Embed Size (px)
Citation preview
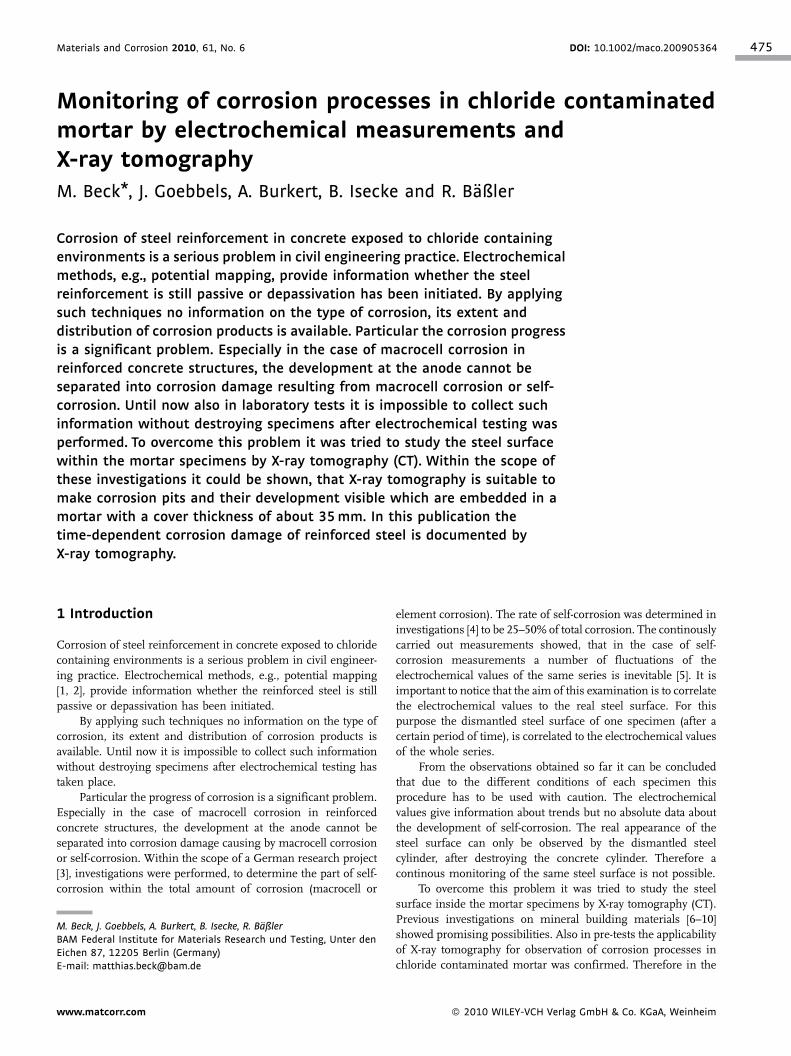
Materials and Corrosion 2010, 61, No. 6 DOI: 10.1002/maco.200905364 475
Monitoring of corrosion processes in chloride contaminatedmortar by electrochemical measurements and
X-ray tomography
M. Beck*, J. Goebbels, A. Burkert, B. Isecke and R. Baßler
Corrosion of steel reinforcement in concrete exposed to chloride containing
environments is a serious problem in civil engineering practice. Electrochemical
methods, e.g., potential mapping, provide information whether the steel
reinforcement is still passive or depassivation has been initiated. By applying
such techniques no information on the type of corrosion, its extent and
distribution of corrosion products is available. Particular the corrosion progress
is a significant problem. Especially in the case of macrocell corrosion in
reinforced concrete structures, the development at the anode cannot be
separated into corrosion damage resulting from macrocell corrosion or self-
corrosion. Until now also in laboratory tests it is impossible to collect such
information without destroying specimens after electrochemical testing was
performed. To overcome this problem it was tried to study the steel surface
within the mortar specimens by X-ray tomography (CT). Within the scope of
these investigations it could be shown, that X-ray tomography is suitable to
make corrosion pits and their development visible which are embedded in a
mortar with a cover thickness of about 35mm. In this publication the
time-dependent corrosion damage of reinforced steel is documented by
X-ray tomography.
1 Introduction
Corrosion of steel reinforcement in concrete exposed to chloride
containing environments is a serious problem in civil engineer-
ing practice. Electrochemical methods, e.g., potential mapping
[1, 2], provide information whether the reinforced steel is still
passive or depassivation has been initiated.
By applying such techniques no information on the type of
corrosion, its extent and distribution of corrosion products is
available. Until now it is impossible to collect such information
without destroying specimens after electrochemical testing has
taken place.
Particular the progress of corrosion is a significant problem.
Especially in the case of macrocell corrosion in reinforced
concrete structures, the development at the anode cannot be
separated into corrosion damage causing by macrocell corrosion
or self-corrosion. Within the scope of a German research project
[3], investigations were performed, to determine the part of self-
corrosion within the total amount of corrosion (macrocell or
M. Beck, J. Goebbels, A. Burkert, B. Isecke, R. Baßler
BAM Federal Institute for Materials Research und Testing, Unter den
Eichen 87, 12205 Berlin (Germany)
E-mail: [email protected]
www.matcorr.com
element corrosion). The rate of self-corrosion was determined in
investigations [4] to be 25–50% of total corrosion. The continously
carried out measurements showed, that in the case of self-
corrosion measurements a number of fluctuations of the
electrochemical values of the same series is inevitable [5]. It is
important to notice that the aim of this examination is to correlate
the electrochemical values to the real steel surface. For this
purpose the dismantled steel surface of one specimen (after a
certain period of time), is correlated to the electrochemical values
of the whole series.
From the observations obtained so far it can be concluded
that due to the different conditions of each specimen this
procedure has to be used with caution. The electrochemical
values give information about trends but no absolute data about
the development of self-corrosion. The real appearance of the
steel surface can only be observed by the dismantled steel
cylinder, after destroying the concrete cylinder. Therefore a
continous monitoring of the same steel surface is not possible.
To overcome this problem it was tried to study the steel
surface inside the mortar specimens by X-ray tomography (CT).
Previous investigations on mineral building materials [6–10]
showed promising possibilities. Also in pre-tests the applicability
of X-ray tomography for observation of corrosion processes in
chloride contaminated mortar was confirmed. Therefore in the
� 2010 WILEY-VCH Verlag GmbH & Co. KGaA, Weinheim
476 Beck, Goebbels, Burkert, Isecke, and Baßler Materials and Corrosion 2010, 61, No. 6
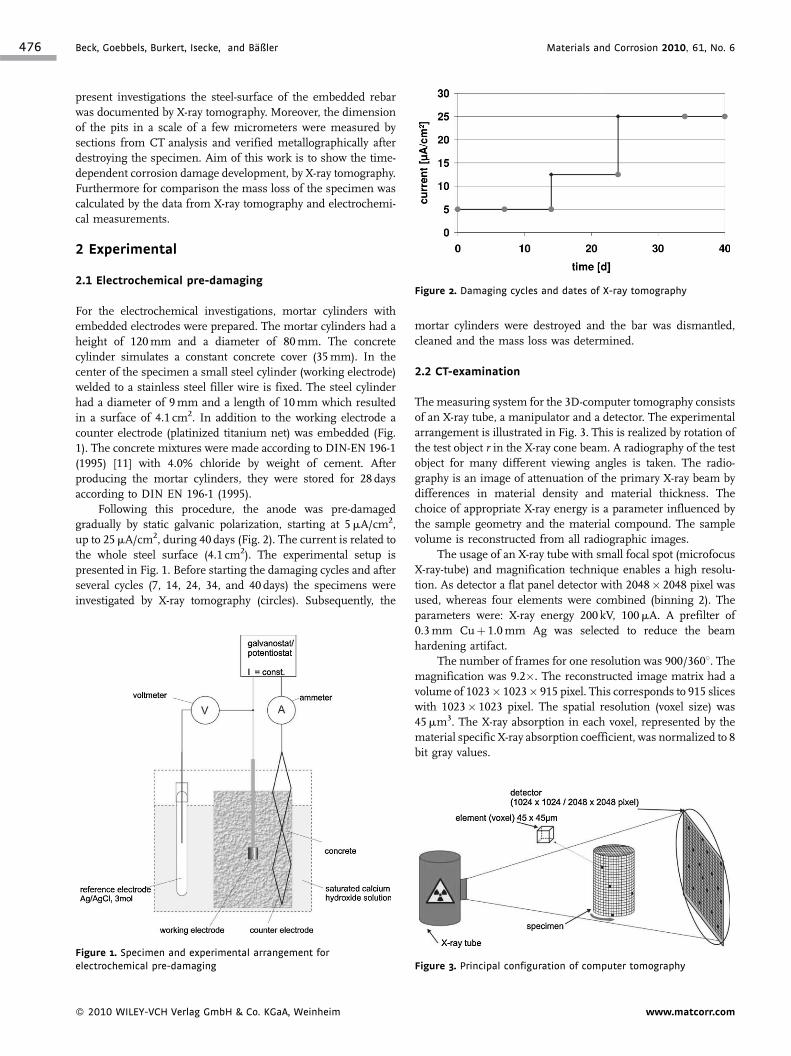
Figure 2. Damaging cycles and dates of X-ray tomography
present investigations the steel-surface of the embedded rebar
was documented by X-ray tomography. Moreover, the dimension
of the pits in a scale of a few micrometers were measured by
sections from CT analysis and verified metallographically after
destroying the specimen. Aim of this work is to show the time-
dependent corrosion damage development, by X-ray tomography.
Furthermore for comparison the mass loss of the specimen was
calculated by the data from X-ray tomography and electrochemi-
cal measurements.
2 Experimental
2.1 Electrochemical pre-damaging
For the electrochemical investigations, mortar cylinders with
embedded electrodes were prepared. The mortar cylinders had a
height of 120mm and a diameter of 80mm. The concrete
cylinder simulates a constant concrete cover (35mm). In the
center of the specimen a small steel cylinder (working electrode)
welded to a stainless steel filler wire is fixed. The steel cylinder
had a diameter of 9mm and a length of 10mm which resulted
in a surface of 4.1 cm2. In addition to the working electrode a
counter electrode (platinized titanium net) was embedded (Fig.
1). The concrete mixtures were made according to DIN-EN 196-1
(1995) [11] with 4.0% chloride by weight of cement. After
producing the mortar cylinders, they were stored for 28 days
according to DIN EN 196-1 (1995).
Following this procedure, the anode was pre-damaged
gradually by static galvanic polarization, starting at 5mA/cm2,
up to 25mA/cm2, during 40 days (Fig. 2). The current is related to
the whole steel surface (4.1 cm2). The experimental setup is
presented in Fig. 1. Before starting the damaging cycles and after
several cycles (7, 14, 24, 34, and 40 days) the specimens were
investigated by X-ray tomography (circles). Subsequently, the
Figure 1. Specimen and experimental arrangement for
electrochemical pre-damaging
� 2010 WILEY-VCH Verlag GmbH & Co. KGaA, Weinheim
mortar cylinders were destroyed and the bar was dismantled,
cleaned and the mass loss was determined.
2.2 CT-examination
The measuring system for the 3D-computer tomography consists
of an X-ray tube, a manipulator and a detector. The experimental
arrangement is illustrated in Fig. 3. This is realized by rotation of
the test object r in the X-ray cone beam. A radiography of the test
object for many different viewing angles is taken. The radio-
graphy is an image of attenuation of the primary X-ray beam by
differences in material density and material thickness. The
choice of appropriate X-ray energy is a parameter influenced by
the sample geometry and the material compound. The sample
volume is reconstructed from all radiographic images.
The usage of an X-ray tube with small focal spot (microfocus
X-ray-tube) and magnification technique enables a high resolu-
tion. As detector a flat panel detector with 2048� 2048 pixel was
used, whereas four elements were combined (binning 2). The
parameters were: X-ray energy 200 kV, 100mA. A prefilter of
0.3mm Cuþ 1.0mm Ag was selected to reduce the beam
hardening artifact.
The number of frames for one resolution was 900/3608. Themagnification was 9.2�. The reconstructed image matrix had a
volume of 1023� 1023� 915 pixel. This corresponds to 915 slices
with 1023� 1023 pixel. The spatial resolution (voxel size) was
45mm3. The X-ray absorption in each voxel, represented by the
material specific X-ray absorption coefficient, was normalized to 8
bit gray values.
Figure 3. Principal configuration of computer tomography
www.matcorr.com
Materials and Corrosion 2010, 61, No. 6 Monitoring of corrosion processes by X-ray tomography 477
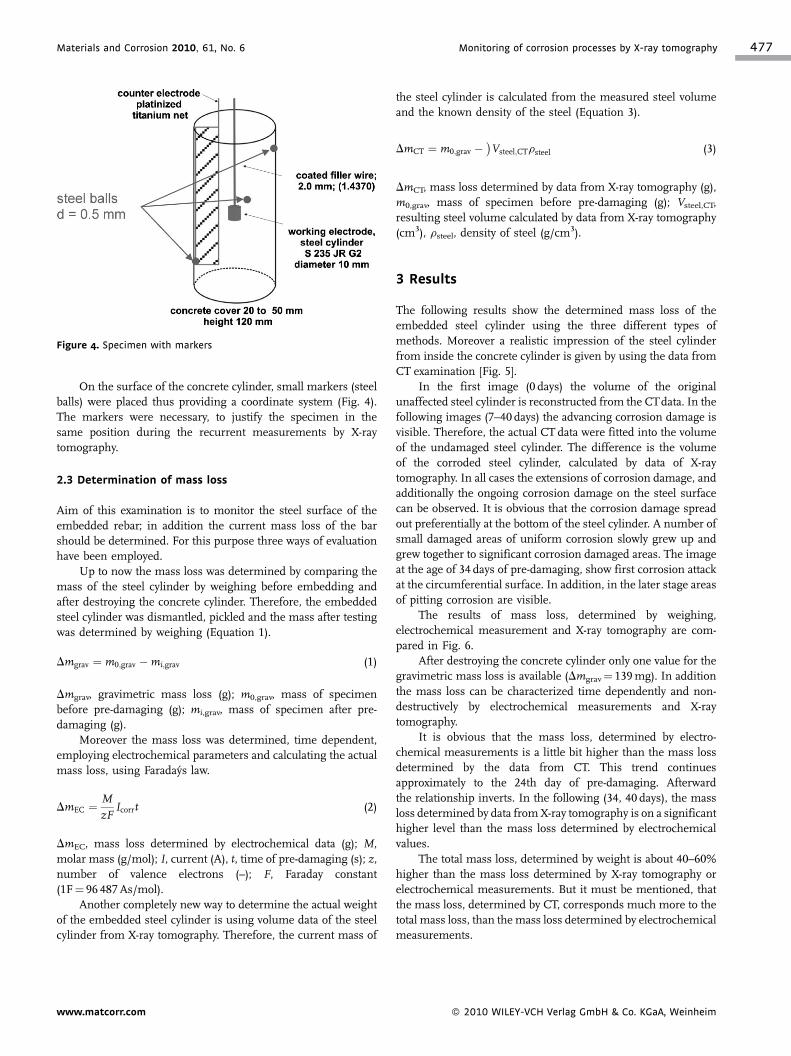
Figure 4. Specimen with markers
On the surface of the concrete cylinder, small markers (steel
balls) were placed thus providing a coordinate system (Fig. 4).
The markers were necessary, to justify the specimen in the
same position during the recurrent measurements by X-ray
tomography.
2.3 Determination of mass loss
Aim of this examination is to monitor the steel surface of the
embedded rebar; in addition the current mass loss of the bar
should be determined. For this purpose three ways of evaluation
have been employed.
Up to now the mass loss was determined by comparing the
mass of the steel cylinder by weighing before embedding and
after destroying the concrete cylinder. Therefore, the embedded
steel cylinder was dismantled, pickled and the mass after testing
was determined by weighing (Equation 1).
Dmgrav ¼ m0;grav �mi;grav (1)
Dmgrav, gravimetric mass loss (g); m0,grav, mass of specimen
before pre-damaging (g); mi,grav, mass of specimen after pre-
damaging (g).
Moreover the mass loss was determined, time dependent,
employing electrochemical parameters and calculating the actual
mass loss, using Faradays law.
DmEC ¼ M
zFIcorrt (2)
DmEC, mass loss determined by electrochemical data (g); M,
molar mass (g/mol); I, current (A), t, time of pre-damaging (s); z,number of valence electrons (–); F, Faraday constant
(1F¼ 96 487As/mol).
Another completely new way to determine the actual weight
of the embedded steel cylinder is using volume data of the steel
cylinder from X-ray tomography. Therefore, the current mass of
www.matcorr.com
the steel cylinder is calculated from the measured steel volume
and the known density of the steel (Equation 3).
DmCT ¼ m0;grav � Vsteel;CTrsteel� �
(3)
DmCT, mass loss determined by data from X-ray tomography (g),
m0,grav, mass of specimen before pre-damaging (g); Vsteel,CT,
resulting steel volume calculated by data from X-ray tomography
(cm3), rsteel, density of steel (g/cm3).
3 Results
The following results show the determined mass loss of the
embedded steel cylinder using the three different types of
methods. Moreover a realistic impression of the steel cylinder
from inside the concrete cylinder is given by using the data from
CT examination [Fig. 5].
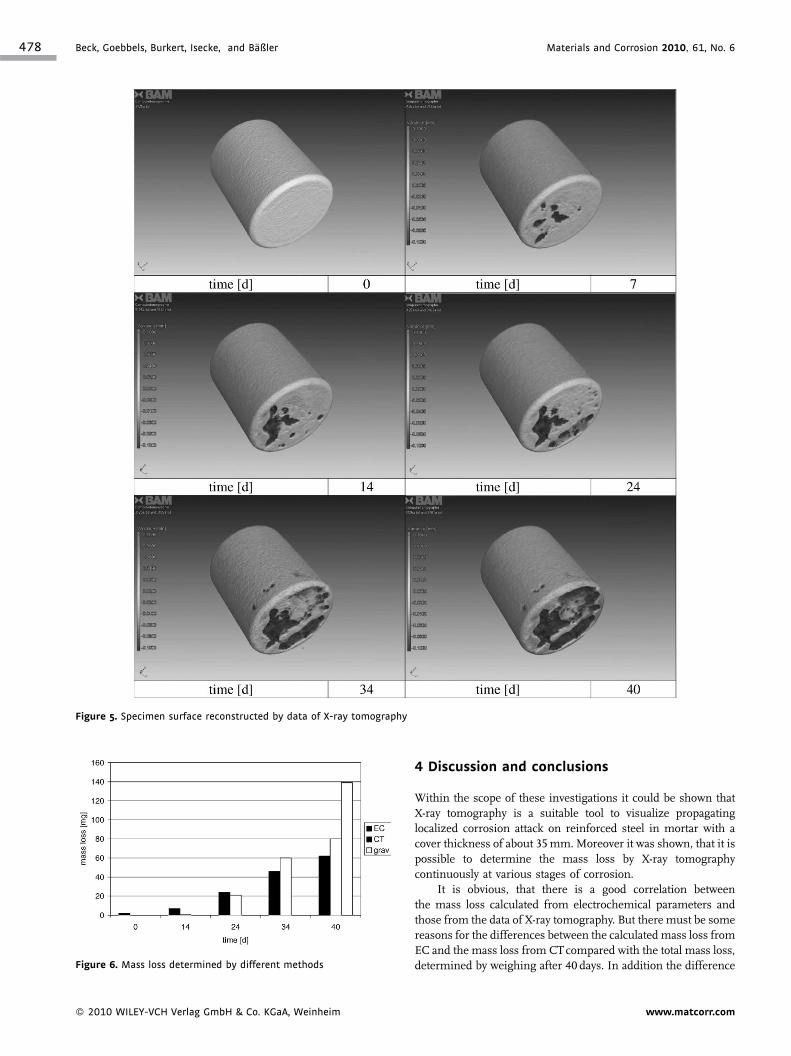
In the first image (0 days) the volume of the original
unaffected steel cylinder is reconstructed from the CTdata. In the
following images (7–40 days) the advancing corrosion damage is
visible. Therefore, the actual CT data were fitted into the volume
of the undamaged steel cylinder. The difference is the volume
of the corroded steel cylinder, calculated by data of X-ray
tomography. In all cases the extensions of corrosion damage, and
additionally the ongoing corrosion damage on the steel surface
can be observed. It is obvious that the corrosion damage spread
out preferentially at the bottom of the steel cylinder. A number of
small damaged areas of uniform corrosion slowly grew up and
grew together to significant corrosion damaged areas. The image
at the age of 34 days of pre-damaging, show first corrosion attack
at the circumferential surface. In addition, in the later stage areas
of pitting corrosion are visible.
The results of mass loss, determined by weighing,
electrochemical measurement and X-ray tomography are com-
pared in Fig. 6.
After destroying the concrete cylinder only one value for the
gravimetric mass loss is available (Dmgrav¼ 139mg). In addition
the mass loss can be characterized time dependently and non-
destructively by electrochemical measurements and X-ray
tomography.
It is obvious that the mass loss, determined by electro-
chemical measurements is a little bit higher than the mass loss
determined by the data from CT. This trend continues
approximately to the 24th day of pre-damaging. Afterward
the relationship inverts. In the following (34, 40 days), the mass
loss determined by data fromX-ray tomography is on a significant
higher level than the mass loss determined by electrochemical
values.
The total mass loss, determined by weight is about 40–60%
higher than the mass loss determined by X-ray tomography or
electrochemical measurements. But it must be mentioned, that
the mass loss, determined by CT, corresponds much more to the
total mass loss, than the mass loss determined by electrochemical
measurements.
� 2010 WILEY-VCH Verlag GmbH & Co. KGaA, Weinheim
478 Beck, Goebbels, Burkert, Isecke, and Baßler Materials and Corrosion 2010, 61, No. 6
Figure 5. Specimen surface reconstructed by data of X-ray tomography
Figure 6. Mass loss determined by different methods
� 2010 WILEY-VCH Verlag GmbH & Co. KGaA, Weinheim
4 Discussion and conclusions
Within the scope of these investigations it could be shown that
X-ray tomography is a suitable tool to visualize propagating
localized corrosion attack on reinforced steel in mortar with a
cover thickness of about 35mm. Moreover it was shown, that it is
possible to determine the mass loss by X-ray tomography
continuously at various stages of corrosion.
It is obvious, that there is a good correlation between
the mass loss calculated from electrochemical parameters and
those from the data of X-ray tomography. But there must be some
reasons for the differences between the calculated mass loss from
EC and the mass loss from CTcompared with the total mass loss,
determined by weighing after 40 days. In addition the difference
www.matcorr.com
Materials and Corrosion 2010, 61, No. 6 Monitoring of corrosion processes by X-ray tomography 479
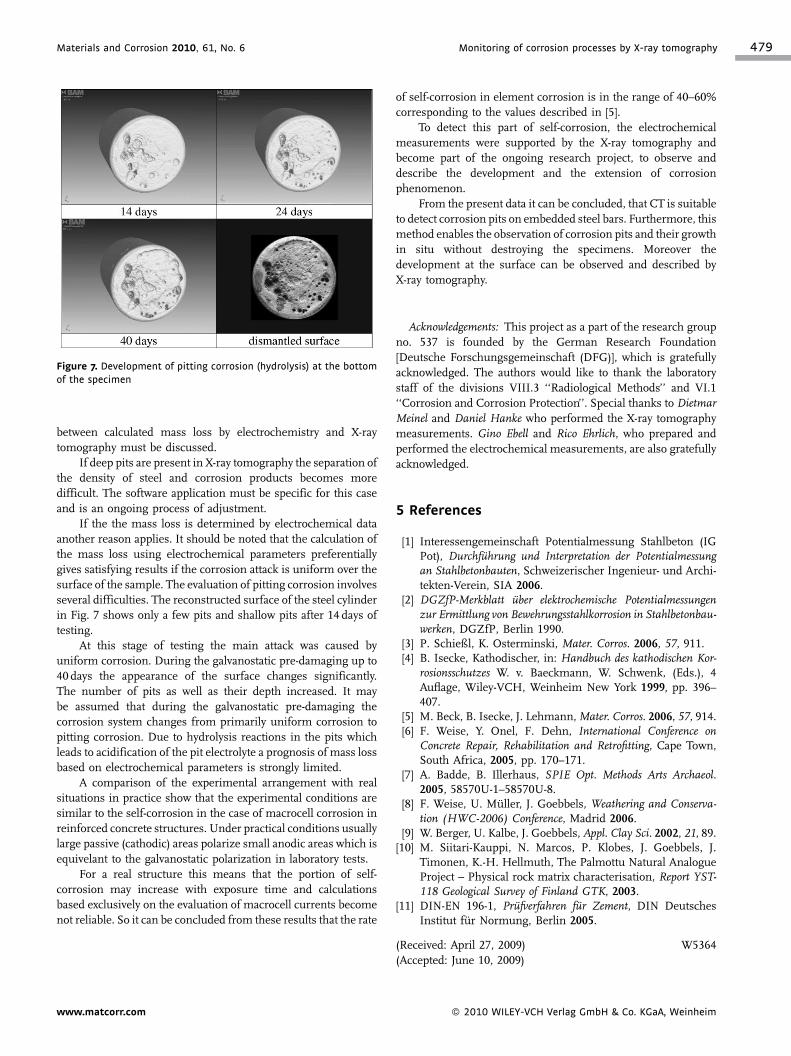
Figure 7. Development of pitting corrosion (hydrolysis) at the bottom
of the specimen
between calculated mass loss by electrochemistry and X-ray
tomography must be discussed.
If deep pits are present in X-ray tomography the separation of
the density of steel and corrosion products becomes more
difficult. The software application must be specific for this case
and is an ongoing process of adjustment.
If the the mass loss is determined by electrochemical data
another reason applies. It should be noted that the calculation of
the mass loss using electrochemical parameters preferentially
gives satisfying results if the corrosion attack is uniform over the
surface of the sample. The evaluation of pitting corrosion involves
several difficulties. The reconstructed surface of the steel cylinder
in Fig. 7 shows only a few pits and shallow pits after 14 days of
testing.
At this stage of testing the main attack was caused by
uniform corrosion. During the galvanostatic pre-damaging up to
40 days the appearance of the surface changes significantly.
The number of pits as well as their depth increased. It may
be assumed that during the galvanostatic pre-damaging the
corrosion system changes from primarily uniform corrosion to
pitting corrosion. Due to hydrolysis reactions in the pits which
leads to acidification of the pit electrolyte a prognosis of mass loss
based on electrochemical parameters is strongly limited.
A comparison of the experimental arrangement with real
situations in practice show that the experimental conditions are
similar to the self-corrosion in the case of macrocell corrosion in
reinforced concrete structures. Under practical conditions usually
large passive (cathodic) areas polarize small anodic areas which is
equivelant to the galvanostatic polarization in laboratory tests.
For a real structure this means that the portion of self-
corrosion may increase with exposure time and calculations
based exclusively on the evaluation of macrocell currents become
not reliable. So it can be concluded from these results that the rate
www.matcorr.com
of self-corrosion in element corrosion is in the range of 40–60%
corresponding to the values described in [5].
To detect this part of self-corrosion, the electrochemical
measurements were supported by the X-ray tomography and
become part of the ongoing research project, to observe and
describe the development and the extension of corrosion
phenomenon.
From the present data it can be concluded, that CT is suitable
to detect corrosion pits on embedded steel bars. Furthermore, this
method enables the observation of corrosion pits and their growth
in situ without destroying the specimens. Moreover the
development at the surface can be observed and described by
X-ray tomography.
Acknowledgements: This project as a part of the research group
no. 537 is founded by the German Research Foundation
[Deutsche Forschungsgemeinschaft (DFG)], which is gratefully
acknowledged. The authors would like to thank the laboratory
staff of the divisions VIII.3 ‘‘Radiological Methods’’ and VI.1
‘‘Corrosion and Corrosion Protection’’. Special thanks to DietmarMeinel and Daniel Hanke who performed the X-ray tomography
measurements. Gino Ebell and Rico Ehrlich, who prepared and
performed the electrochemical measurements, are also gratefully
acknowledged.
5 References
[1] Interessengemeinschaft Potentialmessung Stahlbeton (IGPot), Durchfuhrung und Interpretation der Potentialmessungan Stahlbetonbauten, Schweizerischer Ingenieur- und Archi-tekten-Verein, SIA 2006.
[2] DGZfP-Merkblatt uber elektrochemische Potentialmessungenzur Ermittlung von Bewehrungsstahlkorrosion in Stahlbetonbau-werken, DGZfP, Berlin 1990.
[3] P. Schießl, K. Osterminski, Mater. Corros. 2006, 57, 911.[4] B. Isecke, Kathodischer, in: Handbuch des kathodischen Kor-
rosionsschutzes W. v. Baeckmann, W. Schwenk, (Eds.), 4Auflage, Wiley-VCH, Weinheim New York 1999, pp. 396–407.
[5] M. Beck, B. Isecke, J. Lehmann,Mater. Corros. 2006, 57, 914.[6] F. Weise, Y. Onel, F. Dehn, International Conference on
Concrete Repair, Rehabilitation and Retrofitting, Cape Town,South Africa, 2005, pp. 170–171.
[7] A. Badde, B. Illerhaus, SPIE Opt. Methods Arts Archaeol.2005, 58570U-1–58570U-8.
[8] F. Weise, U. Muller, J. Goebbels, Weathering and Conserva-tion (HWC-2006) Conference, Madrid 2006.
[9] W. Berger, U. Kalbe, J. Goebbels, Appl. Clay Sci. 2002, 21, 89.[10] M. Siitari-Kauppi, N. Marcos, P. Klobes, J. Goebbels, J.
Timonen, K.-H. Hellmuth, The Palmottu Natural AnalogueProject – Physical rock matrix characterisation, Report YST-118 Geological Survey of Finland GTK, 2003.
[11] DIN-EN 196-1, Prufverfahren fur Zement, DIN DeutschesInstitut fur Normung, Berlin 2005.
(Received: April 27, 2009)
(Accepted: June 10, 2009)
W5364
� 2010 WILEY-VCH Verlag GmbH & Co. KGaA, Weinheim