Embed Size (px)
Citation preview
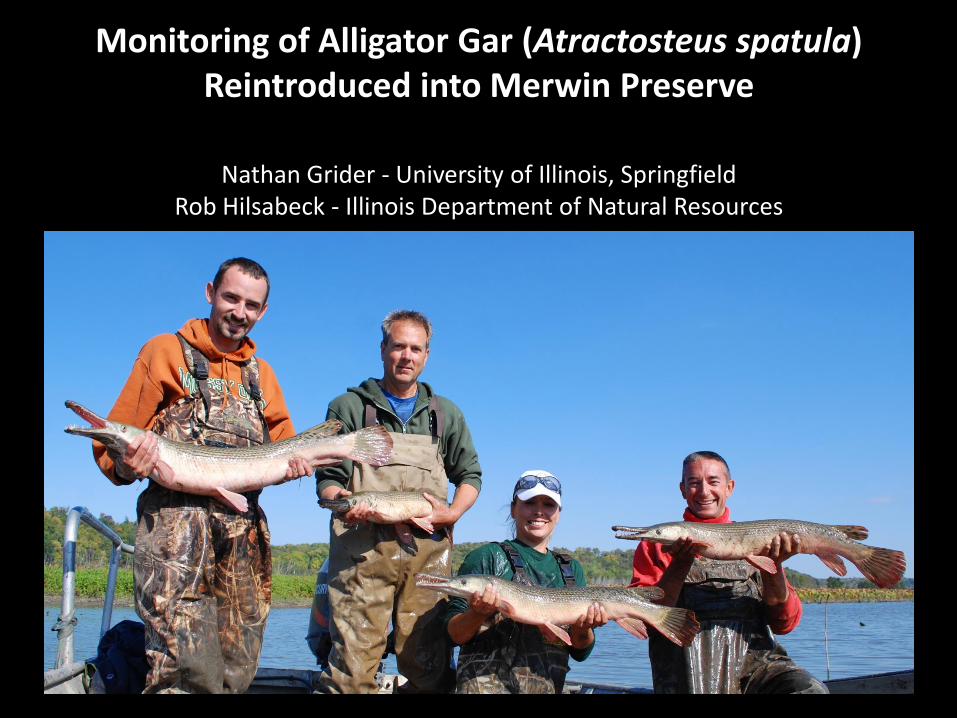
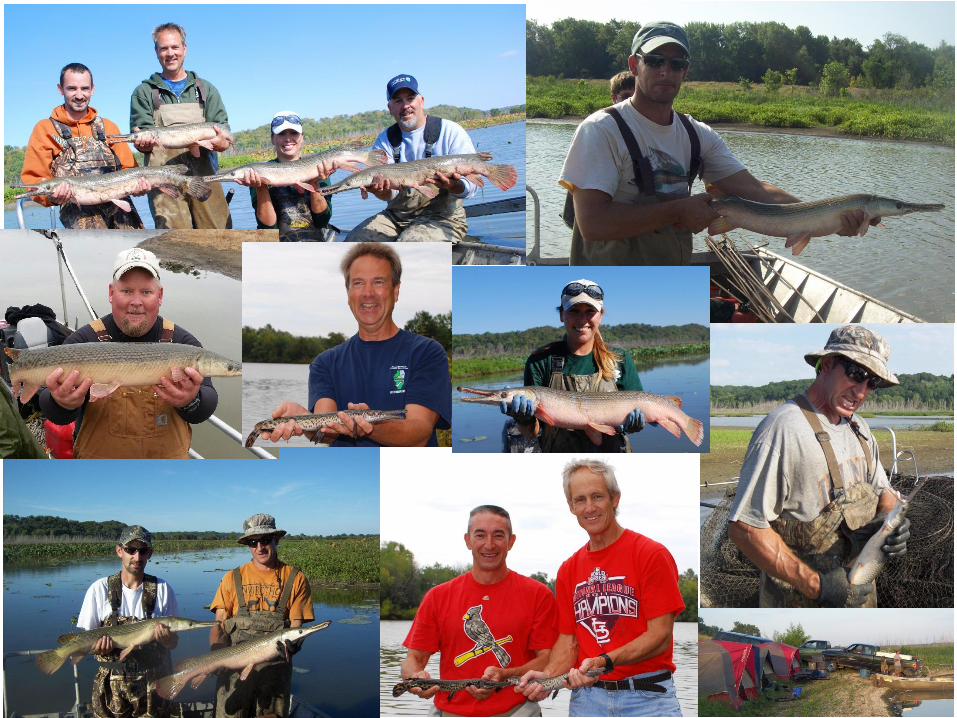
Monitoring of Alligator Gar (Atractosteus spatula) Reintroduced into Merwin Preserve
Nathan Grider - University of Illinois, Springfield
Rob Hilsabeck - Illinois Department of Natural Resources
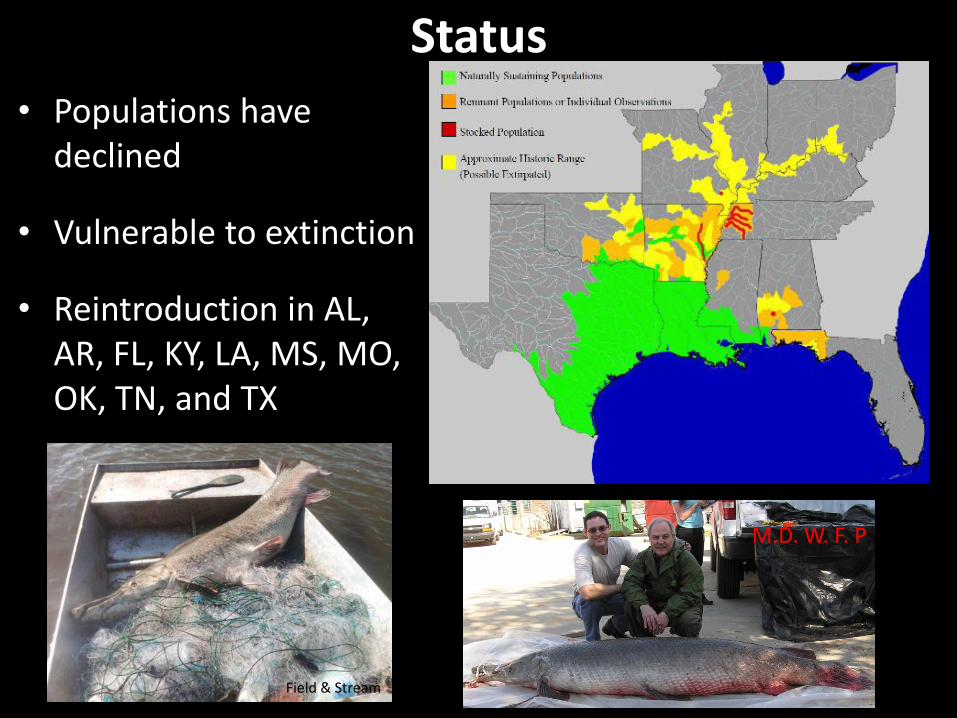
Status
• Populations have declined
• Vulnerable to extinction
• Reintroduction in AL, AR, FL, KY, LA, MS, MO, OK, TN, and TX
M.D. W. F. P
Field & Stream
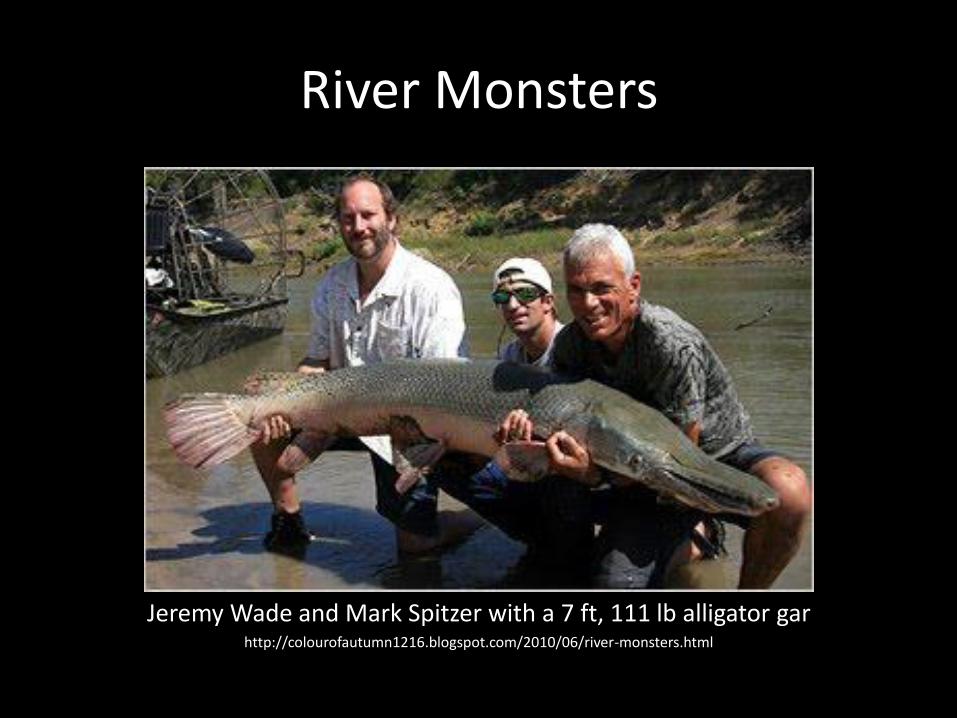
River Monsters
Jeremy Wade and Mark Spitzer with a 7 ft, 111 lb alligator gar http://colourofautumn1216.blogspot.com/2010/06/river-monsters.html
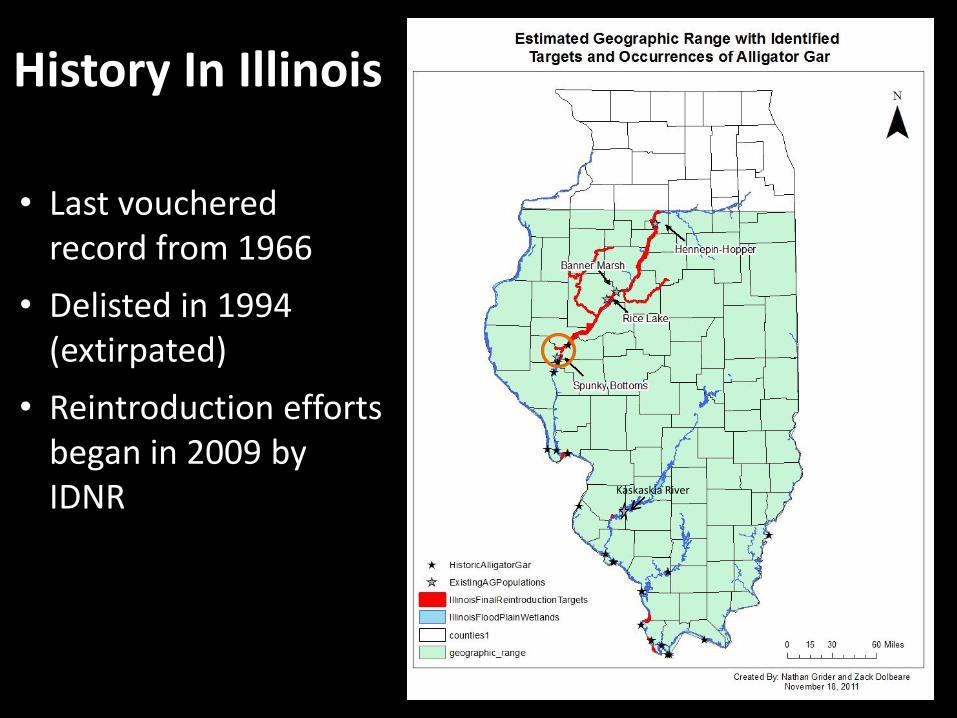
Kaskaskia River
History In Illinois
• Last vouchered record from 1966
• Delisted in 1994 (extirpated)
• Reintroduction efforts began in 2009 by IDNR
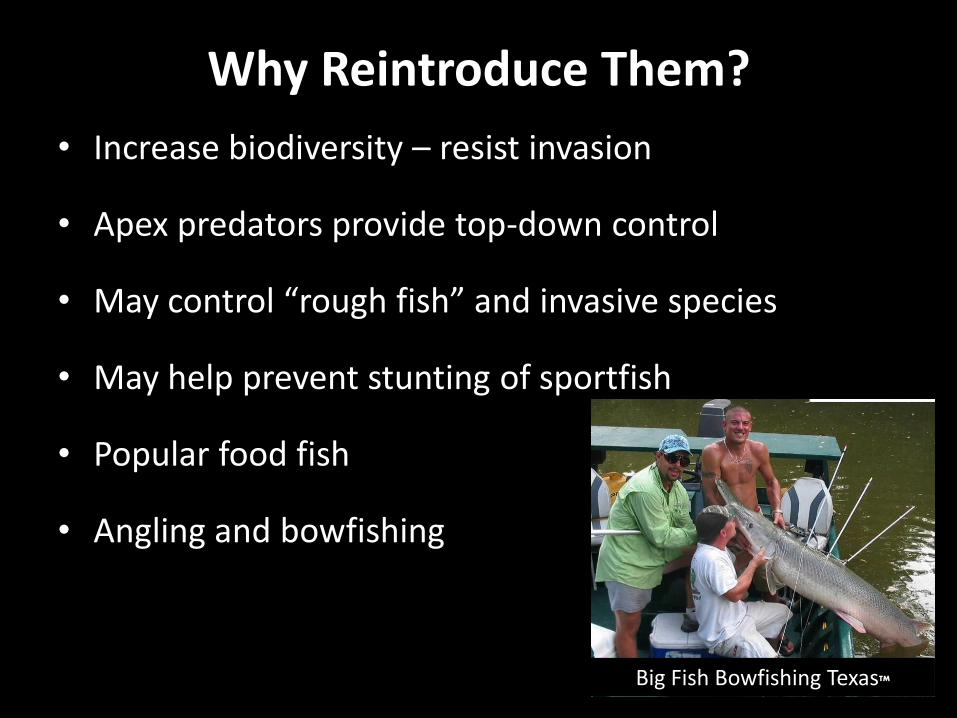
Why Reintroduce Them?
• Increase biodiversity – resist invasion
• Apex predators provide top-down control
• May control “rough fish” and invasive species
• May help prevent stunting of sportfish
• Popular food fish
• Angling and bowfishing
Big Fish Bowfishing Texas™
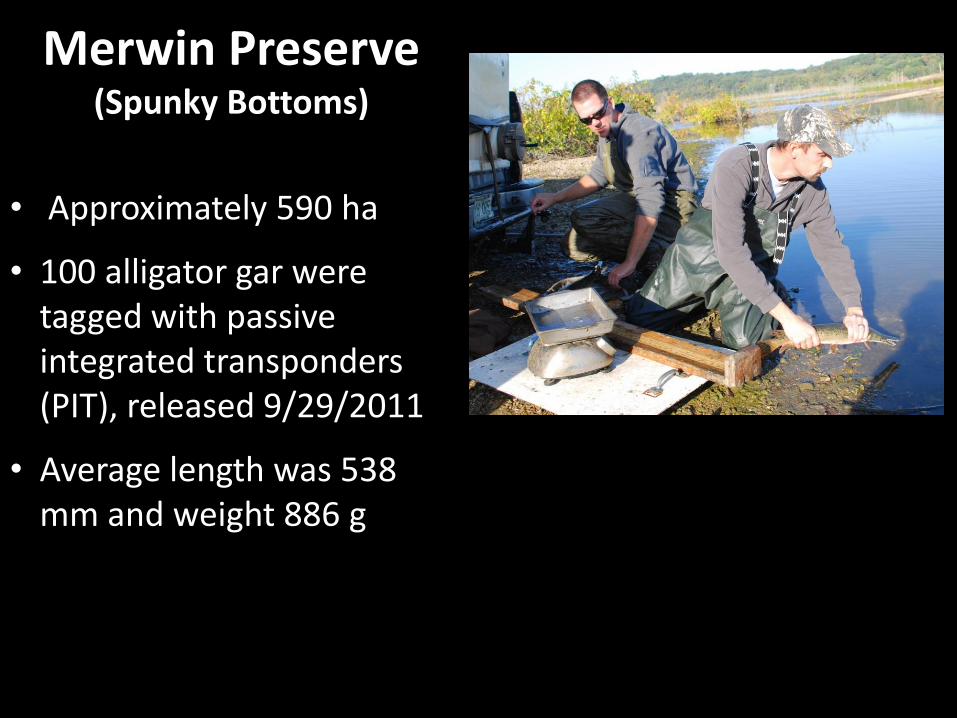
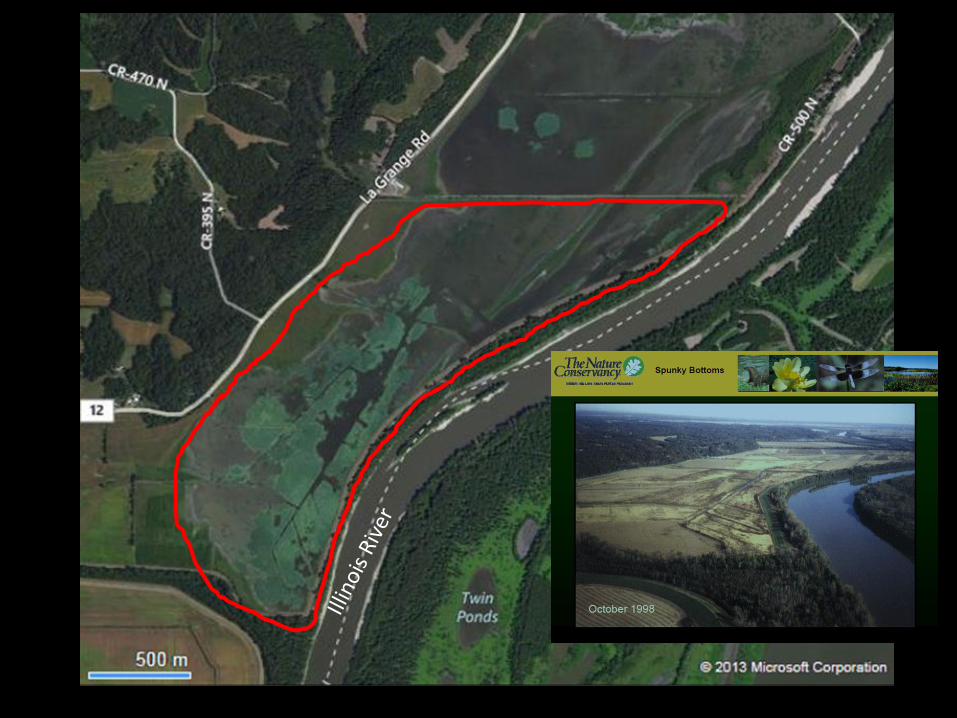
Merwin Preserve (Spunky Bottoms)
• Approximately 590 ha
• 100 alligator gar were tagged with passive integrated transponders (PIT), released 9/29/2011
• Average length was 538 mm and weight 886 g
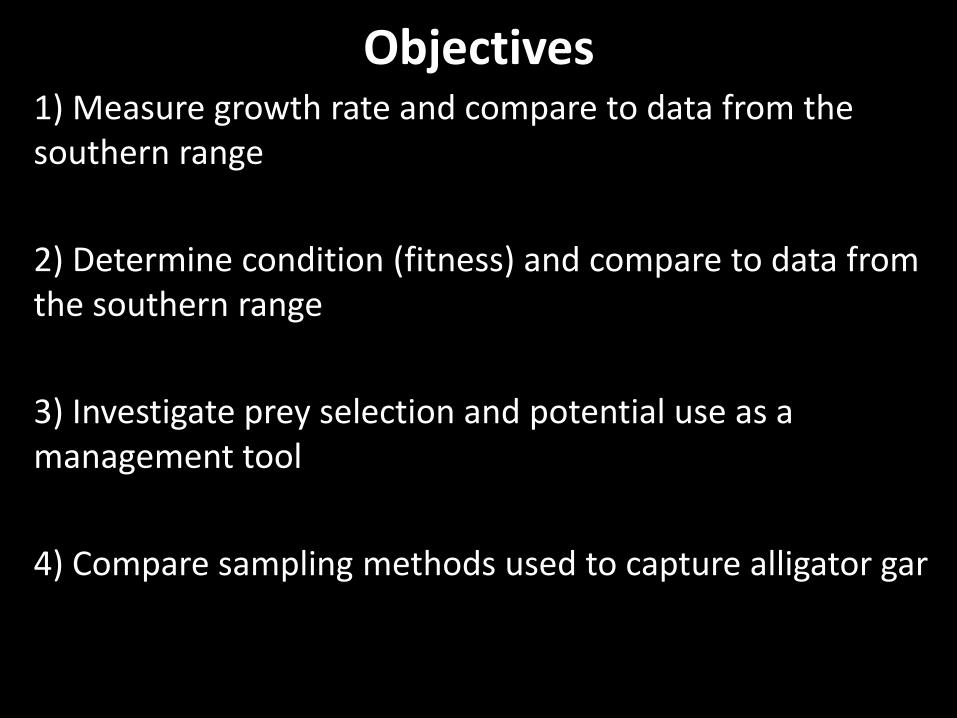
Objectives 1) Measure growth rate and compare to data from the
southern range
2) Determine condition (fitness) and compare to data from the southern range
3) Investigate prey selection and potential use as a management tool
4) Compare sampling methods used to capture alligator gar

Methods
Sampling •Sampled May - October = six events
• Sample event = two days and one night of extensive gear effort
Gears • Modified multifilament gill nets – 3” bar mesh, dyed black
• Experimental monofilament gill nets
• Trap nets, 1.5” mesh
• Mini fyke nets
• DC Electrofishing

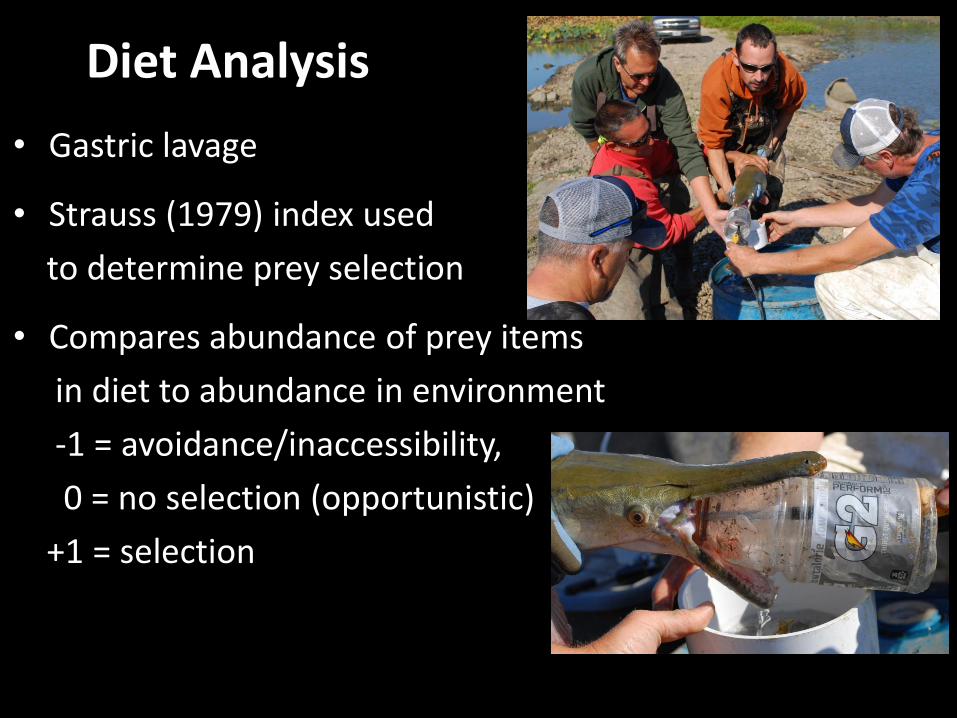
Diet Analysis
• Gastric lavage
• Strauss (1979) index used
to determine prey selection
• Compares abundance of prey items
in diet to abundance in environment
-1 = avoidance/inaccessibility,
0 = no selection (opportunistic)
+1 = selection
Results
American Fisheries Society

0.25
0
2
4
6
8
10
12
14
16
18
20
22
24
26
28
30
Freq
uen
cy %
Catch Frequency, All Gears, All months
N = 6,911

Length and Mass Gain
0
1
2
3
4
5
6
7
0
200
400
600
800
1000
9/1
4/2
01
1
11
/3/2
01
1
12
/23
/20
11
2/1
1/2
01
2
4/1
/20
12
5/2
1/2
01
2
7/1
0/2
01
2
8/2
9/2
01
2
10
/18
/20
12
12
/7/2
01
2
Mas
s (k
g)
Len
gth
(m
m)
Length
Mass
(t(17) = -13.48, p < 0.001)
(t(17) = -10.39, p < 0.001)
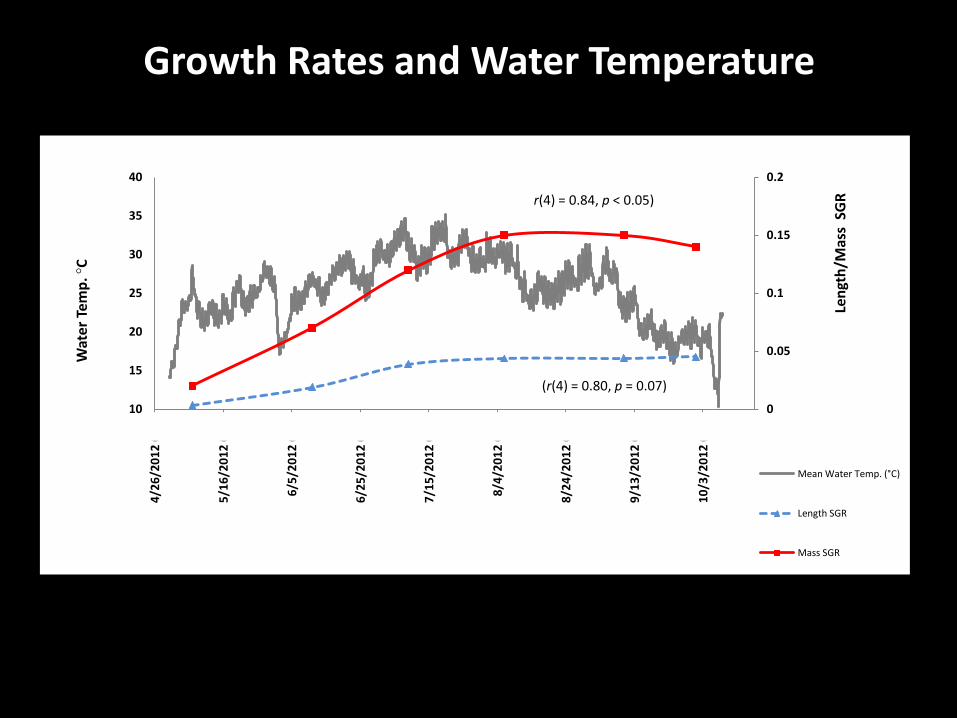
Growth Rates and Water Temperature
0
0.05
0.1
0.15
0.2
10
15
20
25
30
35
40
4/2
6/2
01
2 0
:00
5/1
6/2
01
2 0
:00
6/5
/20
12
0:0
0
6/2
5/2
01
2 0
:00
7/1
5/2
01
2 0
:00
8/4
/20
12
0:0
0
8/2
4/2
01
2 0
:00
9/1
3/2
01
2 0
:00
10
/3/2
01
2 0
:00
Len
gth
/Mas
s S
GR
W
ater
Tem
p. °
C
Mean Water Temp. (°C)
Length SGR
Mass SGR
r(4) = 0.84, p < 0.05)
(r(4) = 0.80, p = 0.07)
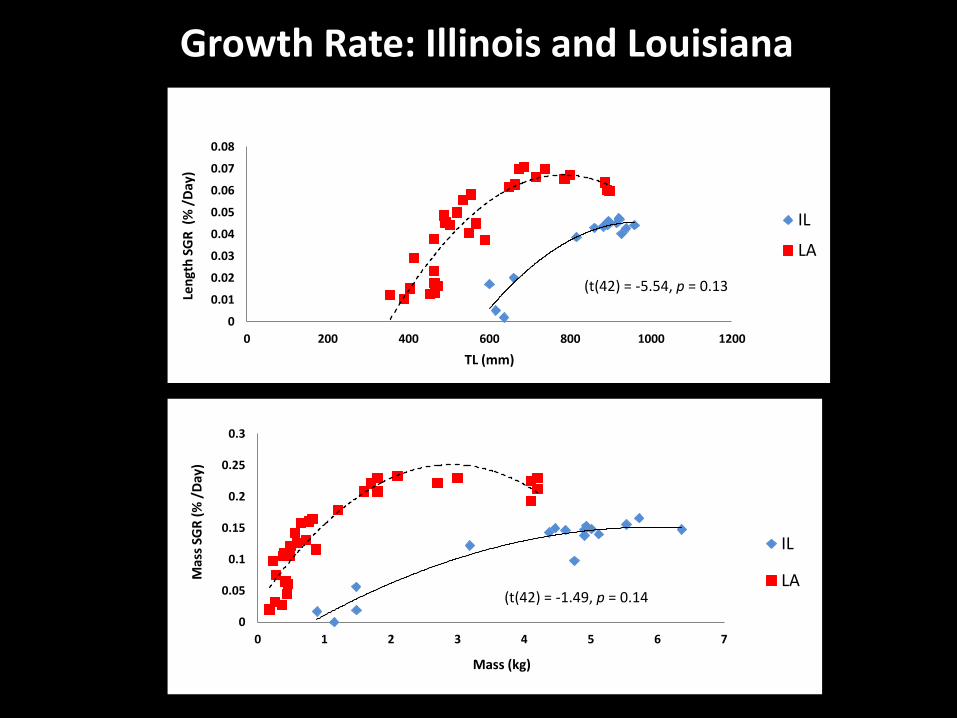
Growth Rate: Illinois and Louisiana
0
0.01
0.02
0.03
0.04
0.05
0.06
0.07
0.08
0 200 400 600 800 1000 1200
Len
gth
SG
R (
% /
Day
)
TL (mm)
IL
LA
0
0.05
0.1
0.15
0.2
0.25
0.3
0 1 2 3 4 5 6 7
Mas
s SG
R (
% /
Day
)
Mass (kg)
IL
LA
(t(42) = -5.54, p = 0.13
(t(42) = -1.49, p = 0.14

Length Gain: Illinois and Louisiana
300
400
500
600
700
800
900
1000
1100
350 400 450 500 550 600
TL (
mm
)
Age in days
IL
LA
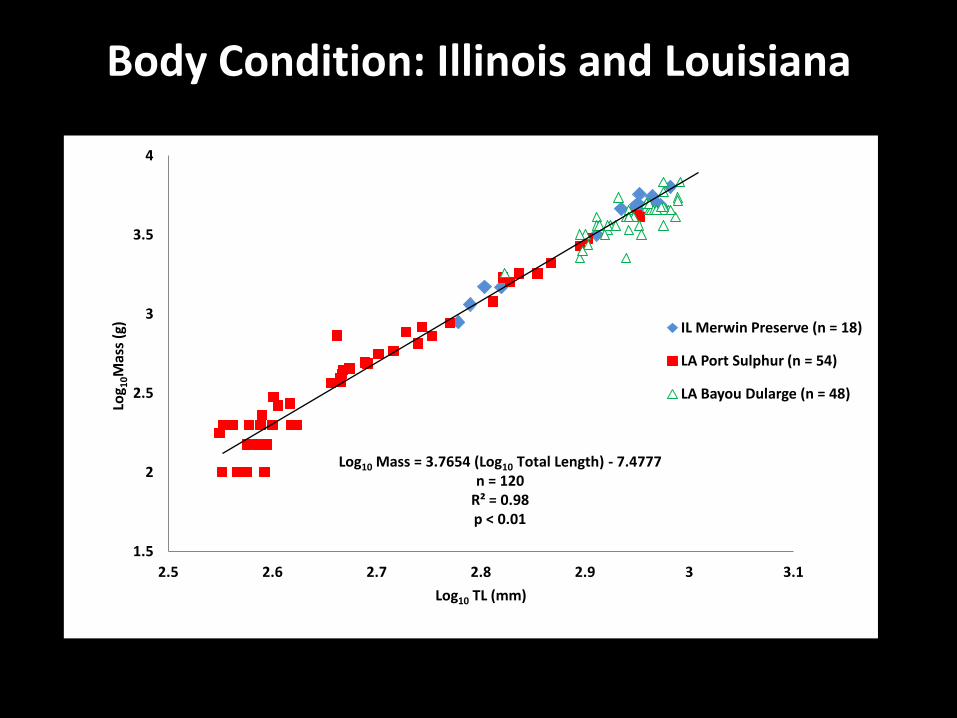
Body Condition: Illinois and Louisiana
1.5
2
2.5
3
3.5
4
2.5 2.6 2.7 2.8 2.9 3 3.1
Log 1
0M
ass
(g)
Log10 TL (mm)
IL Merwin Preserve (n = 18)
LA Port Sulphur (n = 54)
LA Bayou Dularge (n = 48)
Log10 Mass = 3.7654 (Log10 Total Length) - 7.4777 n = 120
R² = 0.98 p < 0.01


0%
10%
20%
30%
40%
50%
60%
70%
80%
90%
100%
Shortnose Alligator Gar
Diet Content Frequency
Unknown Fish
Gizzard Shad
Empty
Diets
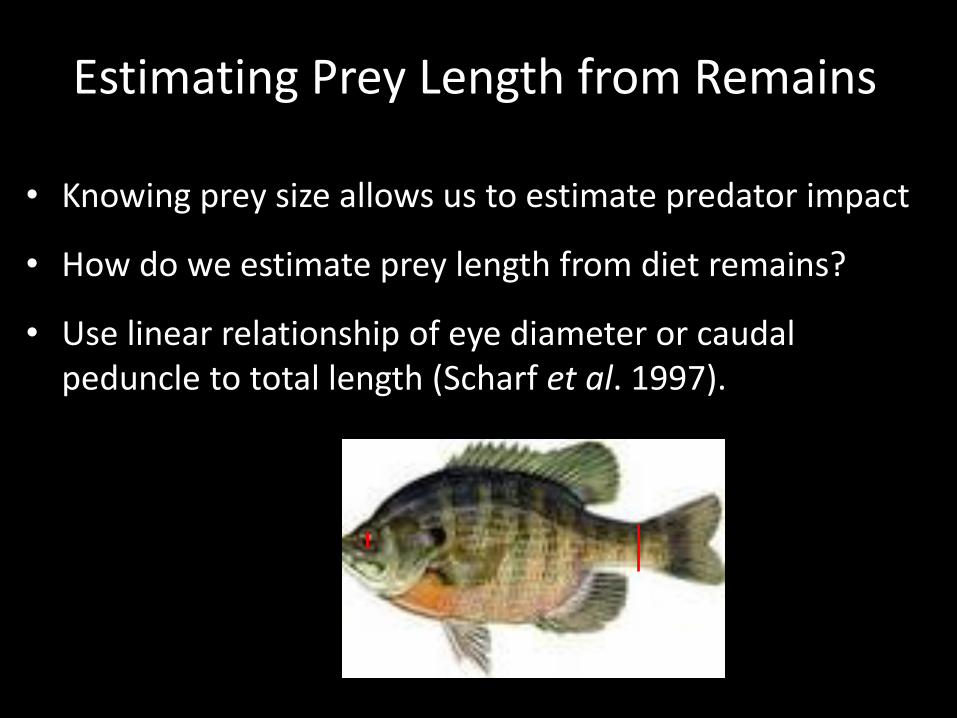
Estimating Prey Length from Remains
• Knowing prey size allows us to estimate predator impact
• How do we estimate prey length from diet remains?
• Use linear relationship of eye diameter or caudal peduncle to total length (Scharf et al. 1997).
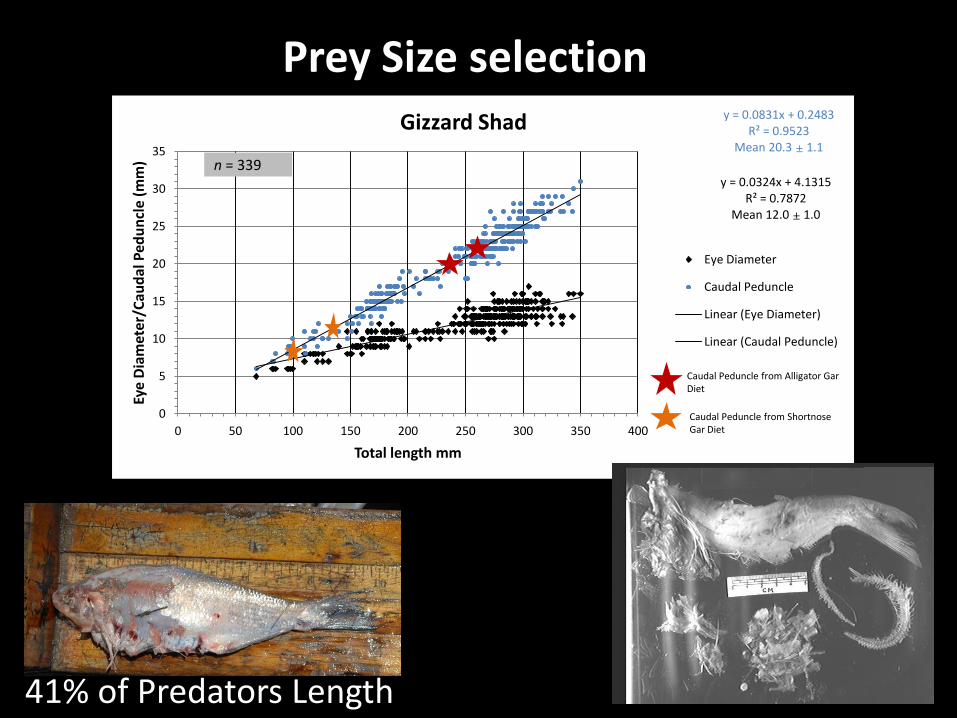
y = 0.0324x + 4.1315 R² = 0.7872
Mean 12.0 ± 1.0
y = 0.0831x + 0.2483 R² = 0.9523
Mean 20.3 ± 1.1
0
5
10
15
20
25
30
35
0 50 100 150 200 250 300 350 400
Eye
Dia
met
er/C
aud
al P
edu
ncl
e (m
m)
Total length mm
Gizzard Shad
Eye Diameter
Caudal Peduncle
Linear (Eye Diameter)
Linear (Caudal Peduncle)
Caudal Peduncle from Alligator Gar Diet
Caudal Peduncle from Shortnose Gar Diet
n = 339
Prey Size selection
41% of Predators Length
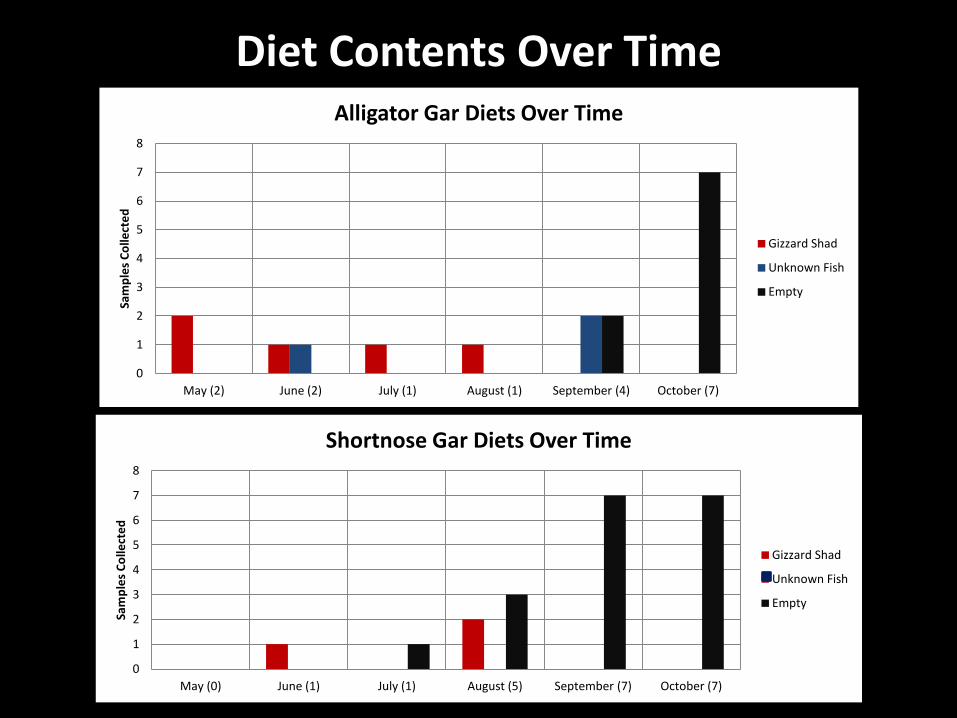
Diet Contents Over Time
0
1
2
3
4
5
6
7
8
May (2) June (2) July (1) August (1) September (4) October (7)
Sam
ple
s C
olle
cte
d
Alligator Gar Diets Over Time
Gizzard Shad
Unknown Fish
Empty
0
1
2
3
4
5
6
7
8
May (0) June (1) July (1) August (5) September (7) October (7)
Sam
ple
s C
olle
cte
d
Shortnose Gar Diets Over Time
Gizzard Shad
Unknown Fish
Empty

+1 = Selection
0 = No selection (opportunistic)
-1 = Avoidance/inaccessibility
May/June July/August September/October
Ameiurus -0.0649 -0.078 -0.1688
Bigmouth Buffalo -0.0119 -0.0395 -0.063
Common Carp -0.2727 -0.3192 -0.529
Gizzard Shad 0.68515 0.74139 -0.0504
Largemouth Bass -0.1862 -0.0968 -0.0554
Lepomis -0.341 -0.1774 -0.063
Pomoxis -0.0586 -0.0305 -0.0705
-1
-0.8
-0.6
-0.4
-0.2
0
0.2
0.4
0.6
0.8
1
L Sc
ore
Food Selection Index

Prey Abundance Over Time
June October
0
5
10
15
20
40
90
14
0
19
0
24
0
29
0
34
0
39
0
44
0
49
0
55
0
Cat
ch/H
ou
r
Total Length (mm)
July & August Electrofishing CPUE
Common Carp
Gizzard Shad
Lepomis
Largemouth Bass
Pomoxis
0
5
10
15
20
40
10
0
15
0
20
0
25
0
30
0
35
0
40
0
45
0
50
0
55
0
63
0
Cat
ch/H
ou
r
Total Length (mm)
September & October Electrofishing CPUE
Common Carp
Gizzard Shad
Lepomis
Largemouth Bass
Pomoxis
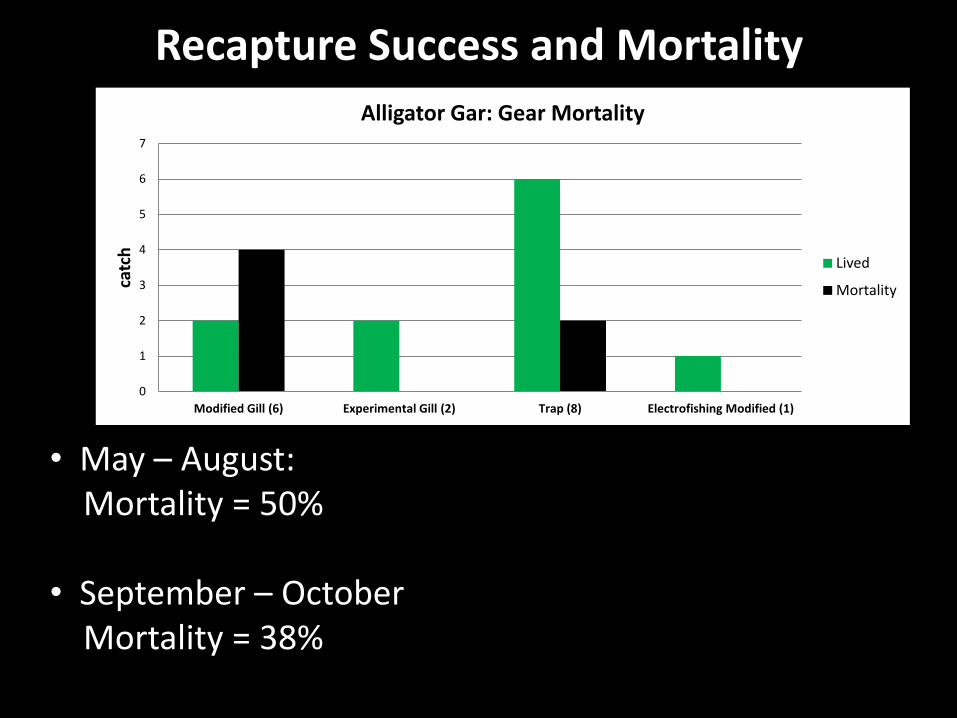
Recapture Success and Mortality
• May – August: Mortality = 50% • September – October Mortality = 38%
0
1
2
3
4
5
6
7
Modified Gill (6) Experimental Gill (2) Trap (8) Electrofishing Modified (1)
catc
h
Alligator Gar: Gear Mortality
Lived
Mortality

Discussion Objective 1 & 2
• No significant difference in growth rate or condition compared to Louisiana
• Factors that effect growth rate: salinity, temp., prey, and habitat
Objective 3
• No sportfish found in diet.
• Did they eat a few? Probably.
• Selection or opportunistic feeding on gizzard shad?
“Optimal Foraging Theory”
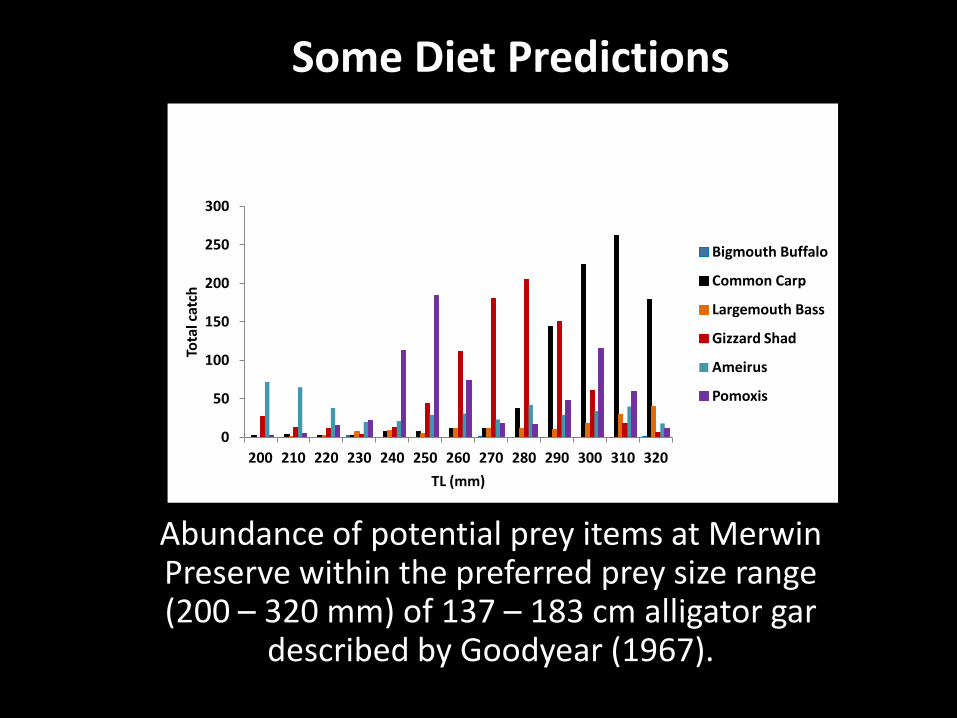
Abundance of potential prey items at Merwin Preserve within the preferred prey size range (200 – 320 mm) of 137 – 183 cm alligator gar
described by Goodyear (1967).
Some Diet Predictions
0
50
100
150
200
250
300
200 210 220 230 240 250 260 270 280 290 300 310 320
Tota
l cat
ch
TL (mm)
Bigmouth Buffalo
Common Carp
Largemouth Bass
Gizzard Shad
Ameirus
Pomoxis
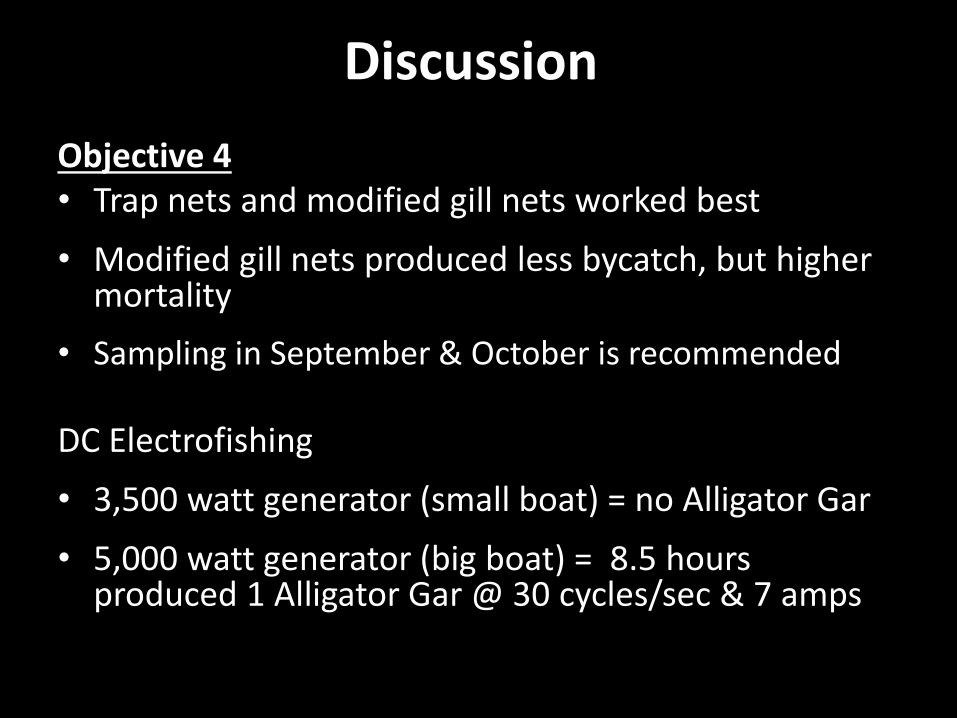
Discussion
Objective 4 • Trap nets and modified gill nets worked best
• Modified gill nets produced less bycatch, but higher mortality
• Sampling in September & October is recommended DC Electrofishing
• 3,500 watt generator (small boat) = no Alligator Gar
• 5,000 watt generator (big boat) = 8.5 hours produced 1 Alligator Gar @ 30 cycles/sec & 7 amps
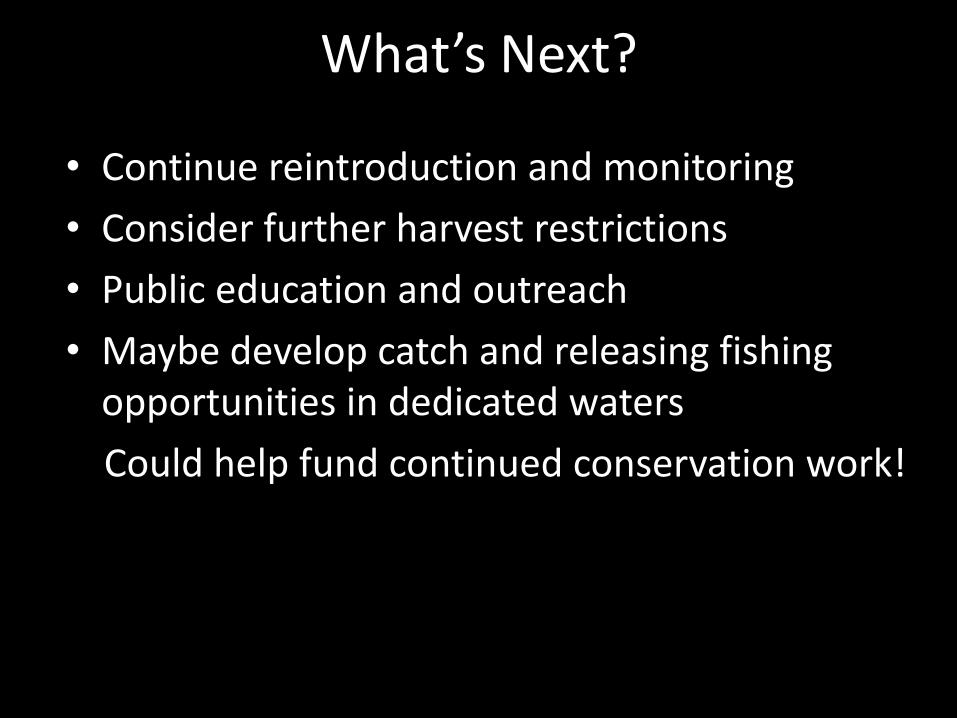
What’s Next?
• Continue reintroduction and monitoring
• Consider further harvest restrictions
• Public education and outreach
• Maybe develop catch and releasing fishing opportunities in dedicated waters
Could help fund continued conservation work!
Bass Pro Shop - Springfield, MO
Acknowledgments
Illinois Department of Natural Resources
Rob Hilsabeck
Trent Thomas
Doug Carney
Matt O’Hara
Rich Lewis
Karen Miller
Todd Rettig
Nate Goetten
Dr. Michael Lemke - Thesis Advisor
Illinois Natural History Survey Dr. Leon Hinz
Nerissa Michaels Levi Solomon John Wisher
The Nature Conservancy Tharran Hobson
Literature Cited Brinkman, E. L. 2008. Contributions to the life history of alligator gar (Atractosteus spatula,
lacepede), in Oklahoma. Master’s Thesis, Oklahoma State University. Oklahoma City, Oklahoma
Garcia De Leon, F. J., L. Gonzalez-Garcia, L. M. Herrera-Castillo, K. O. Winemiller, & A. Banda-Valdes. 2001. Ecology of the alligator gar, Atractosteus spatula, in the Vicente Guerrero Reservoir, Tamaulipas, Mexico . The Southwestern Naturalist 46(2):151-157
Ianni, R. C. 2011. Monitoring diets and growth rates of native predatory fish stocked to suppress non-native tilapia. Master’s Thesis, Nicholls State University. Thibodaux, Louisiana
Scharf, F. S., J. A. Buckel, F. Juanes, & D. O. Conover. 1997. Estimating piscine prey size from partial remains: Testing for shifts in foraging mode by juvenile bluefish. Environmental Biology of Fishes 49: 377-388
Strauss, R. E. 1979. Reliability estimates for Ivlev’s Electivity Index, the forage ratio, and a proposed linear index of food selection. Transactions of the American Fisheries Society 108: 344-352