Embed Size (px)
Citation preview
Monitoring Namibian rangelands from space: Developing a system with farmers
Delegation of the European Union to Namibia
Climate Change Adaptation and Mitigation, including Energy
21 June 2016
GEOGLAM RAPP WORKSHOP
Cornelis van der Waal
Namibia Rangeland Monitoring Project
Introduction
• Namibia most arid African country south of equator
• Animal production systems dominant landuse
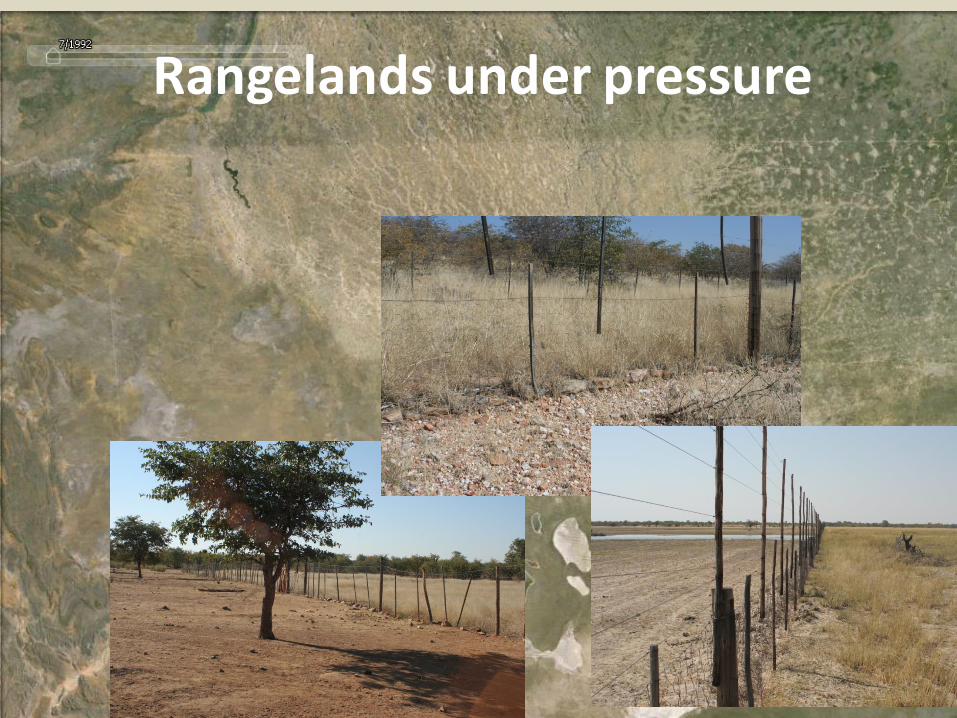
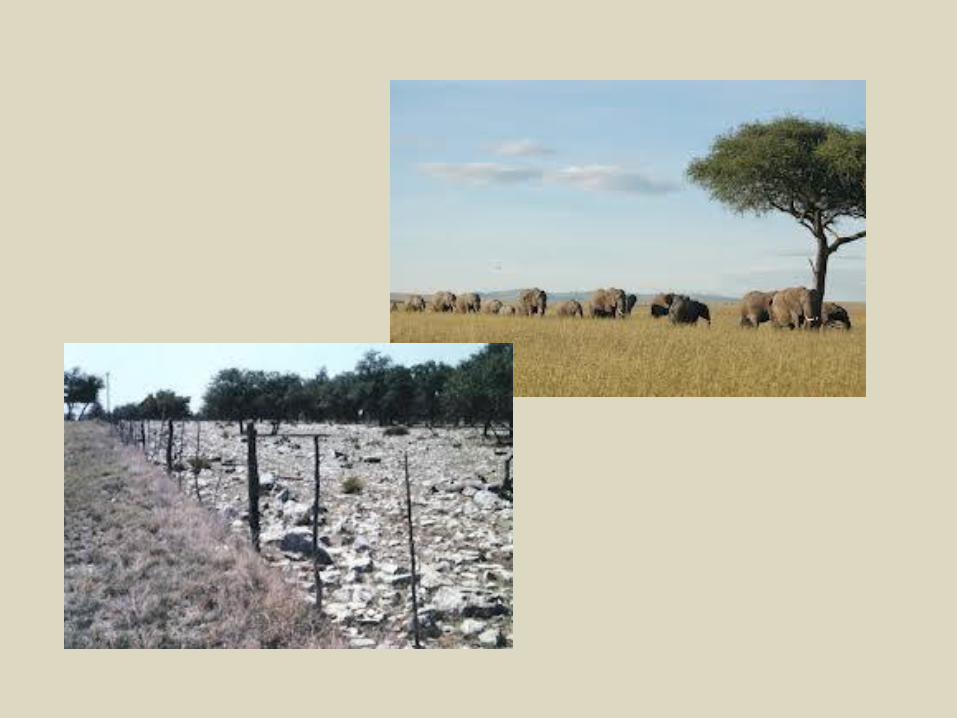
Rangelands under pressure
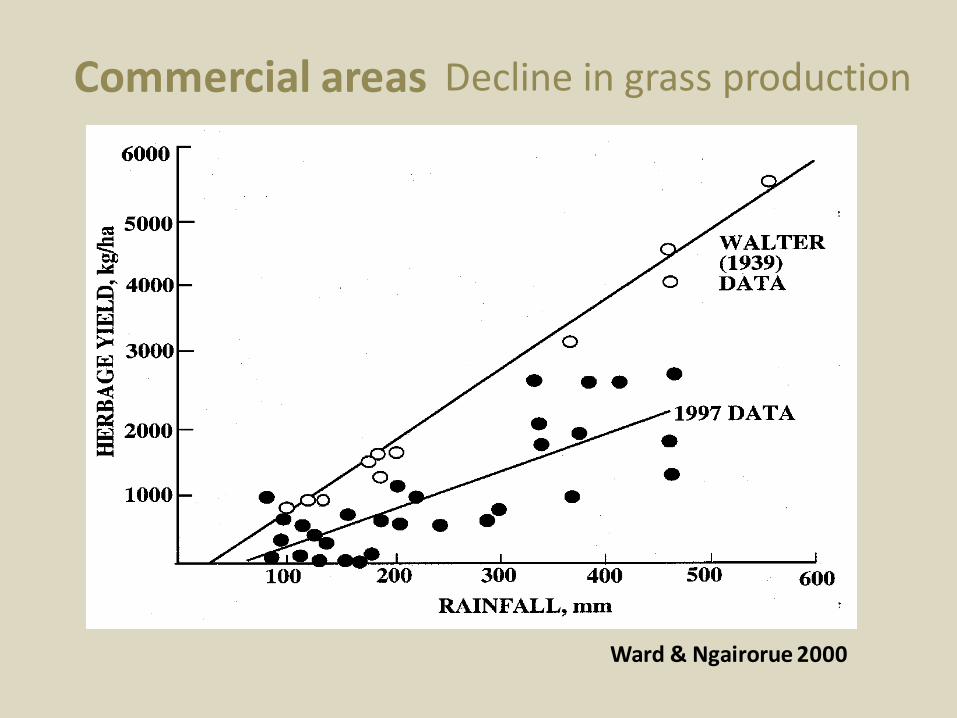
Ward & Ngairorue 2000
1939: 10.34 kg herbage/mm 1997: 5.93 kg herbage/mm
Decline in grass production Commercial areas
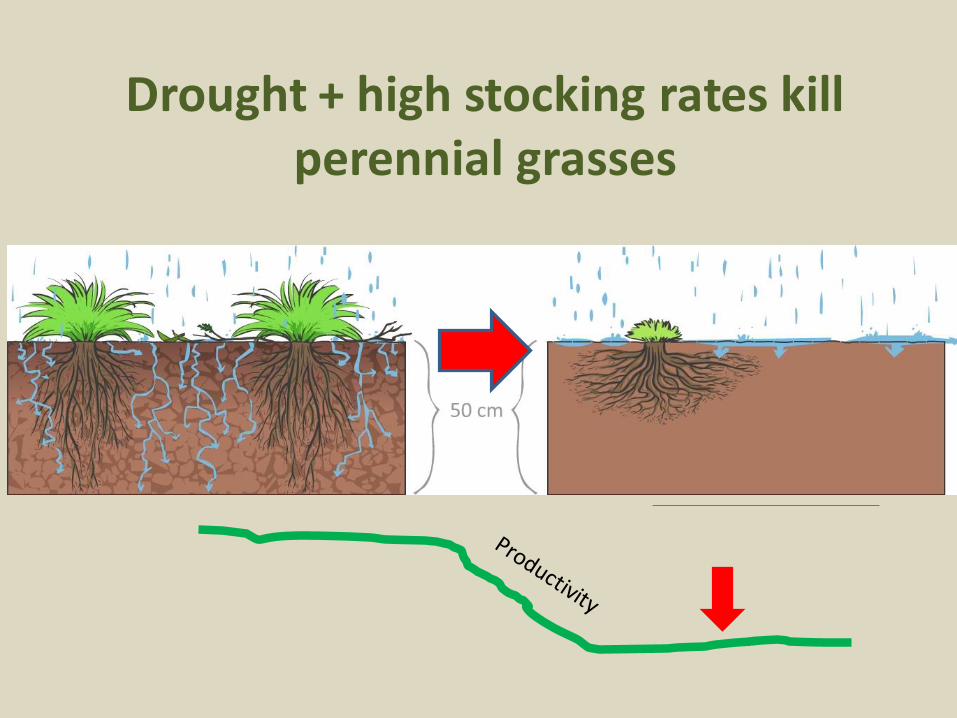
Drought + high stocking rates kill perennial grasses
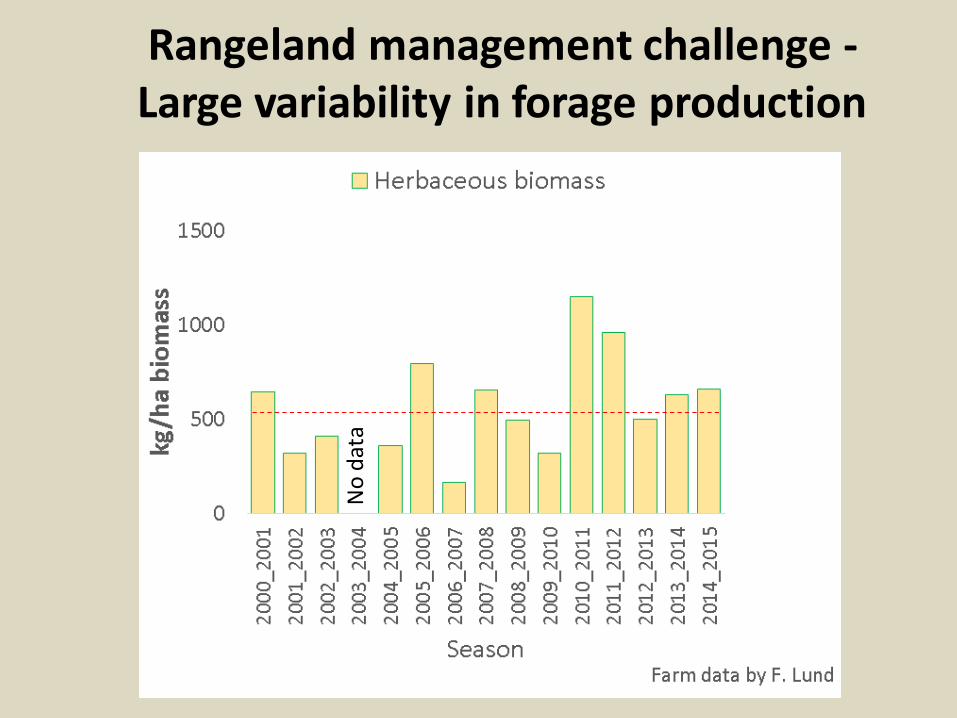
Rangeland management challenge -Large variability in forage production
No
dat
a
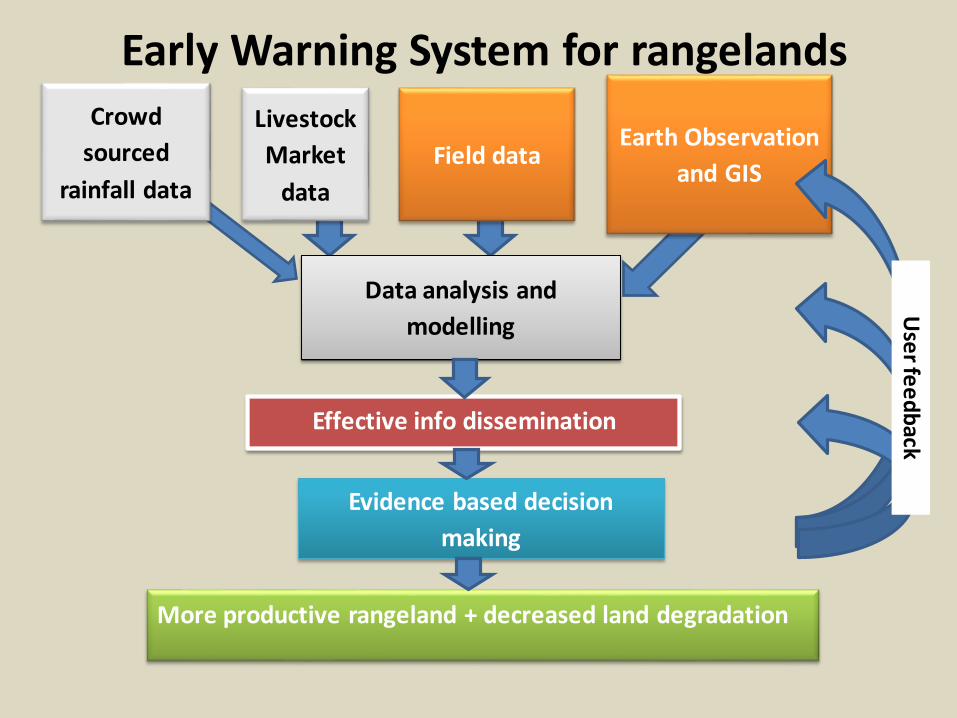
Early Warning System for rangelands
More productive rangeland + decreased land degradation
Evidence based decision
making
Data analysis and
modelling
Earth Observation
and GISField data
Effective info dissemination
Use
r fee
db
ack
Livestock
Market
data
Crowd
sourced
rainfall data
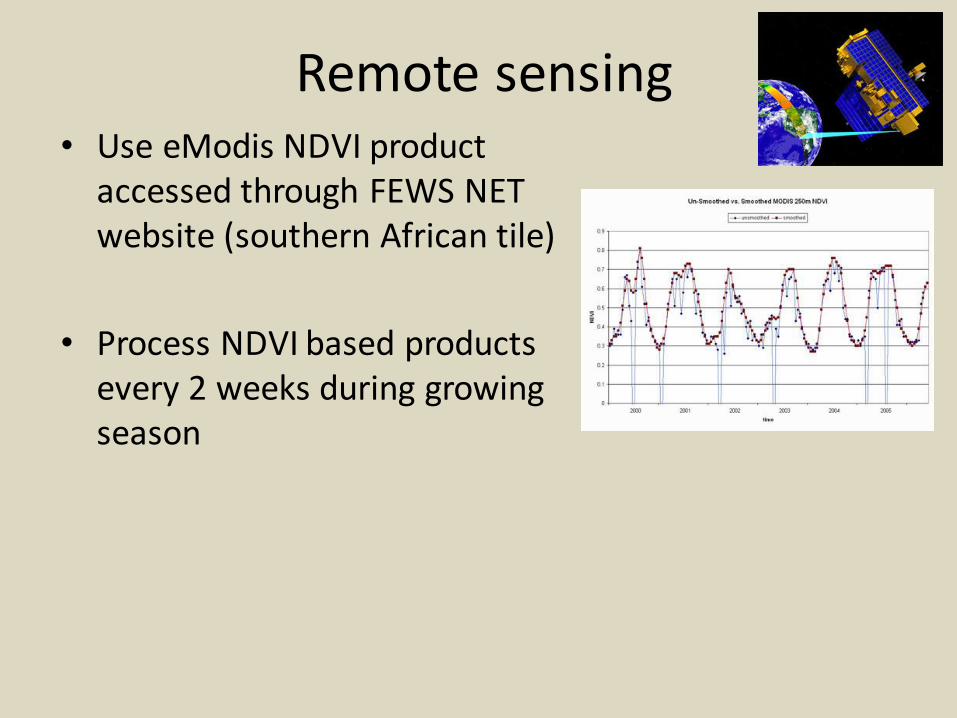
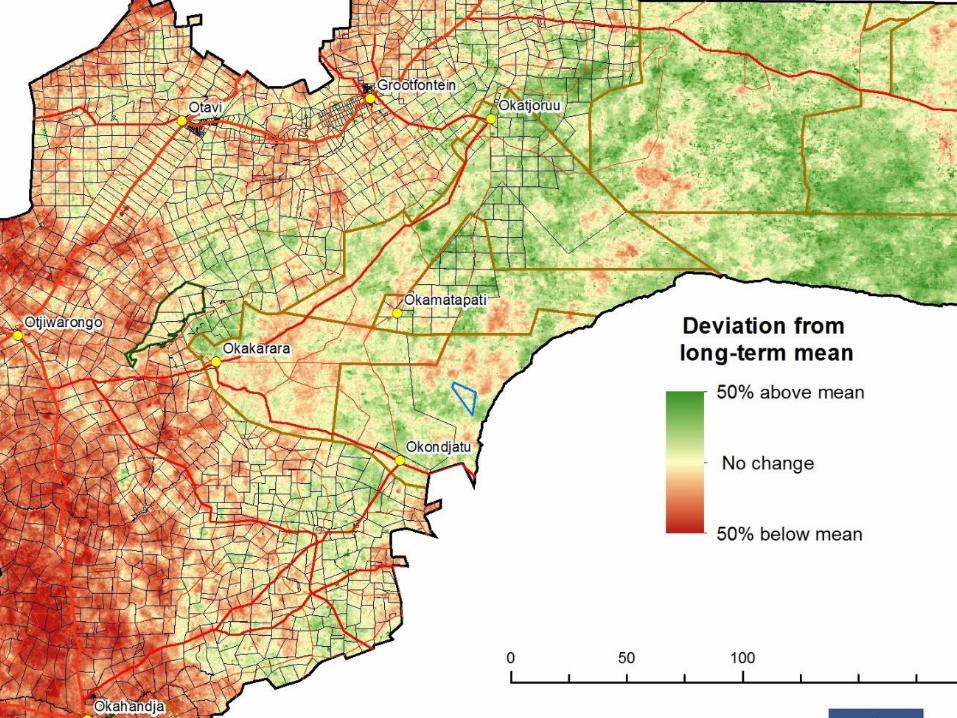
Remote sensing • Use eModis NDVI product
accessed through FEWS NET website (southern African tile)
• Process NDVI based products every 2 weeks during growing season
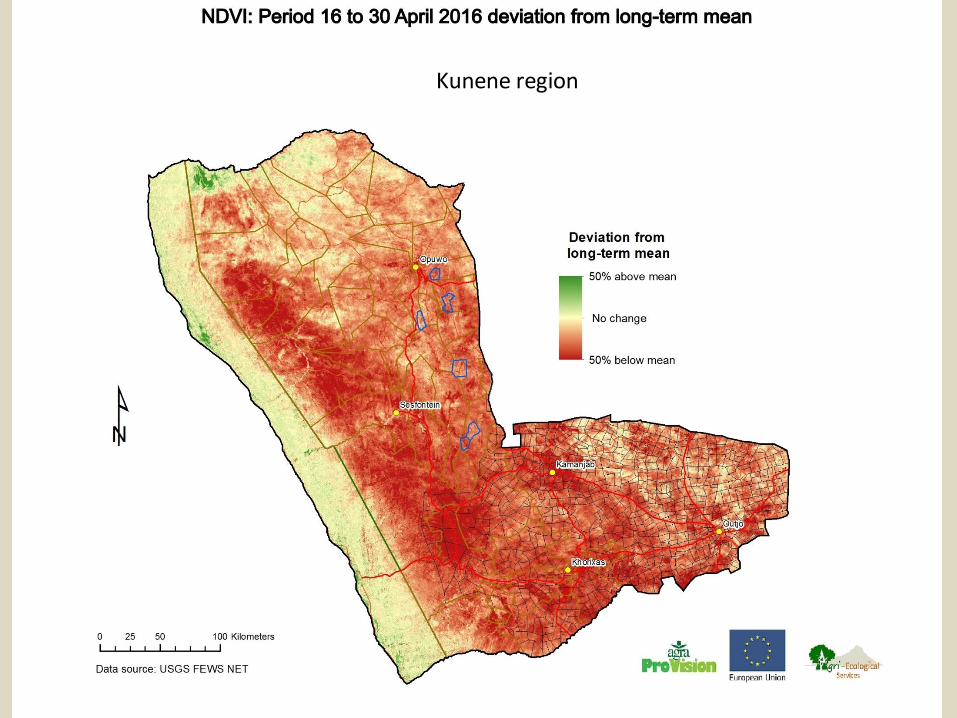
Kunene region
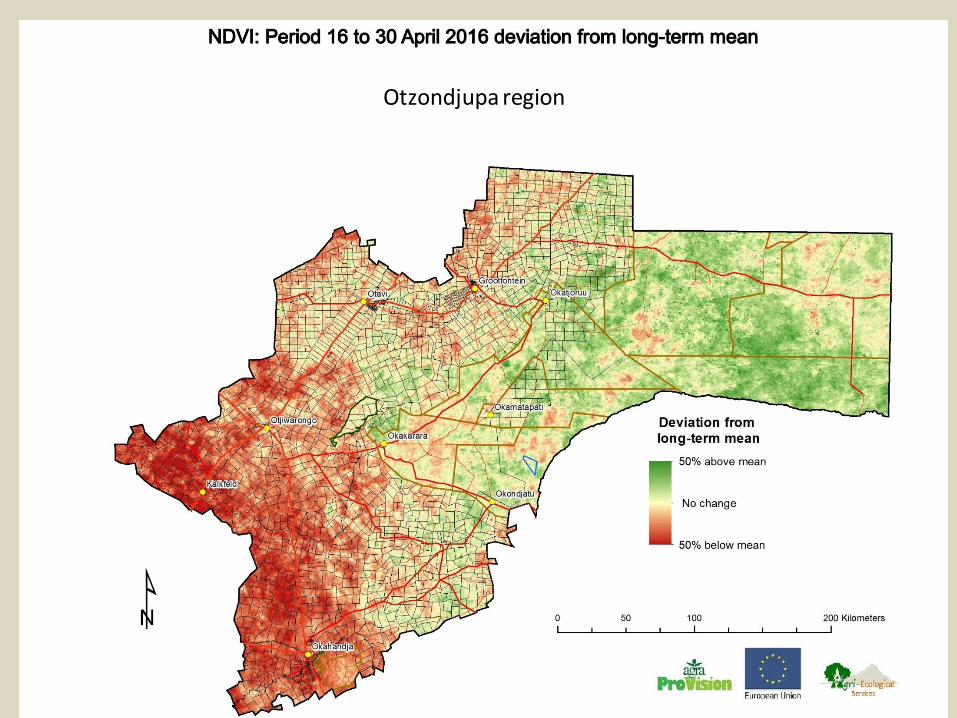
Otzondjupa region
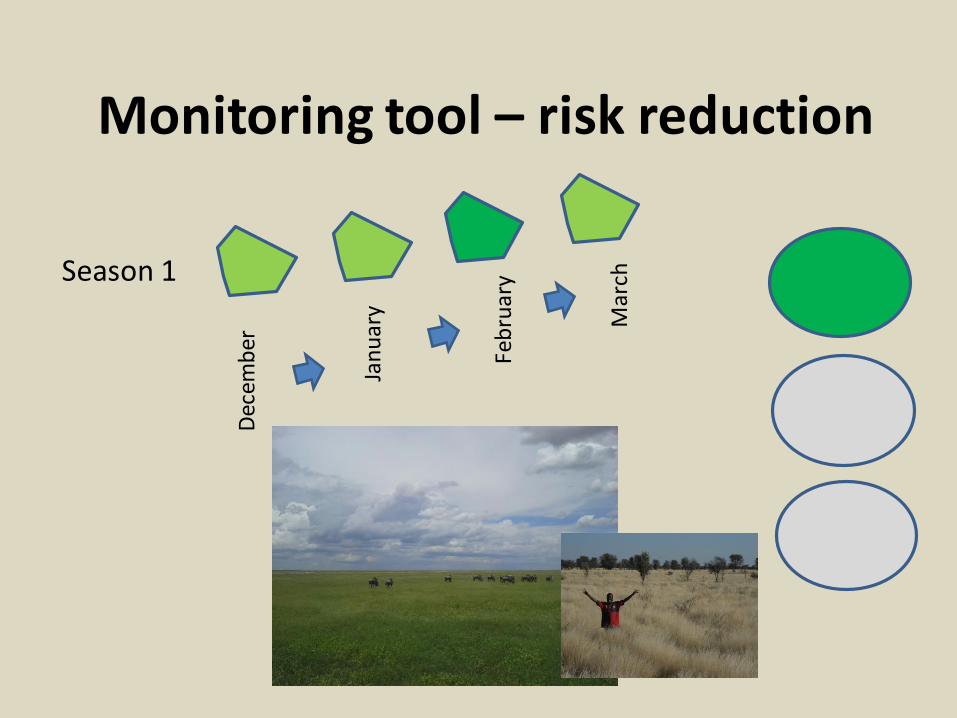
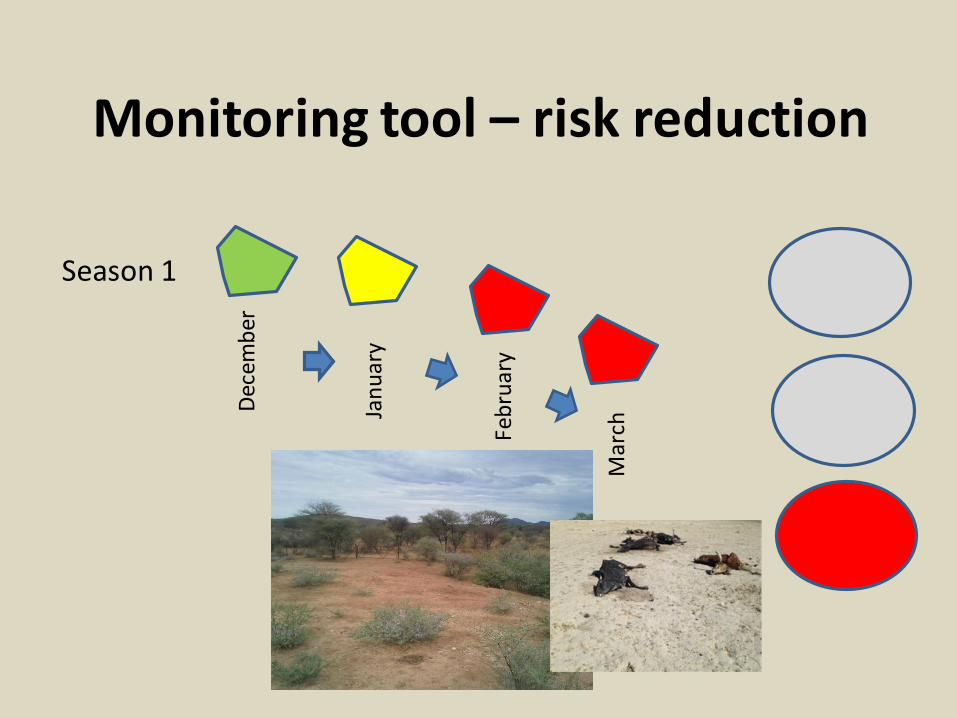
Monitoring tool – risk reduction
Season 1D
ecem
ber
Mar
ch
Feb
ruar
y
Jan
uar
y
Monitoring tool – risk reduction
Season 1D
ecem
ber
Mar
chFeb
ruar
y
Jan
uar
y
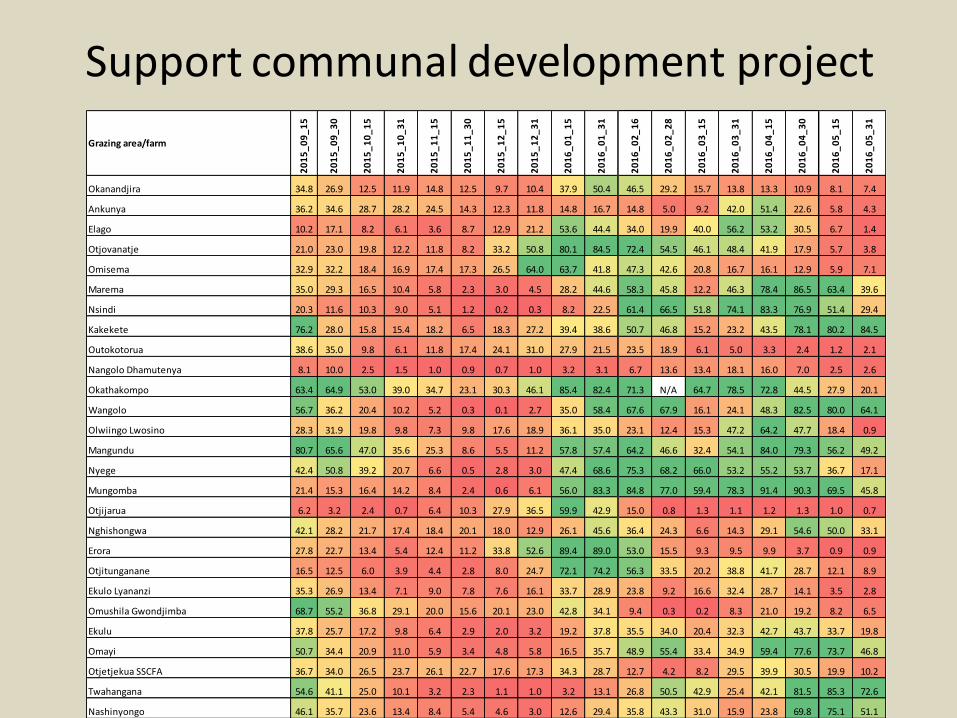
Support communal development project
Grazing area/farm
20
15
_0
9_
15
20
15
_0
9_
30
20
15
_1
0_
15
20
15
_1
0_
31
20
15
_1
1_
15
20
15
_1
1_
30
20
15
_1
2_
15
20
15
_1
2_
31
20
16
_0
1_
15
20
16
_0
1_
31
20
16
_0
2_
16
20
16
_0
2_
28
20
16
_0
3_
15
20
16
_0
3_
31
20
16
_0
4_
15
20
16
_0
4_
30
20
16
_0
5_
15
20
16
_0
5_
31
Okanandjira 34.8 26.9 12.5 11.9 14.8 12.5 9.7 10.4 37.9 50.4 46.5 29.2 15.7 13.8 13.3 10.9 8.1 7.4
Ankunya 36.2 34.6 28.7 28.2 24.5 14.3 12.3 11.8 14.8 16.7 14.8 5.0 9.2 42.0 51.4 22.6 5.8 4.3
Elago 10.2 17.1 8.2 6.1 3.6 8.7 12.9 21.2 53.6 44.4 34.0 19.9 40.0 56.2 53.2 30.5 6.7 1.4
Otjovanatje 21.0 23.0 19.8 12.2 11.8 8.2 33.2 50.8 80.1 84.5 72.4 54.5 46.1 48.4 41.9 17.9 5.7 3.8
Omisema 32.9 32.2 18.4 16.9 17.4 17.3 26.5 64.0 63.7 41.8 47.3 42.6 20.8 16.7 16.1 12.9 5.9 7.1
Marema 35.0 29.3 16.5 10.4 5.8 2.3 3.0 4.5 28.2 44.6 58.3 45.8 12.2 46.3 78.4 86.5 63.4 39.6
Nsindi 20.3 11.6 10.3 9.0 5.1 1.2 0.2 0.3 8.2 22.5 61.4 66.5 51.8 74.1 83.3 76.9 51.4 29.4
Kakekete 76.2 28.0 15.8 15.4 18.2 6.5 18.3 27.2 39.4 38.6 50.7 46.8 15.2 23.2 43.5 78.1 80.2 84.5
Outokotorua 38.6 35.0 9.8 6.1 11.8 17.4 24.1 31.0 27.9 21.5 23.5 18.9 6.1 5.0 3.3 2.4 1.2 2.1
Nangolo Dhamutenya 8.1 10.0 2.5 1.5 1.0 0.9 0.7 1.0 3.2 3.1 6.7 13.6 13.4 18.1 16.0 7.0 2.5 2.6
Okathakompo 63.4 64.9 53.0 39.0 34.7 23.1 30.3 46.1 85.4 82.4 71.3 N/A 64.7 78.5 72.8 44.5 27.9 20.1
Wangolo 56.7 36.2 20.4 10.2 5.2 0.3 0.1 2.7 35.0 58.4 67.6 67.9 16.1 24.1 48.3 82.5 80.0 64.1
Olwiingo Lwosino 28.3 31.9 19.8 9.8 7.3 9.8 17.6 18.9 36.1 35.0 23.1 12.4 15.3 47.2 64.2 47.7 18.4 0.9
Mangundu 80.7 65.6 47.0 35.6 25.3 8.6 5.5 11.2 57.8 57.4 64.2 46.6 32.4 54.1 84.0 79.3 56.2 49.2
Nyege 42.4 50.8 39.2 20.7 6.6 0.5 2.8 3.0 47.4 68.6 75.3 68.2 66.0 53.2 55.2 53.7 36.7 17.1
Mungomba 21.4 15.3 16.4 14.2 8.4 2.4 0.6 6.1 56.0 83.3 84.8 77.0 59.4 78.3 91.4 90.3 69.5 45.8
Otjijarua 6.2 3.2 2.4 0.7 6.4 10.3 27.9 36.5 59.9 42.9 15.0 0.8 1.3 1.1 1.2 1.3 1.0 0.7
Nghishongwa 42.1 28.2 21.7 17.4 18.4 20.1 18.0 12.9 26.1 45.6 36.4 24.3 6.6 14.3 29.1 54.6 50.0 33.1
Erora 27.8 22.7 13.4 5.4 12.4 11.2 33.8 52.6 89.4 89.0 53.0 15.5 9.3 9.5 9.9 3.7 0.9 0.9
Otjitunganane 16.5 12.5 6.0 3.9 4.4 2.8 8.0 24.7 72.1 74.2 56.3 33.5 20.2 38.8 41.7 28.7 12.1 8.9
Ekulo Lyananzi 35.3 26.9 13.4 7.1 9.0 7.8 7.6 16.1 33.7 28.9 23.8 9.2 16.6 32.4 28.7 14.1 3.5 2.8
Omushila Gwondjimba 68.7 55.2 36.8 29.1 20.0 15.6 20.1 23.0 42.8 34.1 9.4 0.3 0.2 8.3 21.0 19.2 8.2 6.5
Ekulu 37.8 25.7 17.2 9.8 6.4 2.9 2.0 3.2 19.2 37.8 35.5 34.0 20.4 32.3 42.7 43.7 33.7 19.8
Omayi 50.7 34.4 20.9 11.0 5.9 3.4 4.8 5.8 16.5 35.7 48.9 55.4 33.4 34.9 59.4 77.6 73.7 46.8
Otjetjekua SSCFA 36.7 34.0 26.5 23.7 26.1 22.7 17.6 17.3 34.3 28.7 12.7 4.2 8.2 29.5 39.9 30.5 19.9 10.2
Twahangana 54.6 41.1 25.0 10.1 3.2 2.3 1.1 1.0 3.2 13.1 26.8 50.5 42.9 25.4 42.1 81.5 85.3 72.6
Nashinyongo 46.1 35.7 23.6 13.4 8.4 5.4 4.6 3.0 12.6 29.4 35.8 43.3 31.0 15.9 23.8 69.8 75.1 51.1
Oihole Farm 43.1 40.0 27.0 16.7 4.6 0.7 0.0 3.5 71.2 93.7 97.9 81.7 45.2 49.5 58.7 71.2 38.5 13.0
Omupanda Farm 27.5 22.8 17.7 10.2 1.3 0.0 0.0 13.9 90.5 96.7 96.0 70.4 34.6 54.3 67.1 81.3 57.4 31.1
Osuudiya 40.8 38.0 27.7 16.4 3.1 0.0 0.0 32.2 90.9 97.5 96.4 61.9 48.9 42.4 56.3 83.3 83.4 59.9
Ohangwena small-scale commercial farms 40.3 28.5 17.4 11.6 4.7 0.6 0.2 9.7 76.4 88.9 91.2 64.8 43.4 33.2 40.1 63.8 52.6 30.9
Ondundombapa 52.6 53.9 42.7 34.6 31.9 25.8 18.0 19.7 36.3 25.4 6.8 0.5 3.2 18.7 28.6 21.9 13.7 7.6
Orozondjise 53.3 51.4 45.3 42.8 38.6 32.6 24.7 30.9 47.4 39.4 17.9 4.9 3.5 15.2 22.0 16.4 11.4 7.0
Otjetjekua 39.0 34.7 32.5 34.8 38.1 36.9 26.3 24.7 40.4 38.3 19.4 5.3 8.2 28.7 37.1 24.8 10.5 7.3
Otjenova 35.2 29.6 21.8 23.4 28.3 22.5 11.8 7.2 22.9 33.9 23.0 5.1 8.8 44.6 59.7 43.2 19.1 4.9
Odjina Yomanyangwa 41.1 28.1 20.5 15.1 8.1 0.8 0.1 1.8 64.7 84.4 94.3 57.2 28.9 34.9 51.4 69.3 58.8 32.9
Hileni Mbeli 52.0 51.1 36.0 23.9 12.1 2.6 1.5 8.2 79.5 95.1 97.6 71.5 29.0 35.7 43.7 61.3 38.0 13.0
Junias 50.6 33.8 18.3 9.6 4.3 0.2 0.0 28.7 79.7 92.4 94.1 50.2 31.1 26.4 14.4 37.8 38.6 30.7
Otjenova 35.2 29.6 21.8 23.4 28.3 22.5 11.8 7.2 22.9 33.9 23.0 5.1 8.8 44.6 59.7 43.2 19.1 4.9
Otjijamangombe 47.5 38.8 34.2 27.6 19.6 12.6 9.4 9.1 38.0 59.4 72.8 54.9 42.4 62.6 70.2 57.5 24.7 6.0
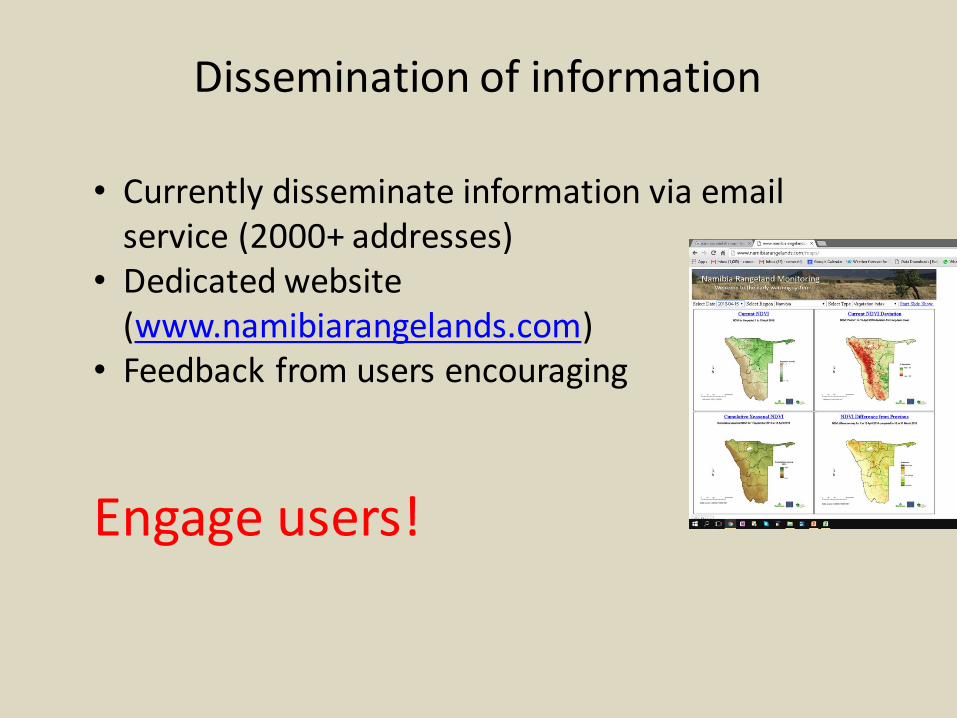
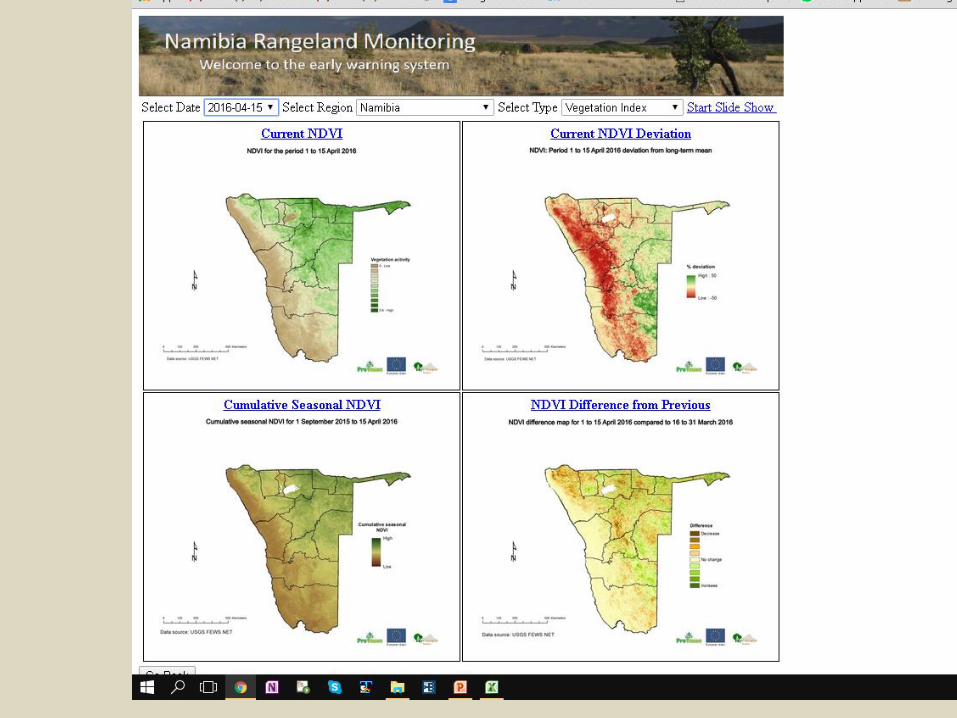
• Currently disseminate information via email service (2000+ addresses)
• Dedicated website (www.namibiarangelands.com)
• Feedback from users encouraging
Engage users!
Dissemination of information
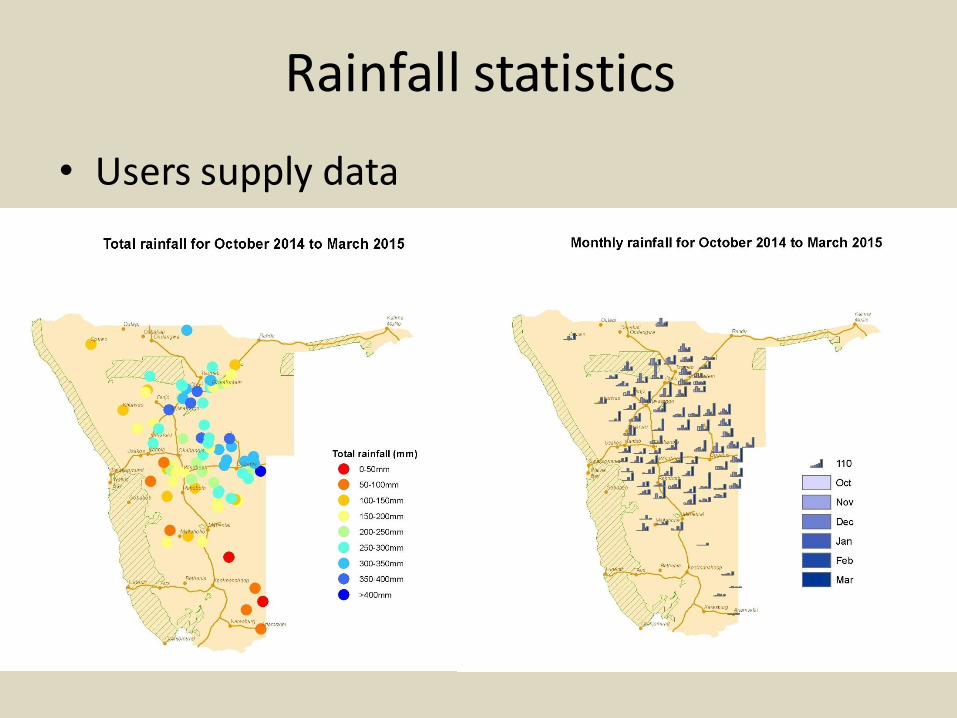
Rainfall statistics
• Users supply data
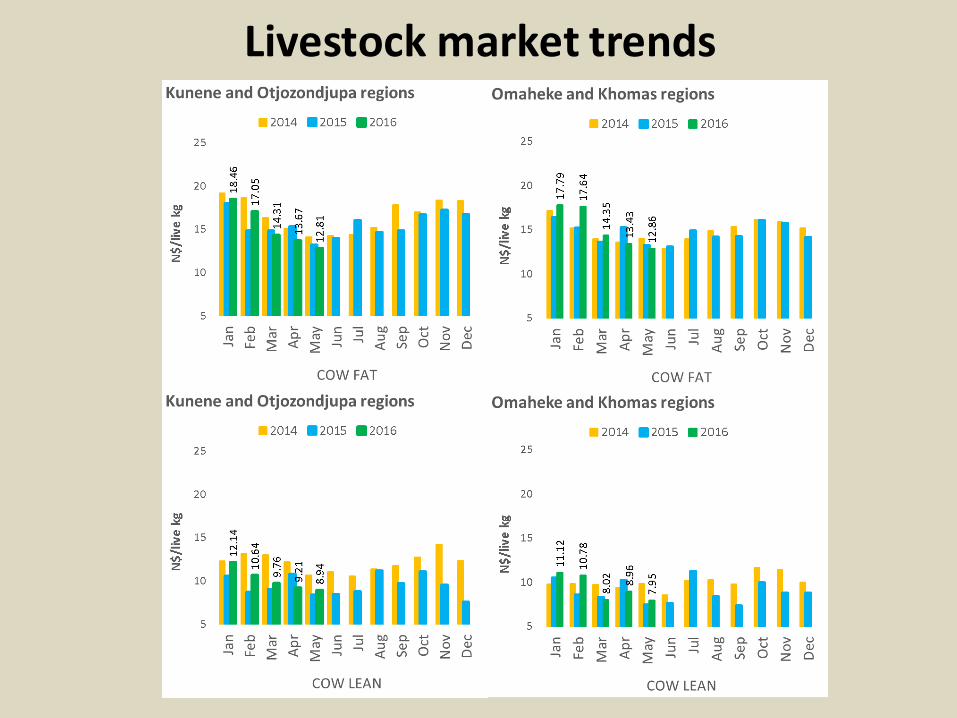
Livestock market trends
0.2
0.3
0.4
0.5
0.6
0
500
1000
1500
2000
_200
1
2001
_200
2
2002
_200
3
2003
_200
4
2004
_200
5
2005
_200
6
2006
_200
7
2007
_200
8
2008
_200
9
2009
_201
0
2010
_201
1
2011
_201
2
2012
_201
3
2013
_201
4
2014
_201
5
Me
an N
DV
I (F
eb
rua
ry t
o M
ay)
kg/h
a b
iom
ass
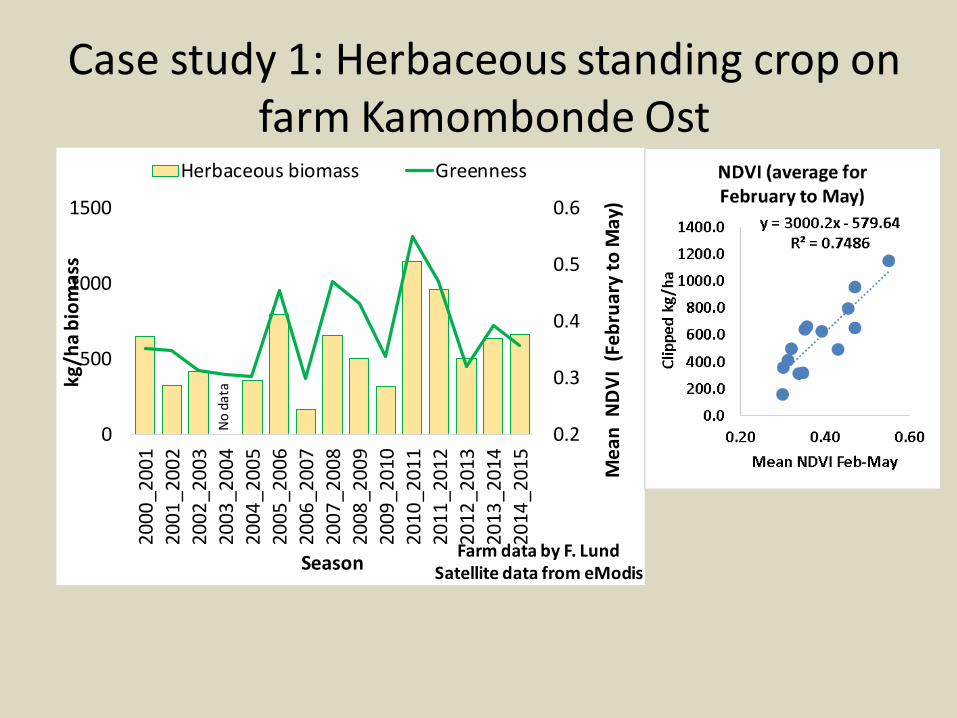
SeasonFarm data by F. Lund
Satellite data from eModis
Herbaceous biomass Greenness
Case study 1: Herbaceous standing crop on farm Kamombonde Ost
No
data
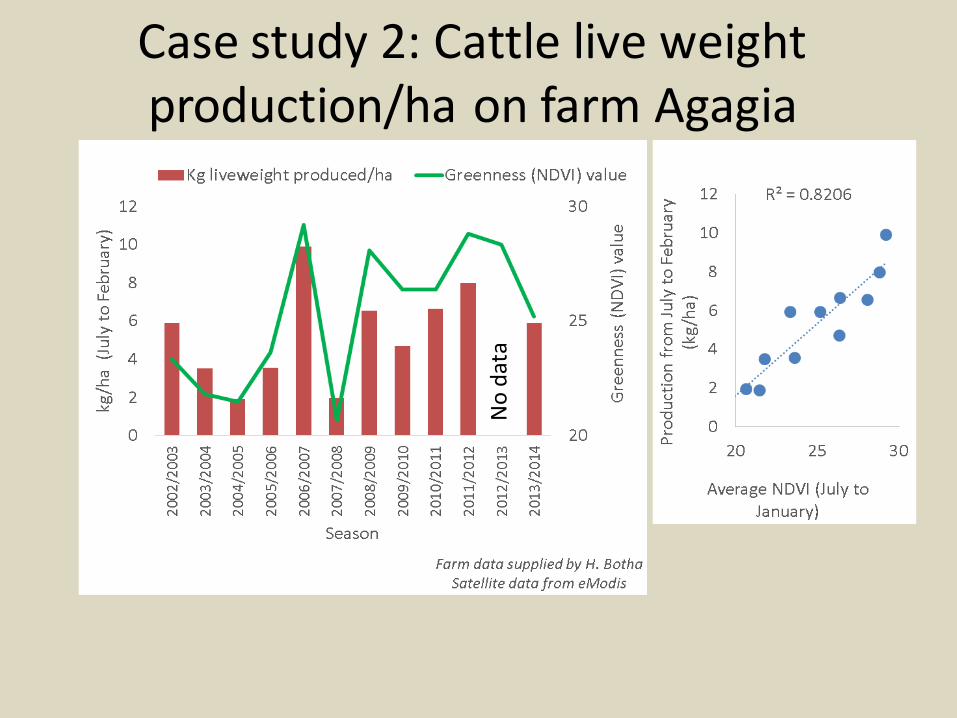
Case study 2: Cattle live weight production/ha on farm Agagia
No
dat
a
Dry season forage budgetting model
• Very long dry season (6-8 months dormant herbaceous layer)
• Grazers dependent on accumulated herbaceous biomass during the growing season to bridge dry season
• Aim: Predict end-of-growing season herbaceous biomass
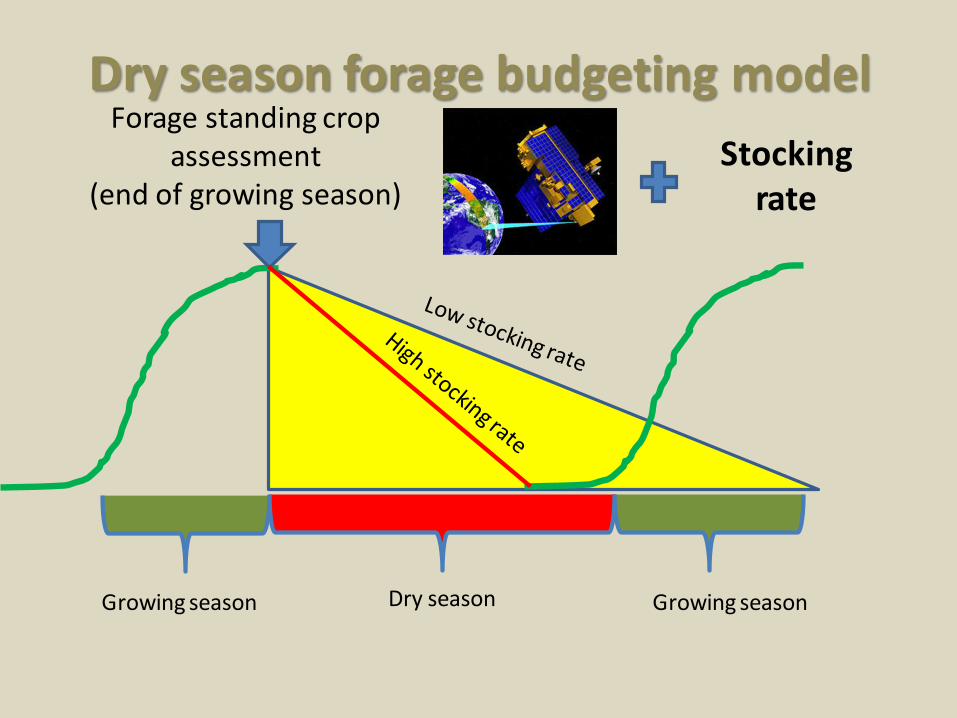
Growing seasonGrowing season Dry season
Forage standing crop assessment
(end of growing season)
Dry season forage budgeting model
Stocking rate
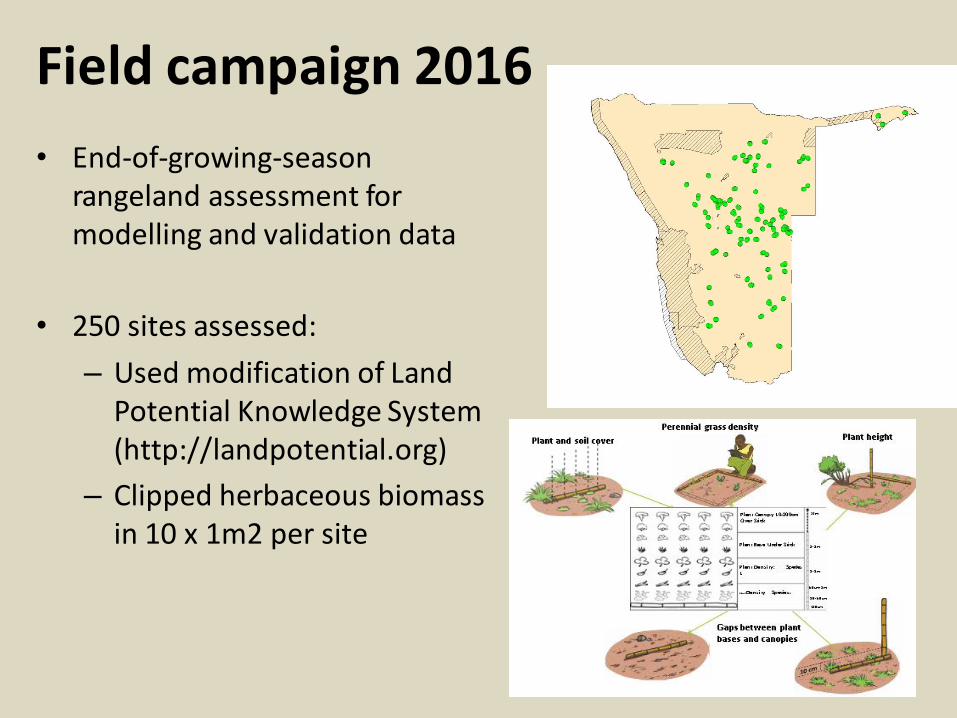
Field campaign 2016
• End-of-growing-season rangeland assessment for modelling and validation data
• 250 sites assessed:
– Used modification of Land Potential Knowledge System (http://landpotential.org)
– Clipped herbaceous biomass in 10 x 1m2 per site
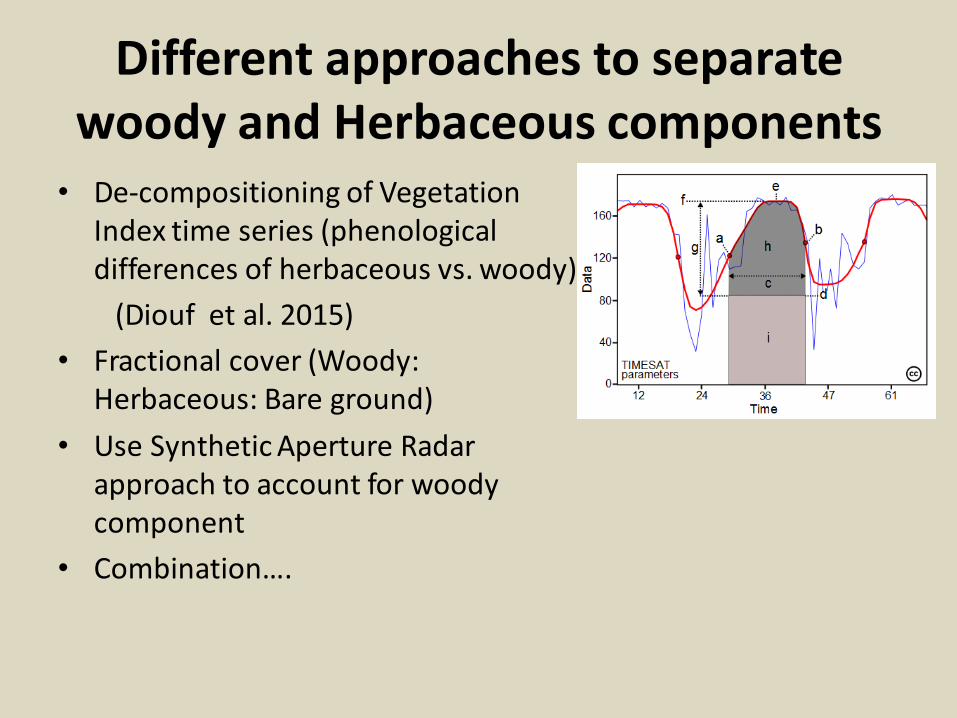
Different approaches to separate woody and Herbaceous components
• De-compositioning of Vegetation Index time series (phenologicaldifferences of herbaceous vs. woody)
(Diouf et al. 2015)
• Fractional cover (Woody: Herbaceous: Bare ground)
• Use Synthetic Aperture Radar approach to account for woody component
• Combination….


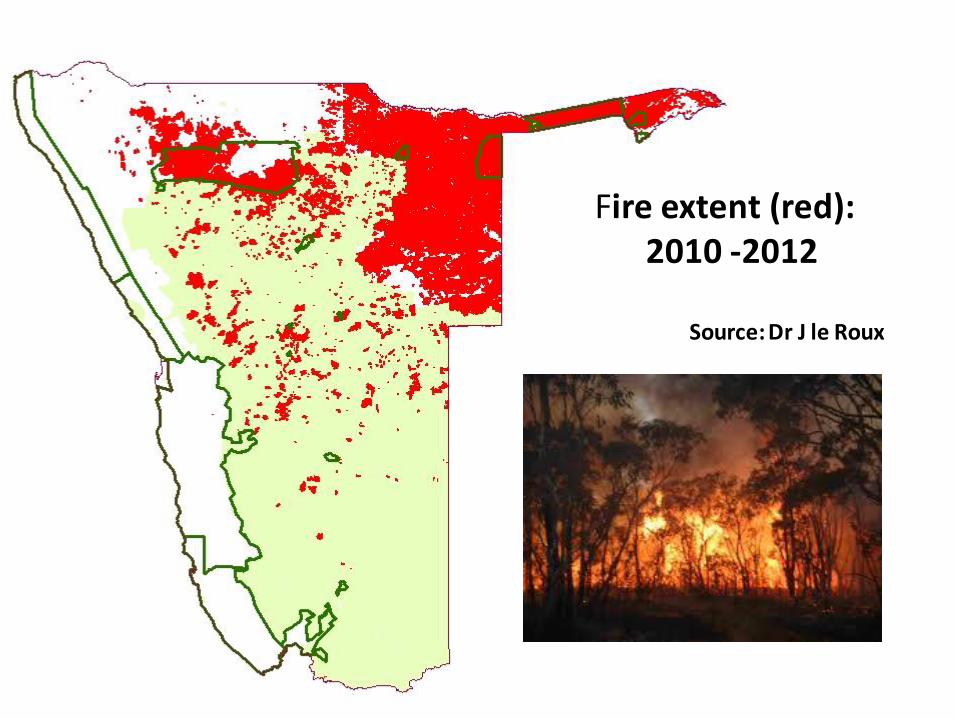
Fire extent (red):2010 -2012
Source: Dr J le Roux
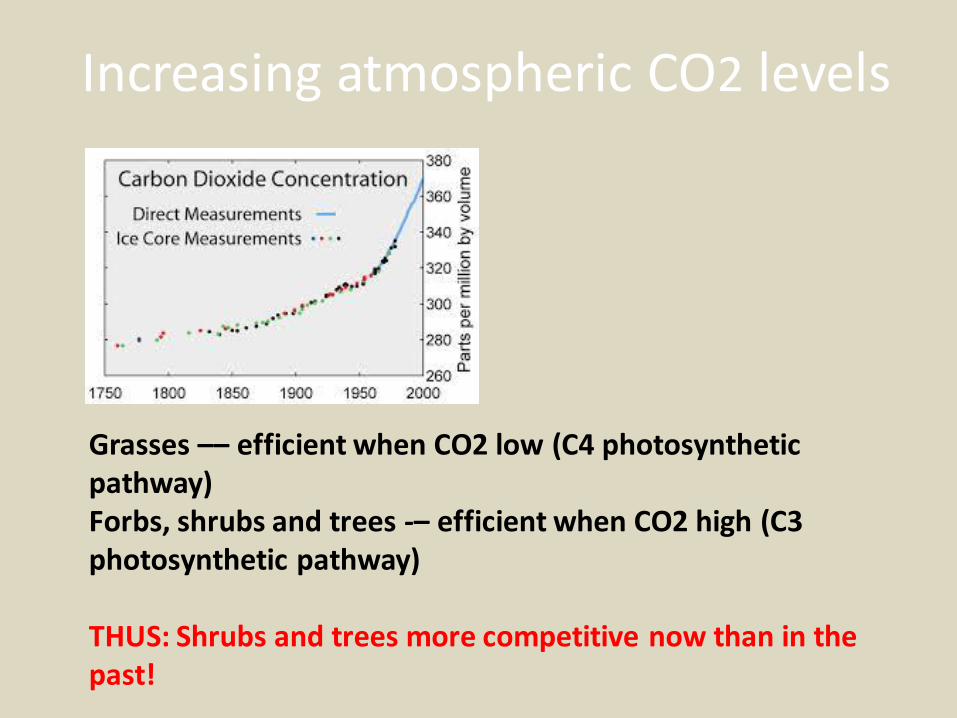
Increasing atmospheric CO2 levels
Grasses –– efficient when CO2 low (C4 photosynthetic pathway) Forbs, shrubs and trees -– efficient when CO2 high (C3 photosynthetic pathway)
THUS: Shrubs and trees more competitive now than in the past!
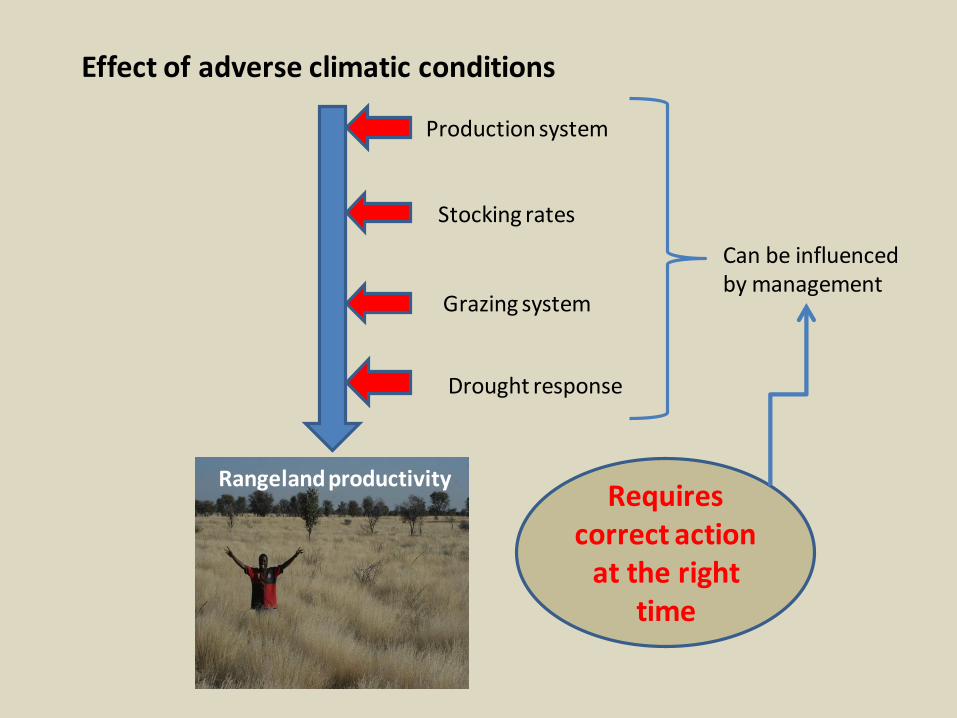
Effect of adverse climatic conditions
Rangelandproductivity
Stocking rates
Production system
Can be influenced by management
Grazing system
Requires correct action
at the right time
Drought response