Embed Size (px)
Citation preview

Presented by,
MySQL & O’Reilly Media, Inc.
Monitoring MySQL
A quick overview of available tools

Monitoring
! Monitoring your database is as important as benchmarking
! You want to view trends over time
! See how hardware application and schema changes affect performance
! Get alerts when something goes wrong

Presented by,
MySQL & O’Reilly Media, Inc.
Monitor tool basics
! show full processlist
! Show global status
! Show global variables
All the monitoring of MySQL relies in some way on this framework provided by the server. There are sometimes methods of getting additional information and linking system information to the MySQL data but both of these tools are part of most monitoring solutions, wether the end user is aware of it or not
Show global status
! MySQL keeps status counters on each of the various operations it has performed.
Run a select statement... increment com_select
Run a delete increment com_delete
Open a table increment tables_opened
Accept a connection increment Threads_connected
SHOW GLOBAL VARIABLES
! Many of MySQL configuration options are dynamic. We set them in a config file but a user with appropriate permissions can change them on a running server.
! SHOW GLOBAL VARIABLES allows us to see the current configuration.
! Comparing the settings and cache sizes shown in the variables with the operations shown in status allows us to get a view of our servers configuration and performance
Show full processlist
! Shows you who is connected and what they are doing.
Basic tools
! mysqladmin is provided with the server, allthough I call it basic it is also very powerful. Some examples.
mysqladmin -i 10 extended status
In this example mysqladmin will connect to the server run “show global status” and then sleep for ten seconds and run the same command again.
“Pipe that through your grep and smoke it” (bad pun.. groan)
mysqladmin
! Final thoughts..
Do not dismiss mysqladmin because it seems simple and unsophisticated. No it does not make pretty graphs or email you when your server crashes.. but by using the sleep function, running a process against the server and watching you can frequently get some useful information.
MySQL administrator
! Our administrator GUI provides a view of server status, server variables, processlist, and a collection of graphs.
! Easy to use
! Good first introduction to the variables and activity that you want to monitor
! Take a look at the health graphs, edit them, add your own and get a feel for how they work.

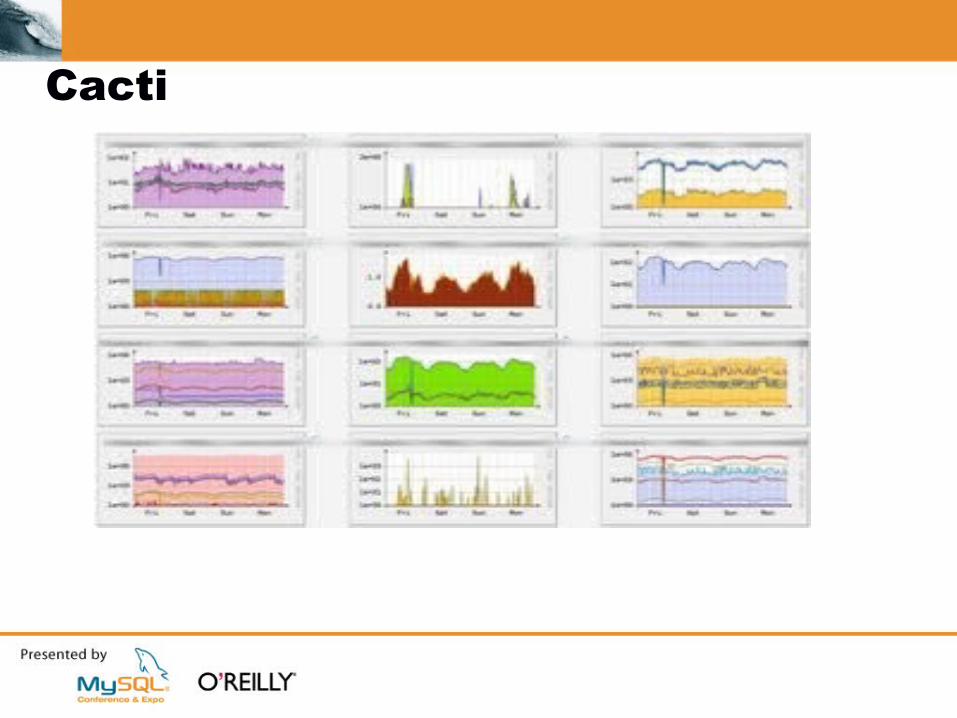
Cacti
! Cacti is a rrdtool based network graphing tool
! PHP apache and MySQL based solution
! Monitors devices on a network
! Modular has been extended to include MySQL monitoring
! URL for cacti http://www.cacti.net/
! MySQL plugin http://faemalia.net/mysqlUtils/
Cacti
! How does CACTI work..
Modular
“Poller” gathers the data to be monitored remote hosts are polled using SNMP
RRDTool stores the data.
“round Robin database” compact, won't grow to fill your disk.
Presentation.
Nice graphs built by RRDtool presented in a browser.
Cacti
Cacti
! PROS
Cacti is fairly easy to configure. Apache PHP and a crontab managed “poller” so it is a bit more difficult on windows
Cacti is fairly commonly used so you have a large community of users
! CONS
Nothing major

Munin
! Similar to cacti
Seemed to be easier to configure the data collector in munin and it seemed to therefore be less flexible in terms of polling interval.
Google cacti vs munin and make your own decision, to similar to go into the details.
Munin
! URL
http://munin.projects.linpro.no/
Zenoss
! Open source network monitoring tool
I did not have enough time to give Zenoss a good going over. So it is time for an audience poll
Who uses it ?
Who likes it ? Why ?
Who tried it and discarded it ? Why
Zenoss
! Regardless of what the “audience poll” had to say I think Zenoss shows great promise and I intend to check it out.
! Cons..
I hate to be negative but why do we need a plugin to google maps ? If you do not know where your servers are then you need more than monitoring tools.
Seems like the AJAX designers went too far there ?
A few more text based tools
! innotop
! mytop
! mtstat-mysql
innotop
! Monitoring innodb can be a little more complex
! Show engine innodb status... complex output
! innotop organizes the innodb information and presents it in user friendly but text based form.
! URL http://www.xaprb.com/blog/2006/07/02/innotop-mysql-innodb-monitor/
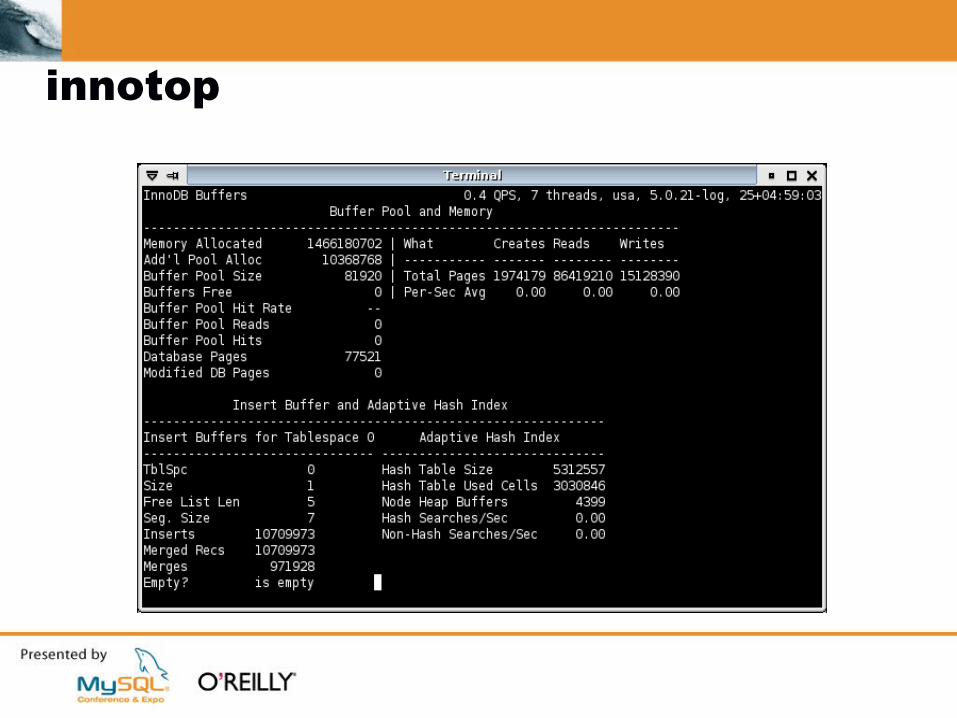
innotop

Innotop
! Developed by “community member of the year” Baron Schwartz
mytop
! Provides MySQL information similar to the linux utility “top”
Some summary information at the top, similar to the output of the “status” command in the client.
List of threads connected, similar to the output of “show full processlist”
mytop
! Cool features
Filter connections based on database/host being used
Kill connections
Queries per second mode
mytop
! MyTop makes the process of connecting to the server and running a series of commands much easier and intuitive. Check it out

mtstat-mysql
! Plugin for the system monitoring tool mtstat
mtstat provides the functionality of vmstat and iostat tools to monitor system activity.
mtstat-mysql is a collection of plugins that add the ability to monitor mysql performance.
The combination allows you to see what sort of database requests lead to what sort of system utilization
mtstat-mysql
! URL
https://launchpad.net/mtstat
! Cool features
Text based yet feature rich.. color coding, autoupdating.
mtstat-mysql
! Details
Python based, sparse documentation.
Mostly intuitive.
Install mtstat and then mtstat-mysql

Nagios
! URL
http://www.nagios.org/
! Nagios is more of a notification tool. It is frequently used in combination with CACTI MUNIN or any of the monitoring tools.
Configure the other tools to gather the information and make graphs of normal behavior, configure nagios to call/email you when something is wrong.
Nagios
! A few tools, zenoss and our dashboard do there own alerting. Centralized alerts are important so plenty of tools can be used in combination with Nagios.
Nagios
! PROS
Widely used, flexible, configurable, comprehensive
! CONS
Complex setup, time consuming, strange config file.
MySQL Enterprise Monitor
! URL
http://www.mysql.com/products/enterprise/monitor.html
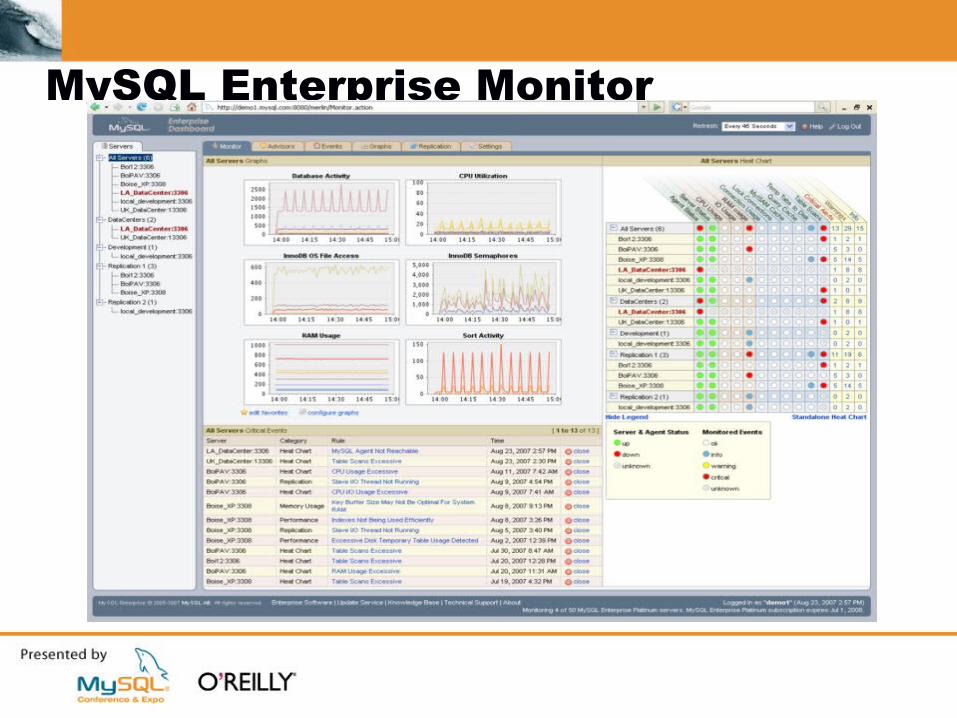
! Cool features
Monitoring , alerting, graphing, heat chart, advisors for tuning and the like all in one place
MySQL Enterprise Monitor
! Buy the Monitor get free MySQL enterprise subscription and support. Or is it buy MySQL enterprise get the Monitor for free ?
! Regardless of how you look at it the Monitor is not available for free, except for the free thirty day trial. Install it and check it out.
MySQL Enterprise Monitor
Monitor details
! Built by folks who know MySQL well
! Agent based
Agent installed on server or remotely gathers MySQL data and Server data and the Monitor presents that data in a series of graphs.
! Well organized
Allows for grouping of servers graphs and heat charts so that I can quickly view a screen and spot any trouble spots for large groups of servers.
Monitor Details
! Replication Aware
Auto detects your replication setup and monitors accordingly.
! URL that discusses features briefly
http://www.mysql.com/products/enterprise/benefits.html