Embed Size (px)
Citation preview
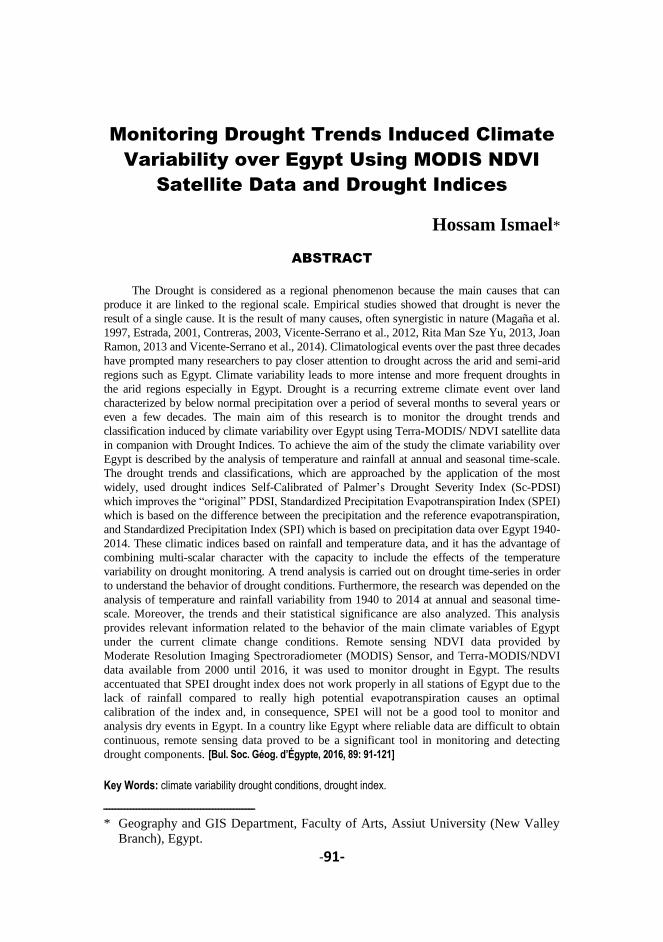
Monitoring Drought Trends Induced Climate Variability over Egypt Hossam Ismael
-91-
Monitoring Drought Trends Induced Climate
Variability over Egypt Using MODIS NDVI
Satellite Data and Drought Indices
Hossam Ismael*
ABSTRACT
The Drought is considered as a regional phenomenon because the main causes that can
produce it are linked to the regional scale. Empirical studies showed that drought is never the
result of a single cause. It is the result of many causes, often synergistic in nature (Magaña et al.
1997, Estrada, 2001, Contreras, 2003, Vicente-Serrano et al., 2012, Rita Man Sze Yu, 2013, Joan
Ramon, 2013 and Vicente-Serrano et al., 2014). Climatological events over the past three decades
have prompted many researchers to pay closer attention to drought across the arid and semi-arid
regions such as Egypt. Climate variability leads to more intense and more frequent droughts in
the arid regions especially in Egypt. Drought is a recurring extreme climate event over land
characterized by below normal precipitation over a period of several months to several years or
even a few decades. The main aim of this research is to monitor the drought trends and
classification induced by climate variability over Egypt using Terra-MODIS/ NDVI satellite data
in companion with Drought Indices. To achieve the aim of the study the climate variability over
Egypt is described by the analysis of temperature and rainfall at annual and seasonal time-scale.
The drought trends and classifications, which are approached by the application of the most
widely, used drought indices Self-Calibrated of Palmer‟s Drought Severity Index (Sc-PDSI)
which improves the “original” PDSI, Standardized Precipitation Evapotranspiration Index (SPEI)
which is based on the difference between the precipitation and the reference evapotranspiration,
and Standardized Precipitation Index (SPI) which is based on precipitation data over Egypt 1940-
2014. These climatic indices based on rainfall and temperature data, and it has the advantage of
combining multi-scalar character with the capacity to include the effects of the temperature
variability on drought monitoring. A trend analysis is carried out on drought time-series in order
to understand the behavior of drought conditions. Furthermore, the research was depended on the
analysis of temperature and rainfall variability from 1940 to 2014 at annual and seasonal time-
scale. Moreover, the trends and their statistical significance are also analyzed. This analysis
provides relevant information related to the behavior of the main climate variables of Egypt
under the current climate change conditions. Remote sensing NDVI data provided by
Moderate Resolution Imaging Spectroradiometer (MODIS) Sensor, and Terra-MODIS/NDVI
data available from 2000 until 2016, it was used to monitor drought in Egypt. The results
accentuated that SPEI drought index does not work properly in all stations of Egypt due to the
lack of rainfall compared to really high potential evapotranspiration causes an optimal
calibration of the index and, in consequence, SPEI will not be a good tool to monitor and
analysis dry events in Egypt. In a country like Egypt where reliable data are difficult to obtain
continuous, remote sensing data proved to be a significant tool in monitoring and detecting
drought components. [Bul. Soc. Géog. d’Égypte, 2016, 89: 91-121]
Key Words: climate variability drought conditions, drought index.
ــــــــــــــــــــــــــــــــــــــــــــــــــ* Geography and GIS Department, Faculty of Arts, Assiut University (New Valley
Branch), Egypt.

Bul. Soc. Géog. d’Égypte Tome LXXXIX
-92-
1. Introduction The sixteen Koppen climate zones can be broadly categorized into
“high”, “moderate” and “low” based on their overall projected magnitudes of
change in drought parameters. The “high” category includes Egypt climate
status in BWh, BSh. These climates tend to occur in the low-latitudes around
Egypt, and have robust increases in drought. Drought causes major losses in
agriculture (Potop et al., 2012 and Hunt et al., 2014) and damages natural
ecosystems and forestry (Burke et al., 2008). It may lead to desertification
and degradation of soils (Nicholson et al., 1998 and Vicente-Serrano et al.,
2012a).
Drought is an insidious natural hazard that results from lower levels of
precipitations than what is considered normal. When this phenomenon
extends over a season or a longer period of time, precipitation is insufficient
to meet the demands of human activities and the environment. The drought
must be considered a relative rather than absolute condition. There are also
many different methodologies for monitoring drought. Drought is regional in
extent and each region has specific climatic characteristics (World
Meteorological Organization, 2012).
Climatically, drought is among the most complex climatic phenomena
affecting society and the environment (Wilhite, 1993). The root of this
complexity is related to the difficulty of quantifying drought severity since
we identify a drought by its effects or impacts on different types of systems
(agriculture, water resources, ecology, forestry, economy, etc.), but there is
not a physical variable we can measure to quantify drought. Thus, droughts
are difficult to pinpoint in time and space since it is very complex to identify
the moment when a drought starts and ends and also to quantify its duration,
magnitude, and spatial extent (Burton et al., 1978 and Wilhite, 2000).
Drought is one of the most damaging natural hazards, in human,
environmental and economic terms (Sheffield & Wood, 2008b and Kirono et
al., 2011). It affects agriculture (Dai et al., 2004; Fink et al., 2004 and Motha
& Baier, 2005), irrigation (D¨oll, 2002) and food production (Li et al., 2009
and Piao et al., 2014). Droughts also have implications for hydrological (e.g.
Groundwater and reservoir storage; Vidal and Wade, 2009) and ecological
(Ciais et al., 2005; Gaborone et al., 2005 and Archer & Predick, 2008)
systems, e.g. aquatic ecosystems (Kirono et al., 2011). Their impacts on
socioeconomic systems (Alston & Kent, 2004; Fink et al., 2004 and Ding et
al., 2011) include municipal and industrial water supply (Blenkinsop &
Fowler, 2007a and Zhang et al., 2011), hydro-power generation, recreation,
industry (Panu and Sharma, 2002), and navigation (Graham et al., 2007).

Monitoring Drought Trends Induced Climate Variability over Egypt Hossam Ismael
-93-
Increasing drought conditions can lead to human health concerns
(Quevauviller, 2011), e.g. famine in northern Nigeria (Tarhule and Woo,
1997), as they could counteract the effects of the anticipated longer growing
seasons.
Despite advances in science and improved technology, drought remains
one of the major challenges of climate variability worldwide (Piao et al.,
2014). Impact assessment and adaptation decisions require specific
information about the spatial and temporal characteristics of drought risk
(Loukas & Vasiliades, 2004 and Mechler et al., 2014). A better
understanding of potential future drought evolution could facilitate the
implementation of effective adaptation, preparedness and disaster risk
reduction measures (Rita Man Sze Yu, 2013).
Drought is one of the main natural causes of agricultural, economic, and
environmental damage (Burton et al., 1978; Wilhite & Glantz 1985 and
Wilhite, 1993). Droughts are apparent after a long period without
precipitation, but it is difficult to determine their onset, extent, and end. Thus,
it is very difficult to objectively quantify their characteristics in terms of
intensity, magnitude, duration, and spatial extent. For this reason, much effort
has been devoted to developing techniques for drought analysis and
monitoring. Among these, objective indices are the most widely used, but
subjectivity in the definition of drought has made it very difficult to establish
a unique and universal drought index (Mastrandrea, 2014).
It can be summarized, the most prominent of the above, drought is one of
the main natural causes of agricultural, economic, and environmental damage,
and it is a slow-onset natural disaster, an insidious and creeping phenomenon
which occurs in virtually all climatic regimes. It is also related to the timing
and the effectiveness of the rains, thus, each drought year is unique in its
climatic characteristics and impacts. And also Drought is a major nature hazard
affecting large areas and millions of people every year (Burton et al., 1978;
Wilhite & Glantz 1985 and Wilhite, 1993). Droughts are apparent after a long
period without precipitation, but it is difficult to determine their onset, extent,
and end. Drought is a significant deficiency of precipitation from “normal”
over an extended period of time, resulting in a water shortage for some activity,
group, or environmental sector. Asia and Africa rank first among continents in
the number of people directly affected (EM-DAT, 2008).
For this reason, numbers of indices were developed during the twentieth
century for drought quantification, monitoring, and analysis (Du Pisani et al.,
1998; Heim, 2002; Keyantash and Dracup, 2002; Joan Ramon, 2013 and
Vicente-Serrano et al., 2009, 2010a, 2015). In recent years, there have been
Bul. Soc. Géog. d’Égypte Tome LXXXIX
-94-
many attempts to develop new drought indices, or to improve existing ones
(Gonza´lez and Valde´s, 2006; Keyantash and Dracup, 2004; Wells et al.,
2004; Tsakiris et al., 2007 and Vicente-Serrano et al., 2015). Most studies
related to drought analysis and monitoring systems have been conducted
using either 1) the Palmer drought severity index (PDSI; Palmer, 1965),
based on a soil water balance equation, or 2) the standardized precipitation
index (SPI; McKee et al., 1993) which based on a precipitation probabilistic
approach.
Some studies of drought variability used a few observatories to detect
drought conditions across wide regions, highlighting the longevity and the
quality of the time-series prior to the density of the network. For example,
Szinell et al., (1999) analyzed drought trends in Hungary using 15 long-term
stations spread over the country; Briffa et al. (2009) detected dry and wet
summers in Europe using 22 long-term series to explain the evidence of
increasing drought; Laux et al. (2009) used 29 observatories to demonstrate
the precipitation variability in the Volta Basin (West Africa); and Potop
(2011) assessed drought variability in the Czech Republic using 15
meteorological stations. Moreover, it is crucial to have time-series as long as
possible since this study is focused on drought evolution across time.
In this study, the quantification of drought severity is typically carried
out using drought indices, which are proxies based on climatic data; these
indices are assumed to adequately quantify the degree of drought hazard for
sensitive systems. The development of drought indices has recently been
reviewed, and their advantages and drawbacks compared (Heim, 2002;
Keyantash & Dracup, 2002; Sivakumar et al., 2010 and Vicente-Serrano et
al., 2011, 2012b, 2014). So, the study used drought indices Self-Calibrated of
Palmer‟s Drought Severity Index (Sc-PDSI) which improves the “original”
PDSI, Standardized Precipitation Evapotranspiration Index (SPEI) which is
based on the difference between the precipitation and the reference
evapotranspiration, and Standardized Precipitation Index (SPI) which is
based on precipitation data over Egypt 1940-2014.
Recently, (Drobyshev et al., 2012 and Vicente-Serrano et al., 2011,
2012b, 2014) analyzed the correlation between different drought indices and
fire frequency in Sweden. The results of these studies are diverse, since the
best drought index for detecting impact changes as a function of the analyzed
system and the performance of the drought indices varied spatially. As a
result, at present there is high uncertainty among scientists, managers, and
end users of drought information when they aim to select one drought index
for a specific purpose (Dongdong Wang et al., 2012).

Monitoring Drought Trends Induced Climate Variability over Egypt Hossam Ismael
-95-
Various indices have been developed to depict the drought in different
applications (Dracup et al., 1980 and Wilhite & Glantz, 1985). Among these
indices, the standardized precipitation index (SPI; McKee et al., 1993) is the
most popular one. SPI has the advantages of flexible time scale and simple
calculation procedure. However, SPI also has disadvantages; it only utilizes
precipitation information, without considering other meteorological variables
that play important roles during the development of a drought event (Taylor
et al., 2012 and Teuling et al., 2013). Recently, many attempts have been
made to improve SPI by incorporating other Hydrometeorological variables.
Vicente-Serrano et al. (2010) developed the standardized precipitation
evapotranspiration index (SPEI), defined as the difference between the
cumulative precipitation and the cumulative potential evapotranspiration, and
found that it is sensitive to the temperature.
2. Study Area, Data Set and Methods
2.1. Study Area Egypt lies primarily between latitudes 22° and 32°N, and longitudes 25°
and 37°E, and the country‟s maximum distances are 1,024 km from north to
south, and 1,240 km from east to west. It extends over about ten degrees of
latitude with the southern portion of the country lying south of the Tropic of
Cancer. In consequence most of Egypt comes within Africa's dry desert
region, apart from a narrow strip in the far north which experiences a
Mediterranean climate. Barren desert covers more than 96% of the country.
The only inhabited part of Egypt is a longitudinal oasis corresponding to the
Lower Nile Valley. This locale is where Egypt's inhabitants have
concentrated since the dawn of history (Abdel-Kader, 1978).
Egypt is boarded by the Mediterranean Sea to the north, by Sudan to
the south, by the Red Sea, Palestine to the east, and by Libya to the west
(Figure 1). The total area of Egypt is 1,001,450 km2, with a land area of
995,450 km2 and a coastline of 3,500 km on the Mediterranean and the Red
Sea. The surface level extremes range from 133 m below sea level in the
Western Desert to 2,629 m above sea level in the Sinai Peninsula. Climate
in Egypt is commonly described as arid and semi-arid, characterized by hot,
dry summer, moderate winter and erratic rainfall. According to Koeppen‟s
climate classification, Egypt experiences the „hot desert climate type‟
(BWh) in the southern and central parts and the „hot steppe climate type‟
(BSh) along the coast. Most parts of Egypt are occupied by the Sahara
desert, which represents the most extensive area of severe aridity (Domroes
et al., 2005).

Bul. Soc. Géog. d’Égypte Tome LXXXIX
-96-
Figure 1. Location map and meteorological stations.
Egypt is located in the hyper-arid regions of North Africa and West Asia
astride the Sahara and Arabian Desert with annual rainfall in most parts of less than 50 mm. According to the aridity index P/ETP (P = precipitation and ETP = potential evapotranspiration, calculated by Penman‟s formula), the arid regions are classified to hyper-arid (P/ETP < 0.03) and arid (P/ETP = 0.03 – 0.20). These classes are, in turn, subdivided according to the mean temperature of the coldest month and that of the hottest month of the year. Consideration is also given to the time of the rainy period relative to the temperature regime. On these bases, four climatic provinces in Egypt are distinguished.
Indeed, Egypt faces serious risks from climate change. With 88% of its water coming from the River Nile and 97% of its population living along the Nile Delta, a substantial reduction in the flow of the Nile would pose a serious risk to Egypt. In addition, sea level rise (SLR) threatens settlements and agriculture in the Nile Delta and also in the Red Sea. Egypt has been

Monitoring Drought Trends Induced Climate Variability over Egypt Hossam Ismael
-97-
already hot and dry. Higher temperatures alone threaten to evaporate more water, increase the need for water supplies, create more heat stress, exacerbate already high levels of air pollution, and drive away tourists. As a result of the above, the drought causes major losses in agriculture and it may lead to desertification and degradation of soils.
In this study, we analyze the trends of droughts induced spatio-temporal climate variability over Egypt between 1940 and 2014, using four climate drought indices. The objectives of the study were as follows: (1) to investigate how the variability of drought has changed across time and how this affects the whole Egypt; (2) to assess trends using different drought indices, considering precipitation droughts and also the influence of warming on drought severity; (3) to analysis drought trends and drought spatial distribution in order to describe the impact of climate change on droughts over Egypt along the 20
th
century; and (4) to perform an analysis of Spatio-temporal drought analysis based on the combination of duration, severity, area, and inter arrival time using Terra-MODIS/NDVI.
2.2. Data Set We used data series of monthly precipitation (P), and maximum (Tmax) and
minimum (Tmin) temperature from 12 meteorological stations, recorded by the Egyptian meteorological authority. The series comprised records of differing temporal length, and included data gaps less than 10% data. The series were subjected to quality control and homogenization. The quality control procedure was based on comparison of the rank of each data record with the average rank of the data recorded at adjacent stations (Vicente-Serrano et al., 2010a, 2012b) using ACMANT software available at (http://www.c3.urv.cat/data.html).
The current research used Sc-PDSI, the SPI and the SPEI. Temperature and rainfall data from time-series regularly in monthly scale spread Egypt is quality controlled. Rainfall data are only required to compute SPI, but potential evapotranspiration (PET) is also needed to perform the Sc-PDSI and SPEI, which is estimated using the Thornthwaite‟s method. An interpolation Analysis in Arcgis10.2 is carried out to identify spatial-temporal patterns of drought, the characteristics and trends of severity.
Climatic data were available over the 70 year main period from 1940 until 2014 for the twelve stations: Alexandria, Matrouh, Damietta, Port Said, El-Arish, Cairo, Helwan, Assiut, Luxor, Aswan, Kharga and Siwa (Table 1). The stations under study are scattered across the whole of Egypt, though some parts have a sparse network (Figure 1). The climatic data under study were acquired from the Egyptian Meteorological Authority (www. http://ema.gov.eg) (last visited, 12/08/2015).

Bul. Soc. Géog. d’Égypte Tome LXXXIX
-98-

Monitoring Drought Trends Induced Climate Variability over Egypt Hossam Ismael
-99-
2.3. Satellite Data MODIS/Terra Vegetation Indices (NDVI)
A complete 16 year, about 4000 available images of daily surface
reflectance Moderate Resolution Imaging Spectroradiometer MODIS/Terra data,
were used in this study to cover the study area in Egypt. These images were
downloaded from National Aeronautics and Space Administration‟s (NASA)
Earth Observing System (EOS), and the website of the Land Processes
Distributed Active Archive Center (LP DAAC) using the Warehouse Inventory
Search Tool (WIST). Historical surface reflectance and Normalized Difference
Vegetation Index (NDVI) products over Egypt are composed in 16-day intervals
on the MOD13Q1/250m_16_days_NDVI mapping grid in Geostationary Earth
Orbit Tagged Image File Format (GeoTIFF) from February 18, 2000 to April 22,
2016 (http://daac.ornl.gov/modiswebservice )(1)
.
2.4. Drought Indices Drought indices are important elements of drought monitoring and
assessment, since they simplify complex interrelationships between many
climates and climate-related parameters. Indices make it easier to
communicate information about climate anomalies to diverse user audiences
and allow scientists to assess quantitatively climate anomalies in terms of
their intensity, duration, frequency and spatial extent (Wilhite, et al., 2000).
The Palmer Drought Severity Index (PDSI)
The (PDSI) is the most prominent index of meteorological drought used in
the United States (Heim, 2002). The PDSI was created by Palmer (1965) with
the intent to measure the cumulative departure (relative to local mean
conditions) in atmospheric moisture supply and demand at the surface. It
incorporates antecedent precipitation, moisture supply, and moisture demand
[based on the classic work of Thornthwaite (1948)] into a hydrological
accounting system. PDSI values are distributed in 9 categories using a
comprehensive classification depending of the severity of dry or wet conditions
(Table 2). The PDSI is calculated based on precipitation and temperature data,
as well as the local Available Water Content (AWC) of the soil.
ـــــــــــــــــــــــــــــــــــــــــــــــــــ(1) The spatial resolution is 250 250 square meters. For this study, two products were
downloaded and analyzed: MCD12Q1 Land Cover Type (Collection 5) and
MOD13Q1 Vegetation Indices. MODIS products are provided in HDF-EOS format
(Hierarchical Data Format for NASA's Earth Observing System). The standard
projection system is a sinusoidal grid projection; MODIS tiles measure 4800 by 4800
pixels, which correspond to about 1200 by 1200 km. NDVI has been used to detect
drought in various parts of the world in the recent decades. Normalized difference
vegetation index (NDVI), taking the ratio between the difference between the Near-
Infrared Radiation (NIR) and Visible Red Radiation and their sum.

Bul. Soc. Géog. d’Égypte Tome LXXXIX
-100-
Table 2. Classification of PDSI categories defined by Palmer (1965).
Categories PDSI value
Extremely wet ≥ +4
Severely wet ≥ + 3 to < +4
Moderately wet ≥ +2 to < +3
Slightly wet ≥ +1 to < +2
Near normal > -1 to < +1
Slightly dry > -2 to ≤ -1
Moderately dry > -3 to ≤ -2
Severely dry > -4 to ≤ -3
Extremely dry ≤ -4
PDSI has been criticized for a variety of reasons of which most significant,
perhaps that is not comparable between diverse climatological regions (Alley,
1984 and Karl, 1986). This problem has been solved by Wells et al. (2004)
creating Self-Calibrated PDSI (Sc-PDSI) which improves the “original” PDSI. A
detailed description of the modifications to this algorithm to obtain the Sc-PDSI
is given by Wells et al., 2004 and van der Schrier et al. (2006a).
The Standardized Precipitation Index
The SPI is based on the conversion of the precipitation data to
probabilities, based on long-term precipitation records computed at various
time scales. The index has the advantages of being easily calculated, having
modest data requirements (only precipitation), and being independent of the
magnitude of mean rainfall and hence comparable over a range of climatic
zones. It does, however, assume the data are normally distributed, and this
can introduce complications for short time periods (Agnew, 2000). The SPI
has been accepted by the World Meteorological Organization (WMO) as the
reference drought index and it should be used by national meteorological and
hydrological services worldwide to characterize meteorological droughts
(Hayes et al., 2011). The SPI has been extensively used for drought analysis
in many studies (e.g., Hayes et al., 1999; Lana et al., 2001; Vicente-Serrano
et al. 2004, 2006, 2008, 2014 and 2011; Mavromatis, 2007; Kingtse et al.
2008, 2009; Dubrovsky et al. 2007b, 2008; Wu et al. 2009; Subash et al.
2014), and has become an important component in many drought monitoring
efforts (i.e., the U.S. Drought Monitor (NCDC and NDMC), North American
Drought Monitor (NOAA) and European Drought Observatory (EDC).
To calculate the SPI, a long-term precipitation record at the desired station
is first fitted to a probability distribution (e.g. Gamma distribution), which is then
Monitoring Drought Trends Induced Climate Variability over Egypt Hossam Ismael
-101-
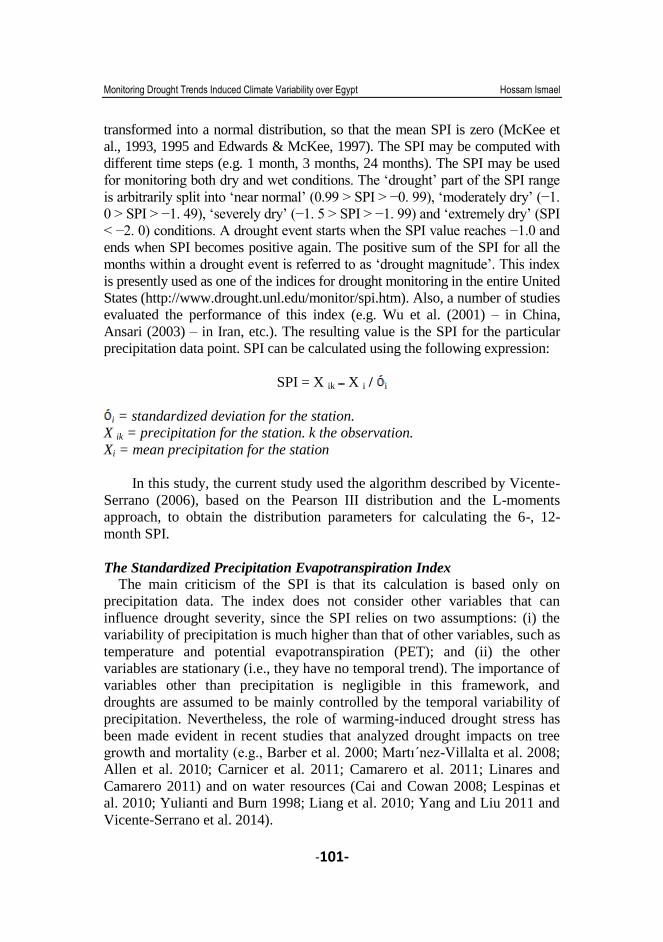
transformed into a normal distribution, so that the mean SPI is zero (McKee et
al., 1993, 1995 and Edwards & McKee, 1997). The SPI may be computed with
different time steps (e.g. 1 month, 3 months, 24 months). The SPI may be used
for monitoring both dry and wet conditions. The „drought‟ part of the SPI range
is arbitrarily split into „near normal‟ (0.99 > SPI > −0. 99), „moderately dry‟ (−1.
0 > SPI > −1. 49), „severely dry‟ (−1. 5 > SPI > −1. 99) and „extremely dry‟ (SPI
< −2. 0) conditions. A drought event starts when the SPI value reaches −1.0 and
ends when SPI becomes positive again. The positive sum of the SPI for all the
months within a drought event is referred to as „drought magnitude‟. This index
is presently used as one of the indices for drought monitoring in the entire United
States (http://www.drought.unl.edu/monitor/spi.htm). Also, a number of studies
evaluated the performance of this index (e.g. Wu et al. (2001) – in China,
Ansari (2003) – in Iran, etc.). The resulting value is the SPI for the particular
precipitation data point. SPI can be calculated using the following expression:
SPI = X ik ــ X i / i
i = standardized deviation for the station.
X ik = precipitation for the station. k the observation.
Xi = mean precipitation for the station
In this study, the current study used the algorithm described by Vicente-
Serrano (2006), based on the Pearson III distribution and the L-moments
approach, to obtain the distribution parameters for calculating the 6-, 12-
month SPI.
The Standardized Precipitation Evapotranspiration Index
The main criticism of the SPI is that its calculation is based only on
precipitation data. The index does not consider other variables that can
influence drought severity, since the SPI relies on two assumptions: (i) the
variability of precipitation is much higher than that of other variables, such as
temperature and potential evapotranspiration (PET); and (ii) the other
variables are stationary (i.e., they have no temporal trend). The importance of
variables other than precipitation is negligible in this framework, and
droughts are assumed to be mainly controlled by the temporal variability of
precipitation. Nevertheless, the role of warming-induced drought stress has
been made evident in recent studies that analyzed drought impacts on tree
growth and mortality (e.g., Barber et al. 2000; Martı´nez-Villalta et al. 2008;
Allen et al. 2010; Carnicer et al. 2011; Camarero et al. 2011; Linares and
Camarero 2011) and on water resources (Cai and Cowan 2008; Lespinas et
al. 2010; Yulianti and Burn 1998; Liang et al. 2010; Yang and Liu 2011 and
Vicente-Serrano et al. 2014).
Bul. Soc. Géog. d’Égypte Tome LXXXIX
-102-
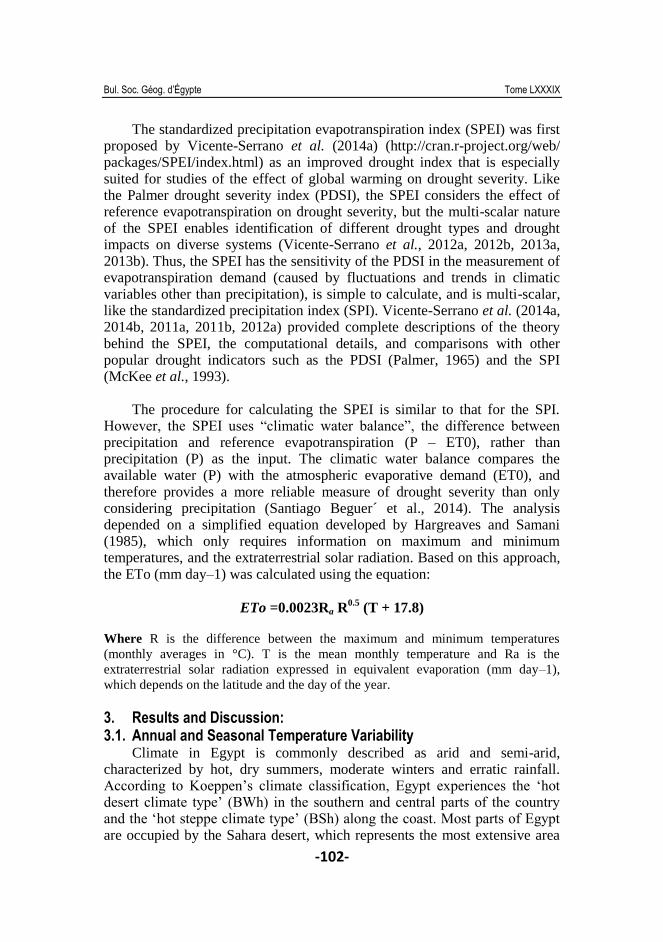
The standardized precipitation evapotranspiration index (SPEI) was first proposed by Vicente-Serrano et al. (2014a) (http://cran.r-project.org/web/ packages/SPEI/index.html) as an improved drought index that is especially suited for studies of the effect of global warming on drought severity. Like the Palmer drought severity index (PDSI), the SPEI considers the effect of reference evapotranspiration on drought severity, but the multi-scalar nature of the SPEI enables identification of different drought types and drought impacts on diverse systems (Vicente-Serrano et al., 2012a, 2012b, 2013a, 2013b). Thus, the SPEI has the sensitivity of the PDSI in the measurement of evapotranspiration demand (caused by fluctuations and trends in climatic variables other than precipitation), is simple to calculate, and is multi-scalar, like the standardized precipitation index (SPI). Vicente-Serrano et al. (2014a, 2014b, 2011a, 2011b, 2012a) provided complete descriptions of the theory behind the SPEI, the computational details, and comparisons with other popular drought indicators such as the PDSI (Palmer, 1965) and the SPI (McKee et al., 1993).
The procedure for calculating the SPEI is similar to that for the SPI. However, the SPEI uses “climatic water balance”, the difference between precipitation and reference evapotranspiration (P – ET0), rather than precipitation (P) as the input. The climatic water balance compares the available water (P) with the atmospheric evaporative demand (ET0), and therefore provides a more reliable measure of drought severity than only considering precipitation (Santiago Beguer´ et al., 2014). The analysis depended on a simplified equation developed by Hargreaves and Samani (1985), which only requires information on maximum and minimum temperatures, and the extraterrestrial solar radiation. Based on this approach, the ETo (mm day–1) was calculated using the equation:
ETo =0.0023Ra R0.5
(T + 17.8)
Where R is the difference between the maximum and minimum temperatures
(monthly averages in °C). T is the mean monthly temperature and Ra is the
extraterrestrial solar radiation expressed in equivalent evaporation (mm day–1),
which depends on the latitude and the day of the year.
3. Results and Discussion: 3.1. Annual and Seasonal Temperature Variability
Climate in Egypt is commonly described as arid and semi-arid, characterized by hot, dry summers, moderate winters and erratic rainfall. According to Koeppen‟s climate classification, Egypt experiences the „hot desert climate type‟ (BWh) in the southern and central parts of the country and the „hot steppe climate type‟ (BSh) along the coast. Most parts of Egypt are occupied by the Sahara desert, which represents the most extensive area
Monitoring Drought Trends Induced Climate Variability over Egypt Hossam Ismael
-103-
of severe aridity on the globe (Manfred Domroes, et al, 2005). Temperature data of Egypt consist of gridded data for the period 1940-2014. The data were taken from Egyptian meteorological authority, unpublished data. The correlation coefficient was used to test the strength of the temperature relationships with time. Linear trend was used to understand the temperature trends from 1940 to 2014.
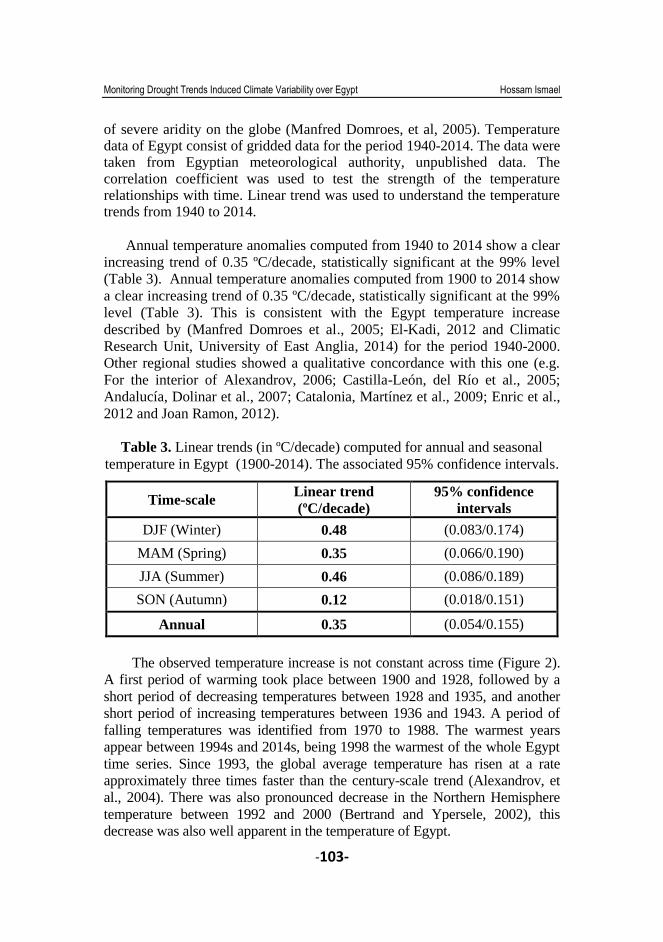
Annual temperature anomalies computed from 1940 to 2014 show a clear
increasing trend of 0.35 ºC/decade, statistically significant at the 99% level
(Table 3). Annual temperature anomalies computed from 1900 to 2014 show
a clear increasing trend of 0.35 ºC/decade, statistically significant at the 99%
level (Table 3). This is consistent with the Egypt temperature increase
described by (Manfred Domroes et al., 2005; El-Kadi, 2012 and Climatic
Research Unit, University of East Anglia, 2014) for the period 1940-2000.
Other regional studies showed a qualitative concordance with this one (e.g.
For the interior of Alexandrov, 2006; Castilla-León, del Río et al., 2005;
Andalucía, Dolinar et al., 2007; Catalonia, Martínez et al., 2009; Enric et al.,
2012 and Joan Ramon, 2012).
Table 3. Linear trends (in ºC/decade) computed for annual and seasonal
temperature in Egypt (1900-2014). The associated 95% confidence intervals.
Time-scale Linear trend
(ºC/decade)
95% confidence
intervals
DJF (Winter) 0.48 (0.083/0.174)
MAM (Spring) 0.35 (0.066/0.190)
JJA (Summer) 0.46 (0.086/0.189)
SON (Autumn) 0.12 (0.018/0.151)
Annual 0.35 (0.054/0.155)
The observed temperature increase is not constant across time (Figure 2).
A first period of warming took place between 1900 and 1928, followed by a
short period of decreasing temperatures between 1928 and 1935, and another
short period of increasing temperatures between 1936 and 1943. A period of
falling temperatures was identified from 1970 to 1988. The warmest years
appear between 1994s and 2014s, being 1998 the warmest of the whole Egypt
time series. Since 1993, the global average temperature has risen at a rate
approximately three times faster than the century-scale trend (Alexandrov, et
al., 2004). There was also pronounced decrease in the Northern Hemisphere
temperature between 1992 and 2000 (Bertrand and Ypersele, 2002), this
decrease was also well apparent in the temperature of Egypt.
Bul. Soc. Géog. d’Égypte Tome LXXXIX
-104-
Moreover, seasonal temperature anomalies also show a clear increase of
0.480 ºC/decade for winter (DJF); 0.350 ºC/decade for spring (MAM); 0.462
ºC/decade for summer (JJA); and 0.122 ºC/decade for autumn (SON), all
statistically significant at the 99% level (Table 3). Summer and spring are the
seasons with the highest rates of change while winter and autumn show lower
trends. But, as described for the annual temperature anomalies, the increase is
not also constant across time in seasonal temperatures.
Figure (3) represents the seasonal temperature variability over Egypt
from 1900 to 2014 using the main period 1940-2000. The trends show a
build-up of continuous warming from the beginning of the 1900 to around
mid 1950s, followed by a decreasing downward trend to the early 1965s,
followed by a stabilization of temperatures between 1965s and 1984.
Therefore the upward and downward cyclic patterns concealed the long-term
trends and the resulted correlation and the linear trends were insignificant in
the whole period. This finding confirmed the result of (Hasanean, 2004), who
concluded that the trends in wintertime temperature of Egypt are not
significant at all stations. He found upward warming trends during the 1910s-
1940s, mid 1970s and from 1980s onwards, and a downward trend occurred
during 1950-1960s, showing similar patterns.
Unexpectedly, the variability of spring temperatures is lower than in
winter because the first warming period took place between 1939 and 1960,
followed by a stabilization of temperatures until 1965. A clear decrease in
temperatures was identified from 1962 to 1983, being the last one the coldest
spring of the time-series. Finally, a clear warming period was recorded from
1988 to 1999, being the last one the warmest spring over Egypt. The last
years of the time-series were dominated by a slight decrease of temperatures
in spring.
Furthermore, the variability of summer temperature shows a short
warming period at the beginning of the time-series, from 1908 to 1920,
followed by a decreasing of temperatures until 1928. As occurred in spring
temperatures, another warming period was identified from 1932 to 1960,
although the second, decreasing period began in 1964 and prolonged until
1990, being the last one the coldest summer in the time-series.
Since then, a clear warming period was detected until 2014, being the
summer of 1998 the warmest summer ever recorded in Egypt with an anomaly
of almost +3.6 ºC. Therefore, Summer of Egypt is climatologically
characterized by strong warming in the last three decades of the last century. A
similar strong tendency of warming was found in Greece, Palestine and Iberian
Peninsula (Feidas, et al., 2004; El-Kadi, 2008 and Joen Romon, 2013).

Monitoring Drought Trends Induced Climate Variability over Egypt Hossam Ismael
-105-
Figure 2. Annual temperature anomalies (base-period 1940-2000)
Egypt for the period 1900-2014.
Figure 3. Seasonal temperature anomalies ordered as winter (DJF, upper panel),
spring (MAM), summer (JJA) and autumn (SON, lower panel) (main period
1940-2000) in the Egypt for the period 1900-2014.
Bul. Soc. Géog. d’Égypte Tome LXXXIX
-106-
Finally, the variability of autumn temperatures shows a first period of
warming between 1932 and 1960 followed by a decreasing of temperatures
until 1996 (the coldest autumn of the time-series). The last warming period
began in 1998 and prolonged until 2014 in spite of this warmer period was
not constant across time.
3.2. Annual and Seasonal Rainfall Variability Generally, three rainfall belts may be distinguished: (1) The
Mediterranean coastal belt, (2) middle Egypt with latitude 30° N as its
southern boundary, and (3) upper Egypt. The first and second belts have a
winter rainfall (Mediterranean regime); the rainy season extends from
November to April, though mainly concentrated in December and January.
These belts correspond roughly to the attenuated (shorter dry period) and
accentuated (longer dry period) arid provinces of northern Egypt, where the
average annual rainfall ranges from 100 to 150 mm in the attenuated arid
province, and from 20 to 100 mm in the accentuated arid province. It extends
rather south along the Gulf of Suez to Lat 26° N due to the orographic
influence of the Red Sea coastal mountains. The third belt is almost rainless;
it corresponds roughly to the hyper arid provinces. Rain in this belt is not an
annually recurring incident; 10 mm may occur once every ten years.
The rainfall increases gradually to the North until it reaches about 20
mm at the borders with the arid province (at Giza). One of the major features
of rainfall in arid and semi-arid regions [N.B. hyperarid (P/ETP< 0.03) and
arid (P/ETP = 0.03 – 0.20) where P = precipitation and ETP = potential
evapotranspiration, calculated by Penman‟s formula] other than being scanty,
is its great temporal variability, average deviation of annual precipitation
from the mean, expressed as percentage of the mean, is greatest in the hyper
arid provinces (e. g. El Dakhla 83%). In the arid province the percentage
variability is 65% in Giza, which is close to the hyperarid provinces (FAO
2011).
Rainfall over Egypt is mainly of the showery type. Amounts may vary
considerably from year to year, in the same place and may also differ widely
in two neighboring localities in the same season or year. The rainy season,
lasting from October to May, tends to start earlier in the north and west, since
secondary Mediterranean air masses are most active in autumn, winter and
spring, and generally follow west to east tracks. The dry season is almost
totally rainless (Figure 4). Though occasional showers may fall over the
Mediterranean coastal region in June or September, it is extremely rare for
Rainfall to occur during July and August.
Monitoring Drought Trends Induced Climate Variability over Egypt Hossam Ismael
-107-
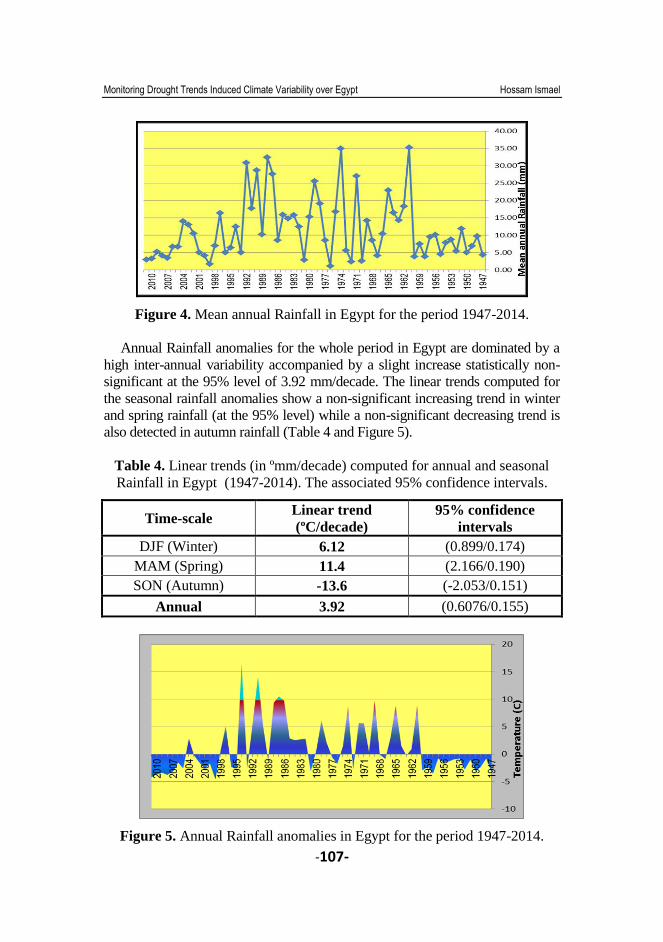
Figure 4. Mean annual Rainfall in Egypt for the period 1947-2014.
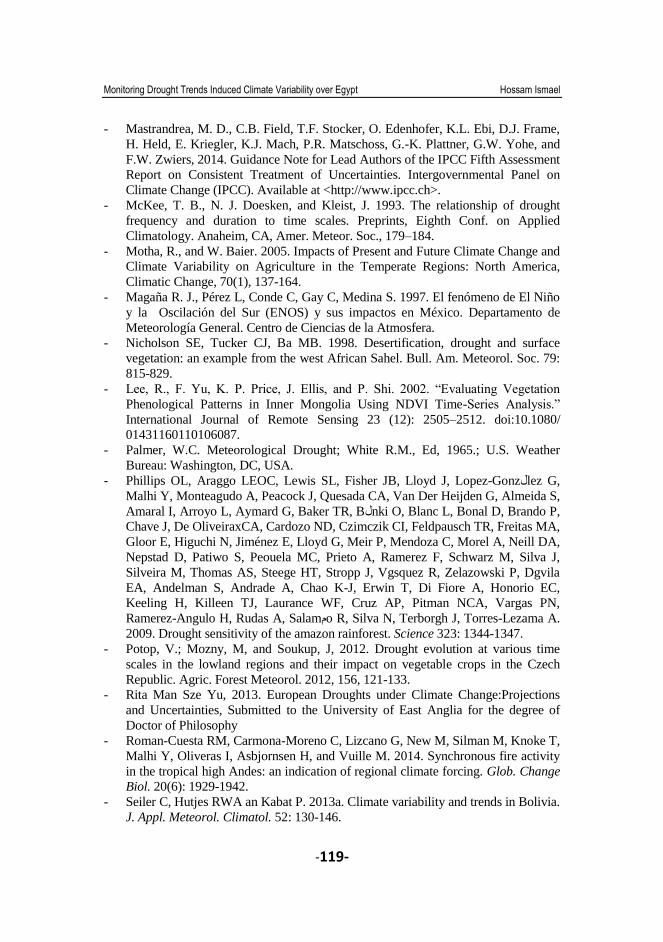
Annual Rainfall anomalies for the whole period in Egypt are dominated by a
high inter-annual variability accompanied by a slight increase statistically non-
significant at the 95% level of 3.92 mm/decade. The linear trends computed for
the seasonal rainfall anomalies show a non-significant increasing trend in winter
and spring rainfall (at the 95% level) while a non-significant decreasing trend is
also detected in autumn rainfall (Table 4 and Figure 5).
Table 4. Linear trends (in ºmm/decade) computed for annual and seasonal
Rainfall in Egypt (1947-2014). The associated 95% confidence intervals.
Time-scale Linear trend
(ºC/decade)
95% confidence
intervals
DJF (Winter) 6.12 (0.899/0.174)
MAM (Spring) 11.4 (2.166/0.190)
SON (Autumn) -13.6 (-2.053/0.151)
Annual 3.92 (0.6076/0.155)
Figure 5. Annual Rainfall anomalies in Egypt for the period 1947-2014.

Bul. Soc. Géog. d’Égypte Tome LXXXIX
-108-
This is consistent with Trenberth et al. (2007), who did not detect a generalized and a significant decrease of precipitation in the Mediterranean basin North and South. Other studies which dealt the evolution of the Rainfall during the 20
th century or before concluded annual Rainfall does not
show appreciable changes in secular time scale (Lana & Burgueño, 2000; Llasat & Quintas, 2004; Saladié, 2004; Barrera-Escoda, 2008; Clivar, 2014; Joan Ramon, 2013 and Rita Man, 2013).
As occurred in annual Rainfall, seasonal anomalies show a very high variability among years in all seasons except spring during all time-series long (Figure 6). The variability of the winter rainfall is based on the dominance of dry winters from 1947 to 1960, followed by a wetter period from 1960-1965, followed by a balanced combination of dry and wet winters between 1966 and 1982. Wetter conditions dominated in 1974s and 1978s, and from 1982-1992, while dry winters came back in 1980s, and from 1998-2014.
Figure 6. Seasonal precipitation anomalies ordered as winter (DJF, upper pannel),
spring (MAM) and autumn (SON, lower pannel) in Egypt for the period 1947-2014.

Monitoring Drought Trends Induced Climate Variability over Egypt Hossam Ismael
-109-
The variability of spring rainfall shows a balanced distribution of wet
and dry springs during most of the time-series, it could be divided into three
main periods, two periods of dry from 1947-1965 and from 2000-2014,
separated by a wetted spring from 1983-1997. Moreover, although the
dominance of wet springs was between mid-1965s and early-1974s while dry
springs were focused from early-1947s to late-1964s, and from the period
2000-2014.
Finally, the variability of autumn rainfall is based on the dominance of
dry conditions in all time-series under investigation 1947-2014, separated by
scattered wet periods in mid-1965 to 1972, early-1996 to 1999, in 2004s,
while the last two decades of the time-series were dominated by dry
conditions (Figure 6).
3.3. Drought Trends The current research was used the C3 software, Quality control and
homogenization and climate data from The Centre for Climate Change (C3),
University Rovira Virgili (Tarragona, Spain) http://www.c3.urv.cat/ last visit
20/05/2016. We analysed the spatial variability of the Pc-PDSI, SPI and SPEI
over Egypt using principal component analysis (PCA). We obtained a
classification of homogeneous areas according to the general temporal and
spatial patterns of monthly rainfall and temperature along the 1961-2014
periods.
The most relevant droughts are identified and validated using
documental sources. To ensure the quality of our results, the calibration of
drought indices is checked. Afterwards, a trend analysis is carried out for the
whole region under study as well as for each location individually in order to
find out significant fluctuations in drought conditions. Furthermore, the role
of temperature in drought indices is also assessed to quantify the effect of
global warming on drought trends. Finally, we study the evolution of the
drought spatial coverage across time.
Trends in the seasonal (DJF, MAM, JJA and SON) 6 and 12-month
December (which is a summary of annual drought severity) SC-PDSI, SPI
and SPEI series for particular stations, and trends in the series representative
of different regions obtained through the PCA, were calculated using the
Mann–Kendall τ rank correlation coefficient (Kendall, 1955).
Figure (7) shows the evolution of the 6 and 12 months Sc-PDSI, SPI and
SPEI derived from the regional series of rainfall, temperature and climatic

Bul. Soc. Géog. d’Égypte Tome LXXXIX
-110-
water balance (P-ETo) for Egypt. Short time scales showed higher temporal
frequency than long time scales. Nevertheless, independent of the drought
time scale, the various time series showed a similar temporal behavior. The
main drought episodes occurred in the 1998s, and from 2008 to 2010. In
contrast, the period from 1966 to 1975 was dominated by humid conditions,
evident in both the SPI and the SPEI.
Drought variability according to Sc-PDSI 6-Month (Figure 7) shows wet
conditions from the period 2000-2015. Moreover, dry conditions are found in
early-1971s, most of the 1975s and 1981s, mid-1985s, early-mid-1987, late-
1998, most of the last two decades of the time-series in which the driest
conditions were identified over Egypt from the period 1998 to 2014. Note
that extremely dry conditions (less or equal than -3 in PDSI categories) are
identified only in 1982 for the whole Egypt (regional average) while
extremely wet conditions (greater or equal than +3 in PDSI categories) are
not found in the time-series.
Figure 7. Evolution of the Sc-PDSI, SPI and SPEI
at 6 and 12 Month time scale from 1961 to 2014.
Evidently, Drought variability according to 12-month Sc-PDSI shows
higher frequency of wet and dry condition, the wet condition for the period
1988-1998. Moreover, dry conditions are detected in late-1961 to the early-
1965, all the period from 1973 to1980, all the period from 1998 to 2003, and
mutual condition from dry and wet from the period 2004-2015.

Monitoring Drought Trends Induced Climate Variability over Egypt Hossam Ismael
-111-
Drought variability according to 6-month SPI (Figure 7) shows higher
frequency of wet and dry conditions than Sc-PDSI time-series, but wet
conditions are detected in late-1968s, early and late-1981s, early and late-
1987. Furthermore, dry conditions are found in mid-1961s to the mid of
1986s, the periods from 1979 to 1983 and 1999-2007 respectively. Drought
variability according to 12-month SPI shows higher frequency of the wet and
dry condition, the wet conditions are found in early-1962s, the period from
1973 to 1979, late-1994s, mid-1999s to end-2004, late-2009s and early-2014.
On the other hand, the dry conditions are detected in mid-1966s, the period
from 1968 to 1972, the period from 1981 to early-1984s, mid-1987s, the
period from 1989 to 1998, and late-2013s.
Drought variability according to 6-month SPEI (Figure 7) shows wet
conditions in late-1960s, the period from 1970 to the mid-1979s, early-1997s
to the late-2003s, early-2006s to 2009, and late-2012s. Dry conditions are
found in most of the 1964s and 1966s, late-1967 to late-1970s, mid-1978s,
late-1995s, the period from 1988 to 1997, the period from 2004 to the late-
2006s, and mid-2011. Extremely dry conditions (less or equal than -2 in SPEI
categories) are identified in 1968 and in 1978 respectively, while extremely
wet conditions (greater or equal than +2 in SPEI categories) are not found in
1997. On the other hand, Drought variability according to 12-month SPEI
(Figure.) shows higher frequency of the wet and dry condition, the wet
conditions from 1961 to 1964, 1973-1976 and 1985-1988. The dry conditions
are from 1967-1970, 1979-1982, 1988-1994, and 2000-2005.
3.4. Terra-MODIS/NDVI Analysis Seasonal mean of NDVI and rainfall were used to quantify the change of
NDVI and rainfall in comparison to the long-term seasonal mean of 2000-
2016. Figures (8), (9) and (10) show the results from NDVI (2000-2016).
Depending on the degree of change, a suggestion for classification of drought
impact is found in (Table 5). In the following paragraphs, more descriptions
about the percentage of change for each location are given:
Table 5. Degree of drought depends on the percent of change for NDVI only.
Value Degree of Drought
> = 0% No drought
-1% to -10% Mild
-11% to -20% Moderate
-20% to -30% Severe
< -30% Extreme

Bul. Soc. Géog. d’Égypte Tome LXXXIX
-112-
Figure 8. NDVI scale factor, filter, and land cover mask
applied over Egypt from the period 2000-2016
Egyptian Delta region:
Climatically, it belongs to the Mediterranean region, includes the East,
North and West delta, located in a semi-dry zone in the north of Egypt, where
rainfall patterns showed that the two seasons were not clearly separated or
there were only one long season in some years. Changes in rainfall showed
that this region receives a different amount of rainfall every season. Egyptian
Delta experienced drought in some seasons like in 2002, 2010 and 2012,

Monitoring Drought Trends Induced Climate Variability over Egypt Hossam Ismael
-113-
when rainfall decrease to 25% less than normal, while in years 2004, 2013
and 2016, the region received a significant amount of rainfall. NDVI did not
show any a severe or an extreme drought, but there was moderate drought in
2008. In 2016 greenness increased by 45% when the there was a significant
amount of rainfall up to 70% more than the average in the first season.
El Dakhla Oasis: located in the Southwest in the hyper dry zone and it
received the lowest amount of rainfall among all the locations. Results from
NDVI changes indicated a severe drought in seasons of 2000, 2002, 2004,
2005, 2008 and 2016 with negative change 42%, 30%, 25%, 41%, 45% and
35%, respectively. Changes in rainfall proved NDVI results in 2008 with
negative change 52%. In 2016, there was a negative change in rainfall with -
55% and NDVI showed change with 50%.
Figure 9. Mean grouped by Year and Month of NDVI
over Egypt from the period 2000-2016
Sinai region: located in North West of Egypt, it belongs to the
Mediterranean region, with semi-arid climate. NDVI results indicated that
there was an extreme drought in the Years of 200, 2008, 2010 and 2016, and
a severe drought in the Year of 2012 with 30%, 25%, 25% and 19% below
the average, respectively. Rainfall results proved the result of NDVI in 2008
and 2010 with negative change of 15% and 35%, respectively.

Bul. Soc. Géog. d’Égypte Tome LXXXIX
-114-
El Fayoum Governorate: located in the semi-arid zone in southwest of
Cairo. Rainfall appeared to be less changeable than NDVI except in the last
five seasons. NDVI indicated an extreme drought in the second seasons of
2008 and 2010 with negative change 30% and 40%, respectively. Rainfall
indicated drought in the second seasons of 2010 and the first season of 2012
with negative change 25% and 33%, respectively.
Assiut and Aswan Governorate: located in the semi-arid zone in the
south of Egypt and it received the lowest amount of rainfall. Rainfall
fluctuated from year to year, but this did reflect in NDVI pattern which might
be due to the type of vegetation, which tends to be moderate. Results of
NDVI indicated an extreme drought in the season of 2008 and severe drought
in the first season of 2010. The highest record of negative change in rainfall
was in the second season of 2002 and the first season of 2016 with -35% to
42%, respectively.
Figure 10. NDVI Frequency of subset area mean values
over Egypt from the period 2000-2016.

Monitoring Drought Trends Induced Climate Variability over Egypt Hossam Ismael
-115-
4. Conclusions In this study, we investigate the climate variability across Egypt is described
in terms of temperature and rainfall at annual and seasonal time-scale. Then, we discuss the drought variability, which is approached by the application of the most widely used drought indices (Sc-PDSI, SPEI and the SPI) over Egypt (1940 to 2014). A trend analysis is carried out on drought time-series in order to understand the behavior of drought conditions using Terra-MODIS NDVI to evaluate the Utilizing MODIS NDVI satellite data, GIS and Drought Indices for effective near real-time drought monitoring over Egypt.
Rainfall data are only required to compute SPI, but potential
evapotranspiration (PET) is also needed to perform the Sc-PDSI and SPEI, which is estimated using the Thornthwaite‟s method. A Principal Component Analysis is carried out to identify spatial-temporal patterns of droughts and the characteristics and trends of severity, magnitude and duration of droughts and wet events are also described.
A remote sensing data proved to be a significant tool in monitoring and
detecting drought components. In the thesis‟s case where rainfall data and other meteorological data were absent or unreliable, remote sensing data were the only practical choice. A comparison between different drought indices based on remote sensing shows that there are none of the major indices is inherently superior to the rest in all circumstances but some indices have advantages spatially. There is still need for a comprehensive study to evaluate the performance of these drought indices, especially in semiarid and arid zone because of the frequent occurrence of drought.
The superiority of NDVI is that: it is easy to calculate and used;
provided relatively freely to users and cover the entire globe. The areas with low NDVI values doesn‟t necessary mean that drought occurred there: the index‟s value can be also associated with an early harvest or with the lack of vegetation due to various regions.
MODIS NDVI data have many advantages spatially and temporally in
comparison to rainfall data which make it more practical. The spatial resolution of NDVI is 0.05 degrees (~5600 meters) and RE rainfall data is 0.1 degrees, which is higher than any kind of rainfall data available in this case (CRU rainfall data is only 0.5 degrees).
It is common to find that two months without precipitation can produce
drought conditions in the soil moisture suffering meteorological and/or agricultural drought. But, this lack of precipitation probably will not have an immediate effect on the discharge of large river systems, or in the level of water stored in the reservoirs of a region. However, the opposite situation can also occur.

Bul. Soc. Géog. d’Égypte Tome LXXXIX
-116-
LIST OF ABBREVIATIONS
AWC: Available Water Content of the soil
CLIVAR: Climate Variability and Predictability Organization
CRU: Climate Research Unit, University of East Anglia
C3: Centre for Climate Change, Universitat Rovira i Virgili
ENSO: El Niño Southern Oscillation
IPCC: Intergovernmental Panel on Climate Change
ITCZ: I n ter tropical Convergence Zone
LP DAAC: Land Processes Distributed Active Archive Center
MOD12C1: MODIS Land cover
MODIS: Moderate Resolution Imaging Spectroradiometer
NDVI: Normalized difference vegetation index
PET: Potential Evapotranspiration
PDSI: Palmer‟s Drought Severity Index
Sc-PDSI: Self-Calibrating Palmer‟s Drought Severity Index
SPEI: Standardized Precipitation-Evapotranspiration Index
SPI: Standardized Precipitation Index
WMO: World Meteorological Organization

Monitoring Drought Trends Induced Climate Variability over Egypt Hossam Ismael
-117-
REFERENCES
- Allen RG, Pereira LS, Raes D, Smith M. 1998. Crop evapotranspiration –
guidelines for computing crop water requirements. FAO Irrigation and Drainage
Paper 56, FAO, Rome.
- Blenkinsop, S. and H.J. Fowler, 2007a. Changes in drought frequency, severity and
duration for the British Isles projected by the PRUDENCE regional climate
models. Journal of Hydrology, 342, 50-71.
- Brando PM. 2010. Seasonal and interannual variability of climate and vegetation
indices across the Amazon. Proc. Natl. Acad. Sci. U. S. A.107: 14685–14690.
- Brando PM, Balch JK, Nepstad DC, Morton DC, Putz FE, Coe MT, Silvério D,
Macedo MN, Davidson EA, Nobrega CC, Alencar A, Soares-Filho BS. 2014.
Abrupt increases in Amazonian tree mortality due to drought–fire interactions.
Proc. Natl. Acad. Sci. U. S. A. 111: 6347-6352.
- Burke, E. J., Brown S. J. 2008. Evaluating uncertainties in the projection of future
drought.2008. J. Hydrometeorol. 9, 292-299.
- Cao, L., T. Liu, and L. Wei. 2014. “A Comparison of Multi-Resource Remote
Sensing Data for Vegetation Indices.” IOP Conference Series: Earth and
Environmental Science 17: 012067.doi:10.1088/1755-1315/17/1/012067.
- Chapin, F. S., A. J. Bloom, C. B. Field, and R. H. Waring. 1987. “Plant-Responses
to Multiple Environmental-Factors.” Bioscience 37 (1): 49-57.
doi:10.2307/1310177.
- Contreras S. C., 2003. Importancia de las sequías en el clima de México. Pp. 1-7
http://www.uaslp.mx/Docs/CCSYH/Programas/publicaciones/sequia.pdf
- Dai, A, 2011. Characteristics and trends in various forms of the Palmer Drought
Severity Index (PDSI) during 1900_2008. J. Geophys. Res. 116, D12115.
- Dai A. 2013. Increasing drought under global warming in observations and models.
Nat. Clim. Change 3: 52-58.
- Dai A, 2014. Drought under global warming: a review. WIREs Clim Chang 2:45–
65. doi:10.1002/wcc.81
- Ding Y, Hayes MJ, Widhalm M ,2014: Measuring economic impacts of drought: a
review and discussion. Papers in Natural Resources. Paper 196.
http://digitalcommons.unl.edu/natrespapers/196
- Domroes, M., and El-Tantawi, A., 2005: recent temporal and spatial temperature
changes in EGYPT, INTERNATIONAL JOURNAL OF CLIMATOLOGY, Int. J.
Climatol. 25: 51-63.
- Droogers P, Allen RG. 2002. Estimating reference evapotranspiration under
inaccurate data conditions. Irrig. Drain. Syst. 16: 33-45.
- El-Tantawi, A., 2005: Climate Change in Libya and Desertification of Jifara Plain
Using Geographical Information System and Remote Sensing Techniques, Doktor
der Naturwissenschaften, Mainz, Germany.
- Escurra JJ, Vazquez V, Cestti R, De Nys E, Srinivasan R. 2014. Climate change
impact on countrywide water balance in Bolivia. Reg. Environ. Change 14: 727-
742.
- Estrada P. M., 2001. Cambio climático global: causas y consecuencias.
http://www.inigi.gob.mx/inegi/contenidos/espanol/prensa/contenidos/articulos/amb
ientales/climatico.pdf

Bul. Soc. Géog. d’Égypte Tome LXXXIX
-118-
- Garcia M, Raesb D, Jacobsenc S-E, Micheld T. 2007. Agroclimatic constraints for
rain-fed agriculture in the Bolivian Altiplano. J. Arid Environ. 71: 109–121.
- Hasanean HM. 2004. Wintertime surface temperature in Egypt in relation to the
associated atmospheric circulation. International Journal of Climatology 24: 985-
999.
- Heino R. 1994. Climate in Finland During the Period of Meteorological
Observations, Finnish Meteorological Institute Contributions12. Academic
Dissertation: Helsinki, 209.
- Hayes, M., D. A. Wilhite, M. Svoboda, and O. Vanyarkho, 1999: Monitoring the
1996 drought using the standardized precipitation index. Bull. Amer. Meteor. Soc.,
80, 429-438.
- Hayes MJ, 2012. Drought indices, National Drought Mitigation Center
(http://www.drought.unl.edu/whatis/indices.htm). With modifications by Dev
Niyogi and Umarporn Charusambot, Indiana State Climate Office, Purdue
University (http://iclimate.org/ 2.2.2012).
- Heim, R. R., 2002: A review of twentieth-century drought indices used in the
United States. Bull. Amer. Meteor. Soc., 83, 1149–1165.
- Hunt ED, Svoboda M, Wardlow B, Hubbard K, Hayes M, Arkebauer T. 2014.
Monitoring the effects of rapid onset of drought on non-irrigated maize with
agronomic data and climate-based drought indices. Agric. For. Meteorol. 191: 1-
11.
- IPCC climate change 2012. Managing the Risks of Extreme Events and Disasters
to Advance Climate Change Adaptation. A Special Report of Working Groups I
and II of the Intergovernmental Panel on Climate Change [Field, C.B., V. Barros,
T.F. Stocker, D. Qin, D.J. Dokken, K.L. Ebi, M.D. Mastrandrea, K.J. Mach, G.-K.
Plattner, S.K. Allen, M. Tignor, and P.M. Midgley (eds.)]. Cambridge University
Press, Cambridge, UK, and New York, NY, USA, 582.pp.
- Jansen M, Schulze A, Werding L, Streit B. 2009. Effects of extreme drought in the
dry season on an anural community in the Bolivian Chiquitano region. Salamandra
45: 233-238.
- Khan, S., H. F. Gabriel, and Rana, T, 2008: Standard precipitation index to track
drought and assess impact of rainfall on watertables in irrigation areas. Irrig. Drain.
Syst., 22, 159-177.
- Karavitis CA, Alexandris S, Tsesmelis DE, Athanasopoulos G ,2011. Application
of the Standardized Precipitation Index (SPI) in Greece. Walter J 3:787–805.
doi:10.3390/w3030787
- Kenny P, 2008. Assessment of the social impacts of drought and government and
non-government social support services. Issues Paper.
http://www.daff.gov.au/__data/assets/pdf_file/0004/
710644/social_panels_isues_paper.pdf
- Li, Y.J.; Zheng, X.D.; Lu, F. and Ma, J, 2012. Analysis of drought evolvement
characteristics based on Standardized Precipitation Index in the Huaihe River
Basin. Proced. Eng, 28, 434-437.
+ Mendivelso HA, Camarero JJ, Gutiérrez E and Zuidema PA. 2014. Time-
dependent effects of climate and drought on tree growth in a neotropical dry forest:
short-term tolerance vs. long-term sensitivity. Agric. For. Meteorol. 188: 13-23.
Monitoring Drought Trends Induced Climate Variability over Egypt Hossam Ismael
-119-
- Mastrandrea, M. D., C.B. Field, T.F. Stocker, O. Edenhofer, K.L. Ebi, D.J. Frame,
H. Held, E. Kriegler, K.J. Mach, P.R. Matschoss, G.-K. Plattner, G.W. Yohe, and
F.W. Zwiers, 2014. Guidance Note for Lead Authors of the IPCC Fifth Assessment
Report on Consistent Treatment of Uncertainties. Intergovernmental Panel on
Climate Change (IPCC). Available at <http://www.ipcc.ch>.
- McKee, T. B., N. J. Doesken, and Kleist, J. 1993. The relationship of drought
frequency and duration to time scales. Preprints, Eighth Conf. on Applied
Climatology. Anaheim, CA, Amer. Meteor. Soc., 179–184.
- Motha, R., and W. Baier. 2005. Impacts of Present and Future Climate Change and
Climate Variability on Agriculture in the Temperate Regions: North America,
Climatic Change, 70(1), 137-164.
- Magaña R. J., Pérez L, Conde C, Gay C, Medina S. 1997. El fenómeno de El Niño
y la Oscilación del Sur (ENOS) y sus impactos en México. Departamento de
Meteorología General. Centro de Ciencias de la Atmosfera.
- Nicholson SE, Tucker CJ, Ba MB. 1998. Desertification, drought and surface
vegetation: an example from the west African Sahel. Bull. Am. Meteorol. Soc. 79:
815-829.
- Lee, R., F. Yu, K. P. Price, J. Ellis, and P. Shi. 2002. “Evaluating Vegetation
Phenological Patterns in Inner Mongolia Using NDVI Time-Series Analysis.”
International Journal of Remote Sensing 23 (12): 2505–2512. doi:10.1080/
01431160110106087.
- Palmer, W.C. Meteorological Drought; White R.M., Ed, 1965.; U.S. Weather
Bureau: Washington, DC, USA.
- Phillips OL, Araggo LEOC, Lewis SL, Fisher JB, Lloyd J, Lopez-Gonzلlez G,
Malhi Y, Monteagudo A, Peacock J, Quesada CA, Van Der Heijden G, Almeida S,
Amaral I, Arroyo L, Aymard G, Baker TR, Bلnki O, Blanc L, Bonal D, Brando P,
Chave J, De OliveiraxCA, Cardozo ND, Czimczik CI, Feldpausch TR, Freitas MA,
Gloor E, Higuchi N, Jiménez E, Lloyd G, Meir P, Mendoza C, Morel A, Neill DA,
Nepstad D, Patiwo S, Peouela MC, Prieto A, Ramerez F, Schwarz M, Silva J,
Silveira M, Thomas AS, Steege HT, Stropp J, Vgsquez R, Zelazowski P, Dgvila
EA, Andelman S, Andrade A, Chao K-J, Erwin T, Di Fiore A, Honorio EC,
Keeling H, Killeen TJ, Laurance WF, Cruz AP, Pitman NCA, Vargas PN,
Ramerez-Angulo H, Rudas A, Salamمo R, Silva N, Terborgh J, Torres-Lezama A.
2009. Drought sensitivity of the amazon rainforest. Science 323: 1344-1347.
- Potop, V.; Mozny, M, and Soukup, J, 2012. Drought evolution at various time
scales in the lowland regions and their impact on vegetable crops in the Czech
Republic. Agric. Forest Meteorol. 2012, 156, 121-133.
- Rita Man Sze Yu, 2013. European Droughts under Climate Change:Projections
and Uncertainties, Submitted to the University of East Anglia for the degree of
Doctor of Philosophy
- Roman-Cuesta RM, Carmona-Moreno C, Lizcano G, New M, Silman M, Knoke T,
Malhi Y, Oliveras I, Asbjornsen H, and Vuille M. 2014. Synchronous fire activity
in the tropical high Andes: an indication of regional climate forcing. Glob. Change
Biol. 20(6): 1929-1942.
- Seiler C, Hutjes RWA an Kabat P. 2013a. Climate variability and trends in Bolivia.
J. Appl. Meteorol. Climatol. 52: 130-146.
Bul. Soc. Géog. d’Égypte Tome LXXXIX
-120-
- Seiler C, Hutjes RWA and Kabat P. 2013b. Likely ranges of climate change in
Bolivia. J. Appl. Meteorol. Climatol. 52: 1303-1317.
- Seiler C, Hutjes RWA, Kruijt B, Quispe J, Adez S, Arora VK, Melton JR, Hickler
T and Kabat P. 2014. Modeling forest dynamics along climate gradients in
Bolivia. J. Geophys. Res. Biogeosci. 119: 758-775.
- Serrano A, Garcdda AJ, Mateos VL, Cancillo ML, Garrido J. 1999. Monthly
modes of variation of precipitation over the Iberian Peninsula. J. Clim. 12: 2894-
2919.
- Shahid S, Behrawan H, 2008. Drought risk assessment in the western part of
Bangladesh. Nat Hazards J 46:391–413. doi:10.1007/ s11069-007-9191-5.
- Sheffield J., Wood, EF., Roderick ML., 2012. Little change in global drought over
the past 60 years. LETTER DOI: 10.1038/nature11575.
- Spinoni, J.; Naumann, G.; Carrao, H.; Barbosa, P. and Vogt, J, 2014. World
drought frequency, duration, and severity for 1951–2010. Int. J. Climatol. 2014, 34,
2792-2804.
- Szinell Cs., Bussay, A., and Szentimrey, T., 1998, Drought tendencies in Hungary.
Int. J. Climatol. 18, 1479-1491.
- Thornthwaite C. W., 1948. An approach toward a rational classification of climate.
Geographical Review, 38, 55-94.
- Tao J, Zhongfa Z, Shui C, 2011. Drought monitoring and analyzing on typical
karst ecological fragile area based on GIS. Procedia Environ Sci 10:2091–2096.
Published by Elsevier Ltd. Selection. doi:10.1016/j.proenv.2011.09.326. Available
online at www.sciencedirect.com
- UN Secretariat General, 1994. United Nations convention to combat drought and
desertification in countries experiencing serious droughts and/or desertification,
particularly in Africa. Paris
- Thornthwaite, C.W., 1948: An approach toward a rational classification of climate.
Geogr. Rev., 38, 55-94.
- Vicente-Serrano SM. 2006. Differences in spatial patterns of drought on different
time scales: an analysis of the Iberian Peninsula. Water Resour. Manage. 20: 37-60.
- Vicente-Serrano SM, Beguera S, Lopez-Moreno JI, Garcea-Vera MA, Stepanek P.
2010a. A complete daily precipitation database for North-East Spain:
reconstruction, quality control and homogeneity. Int. J. Climatol. 30: 1146–1163.
- Vicente-Serrano SM, Beguerea S, Lopez-Moreno JI. 2010b. A multi-scalar drought
index sensitive to global warming: the Standardized Precipitation
Evapotranspiration Index – SPEI. J. Clim. 23: 1696-1718.
- Vicente-Serrano SM, Beguerea S, Lopez-Moreno JI. 2011. Comment on
“Characteristics and trends in various forms of the Palmer Drought Severity Index
(PDSI) during 1900–2008” by A. Dai. J. Geophys. Res. Atmos. 116: D19112, doi:
10.1029/2011JD016410.
- Vicente-Serrano SM, Zouber A, Lasanta T, Pueyo Y. 2012a. Dryness is
accelerating degradation of vulnerable shrublands in semiarid Mediterranean
environments. Ecol. Monogr. 82: 407-428.
- Vicente-Serrano SM, Beguerea S, Lorenzo-Lacruz J, Camarero JJ, Lopez-Moreno
JI, Azorin-Molina C, Revuelto J, Moron-Tejeda E, Sanchez-Lorenzo A. 2012b.
Performance of drought indices for ecological, agricultural and hydrological
applications. Earth Interact. 16: 1-27.
Monitoring Drought Trends Induced Climate Variability over Egypt Hossam Ismael
-121-
- Vicente-Serrano SM, Lopez-Moreno J-I, Beguerيa S, Lorenzo-Lacruz J, Sanchez-
Lorenzo A, Garcيa-Ruiz JM, Azorin-Molina C, Revuelto J, Trigo R, Coelho F,
Espejo F. 2014. Evidence of increasing drought severity caused by temperature rise
in southern Europe. Environ. Res. Lett. 9: 044001, doi: 10.1088/1748-
9326/9/4/044001.
- Wang, G. L, 2005. Agricultural drought in a future climate: Results from 15 global
climate models participating in the IPCC 4th assessment. Clim. Dynam. 25, 739-
753.
- Wilhite, D., and M. Glantz .1985. Understanding: the Drought Phenomenon: The
Role of Definitions, Water International, 10(3), 111–120.
- Wilhite, D. A., 1993: Drought Assessment, Management, and Planning: Theory
and Case Studies. Natural Resource Management and Policy Series, Vol. 2,
Kluwer, 293 pp.
- World Meteorological Organization, 2012: Standardized Precipitation Index User
Guide (M. Svoboda, M. Hayes and D. Wood). (WMO-No. 1090), Geneva.
- Wu,H.,M.D.Svoboda,M. J.Hayes,D.A.Wilhite, andF.Wen, 2007: Appropriate
application of the Standardized Precipitation Index in arid locations and dry
seasons. Int. J. Climatol., 27, 65-79.
- Xie, N.M.; Xin, J.H.; Liu, S.F, 2014. China‟s regional meteorological disaster loss
analysis and evaluation based on grey cluster model. Nat. Hazards 2014, 71, 1067-
1089.