Embed Size (px)
Citation preview
SYSTEMATIC REVIEW
Monitoring Athletic Training Status Through Autonomic HeartRate Regulation: A Systematic Review and Meta-Analysis
Clint R. Bellenger1 • Joel T. Fuller1 • Rebecca L. Thomson1 • Kade Davison1 •
Eileen Y. Robertson2 • Jonathan D. Buckley1
Published online: 18 February 2016
� Springer International Publishing Switzerland 2016
Abstract
Background Autonomic regulation of heart rate (HR) as
an indicator of the body’s ability to adapt to an exercise
stimulus has been evaluated in many studies through HR
variability (HRV) and post-exercise HR recovery (HRR).
Recently, HR acceleration has also been investigated.
Objective The aim of this systematic literature review
and meta-analysis was to evaluate the effect of negative
adaptations to endurance training (i.e., a period of over-
reaching leading to attenuated performance) and positive
adaptations (i.e., training leading to improved perfor-
mance) on autonomic HR regulation in endurance-trained
athletes.
Methods We searched Ovid MEDLINE, Embase,
CINAHL, SPORTDiscus, PubMed, and Academic Search
Premier databases from inception until April 2015. Inclu-
ded articles examined the effects of endurance training
leading to increased or decreased exercise performance on
four measures of autonomic HR regulation: resting and
post-exercise HRV [vagal-related indices of the root-mean-
square difference of successive normal R–R intervals
(RMSSD), high frequency power (HFP) and the standard
deviation of instantaneous beat-to-beat R–R interval vari-
ability (SD1) only], and post-exercise HRR and HR
acceleration.
Results Of the 5377 records retrieved, 27 studies were
included in the systematic review and 24 studies were
included in the meta-analysis. Studies inducing increases in
performance showed small increases in resting RMSSD
[standardised mean difference (SMD) = 0.58; P\ 0.001],
HFP (SMD = 0.55; P\ 0.001) and SD1 (SMD = 0.23;
P = 0.16), and moderate increases in post-exercise
RMSSD (SMD = 0.60; P\ 0.001), HFP (SMD = 0.90;
P\ 0.04), SD1 (SMD = 1.20; P = 0.04), and post-exer-
cise HRR (SMD = 0.63; P = 0.002). A large increase in
HR acceleration (SMD = 1.34) was found in the single
study assessing this parameter. Studies inducing decreases
in performance showed a small increase in resting RMSSD
(SMD = 0.26; P = 0.01), but trivial changes in resting
HFP (SMD = 0.04; P = 0.77) and SD1 (SMD = 0.04;
P = 0.82). Post-exercise RMSSD (SMD = 0.64;
P = 0.04) and HFP (SMD = 0.49; P = 0.18) were
increased, as was HRR (SMD = 0.46; P\ 0.001), while
HR acceleration was decreased (SMD = -0.48;
P\ 0.001).
Conclusions Increases in vagal-related indices of resting
and post-exercise HRV, post-exercise HRR, and HR
acceleration are evident when positive adaptation to
training has occurred, allowing for increases in perfor-
mance. However, increases in post-exercise HRV and HRR
also occur in response to overreaching, demonstrating that
additional measures of training tolerance may be required
to determine whether training-induced changes in these
parameters are related to positive or negative adaptations.
Resting HRV is largely unaffected by overreaching,
although this may be the result of methodological issues
that warrant further investigation. HR acceleration appears
to decrease in response to overreaching training, and thus
may be a potential indicator of training-induced fatigue.
& Clint R. Bellenger
1 Alliance for Research in Exercise, Nutrition and Activity
(ARENA), Sansom Institute for Health Research, University
of South Australia, GPO Box 2471, Adelaide, SA 5001,
Australia
2 South Australian Sports Institute, Adelaide, SA, Australia
123
Sports Med (2016) 46:1461–1486
DOI 10.1007/s40279-016-0484-2
Key Points
Measures of resting and post-exercise heart rate (HR)
variability, post-exercise HR recovery, and HR
acceleration increase in response to training,
facilitating improvements in athletic performance.
In studies leading to reductions in performance as a
result of overload training, HR recovery and HR
variability assessed post-exercise also increased,
making their interpretation difficult without
additional variables allowing for contextualisation of
training.
Overload training had little effect on resting HR
variability; however, the disagreement between
studies may be the result of methodological issues
that warrant further investigation.
A small number of studies demonstrated a decrease
in HR acceleration following overload training,
indicating that it may be a potential indicator of
training-induced fatigue.
1 Introduction
Optimizing athletic training through manipulation of
training stress and recovery allows for the enhancement of
athletic performance at important time points [1–3].
Unfortunately, if the subtle balance between the high
training stress required for physiological adaptation and the
appropriate recovery from such stress is not adequately
maintained, training-induced fatigue may accumulate,
leading to attenuated exercise performance (i.e., a state of
functional overreaching or, if severe, non-functional over-
reaching and overtraining) [4]. The establishment of a
marker capable of accurately conveying athletic training
status that is easily administered and readily incorporated
into any training program has become a popular topic in
sports and exercise physiology research [1]. Such a marker
would allow for recognition of training-induced fatigue or
the level of recovery/adaptation achieved, facilitating
adjustments in training load to individualize training pro-
grams [3].
Several methods to quantify change in autonomic nervous
system (ANS) function are proposed to be capable of indi-
cating training status. The ANS functions during and after
physical exercise to maintain homeostasis, and repeated
exposure to an exercise stress causes physiological
adaptation, reducing homeostatic perturbation in response to
subsequent stressors [3]. Consequently, examining ANS
responsiveness to changes in training load may indicate the
body’s ability to tolerate or adapt to an exercise stimulus [3,
5]. Since the ANS controls cardiovascular function through
sympathetic and parasympathetic modulation [6], and the
balance of parasympathetic and sympathetic modulation is
altered following changes in training load [7, 8], research has
specifically focused on conveying training status through
autonomic heart rate (HR) regulation, as it provides a simple
and non-invasive measure of ANS function [9]. Two popular
measures of autonomic HR regulation are HR variability
(HRV) and post-exercise HR recovery (HRR).
HRV utilizes a non-invasive assessment of the variation
in time between consecutive heart beats or R-to-R intervals
[10]. The time between consecutive R-to-R intervals is
constantly fluctuating as a result of the interaction between
pulmonary ventilation, blood pressure, and cardiac output
to maintain blood pressure homeostasis within specific
limits [11]. In its simplest form, HRV has been analysed
and presented in the time domain; however, more complex
assessments include power spectral and non-linear analysis
(see Malik et al. [10] for more information on methods of
HRV analysis). These analyses of HRV are able to provide
researchers with direct information on the parasympathetic
contributions (and by extension, inferred information on
the sympathetic contributions) to resting and post-exercise
modulation of HR.
HRR is the assessment of the rate at which HR decreases
following the cessation of exercise [12] and reflects the
coordinated interaction between parasympathetic re-acti-
vation and sympathetic withdrawal [13, 14]. As such, HRR
also has the potential to provide insight into the balance of
parasympathetic and sympathetic HR modulation.
One mode of assessing autonomic HR regulation that
has not been well investigated is the measurement of HR
kinetics at the onset of exercise. Since these kinetics are
controlled by the parasympathetic and sympathetic divi-
sions of the ANS [6, 15], training-induced changes in HR
kinetics at the onset of exercise may provide the potential
to indicate training status. Indeed, cross-sectional research
supports this potential [16], with mono-exponential curve
fitting showing that the half-time for the increase in HR at
the onset of exercise (i.e., the time taken for HR to reach
one half of the difference between steady-state HR and pre-
exercise HR) was shorter in well-trained athletes than in
untrained individuals and was correlated with maximal
oxygen consumption in both groups. The faster HR
increase in trained individuals may contribute to improved
exercise performance through a more rapid increase in
oxygen delivery to active muscle, thus reducing peripheral
muscle fatigue [17].
1462 C. R. Bellenger et al.
123
More recently, a novel method of examining HR
kinetics at the onset of exercise using sigmoidal curve fit-
ting has been investigated [18–20]. Specifically, the first
derivative of the sigmoidal HR curve obtained during the
transition from rest to steady state during sub-maximal
exercise provided a measure of the maximal rate of HR
increase (rHRI) at the onset of exercise.
Given the interest in autonomic HR regulation and its
potential application in the field of sports and exercise
physiology to monitor athletic training status, the aim of
this systematic literature review was to determine the effect
of training interventions leading to changes in exercise
performance (as a measure of training status) on measures
of autonomic HR regulation in endurance-trained athletes
undergoing endurance-based training. Specifically, this
review sought to investigate the effect of negative adap-
tations to training (i.e., a period of overreaching leading to
attenuated performance) on autonomic HR regulation
compared with the effects of positive adaptations to train-
ing (i.e., training leading to improved performance).
2 Methods
This review followed the PRISMA (Preferred Reporting
Items for Systematic Reviews and Meta-Analyses) state-
ment for improved reporting of systematic reviews [21].
2.1 Literature Search
A literature search was conducted on 15 August 2013, and
database update alerts were monitored until April 2015.
The databases Ovid MEDLINE, Embase, Cumulative
Index to Nursing and Allied Health (CINAHL),
SPORTDiscus, PubMed, and Academic Search Premier
were searched. Database searches were complemented by
pearling of the reference lists of relevant articles. Where
available, searches were limited to peer-reviewed, English
language studies using human participants only.
Title, abstract, and keyword search fields were searched
in each of the aforementioned databases using the follow-
ing search terms:
overreaching OR overtraining OR OT OR OTS OR
overload OR training OR training status AND heart
rate variability OR HRV OR heart rate recovery OR
HRR OR rate of heart rate increase OR rHRI
2.2 Eligibility Criteria
To be eligible for inclusion in this review, study partici-
pants had to have been previously undertaking some form
of endurance training (i.e., they were not previously
sedentary), the training intervention utilized needed to
induce a change in training status (either a decrease in
performance (i.e., a state of overreaching) or an improve-
ment in performance), and maximal exercise performance
must have been measured and reported to confirm such a
change in training status (measures of maximal oxygen
consumption were not considered to be an accept-
able proxy for exercise performance) [4, 22, 23]. Studies
also had to include all necessary data to calculate effect
size (i.e., number of participants, mean, and standard
deviation).
2.3 Study Selection
All articles identified in the literature search were exported
to a reference management software program (Endnote
version X6, Thomson Reuters, 2012), and duplicate refer-
ences were removed. Eligibility assessment was performed
independently by two investigators (CRB and JTF), with
disagreement settled by consensus. All records were
examined by title and abstract in order to exclude obvi-
ously irrelevant records, and full-text articles were then
assessed for eligibility using the eligibility criteria. For
studies with more than one article based on the same study
population, inclusion was limited to the original
publication.
Data extraction was performed by the lead author (CRB)
and confirmed by a second investigator (JTF). The fol-
lowing information was collected from included studies:
publication details, participant characteristics, length of
training intervention, details of conditions under which the
relevant autonomic parameter was assessed (i.e., length of
recording, posture, and intensity of exercise if applicable),
and results (measures of maximal exercise performance
and autonomic HR regulation as assessed by HRV, HRR,
and HR acceleration).
2.4 Risk of Bias Assessment
Risk of bias assessment was performed by the lead author
(CRB) and confirmed by a second investigator (JTF)
utilizing the Cochrane Collaboration’s tool for assessing
risk of bias [24]. This tool was used to assess the selec-
tion, performance, detection, attrition, and reporting bias
of each of the eligible studies identified from the literature
search.
2.5 Statistical Analysis
The standardized mean difference (SMD) in autonomic HR
regulation and maximal exercise performance before and
after the training intervention was calculated by standard-
izing the mean difference (post-intervention value minus
Athletic Training Status and Autonomic Heart Rate Regulation 1463
123
pre-intervention value) by the pooled between-subject
standard deviation at the pre- and post-intervention time
points. Effects were quantified as trivial (\0.2), small
(0.2–0.6), moderate (0.61–1.2), large (1.21–2.0), and very
large ([2.0) [25]. Precision of the effect size estimate was
assessed using 95 % confidence intervals (CIs).
Random-effects meta-analysis was performed in
Review Manager software (RevMan, version 5.2,
Cochrane Collaboration, Oxford, UK) using the inverse-
variance method. Data were presented as SMD ± 95 %
CI with statistical significance set at P\ 0.05. Where not
reported, the standard error of mean difference and cor-
relations between treatment outcomes were estimated
from P values using the equivalent T-statistic. When this
was not possible, standard error of the mean difference
was estimated according to the methods described by
Elbourne et al. [26], using the lowest correlation estimate
among other studies. The presence of statistical hetero-
geneity was determined by the I2 statistic and Cochran’s
Q statistic [27].
Separate meta-analyses were carried out on indices of
autonomic HR regulation (HRV, HRR, and HR accelera-
tion) in those studies that found decrements in performance
following a training intervention and those that found
improvements in performance following a training inter-
vention. With regard to HRV, meta-analyses were only
carried out on vagal-related indices in accordance with
recent recommendations of Buchheit [28] and Plews et al.
[29]. Thus, the root-mean-square difference of successive
normal R–R intervals (RMSSD) in the time domain, high
frequency power (HFP) in the power spectral domain, and
the standard deviation of instantaneous beat-to-beat R–
R interval variability (SD1) from non-linear Poincare plots
(or their natural logarithms) were extracted and analysed
since they represent pure parasympathetic HR modulation
[10]. Separate meta-analyses were performed on each of
these indices. Researchers have also hypothesized that the
posture in which the assessment of resting HRV occurs, in
addition to the time of day at which it occurs, can affect the
magnitude of training-induced change in resting HRV [28].
As such, sub-group meta-analyses were carried out on
combinations of posture and recording time of day in
studies assessing resting HRV.
3 Results
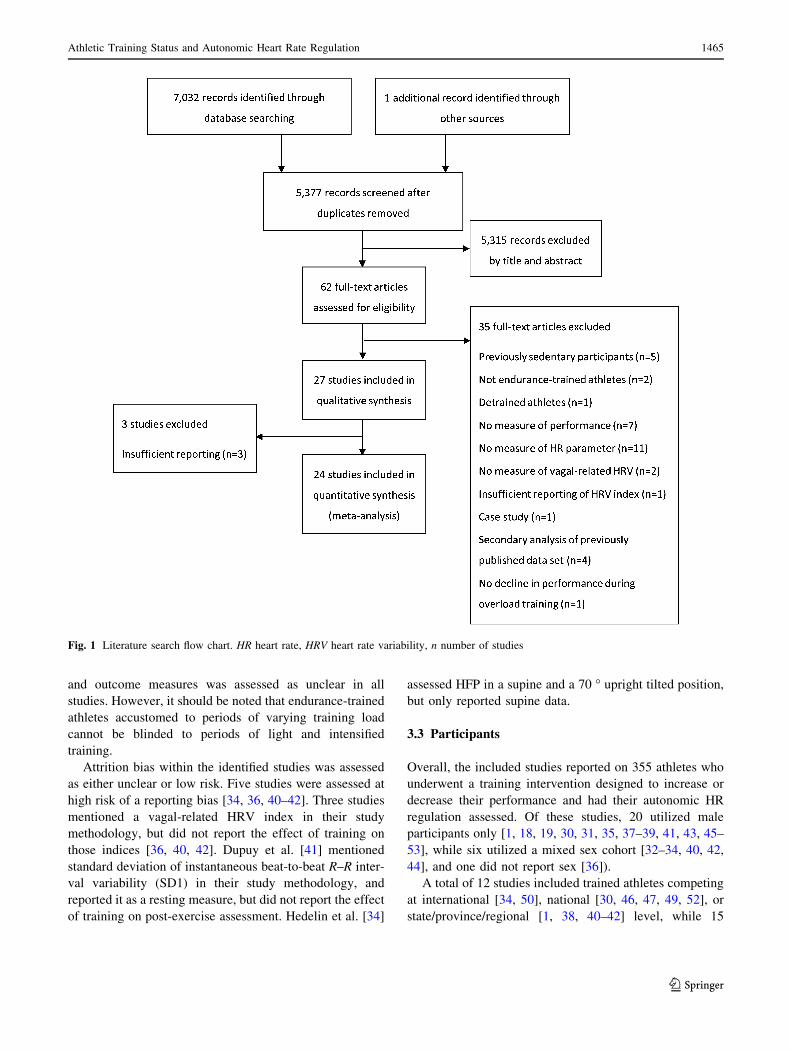
After removal of duplicates, the initial search identified
5377 records. A summary of the search, including the
number of studies suitable for qualitative synthesis and
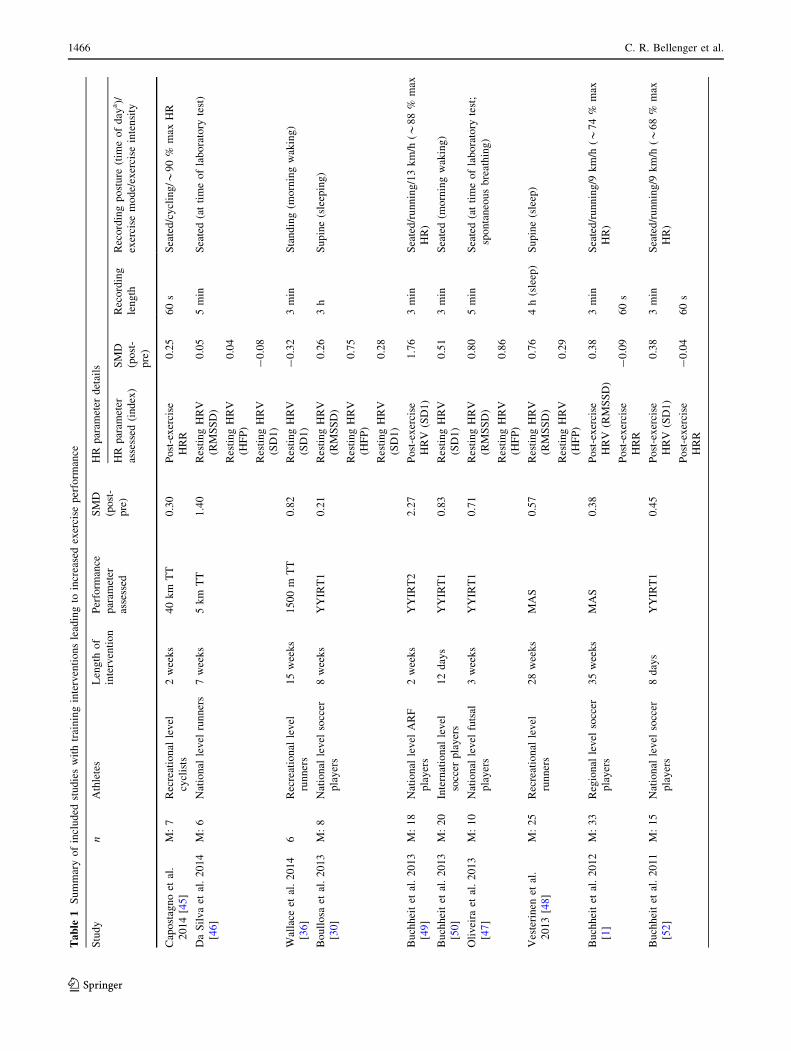
meta-analysis is shown in Fig. 1. The 27 studies included
for review are summarized in Tables 1 and 2 [1, 18, 19,
30–53].
3.1 Reasons for Exclusion
A total of 35 studies for which the full text was reviewed
were excluded from qualitative synthesis, as follows: pre-
viously sedentary nature of the participants (n = 5) [54–
58], not using endurance-trained athletes (n = 2) [59, 60],
inducing a decline in performance that was not due to an
overreaching intervention (i.e., athletes were allowed to
detrain) (n = 1) [61], not including/reporting a valid
measure of exercise performance (n = 7) [12, 62–67], not
assessing an autonomic HR parameter of interest (n = 11)
[68–78], not assessing a vagal-related index of HRV
(n = 2) [79, 80], not identifying what HRV index was
assessed (n = 1) [81], being a case study of an individual
(n = 1) [82], being a secondary analysis of study data for
which the original publication [31, 37, 41, 44] had already
been included for analysis (n = 4 [83–86], and not
inducing a decline in performance during a deliberate
overreaching intervention (and thus any associated change
in autonomic HR regulation was not due to a change in
training status) (n = 1) [87].
Three studies were included for qualitative synthesis,
but were excluded from meta-analysis as they presented
median and interquartile ranges [44], did not present a
standard deviation for SMD calculation [43], and presented
repeat measures of resting HRV relative to baseline mea-
sures (and thus a valid measure of SMD could not be
calculated) [42]. These authors were emailed for the
required information but did not respond.
Boullosa et al. [30] measured ultra-short-term HRR
(0–20 s); however, this work was excluded from qualita-
tive synthesis and meta-analysis as it was not adequately
standardized to allow accurate comparison with other
studies (i.e., HRR was measured whenever an athlete had
up to 20 s of recovery at any point during training without
regard for exercise intensity or duration).
3.2 Risk of Bias
Selection bias (random sequence generation and allocation
concealment bias) was not assessed in this review, as the
nature of the training interventions utilized in the identified
studies did not allow for such study rigour. Seven studies
[18, 19, 39, 40, 42, 43, 53] utilized a period of controlled
baseline training before intensifying training in order to
induce a decrease in performance. In each of these studies,
the order of training was fixed such that a period of ‘light’
training occurred before intensified training. Given that
training needs to be intensified to induce the reductions in
performance required in these studies, the order in which
these periods of training occurred could not be randomized.
Performance and detection bias as a result of participant
and study personnel blinding to the training intervention
1464 C. R. Bellenger et al.
123
and outcome measures was assessed as unclear in all
studies. However, it should be noted that endurance-trained
athletes accustomed to periods of varying training load
cannot be blinded to periods of light and intensified
training.
Attrition bias within the identified studies was assessed
as either unclear or low risk. Five studies were assessed at
high risk of a reporting bias [34, 36, 40–42]. Three studies
mentioned a vagal-related HRV index in their study
methodology, but did not report the effect of training on
those indices [36, 40, 42]. Dupuy et al. [41] mentioned
standard deviation of instantaneous beat-to-beat R–R inter-
val variability (SD1) in their study methodology, and
reported it as a resting measure, but did not report the effect
of training on post-exercise assessment. Hedelin et al. [34]
assessed HFP in a supine and a 70 � upright tilted position,
but only reported supine data.
3.3 Participants
Overall, the included studies reported on 355 athletes who
underwent a training intervention designed to increase or
decrease their performance and had their autonomic HR
regulation assessed. Of these studies, 20 utilized male
participants only [1, 18, 19, 30, 31, 35, 37–39, 41, 43, 45–
53], while six utilized a mixed sex cohort [32–34, 40, 42,
44], and one did not report sex [36]).
A total of 12 studies included trained athletes competing
at international [34, 50], national [30, 46, 47, 49, 52], or
state/province/regional [1, 38, 40–42] level, while 15
Fig. 1 Literature search flow chart. HR heart rate, HRV heart rate variability, n number of studies
Athletic Training Status and Autonomic Heart Rate Regulation 1465
123
Table
1S
um
mar
yo
fin
clu
ded
stu
die
sw
ith
trai
nin
gin
terv
enti
on
sle
adin
gto
incr
ease
dex
erci
sep
erfo
rman
ce
Stu
dy
nA
thle
tes
Len
gth
of
inte
rven
tio
n
Per
form
ance
par
amet
er
asse
ssed
SM
D
(po
st-
pre
)
HR
par
amet
erd
etai
ls
HR
par
amet
er
asse
ssed
(in
dex
)
SM
D
(po
st-
pre
)
Rec
ord
ing
len
gth
Rec
ord
ing
po
stu
re(t
ime
of
day
a)/
exer
cise
mo
de/
exer
cise
inte
nsi
ty
Cap
ost
agn
oet
al.
20
14
[45]
M:
7R
ecre
atio
nal
lev
el
cycl
ists
2w
eek
s4
0k
mT
T0
.30
Po
st-e
xer
cise
HR
R
0.2
56
0s
Sea
ted
/cy
clin
g/*
90
%m
axH
R
Da
Sil
va
etal
.2
01
4
[46
]
M:
6N
atio
nal
lev
elru
nn
ers
7w
eek
s5
km
TT
1.4
0R
esti
ng
HR
V
(RM
SS
D)
0.0
55
min
Sea
ted
(at
tim
eo
fla
bo
rato
ryte
st)
Res
tin
gH
RV
(HF
P)
0.0
4
Res
tin
gH
RV
(SD
1)
-0
.08
Wal
lace
etal
.2
01
4
[36
]
6R
ecre
atio
nal
lev
el
run
ner
s
15
wee
ks
15
00
mT
T0
.82
Res
tin
gH
RV
(SD
1)
-0
.32
3m
inS
tan
din
g(m
orn
ing
wak
ing
)
Bo
ull
osa
etal
.2
01
3
[30
]
M:
8N
atio
nal
lev
elso
ccer
pla
yer
s
8w
eek
sY
YIR
T1
0.2
1R
esti
ng
HR
V
(RM
SS
D)
0.2
63
hS
up
ine
(sle
epin
g)
Res
tin
gH
RV
(HF
P)
0.7
5
Res
tin
gH
RV
(SD
1)
0.2
8
Bu
chh
eit
etal
.2
01
3
[49
]
M:
18
Nat
ion
alle
vel
AR
F
pla
yer
s
2w
eek
sY
YIR
T2
2.2
7P
ost
-ex
erci
se
HR
V(S
D1
)
1.7
63
min
Sea
ted
/ru
nn
ing
/13
km
/h(*
88
%m
ax
HR
)
Bu
chh
eit
etal
.2
01
3
[50
]
M:
20
Inte
rnat
ion
alle
vel
socc
erp
lay
ers
12
day
sY
YIR
T1
0.8
3R
esti
ng
HR
V
(SD
1)
0.5
13
min
Sea
ted
(mo
rnin
gw
akin
g)
Oli
vei
raet
al.
20
13
[47
]
M:
10
Nat
ion
alle
vel
futs
al
pla
yer
s
3w
eek
sY
YIR
T1
0.7
1R
esti
ng
HR
V
(RM
SS
D)
0.8
05
min
Sea
ted
(at
tim
eo
fla
bo
rato
ryte
st;
spo
nta
neo
us
bre
ath
ing
)
Res
tin
gH
RV
(HF
P)
0.8
6
Ves
teri
nen
etal
.
20
13
[48]
M:
25
Rec
reat
ion
alle
vel
run
ner
s
28
wee
ks
MA
S0
.57
Res
tin
gH
RV
(RM
SS
D)
0.7
64
h(s
leep
)S
up
ine
(sle
ep)
Res
tin
gH
RV
(HF
P)
0.2
9
Bu
chh
eit
etal
.2
01
2
[1]
M:
33
Reg
ion
alle
vel
socc
er
pla
yer
s
35
wee
ks
MA
S0
.38
Po
st-e
xer
cise
HR
V(R
MS
SD
)
0.3
83
min
Sea
ted
/ru
nn
ing
/9k
m/h
(*7
4%
max
HR
)
Po
st-e
xer
cise
HR
R
-0
.09
60
s
Bu
chh
eit
etal
.2
01
1
[52
]
M:
15
Nat
ion
alle
vel
socc
er
pla
yer
s
8d
ays
YY
IRT
10
.45
Po
st-e
xer
cise
HR
V(S
D1
)
0.3
83
min
Sea
ted
/ru
nn
ing
/9k
m/h
(*6
8%
max
HR
)
Po
st-e
xer
cise
HR
R
-0
.04
60
s
1466 C. R. Bellenger et al.
123
Table
1co
nti
nu
ed
Stu
dy
nA
thle
tes
Len
gth
of
inte
rven
tio
n
Per
form
ance
par
amet
er
asse
ssed
SM
D
(po
st-
pre
)
HR
par
amet
erd
etai
ls
HR
par
amet
er
asse
ssed
(in
dex
)
SM
D
(po
st-
pre
)
Rec
ord
ing
len
gth
Rec
ord
ing
po
stu
re(t
ime
of
day
a)/
exer
cise
mo
de/
exer
cise
inte
nsi
ty
Bu
chh
eit
etal
.2
01
0
[31
]
M:
11
Rec
reat
ion
alle
vel
run
ner
s
8w
eek
sM
AS
0.7
9R
esti
ng
HR
V
(RM
SS
D)
0.5
75
min
Su
pin
e(m
orn
ing
wak
ing
)
10
km
TT
0.4
6P
ost
-ex
erci
se
HR
V(R
MS
SD
)
0.7
53
min
Sta
nd
ing
/ru
nn
ing
/60
%M
AS
(*7
8%
max
HR
b)
Po
st-e
xer
cise
HR
R
1.2
26
0s
Lam
ber
tset
al.
20
09
[37
]
M:
14
Rec
reat
ion
alle
vel
cycl
ists
4w
eek
s4
0k
mT
T0
.68
Po
st-e
xer
cise
HR
R(4
0k
m
TT
)
1.2
06
0s
Sea
ted
/cy
clin
g/m
axex
erci
se(*
98
%
max
HR
)
MA
P0
.39
Po
st-e
xer
cise
HR
R(H
IT)
0.8
8S
eate
d/c
ycl
ing
/*9
4%
max
HR
Bu
chh
eit
etal
.2
00
8
[38
]G
RS
M:
8R
egio
nal
lev
el
han
db
all
pla
yer
s
9w
eek
sV
IFT
0.9
2P
ost
-ex
erci
se
HR
V(R
MS
SD
)
0.7
55
min
Sea
ted
/ru
nn
ing
/60
%V
IFT
(*7
9%
max
HR
)
Po
st-e
xer
cise
HR
V(H
FP
)
0.5
6
Po
st-e
xer
cise
HR
R
0.3
36
0s
Bu
chh
eit
etal
.2
00
8
[38
]G
HIT
M:
7R
egio
nal
lev
el
han
db
all
pla
yer
s
9w
eek
sV
IFT
1.0
5P
ost
-ex
erci
se
HR
V(R
MS
SD
)
1.2
65
min
Sea
ted
/ru
nn
ing
/60
%V
IFT
(*7
9%
max
HR
)
Po
st-e
xer
cise
HR
V(H
FP
)
1.2
9
Po
st-e
xer
cise
HR
R
1.2
16
0s
Kiv
inie
mi
etal
.
20
07
[35]
Gn
HR
V
M:
8R
ecre
atio
nal
lev
el
run
ner
s
4w
eek
sM
AS
0.4
8R
esti
ng
HR
V(s
it;
HF
P)
0.0
05
min
Sea
ted
(mo
rnin
gw
akin
g;
spo
nta
neo
us
bre
ath
ing
)
Res
tin
gH
RV
(sta
nd
;H
FP
)
1.3
3S
tan
din
g(m
orn
ing
wak
ing
;
spo
nta
neo
us
bre
ath
ing
)
Kiv
inie
mi
etal
.
20
07
[35]
GH
RV
M:
9R
ecre
atio
nal
lev
el
run
ner
s
4w
eek
sM
AS
0.9
0R
esti
ng
HR
V(s
it;
HF
P)
0.6
45
min
Sea
ted
(mo
rnin
gw
akin
g;
spo
nta
neo
us
bre
ath
ing
)
Res
tin
gH
RV
(sta
nd
;H
FP
)
0.5
7S
tan
din
g(m
orn
ing
wak
ing
;
spo
nta
neo
us
bre
ath
ing
)
Car
ter
etal
.2
00
3
[32
]
M:
12
F:
12
Rec
reat
ion
alle
vel
run
ner
s
12
wee
ks
3.2
km
TT
0.3
1R
esti
ng
HR
V
(HF
P)
0.7
31
0m
inS
up
ine
(at
tim
eo
fla
bo
rato
ryte
st;
con
tro
lled
bre
ath
ing
@1
5/m
in)
Laf
fite
etal
.2
00
3
[51
]
M:
7R
ecre
atio
nal
lev
el
run
ner
s
8w
eek
sV
50
0.4
0H
Rac
cele
rati
on
1.3
49
min
23
scU
pri
gh
t/ru
nn
ing
/*9
1%
max
HR
Athletic Training Status and Autonomic Heart Rate Regulation 1467
123
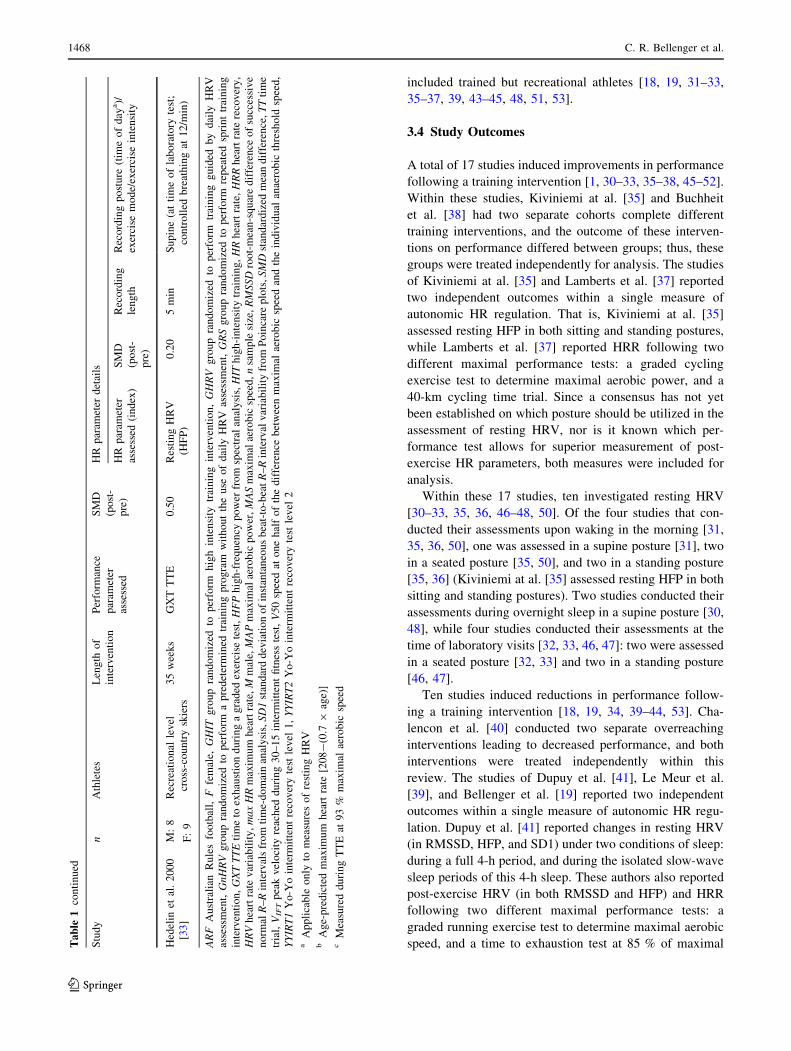
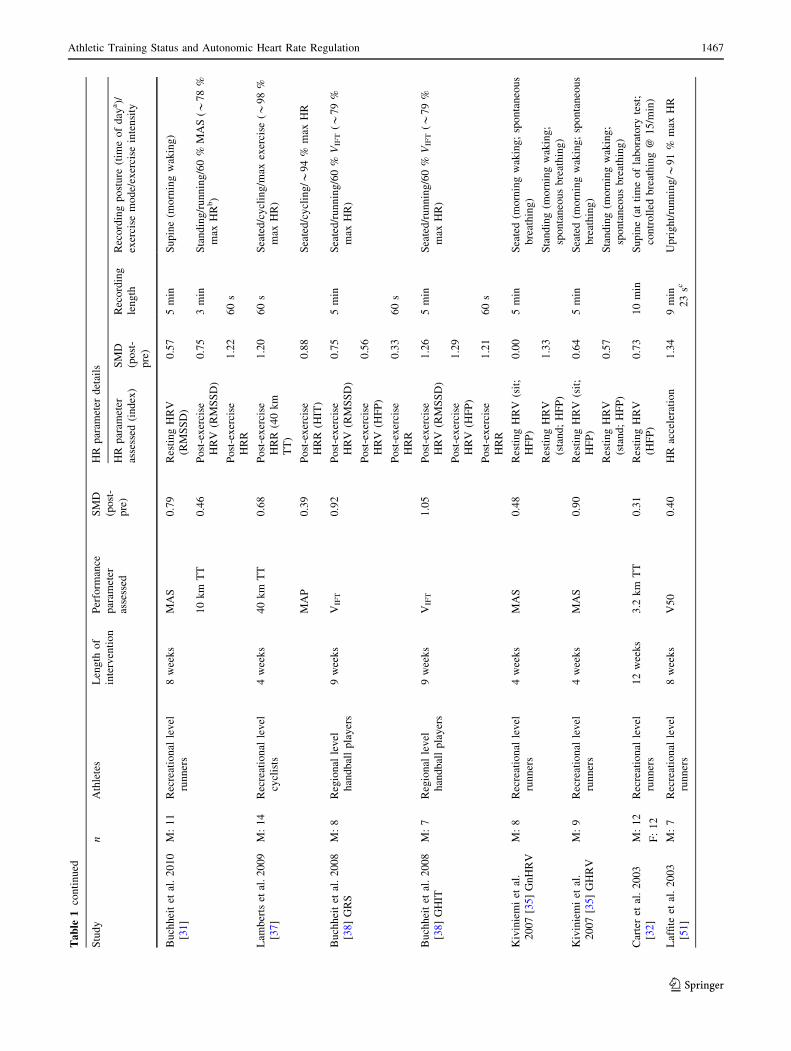
included trained but recreational athletes [18, 19, 31–33,
35–37, 39, 43–45, 48, 51, 53].
3.4 Study Outcomes
A total of 17 studies induced improvements in performance
following a training intervention [1, 30–33, 35–38, 45–52].
Within these studies, Kiviniemi at al. [35] and Buchheit
et al. [38] had two separate cohorts complete different
training interventions, and the outcome of these interven-
tions on performance differed between groups; thus, these
groups were treated independently for analysis. The studies
of Kiviniemi at al. [35] and Lamberts et al. [37] reported
two independent outcomes within a single measure of
autonomic HR regulation. That is, Kiviniemi at al. [35]
assessed resting HFP in both sitting and standing postures,
while Lamberts et al. [37] reported HRR following two
different maximal performance tests: a graded cycling
exercise test to determine maximal aerobic power, and a
40-km cycling time trial. Since a consensus has not yet
been established on which posture should be utilized in the
assessment of resting HRV, nor is it known which per-
formance test allows for superior measurement of post-
exercise HR parameters, both measures were included for
analysis.
Within these 17 studies, ten investigated resting HRV
[30–33, 35, 36, 46–48, 50]. Of the four studies that con-
ducted their assessments upon waking in the morning [31,
35, 36, 50], one was assessed in a supine posture [31], two
in a seated posture [35, 50], and two in a standing posture
[35, 36] (Kiviniemi at al. [35] assessed resting HFP in both
sitting and standing postures). Two studies conducted their
assessments during overnight sleep in a supine posture [30,
48], while four studies conducted their assessments at the
time of laboratory visits [32, 33, 46, 47]: two were assessed
in a seated posture [32, 33] and two in a standing posture
[46, 47].
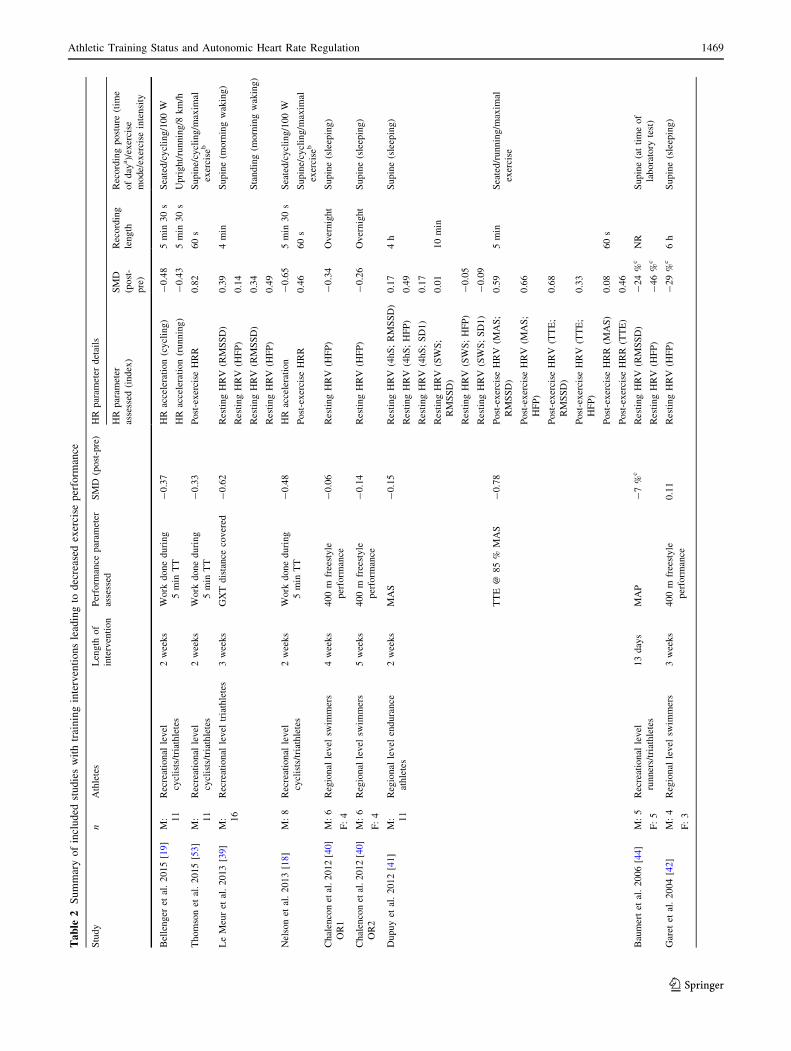
Ten studies induced reductions in performance follow-
ing a training intervention [18, 19, 34, 39–44, 53]. Cha-
lencon et al. [40] conducted two separate overreaching
interventions leading to decreased performance, and both
interventions were treated independently within this
review. The studies of Dupuy et al. [41], Le Meur et al.
[39], and Bellenger et al. [19] reported two independent
outcomes within a single measure of autonomic HR regu-
lation. Dupuy et al. [41] reported changes in resting HRV
(in RMSSD, HFP, and SD1) under two conditions of sleep:
during a full 4-h period, and during the isolated slow-wave
sleep periods of this 4-h sleep. These authors also reported
post-exercise HRV (in both RMSSD and HFP) and HRR
following two different maximal performance tests: a
graded running exercise test to determine maximal aerobic
speed, and a time to exhaustion test at 85 % of maximalTable
1co
nti
nu
ed
Stu
dy
nA
thle
tes
Len
gth
of
inte
rven
tio
n
Per
form
ance
par
amet
er
asse
ssed
SM
D
(po
st-
pre
)
HR
par
amet
erd
etai
ls
HR
par
amet
er
asse
ssed
(in
dex
)
SM
D
(po
st-
pre
)
Rec
ord
ing
len
gth
Rec
ord
ing
po
stu
re(t
ime
of
day
a)/
exer
cise
mo
de/
exer
cise
inte
nsi
ty
Hed
elin
etal
.2
00
0
[33
]
M:
8
F:
9
Rec
reat
ion
alle
vel
cro
ss-c
ou
ntr
ysk
iers
35
wee
ks
GX
TT
TE
0.5
0R
esti
ng
HR
V
(HF
P)
0.2
05
min
Su
pin
e(a
tti
me
of
lab
ora
tory
test
;
con
tro
lled
bre
ath
ing
at1
2/m
in)
ARF
Au
stra
lian
Ru
les
foo
tbal
l,F
fem
ale,
GHIT
gro
up
ran
do
miz
edto
per
form
hig
hin
ten
sity
trai
nin
gin
terv
enti
on
,GHRV
gro
up
ran
do
miz
edto
per
form
trai
nin
gg
uid
edb
yd
aily
HR
V
asse
ssm
ent,GnHRV
gro
up
ran
do
miz
edto
per
form
ap
red
eter
min
edtr
ain
ing
pro
gra
mw
ith
ou
tth
eu
seo
fd
aily
HR
Vas
sess
men
t,GRS
gro
up
ran
do
miz
edto
per
form
rep
eate
dsp
rin
ttr
ain
ing
inte
rven
tio
n,GXTTTE
tim
eto
exh
aust
ion
du
rin
ga
gra
ded
exer
cise
test
,HFP
hig
h-f
req
uen
cyp
ow
erfr
om
spec
tral
anal
ysi
s,HIT
hig
h-i
nte
nsi
tytr
ain
ing
,HR
hea
rtra
te,HRR
hea
rtra
tere
cov
ery
,
HRV
hea
rtra
tev
aria
bil
ity
,maxHR
max
imu
mh
eart
rate
,M
mal
e,MAP
max
imal
aero
bic
po
wer
,MAS
max
imal
aero
bic
spee
d,n
sam
ple
size
,RMSSD
roo
t-m
ean
-sq
uar
ed
iffe
ren
ceo
fsu
cces
siv
e
no
rmalR
–R
inte
rval
sfr
om
tim
e-d
om
ain
anal
ysi
s,SD1
stan
dar
dd
evia
tio
no
fin
stan
tan
eou
sb
eat-
to-b
eatR
–R
inte
rval
var
iab
ilit
yfr
om
Po
inca
rep
lots
,SMD
stan
dar
diz
edm
ean
dif
fere
nce
,TT
tim
e
tria
l,VIFT
pea
kv
elo
city
reac
hed
du
rin
g3
0–
15
inte
rmit
ten
tfi
tnes
ste
st,V50
spee
dat
on
eh
alf
of
the
dif
fere
nce
bet
wee
nm
axim
alae
rob
icsp
eed
and
the
ind
ivid
ual
anae
rob
icth
resh
old
spee
d,
YYIRT1
Yo
-Yo
inte
rmit
ten
tre
cov
ery
test
lev
el1
,YYIRT2
Yo
-Yo
inte
rmit
ten
tre
cov
ery
test
lev
el2
aA
pp
lica
ble
on
lyto
mea
sure
so
fre
stin
gH
RV
bA
ge-
pre
dic
ted
max
imu
mh
eart
rate
[20
8-
(0.7
9ag
e)]
cM
easu
red
du
rin
gT
TE
at9
3%
max
imal
aero
bic
spee
d
1468 C. R. Bellenger et al.
123
Table
2S
um
mar
yo
fin
clu
ded
stu
die
sw
ith
trai
nin
gin
terv
enti
on
sle
adin
gto
dec
reas
edex
erci
sep
erfo
rman
ce
Stu
dy
nA
thle
tes
Len
gth
of
inte
rven
tion
Per
form
ance
par
amet
er
asse
ssed
SM
D(p
ost
-pre
)H
Rpar
amet
erdet
ails
HR
par
amet
er
asse
ssed
(index
)
SM
D
(post
-
pre
)
Rec
ord
ing
length
Rec
ord
ing
post
ure
(tim
e
of
day
a)/
exer
cise
mode/
exer
cise
inte
nsi
ty
Bel
lenger
etal
.2015
[19
]M
: 11
Rec
reat
ional
level
cycl
ists
/tri
athle
tes
2w
eeks
Work
done
duri
ng
5m
inT
T
-0.3
7H
Rac
cele
rati
on
(cycl
ing)
-0.4
85
min
30
sS
eate
d/c
ycl
ing/1
00
W
HR
acce
lera
tion
(runnin
g)
-0.4
35
min
30
sU
pri
ght/
runnin
g/8
km
/h
Thom
son
etal
.2015
[53
]M
: 11
Rec
reat
ional
level
cycl
ists
/tri
athle
tes
2w
eeks
Work
done
duri
ng
5m
inT
T
-0.3
3P
ost
-exer
cise
HR
R0.8
260
sS
upin
e/cy
clin
g/m
axim
al
exer
cise
b
Le
Meu
ret
al.
2013
[39
]M
: 16
Rec
reat
ional
level
tria
thle
tes
3w
eeks
GX
Tdis
tance
cover
ed-
0.6
2R
esti
ng
HR
V(R
MS
SD
)0.3
94
min
Supin
e(m
orn
ing
wak
ing)
Res
ting
HR
V(H
FP
)0.1
4
Res
ting
HR
V(R
MS
SD
)0.3
4S
tandin
g(m
orn
ing
wak
ing)
Res
ting
HR
V(H
FP
)0.4
9
Nel
son
etal
.2013
[18
]M
:8
Rec
reat
ional
level
cycl
ists
/tri
athle
tes
2w
eeks
Work
done
duri
ng
5m
inT
T
-0.4
8H
Rac
cele
rati
on
-0.6
55
min
30
sS
eate
d/c
ycl
ing/1
00
W
Post
-exer
cise
HR
R0.4
660
sS
upin
e/cy
clin
g/m
axim
al
exer
cise
b
Chal
enco
net
al.
2012
[40]
OR
1
M:
6
F:
4
Reg
ional
level
swim
mer
s4
wee
ks
400
mfr
eest
yle
per
form
ance
-0.0
6R
esti
ng
HR
V(H
FP
)-
0.3
4O
ver
nig
ht
Supin
e(s
leep
ing)
Chal
enco
net
al.
2012
[40]
OR
2
M:
6
F:
4
Reg
ional
level
swim
mer
s5
wee
ks
400
mfr
eest
yle
per
form
ance
-0.1
4R
esti
ng
HR
V(H
FP
)-
0.2
6O
ver
nig
ht
Supin
e(s
leep
ing)
Dupuy
etal
.2012
[41
]M
: 11
Reg
ional
level
endura
nce
athle
tes
2w
eeks
MA
S-
0.1
5R
esti
ng
HR
V(4
hS
;R
MS
SD
)0.1
74
hS
upin
e(s
leep
ing)
Res
ting
HR
V(4
hS
;H
FP
)0.4
9
Res
ting
HR
V(4
hS
;S
D1)
0.1
7
Res
ting
HR
V(S
WS
;
RM
SS
D)
0.0
110
min
Res
ting
HR
V(S
WS
;H
FP
)-
0.0
5
Res
ting
HR
V(S
WS
;S
D1)
-0.0
9
TT
E@
85
%M
AS
-0.7
8P
ost
-exer
cise
HR
V(M
AS
;
RM
SS
D)
0.5
95
min
Sea
ted/r
unnin
g/m
axim
al
exer
cise
Post
-exer
cise
HR
V(M
AS
;
HF
P)
0.6
6
Post
-exer
cise
HR
V(T
TE
;
RM
SS
D)
0.6
8
Post
-exer
cise
HR
V(T
TE
;
HF
P)
0.3
3
Post
-exer
cise
HR
R(M
AS
)0.0
860
s
Post
-exer
cise
HR
R(T
TE
)0.4
6
Bau
mer
tet
al.
2006
[44
]M
:5
F:
5
Rec
reat
ional
level
runner
s/tr
iath
lete
s
13
day
sM
AP
-7
%c
Res
ting
HR
V(R
MS
SD
)-
24
%c
NR
Supin
e(a
tti
me
of
labora
tory
test
)R
esti
ng
HR
V(H
FP
)-
46
%c
Gar
etet
al.
2004
[42
]M
:4
F:
3
Reg
ional
level
swim
mer
s3
wee
ks
400
mfr
eest
yle
per
form
ance
0.1
1R
esti
ng
HR
V(H
FP
)-
29
%c
6h
Supin
e(s
leep
ing)
Athletic Training Status and Autonomic Heart Rate Regulation 1469
123
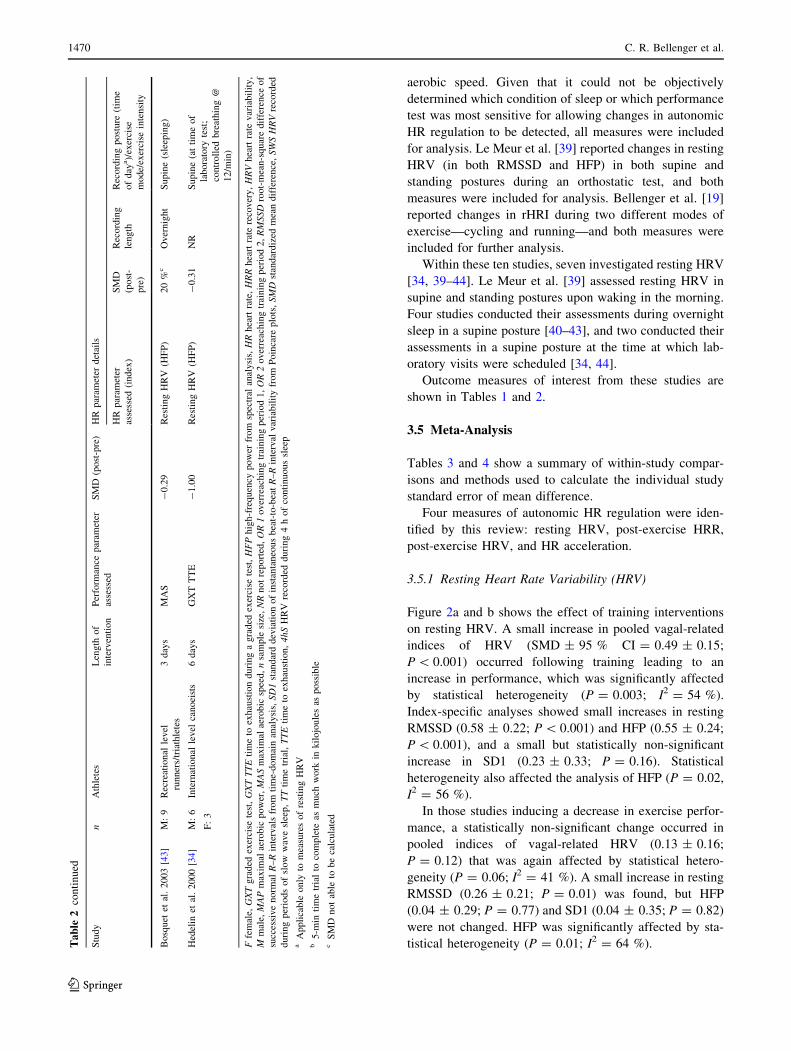
aerobic speed. Given that it could not be objectively
determined which condition of sleep or which performance
test was most sensitive for allowing changes in autonomic
HR regulation to be detected, all measures were included
for analysis. Le Meur et al. [39] reported changes in resting
HRV (in both RMSSD and HFP) in both supine and
standing postures during an orthostatic test, and both
measures were included for analysis. Bellenger et al. [19]
reported changes in rHRI during two different modes of
exercise—cycling and running—and both measures were
included for further analysis.
Within these ten studies, seven investigated resting HRV
[34, 39–44]. Le Meur et al. [39] assessed resting HRV in
supine and standing postures upon waking in the morning.
Four studies conducted their assessments during overnight
sleep in a supine posture [40–43], and two conducted their
assessments in a supine posture at the time at which lab-
oratory visits were scheduled [34, 44].
Outcome measures of interest from these studies are
shown in Tables 1 and 2.
3.5 Meta-Analysis
Tables 3 and 4 show a summary of within-study compar-
isons and methods used to calculate the individual study
standard error of mean difference.
Four measures of autonomic HR regulation were iden-
tified by this review: resting HRV, post-exercise HRR,
post-exercise HRV, and HR acceleration.
3.5.1 Resting Heart Rate Variability (HRV)
Figure 2a and b shows the effect of training interventions
on resting HRV. A small increase in pooled vagal-related
indices of HRV (SMD ± 95 % CI = 0.49 ± 0.15;
P\ 0.001) occurred following training leading to an
increase in performance, which was significantly affected
by statistical heterogeneity (P = 0.003; I2 = 54 %).
Index-specific analyses showed small increases in resting
RMSSD (0.58 ± 0.22; P\ 0.001) and HFP (0.55 ± 0.24;
P\ 0.001), and a small but statistically non-significant
increase in SD1 (0.23 ± 0.33; P = 0.16). Statistical
heterogeneity also affected the analysis of HFP (P = 0.02,
I2 = 56 %).
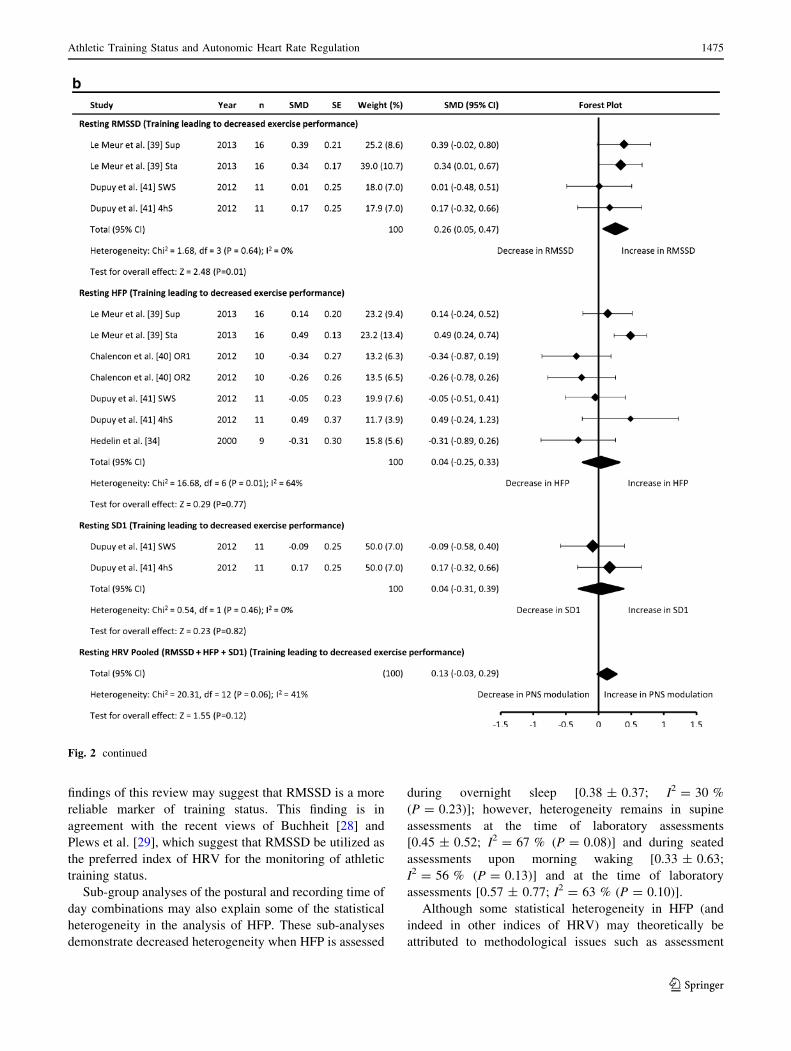
In those studies inducing a decrease in exercise perfor-
mance, a statistically non-significant change occurred in
pooled indices of vagal-related HRV (0.13 ± 0.16;
P = 0.12) that was again affected by statistical hetero-
geneity (P = 0.06; I2 = 41 %). A small increase in resting
RMSSD (0.26 ± 0.21; P = 0.01) was found, but HFP
(0.04 ± 0.29; P = 0.77) and SD1 (0.04 ± 0.35; P = 0.82)
were not changed. HFP was significantly affected by sta-
tistical heterogeneity (P = 0.01; I2 = 64 %).Table
2co
nti
nu
ed
Stu
dy
nA
thle
tes
Len
gth
of
inte
rven
tion
Per
form
ance
par
amet
er
asse
ssed
SM
D(p
ost
-pre
)H
Rpar
amet
erdet
ails
HR
par
amet
er
asse
ssed
(index
)
SM
D
(post
-
pre
)
Rec
ord
ing
length
Rec
ord
ing
post
ure
(tim
e
of
day
a)/
exer
cise
mode/
exer
cise
inte
nsi
ty
Bosq
uet
etal
.2003
[43
]M
:9
Rec
reat
ional
level
runner
s/tr
iath
lete
s
3day
sM
AS
-0.2
9R
esti
ng
HR
V(H
FP
)20
%c
Over
nig
ht
Supin
e(s
leep
ing)
Hed
elin
etal
.2000
[34
]M
:6
F:
3
Inte
rnat
ional
level
canoei
sts
6day
sG
XT
TT
E-
1.0
0R
esti
ng
HR
V(H
FP
)-
0.3
1N
RS
upin
e(a
tti
me
of
labora
tory
test
;
contr
oll
edbre
athin
g@
12/m
in)
Ffe
mal
e,GXT
gra
ded
exer
cise
test
,GXTTTE
tim
eto
exhau
stio
nduri
ng
agra
ded
exer
cise
test
,HFP
hig
h-f
requen
cypow
erfr
om
spec
tral
anal
ysi
s,HR
hea
rtra
te,HRR
hea
rtra
tere
cover
y,HRV
hea
rtra
tevar
iabil
ity,
Mm
ale,MAP
max
imal
aero
bic
pow
er,MAS
max
imal
aero
bic
spee
d,n
sam
ple
size
,NR
not
report
ed,OR1
over
reac
hin
gtr
ainin
gper
iod
1,OR2
over
reac
hin
gtr
ainin
gper
iod
2,RMSSD
root-
mea
n-s
quar
edif
fere
nce
of
succ
essi
ve
norm
alR
–R
inte
rval
sfr
om
tim
e-dom
ain
anal
ysi
s,SD1
stan
dar
ddev
iati
on
of
inst
anta
neo
us
bea
t-to
-bea
tR
–R
inte
rval
var
iabil
ity
from
Poin
care
plo
ts,SMD
stan
dar
diz
edm
ean
dif
fere
nce
,SWSHRV
reco
rded
duri
ng
per
iods
of
slow
wav
esl
eep,TT
tim
etr
ial,TTE
tim
eto
exhau
stio
n,4hS
HR
Vre
cord
edduri
ng
4h
of
conti
nuous
slee
pa
Appli
cable
only
tom
easu
res
of
rest
ing
HR
Vb
5-m
inti
me
tria
lto
com
ple
teas
much
work
inkil
ojo
ule
sas
poss
ible
cS
MD
not
able
tobe
calc
ula
ted
1470 C. R. Bellenger et al.
123
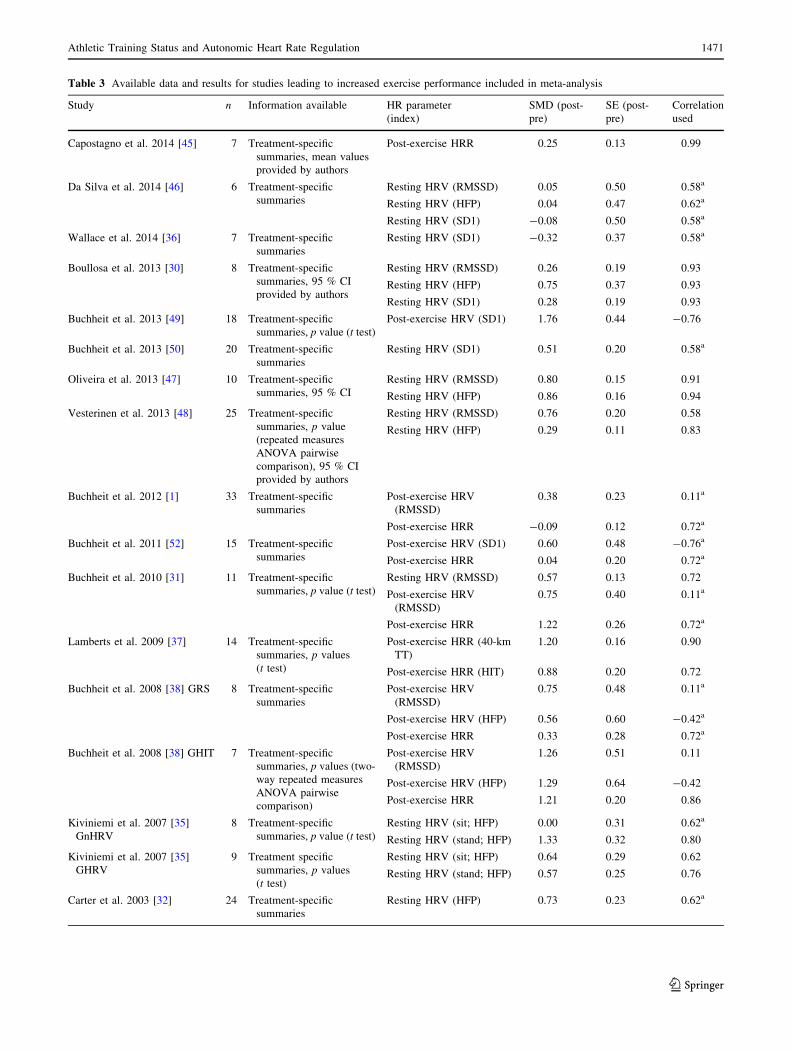
Table 3 Available data and results for studies leading to increased exercise performance included in meta-analysis
Study n Information available HR parameter
(index)
SMD (post-
pre)
SE (post-
pre)
Correlation
used
Capostagno et al. 2014 [45] 7 Treatment-specific
summaries, mean values
provided by authors
Post-exercise HRR 0.25 0.13 0.99
Da Silva et al. 2014 [46] 6 Treatment-specific
summaries
Resting HRV (RMSSD) 0.05 0.50 0.58a
Resting HRV (HFP) 0.04 0.47 0.62a
Resting HRV (SD1) -0.08 0.50 0.58a
Wallace et al. 2014 [36] 7 Treatment-specific
summaries
Resting HRV (SD1) -0.32 0.37 0.58a
Boullosa et al. 2013 [30] 8 Treatment-specific
summaries, 95 % CI
provided by authors
Resting HRV (RMSSD) 0.26 0.19 0.93
Resting HRV (HFP) 0.75 0.37 0.93
Resting HRV (SD1) 0.28 0.19 0.93
Buchheit et al. 2013 [49] 18 Treatment-specific
summaries, p value (t test)
Post-exercise HRV (SD1) 1.76 0.44 -0.76
Buchheit et al. 2013 [50] 20 Treatment-specific
summaries
Resting HRV (SD1) 0.51 0.20 0.58a
Oliveira et al. 2013 [47] 10 Treatment-specific
summaries, 95 % CI
Resting HRV (RMSSD) 0.80 0.15 0.91
Resting HRV (HFP) 0.86 0.16 0.94
Vesterinen et al. 2013 [48] 25 Treatment-specific
summaries, p value
(repeated measures
ANOVA pairwise
comparison), 95 % CI
provided by authors
Resting HRV (RMSSD) 0.76 0.20 0.58
Resting HRV (HFP) 0.29 0.11 0.83
Buchheit et al. 2012 [1] 33 Treatment-specific
summaries
Post-exercise HRV
(RMSSD)
0.38 0.23 0.11a
Post-exercise HRR -0.09 0.12 0.72a
Buchheit et al. 2011 [52] 15 Treatment-specific
summaries
Post-exercise HRV (SD1) 0.60 0.48 -0.76a
Post-exercise HRR 0.04 0.20 0.72a
Buchheit et al. 2010 [31] 11 Treatment-specific
summaries, p value (t test)
Resting HRV (RMSSD) 0.57 0.13 0.72
Post-exercise HRV
(RMSSD)
0.75 0.40 0.11a
Post-exercise HRR 1.22 0.26 0.72a
Lamberts et al. 2009 [37] 14 Treatment-specific
summaries, p values
(t test)
Post-exercise HRR (40-km
TT)
1.20 0.16 0.90
Post-exercise HRR (HIT) 0.88 0.20 0.72
Buchheit et al. 2008 [38] GRS 8 Treatment-specific
summaries
Post-exercise HRV
(RMSSD)
0.75 0.48 0.11a
Post-exercise HRV (HFP) 0.56 0.60 -0.42a
Post-exercise HRR 0.33 0.28 0.72a
Buchheit et al. 2008 [38] GHIT 7 Treatment-specific
summaries, p values (two-
way repeated measures
ANOVA pairwise
comparison)
Post-exercise HRV
(RMSSD)
1.26 0.51 0.11
Post-exercise HRV (HFP) 1.29 0.64 -0.42
Post-exercise HRR 1.21 0.20 0.86
Kiviniemi et al. 2007 [35]
GnHRV
8 Treatment-specific
summaries, p value (t test)
Resting HRV (sit; HFP) 0.00 0.31 0.62a
Resting HRV (stand; HFP) 1.33 0.32 0.80
Kiviniemi et al. 2007 [35]
GHRV
9 Treatment specific
summaries, p values
(t test)
Resting HRV (sit; HFP) 0.64 0.29 0.62
Resting HRV (stand; HFP) 0.57 0.25 0.76
Carter et al. 2003 [32] 24 Treatment-specific
summaries
Resting HRV (HFP) 0.73 0.23 0.62a
Athletic Training Status and Autonomic Heart Rate Regulation 1471
123
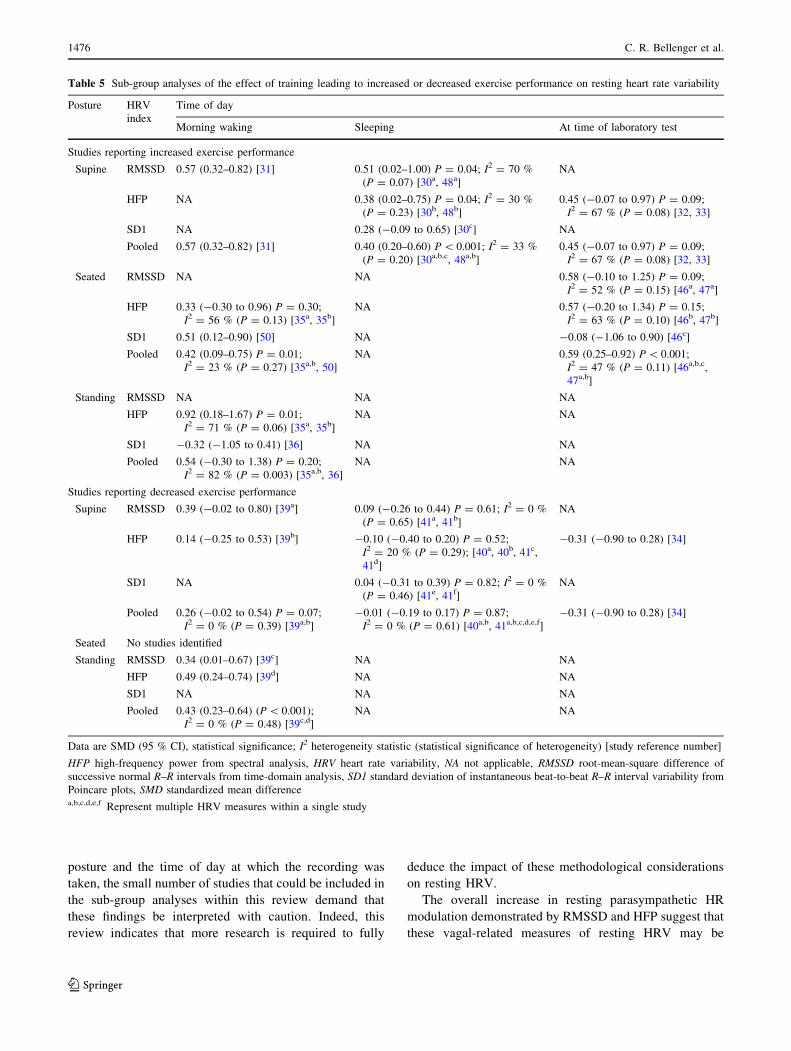
Sub-group analyses for the combinations of posture and
recording time of day for studies leading to increases and
decreases in performance are shown in Table 5.
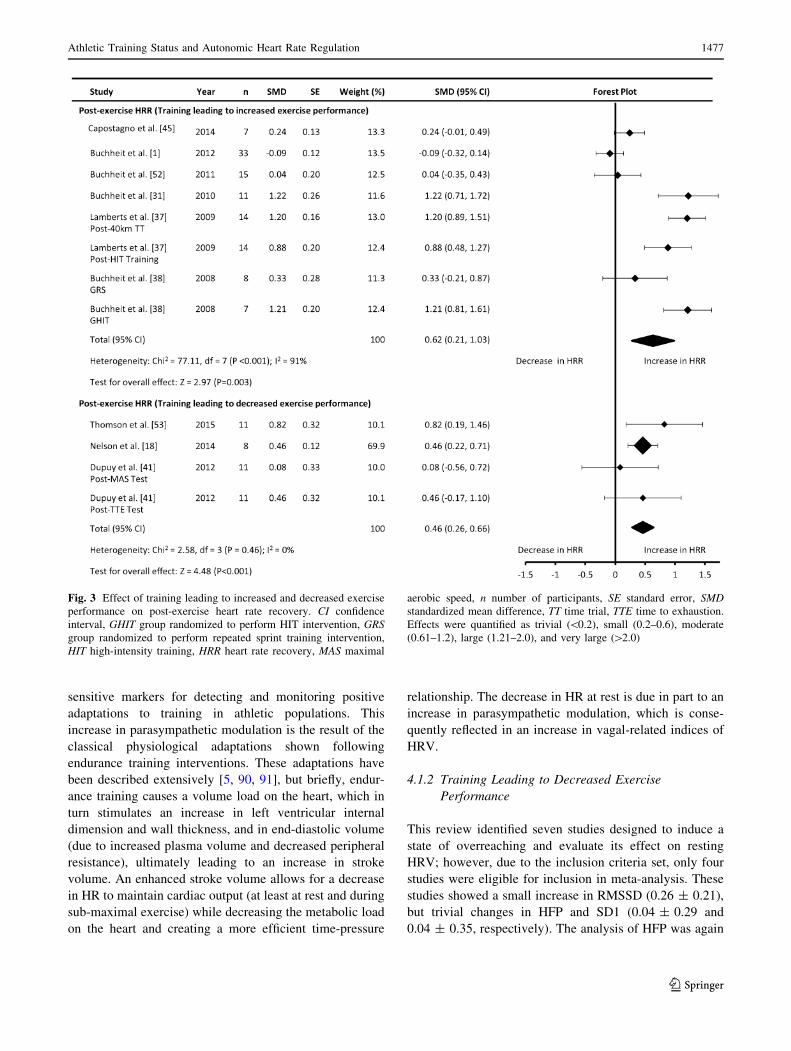
3.5.2 Post-Exercise Heart Rate Recovery (HRR)
A moderate increase in post-exercise HRR was found
following improved exercise performance (0.63 ± 0.40;
P = 0.002), but post-exercise HRR was also significantly
affected by statistical heterogeneity (P\ 0.001;
I2 = 91 %).
A small increase in post-exercise HRR was also found
(0.46 ± 0.20; P\ 0.001) in those studies inducing a
decrease in performance. Figure 3 depicts the effect of
training on HRR.
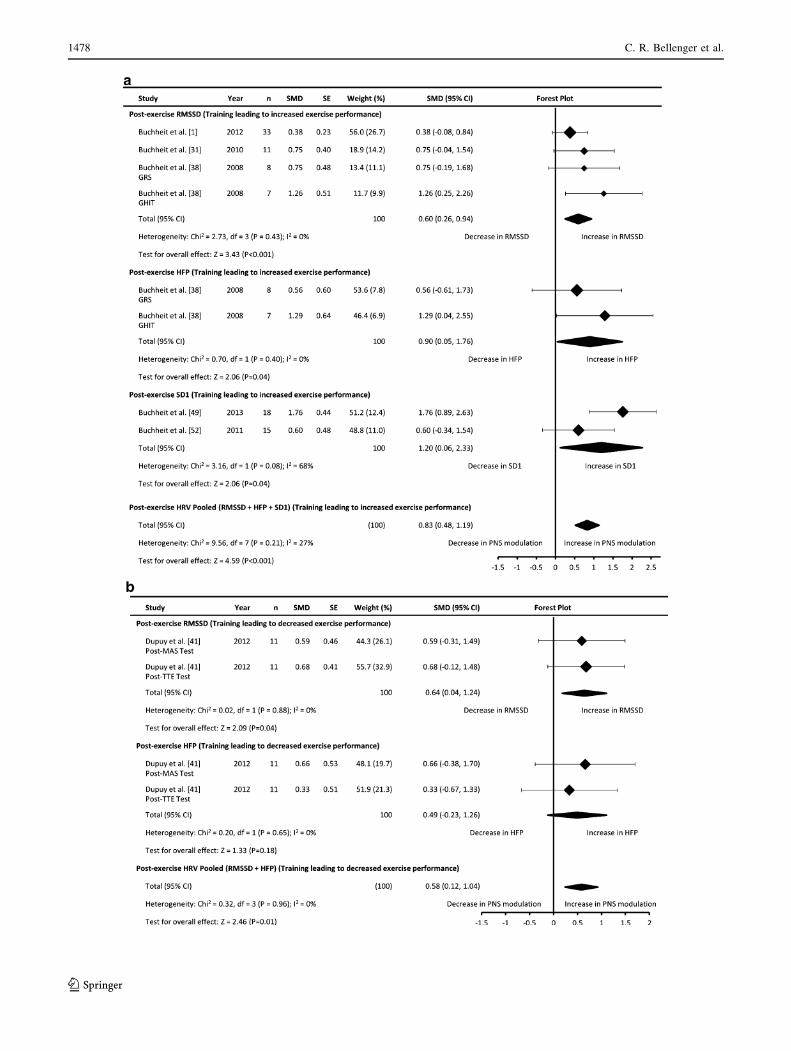
3.5.3 Post-Exercise HRV
A moderate increase in pooled indices of post-exercise
HRV (0.83 ± 0.36; P\ 0.001) was found in studies
leading to increased performance. RMSSD (0.60 ± 0.34;
P\ 0.001), HFP (0.90 ± 0.85; P\ 0.04), and SD1
(1.20 ± 1.13; P = 0.04) all showed moderate increases
(Fig. 4a).
Studies inducing a decrease in performance demon-
strated a small increase in pooled post-exercise HRV
(0.58 ± 0.46; P = 0.01). Measures of RMSSD
(0.64 ± 0.60; P = 0.04) increased moderately, while small
and non-significant changes in HFP (0.49 ± 0.77;
P = 0.18) were evident (Fig. 4b).
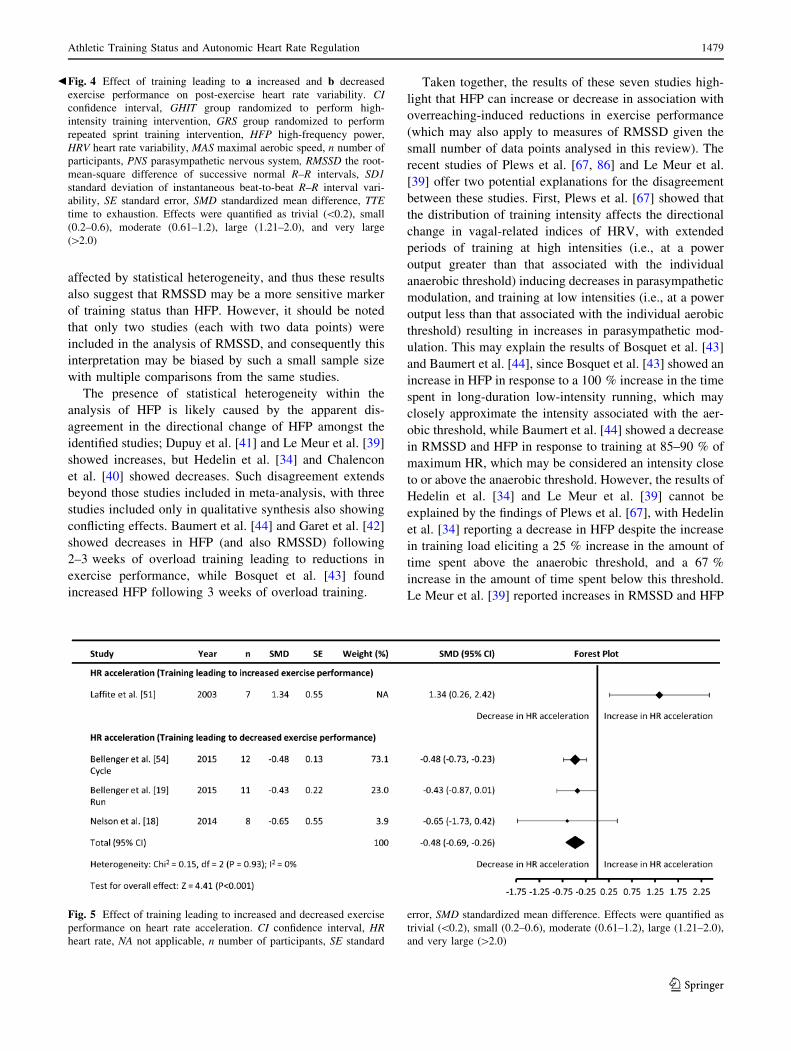
3.5.4 HR Acceleration
Figure 5 highlights the training-induced changes in HR
acceleration. Only one study [51] assessed the effect of
training interventions leading to increased exercise per-
formance on HR acceleration, and this study reported an
increase (1.34 ± 1.08) in this parameter. A small decrease
in this parameter occurred in those studies inducing
decreased exercise performance (-0.48 ± 0.21;
P\ 0.001).
4 Discussion
This systematic literature review sought to determine the
effect of training interventions leading to decreased and/or
increased exercise performance on measures of autonomic
HR regulation. Four measures of autonomic HR regulation
were identified: resting HRV, post-exercise HRR, post-
exercise HRV and HR acceleration. These will be dis-
cussed separately.
4.1 Resting HRV
4.1.1 Training Leading to Increased Exercise
Performance
Resting measures of RMSSD and HFP increased following
training interventions that led to increased performance
(0.58 ± 0.22 and 0.55 ± 0.24, respectively), highlighting
an increase in cardiac parasympathetic modulation as a
positive training adaptation. Studies of SD1 demonstrated a
small increase (0.23 ± 0.33).
Interestingly, the analysis of HFP was significantly
affected by statistical heterogeneity, but the analysis of
RMSSD was not. Statistical heterogeneity in this review
suggests that training leading to increased performance
does not lead to a uniform change in HFP, which may be
due to limitations inherent in its assessment. While
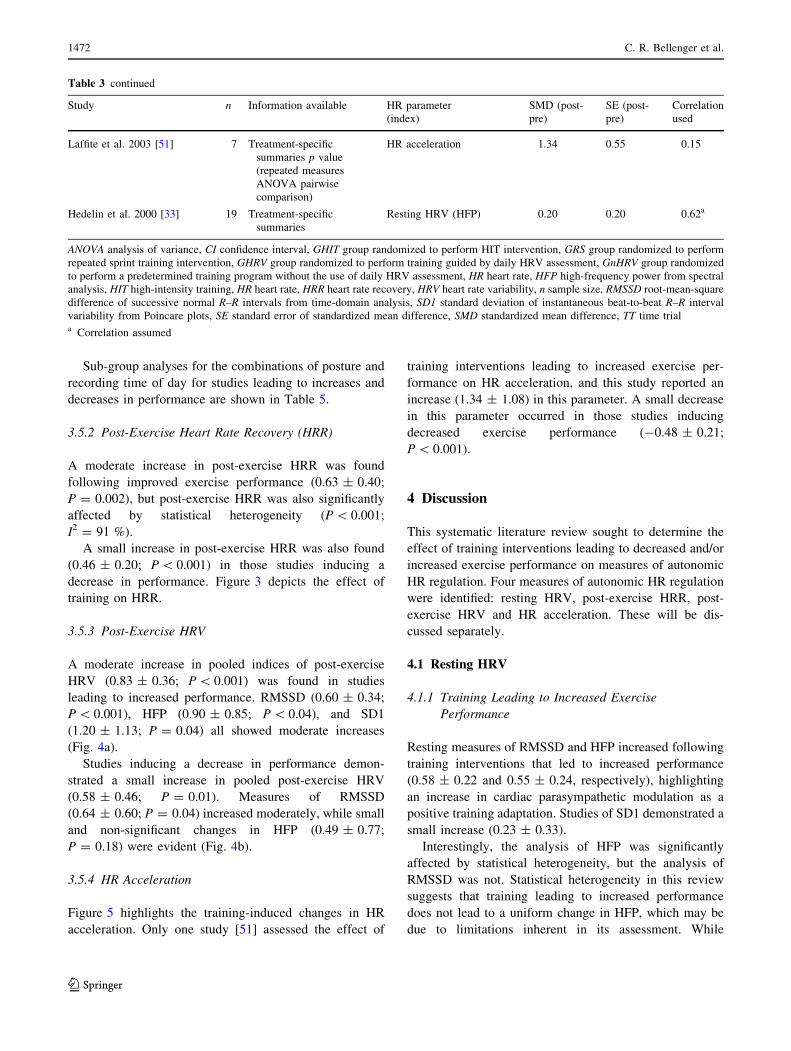
Table 3 continued
Study n Information available HR parameter
(index)
SMD (post-
pre)
SE (post-
pre)
Correlation
used
Laffite et al. 2003 [51] 7 Treatment-specific
summaries p value
(repeated measures
ANOVA pairwise
comparison)
HR acceleration 1.34 0.55 0.15
Hedelin et al. 2000 [33] 19 Treatment-specific
summaries
Resting HRV (HFP) 0.20 0.20 0.62a
ANOVA analysis of variance, CI confidence interval, GHIT group randomized to perform HIT intervention, GRS group randomized to perform
repeated sprint training intervention, GHRV group randomized to perform training guided by daily HRV assessment, GnHRV group randomized
to perform a predetermined training program without the use of daily HRV assessment, HR heart rate, HFP high-frequency power from spectral
analysis, HIT high-intensity training, HR heart rate, HRR heart rate recovery, HRV heart rate variability, n sample size, RMSSD root-mean-square
difference of successive normal R–R intervals from time-domain analysis, SD1 standard deviation of instantaneous beat-to-beat R–R interval
variability from Poincare plots, SE standard error of standardized mean difference, SMD standardized mean difference, TT time triala Correlation assumed
1472 C. R. Bellenger et al.
123
assessments of HFP and RMSSD demonstrate similar day-
to-day variability during short-term (5–10 min) recordings
[88], HFP assessment has a heightened sensitivity to
respiration rates (which has been shown to affect measures
of resting HRV [89]). Thus, while the overall effect of a
positive training adaptation on HFP is significant, the
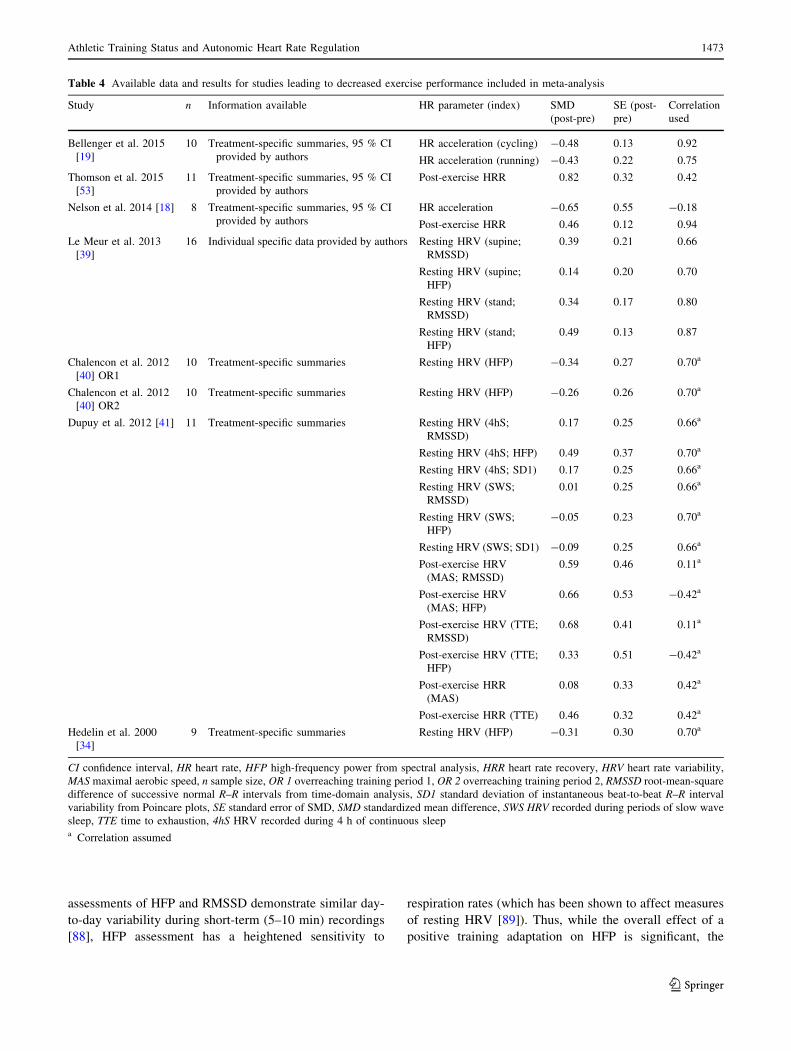
Table 4 Available data and results for studies leading to decreased exercise performance included in meta-analysis
Study n Information available HR parameter (index) SMD
(post-pre)
SE (post-
pre)
Correlation
used
Bellenger et al. 2015
[19]
10 Treatment-specific summaries, 95 % CI
provided by authors
HR acceleration (cycling) -0.48 0.13 0.92
HR acceleration (running) -0.43 0.22 0.75
Thomson et al. 2015
[53]
11 Treatment-specific summaries, 95 % CI
provided by authors
Post-exercise HRR 0.82 0.32 0.42
Nelson et al. 2014 [18] 8 Treatment-specific summaries, 95 % CI
provided by authors
HR acceleration -0.65 0.55 -0.18
Post-exercise HRR 0.46 0.12 0.94
Le Meur et al. 2013
[39]
16 Individual specific data provided by authors Resting HRV (supine;
RMSSD)
0.39 0.21 0.66
Resting HRV (supine;
HFP)
0.14 0.20 0.70
Resting HRV (stand;
RMSSD)
0.34 0.17 0.80
Resting HRV (stand;
HFP)
0.49 0.13 0.87
Chalencon et al. 2012
[40] OR1
10 Treatment-specific summaries Resting HRV (HFP) -0.34 0.27 0.70a
Chalencon et al. 2012
[40] OR2
10 Treatment-specific summaries Resting HRV (HFP) -0.26 0.26 0.70a
Dupuy et al. 2012 [41] 11 Treatment-specific summaries Resting HRV (4hS;
RMSSD)
0.17 0.25 0.66a
Resting HRV (4hS; HFP) 0.49 0.37 0.70a
Resting HRV (4hS; SD1) 0.17 0.25 0.66a
Resting HRV (SWS;
RMSSD)
0.01 0.25 0.66a
Resting HRV (SWS;
HFP)
-0.05 0.23 0.70a
Resting HRV (SWS; SD1) -0.09 0.25 0.66a
Post-exercise HRV
(MAS; RMSSD)
0.59 0.46 0.11a
Post-exercise HRV
(MAS; HFP)
0.66 0.53 -0.42a
Post-exercise HRV (TTE;
RMSSD)
0.68 0.41 0.11a
Post-exercise HRV (TTE;
HFP)
0.33 0.51 -0.42a
Post-exercise HRR
(MAS)
0.08 0.33 0.42a
Post-exercise HRR (TTE) 0.46 0.32 0.42a
Hedelin et al. 2000
[34]
9 Treatment-specific summaries Resting HRV (HFP) -0.31 0.30 0.70a
CI confidence interval, HR heart rate, HFP high-frequency power from spectral analysis, HRR heart rate recovery, HRV heart rate variability,
MAS maximal aerobic speed, n sample size, OR 1 overreaching training period 1, OR 2 overreaching training period 2, RMSSD root-mean-square
difference of successive normal R–R intervals from time-domain analysis, SD1 standard deviation of instantaneous beat-to-beat R–R interval
variability from Poincare plots, SE standard error of SMD, SMD standardized mean difference, SWS HRV recorded during periods of slow wave
sleep, TTE time to exhaustion, 4hS HRV recorded during 4 h of continuous sleepa Correlation assumed
Athletic Training Status and Autonomic Heart Rate Regulation 1473
123
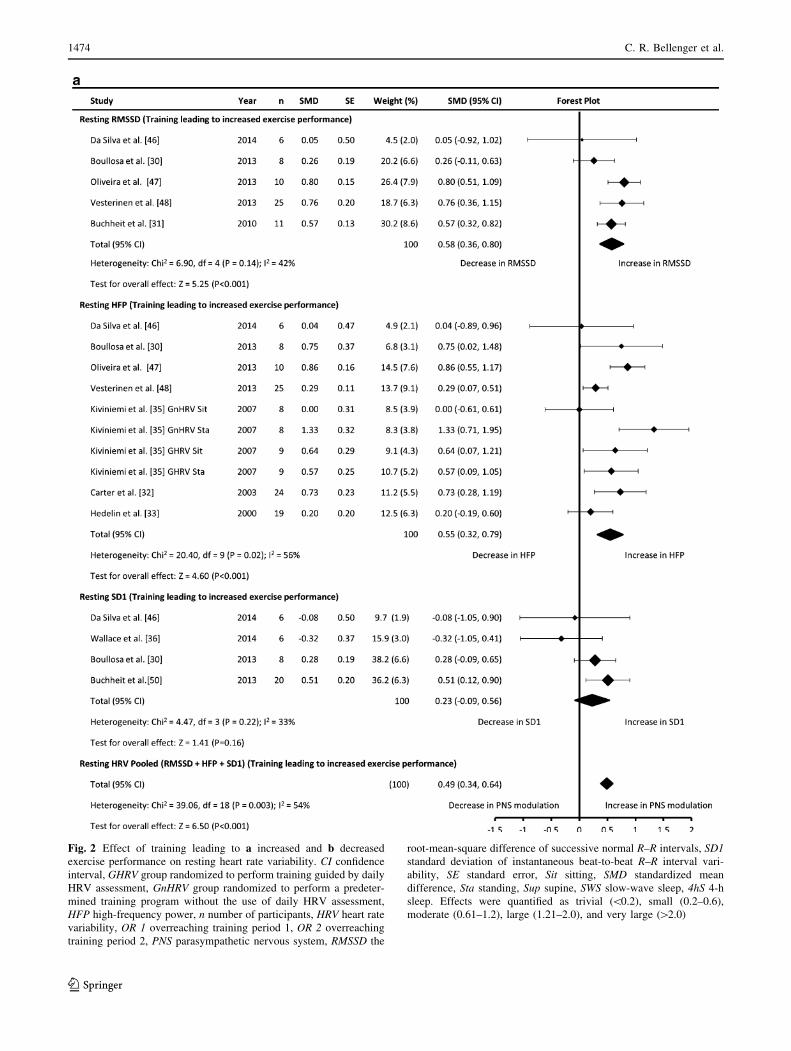
Fig. 2 Effect of training leading to a increased and b decreased
exercise performance on resting heart rate variability. CI confidence
interval, GHRV group randomized to perform training guided by daily
HRV assessment, GnHRV group randomized to perform a predeter-
mined training program without the use of daily HRV assessment,
HFP high-frequency power, n number of participants, HRV heart rate
variability, OR 1 overreaching training period 1, OR 2 overreaching
training period 2, PNS parasympathetic nervous system, RMSSD the
root-mean-square difference of successive normal R–R intervals, SD1
standard deviation of instantaneous beat-to-beat R–R interval vari-
ability, SE standard error, Sit sitting, SMD standardized mean
difference, Sta standing, Sup supine, SWS slow-wave sleep, 4hS 4-h
sleep. Effects were quantified as trivial (\0.2), small (0.2–0.6),
moderate (0.61–1.2), large (1.21–2.0), and very large ([2.0)
1474 C. R. Bellenger et al.
123
findings of this review may suggest that RMSSD is a more
reliable marker of training status. This finding is in
agreement with the recent views of Buchheit [28] and
Plews et al. [29], which suggest that RMSSD be utilized as
the preferred index of HRV for the monitoring of athletic
training status.
Sub-group analyses of the postural and recording time of
day combinations may also explain some of the statistical
heterogeneity in the analysis of HFP. These sub-analyses
demonstrate decreased heterogeneity when HFP is assessed
during overnight sleep [0.38 ± 0.37; I2 = 30 %
(P = 0.23)]; however, heterogeneity remains in supine
assessments at the time of laboratory assessments
[0.45 ± 0.52; I2 = 67 % (P = 0.08)] and during seated
assessments upon morning waking [0.33 ± 0.63;
I2 = 56 % (P = 0.13)] and at the time of laboratory
assessments [0.57 ± 0.77; I2 = 63 % (P = 0.10)].
Although some statistical heterogeneity in HFP (and
indeed in other indices of HRV) may theoretically be
attributed to methodological issues such as assessment
Fig. 2 continued
Athletic Training Status and Autonomic Heart Rate Regulation 1475
123
posture and the time of day at which the recording was
taken, the small number of studies that could be included in
the sub-group analyses within this review demand that
these findings be interpreted with caution. Indeed, this
review indicates that more research is required to fully
deduce the impact of these methodological considerations
on resting HRV.
The overall increase in resting parasympathetic HR
modulation demonstrated by RMSSD and HFP suggest that
these vagal-related measures of resting HRV may be
Table 5 Sub-group analyses of the effect of training leading to increased or decreased exercise performance on resting heart rate variability
Posture HRV
index
Time of day
Morning waking Sleeping At time of laboratory test
Studies reporting increased exercise performance
Supine RMSSD 0.57 (0.32–0.82) [31] 0.51 (0.02–1.00) P = 0.04; I2 = 70 %
(P = 0.07) [30a, 48a]
NA
HFP NA 0.38 (0.02–0.75) P = 0.04; I2 = 30 %
(P = 0.23) [30b, 48b]
0.45 (-0.07 to 0.97) P = 0.09;
I2 = 67 % (P = 0.08) [32, 33]
SD1 NA 0.28 (-0.09 to 0.65) [30c] NA
Pooled 0.57 (0.32–0.82) [31] 0.40 (0.20–0.60) P\ 0.001; I2 = 33 %
(P = 0.20) [30a,b,c, 48a,b]
0.45 (-0.07 to 0.97) P = 0.09;
I2 = 67 % (P = 0.08) [32, 33]
Seated RMSSD NA NA 0.58 (-0.10 to 1.25) P = 0.09;
I2 = 52 % (P = 0.15) [46a, 47a]
HFP 0.33 (-0.30 to 0.96) P = 0.30;
I2 = 56 % (P = 0.13) [35a, 35b]
NA 0.57 (-0.20 to 1.34) P = 0.15;
I2 = 63 % (P = 0.10) [46b, 47b]
SD1 0.51 (0.12–0.90) [50] NA -0.08 (-1.06 to 0.90) [46c]
Pooled 0.42 (0.09–0.75) P = 0.01;
I2 = 23 % (P = 0.27) [35a,b, 50]
NA 0.59 (0.25–0.92) P\ 0.001;
I2 = 47 % (P = 0.11) [46a,b,c,
47a,b]
Standing RMSSD NA NA NA
HFP 0.92 (0.18–1.67) P = 0.01;
I2 = 71 % (P = 0.06) [35a, 35b]
NA NA
SD1 -0.32 (-1.05 to 0.41) [36] NA NA
Pooled 0.54 (-0.30 to 1.38) P = 0.20;
I2 = 82 % (P = 0.003) [35a,b, 36]
NA NA
Studies reporting decreased exercise performance
Supine RMSSD 0.39 (-0.02 to 0.80) [39a] 0.09 (-0.26 to 0.44) P = 0.61; I2 = 0 %
(P = 0.65) [41a, 41b]
NA
HFP 0.14 (-0.25 to 0.53) [39b] -0.10 (-0.40 to 0.20) P = 0.52;
I2 = 20 % (P = 0.29); [40a, 40b, 41c,
41d]
-0.31 (-0.90 to 0.28) [34]
SD1 NA 0.04 (-0.31 to 0.39) P = 0.82; I2 = 0 %
(P = 0.46) [41e, 41f]
NA
Pooled 0.26 (-0.02 to 0.54) P = 0.07;
I2 = 0 % (P = 0.39) [39a,b]
-0.01 (-0.19 to 0.17) P = 0.87;
I2 = 0 % (P = 0.61) [40a,b, 41a,b,c,d,e,f]
-0.31 (-0.90 to 0.28) [34]
Seated No studies identified
Standing RMSSD 0.34 (0.01–0.67) [39c] NA NA
HFP 0.49 (0.24–0.74) [39d] NA NA
SD1 NA NA NA
Pooled 0.43 (0.23–0.64) (P\ 0.001);
I2 = 0 % (P = 0.48) [39c,d]
NA NA
Data are SMD (95 % CI), statistical significance; I2 heterogeneity statistic (statistical significance of heterogeneity) [study reference number]
HFP high-frequency power from spectral analysis, HRV heart rate variability, NA not applicable, RMSSD root-mean-square difference of
successive normal R–R intervals from time-domain analysis, SD1 standard deviation of instantaneous beat-to-beat R–R interval variability from
Poincare plots, SMD standardized mean differencea,b,c,d,e,f Represent multiple HRV measures within a single study
1476 C. R. Bellenger et al.
123
sensitive markers for detecting and monitoring positive
adaptations to training in athletic populations. This
increase in parasympathetic modulation is the result of the
classical physiological adaptations shown following
endurance training interventions. These adaptations have
been described extensively [5, 90, 91], but briefly, endur-
ance training causes a volume load on the heart, which in
turn stimulates an increase in left ventricular internal
dimension and wall thickness, and in end-diastolic volume
(due to increased plasma volume and decreased peripheral
resistance), ultimately leading to an increase in stroke
volume. An enhanced stroke volume allows for a decrease
in HR to maintain cardiac output (at least at rest and during
sub-maximal exercise) while decreasing the metabolic load
on the heart and creating a more efficient time-pressure
relationship. The decrease in HR at rest is due in part to an
increase in parasympathetic modulation, which is conse-
quently reflected in an increase in vagal-related indices of
HRV.
4.1.2 Training Leading to Decreased Exercise
Performance
This review identified seven studies designed to induce a
state of overreaching and evaluate its effect on resting
HRV; however, due to the inclusion criteria set, only four
studies were eligible for inclusion in meta-analysis. These
studies showed a small increase in RMSSD (0.26 ± 0.21),
but trivial changes in HFP and SD1 (0.04 ± 0.29 and
0.04 ± 0.35, respectively). The analysis of HFP was again
Fig. 3 Effect of training leading to increased and decreased exercise
performance on post-exercise heart rate recovery. CI confidence
interval, GHIT group randomized to perform HIT intervention, GRS
group randomized to perform repeated sprint training intervention,
HIT high-intensity training, HRR heart rate recovery, MAS maximal
aerobic speed, n number of participants, SE standard error, SMD
standardized mean difference, TT time trial, TTE time to exhaustion.
Effects were quantified as trivial (\0.2), small (0.2–0.6), moderate
(0.61–1.2), large (1.21–2.0), and very large ([2.0)
Athletic Training Status and Autonomic Heart Rate Regulation 1477
123
1478 C. R. Bellenger et al.
123
affected by statistical heterogeneity, and thus these results
also suggest that RMSSD may be a more sensitive marker
of training status than HFP. However, it should be noted
that only two studies (each with two data points) were
included in the analysis of RMSSD, and consequently this
interpretation may be biased by such a small sample size
with multiple comparisons from the same studies.
The presence of statistical heterogeneity within the
analysis of HFP is likely caused by the apparent dis-
agreement in the directional change of HFP amongst the
identified studies; Dupuy et al. [41] and Le Meur et al. [39]
showed increases, but Hedelin et al. [34] and Chalencon
et al. [40] showed decreases. Such disagreement extends
beyond those studies included in meta-analysis, with three
studies included only in qualitative synthesis also showing
conflicting effects. Baumert et al. [44] and Garet et al. [42]
showed decreases in HFP (and also RMSSD) following
2–3 weeks of overload training leading to reductions in
exercise performance, while Bosquet et al. [43] found
increased HFP following 3 weeks of overload training.
Taken together, the results of these seven studies high-
light that HFP can increase or decrease in association with
overreaching-induced reductions in exercise performance
(which may also apply to measures of RMSSD given the
small number of data points analysed in this review). The
recent studies of Plews et al. [67, 86] and Le Meur et al.
[39] offer two potential explanations for the disagreement
between these studies. First, Plews et al. [67] showed that
the distribution of training intensity affects the directional
change in vagal-related indices of HRV, with extended
periods of training at high intensities (i.e., at a power
output greater than that associated with the individual
anaerobic threshold) inducing decreases in parasympathetic
modulation, and training at low intensities (i.e., at a power
output less than that associated with the individual aerobic
threshold) resulting in increases in parasympathetic mod-
ulation. This may explain the results of Bosquet et al. [43]
and Baumert et al. [44], since Bosquet et al. [43] showed an
increase in HFP in response to a 100 % increase in the time
spent in long-duration low-intensity running, which may
closely approximate the intensity associated with the aer-
obic threshold, while Baumert et al. [44] showed a decrease
in RMSSD and HFP in response to training at 85–90 % of
maximum HR, which may be considered an intensity close
to or above the anaerobic threshold. However, the results of
Hedelin et al. [34] and Le Meur et al. [39] cannot be
explained by the findings of Plews et al. [67], with Hedelin
et al. [34] reporting a decrease in HFP despite the increase
in training load eliciting a 25 % increase in the amount of
time spent above the anaerobic threshold, and a 67 %
increase in the amount of time spent below this threshold.
Le Meur et al. [39] reported increases in RMSSD and HFP
bFig. 4 Effect of training leading to a increased and b decreased
exercise performance on post-exercise heart rate variability. CI
confidence interval, GHIT group randomized to perform high-
intensity training intervention, GRS group randomized to perform
repeated sprint training intervention, HFP high-frequency power,
HRV heart rate variability, MAS maximal aerobic speed, n number of
participants, PNS parasympathetic nervous system, RMSSD the root-
mean-square difference of successive normal R–R intervals, SD1
standard deviation of instantaneous beat-to-beat R–R interval vari-
ability, SE standard error, SMD standardized mean difference, TTE
time to exhaustion. Effects were quantified as trivial (\0.2), small
(0.2–0.6), moderate (0.61–1.2), large (1.21–2.0), and very large
([2.0)
Fig. 5 Effect of training leading to increased and decreased exercise
performance on heart rate acceleration. CI confidence interval, HR
heart rate, NA not applicable, n number of participants, SE standard
error, SMD standardized mean difference. Effects were quantified as
trivial (\0.2), small (0.2–0.6), moderate (0.61–1.2), large (1.21–2.0),
and very large ([2.0)
Athletic Training Status and Autonomic Heart Rate Regulation 1479
123
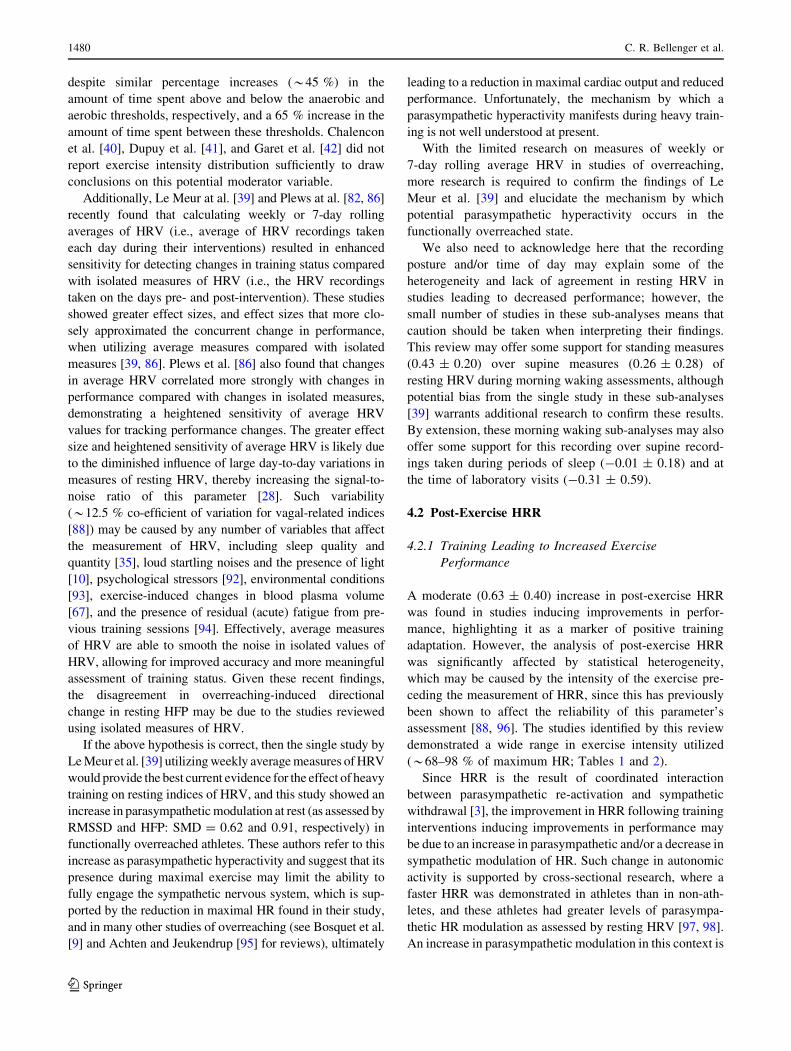
despite similar percentage increases (*45 %) in the
amount of time spent above and below the anaerobic and
aerobic thresholds, respectively, and a 65 % increase in the
amount of time spent between these thresholds. Chalencon
et al. [40], Dupuy et al. [41], and Garet et al. [42] did not
report exercise intensity distribution sufficiently to draw
conclusions on this potential moderator variable.
Additionally, Le Meur at al. [39] and Plews at al. [82, 86]
recently found that calculating weekly or 7-day rolling
averages of HRV (i.e., average of HRV recordings taken
each day during their interventions) resulted in enhanced
sensitivity for detecting changes in training status compared
with isolated measures of HRV (i.e., the HRV recordings
taken on the days pre- and post-intervention). These studies
showed greater effect sizes, and effect sizes that more clo-
sely approximated the concurrent change in performance,
when utilizing average measures compared with isolated
measures [39, 86]. Plews et al. [86] also found that changes
in average HRV correlated more strongly with changes in
performance compared with changes in isolated measures,
demonstrating a heightened sensitivity of average HRV
values for tracking performance changes. The greater effect
size and heightened sensitivity of average HRV is likely due
to the diminished influence of large day-to-day variations in
measures of resting HRV, thereby increasing the signal-to-
noise ratio of this parameter [28]. Such variability
(*12.5 % co-efficient of variation for vagal-related indices
[88]) may be caused by any number of variables that affect
the measurement of HRV, including sleep quality and
quantity [35], loud startling noises and the presence of light
[10], psychological stressors [92], environmental conditions
[93], exercise-induced changes in blood plasma volume
[67], and the presence of residual (acute) fatigue from pre-
vious training sessions [94]. Effectively, average measures
of HRV are able to smooth the noise in isolated values of
HRV, allowing for improved accuracy and more meaningful
assessment of training status. Given these recent findings,
the disagreement in overreaching-induced directional
change in resting HFP may be due to the studies reviewed
using isolated measures of HRV.
If the above hypothesis is correct, then the single study by
Le Meur et al. [39] utilizing weekly average measures of HRV
would provide the best current evidence for the effect of heavy
training on resting indices of HRV, and this study showed an
increase in parasympathetic modulation at rest (as assessed by
RMSSD and HFP: SMD = 0.62 and 0.91, respectively) in
functionally overreached athletes. These authors refer to this
increase as parasympathetic hyperactivity and suggest that its
presence during maximal exercise may limit the ability to
fully engage the sympathetic nervous system, which is sup-
ported by the reduction in maximal HR found in their study,
and in many other studies of overreaching (see Bosquet et al.
[9] and Achten and Jeukendrup [95] for reviews), ultimately
leading to a reduction in maximal cardiac output and reduced
performance. Unfortunately, the mechanism by which a
parasympathetic hyperactivity manifests during heavy train-
ing is not well understood at present.
With the limited research on measures of weekly or
7-day rolling average HRV in studies of overreaching,
more research is required to confirm the findings of Le
Meur et al. [39] and elucidate the mechanism by which
potential parasympathetic hyperactivity occurs in the
functionally overreached state.
We also need to acknowledge here that the recording
posture and/or time of day may explain some of the
heterogeneity and lack of agreement in resting HRV in
studies leading to decreased performance; however, the
small number of studies in these sub-analyses means that
caution should be taken when interpreting their findings.
This review may offer some support for standing measures
(0.43 ± 0.20) over supine measures (0.26 ± 0.28) of
resting HRV during morning waking assessments, although
potential bias from the single study in these sub-analyses
[39] warrants additional research to confirm these results.
By extension, these morning waking sub-analyses may also
offer some support for this recording over supine record-
ings taken during periods of sleep (-0.01 ± 0.18) and at
the time of laboratory visits (-0.31 ± 0.59).
4.2 Post-Exercise HRR
4.2.1 Training Leading to Increased Exercise
Performance
A moderate (0.63 ± 0.40) increase in post-exercise HRR
was found in studies inducing improvements in perfor-
mance, highlighting it as a marker of positive training
adaptation. However, the analysis of post-exercise HRR
was significantly affected by statistical heterogeneity,
which may be caused by the intensity of the exercise pre-
ceding the measurement of HRR, since this has previously
been shown to affect the reliability of this parameter’s
assessment [88, 96]. The studies identified by this review
demonstrated a wide range in exercise intensity utilized
(*68–98 % of maximum HR; Tables 1 and 2).
Since HRR is the result of coordinated interaction
between parasympathetic re-activation and sympathetic
withdrawal [3], the improvement in HRR following training
interventions inducing improvements in performance may
be due to an increase in parasympathetic and/or a decrease in
sympathetic modulation of HR. Such change in autonomic
activity is supported by cross-sectional research, where a
faster HRR was demonstrated in athletes than in non-ath-
letes, and these athletes had greater levels of parasympa-
thetic HR modulation as assessed by resting HRV [97, 98].
An increase in parasympathetic modulation in this context is
1480 C. R. Bellenger et al.
123
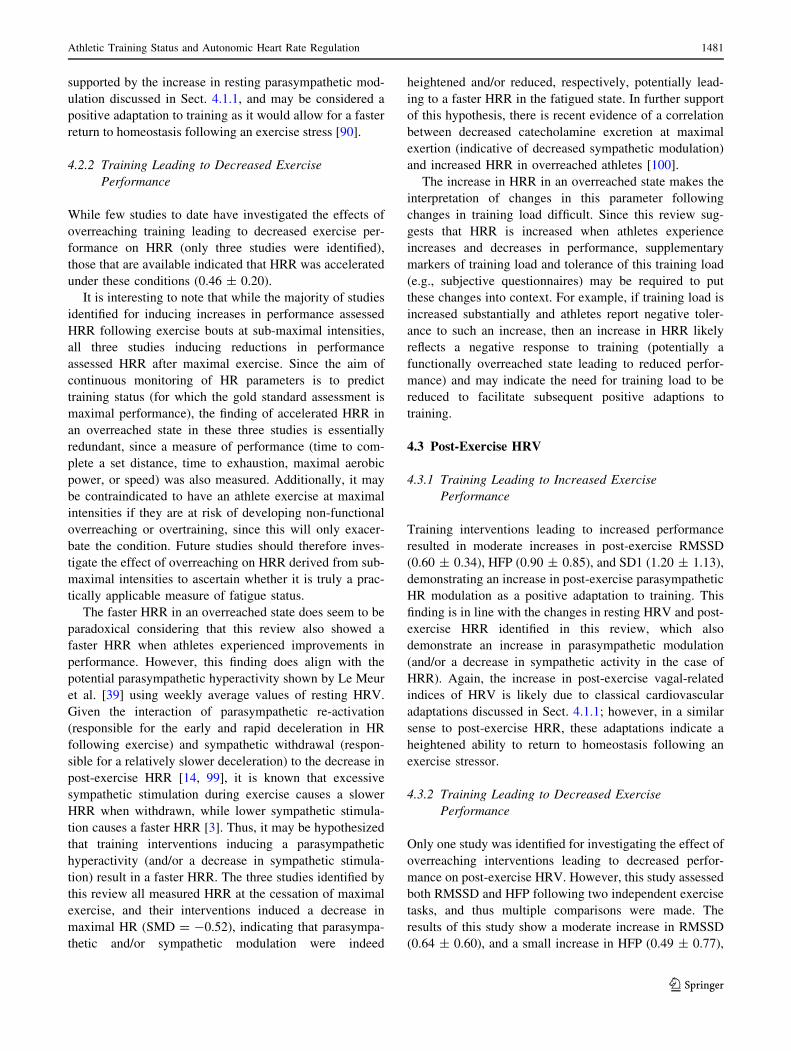
supported by the increase in resting parasympathetic mod-
ulation discussed in Sect. 4.1.1, and may be considered a
positive adaptation to training as it would allow for a faster
return to homeostasis following an exercise stress [90].
4.2.2 Training Leading to Decreased Exercise
Performance
While few studies to date have investigated the effects of
overreaching training leading to decreased exercise per-
formance on HRR (only three studies were identified),
those that are available indicated that HRR was accelerated
under these conditions (0.46 ± 0.20).
It is interesting to note that while the majority of studies
identified for inducing increases in performance assessed
HRR following exercise bouts at sub-maximal intensities,
all three studies inducing reductions in performance
assessed HRR after maximal exercise. Since the aim of
continuous monitoring of HR parameters is to predict
training status (for which the gold standard assessment is
maximal performance), the finding of accelerated HRR in
an overreached state in these three studies is essentially
redundant, since a measure of performance (time to com-
plete a set distance, time to exhaustion, maximal aerobic
power, or speed) was also measured. Additionally, it may
be contraindicated to have an athlete exercise at maximal
intensities if they are at risk of developing non-functional
overreaching or overtraining, since this will only exacer-
bate the condition. Future studies should therefore inves-
tigate the effect of overreaching on HRR derived from sub-
maximal intensities to ascertain whether it is truly a prac-
tically applicable measure of fatigue status.
The faster HRR in an overreached state does seem to be
paradoxical considering that this review also showed a
faster HRR when athletes experienced improvements in
performance. However, this finding does align with the
potential parasympathetic hyperactivity shown by Le Meur
et al. [39] using weekly average values of resting HRV.
Given the interaction of parasympathetic re-activation
(responsible for the early and rapid deceleration in HR
following exercise) and sympathetic withdrawal (respon-
sible for a relatively slower deceleration) to the decrease in
post-exercise HRR [14, 99], it is known that excessive
sympathetic stimulation during exercise causes a slower
HRR when withdrawn, while lower sympathetic stimula-
tion causes a faster HRR [3]. Thus, it may be hypothesized
that training interventions inducing a parasympathetic
hyperactivity (and/or a decrease in sympathetic stimula-
tion) result in a faster HRR. The three studies identified by
this review all measured HRR at the cessation of maximal
exercise, and their interventions induced a decrease in
maximal HR (SMD = -0.52), indicating that parasympa-
thetic and/or sympathetic modulation were indeed
heightened and/or reduced, respectively, potentially lead-
ing to a faster HRR in the fatigued state. In further support
of this hypothesis, there is recent evidence of a correlation
between decreased catecholamine excretion at maximal
exertion (indicative of decreased sympathetic modulation)
and increased HRR in overreached athletes [100].
The increase in HRR in an overreached state makes the
interpretation of changes in this parameter following
changes in training load difficult. Since this review sug-
gests that HRR is increased when athletes experience
increases and decreases in performance, supplementary
markers of training load and tolerance of this training load
(e.g., subjective questionnaires) may be required to put
these changes into context. For example, if training load is
increased substantially and athletes report negative toler-
ance to such an increase, then an increase in HRR likely
reflects a negative response to training (potentially a
functionally overreached state leading to reduced perfor-
mance) and may indicate the need for training load to be
reduced to facilitate subsequent positive adaptions to
training.
4.3 Post-Exercise HRV
4.3.1 Training Leading to Increased Exercise
Performance
Training interventions leading to increased performance
resulted in moderate increases in post-exercise RMSSD
(0.60 ± 0.34), HFP (0.90 ± 0.85), and SD1 (1.20 ± 1.13),
demonstrating an increase in post-exercise parasympathetic
HR modulation as a positive adaptation to training. This
finding is in line with the changes in resting HRV and post-
exercise HRR identified in this review, which also
demonstrate an increase in parasympathetic modulation
(and/or a decrease in sympathetic activity in the case of
HRR). Again, the increase in post-exercise vagal-related
indices of HRV is likely due to classical cardiovascular
adaptations discussed in Sect. 4.1.1; however, in a similar
sense to post-exercise HRR, these adaptations indicate a
heightened ability to return to homeostasis following an
exercise stressor.
4.3.2 Training Leading to Decreased Exercise
Performance
Only one study was identified for investigating the effect of
overreaching interventions leading to decreased perfor-
mance on post-exercise HRV. However, this study assessed
both RMSSD and HFP following two independent exercise
tasks, and thus multiple comparisons were made. The
results of this study show a moderate increase in RMSSD
(0.64 ± 0.60), and a small increase in HFP (0.49 ± 0.77),
Athletic Training Status and Autonomic Heart Rate Regulation 1481
123
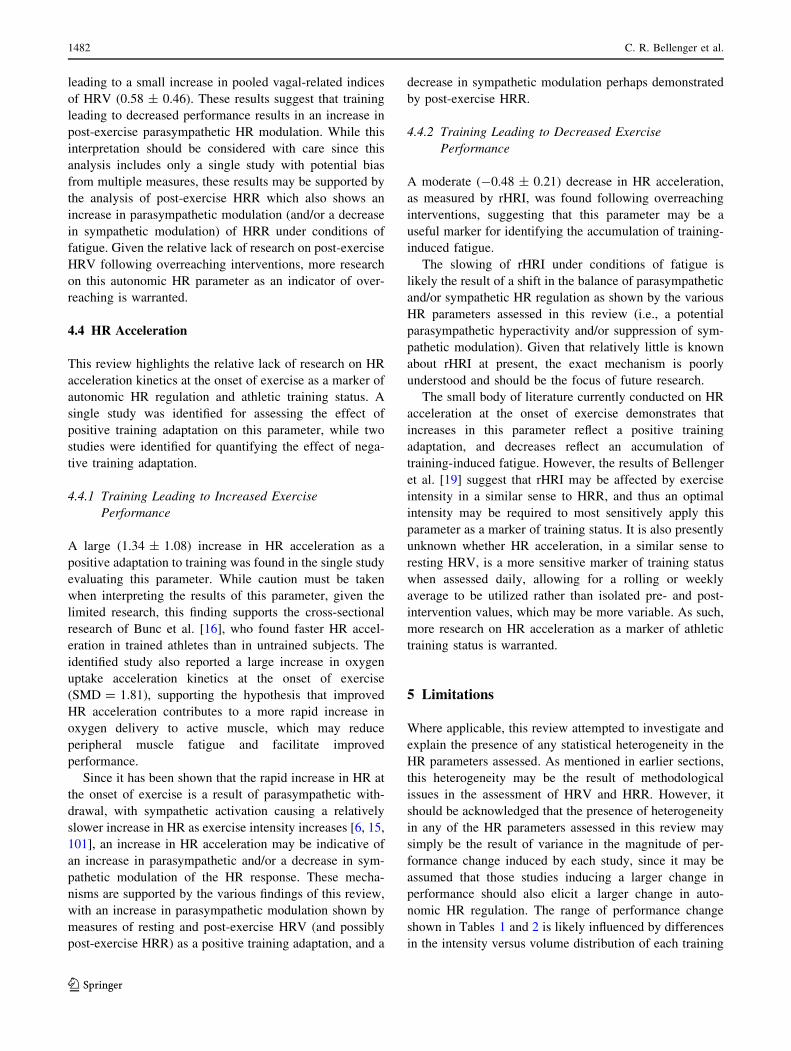
leading to a small increase in pooled vagal-related indices
of HRV (0.58 ± 0.46). These results suggest that training
leading to decreased performance results in an increase in
post-exercise parasympathetic HR modulation. While this
interpretation should be considered with care since this
analysis includes only a single study with potential bias
from multiple measures, these results may be supported by
the analysis of post-exercise HRR which also shows an
increase in parasympathetic modulation (and/or a decrease
in sympathetic modulation) of HRR under conditions of
fatigue. Given the relative lack of research on post-exercise
HRV following overreaching interventions, more research
on this autonomic HR parameter as an indicator of over-
reaching is warranted.
4.4 HR Acceleration
This review highlights the relative lack of research on HR
acceleration kinetics at the onset of exercise as a marker of
autonomic HR regulation and athletic training status. A
single study was identified for assessing the effect of
positive training adaptation on this parameter, while two
studies were identified for quantifying the effect of nega-
tive training adaptation.
4.4.1 Training Leading to Increased Exercise
Performance
A large (1.34 ± 1.08) increase in HR acceleration as a
positive adaptation to training was found in the single study
evaluating this parameter. While caution must be taken
when interpreting the results of this parameter, given the
limited research, this finding supports the cross-sectional
research of Bunc et al. [16], who found faster HR accel-
eration in trained athletes than in untrained subjects. The
identified study also reported a large increase in oxygen
uptake acceleration kinetics at the onset of exercise
(SMD = 1.81), supporting the hypothesis that improved
HR acceleration contributes to a more rapid increase in
oxygen delivery to active muscle, which may reduce
peripheral muscle fatigue and facilitate improved
performance.
Since it has been shown that the rapid increase in HR at
the onset of exercise is a result of parasympathetic with-
drawal, with sympathetic activation causing a relatively
slower increase in HR as exercise intensity increases [6, 15,
101], an increase in HR acceleration may be indicative of
an increase in parasympathetic and/or a decrease in sym-
pathetic modulation of the HR response. These mecha-
nisms are supported by the various findings of this review,
with an increase in parasympathetic modulation shown by
measures of resting and post-exercise HRV (and possibly
post-exercise HRR) as a positive training adaptation, and a
decrease in sympathetic modulation perhaps demonstrated
by post-exercise HRR.
4.4.2 Training Leading to Decreased Exercise
Performance
A moderate (-0.48 ± 0.21) decrease in HR acceleration,
as measured by rHRI, was found following overreaching
interventions, suggesting that this parameter may be a
useful marker for identifying the accumulation of training-
induced fatigue.
The slowing of rHRI under conditions of fatigue is
likely the result of a shift in the balance of parasympathetic
and/or sympathetic HR regulation as shown by the various
HR parameters assessed in this review (i.e., a potential
parasympathetic hyperactivity and/or suppression of sym-
pathetic modulation). Given that relatively little is known
about rHRI at present, the exact mechanism is poorly
understood and should be the focus of future research.
The small body of literature currently conducted on HR
acceleration at the onset of exercise demonstrates that
increases in this parameter reflect a positive training
adaptation, and decreases reflect an accumulation of
training-induced fatigue. However, the results of Bellenger
et al. [19] suggest that rHRI may be affected by exercise
intensity in a similar sense to HRR, and thus an optimal
intensity may be required to most sensitively apply this
parameter as a marker of training status. It is also presently
unknown whether HR acceleration, in a similar sense to
resting HRV, is a more sensitive marker of training status
when assessed daily, allowing for a rolling or weekly
average to be utilized rather than isolated pre- and post-
intervention values, which may be more variable. As such,
more research on HR acceleration as a marker of athletic
training status is warranted.
5 Limitations
Where applicable, this review attempted to investigate and
explain the presence of any statistical heterogeneity in the
HR parameters assessed. As mentioned in earlier sections,
this heterogeneity may be the result of methodological
issues in the assessment of HRV and HRR. However, it
should be acknowledged that the presence of heterogeneity
in any of the HR parameters assessed in this review may
simply be the result of variance in the magnitude of per-
formance change induced by each study, since it may be
assumed that those studies inducing a larger change in
performance should also elicit a larger change in auto-
nomic HR regulation. The range of performance change
shown in Tables 1 and 2 is likely influenced by differences
in the intensity versus volume distribution of each training
1482 C. R. Bellenger et al.
123
intervention, and the length of time that it was performed
for, in addition to the subtle differences in the caliber of
athletes utilized in these studies (i.e., recreational vs. elite).
This literature review may also be limited by the indi-
vidual studies identified failing to differentiate those ath-
letes who were truly overreached (i.e., experiencing a
decline in performance) from those that were only ‘acutely
fatigued’ (i.e., experiencing preserved performance but
with high levels of perceived fatigue) [102]. As a result of
inter-individual variability, not all athletes within a cohort
will necessarily become overreached by the end of a
training intervention. However, many studies reported the
mean effect of the intervention on performance but not the
number of individuals who experienced a meaningful
decline in performance. Thus, it was difficult to determine
whether the HR response in those athletes experiencing
acute fatigue differed from the response in those athletes
who were truly overreached. If it were indeed varied, this
response may attenuate the true effect of overreaching on
autonomic HR regulation, and decrease its sensitivity for
predicting athletic training status. Future overreaching
studies should therefore account for such inter-athlete
variability, potentially by performing sub-group analyses
on acutely fatigued and overreached athletes, excluding
acutely fatigued athletes from analyses (provided the
study’s aim was to investigate the effect of overreaching on
autonomic HR regulation), or at the very least reporting
how many athletes were truly overreached.
Additionally, this review could not accurately differen-
tiate between the training states of functional overreaching,
non-functional overreaching, or overtraining. From a
practical view, since a state of functional overreaching may
ultimately lead to super-compensatory performance adap-
tations, coaches and athletes would be utilizing parameters
of autonomic HR regulation to identify this state of training
before training-induced fatigue gives way to non-func-
tional overreaching or overtraining, as these states may
result in longer-term attenuation of performance. However,
since this review could not differentiate between these
training states, it is difficult to determine whether the HR
response in athletes experiencing functional overreaching
differs from that of athletes who are experiencing non-
functional overreaching or overtraining. Again, this may
attenuate the true effect of functional overreaching on
autonomic HR regulation and decrease its sensitivity for
predicting athletic training status.
6 Conclusion
This review sought to examine the effect of training
interventions inducing positive and negative adaptations to
training, as characterized by improvements and decrements
in exercise performance respectively, on measures of
autonomic HR regulation.
With regard to interventions inducing improvements in
performance, concurrent increases in measures of resting
HRV, post-exercise HRV, post-exercise HRR, and HR
acceleration were found. These increases were likely the
result of increases in parasympathetic HR modulation (and/
or decreases in sympathetic modulation in the case of post-
exercise HRR and HR acceleration) facilitated by positive
adaptations to athletic training.
Studies leading to reductions in performance suggested
that overreaching had little effect on resting HRV, as there
appears to be disagreement in the direction of change in
vagal-related indices of HRV. This disagreement may be
the result of methodological issues that should be inves-
tigated further, namely the effect of utilizing isolated
values compared with weekly/rolling average values, and
also the impact of posture and recording time of day.
Additionally, this review highlights that increases in post-
exercise HRR occur in association with both increases and
decreases in exercise performance, which makes the use of
post-exercise HRR as an isolated marker of athletic
training status difficult. Consequently, additional moni-
toring variables, such as quantification of total training
load and the rate at which that training load is applied, in
addition to the athlete’s subjective perception of training
tolerance, may be required to contextualize changes in
HRR. Surprisingly, only one study investigated the effect
of overreaching training on post-exercise HRV, and again
found an increase in this marker, also making its inter-
pretation in isolation difficult. Limited studies have
investigated the effect of training on HR acceleration, and
thus more research is required. However, this review
shows a decrease in this HR acceleration in response to
overreaching training, and thus it may be a potential
indicator of training-induced fatigue.
Compliance with Ethical Standards
Funding No sources of funding were used to assist in the prepa-
ration of this review. Rebecca Thomson, Eileen Robertson, and
Jonathan Buckley are the recipients of a recent Australian Research
Council Linkage grant (LP140101013) that was awarded to investi-
gate the potential for the HR acceleration parameter (maximal rate of
HR increase) referred to in this review to track how athletes are
tolerating changes in training load. This grant does not relate to the
work described in the current manuscript, but is for future work.
Conflicts of interest Clint Bellenger, Joel Fuller, Rebecca Thom-
son, Kade Davison, and Eileen Robertson declare that they have no
conflicts of interest relevant to the content of this review. Jonathan
Buckley invented the HR acceleration parameter (maximal rate of HR
increase) referred to in this review, and the parameter is patented by
the University of South Australia. The University of South Australia
is seeking to license the technology for commercial gain, and Jona-
than Buckley may benefit financially from any such license.
Athletic Training Status and Autonomic Heart Rate Regulation 1483
123
References
1. Buchheit M, Simpson M, Al Haddad H, et al. Monitoring
changes in physical performance with heart rate measures in
young soccer players. Eur J Appl Physiol. 2012;112:711–23.
2. Borresen J, Lambert MI. The quantification of training load, the
training response and the effect on performance. Sports Med.
2009;39:779–95.
3. Borresen J, Lambert MI. Autonomic control of heart rate during
and after exercise: measurements and implications for moni-
toring training status. Sports Med. 2008;38:633–46.
4. Meeusen R, Duclos M, Foster C, et al. Prevention, diagnosis,
and treatment of the overtraining syndrome: Joint Consensus
Statement of the European College of Sport Science and the
American College of Sports Medicine. Med Sci Sports Exerc.
2013;45:186–205.
5. Aubert AE, Seps B, Beckers F. Heart rate variability in athletes.
Sports Med. 2003;33:889–919.
6. Robinson BF, Epstein SE, Beiser GD, et al. Control of heart rate
by the autonomic nervous system: Studies in man on the inter-
relation between baroreceptor mechanisms and exercise. Circ
Res. 1966;19:400–11.
7. Pichot V, Busso T, Roche F, et al. Autonomic adaptations to
intensive and overload training periods: a laboratory study. Med
Sci Sports Exerc. 2002;34:1660–6.
8. Pichot V, Roche F, Gaspoz J, et al. Relation between heart rate
variability and training load in middle-distance runners. Med Sci
Sports Exerc. 2000;32:1729–36.
9. Bosquet L, Merkari S, Arvisais D, et al. Is heart rate a conve-
nient tool to monitor over- reaching? A systematic review of the
literature. Br J Sports Med. 2008;42:709–14.
10. Malik M, Bigger JT, Camm AJ, et al. Heart rate variability:
standards of measurement, physiological interpretation, and
clinical use. Eur Heart J. 1996;17:354–81.
11. Malpas SC. Neural influences on cardiovascular variability:
possibilities and pitfalls. Am J Physiol Heart Circ Physiol.
2002;51:H6–20.
12. Borresen J, Lambert MI. Changes in heart rate recovery in
response to acute changes in training load. Eur J Appl Physiol.
2007;101:503–11.
13. Imai K, Sato H, Hori M, et al. Vagally mediated heart rate
recovery after exercise is accelerated in athletes but blunted in
patients with chronic heart failure. J Am Coll Cardiol.
1994;24:1529–35.
14. Kannankeril PJ, Le FK, Kadish AH, et al. Parasympathetic
effects on heart rate recovery after exercise. J Invest Med.
2004;52:394–401.
15. Victor RG, Seals DR, Mark AL. Differential control of heart rate
and sympathetic nerve activity during dynamic exercise: insight
from intraneural recordings in humans. J Clin Invest.
1987;79:508–16.
16. Bunc V, Heller J, Leso J. Kinetics of heart rate responses to
exercise. J Sports Sci. 1988;6:39–48.
17. Amann M, Calbet JA. Convective oxygen transport and fatigue.
J Appl Physiol. 2008;104:861–70.
18. Nelson MJ, Thomson RL, Rogers DK, et al. Maximal rate of
increase in heart rate during the rest-exercise transition tracks
reductions in exercise performance when training load is
increased. J Sci Med Sport. 2014;17:129–33.
19. Bellenger CR, Thomson RL, Howe PRC, et al. Monitoring
athletic training status using the maximal rate of heart rate
increase. J Sci Med Sport. doi:10.1016/j.jsams.2015.07.006
[Epub ahead of print].20. Thomson RL, Rogers DK, Howe PRC, et al. Effect of acute
exercise-induced fatigue on maximal rate of heart rate increase
during submaximal cycling. Res Sports Med. 2015. doi:10.1080/
15438627.2015.1076414.
21. Moher D, Liberati A, Tetzlaff J, et al. Preferred reporting items
for systematic reviews and meta-analyses: the PRISMA state-
ment. BMJ. 2009;339:332–6.
22. Halson SL, Jeukendrup AE. Does overtraining exist? An anal-
ysis of overreaching and overtraining research. Sports Med.
2004;34:967–81.
23. Urhausen A, Kindermann W. Diagnosis of overtraining: what
tools do we have? Sports Med. 2002;32:95–102.
24. Higgins JPT, Altman DG, Gøtzsche PC, et al. The Cochrane
Collaboration’s tool for assessing risk of bias in randomised
trials. BMJ. 2011;343:889.
25. Cohen J. Statistical power analysis for the behavioral sciences.
Hillsdale: Sage Publications; 2010.
26. Elbourne DR, Altman DG, Higgins JP, et al. Meta-analyses
involving cross-over trials: methodological issues. Int J Epi-
demiol. 2002;31:140–9.
27. Higgins JPT. Measuring inconsistency in meta-analyses. BMJ.
2003;327:557–60.
28. Buchheit M. Monitoring training status with HR measures: do
all roads lead to Rome? Front Physiol. 2014;5:73.
29. Plews D, Laursen P, Stanley J, et al. Training adaptation and
heart rate variability in elite endurance athletes: opening the
door to effective monitoring. Sports Med. 2013;43:773–81.
30. Boullosa DA, Abreu L, Nakamura FY, et al. Cardiac autonomic
adaptations in elite Spanish soccer players during preseason. Int
J Sports Physiol Perform. 2013;8:400–9.
31. Buchheit M, Chivot A, Parouty J, et al. Monitoring endurance
running performance using cardiac parasympathetic function.
Eur J Appl Physiol. 2010;108:1153–67.
32. Carter JB, Banister EW, Blaber AP. The effect of age and
gender on heart rate variability after endurance training. Med
Sci Sports Exerc. 2003;35:1333–40.
33. Hedelin R, Wiklund U, Bjerle P, et al. Pre and post-season heart
rate variability in adolescent cross-country skiers. Scand J Med
Sci Sports. 2000;10:298–303.
34. Hedelin R, Kentta G, Wiklund U, et al. Short-term overtraining:
effects on performance, circulatory responses, and heart rate
variability. Med Sci Sports Exerc. 2000;32:1480–4.
35. Kiviniemi A, Hautala A, Kinnunen H, et al. Endurance training
guided individually by daily heart rate variability measurements.
Eur J Appl Physiol. 2007;101:743–51.
36. Wallace LK, Slattery KM, Coutts AJ. A comparison of methods
for quantifying training load: relationships between modelled
and actual training responses. Eur J Appl Physiol.
2014;114:11–20.
37. Lamberts R, Swart J, Noakes T, et al. Changes in heart rate
recovery after high-intensity training in well-trained cyclists.
Eur J Appl Physiol. 2009;105:705–13.
38. Buchheit M, Millet GP, Parisy A, et al. Supramaximal training
and postexercise parasympathetic reactivation in adolescents.
Med Sci Sports Exerc. 2008;40:362–71.
39. Le Meur Y, Pichon A, Schaal K, et al. Evidence of parasym-
pathetic hyperactivity in functionally overreached athletes. Med
Sci Sports Exerc. 2013;45:2061.
40. Chalencon S, Busso T, Lacour J-R, et al. A model for the
training effects in swimming demonstrates a strong relationship
between parasympathetic activity, performance and index of
fatigue. PLoS One. 2012;7:1–10.
41. Dupuy O, Bherer L, Audiffren M, et al. Night and postexercise
cardiac autonomic control in functional overreaching. Appl
Physiol Nutr Metab. 2013;38:200.
42. Garet M, Tournaire N, Roche F, et al. Individual interdepen-
dence between nocturnal ANS activity and performance in
swimmers. Med Sci Sports Exerc. 2004;36:2112–8.
1484 C. R. Bellenger et al.
123
43. Bosquet L, Papelier Y, Leger L, et al. Night heart rate variability
during overtraining in male endurance athletes. J Sports Med
Phys Fitness. 2003;43:506–12.
44. Baumert M, Brechtel L, Lock J, et al. Heart rate variability,
blood pressure variability, and baroreflex sensitivity in over-
trained athletes. Clin J Sport Med. 2006;16:412–7.
45. Capostagno B, Lambert MI, Lamberts RP. Standardized versus
customized high-intensity training: effects on cycling perfor-
mance. Int J Sports Physiol Perform. 2014;9:292–301.
46. Da Silva DF, Verri SM, Nakamura FY, et al. Longitudinal
changes in cardiac autonomic function and aerobic fitness
indices in endurance runners: a case study with a high-level
team. Eur J Sport Sci. 2014;14:443–51.
47. Oliveira RS, Leicht AS, Bishop D, et al. Seasonal changes in
physical performance and heart rate variability in high level
futsal players. Int J Sports Med. 2013;34:424–30.
48. Vesterinen V, Hakkinen K, Hynynen E, et al. Heart rate vari-
ability in prediction of individual adaptation to endurance
training in recreational endurance runners. Scand J Med Sci
Sports. 2013;23:171–80.
49. Buchheit M, Racinais S, Bilsborough JC, et al. Monitoring fit-
ness, fatigue and running performance during a pre-season
training camp in elite football players. J Sci Med Sport.
2013;16:550–5.
50. Buchheit M, Simpson BM, Garvican-Lewis LA, et al. Wellness,
fatigue and physical performance acclimatisation to a 2-week
soccer camp at 3600 m (ISA3600). Br J Sports Med.
2013;47(Suppl 1):i100–6.
51. Laffite LP, Mille-Hamard L, Koralsztein JP, et al. The effects of
interval training on oxygen pulse and performance in supra-
threshold runs. Arch Physiol Biochem. 2003;111:202–10.
52. Buchheit M, Voss SC, Nybo L, et al. Physiological and per-
formance adaptations to an in-season soccer camp in the heat:
Associations with heart rate and heart rate variability. Scand J
Med Sci Sports. 2011;21:e477–85.
53. Thomson RL, Bellenger CR, Howe PRC, et al. Improved heart
rate recovery despite reduced exercise performance following
heavy training: a within-subject analysis. J Sci Med Sport. 2015.
doi:10.1016/j.jsams.2015.02.010.
54. Heydari M, Boutcher YN, Boutcher SH. High-intensity inter-
mittent exercise and cardiovascular and autonomic function.
Clin Auton Res. 2013;23:57–65.
55. Mourot L, Bouhaddi M, Perrey S, et al. Decrease in heart rate
variability with overtraining: assessment by the Poincare plot
analysis. Clin Physiol Funct Imaging. 2004;24:10–8.
56. Kiviniemi AM, Hautala AJ, Kinnunen H, et al. Daily exercise
prescription on the basis of HR variability among men and
women. Med Sci Sports Exerc. 2010;42:1355–63.
57. Hautala AJ, Makikallio TH, Kiviniemi A, et al. Heart rate
dynamics after controlled training followed by a home-based
exercise program. Eur J Appl Physiol. 2004;92:289–97.
58. Gamelin FX, Berthoin S, Sayah H, et al. Effect of training and
detraining on heart rate variability in healthy young men. Int J
Sports Med. 2007;28:564–70.
59. Tian Y, He ZH, Zhao JX, et al. Heart rate variability threshold
values for early-warning nonfunctional overreaching in elite
female wrestlers. J Strength Cond Res. 2013;27:1511–9.
60. Sartor F, Vailati E, Valsecchi V, et al. Heart rate variability
reflects training load and psychophysiological status in young
elite gymnasts. J Strength Cond Res. 2013;27:2782–90.
61. Houmard JA, Kirwan JP, Flynn MG, et al. Effects of reduced
training on submaximal and maximal running responses. Int J
Sports Med. 1989;10:30–3.
62. Atlaoui D, Pichot V, Lacoste L, et al. Heart rate variability,
training variation and performance in elite swimmers. Int J
Sports Med. 2007;28:394–400.
63. Botek M, McKune AJ, Krejci J, et al. Change in performance in
response to training load adjustment based on autonomic
activity. Int J Sports Med. 2014;35:482–8.
64. Iellamo F, Pigozzi F, Spataro A, et al. Autonomic and psycho-
logical adaptations in Olympic rowers. J Sports Med Phys Fit-
ness. 2006;46:598–604.
65. Iellamo F, Legramante JM, Pigozzi F, et al. Conversion from
vagal to sympathetic predominance with strenuous training in
high-performance world class athletes. Circulation.
2002;105:2719–24.
66. Cornolo J, Fouillot J-P, Schmitt L, et al. Interactions between
exposure to hypoxia and the training-induced autonomic adap-
tations in a ‘‘live high–train low’’ session. Eur J Appl Physiol.
2006;96:389–96.
67. Plews DJ, Laursen PB, Kilding AE, et al. Heart-rate variability
and training-intensity distribution in elite rowers. Int J Sports
Physiol Perform. 2014;9:1026–32.
68. Binnie MJ, Dawson B, Arnot MA, et al. Effect of sand versus
grass training surfaces during an 8-week pre-season condition-
ing programme in team sport athletes. J Sports Sci.
2014;32:1001–12.
69. Boushel R, Ara I, Gnaiger E, et al. Low-intensity training
increases peak arm VO2 by enhancing both convective and
diffusive O2 delivery. Acta Physiol. 2014;211:122–34.
70. Buchheit M, Rabbani A. The 30–15 Intermittent Fitness Test
versus the Yo–Yo Intermittent Recovery Test Level 1: rela-
tionship and sensitivity to training. Int J Sports Physiol Perform.
2014;9:522–4.
71. Buchheit M, Morgan W, Wallace J, et al. Physiological, psy-
chometric, and performance effects of the Christmas break in
Australian football. Int J Sports Physiol Perform.
2015;10:120–3.
72. Castagna C, Impellizzeri FM, Chaouachi A, et al. Preseason
variations in aerobic fitness and performance in elite-standard
soccer players: a team study. J Strength Cond Res.
2013;27:2959–65.
73. Diaz Gomez MM, Bocanegra Jaramillo OL, Teixeira RR, et al.
Salivary surrogates of plasma nitrite and catecholamines during
a 21-week training season in swimmers. PLoS One.
2013;8:e64043.
74. Faude O, Steffen A, Kellmann M, et al. The effect of short-term
interval training during the competitive season on physical fit-
ness and signs of fatigue: a crossover trial in high-level youth
football players. Int J Sports Physiol Perform. 2014;9:936–44.
75. Gunnarsson TP, Christensen PM, Thomassen M, et al. Effect of
intensified training on muscle ion kinetics, fatigue development,
and repeated short-term performance in endurance-trained
cyclists. Am J Physiol Regul Integr Comp Physiol.
2013;305:R811–21.
76. Kennedy MD, Tamminen KA, Holt NL. Factors that influence
fatigue status in Canadian university swimmers. J Sports Sci.
2013;31:554–64.
77. Manzi V, Bovenzi A, Franco Impellizzeri M, et al. Individual
training-load and aerobic-fitness variables in premiership soccer
players during the precompetitive season. J Strength Cond Res.
2013;27:631–6.
78. Racinais S, Buchheit M, Bilsborough J, et al. Physiological and
performance responses to a training camp in the heat in pro-
fessional Australian football players. Int J Sports Physiol Per-
form. 2014;9:598–603.
79. Laursen PB, Blanchard MA, Jenkins DG. Acute high-intensity
interval training improves Tvent and peak power output in
highly trained males. Can J Appl Physiol. 2002;27:336–48.
80. Achten J, Halson SL, Moseley L, et al. Higher dietary carbo-
hydrate content during intensified running training results in
Athletic Training Status and Autonomic Heart Rate Regulation 1485
123
better maintenance of performance and mood state. J Appl
Physiol. 2004;96:1331–40.
81. Neal CM, Hunter AM, Galloway SDR. A 6-month analysis of
training-intensity distribution and physiological adaptation in
Ironman triathletes. J Sports Sci. 2011;29:1515–23.
82. Plews D, Laursen P, Kilding A, et al. Heart rate variability in
elite triathletes, is variation in variability the key to effective
training? A case comparison. J Appl Physiol.
2012;112:3729–41.
83. Dupuy O, Lussier M, Fraser S, et al. Effect of overreaching on
cognitive performance and related cardiac autonomic control.
Scand J Med Sci Sports. 2014;24:234–42.
84. Lamberts RP, Swart J, Capostagno B, et al. Heart rate recovery
as a guide to monitor fatigue and predict changes in performance
parameters. Scand J Med Sci Sports. 2010;20:449–57.
85. Baumert M, Brechtel L, Lock J, et al. Changes in heart rate
variability of athletes during a training camp. Biomed Tech.
2006;51:201–4.
86. Plews DJ, Laursen PB, Kilding AE, et al. Evaluating training
adaptation with heart-rate measures: a methodological compar-
ison. Int J Sports Physiol Perform. 2013;8:688.
87. Hug B, Heyer L, Naef N, et al. Tapering for marathon and
cardiac autonomic function. Int J Sports Med. 2014;35:676–83.
88. Al Haddad H, Laursen P, Chollet D, et al. Reliability of resting
and postexercise heart rate measures. Int J Sports Med.
2011;32:598–605.
89. Brown TE, Beightol LA, Koh J, et al. Important influence of
respiration on human R–R interval power spectra is largely
ignored. J Appl Physiol. 1993;75:2310–7.
90. Kenney WL. Physiology of sport and exercise. In: Wilmore JH,
editor. 5th ed. Champaign: Human Kinetics; 2012.
91. Fagard R, Aubert A, Lysens R, et al. Noninvasive assessment of
seasonal variations in cardiac structure and function in cyclists.
Circulation. 1983;67:896.
92. Dishman RK, Nakamura Y, Garcia ME, et al. Heart rate vari-
ability, trait anxiety, and perceived stress among physically fit
men and women. Int J Psychophysiol. 2000;37:121–33.
93. Kristal-Boneh E, Froom P, Harari G, et al. Summer–winter
differences in 24 h variability of heart rate. J Cardiovasc Risk.
2000;7:141–6.
94. Mourot L, Bouhaddi M, Tordi N, et al. Short and long-term
effects of a single bout of exercise on heart rate variability:
comparison between constant and interval training exercises.
Eur J Appl Physiol. 2004;92:508–17.
95. Achten J, Jeukendrup AE. Heart rate monitoring: applications
and limitations. Sports Med. 2003;33:517–38.
96. Lamberts RP, Lambert MI. Day-to-day variation in heart rate at
different levels of submaximal exertion: implications for mon-
itoring training. J Strength Cond Res. 2009;23:1005–10.
97. Du N, Bai S, Oguri K, et al. Heart rate recovery after exercise
and neural regulation Of heart rate variability in 30–40 year old
female marathon runners. J Sport Sci Med. 2005;4:9.
98. Danieli A, Lusa L, Potocnik N, et al. Resting heart rate vari-
ability and heart rate recovery after submaximal exercise. Clin
Auton Res. 2014;24:53–61.
99. Pierpont GL, Voth EJ. Assessing autonomic function by analysis
of heart rate recovery from exercise in healthy subjects. Am J
Cardiol. 2004;94:64–8.
100. Aubry A, Hausswirth C, Louis J, et al. The development of
functional overreaching is associated with a faster heart rate
recovery in endurance athletes. PLoS One.
2015;10(10):e0139754. doi:10.1371/journal.pone.0139754.
101. Rowell LB, O’Leary DS. Reflex control of the circulation during
exercise: chemoreflexes and mechanoreflexes. J Appl Physiol.
1990;69:407–18.
102. Le Meur Y, Louis J, Aubry A, et al. Maximal exercise limitation
in functionally overreached triathletes: role of cardiac adrener-
gic stimulation. J Appl Physiol. 2014;117(3):214–22.
1486 C. R. Bellenger et al.
123