Embed Size (px)
Citation preview
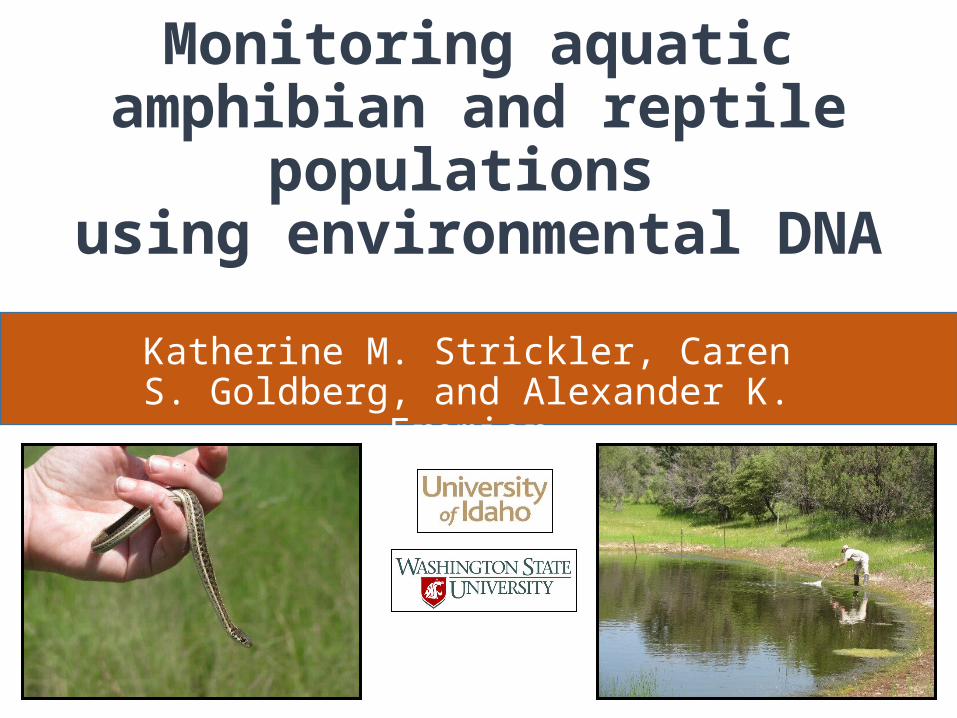
Monitoring aquatic amphibian and reptile
populations using environmental DNA
Katherine M. Strickler, Caren S. Goldberg, and Alexander K. Fremier
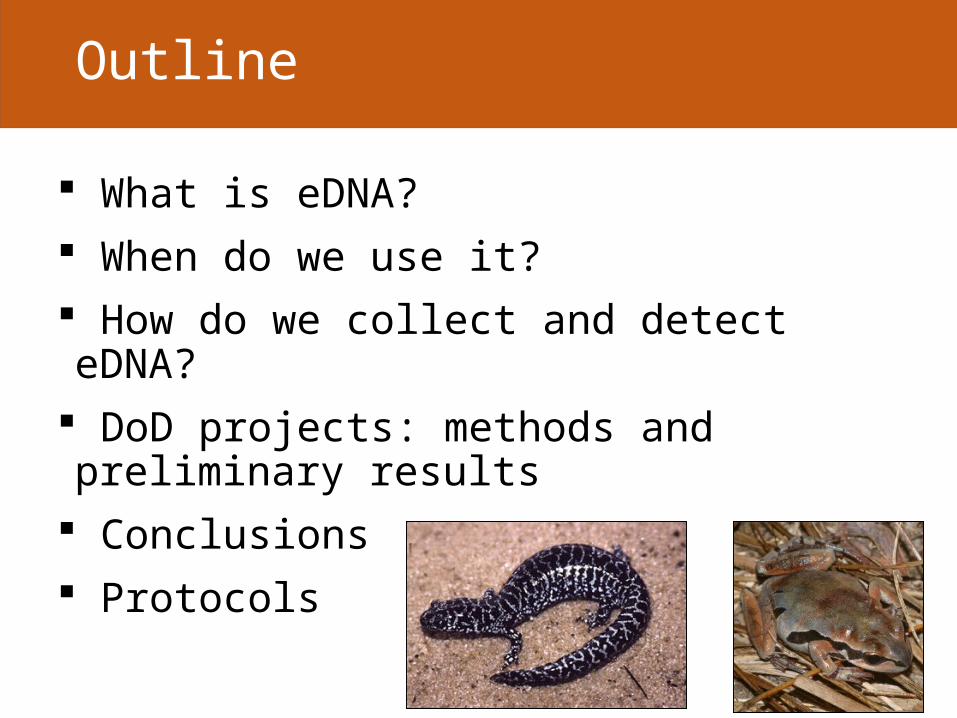
Outline
What is eDNA? When do we use it? How do we collect and detect eDNA? DoD projects: methods and preliminary results Conclusions Protocols
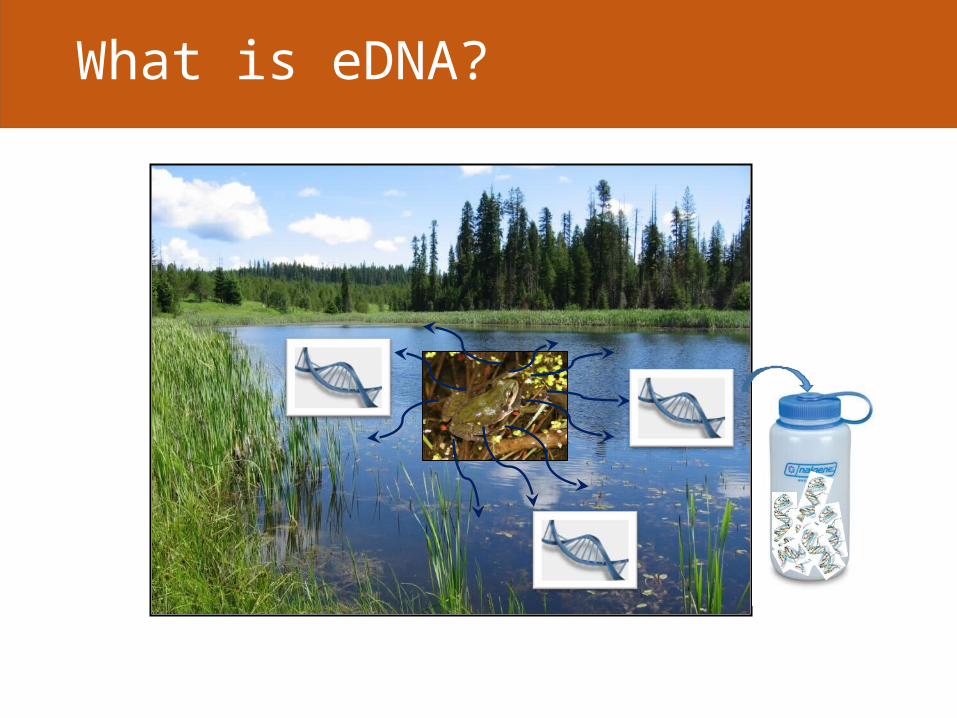
What is eDNA?
UV
endonucleases/ exonucleases
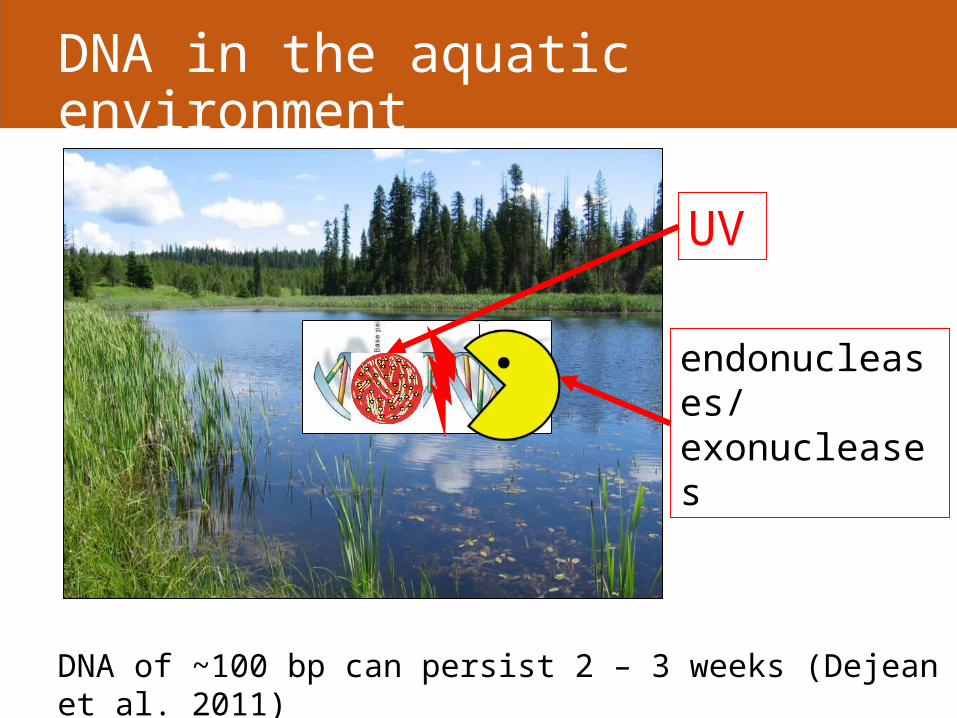
DNA in the aquatic environment
DNA of ~100 bp can persist 2 – 3 weeks (Dejean et al. 2011)
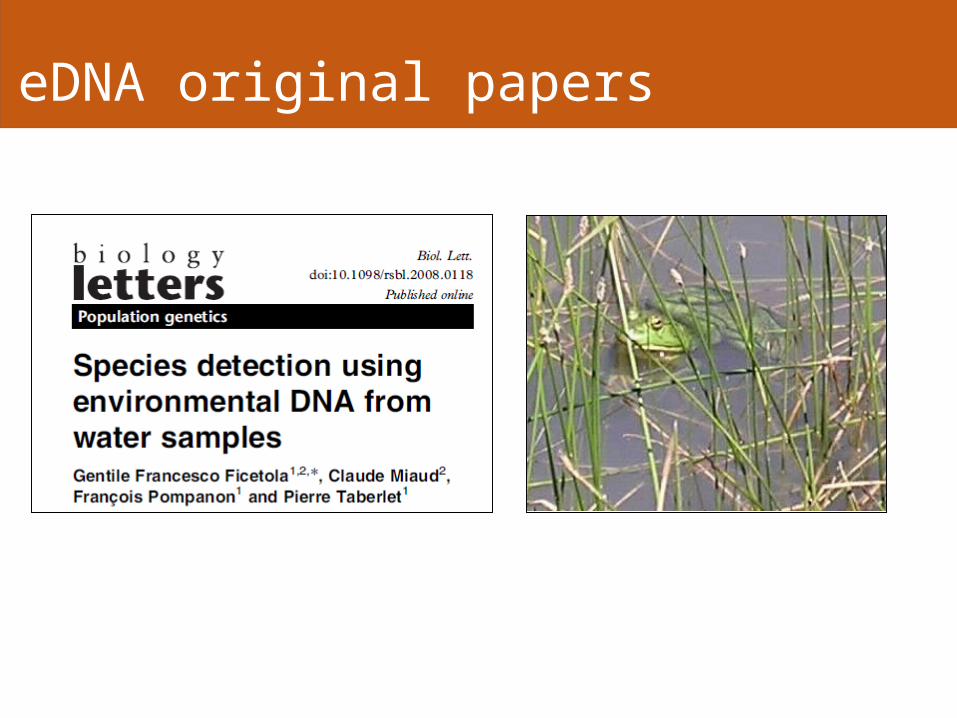
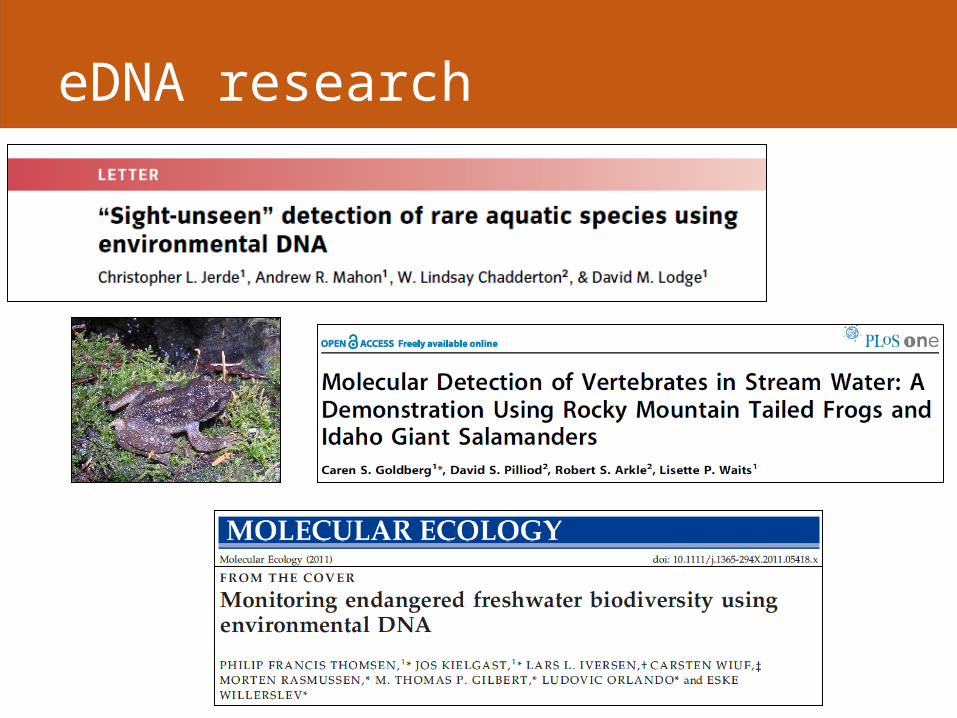
eDNA original papers
Field surveys eDNA surveys
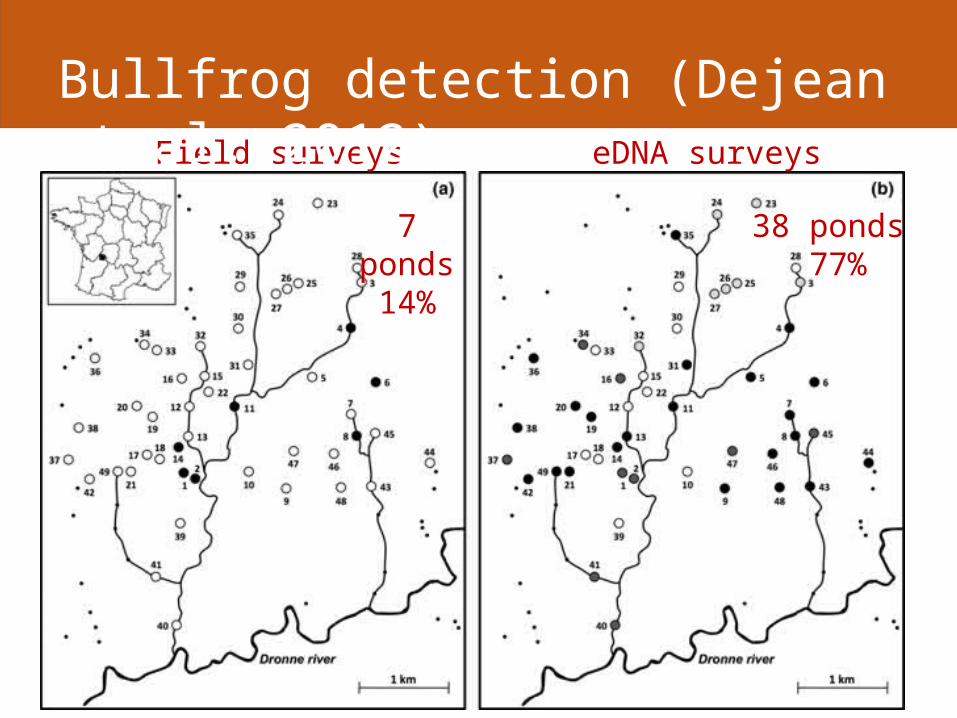
7 ponds14%
38 ponds 77%
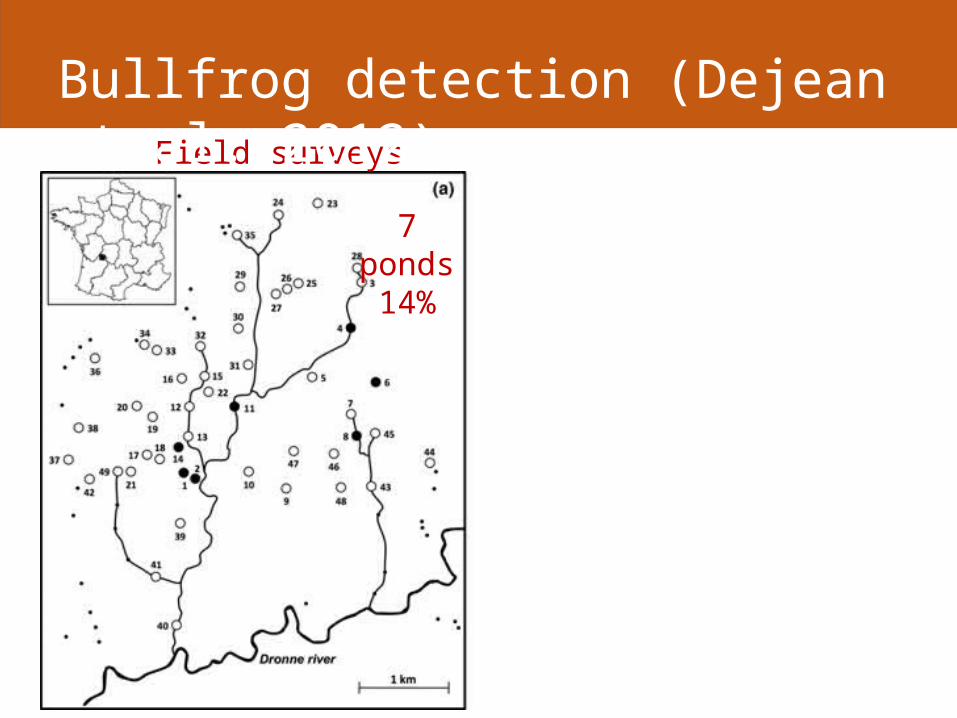
Bullfrog detection (Dejean et al. 2012)
Field surveys eDNA surveys
7 ponds14%
38 ponds 77%
Bullfrog detection (Dejean et al. 2012)
eDNA research
eDNA research
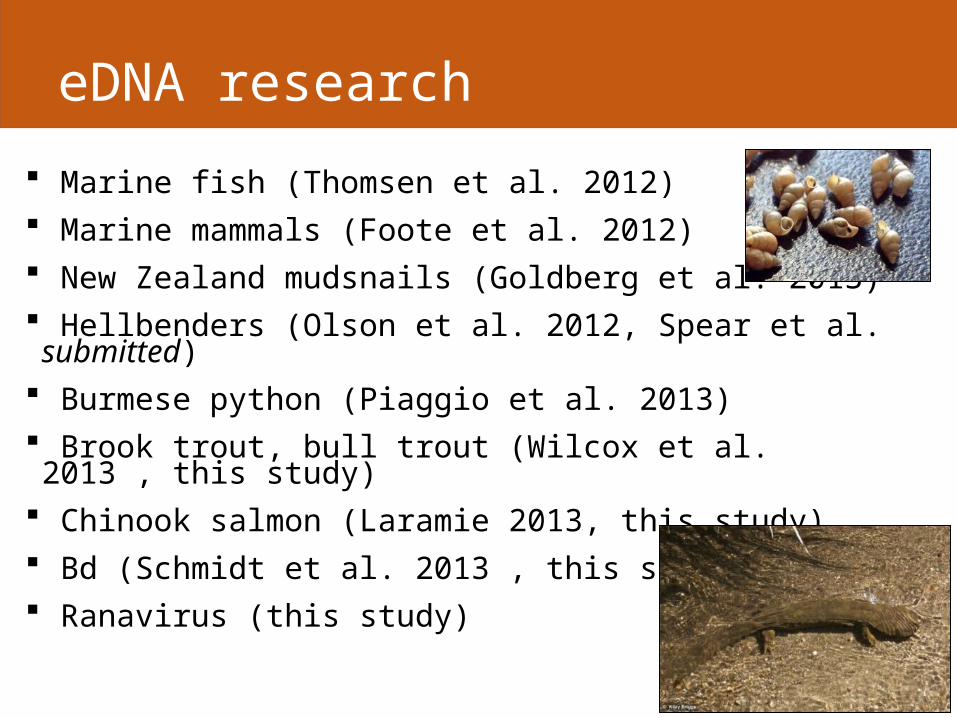
Marine fish (Thomsen et al. 2012) Marine mammals (Foote et al. 2012) New Zealand mudsnails (Goldberg et al. 2013) Hellbenders (Olson et al. 2012, Spear et al. submitted) Burmese python (Piaggio et al. 2013) Brook trout, bull trout (Wilcox et al. 2013 , this study) Chinook salmon (Laramie 2013, this study) Bd (Schmidt et al. 2013 , this study) Ranavirus (this study)
Advantages of eDNA
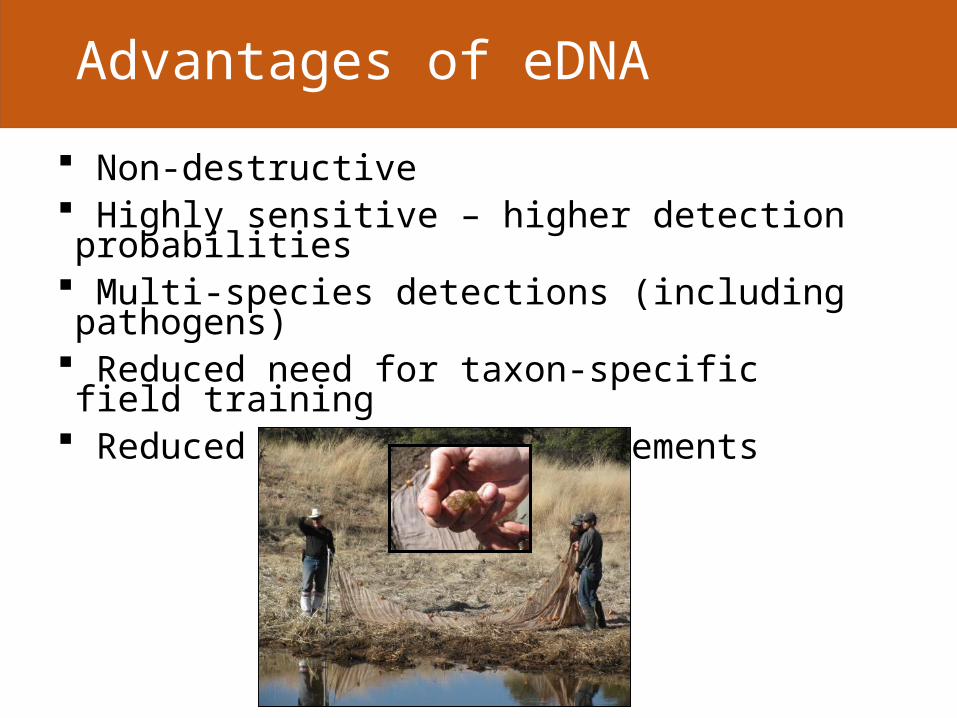
Non-destructive Highly sensitive – higher detection probabilities Multi-species detections (including pathogens) Reduced need for taxon-specific field training Reduced permitting requirements
When do we use eDNA?
Under what circumstances is eDNA sampling more efficient than standard field surveys?
‒ Likely will differ by species and system
When do we use eDNA?
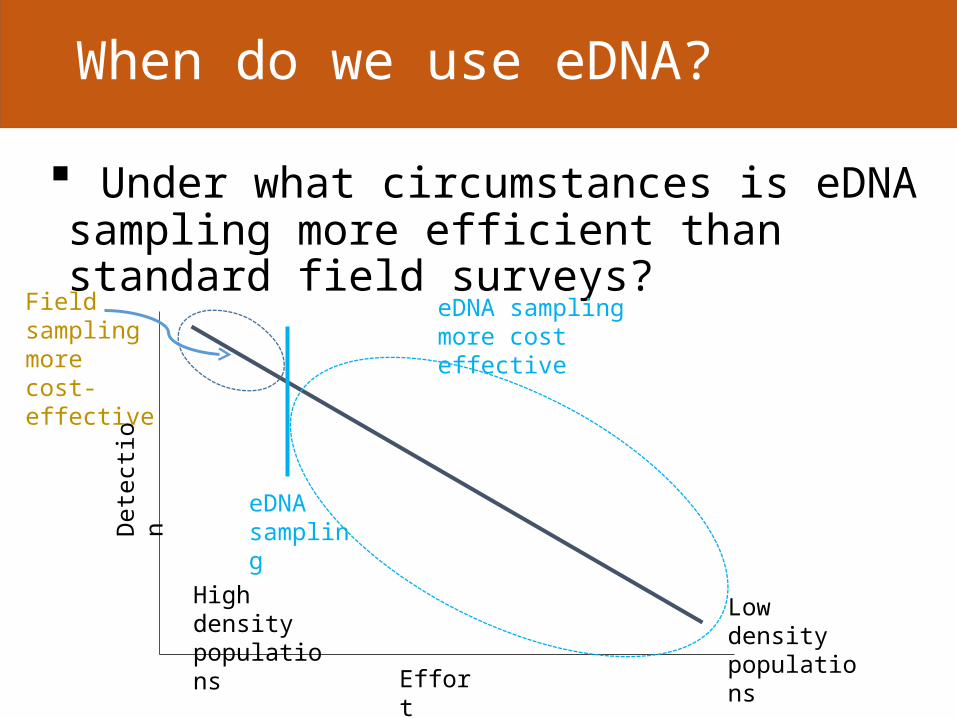
Under what circumstances is eDNA sampling more efficient than standard field surveys?
Effort
Det
ectio
n
High density populations
Low density populations
eDNA sampling
Field sampling more cost-effective
eDNA samplingmore cost effective
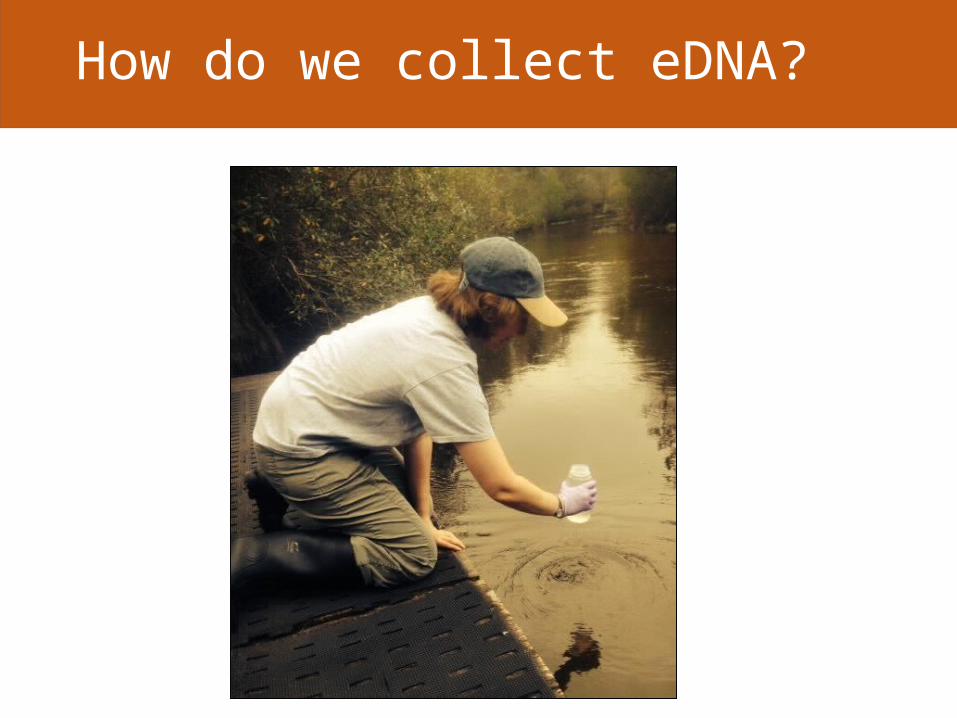
How do we collect eDNA?
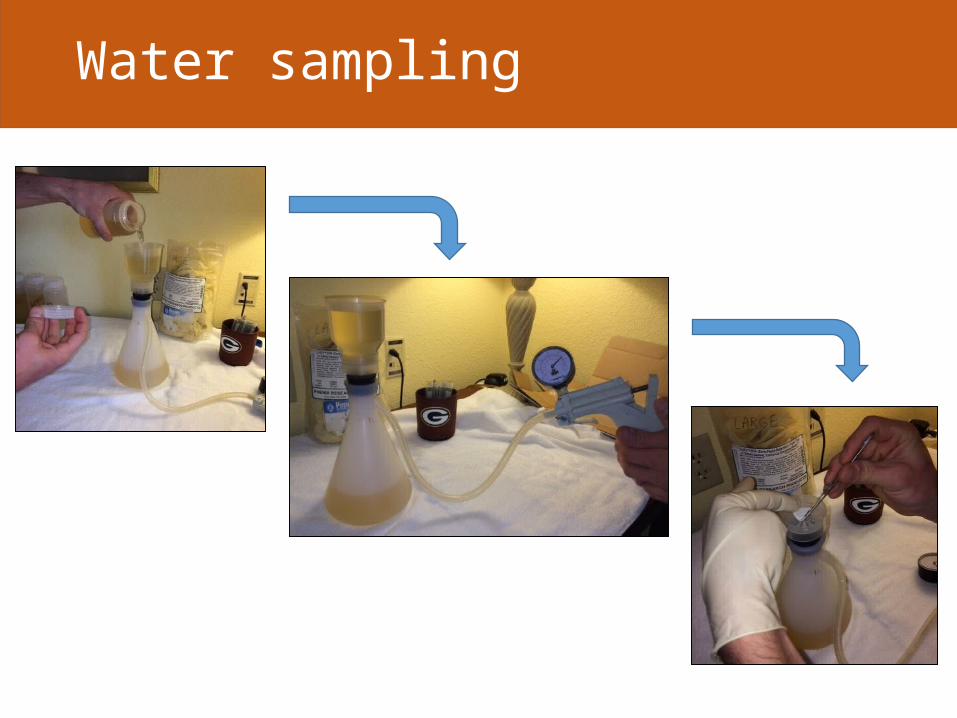
Water sampling
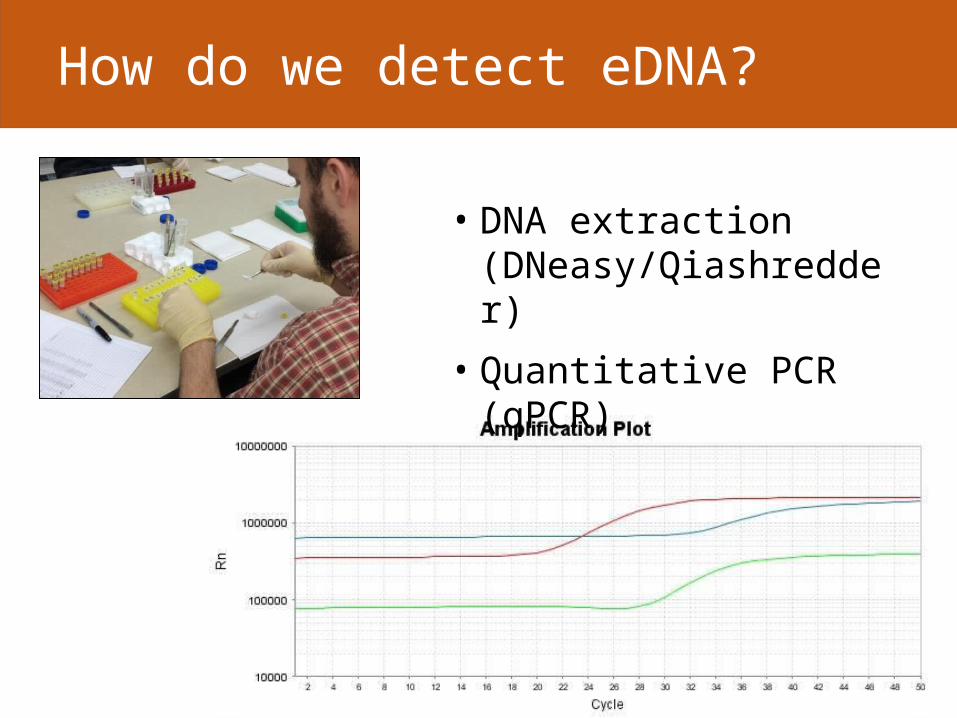
How do we detect eDNA?
• DNA extraction (DNeasy/Qiashredder)
• Quantitative PCR (qPCR)
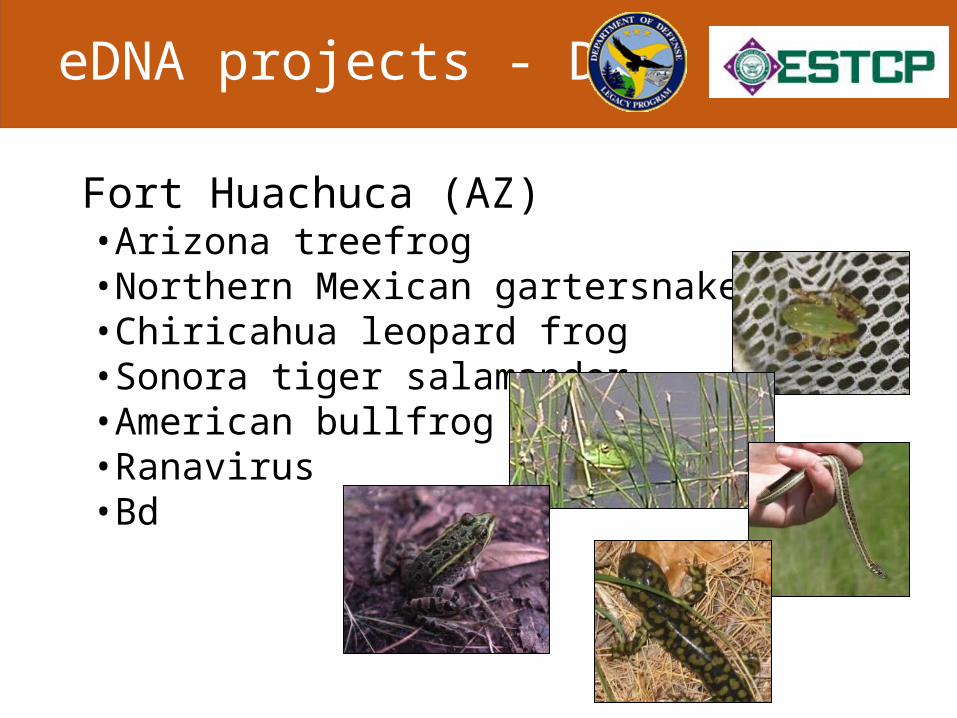
eDNA projects - DoD
Fort Huachuca (AZ)• Arizona treefrog• Northern Mexican gartersnake• Chiricahua leopard frog• Sonora tiger salamander• American bullfrog• Ranavirus• Bd
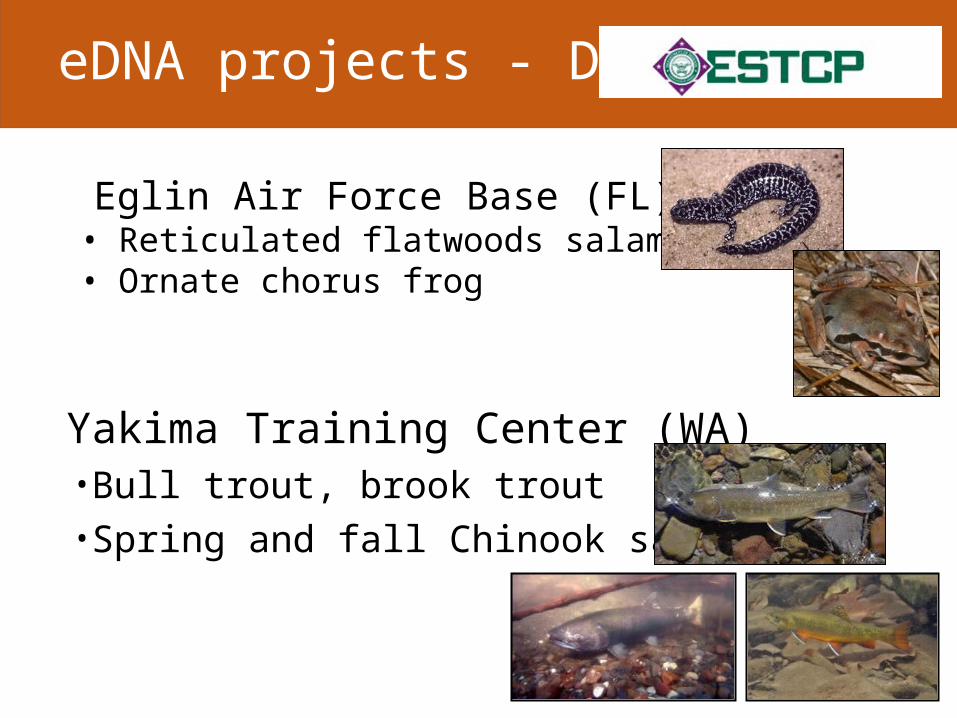
eDNA projects - DoD
Eglin Air Force Base (FL)• Reticulated flatwoods salamander• Ornate chorus frog
Yakima Training Center (WA)• Bull trout, brook trout• Spring and fall Chinook salmon
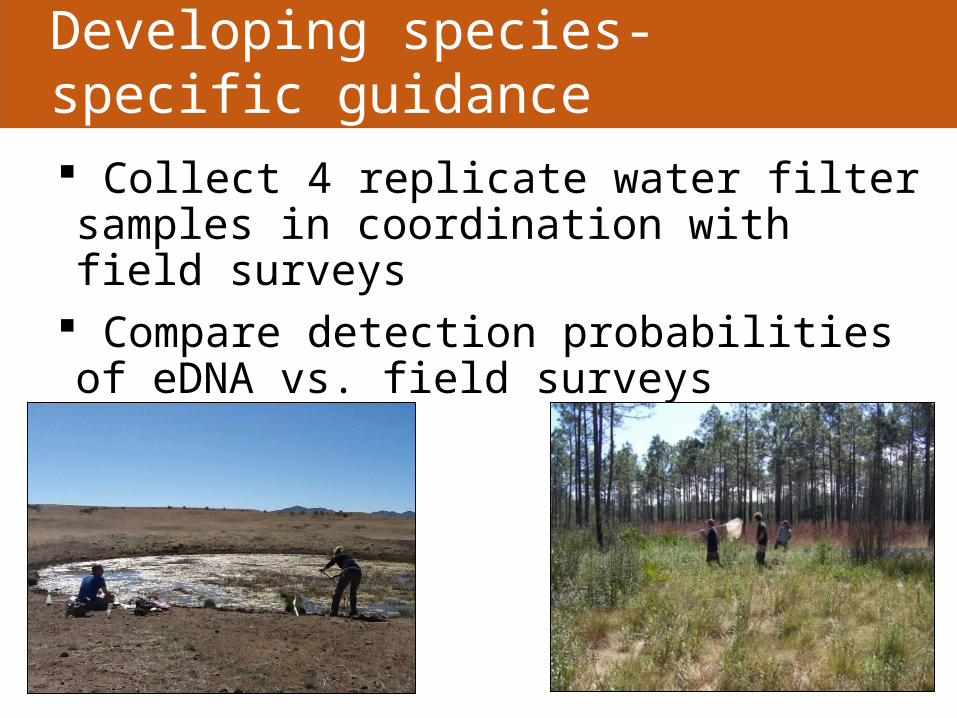
Collect 4 replicate water filter samples in coordination with field surveys
Compare detection probabilities of eDNA vs. field surveys
Developing species-specific guidance
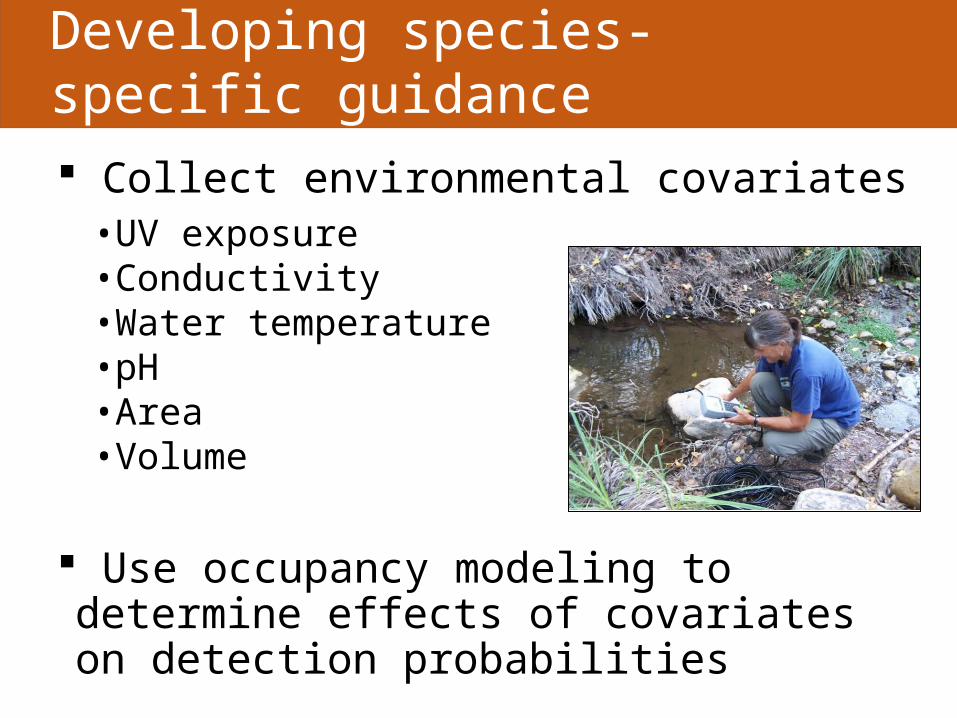
Collect environmental covariates• UV exposure• Conductivity• Water temperature• pH• Area• Volume
Use occupancy modeling to determine effects of covariates on detection probabilities
Developing species-specific guidance
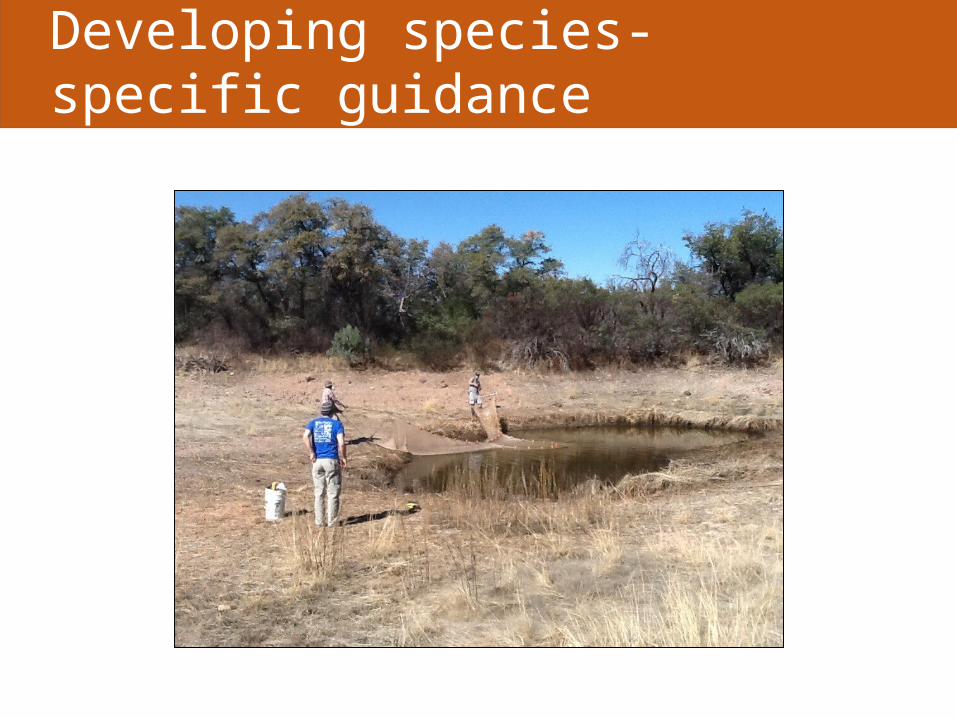
Developing species-specific guidance
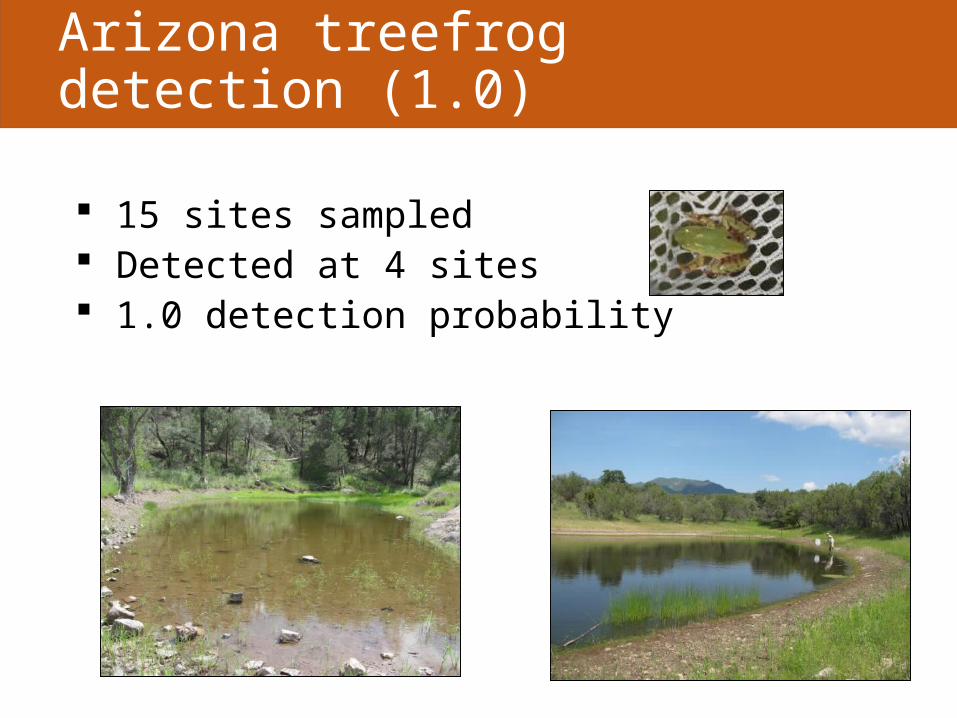
Arizona treefrog detection (1.0)
15 sites sampled Detected at 4 sites 1.0 detection probability
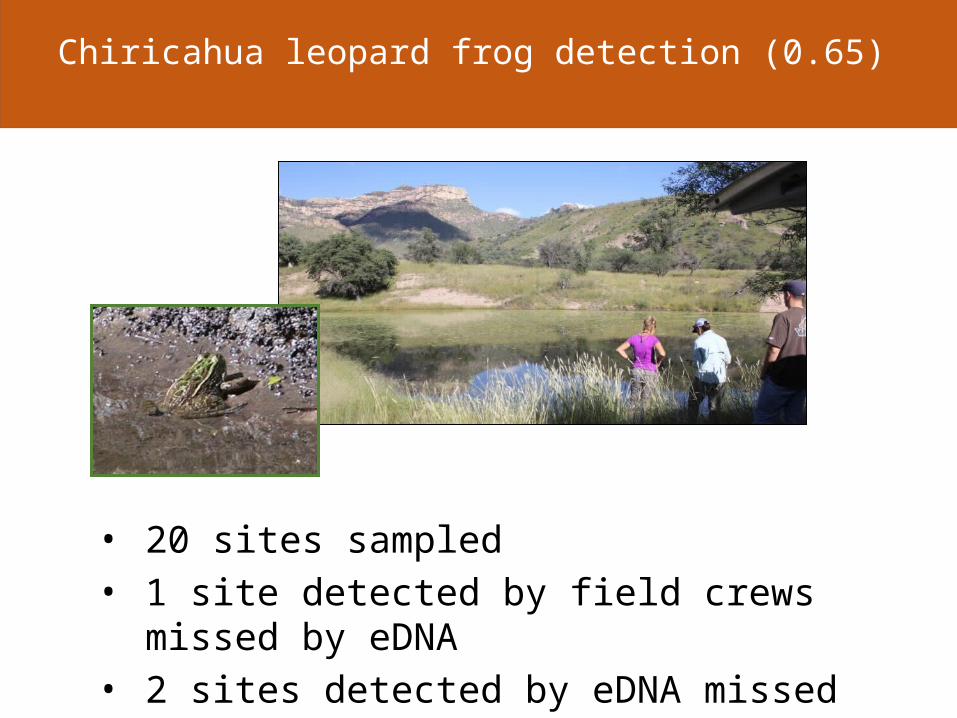
Chiricahua leopard frog detection (0.65)
• 20 sites sampled• 1 site detected by field crews missed by eDNA• 2 sites detected by eDNA missed by field crews
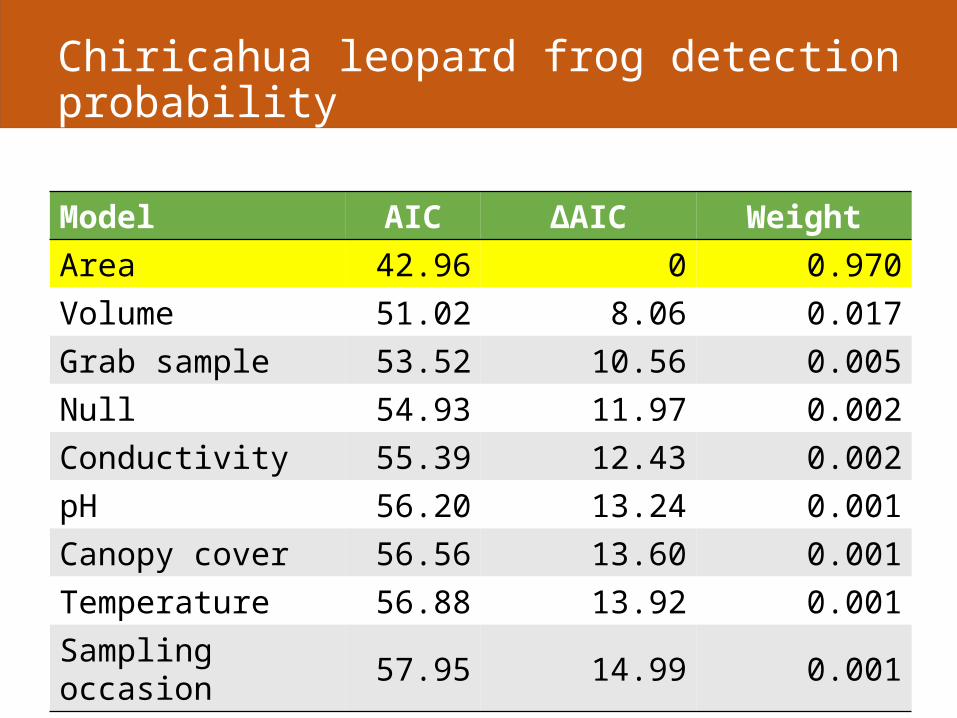
Model AIC ΔAIC WeightArea 42.96 0 0.970Volume 51.02 8.06 0.017Grab sample 53.52 10.56 0.005Null 54.93 11.97 0.002Conductivity 55.39 12.43 0.002pH 56.20 13.24 0.001Canopy cover 56.56 13.60 0.001Temperature 56.88 13.92 0.001Sampling occasion 57.95 14.99 0.001
Chiricahua leopard frog detection probability
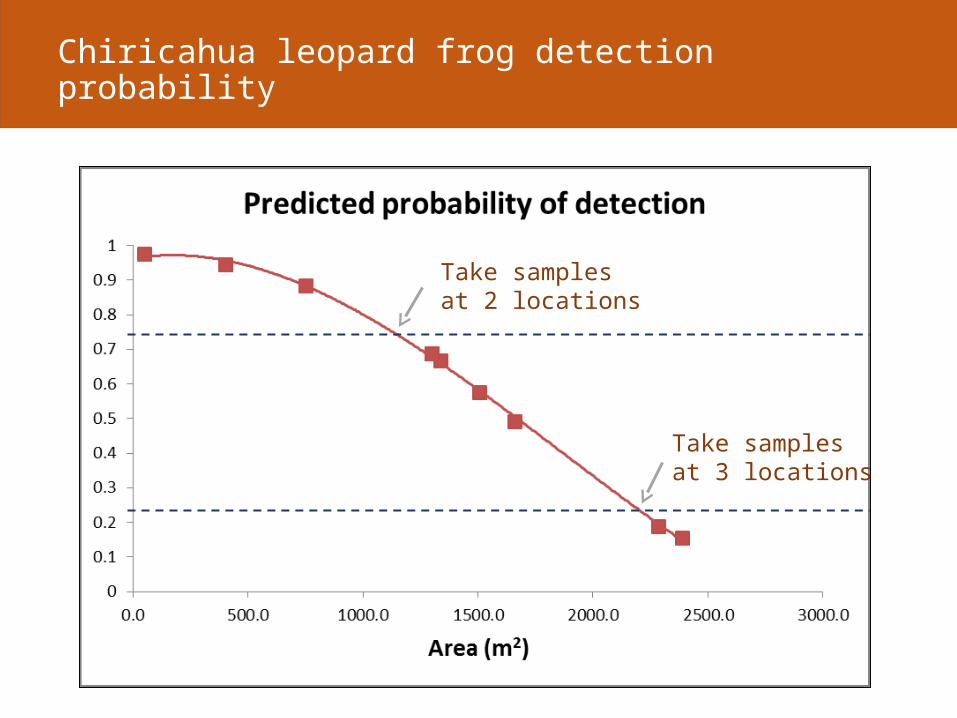
Take samples at 2 locations
Take samples at 3 locations
Chiricahua leopard frog detection probability
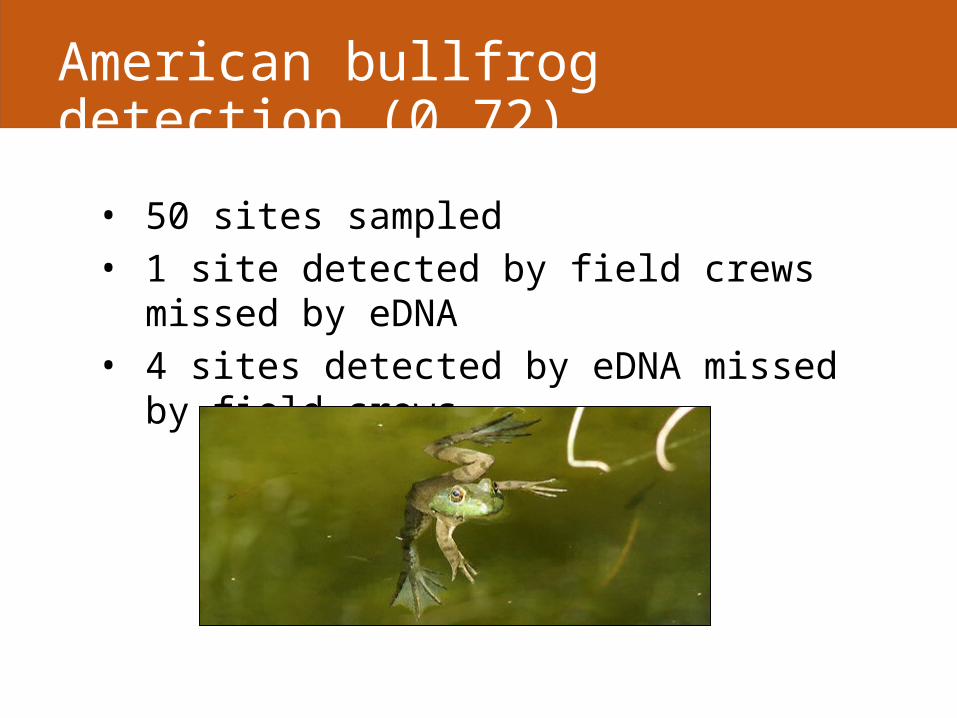
American bullfrog detection (0.72)
• 50 sites sampled• 1 site detected by field crews missed by eDNA• 4 sites detected by eDNA missed by field crews
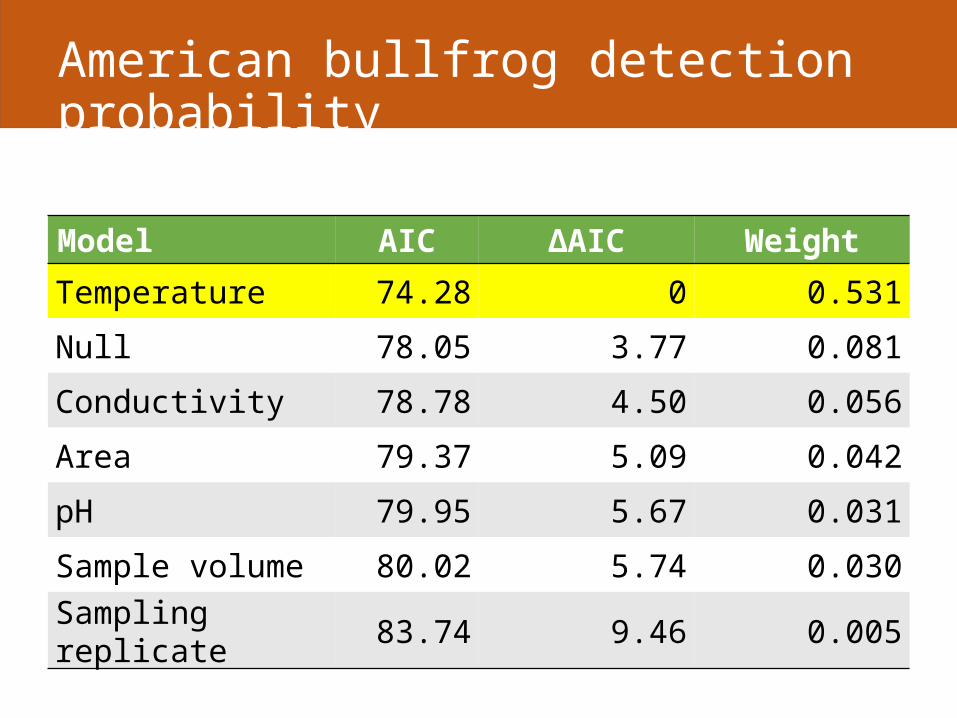
Model AIC ΔAIC Weight
Temperature 74.28 0 0.531
Null 78.05 3.77 0.081
Conductivity 78.78 4.50 0.056
Area 79.37 5.09 0.042
pH 79.95 5.67 0.031
Sample volume 80.02 5.74 0.030
Sampling replicate 83.74 9.46 0.005
American bullfrog detection probability
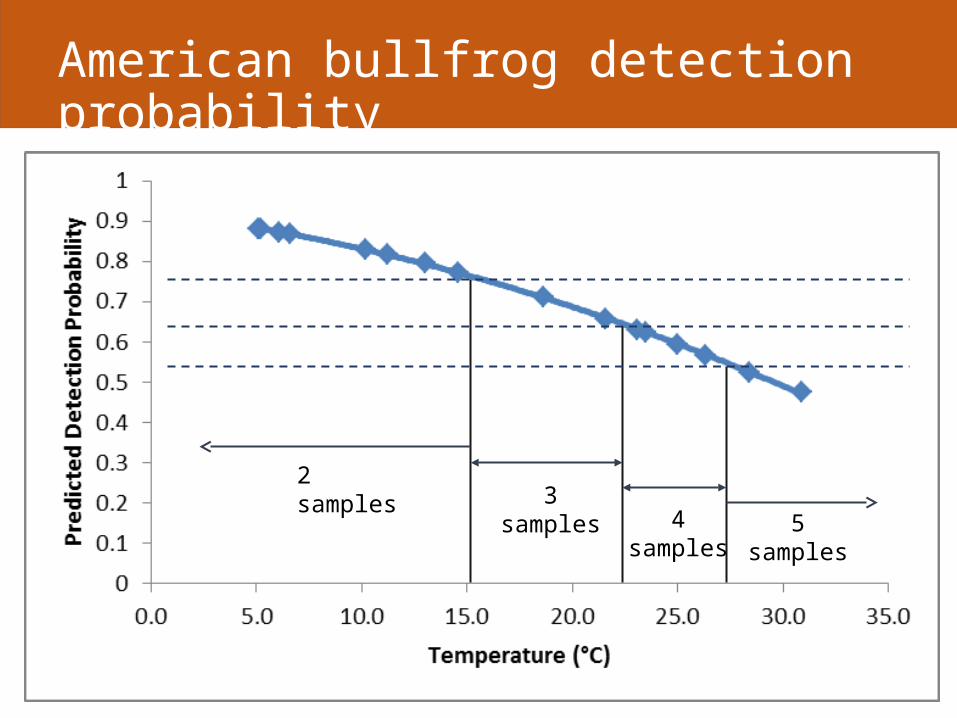
2 samples3 samples
4 samples 5 samples
American bullfrog detection probability
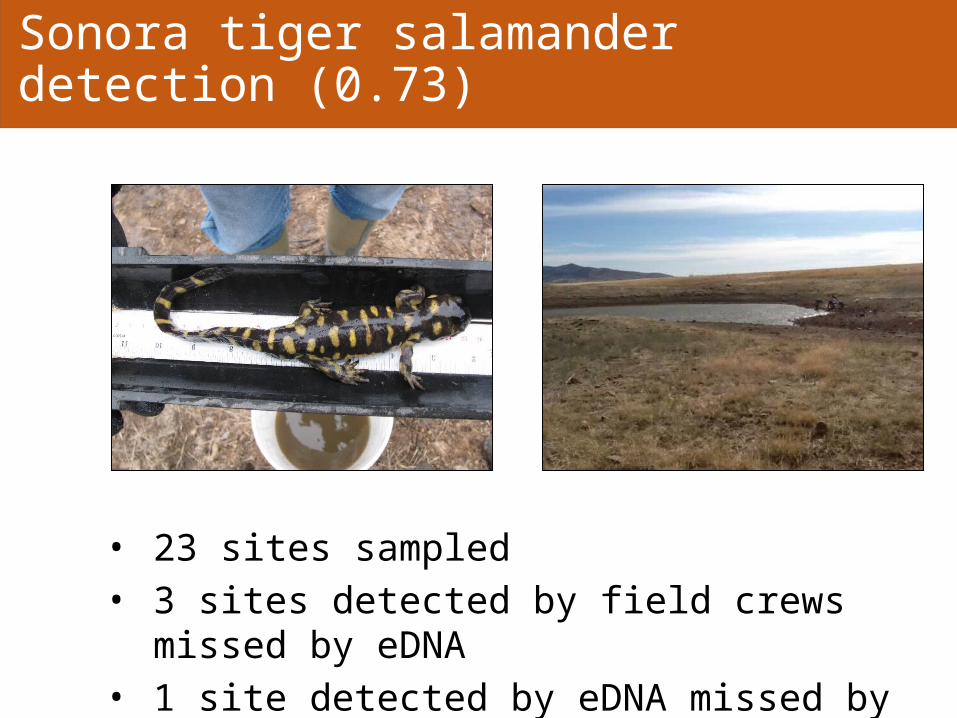
• 23 sites sampled• 3 sites detected by field crews missed by eDNA• 1 site detected by eDNA missed by field crews
Sonora tiger salamander detection (0.73)
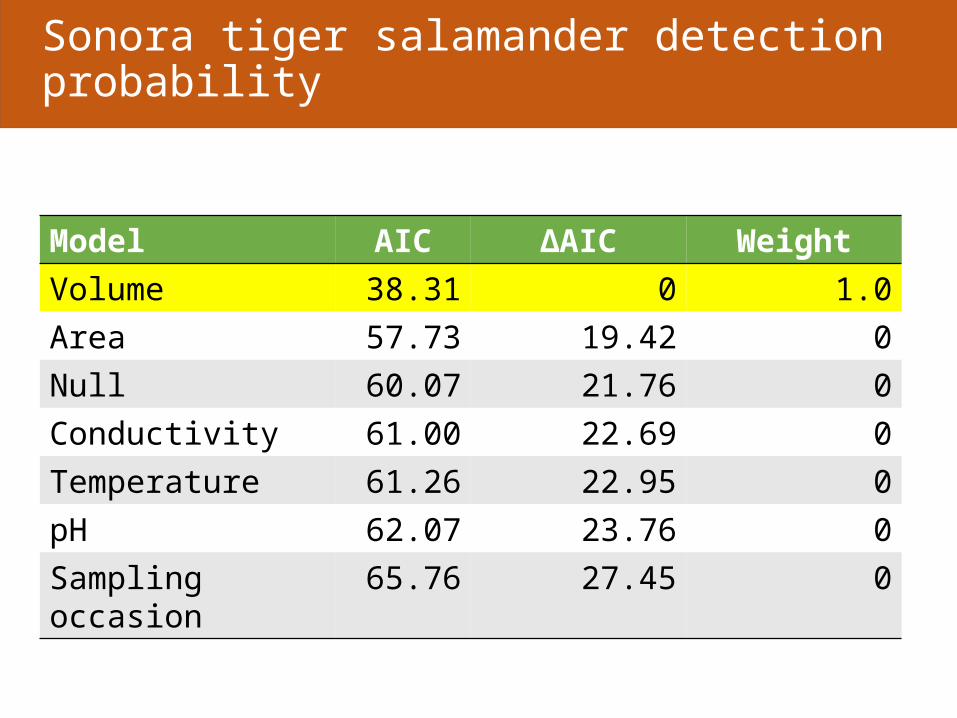
Sonora tiger salamander detection probability
Model AIC ΔAIC WeightVolume 38.31 0 1.0Area 57.73 19.42 0Null 60.07 21.76 0Conductivity 61.00 22.69 0Temperature 61.26 22.95 0pH 62.07 23.76 0Sampling occasion 65.76 27.45 0
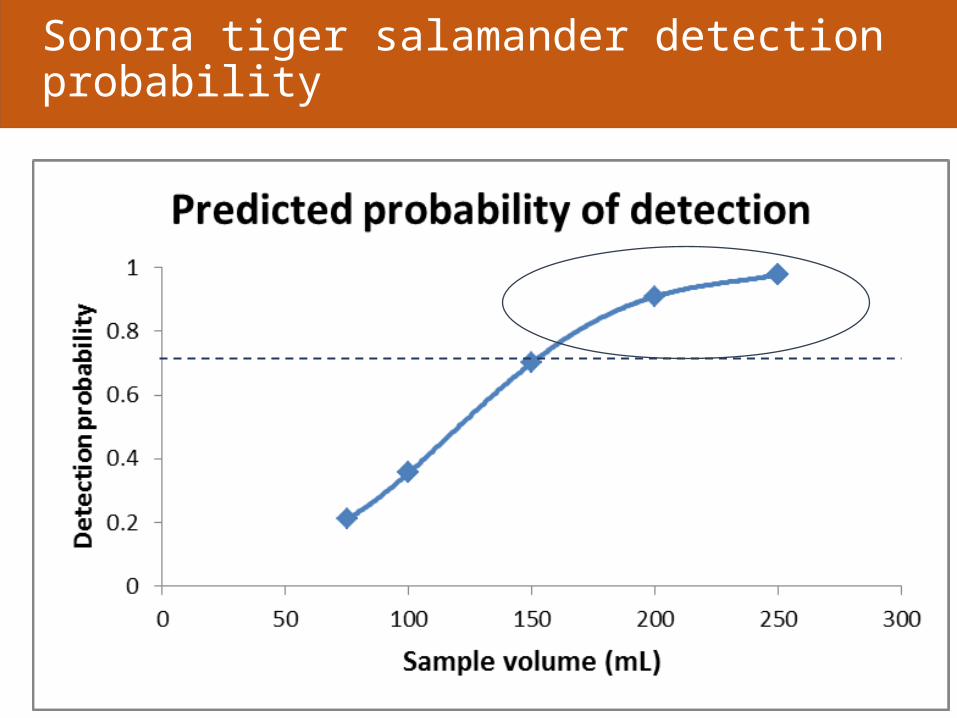
Sonora tiger salamander detection probability
Conclusions
eDNA detection varies by species
Sampling protocols need to maximize detection
• Season for sampling• Number of replicates• Spatial distribution of
replicates
• Volume sampled• Preservation method• Extraction method• Analysis method
Pilot study is critical
eDNA sampling can complement field surveys
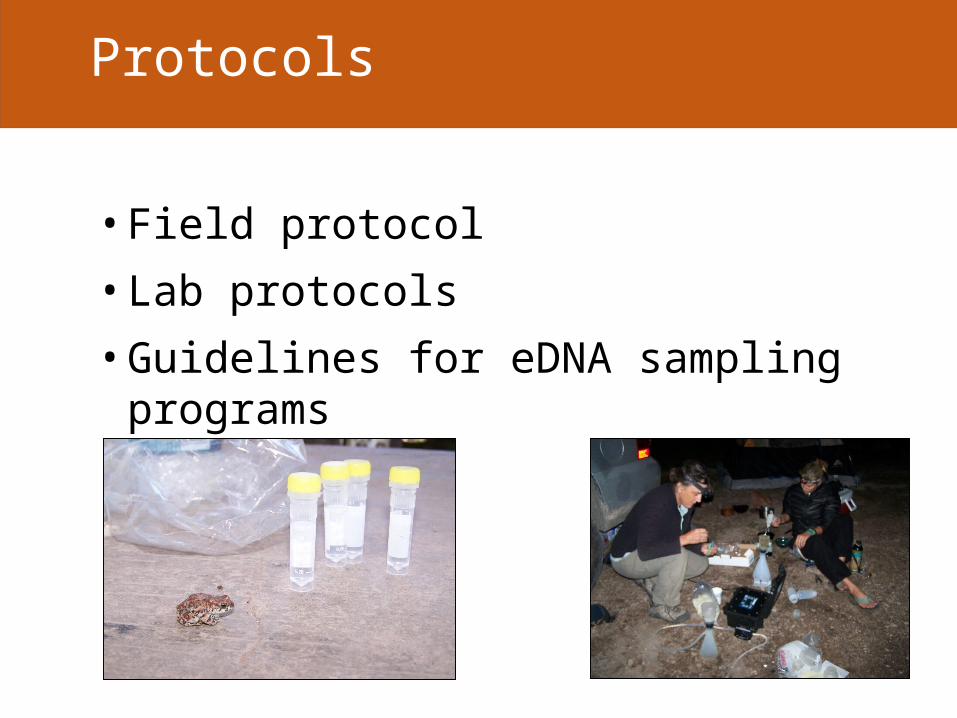
Protocols
• Field protocol• Lab protocols• Guidelines for eDNA sampling programs
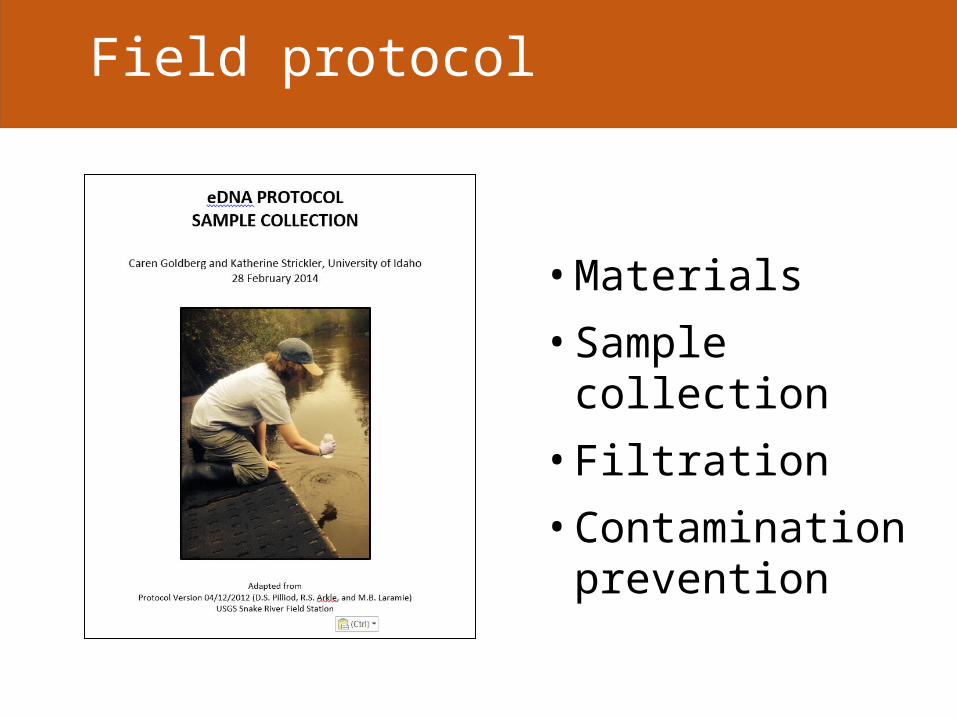
Field protocol
• Materials• Sample collection• Filtration• Contamination
prevention
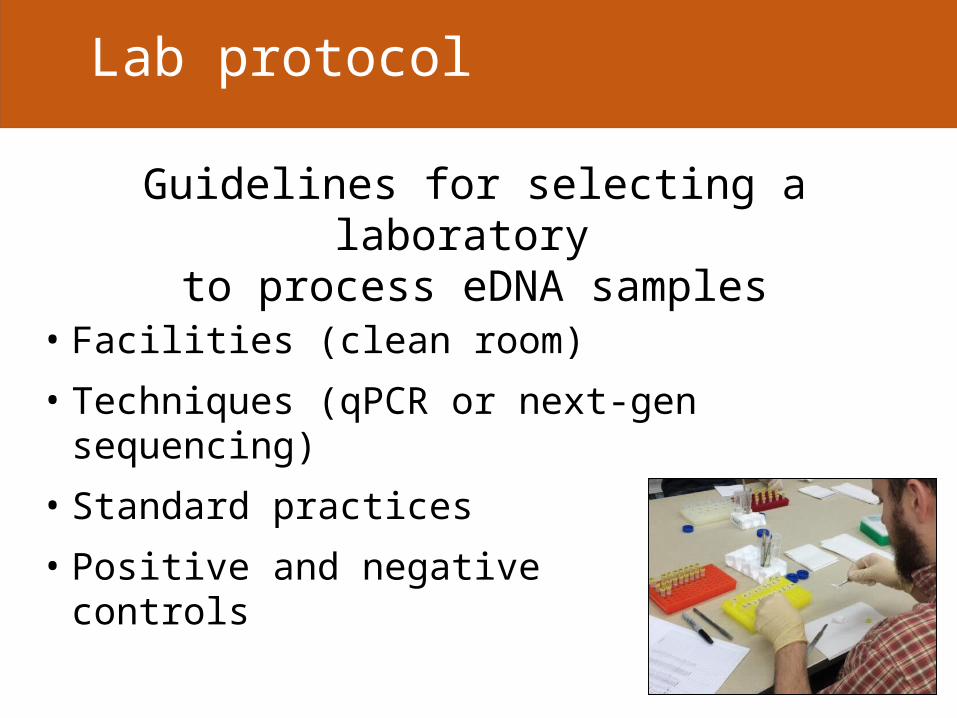
Lab protocol
• Facilities (clean room)
• Techniques (qPCR or next-gen sequencing)
• Standard practices
• Positive and negative controls
Guidelines for selecting a laboratory to process eDNA samples
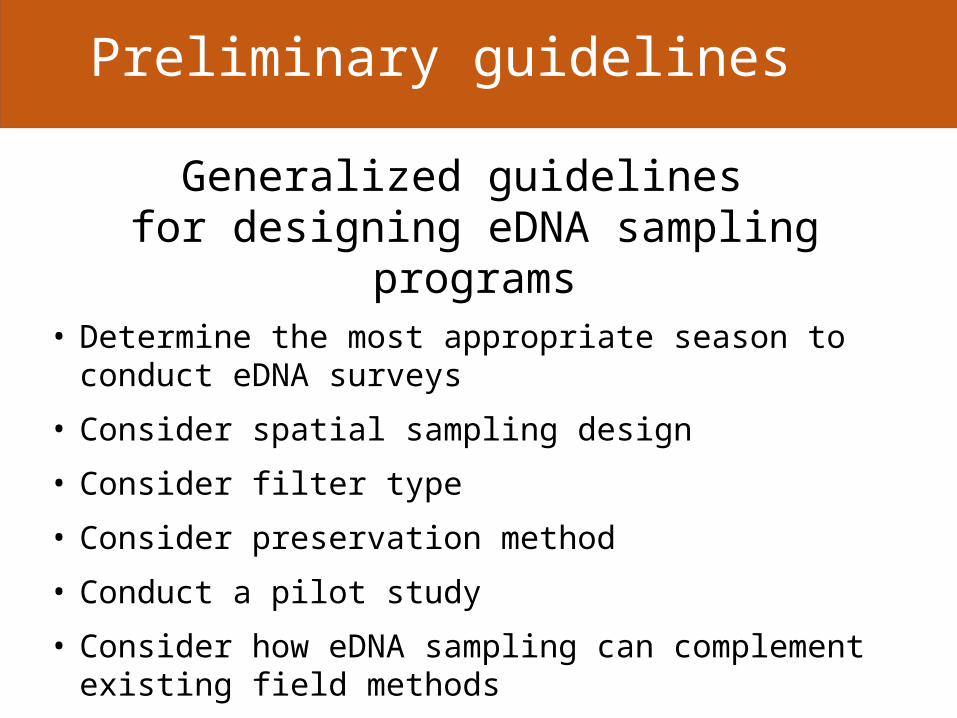
Preliminary guidelines
• Determine the most appropriate season to conduct eDNA surveys
• Consider spatial sampling design
• Consider filter type
• Consider preservation method
• Conduct a pilot study
• Consider how eDNA sampling can complement existing field methods
Generalized guidelines for designing eDNA sampling programs
Thank you
Backup Slides
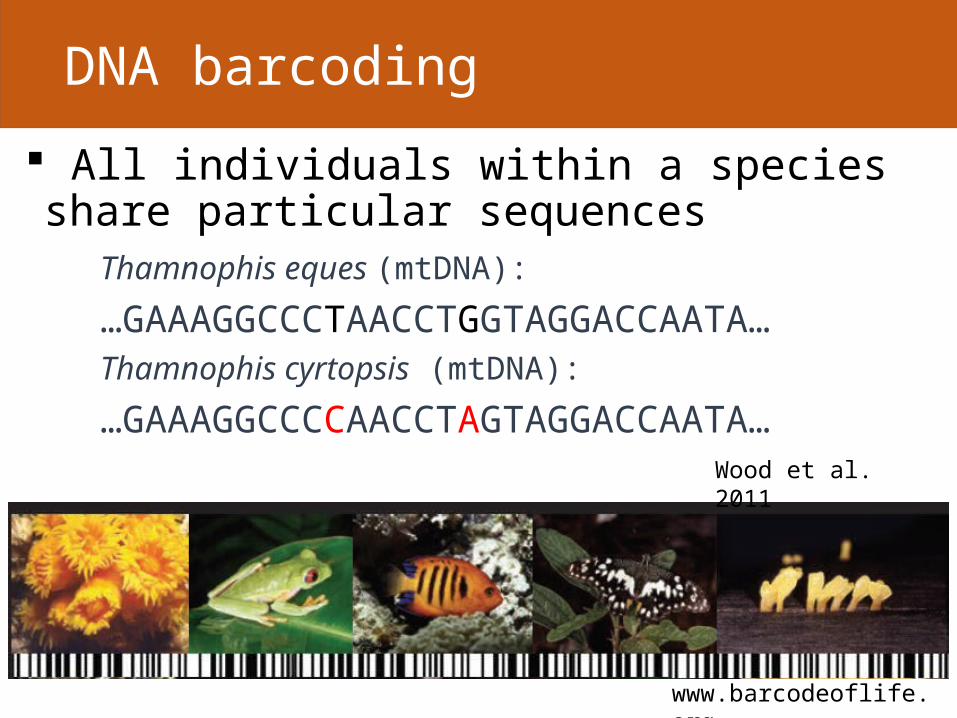
DNA barcoding
All individuals within a species share particular sequences
Thamnophis eques (mtDNA):
…GAAAGGCCCTAACCTGGTAGGACCAATA…Thamnophis cyrtopsis (mtDNA):
…GAAAGGCCCCAACCTAGTAGGACCAATA…
www.barcodeoflife.org
Wood et al. 2011
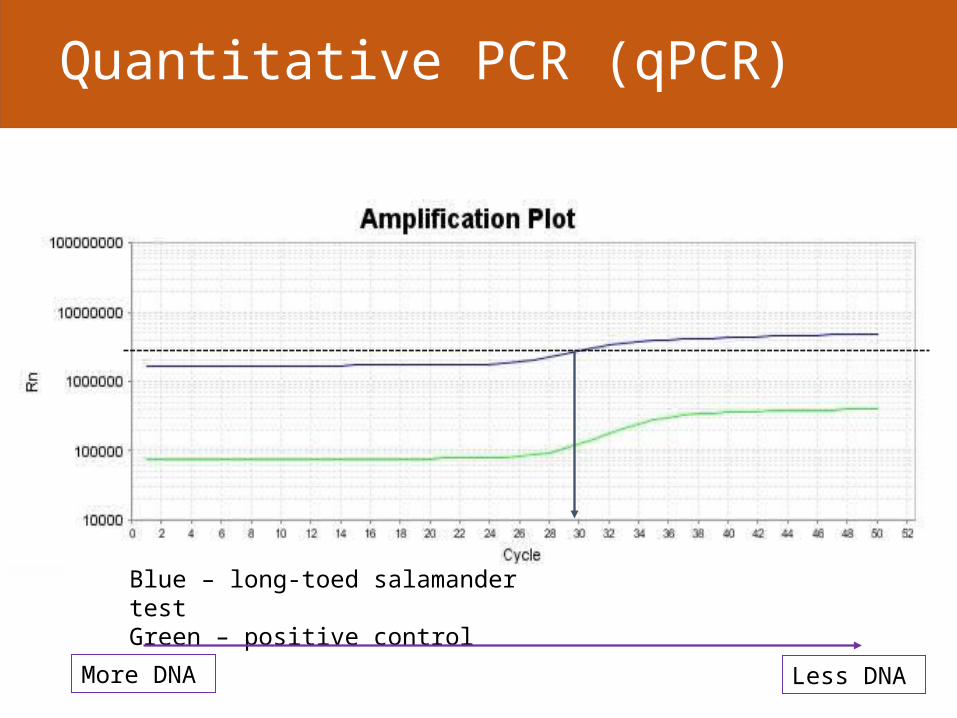
Quantitative PCR (qPCR)
Blue – long-toed salamander test Green – positive control
More DNA Less DNA
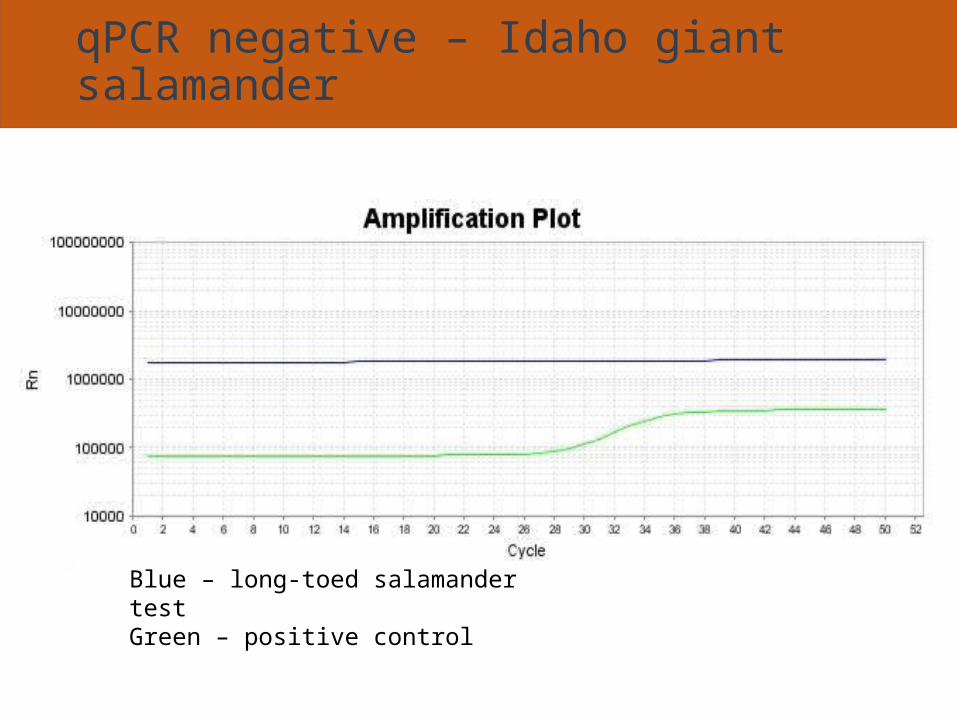
qPCR negative – Idaho giant salamander
Blue – long-toed salamander test Green – positive control
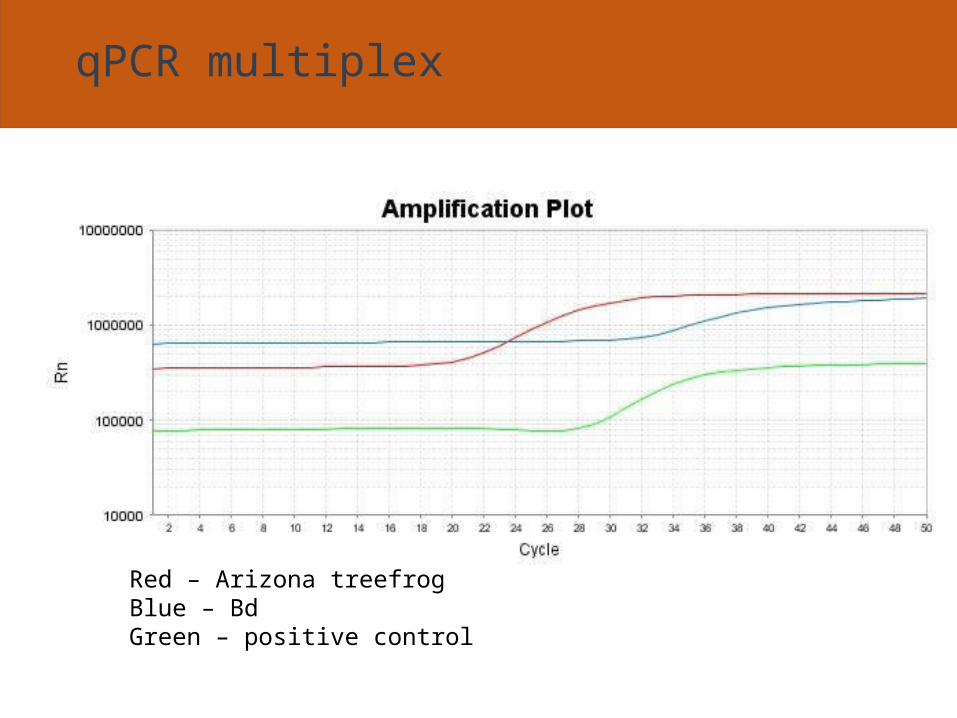
qPCR multiplex
Red – Arizona treefrogBlue – Bd Green – positive control
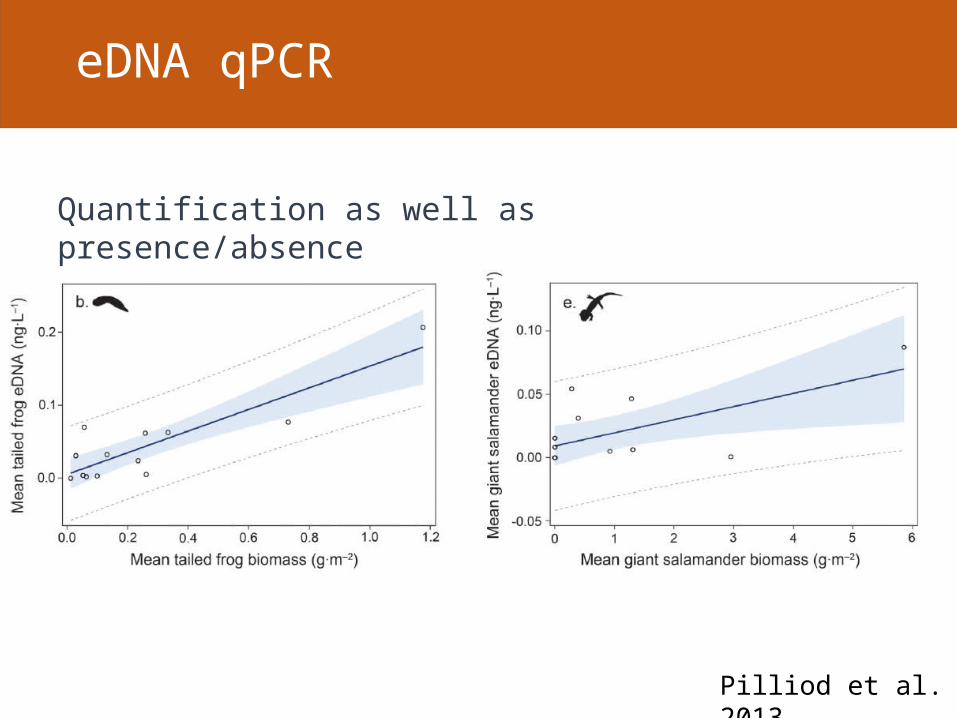
eDNA qPCR
Pilliod et al. 2013
Quantification as well as presence/absence
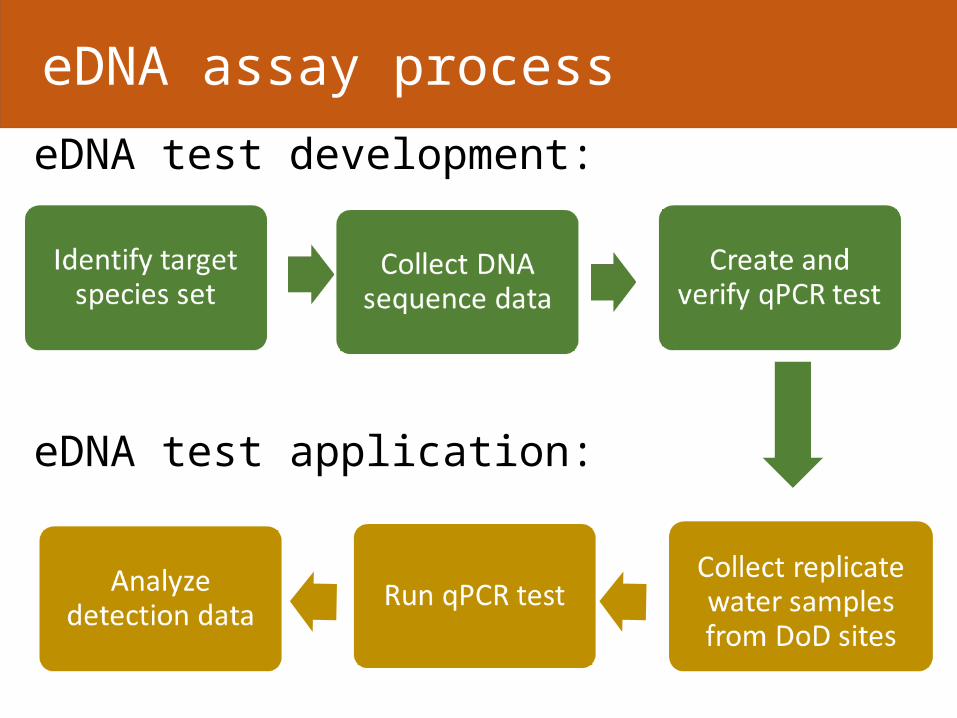
eDNA assay process
eDNA test development:
eDNA test application:
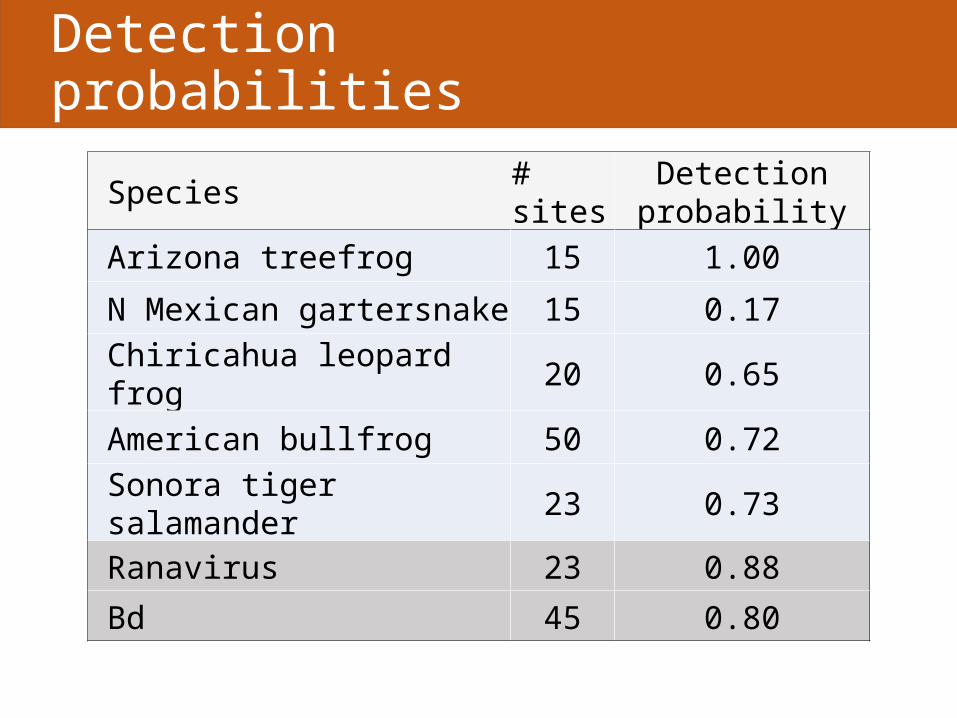
Detection probabilities
Species # sites Detection probability
Arizona treefrog 15 1.00
N Mexican gartersnake 15 0.17
Chiricahua leopard frog 20 0.65
American bullfrog 50 0.72
Sonora tiger salamander 23 0.73
Ranavirus 23 0.88
Bd 45 0.80
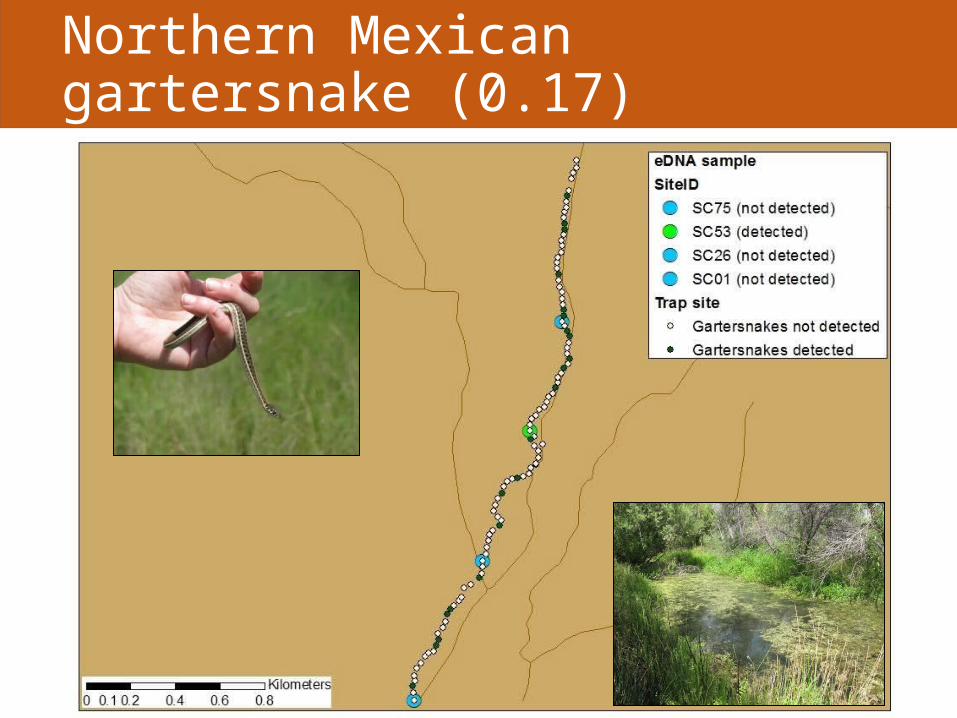
Northern Mexican gartersnake (0.17)
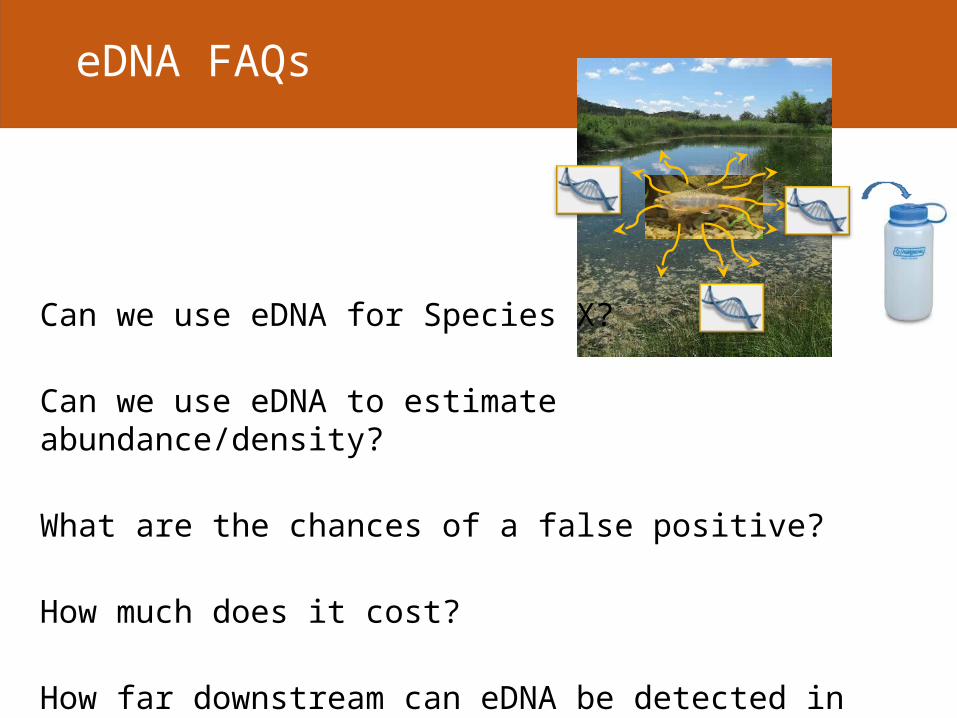
eDNA FAQs
Can we use eDNA for Species X?
Can we use eDNA to estimate abundance/density?
What are the chances of a false positive?
How much does it cost?
How far downstream can eDNA be detected in streams?