Embed Size (px)
DESCRIPTION
This series is designed to make available to a wider readership selected studies on environmental issues prepared for use within the OECD. Authorship is usually collective, but principal authors are named. The papers are generally available only in their original language English or French with a summary in the other if available. The opinions expressed in these papers are the sole responsibility of the author(s) and do not necessarily reflect those of the OECD or the governments of its member countries. Comment on the series is welcome, and should be sent to either [email protected] or the Environment Directorate, 2 rue André Pascal, 75775 PARIS CEDEX 16, France.
Citation preview
Please cite this paper as:
Lamhauge, N., E. Lanzi and S. Agrawala (2012),“Monitoring and Evaluation for Adaptation: Lessons fromDevelopment Co-operation Agencies”, OECD EnvironmentWorking Papers, No. 38, OECD Publishing.http://dx.doi.org/10.1787/5kg20mj6c2bw-en
OECD Environment Working PapersNo. 38
Monitoring and Evaluationfor Adaptation: Lessonsfrom Development Co-operation Agencies
Nicolina Lamhauge, Elisa Lanzi,Shardul Agrawala
JEL Classification: H43, O22, Q54
Unclassified ENV/WKP(2011)8 Organisation de Coopération et de Développement Économiques Organisation for Economic Co-operation and Development 05-Apr-2012 ___________________________________________________________________________________________
English - Or. English ENVIRONMENT DIRECTORATE
MONITORING AND EVALUATION FOR ADAPTATION: LESSONS FROM DEVELOPMENT CO-OPERATION AGENCIES By Nicolina Lamhauge, Eliza Lanzi and Shardul Agrawala, OECD
JEL Classification: 022, H43, Q54 Keywords: Climate change adaptation; monitoring and evaluation; development co-operation
All OECD Environment Working Papers are available at www.oecd.org/env/workingpapers.
JT03319302
Complete document available on OLIS in its original format This document and any map included herein are without prejudice to the status of or sovereignty over any territory, to the delimitation of international frontiers and boundaries and to the name of any territory, city or area.
ENV
/WK
P(2011)8 U
nclassified
English - O
r. English
Cancels & replaces the same document of 28 November 2011
ENV/WKP(2011)8
2
OECD ENVIRONMENT WORKING PAPERS
This series is designed to make available to a wider readership selected studies on environmental issues prepared for use within the OECD. Authorship is usually collective, but principal authors are named. The papers are generally available only in their original language English or French with a summary in the other if available. The opinions expressed in these papers are the sole responsibility of the author(s) and do not necessarily reflect those of the OECD or the governments of its member countries. Comment on the series is welcome, and should be sent to either [email protected] or the Environment Directorate, 2 rue André Pascal, 75775 PARIS CEDEX 16, France.
--------------------------------------------------------------------------- OECD Environment Working Papers are published on
www.oecd.org/env/workingpapers ---------------------------------------------------------------------------
Applications for permission to reproduce or translate all or part of this material should be made to:
OECD Publishing, [email protected] or by fax 33 1 45 24 99 30.
Copyright OECD 2011
ENV/WKP(2011)8
3
ABSTRACT
In the context of scaled up funding for climate change adaptation, it is more important than ever to ensure the effectiveness, equity and efficiency of adaptation interventions. Robust monitoring and evaluation (M&E) is an essential part of this, both to ensure that the prospective benefits of interventions are being realised and to help improve the design of future interventions. This paper is the first empirical assessment of M&E frameworks used by development co-operation agencies for projects and programmes with adaptation-specific or adaptation-related components. It has analysed 106 project documents across six bilateral development agencies. Based on this, it identifies the characteristics of M&E for adaptation and shares lessons learned on the choice and use of indicators for adaptation.
This analysis has found that Result Based Management, the Logical Framework Approach and the accompanying logframe are the most common M&E approaches used for adaptation. In applying these approaches, the long-term perspective of most adaptation initiatives means that it is particularly important to clearly differentiate between outcomes, outputs and activities. In addition, M&E frameworks for adaptation should combine qualitative, quantitative and binary indicators. The baselines for these indicators should include the effects of future climate change, particularly for projects with long-term implications, such as investments in infrastructure. Significant challenges remain in relation to dealing with shifting baselines, attribution and time lags between interventions and outcomes.
JEL Classification: O22, H43, Q54
Keywords: Climate change adaptation; monitoring and evaluation; development co-operation
ENV/WKP(2011)8
4
RÉSUMÉ
De plus en plus de fonds étant alloués à l’adaptation au changement climatique, il est plus que jamais capital de veiller à l’efficacité, à l’équité et à l’efficience des actions menées dans ce cadre. Un système de suivi et d’évaluation rigoureux s’impose, à la fois pour garantir que les avantages attendus de ces actions se concrétiseront et pour mieux préparer les actions à mener dans l’avenir. Le présent document est la première étude empirique des cadres de suivi et d’évaluation appliqués par les agences de coopération pour le développement à des projets et des programmes portant intégralement ou partiellement sur l’adaptation. Cent-six documents de projets de six agences bilatérales de développement ont été analysés. Cela a permis d’identifier les caractéristiques des systèmes de suivi et d’évaluation appliqués à l’adaptation et d’en tirer des enseignements concernant le choix des indicateurs et leur utilisation.
D’après cette analyse, les deux approches de suivi et d’évaluation les plus employées sont en l’occurrence la gestion axée sur les résultats et la méthode du cadre logique et la matrice qui s’y rapporte. La plupart des initiatives d’adaptation s’inscrivant dans le long terme, il est particulièrement important de bien différencier les résultats, les produits et les activités lorsque l’on applique ces approches. En outre, les systèmes de suivi et d’évaluation appliqués à l’adaptation doivent associer des indicateurs qualitatifs, quantitatifs et binaires. Pour ces indicateurs, les références doivent intégrer les effets des changements climatiques futurs, notamment dans le cas des projets qui ont des implications à long terme (investissements dans les infrastructures, par exemple). La prise en charge des variations des références, de l’attribution des résultats et des décalages temporels entre actions et résultats pose encore des problèmes importants.
Classification JEL : O22, H43, Q54
Mots clés : adaptation au changement climatique ; suivi et évaluation ; coopération pour le développement
ENV/WKP(2011)8
5
FOREWORD
This report on “Monitoring and Evaluation for Adaptation: Lessons from Development Co-operation Agencies” is an output of the OECD Task Team on Climate Change and Development Co-operation that is overseen jointly by the Working Party on Global and Structural Policies (WPGSP), predecessor to the Working Party on Climate, Investment and Development (WPCID) of the Environment Policy Committee (EPOC) and the Network on Environment and Development Co-operation (ENVIRONET) of the Development Assistance Committee (DAC).
This report has been authored by Nicolina Lamhauge, Elisa Lanzi and Shardul Agrawala. Financial support from the UK Department for International Development (DFID), the US Environmental Protection Agency (EPA) and the Swedish International Development Cooperation Agency (Sida)/Swedish Environmental Protection Agency (SEPA) is gratefully acknowledged. In addition to these agencies the authors gratefully acknowledge the Canadian International Development Agency (CIDA), the Directorate General for International Cooperation of the Netherlands (DGIS), Japan’s International Cooperation Agency (JICA) and the Swiss Agency for Development and Cooperation (SDC) for provision of extensive documentation on their monitoring and evaluation framework for adaptation and related projects.
In addition to Task Team members, the authors would like to thank Marie-Christine Tremblay, Michael Mullan, Remy Paris, Shannon Wang, Victoria Schreitter, Nicholas Kingsmill and Jane Ellis for valuable input and feedback.
This document does not necessarily represent the views of either the OECD or its member countries. It is published under the responsibility of the authors.
This paper is released as part of the OECD Environment Working Papers series [ENV/WKP(2011)8]. It can be downloaded on the OECD website: www.oecd.org/env/workingpapers or www.oecd.org/env/cc/adaptation.
Further enquiries on ongoing work on Adaptation to Climate Change should be directed to Michael Mullan, OECD Environment Directorate (Email: [email protected]; Tel: +33 1 45 24 13 17).
ENV/WKP(2011)8
6
TABLE OF CONTENTS
ABSTRACT .................................................................................................................................................... 3
RÉSUMÉ ........................................................................................................................................................ 4
FOREWORD .................................................................................................................................................. 5
ACRONYMS .................................................................................................................................................. 8
EXECUTIVE SUMMARY ............................................................................................................................ 9
1. Introduction .................................................................................................................................... 11 2. Data Sources ................................................................................................................................... 12 3. Overview of M&E Approaches ...................................................................................................... 18
3.1 Different Applications of the Logframe .................................................................................... 19 3.2 Intermediate Performance and Review Measures ..................................................................... 23
4. Indicators for M&E for adaptation ................................................................................................. 24 4.1 Indicators on Risk Reduction .................................................................................................... 25 4.2 Indicators on Policy and Administrative Management ............................................................. 29 4.3 Indicators on Environmental Education and Training .............................................................. 33 4.4 Indicators on Research .............................................................................................................. 35 4.5 Indicators on Co-ordination ...................................................................................................... 37
5. Baselines and targets for M&E for adaptation ............................................................................... 40 6. Conclusion ...................................................................................................................................... 42
BIBLIOGRAPHY ......................................................................................................................................... 45
ANNEX 1: COMPLETE LIST OF PROJECTS ........................................................................................... 47
Tables
Table 1. Examples of Climate Change Funds and Programmes ......................................................... 13 Table 2. Keywords Used for the Selection of Adaptation-related Projects......................................... 14 Table 3. Overview of Projects ............................................................................................................. 14 Table 4. Examples of Project Documents Considered ........................................................................ 15 Table 5. Categories of Adaptation Activities ...................................................................................... 16 Table 6. Examples of Climate Sensitive Sectors and Related Adaptation Activities ......................... 17 Table 7. Excerpt From a SDC Logframe ............................................................................................ 20 Table 8. Excert From a DFID Logframe ............................................................................................. 21 Table 9. Common Indicators on Climate Risk Reduction .................................................................. 25 Table 10. Indicators for JICA Flood Management Project ................................................................... 27 Table 11. Example of Future Flooding Predictions in Ex ante Evaluations ......................................... 28 Table 12. Flood Damage in the Beneficiary Area ................................................................................. 28 Table 13. Monitoring Across Seasons .................................................................................................. 29 Table 14. Common Indicators on Policy and Administrative Managment ........................................... 30 Table 15. Common Indicators on Education and Training ................................................................... 33 Table 16. Common Indicators on Environmental Research ................................................................. 36 Table 17. Common Indicators on Co-ordination .................................................................................. 38 Table 18. Indicator, Baseline and Target for JICA Project ................................................................... 40
ENV/WKP(2011)8
7
Figures
Figure 1. Regional Focus of the Agencies ............................................................................................ 15 Figure 2. CIDA Project: Outcome, Output, Activities and Indicators.................................................. 26
Boxes
Box 1. The Logical Framework Approach ................................................................................................ 19 Box 2. Example of Outcome Targets Used by JICA ................................................................................. 22
ENV/WKP(2011)8
8
ACRONYMS
CIDA Canadian International Development Agency CIF Climate Investment Fund DAC Development Assistance Committee DFID UK Department for International Development DGIS Directorate General for International Cooperation of the Netherlands EPA Environmental Protection Agency GBP Pound Sterling GEF Global Environmental Facility GIZ Deutche Gesellschaft für Internationale Zusammenarbeit JICA Japan International Cooperation Agency LFA Logical Framework Approach M&E Monitoring and Evaluation OECD Organisation for Economic Co-operation and Development PPCR Pilot Programme on Climate Resilience RBM Result Based Management SDC Swiss Agency for Development and Cooperation Sida Swedish International Development Cooperation Agency UNDP United Nations Development Programme UNFCCC United Nations Framework Convention on Climate Change USD United States Dollar WRI World Resources Institute
ENV/WKP(2011)8
9
EXECUTIVE SUMMARY
The industrialised countries have made a joint commitment to mobilise USD 100 billion per year by 2020 for climate change adaptation and mitigation initiatives in developing countries (UNFCCC, 2011). With significantly scaled up financing for adaptation also comes the need to evaluate the benefits from investments and their impact in reducing vulnerability to climate change. Monitoring and evaluation (M&E) is an important tool to identify good practices and single out less effective approaches, contributing to evidence based decision making.
Adaptation-specific initiatives are still recent but development co-operation agencies have a long history in implementing projects and programmes with adaptation-related components. M&E for adaptation faces a number of challenges, ranging from the ambiguous definition of adaptation to the identification of targets and the choice of indicators used to monitor performance. Furthermore, the implementation of projects and programmes that specifically target adaptation is still relatively recent. Development co-operation agencies however, have a long history in implementing projects in climate sensitive areas. Many of these activities include adaptation-related components.
This paper is the first empirical assessment of M&E frameworks used by development co-operation agencies for their projects and programmes with adaptation-specific or adaptation-related components. Specifically, it draws on the extensive experience of six bilateral development agencies1 in evaluating their activities. Comparing the approaches used by the agencies in evaluating their projects and programmes, the analysis aims to get a better understanding of i) the particular characteristics of M&E in the context of adaptation and ii) what lessons can be learned on the choice and use of indicators for adaptation.
Documents for 106 projects and programmes were reviewed for this analysis. The documents were grouped into five broad categories of adaptation to climate change: i) risk reduction, ii) policy and administrative management, iii) education, training and awareness, iv) research and v) co-ordination. Across the sample, the majority of the activities were concentrated in the last four categories. Relatively few activities focus specifically on risk reduction measures.
Result Based Management (RBM), the Logical Framework Approach and the accompanying logframe are the most common approaches used by the agencies to distinguish between outcomes, outputs and activities. A core component of M&E is the selection of appropriate and measurable indicators. While outputs and outcomes outline what the activity hopes to achieve, indicators show how results will be measured. Clear differentiation between the layers of results is particularly important in the context of adaptation where short and intermediate objectives contribute to long-term outcomes that may not materialise until far into the future.
This analysis shows that M&E frameworks for adaptation should combine qualitative, quantitative and binary indicators. On their own, any category of indicator is not enough. For instance, the development of a policy framework does not ensure its implementation and sustainability. It therefore needs to be complemented with quantitative indicators that for example measure the number of projects that have been
1 . CIDA, DFID, DGIS, JICA, SDC and Sida
ENV/WKP(2011)8
10
developed in response to the policy or the number of households benefitting. Qualitative indicators are needed to assess the change brought about by the policy. Such differentiation helps clarify the relative contribution of each activity towards the long-term objective. In some cases, surveys, focus group discussions or other means of direct consultation with beneficiaries is needed in order to assess the level of change.
Carefully defined baselines are essential in order to measure project or programme impact. In the context of adaptation, this requires consideration of future climate change. This is particularly the case in large infrastructure projects where a failure to consider possible climate impacts can lead to high costs in the future. Similarly, milestones and targets are required in order to effectively monitor progress and evaluate results in a changing environmental context. Indicators, such as the number of villages or regions with new strategies or policy forums, do on their own not explain the contribution of the project. Instead, the number of new climate strategies should be referenced in relation to the total number of villages vulnerable to climate change at the start of the programme.
In the context of adaptation, M&E activities also need to recognise the longer time horizon of potential climate change impacts and need to be scheduled accordingly. Furthermore, it is important to consider possible barriers to programme or project success. These can for example be cultural barriers or barriers due to geographic separation of stakeholders. Another barrier may arise when many development agencies operate in the same area, each placing different conditions on beneficiaries. In the context of adaptation where potential gains may not materialise until far into the future, the incentives for beneficiaries to comply with project or programme conditions are often limited. Such barriers need to be reflected in the evaluation framework and carefully monitored over time.
The level of detail included in M&E frameworks for adaptation is likely to depend on the type and scale of the activity. In the sample analysed for this study, there is some differentiation across the agencies in the level of detail included in their M&E frameworks. While some have detailed indicators corresponding to every component of an intervention, others focus on an aggregate assessment of change in climate vulnerability. The preferred approach is likely to depend on the type and the scale of the activity. For risk reduction measures, an overall vulnerability assessment may be more appropriate than, for example, for training activities aimed at increasing people’s adaptive capacity through the introduction of new livelihood activities.
While adaptation projects and programmes focus on addressing the risks of climate change, they are, at their core, development projects. The specific features of adaptation call for refinement rather than replacement of development agencies’ existing M&E frameworks. Important aspects of this in the context of adaptation include developing indicators, baselines, milestones and targets. The timing of monitoring and evaluation activities also needs to be adjusted to the longer time-horizon of many adaptation initiatives.
A wider lesson from the M&E of development interventions can be applied to M&E of adaptation to climate change. It is important to examine the contribution of specific interventions to the overall country strategy. In the context of adaptation, this would mean complementing individual project and programme evaluations with overall assessments of trends in the country’s vulnerability to climate change. A framework for linking individual assessments with national level assessments could help to broaden the focus from the means of achieving outcomes (individual interventions) to the desired end result (countries’ becoming less vulnerable to climate change). By doing so, the combination of country-level monitoring and project level M&E should highlight the issues of whether the overall level of action is sufficient, how the distribution of vulnerability is changing and whether the composition of interventions is coherent.
ENV/WKP(2011)8
11
1. Introduction
Meeting the challenge of climate change will require a tremendous effort by developed and developing countries alike. In the face of this challenge, the industrialised countries have made a joint commitment to mobilise “new and additional” resources for climate change adaptation and mitigation initiatives in developing countries approaching USD 100 billion per year by 2020 (UNFCCC, 2011). With significantly scaled up financing for adaptation also comes the need to evaluate the benefits from investments and their contribution to reducing vulnerability to climate change. Monitoring and evaluation (M&E) is an important tool to help identify good practices and single out less effective approaches, contributing to evidence based decision making. M&E can also be an effective tool for prioritisation of inputs and communication of outcomes. However, M&E for adaptation faces a number of challenges, ranging from the ambiguous definition of adaptation to the identification of targets and the choice of indicators used to monitor performance.
Adaptation remains a rather vague concept whose boundaries have yet to be defined. Choices made as part of farming practices, land use planning and infrastructure design might all reflect some considerations of current or future climate change, but it remains difficult to isolate and evaluate the individual adaptation components. Similarly, adaptation-specific activities initiated through the international climate change regime require comparison against a “counter-factual” baseline, which is difficult to establish. This is further complicated by the fact that baseline climatic risks evolve under climate change. Furthermore, adaptation strategies viewed as successful in the short-term might, in fact, exacerbate longer-term vulnerability. For example, poorly designed coastal and flood defences can in the short-term lower vulnerability, encouraging population growth and development. In the long-term however, vulnerability can be exacerbated if extreme weather events exceed the design threshold of the defences. These complexities need to be considered when designing, implementing and interpreting evaluations of adaptation activities.
There is growing literature on M&E for adaptation. This literature has primarily focused on the challenge of conducting M&E, categorisation of adaptation interventions into thematic areas, consideration of possible M&E approaches, and identification of factors to be considered when implementing adaptation activities and devising corresponding indicators (Adger et al., 2004; Brooks et al., 2005; de Franca et al., 2009; Tompkins et al., 2010). In a joint initiative, the Deutche Gesellschaft für Internationale Zusammenarbeit (GIZ) and the World Resources Institute (WRI) propose a six-step process for developing an M&E system for adaptation-related activities in developing countries. The framework suggests that practitioners undertake an examination of the adaptation context that contributes to the formulation of an adaptation theory of change, as well as the selection of indicators and baselines (McGray and Spearman, 2011).
Evaluation efforts are also underway within the context of adaptation-specific projects, which usually have clearly defined objectives, time-frames and budgets. In some cases such evaluations have been extended to project portfolios and not just individual projects. Examples of such M&E frameworks have been developed by the Global Environmental Facility (GEF) and the United Nations Development Programme (UNDP). GEF (2008) outlines the overall goal of an M&E system for adaptation “to identify aspects that are working, those that are not working, and the reasons why, as well as providing mechanisms to adjust the adaptation process accordingly”. In a linked but slightly different approach, the UNDP framework emphasises that adaptation is not a discrete outcome, but a diverse set of activities aimed at achieving development objectives under a changing climate (Brooks and Frankel-Reed, 2008). The framework encompasses evaluation at the level of specific projects, as well as portfolios of projects. Four clusters of indicators are developed to evaluate projects and portfolios in terms of coverage, impact, sustainability, and replicability. More recently, result based management frameworks are being developed
ENV/WKP(2011)8
12
at the programmatic level by the multilateral banks for the Pilot Programme on Climate Resilience (PPCR), under the Climate Investment Funds (CIFs) and for the Adaptation Fund.
These initiatives are still relatively recent, and the frameworks that are being developed are yet to be comprehensively tested and applied in the evaluation of adaptation projects and programmes in real world settings. Furthermore, adaptation-specific activities do not yet have a long record of implementation. There is, however, a long history of implementing development projects and programmes that have adaptation-related aspects, such as livelihood diversification in drought-prone areas and flood control infrastructure. Many of these activities have also been assessed using existing M&E mechanisms within development co-operation agencies. Therefore, prior to establishing dedicated M&E mechanisms for climate change adaptation, it is worth examining the suitability of existing M&E tools used by development agencies for adaptation-related projects.
This study draws on the extensive experience of bilateral development agencies in evaluating their activities. Based on these findings the study outlines some lessons on M&E for adaptation. While many actors, such as non-governmental organisations, international funds and multilateral development agencies contribute to the implementation of development projects, most adaptation financing is channelled through multilateral or bilateral development agencies. Furthermore, bilateral development agencies require the use of rigorous M&E practices in order to ensure efficient use of taxpayers’ money and to demonstrate that development objectives are met.
Comparing the approaches used by development agencies in evaluating adaptation-related projects, this analysis will address the following questions:
i) What are the particular characteristics of M&E in the context of adaptation?
ii) What lessons can be learned on the choice and use of indicators in the context of adaptation?
This paper will use the definition of adaptation proposed by the OECD Development Assistance Committee (DAC): “An activity should be classified as adaptation-related if it intends to reduce the vulnerability of human or natural systems to the impacts of climate change and climate related risks, by maintaining or increasing adaptive capacity or resilience” (OECD, 2010).
2. Data Sources
In order to benefit from the experience of development agencies in monitoring and evaluating their activities, some of the major bilateral agencies were contacted and asked if they could provide examples of their activities with an adaptation component and all available M&E documents. The following agencies responded:
• Canadian International Development Agency (CIDA);
• UK Department for International Development (DFID);
• Directorate General for International Cooperation of the Netherlands (DGIS);
• Japan International Cooperation Agency (JICA);
• Swiss Agency for Development and Cooperation (SDC);
• Swedish International Development Cooperation Agency (Sida).
ENV/WKP(2011)8
13
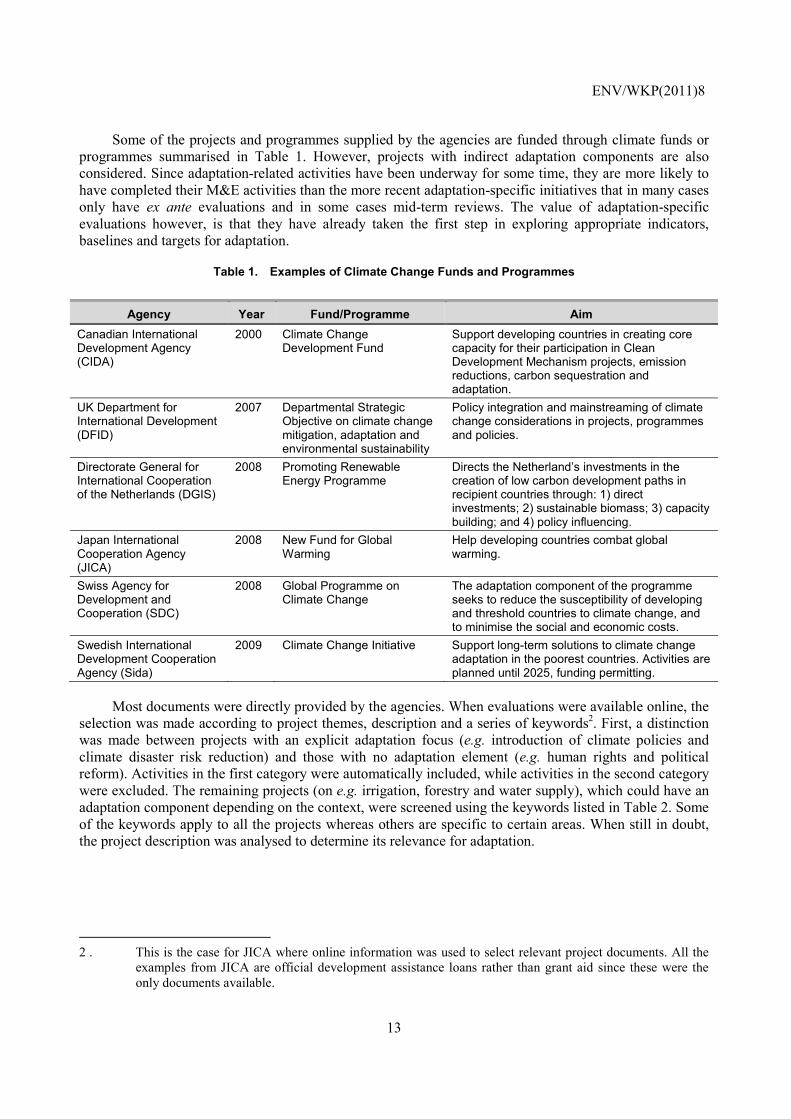
Some of the projects and programmes supplied by the agencies are funded through climate funds or programmes summarised in Table 1. However, projects with indirect adaptation components are also considered. Since adaptation-related activities have been underway for some time, they are more likely to have completed their M&E activities than the more recent adaptation-specific initiatives that in many cases only have ex ante evaluations and in some cases mid-term reviews. The value of adaptation-specific evaluations however, is that they have already taken the first step in exploring appropriate indicators, baselines and targets for adaptation.
Table 1. Examples of Climate Change Funds and Programmes
Most documents were directly provided by the agencies. When evaluations were available online, the selection was made according to project themes, description and a series of keywords2. First, a distinction was made between projects with an explicit adaptation focus (e.g. introduction of climate policies and climate disaster risk reduction) and those with no adaptation element (e.g. human rights and political reform). Activities in the first category were automatically included, while activities in the second category were excluded. The remaining projects (on e.g. irrigation, forestry and water supply), which could have an adaptation component depending on the context, were screened using the keywords listed in Table 2. Some of the keywords apply to all the projects whereas others are specific to certain areas. When still in doubt, the project description was analysed to determine its relevance for adaptation.
2 . This is the case for JICA where online information was used to select relevant project documents. All the
examples from JICA are official development assistance loans rather than grant aid since these were the only documents available.
Agency Year Fund/Programme Aim Canadian International Development Agency (CIDA)
2000 Climate Change Development Fund
Support developing countries in creating core capacity for their participation in Clean Development Mechanism projects, emission reductions, carbon sequestration and adaptation.
UK Department for International Development (DFID)
2007 Departmental Strategic Objective on climate change mitigation, adaptation and environmental sustainability
Policy integration and mainstreaming of climate change considerations in projects, programmes and policies.
Directorate General for International Cooperation of the Netherlands (DGIS)
2008 Promoting Renewable Energy Programme
Directs the Netherland’s investments in the creation of low carbon development paths in recipient countries through: 1) direct investments; 2) sustainable biomass; 3) capacity building; and 4) policy influencing.
Japan International Cooperation Agency (JICA)
2008 New Fund for Global Warming
Help developing countries combat global warming.
Swiss Agency for Development and Cooperation (SDC)
2008 Global Programme on Climate Change
The adaptation component of the programme seeks to reduce the susceptibility of developing and threshold countries to climate change, and to minimise the social and economic costs.
Swedish International Development Cooperation Agency (Sida)
2009 Climate Change Initiative Support long-term solutions to climate change adaptation in the poorest countries. Activities are planned until 2025, funding permitting.
ENV/WKP(2011)8
14
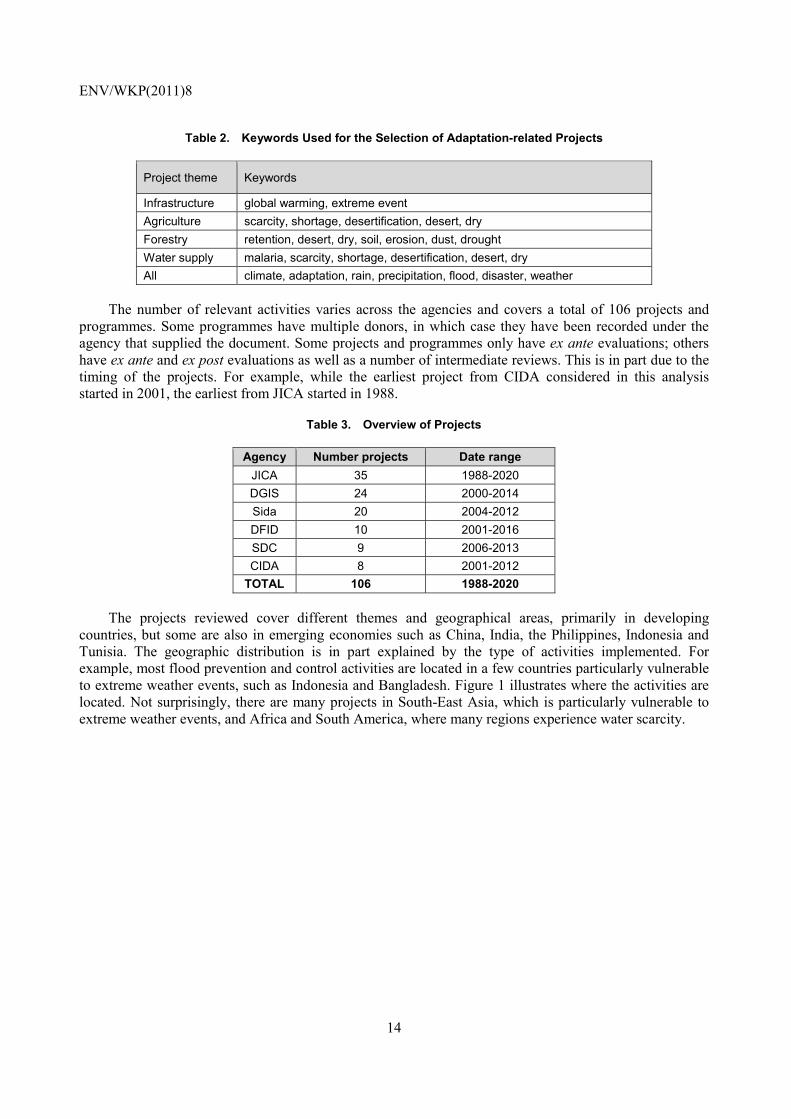
Table 2. Keywords Used for the Selection of Adaptation-related Projects
Project theme Keywords
Infrastructure global warming, extreme event Agriculture scarcity, shortage, desertification, desert, dry Forestry retention, desert, dry, soil, erosion, dust, drought Water supply malaria, scarcity, shortage, desertification, desert, dry All climate, adaptation, rain, precipitation, flood, disaster, weather
The number of relevant activities varies across the agencies and covers a total of 106 projects and programmes. Some programmes have multiple donors, in which case they have been recorded under the agency that supplied the document. Some projects and programmes only have ex ante evaluations; others have ex ante and ex post evaluations as well as a number of intermediate reviews. This is in part due to the timing of the projects. For example, while the earliest project from CIDA considered in this analysis started in 2001, the earliest from JICA started in 1988.
Table 3. Overview of Projects
Agency Number projects Date rangeJICA 35 1988-2020 DGIS 24 2000-2014 Sida 20 2004-2012 DFID 10 2001-2016 SDC 9 2006-2013 CIDA 8 2001-2012
TOTAL 106 1988-2020
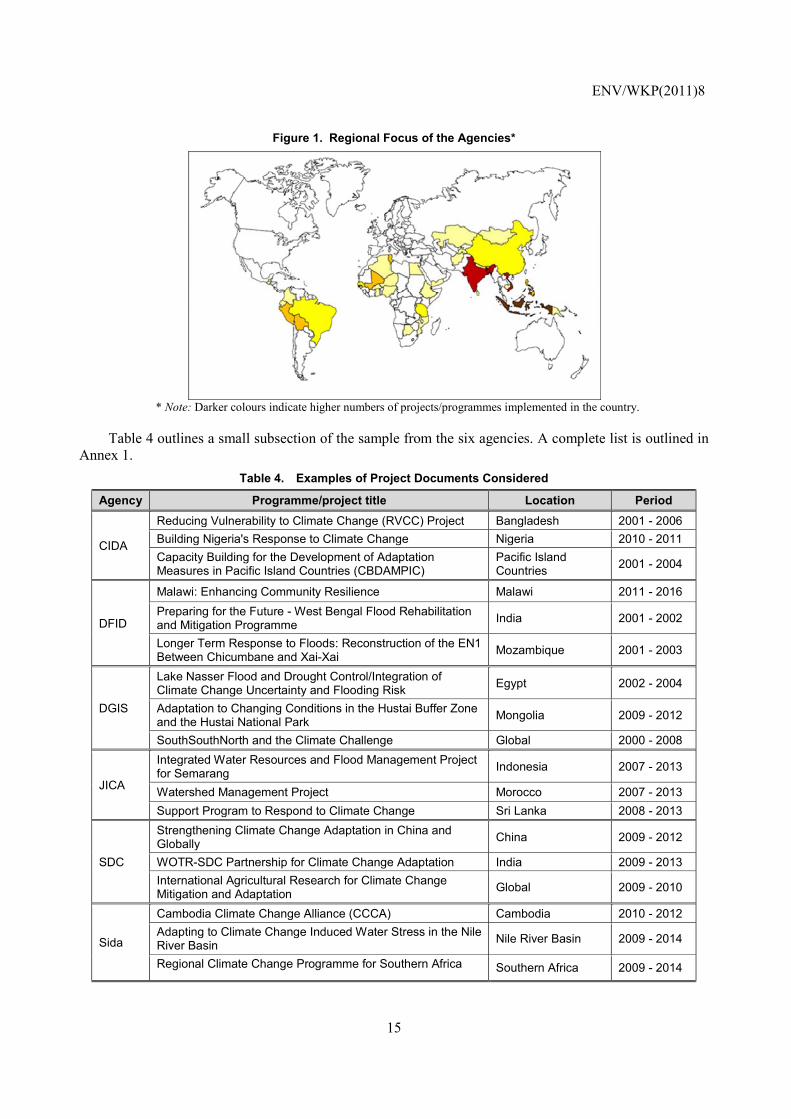
The projects reviewed cover different themes and geographical areas, primarily in developing countries, but some are also in emerging economies such as China, India, the Philippines, Indonesia and Tunisia. The geographic distribution is in part explained by the type of activities implemented. For example, most flood prevention and control activities are located in a few countries particularly vulnerable to extreme weather events, such as Indonesia and Bangladesh. Figure 1 illustrates where the activities are located. Not surprisingly, there are many projects in South-East Asia, which is particularly vulnerable to extreme weather events, and Africa and South America, where many regions experience water scarcity.
ENV/WKP(2011)8
15
Figure 1. Regional Focus of the Agencies*
* Note: Darker colours indicate higher numbers of projects/programmes implemented in the country.
Table 4 outlines a small subsection of the sample from the six agencies. A complete list is outlined in Annex 1.
Table 4. Examples of Project Documents Considered
Agency Programme/project title Location Period
CIDA
Reducing Vulnerability to Climate Change (RVCC) Project Bangladesh 2001 - 2006 Building Nigeria's Response to Climate Change Nigeria 2010 - 2011 Capacity Building for the Development of Adaptation Measures in Pacific Island Countries (CBDAMPIC)
Pacific Island Countries 2001 - 2004
DFID
Malawi: Enhancing Community Resilience Malawi 2011 - 2016 Preparing for the Future - West Bengal Flood Rehabilitation and Mitigation Programme India 2001 - 2002
Longer Term Response to Floods: Reconstruction of the EN1 Between Chicumbane and Xai-Xai Mozambique 2001 - 2003
DGIS
Lake Nasser Flood and Drought Control/Integration of Climate Change Uncertainty and Flooding Risk Egypt 2002 - 2004
Adaptation to Changing Conditions in the Hustai Buffer Zone and the Hustai National Park Mongolia 2009 - 2012
SouthSouthNorth and the Climate Challenge Global 2000 - 2008
JICA
Integrated Water Resources and Flood Management Project for Semarang Indonesia 2007 - 2013
Watershed Management Project Morocco 2007 - 2013 Support Program to Respond to Climate Change Sri Lanka 2008 - 2013
SDC
Strengthening Climate Change Adaptation in China and Globally China 2009 - 2012
WOTR-SDC Partnership for Climate Change Adaptation India 2009 - 2013 International Agricultural Research for Climate Change Mitigation and Adaptation Global 2009 - 2010
Sida
Cambodia Climate Change Alliance (CCCA) Cambodia 2010 - 2012 Adapting to Climate Change Induced Water Stress in the Nile River Basin Nile River Basin 2009 - 2014
Regional Climate Change Programme for Southern Africa Southern Africa 2009 - 2014
ENV/WKP(2011)8
16
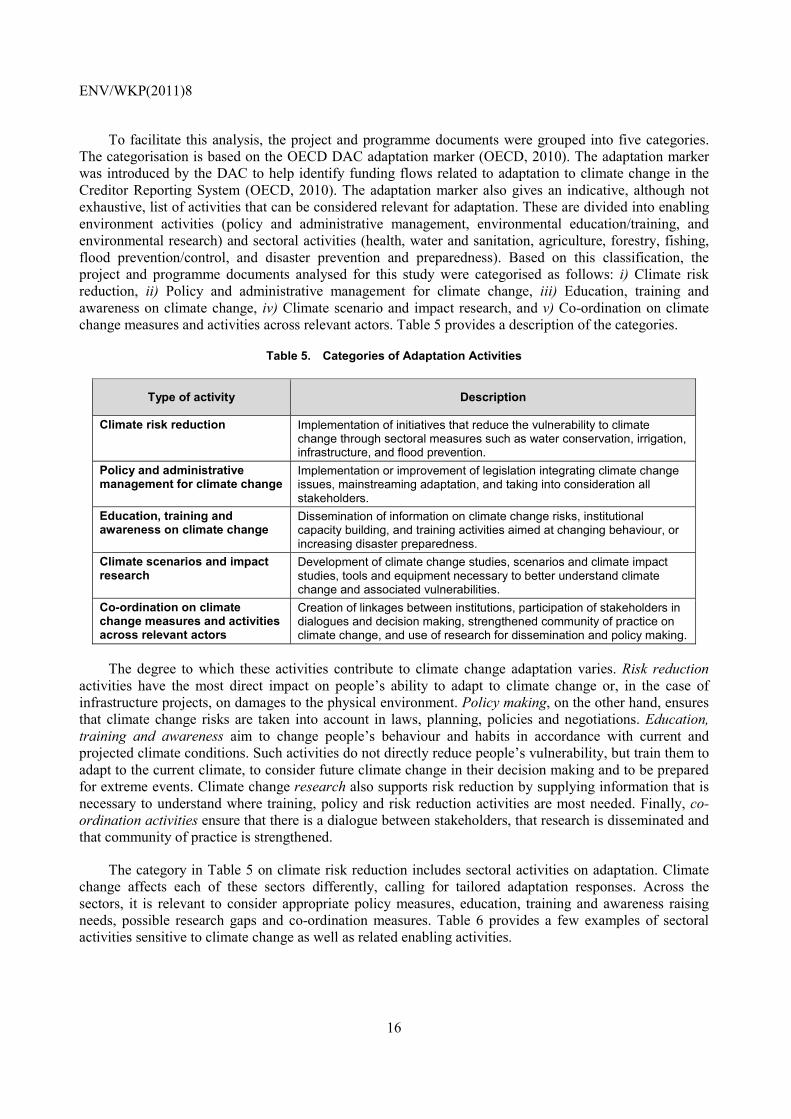
To facilitate this analysis, the project and programme documents were grouped into five categories. The categorisation is based on the OECD DAC adaptation marker (OECD, 2010). The adaptation marker was introduced by the DAC to help identify funding flows related to adaptation to climate change in the Creditor Reporting System (OECD, 2010). The adaptation marker also gives an indicative, although not exhaustive, list of activities that can be considered relevant for adaptation. These are divided into enabling environment activities (policy and administrative management, environmental education/training, and environmental research) and sectoral activities (health, water and sanitation, agriculture, forestry, fishing, flood prevention/control, and disaster prevention and preparedness). Based on this classification, the project and programme documents analysed for this study were categorised as follows: i) Climate risk reduction, ii) Policy and administrative management for climate change, iii) Education, training and awareness on climate change, iv) Climate scenario and impact research, and v) Co-ordination on climate change measures and activities across relevant actors. Table 5 provides a description of the categories.
Table 5. Categories of Adaptation Activities
Type of activity Description
Climate risk reduction Implementation of initiatives that reduce the vulnerability to climate change through sectoral measures such as water conservation, irrigation, infrastructure, and flood prevention.
Policy and administrative management for climate change
Implementation or improvement of legislation integrating climate change issues, mainstreaming adaptation, and taking into consideration all stakeholders.
Education, training and awareness on climate change
Dissemination of information on climate change risks, institutional capacity building, and training activities aimed at changing behaviour, or increasing disaster preparedness.
Climate scenarios and impact research
Development of climate change studies, scenarios and climate impact studies, tools and equipment necessary to better understand climate change and associated vulnerabilities.
Co-ordination on climate change measures and activities across relevant actors
Creation of linkages between institutions, participation of stakeholders in dialogues and decision making, strengthened community of practice on climate change, and use of research for dissemination and policy making.
The degree to which these activities contribute to climate change adaptation varies. Risk reduction activities have the most direct impact on people’s ability to adapt to climate change or, in the case of infrastructure projects, on damages to the physical environment. Policy making, on the other hand, ensures that climate change risks are taken into account in laws, planning, policies and negotiations. Education, training and awareness aim to change people’s behaviour and habits in accordance with current and projected climate conditions. Such activities do not directly reduce people’s vulnerability, but train them to adapt to the current climate, to consider future climate change in their decision making and to be prepared for extreme events. Climate change research also supports risk reduction by supplying information that is necessary to understand where training, policy and risk reduction activities are most needed. Finally, co-ordination activities ensure that there is a dialogue between stakeholders, that research is disseminated and that community of practice is strengthened.
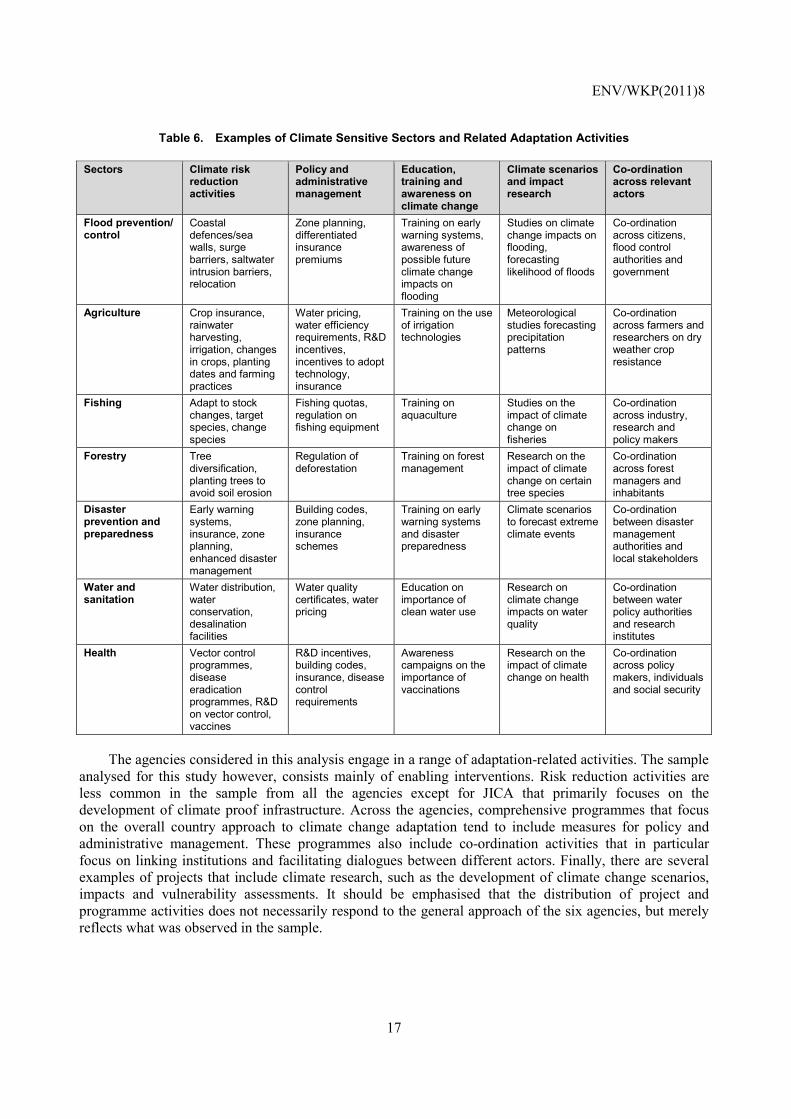
The category in Table 5 on climate risk reduction includes sectoral activities on adaptation. Climate change affects each of these sectors differently, calling for tailored adaptation responses. Across the sectors, it is relevant to consider appropriate policy measures, education, training and awareness raising needs, possible research gaps and co-ordination measures. Table 6 provides a few examples of sectoral activities sensitive to climate change as well as related enabling activities.
ENV/WKP(2011)8
17
Table 6. Examples of Climate Sensitive Sectors and Related Adaptation Activities
Sectors Climate risk reduction activities
Policy and administrative management
Education, training and awareness on climate change
Climate scenarios and impact research
Co-ordination across relevant actors
Flood prevention/ control
Coastal defences/sea walls, surge barriers, saltwater intrusion barriers, relocation
Zone planning, differentiated insurance premiums
Training on early warning systems, awareness of possible future climate change impacts on flooding
Studies on climate change impacts on flooding, forecasting likelihood of floods
Co-ordination across citizens, flood control authorities and government
Agriculture Crop insurance, rainwater harvesting, irrigation, changes in crops, planting dates and farming practices
Water pricing, water efficiency requirements, R&D incentives, incentives to adopt technology, insurance
Training on the use of irrigation technologies
Meteorological studies forecasting precipitation patterns
Co-ordination across farmers and researchers on dry weather crop resistance
Fishing Adapt to stock changes, target species, change species
Fishing quotas, regulation on fishing equipment
Training on aquaculture
Studies on the impact of climate change on fisheries
Co-ordination across industry, research and policy makers
Forestry Tree diversification, planting trees to avoid soil erosion
Regulation of deforestation
Training on forest management
Research on the impact of climate change on certain tree species
Co-ordination across forest managers and inhabitants
Disaster prevention and preparedness
Early warning systems, insurance, zone planning, enhanced disaster management
Building codes, zone planning, insurance schemes
Training on early warning systems and disaster preparedness
Climate scenarios to forecast extreme climate events
Co-ordination between disaster management authorities and local stakeholders
Water and sanitation
Water distribution, water conservation, desalination facilities
Water quality certificates, water pricing
Education on importance of clean water use
Research on climate change impacts on water quality
Co-ordination between water policy authorities and research institutes
Health Vector control programmes, disease eradication programmes, R&D on vector control, vaccines
R&D incentives, building codes, insurance, disease control requirements
Awareness campaigns on the importance of vaccinations
Research on the impact of climate change on health
Co-ordination across policy makers, individuals and social security
The agencies considered in this analysis engage in a range of adaptation-related activities. The sample analysed for this study however, consists mainly of enabling interventions. Risk reduction activities are less common in the sample from all the agencies except for JICA that primarily focuses on the development of climate proof infrastructure. Across the agencies, comprehensive programmes that focus on the overall country approach to climate change adaptation tend to include measures for policy and administrative management. These programmes also include co-ordination activities that in particular focus on linking institutions and facilitating dialogues between different actors. Finally, there are several examples of projects that include climate research, such as the development of climate change scenarios, impacts and vulnerability assessments. It should be emphasised that the distribution of project and programme activities does not necessarily respond to the general approach of the six agencies, but merely reflects what was observed in the sample.
ENV/WKP(2011)8
18
3. Overview of M&E Approaches
Monitoring refers to the systematic collection of data on pre-defined project or programme indicators. It enables the stakeholders involved to check whether an initiative is on track in achieving set objectives (OECD, 2002; GEF, 2010). Evaluation measures change over time, as well as the strengths and weaknesses of project or programme design. A majority of the agencies in this study use Result Based Management (RBM) to design and manage their projects and programmes. RBM is defined as “a management strategy focusing on performance and achievement of outputs, outcomes and impacts” (OECD, 2002). The three levels are:
• Output: the products, capital goods and services which result from a development intervention; may also include changes resulting from the intervention that are relevant to the achievement of outcomes.
• Outcome: the likely or achieved short-term and medium-term effects of an intervention’s outputs.
• Impact: positive and negative, primary and secondary long-term effects produced by a development intervention, directly or indirectly, intended or unintended.
RBM consists of two components: i) implementation measurements to ensure that project or programme inputs and activities are in compliance with the design budget and work plan, and ii) result measurements examining the achievement of project objectives in terms of immediate outputs, intermediate outcomes and long-term impacts (OECD, 2001). The second component includes a wide range of activities, such as setting objectives, developing indicators, defining targets, monitoring performance and analysing results vis-à-vis targets. For the second component, the Logical Framework Approach (LFA) and the accompanying logframe are commonly used (see Box 1 for a brief overview).
Once objectives have been defined, there are a number of practical challenges in accounting for unexpected outcomes and measuring attribution. Longer-term impacts are unlikely to result from the project alone, but rather from a series of interventions in the target area (Bakewell and Garbutt, 2005). The challenge is to identify the short- and long-term outcomes attributable to that specific intervention. This is sometimes referred to as the ‘attribution gap”. Furthermore, the requirement to use objectively verifiable indicators can lead to the use of indicators that are easily measurable within the time-frame of the project, rather than those that are most closely aligned to the intended outcomes.
ENV/WKP(2011)8
19
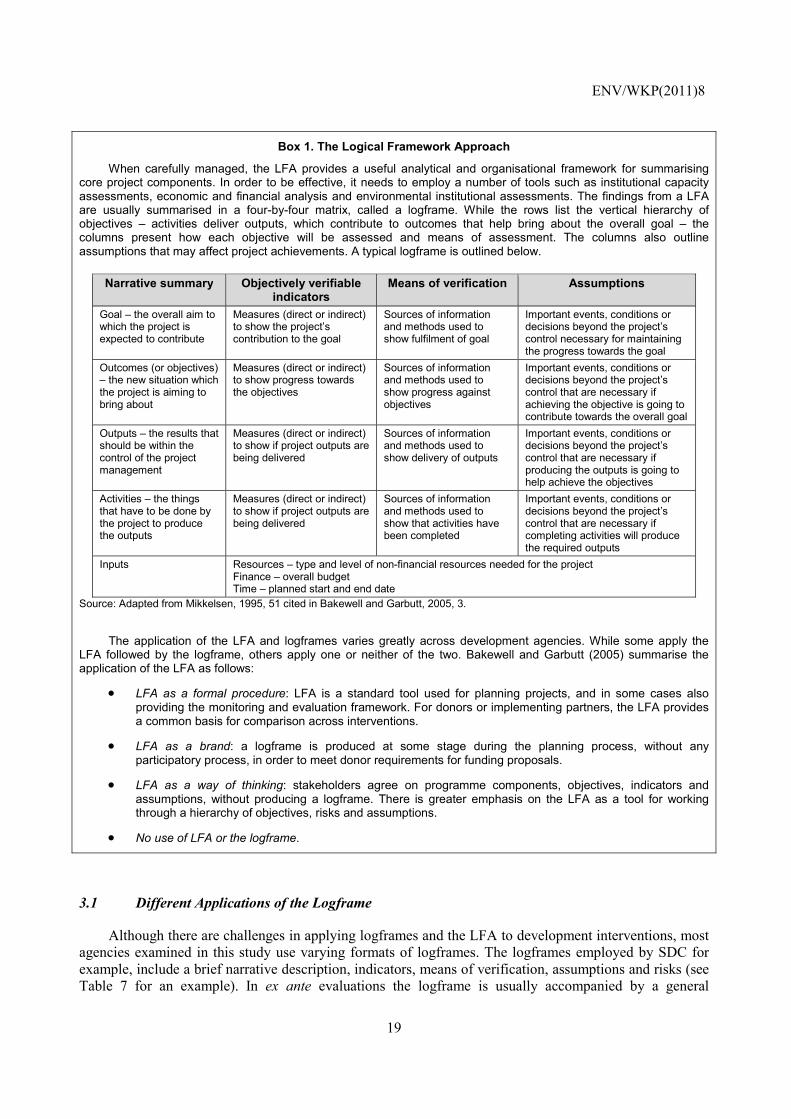
Box 1. The Logical Framework Approach
When carefully managed, the LFA provides a useful analytical and organisational framework for summarising core project components. In order to be effective, it needs to employ a number of tools such as institutional capacity assessments, economic and financial analysis and environmental institutional assessments. The findings from a LFA are usually summarised in a four-by-four matrix, called a logframe. While the rows list the vertical hierarchy of objectives – activities deliver outputs, which contribute to outcomes that help bring about the overall goal – the columns present how each objective will be assessed and means of assessment. The columns also outline assumptions that may affect project achievements. A typical logframe is outlined below.
Narrative summary Objectively verifiable indicators
Means of verification Assumptions
Goal – the overall aim to which the project is expected to contribute
Measures (direct or indirect) to show the project’s contribution to the goal
Sources of information and methods used to show fulfilment of goal
Important events, conditions or decisions beyond the project’s control necessary for maintaining the progress towards the goal
Outcomes (or objectives) – the new situation which the project is aiming to bring about
Measures (direct or indirect) to show progress towards the objectives
Sources of information and methods used to show progress against objectives
Important events, conditions or decisions beyond the project’s control that are necessary if achieving the objective is going to contribute towards the overall goal
Outputs – the results that should be within the control of the project management
Measures (direct or indirect) to show if project outputs are being delivered
Sources of information and methods used to show delivery of outputs
Important events, conditions or decisions beyond the project’s control that are necessary if producing the outputs is going to help achieve the objectives
Activities – the things that have to be done by the project to produce the outputs
Measures (direct or indirect) to show if project outputs are being delivered
Sources of information and methods used to show that activities have been completed
Important events, conditions or decisions beyond the project’s control that are necessary if completing activities will produce the required outputs
Inputs Resources – type and level of non-financial resources needed for the project Finance – overall budget Time – planned start and end date
Source: Adapted from Mikkelsen, 1995, 51 cited in Bakewell and Garbutt, 2005, 3.
The application of the LFA and logframes varies greatly across development agencies. While some apply the LFA followed by the logframe, others apply one or neither of the two. Bakewell and Garbutt (2005) summarise the application of the LFA as follows:
• LFA as a formal procedure: LFA is a standard tool used for planning projects, and in some cases also providing the monitoring and evaluation framework. For donors or implementing partners, the LFA provides a common basis for comparison across interventions.
• LFA as a brand: a logframe is produced at some stage during the planning process, without any participatory process, in order to meet donor requirements for funding proposals.
• LFA as a way of thinking: stakeholders agree on programme components, objectives, indicators and assumptions, without producing a logframe. There is greater emphasis on the LFA as a tool for working through a hierarchy of objectives, risks and assumptions.
• No use of LFA or the logframe.
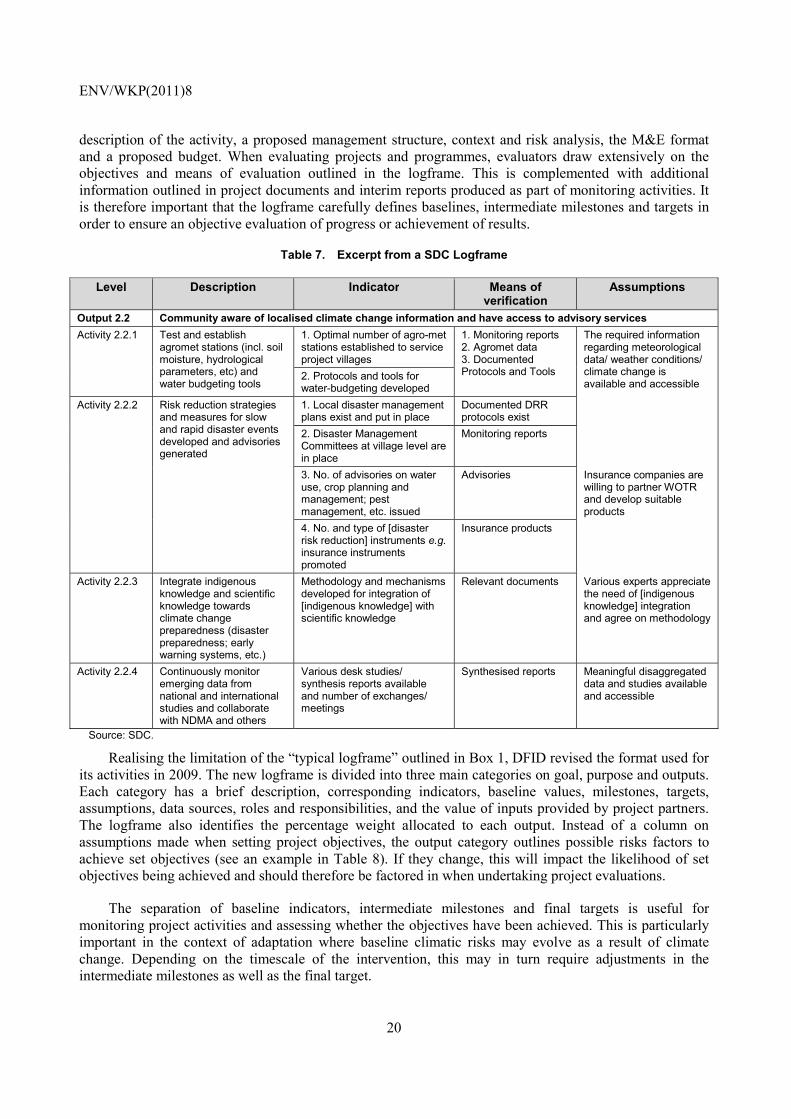
3.1 Different Applications of the Logframe
Although there are challenges in applying logframes and the LFA to development interventions, most agencies examined in this study use varying formats of logframes. The logframes employed by SDC for example, include a brief narrative description, indicators, means of verification, assumptions and risks (see Table 7 for an example). In ex ante evaluations the logframe is usually accompanied by a general
ENV/WKP(2011)8
20
description of the activity, a proposed management structure, context and risk analysis, the M&E format and a proposed budget. When evaluating projects and programmes, evaluators draw extensively on the objectives and means of evaluation outlined in the logframe. This is complemented with additional information outlined in project documents and interim reports produced as part of monitoring activities. It is therefore important that the logframe carefully defines baselines, intermediate milestones and targets in order to ensure an objective evaluation of progress or achievement of results.
Table 7. Excerpt from a SDC Logframe
Level Description Indicator Means of verification
Assumptions
Output 2.2 Community aware of localised climate change information and have access to advisory services Activity 2.2.1 Test and establish
agromet stations (incl. soil moisture, hydrological parameters, etc) and water budgeting tools
1. Optimal number of agro-met stations established to service project villages
1. Monitoring reports 2. Agromet data 3. Documented Protocols and Tools
The required information regarding meteorological data/ weather conditions/ climate change is available and accessible
2. Protocols and tools for water-budgeting developed
Activity 2.2.2 Risk reduction strategies and measures for slow and rapid disaster events developed and advisories generated
1. Local disaster management plans exist and put in place
Documented DRR protocols exist
2. Disaster Management Committees at village level are in place
Monitoring reports
3. No. of advisories on water use, crop planning and management; pest management, etc. issued
Advisories Insurance companies are willing to partner WOTR and develop suitable products
4. No. and type of [disaster risk reduction] instruments e.g. insurance instruments promoted
Insurance products
Activity 2.2.3 Integrate indigenous knowledge and scientific knowledge towards climate change preparedness (disaster preparedness; early warning systems, etc.)
Methodology and mechanisms developed for integration of [indigenous knowledge] with scientific knowledge
Relevant documents Various experts appreciate the need of [indigenous knowledge] integration and agree on methodology
Activity 2.2.4 Continuously monitor emerging data from national and international studies and collaborate with NDMA and others
Various desk studies/ synthesis reports available and number of exchanges/ meetings
Synthesised reports Meaningful disaggregated data and studies available and accessible
Source: SDC.
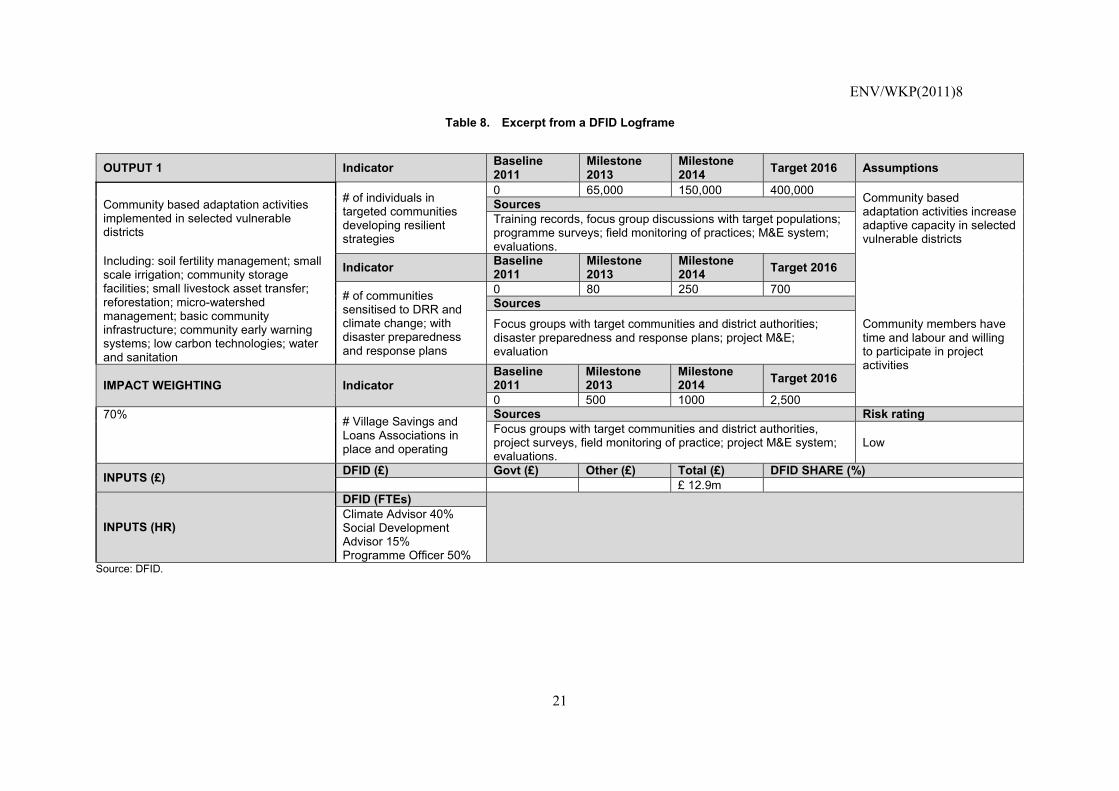
Realising the limitation of the “typical logframe” outlined in Box 1, DFID revised the format used for its activities in 2009. The new logframe is divided into three main categories on goal, purpose and outputs. Each category has a brief description, corresponding indicators, baseline values, milestones, targets, assumptions, data sources, roles and responsibilities, and the value of inputs provided by project partners. The logframe also identifies the percentage weight allocated to each output. Instead of a column on assumptions made when setting project objectives, the output category outlines possible risks factors to achieve set objectives (see an example in Table 8). If they change, this will impact the likelihood of set objectives being achieved and should therefore be factored in when undertaking project evaluations.
The separation of baseline indicators, intermediate milestones and final targets is useful for monitoring project activities and assessing whether the objectives have been achieved. This is particularly important in the context of adaptation where baseline climatic risks may evolve as a result of climate change. Depending on the timescale of the intervention, this may in turn require adjustments in the intermediate milestones as well as the final target.
ENV/WKP(2011)8
21
Table 8. Excerpt from a DFID Logframe
OUTPUT 1 Indicator Baseline 2011
Milestone 2013
Milestone 2014 Target 2016 Assumptions
Community based adaptation activities implemented in selected vulnerable districts
# of individuals in targeted communities developing resilient strategies
0 65,000 150,000 400,000 Community based adaptation activities increase adaptive capacity in selected vulnerable districts
SourcesTraining records, focus group discussions with target populations; programme surveys; field monitoring of practices; M&E system; evaluations.
Including: soil fertility management; small scale irrigation; community storage facilities; small livestock asset transfer; reforestation; micro-watershed management; basic community infrastructure; community early warning systems; low carbon technologies; water and sanitation
Indicator Baseline 2011
Milestone 2013
Milestone 2014 Target 2016
# of communities sensitised to DRR and climate change; with disaster preparedness and response plans
0 80 250 700
Community members have time and labour and willing to participate in project activities
SourcesFocus groups with target communities and district authorities; disaster preparedness and response plans; project M&E; evaluation
IMPACT WEIGHTING Indicator Baseline 2011
Milestone 2013
Milestone 2014 Target 2016
0 500 1000 2,500 70% # Village Savings and
Loans Associations in place and operating
Sources Risk rating
Focus groups with target communities and district authorities, project surveys, field monitoring of practice; project M&E system; evaluations.
Low
INPUTS (£) DFID (£) Govt (£) Other (£) Total (£) DFID SHARE (%) £ 12.9m
INPUTS (HR)
DFID (FTEs)
Climate Advisor 40% Social Development Advisor 15% Programme Officer 50%
Source: DFID.
ENV/WKP(2011)8
22
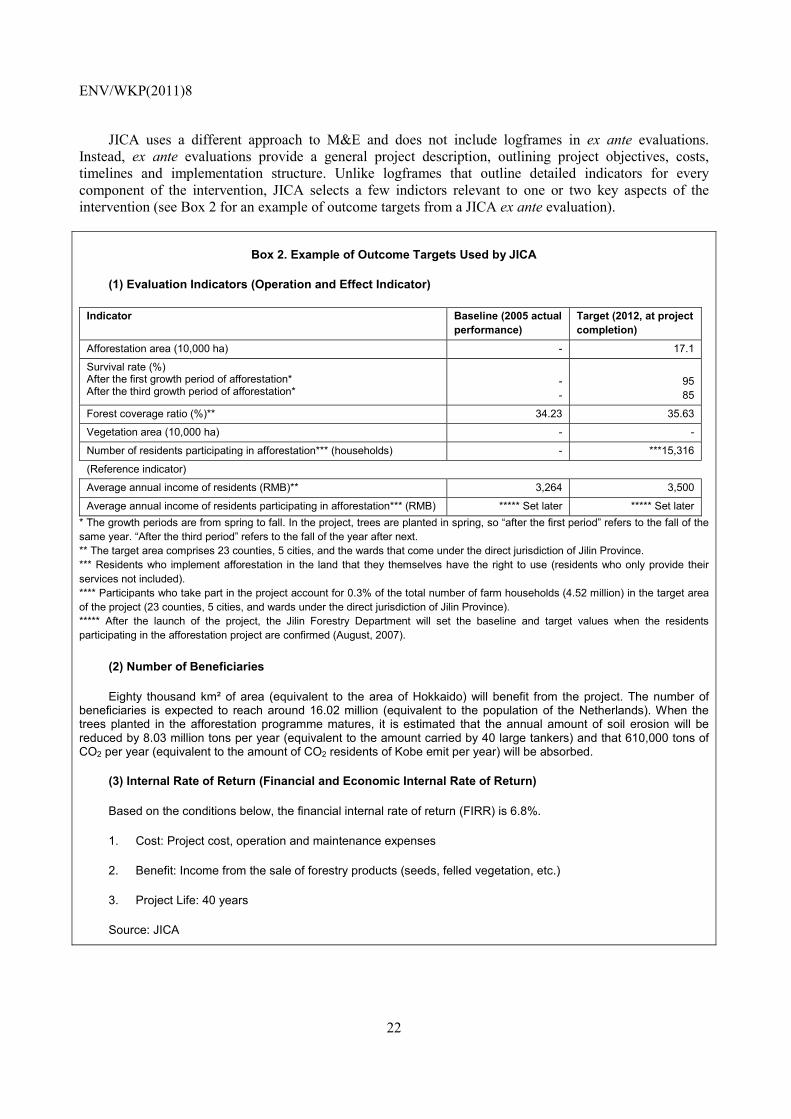
JICA uses a different approach to M&E and does not include logframes in ex ante evaluations. Instead, ex ante evaluations provide a general project description, outlining project objectives, costs, timelines and implementation structure. Unlike logframes that outline detailed indicators for every component of the intervention, JICA selects a few indictors relevant to one or two key aspects of the intervention (see Box 2 for an example of outcome targets from a JICA ex ante evaluation).
Box 2. Example of Outcome Targets Used by JICA
(1) Evaluation Indicators (Operation and Effect Indicator)
Indicator Baseline (2005 actual performance)
Target (2012, at project completion)
Afforestation area (10,000 ha) - 17.1
Survival rate (%) After the first growth period of afforestation* After the third growth period of afforestation*
- -
95 85
Forest coverage ratio (%)** 34.23 35.63
Vegetation area (10,000 ha) - -
Number of residents participating in afforestation*** (households) - ***15,316
(Reference indicator)
Average annual income of residents (RMB)** 3,264 3,500
Average annual income of residents participating in afforestation*** (RMB) ***** Set later ***** Set later * The growth periods are from spring to fall. In the project, trees are planted in spring, so “after the first period” refers to the fall of the same year. “After the third period” refers to the fall of the year after next. ** The target area comprises 23 counties, 5 cities, and the wards that come under the direct jurisdiction of Jilin Province. *** Residents who implement afforestation in the land that they themselves have the right to use (residents who only provide their services not included). **** Participants who take part in the project account for 0.3% of the total number of farm households (4.52 million) in the target area of the project (23 counties, 5 cities, and wards under the direct jurisdiction of Jilin Province). ***** After the launch of the project, the Jilin Forestry Department will set the baseline and target values when the residents participating in the afforestation project are confirmed (August, 2007).
(2) Number of Beneficiaries
Eighty thousand km² of area (equivalent to the area of Hokkaido) will benefit from the project. The number of beneficiaries is expected to reach around 16.02 million (equivalent to the population of the Netherlands). When the trees planted in the afforestation programme matures, it is estimated that the annual amount of soil erosion will be reduced by 8.03 million tons per year (equivalent to the amount carried by 40 large tankers) and that 610,000 tons of CO2 per year (equivalent to the amount of CO2 residents of Kobe emit per year) will be absorbed.
(3) Internal Rate of Return (Financial and Economic Internal Rate of Return)
Based on the conditions below, the financial internal rate of return (FIRR) is 6.8%.
1. Cost: Project cost, operation and maintenance expenses
2. Benefit: Income from the sale of forestry products (seeds, felled vegetation, etc.)
3. Project Life: 40 years
Source: JICA

ENV/WKP(2011)8
23
A common feature of the approaches used by SDC and DFID is the separation between goals, outcomes and outputs. When evaluating the success in achieving set goals, indicators measure broad impacts that are partially - but not exclusively - brought about by the intervention. At outcome and output levels, however, indicators measure more tangible achievements directly resulting from the activity. With accurate baseline data, the evaluator is able to assess whether milestones and targets have been achieved. The approaches differ in the additional level of detail introduced in DFID’s revised format, which clearly outlines who does what by when and how. This is crucial when many stakeholders are involved and programme structures are complex.
The advantage of the approach used by JICA is that it gives managers flexibility to revise project components according to the situation on the ground. This helps evaluators to examine unintended aspects of the intervention that were not specified in the ex ante evaluation. This however, requires a good understanding of the activity to ensure that evaluators do not lose sight of the broad objectives when assessing impact and effectiveness. For all three approaches, a certain level of flexibility is needed to ensure that all relevant issues are considered.
3.2 Intermediate Performance and Review Measures
There is some variation in the summative evaluations used by the six agencies included in this study. An interesting example is CIDA’s annual performance reports that assess results achieved to date, lessons learned, expected long-term impact, and contribution of interventions to particular focus areas (e.g. gender equality). The section on lessons learned focuses on a few core components rather than specific activities, and provides suggestions for moving forward. These vary from the need to assess the potential impact of climate change on the recipient area, to the need to ensure greater participation of women in training activities. The report also includes a review of risk factors in achieving set objectives and corresponding mitigation measures. For example, in the project on Reducing Vulnerability to Climate Change in Bangladesh, one stated risk is that “communities do not have the necessary social capital to build upon to understand and plan climate change initiatives”. In response “the project will attempt to increase the communities’ understanding through workshops and communication campaigns”.
Similarly, DFID annually reviews all multi-year activities exceeding GBP 1 million3. The review format is structured as an excel sheet where project managers record progress made in achieving set objectives. They also make recommendations for moving forward. The review is usually divided into five sections on: i) project data, ii) recommendations, iii) assessment, iv) risk management and v) lessons learned. Progress made in contributing to the goal, purpose and each of the defined outputs is evaluated. An example is DFID’s South Asia Water Initiative. The target for the first output is: “Dialogue and research builds a partnership for regional co-operation on water among the countries of the Greater Himalaya (Afghanistan, Bangladesh, Bhutan, China, India, Nepal, and Pakistan)”. Progress is evaluated using two indicators: i) collaboration between researchers in the region and ii) the engagement of national figures in debates on the evidence produced by the initiative.
Progress made on each objective is scored on a scale from 1-5. A score of 1 is given if the output is “likely to be completely achieved” and 5 if it is “unlikely to be achieved”. Based on the annual review, the first output for the South Asia Water Initiative is allocated a score of 3 out of 5, meaning that it is “likely to be partly achieved”. The programme score of 3 is based on little progress made in establishing a knowledge forum and a grant scheme, both of which support enhanced national engagement. Further delaying progress is poor communication and lack of clarity on governance, architecture and memberships of a regional dialogue. In response to the score, the evaluator recommends that the governance structure of
3. This is equivalent to around USD 647.000 using a yearly average currency exchange rate for 2010 (IRS
(n.d.) and HMRS (n.d.).
ENV/WKP(2011)8
24
the dialogue and other emerging bodies is urgently clarified. A similar assessment is made for every output as well as for higher-level objectives, providing a clear overview to funding agencies and implementing partners.
A shared characteristic of the performance and review measures used by CIDA and DFID is the completion of the evaluations by implementing staff. Since the goal of the evaluations is to monitor progress and make recommendations for moving forward, implementing staff might be best placed to assess achievement of results, possible risks and appropriate strategies to address such risks. The approach used by CIDA provides a broader overview while DFID’s annual review zooms in on each individual output and outcome. The value of the two approaches will in part depend on the audience. If the goal of the review is to provide funding agencies an overview of the status of the intervention, CIDA’s approach might be preferred since it provides a succinct summary without getting into too many details. However, if the purpose of the review is to assess progress on each component and offer guidance moving forward, the approach used by DFID might be the best fit. In both cases, there is a trade-off between making use of the project staff’s specialised knowledge and the objectivity gained by using external evaluators.
4. Indicators for M&E for adaptation
A core component of RBM employed by most development agencies is the selection of concise and measurable indicators. While outputs and outcomes outline what the agency hopes to achieve, indicators show how results will be measured. Indicators can therefore be used by programme staff and partners to prioritise inputs and communicate outcomes.
Indicators range from input indicators to process, output and outcome indicators. Development agencies have traditionally focused primarily on outputs since they have less control over outcomes. An example is the number of schools built (output) compared to the number of children attending school (outcome). While school attendance depends on a range of factors, the construction of a school may directly result from a donor investment. Further complicating the reporting of outcome indicators is that no discernable change may occur over the course of the intervention. Finally, outcome indicators are often more difficult and costly to collect. However, with a narrow focus on outputs there is a risk of overstating results. For example, if a newly constructed school remains empty after project completion, the change brought about by the intervention is limited. Similarly, if people do not apply the training they have received as part of a development initiative there is no sustainable long-term change. This has led many development agencies to shift their emphasis towards outcomes rather than solely assessing outputs.
Indicators can be quantitative (e.g. the number of bridges constructed) or qualitative, requiring a more subjective evaluation. It is important to keep in mind that indicators simply provide an overview of change, but do not explain how that change came about. Finally, it is important to ensure that the means of collecting indicators will remain constant over time. This is crucial in order to ensure comparability, especially in the context of adaptation where end of programme evaluations may not take place until twenty or fifty years after programme completion.
When analysing the project documents for this study, the indicators were grouped into the broad categories of adaptation activities outlined in Section 2.1, Table 5. Although the phrasing of the indicators differs from one agency to another, there is overlap in the kinds of indicators used. In the rest of this section, a few indicators for each category will be identified and analysed. It should be noted that the indicators identified do not necessarily reflect the general approach used by the agencies, but only what was identified in the sample.
ENV/WKP(2011)8
25
4.1 Indicators on Risk Reduction
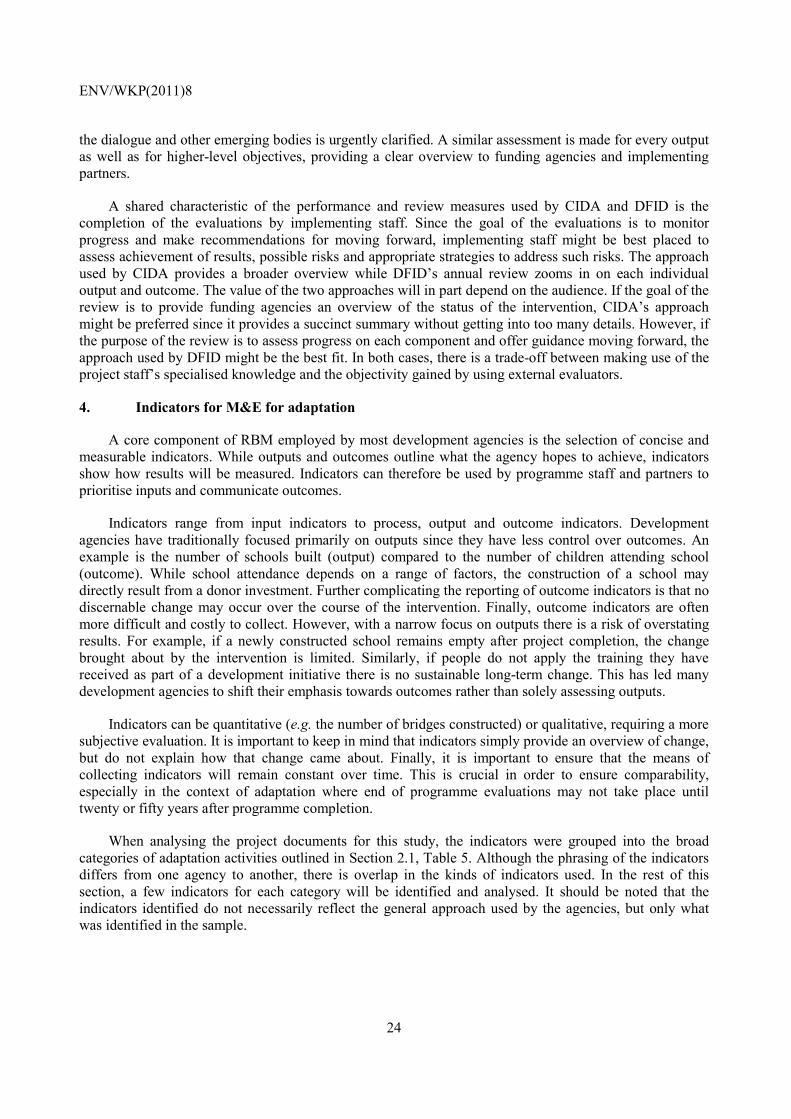
Although risk reduction measures, such as construction of dikes, afforestation and new farming techniques, have the most immediate impact on people’s vulnerability to climate change, they are not the primary focus of the sample considered in this study. The sample from JICA is an exception and focuses almost exclusively on risk reduction activities. The sample from other agencies includes a number of projects and programmes with a sectoral focus for example: water, afforestation or infrastructure. However, the majority of their activities are primarily directed towards policy mainstreaming, research, awareness raising or co-ordination. Within these broader initiatives, sub-components include risk reduction measures. Table 9 outlines some generalised risk reduction indicators identified across the six agencies.
Table 9. Common Indicators on Risk Reduction
INDICATORS CIDA DFID DGIS JICA SDC Sida No. of households/communities participating in afforestation/improved agricultural practices/watershed management
√ √ √
Area of afforestation (m2/ha) √ √ Impact of flood (no. of people affected, inundation depth, duration, value of flood damage)
√
No. and type of DRR instruments e.g. insurance instruments promoted
√
Early warning system in place √ Construction of climate-proof infrastructure √ Percentage of population with improved and sustainable access to water sources √ √ √
No. of (people benefitting from) water, livestock and natural risk management projects √ √ √ √ √
No. of households that seek out, test, adapt and adopt ideas and practices that strengthen their livelihoods √ √ √
The indicators vary according to the context and the sector, but can be grouped into two broad categories. The first includes quantitative indicators such as the number of households benefitting from risk reduction measures and the number of risk reduction measures employed. The second category includes measures of coverage such as the area of afforestation; the impact of climate shocks before and after the construction of disaster management infrastructure; and changes in livelihoods based on project intervention. An afforestation project can for example be evaluated using an indicator on the area of land afforested. Alternatively, the indicator can focus on the number of people benefitting from the project. Often, agencies will use a combination of the two.
Some projects aim to build adaptive capacity to reduce people’s vulnerability to climate change. In 2006, CIDA concluded a five-year project in Bangladesh on awareness of climate change and associated vulnerabilities. In collaboration with local organisations, the project identified and tested indigenous adaptation measures and used a participatory approach to address people’s perceived vulnerabilities. The project consisted of four components: i) household capacity to innovate livelihood strategies less vulnerable to climate change; ii) improved capacity of communities to implement adaptation strategies; iii) increased capacity of local partners in raising awareness on climate change; and iv) regular interaction by project partners with national level stakeholders on policy advocacy issues. While the last three components focus on training, awareness raising and co-ordination, the first output considers people’s adaptive capacity based on their livelihood choices.
ENV/WKP(2011)8
26
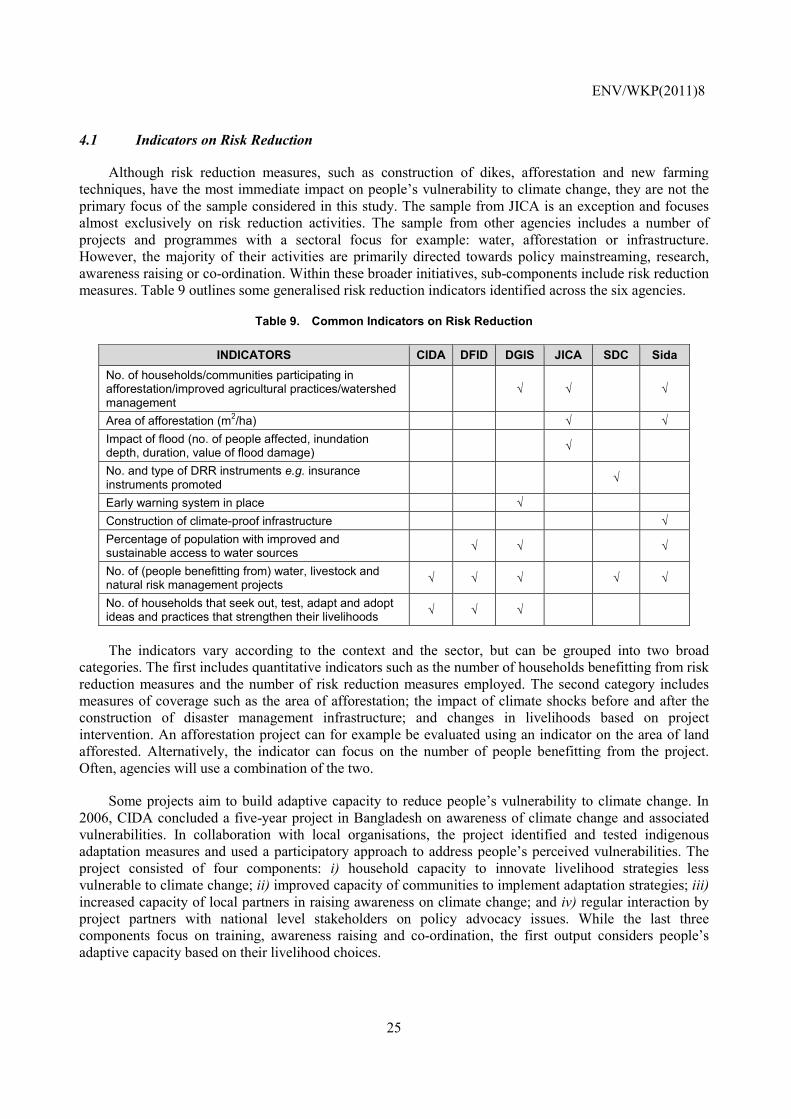
The ambiguity of concepts such as adaptive capacity and climate resilient livelihoods makes it difficult to define objective indicators. The first outcome indicator for this project is the number of households that seek out, test, adapt and adopt improved livelihood practices. The complementary output indicator measures the percentage of households with new livelihood activities resulting from the project. Complementing the output are two activities, one of which considers the ability of households to implement diversified and sustainable livelihoods while the other focuses on dissemination of research findings. For the former there are three performance indicators outlined in Figure 2.
Figure 2. CIDA Project: Outcome, Output, Activities and Indicators
Source: CIDA
The example illustrates how indicators become more focused as we move from longer-term outcomes to outputs and more immediate activities in the logframe. By looking at the outcome and output indicators, it is not clear how the uptake of new livelihood strategies is directly related to the project. It is from a corresponding activity indicator that we learn that household members have received training on alternative livelihood strategies. The activity indicators also include more detailed target values and timelines with reference to specific geographic areas. The final project report notes that the information was collected through male and female focus group discussions. Given that the indicators consider change in livelihood strategies as a result of the project, it is only through direct consultation with beneficiaries that the reasoning for the change in their livelihood choices can be understood.
ENV/WKP(2011)8
27
A DGIS project on indigenous watershed management in the Matanzas river basin in Guatemala reinforces the observation that indicators get more focused as we move down the hierarchy of objectives. The long-term goal of the project is the development of an indigenous model on integrated watershed management. Activities include improvement of watershed management, early warning systems, soil conservation techniques and agricultural practices. Contributing to the overall goal are shorter-term outputs such as the development and adoption of a strategy for the Matanzas watershed. One activity contributing to this output is: “implementation of early warning systems to reduce the vulnerability of the watershed”. An example of an output indicator is: “existence of early warning mechanisms which enable the management of risk of flooding in the watershed”.
Risk reduction is the primary focus of the majority of the sample from JICA. The rest of this section will therefore focus on JICA’s use of indicators for this category of activities. As mentioned earlier, JICA’s evaluations usually outline a few relevant indicators. These only measure one aspect of the project rather than every component. One example is an ongoing project in Indonesia. Over the past decade, Indonesia has experienced almost 50 floods affecting over 3 million people. The project document states that the floods are in part caused by changes in rainfall patterns, thought to be a result of global warming. While construction of flood control infrastructure has been concentrated on Java Island, control measures in outlying cities remain limited. The objective of the project is to help mitigate flood damage in major outlying cities by improving flood control infrastructure, upgrading the administrative capacity of river basin management officers and preparing integrated water resource management plans. Although there are three stated goals, performance indicators measure the level of flooding more generally:
• maximum channel capacity (m3/s) at the water-level measurement point or the initially scheduled construction section;
• maximum flood inundation area caused by dike damage or overflow (km2); • maximum number of inundated households caused by dike damage or overflow.
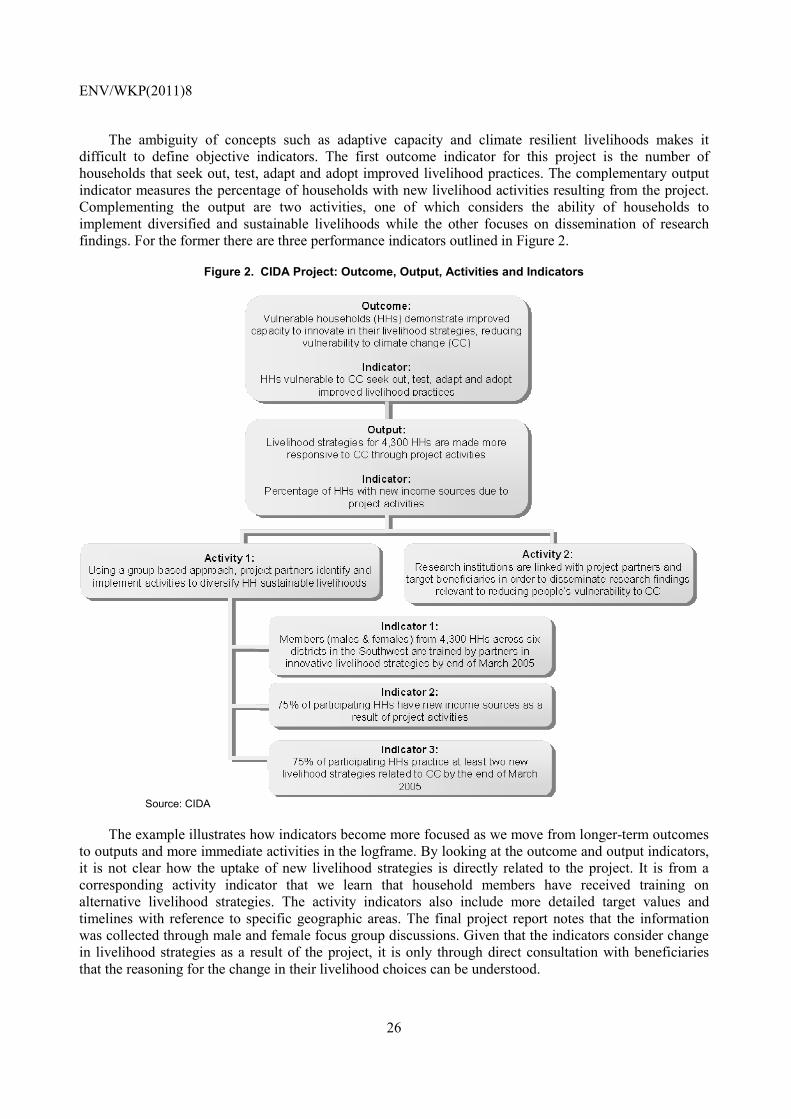
A similar format is used in all JICA ex ante evaluations examined for this study, but the types of indicator used vary by project. For example, a project on mitigation of flood damage in the Philippines focuses on the improvement of drainage channels, rivers, roads and construction of a diversion channel. Rather than monitoring progress on each component, the indicators focus on the impact of floods before and after the intervention as illustrated in Table 10.
Table 10. Indicators for a JICA Flood Management Project
Indicator Original (2002 actual) Target (2015, 2 years after completion)
Inundation depth and duration (2 years return period) (20 years return period)
0.3 – 0.4 m/9 days 1.5-1.8 m/45 days
0.1-0.2 m/2 days 0.6-0.9 m/10 days
Affected population and affected period (2 years return period) (20 years return period)
129,570/9 days 143,676/45 days
65,021/2 days 108,053/days
Amount of flood damage (agricultural products, public resources such as roads and bridges) (2 years return period) (20 years return period)
3.598 million pesos 6,534 million pesos
850 million pesos 2,049 million pesos
Annual maximum number of inundated houses and inundated period (2 years return period) (20 years return period)
24,214 houses/9 days 26,835 houses/45 days
12,418 houses/2 days 20,293 houses/10 days
(Reference indicator) Incident rate of waterborne disease (number of affected patients per 100,000)
Source: JICA
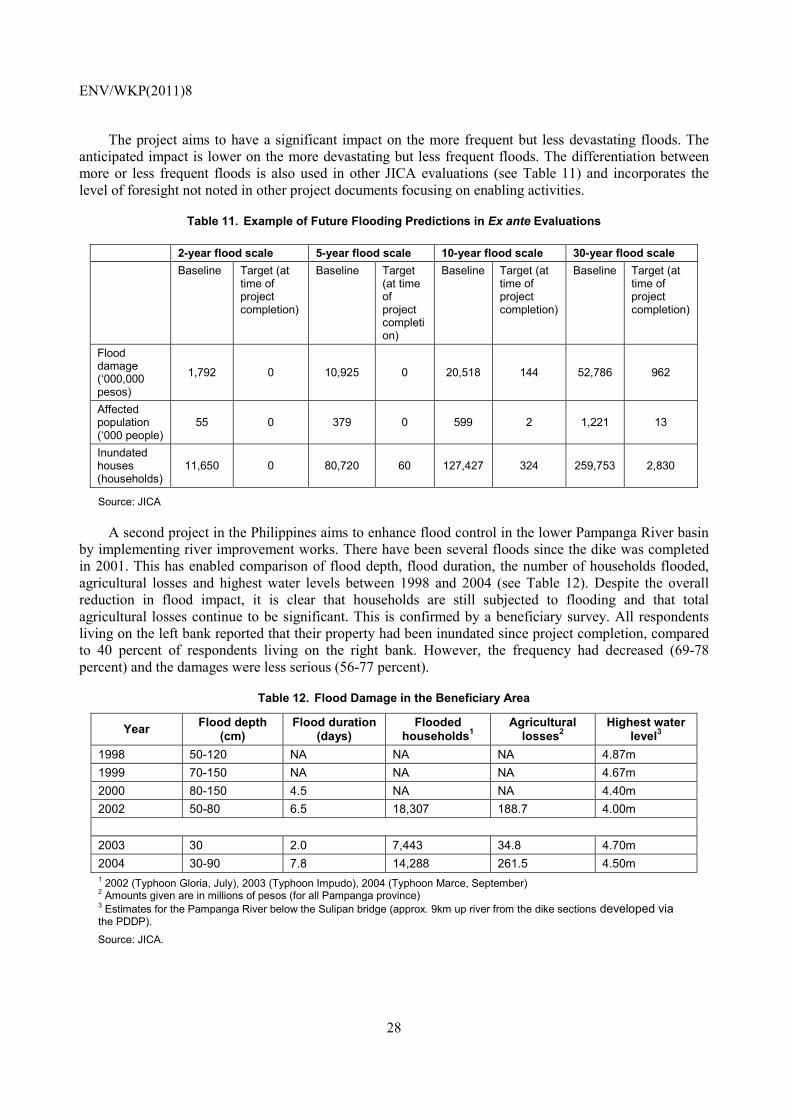
ENV/WKP(2011)8
28
The project aims to have a significant impact on the more frequent but less devastating floods. The anticipated impact is lower on the more devastating but less frequent floods. The differentiation between more or less frequent floods is also used in other JICA evaluations (see Table 11) and incorporates the level of foresight not noted in other project documents focusing on enabling activities.
Table 11. Example of Future Flooding Predictions in Ex ante Evaluations
2-year flood scale 5-year flood scale 10-year flood scale 30-year flood scale Baseline Target (at
time of project completion)
Baseline Target (at time of project completion)
Baseline Target (at time of project completion)
Baseline Target (at time of project completion)
Flood damage (‘000,000 pesos)
1,792 0 10,925 0 20,518 144 52,786 962
Affected population (‘000 people)
55 0 379 0 599 2 1,221 13
Inundated houses (households)
11,650 0 80,720 60 127,427 324 259,753 2,830
Source: JICA
A second project in the Philippines aims to enhance flood control in the lower Pampanga River basin by implementing river improvement works. There have been several floods since the dike was completed in 2001. This has enabled comparison of flood depth, flood duration, the number of households flooded, agricultural losses and highest water levels between 1998 and 2004 (see Table 12). Despite the overall reduction in flood impact, it is clear that households are still subjected to flooding and that total agricultural losses continue to be significant. This is confirmed by a beneficiary survey. All respondents living on the left bank reported that their property had been inundated since project completion, compared to 40 percent of respondents living on the right bank. However, the frequency had decreased (69-78 percent) and the damages were less serious (56-77 percent).
Table 12. Flood Damage in the Beneficiary Area
Year Flood depth (cm)
Flood duration(days)
Flooded households1
Agricultural losses2
Highest water level3
1998 50-120 NA NA NA 4.87m 1999 70-150 NA NA NA 4.67m 2000 80-150 4.5 NA NA 4.40m 2002 50-80 6.5 18,307 188.7 4.00m 2003 30 2.0 7,443 34.8 4.70m 2004 30-90 7.8 14,288 261.5 4.50m 1 2002 (Typhoon Gloria, July), 2003 (Typhoon Impudo), 2004 (Typhoon Marce, September) 2 Amounts given are in millions of pesos (for all Pampanga province) 3 Estimates for the Pampanga River below the Sulipan bridge (approx. 9km up river from the dike sections developed via the PDDP). Source: JICA.
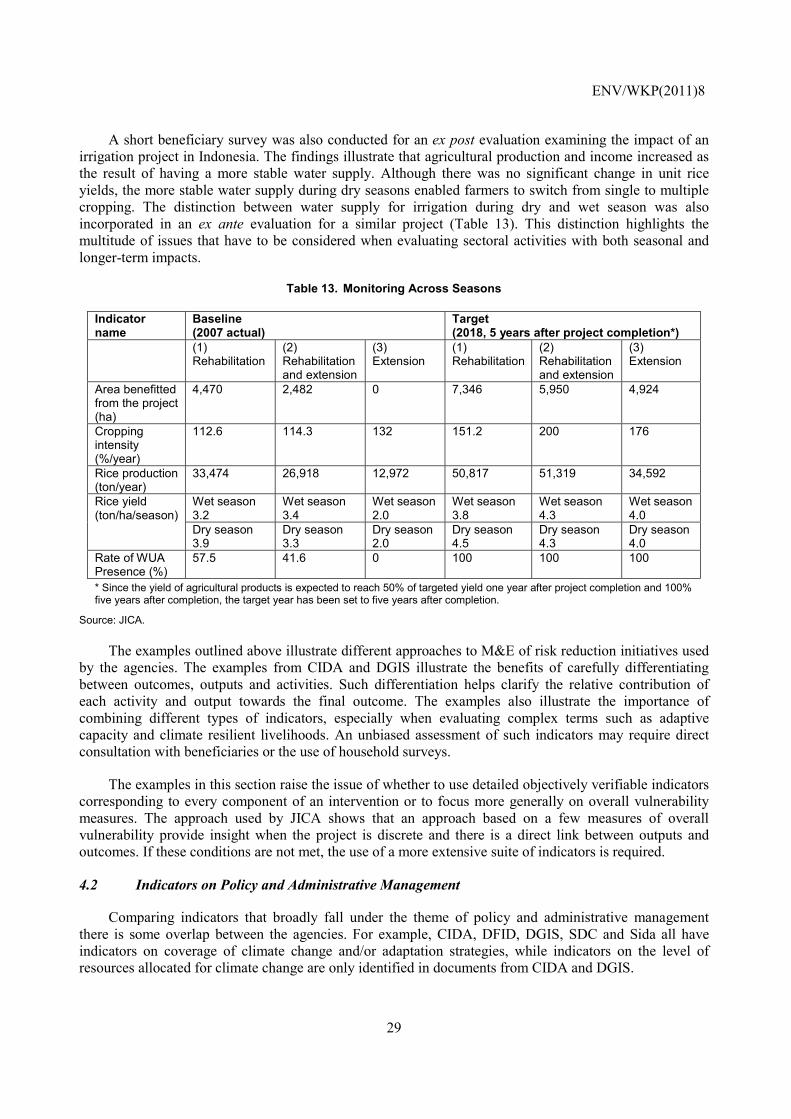
ENV/WKP(2011)8
29
A short beneficiary survey was also conducted for an ex post evaluation examining the impact of an irrigation project in Indonesia. The findings illustrate that agricultural production and income increased as the result of having a more stable water supply. Although there was no significant change in unit rice yields, the more stable water supply during dry seasons enabled farmers to switch from single to multiple cropping. The distinction between water supply for irrigation during dry and wet season was also incorporated in an ex ante evaluation for a similar project (Table 13). This distinction highlights the multitude of issues that have to be considered when evaluating sectoral activities with both seasonal and longer-term impacts.
Table 13. Monitoring Across Seasons
Indicator name
Baseline (2007 actual)
Target (2018, 5 years after project completion*)
(1) Rehabilitation
(2) Rehabilitation and extension
(3) Extension
(1) Rehabilitation
(2) Rehabilitation and extension
(3) Extension
Area benefitted from the project (ha)
4,470 2,482 0 7,346 5,950 4,924
Cropping intensity (%/year)
112.6 114.3 132 151.2 200 176
Rice production (ton/year)
33,474 26,918 12,972 50,817 51,319 34,592
Rice yield (ton/ha/season)
Wet season 3.2
Wet season 3.4
Wet season 2.0
Wet season 3.8
Wet season 4.3
Wet season 4.0
Dry season 3.9
Dry season 3.3
Dry season 2.0
Dry season 4.5
Dry season 4.3
Dry season 4.0
Rate of WUA Presence (%)
57.5 41.6 0 100 100 100
* Since the yield of agricultural products is expected to reach 50% of targeted yield one year after project completion and 100% five years after completion, the target year has been set to five years after completion.
Source: JICA.
The examples outlined above illustrate different approaches to M&E of risk reduction initiatives used by the agencies. The examples from CIDA and DGIS illustrate the benefits of carefully differentiating between outcomes, outputs and activities. Such differentiation helps clarify the relative contribution of each activity and output towards the final outcome. The examples also illustrate the importance of combining different types of indicators, especially when evaluating complex terms such as adaptive capacity and climate resilient livelihoods. An unbiased assessment of such indicators may require direct consultation with beneficiaries or the use of household surveys.
The examples in this section raise the issue of whether to use detailed objectively verifiable indicators corresponding to every component of an intervention or to focus more generally on overall vulnerability measures. The approach used by JICA shows that an approach based on a few measures of overall vulnerability provide insight when the project is discrete and there is a direct link between outputs and outcomes. If these conditions are not met, the use of a more extensive suite of indicators is required.
4.2 Indicators on Policy and Administrative Management
Comparing indicators that broadly fall under the theme of policy and administrative management there is some overlap between the agencies. For example, CIDA, DFID, DGIS, SDC and Sida all have indicators on coverage of climate change and/or adaptation strategies, while indicators on the level of resources allocated for climate change are only identified in documents from CIDA and DGIS.
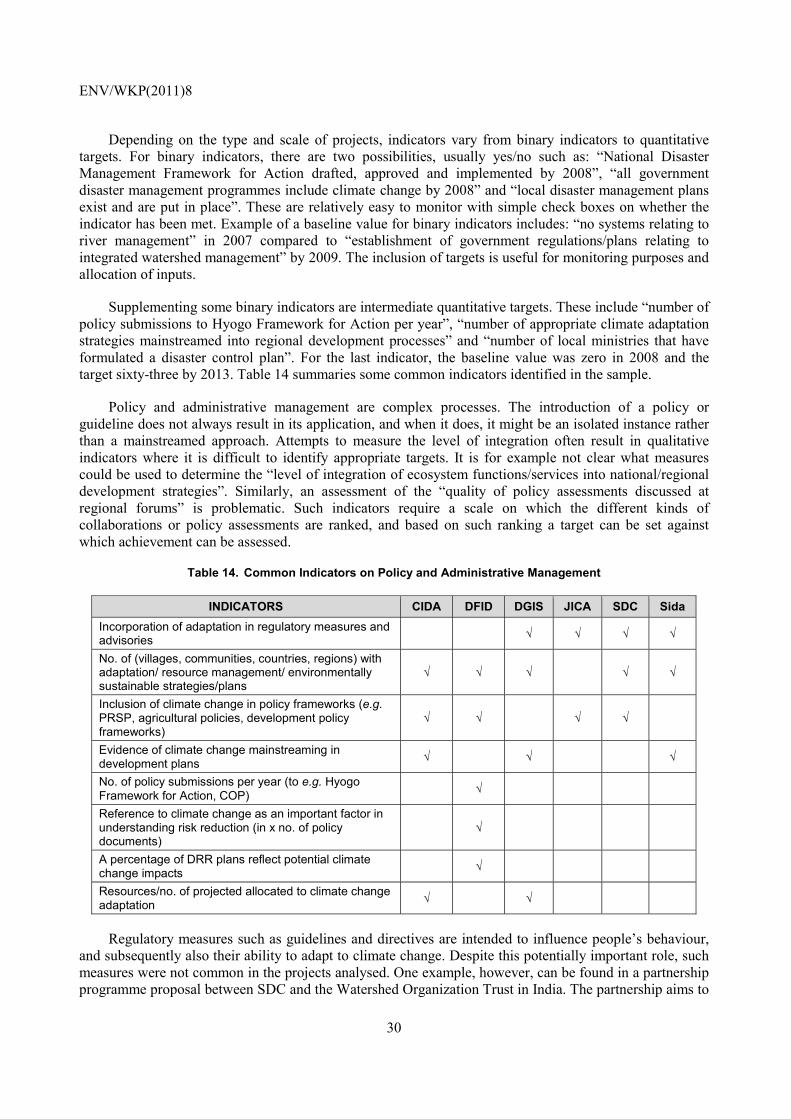
ENV/WKP(2011)8
30
Depending on the type and scale of projects, indicators vary from binary indicators to quantitative targets. For binary indicators, there are two possibilities, usually yes/no such as: “National Disaster Management Framework for Action drafted, approved and implemented by 2008”, “all government disaster management programmes include climate change by 2008” and “local disaster management plans exist and are put in place”. These are relatively easy to monitor with simple check boxes on whether the indicator has been met. Example of a baseline value for binary indicators includes: “no systems relating to river management” in 2007 compared to “establishment of government regulations/plans relating to integrated watershed management” by 2009. The inclusion of targets is useful for monitoring purposes and allocation of inputs.
Supplementing some binary indicators are intermediate quantitative targets. These include “number of policy submissions to Hyogo Framework for Action per year”, “number of appropriate climate adaptation strategies mainstreamed into regional development processes” and “number of local ministries that have formulated a disaster control plan”. For the last indicator, the baseline value was zero in 2008 and the target sixty-three by 2013. Table 14 summaries some common indicators identified in the sample.
Policy and administrative management are complex processes. The introduction of a policy or guideline does not always result in its application, and when it does, it might be an isolated instance rather than a mainstreamed approach. Attempts to measure the level of integration often result in qualitative indicators where it is difficult to identify appropriate targets. It is for example not clear what measures could be used to determine the “level of integration of ecosystem functions/services into national/regional development strategies”. Similarly, an assessment of the “quality of policy assessments discussed at regional forums” is problematic. Such indicators require a scale on which the different kinds of collaborations or policy assessments are ranked, and based on such ranking a target can be set against which achievement can be assessed.
Table 14. Common Indicators on Policy and Administrative Management
INDICATORS CIDA DFID DGIS JICA SDC Sida Incorporation of adaptation in regulatory measures and advisories √ √ √ √
No. of (villages, communities, countries, regions) with adaptation/ resource management/ environmentally sustainable strategies/plans
√ √ √ √ √
Inclusion of climate change in policy frameworks (e.g. PRSP, agricultural policies, development policy frameworks)
√ √ √ √
Evidence of climate change mainstreaming in development plans √ √ √
No. of policy submissions per year (to e.g. Hyogo Framework for Action, COP) √
Reference to climate change as an important factor in understanding risk reduction (in x no. of policy documents)
√
A percentage of DRR plans reflect potential climate change impacts √
Resources/no. of projected allocated to climate change adaptation √ √
Regulatory measures such as guidelines and directives are intended to influence people’s behaviour, and subsequently also their ability to adapt to climate change. Despite this potentially important role, such measures were not common in the projects analysed. One example, however, can be found in a partnership programme proposal between SDC and the Watershed Organization Trust in India. The partnership aims to
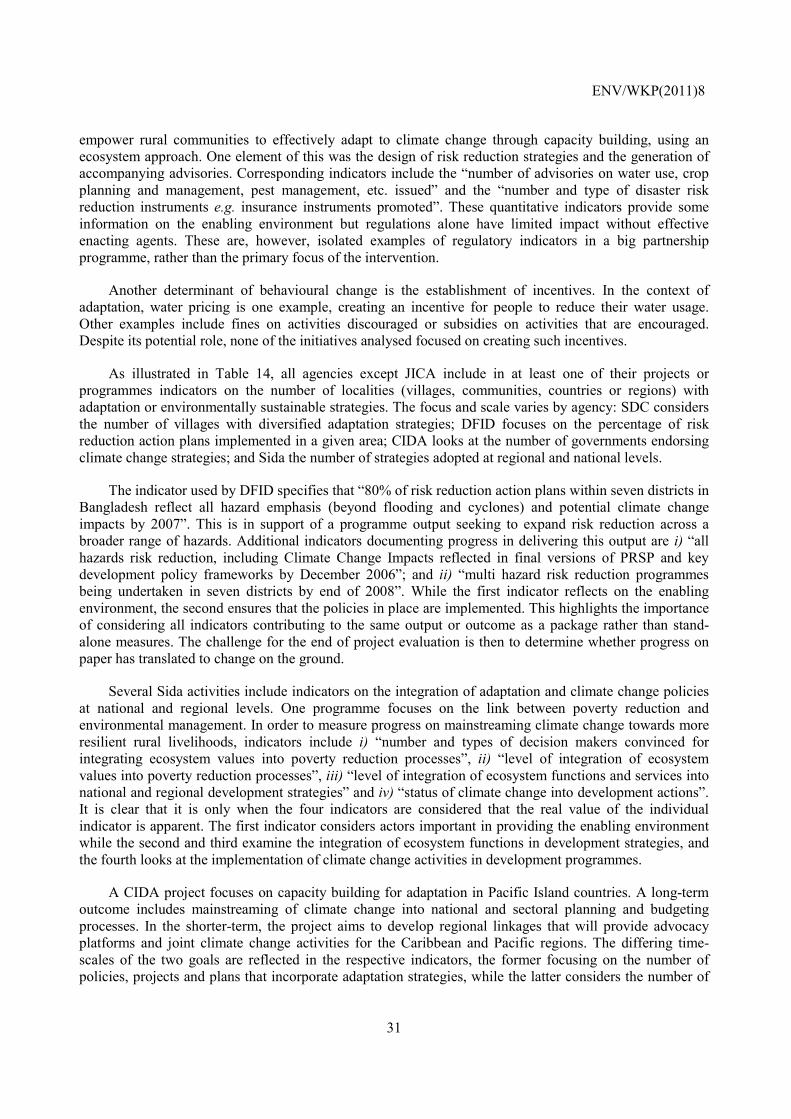
ENV/WKP(2011)8
31
empower rural communities to effectively adapt to climate change through capacity building, using an ecosystem approach. One element of this was the design of risk reduction strategies and the generation of accompanying advisories. Corresponding indicators include the “number of advisories on water use, crop planning and management, pest management, etc. issued” and the “number and type of disaster risk reduction instruments e.g. insurance instruments promoted”. These quantitative indicators provide some information on the enabling environment but regulations alone have limited impact without effective enacting agents. These are, however, isolated examples of regulatory indicators in a big partnership programme, rather than the primary focus of the intervention.
Another determinant of behavioural change is the establishment of incentives. In the context of adaptation, water pricing is one example, creating an incentive for people to reduce their water usage. Other examples include fines on activities discouraged or subsidies on activities that are encouraged. Despite its potential role, none of the initiatives analysed focused on creating such incentives.
As illustrated in Table 14, all agencies except JICA include in at least one of their projects or programmes indicators on the number of localities (villages, communities, countries or regions) with adaptation or environmentally sustainable strategies. The focus and scale varies by agency: SDC considers the number of villages with diversified adaptation strategies; DFID focuses on the percentage of risk reduction action plans implemented in a given area; CIDA looks at the number of governments endorsing climate change strategies; and Sida the number of strategies adopted at regional and national levels.
The indicator used by DFID specifies that “80% of risk reduction action plans within seven districts in Bangladesh reflect all hazard emphasis (beyond flooding and cyclones) and potential climate change impacts by 2007”. This is in support of a programme output seeking to expand risk reduction across a broader range of hazards. Additional indicators documenting progress in delivering this output are i) “all hazards risk reduction, including Climate Change Impacts reflected in final versions of PRSP and key development policy frameworks by December 2006”; and ii) “multi hazard risk reduction programmes being undertaken in seven districts by end of 2008”. While the first indicator reflects on the enabling environment, the second ensures that the policies in place are implemented. This highlights the importance of considering all indicators contributing to the same output or outcome as a package rather than stand-alone measures. The challenge for the end of project evaluation is then to determine whether progress on paper has translated to change on the ground.
Several Sida activities include indicators on the integration of adaptation and climate change policies at national and regional levels. One programme focuses on the link between poverty reduction and environmental management. In order to measure progress on mainstreaming climate change towards more resilient rural livelihoods, indicators include i) “number and types of decision makers convinced for integrating ecosystem values into poverty reduction processes”, ii) “level of integration of ecosystem values into poverty reduction processes”, iii) “level of integration of ecosystem functions and services into national and regional development strategies” and iv) “status of climate change into development actions”. It is clear that it is only when the four indicators are considered that the real value of the individual indicator is apparent. The first indicator considers actors important in providing the enabling environment while the second and third examine the integration of ecosystem functions in development strategies, and the fourth looks at the implementation of climate change activities in development programmes.
A CIDA project focuses on capacity building for adaptation in Pacific Island countries. A long-term outcome includes mainstreaming of climate change into national and sectoral planning and budgeting processes. In the shorter-term, the project aims to develop regional linkages that will provide advocacy platforms and joint climate change activities for the Caribbean and Pacific regions. The differing time-scales of the two goals are reflected in the respective indicators, the former focusing on the number of policies, projects and plans that incorporate adaptation strategies, while the latter considers the number of
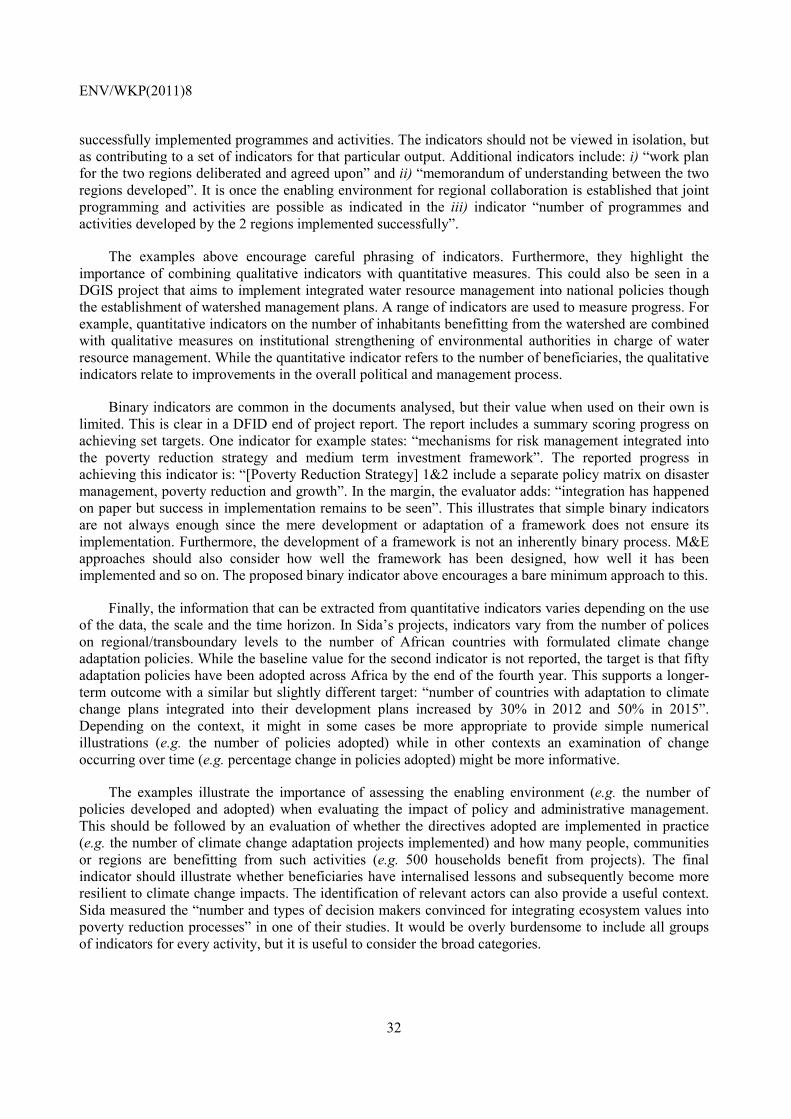
ENV/WKP(2011)8
32
successfully implemented programmes and activities. The indicators should not be viewed in isolation, but as contributing to a set of indicators for that particular output. Additional indicators include: i) “work plan for the two regions deliberated and agreed upon” and ii) “memorandum of understanding between the two regions developed”. It is once the enabling environment for regional collaboration is established that joint programming and activities are possible as indicated in the iii) indicator “number of programmes and activities developed by the 2 regions implemented successfully”.
The examples above encourage careful phrasing of indicators. Furthermore, they highlight the importance of combining qualitative indicators with quantitative measures. This could also be seen in a DGIS project that aims to implement integrated water resource management into national policies though the establishment of watershed management plans. A range of indicators are used to measure progress. For example, quantitative indicators on the number of inhabitants benefitting from the watershed are combined with qualitative measures on institutional strengthening of environmental authorities in charge of water resource management. While the quantitative indicator refers to the number of beneficiaries, the qualitative indicators relate to improvements in the overall political and management process.
Binary indicators are common in the documents analysed, but their value when used on their own is limited. This is clear in a DFID end of project report. The report includes a summary scoring progress on achieving set targets. One indicator for example states: “mechanisms for risk management integrated into the poverty reduction strategy and medium term investment framework”. The reported progress in achieving this indicator is: “[Poverty Reduction Strategy] 1&2 include a separate policy matrix on disaster management, poverty reduction and growth”. In the margin, the evaluator adds: “integration has happened on paper but success in implementation remains to be seen”. This illustrates that simple binary indicators are not always enough since the mere development or adaptation of a framework does not ensure its implementation. Furthermore, the development of a framework is not an inherently binary process. M&E approaches should also consider how well the framework has been designed, how well it has been implemented and so on. The proposed binary indicator above encourages a bare minimum approach to this.
Finally, the information that can be extracted from quantitative indicators varies depending on the use of the data, the scale and the time horizon. In Sida’s projects, indicators vary from the number of polices on regional/transboundary levels to the number of African countries with formulated climate change adaptation policies. While the baseline value for the second indicator is not reported, the target is that fifty adaptation policies have been adopted across Africa by the end of the fourth year. This supports a longer-term outcome with a similar but slightly different target: “number of countries with adaptation to climate change plans integrated into their development plans increased by 30% in 2012 and 50% in 2015”. Depending on the context, it might in some cases be more appropriate to provide simple numerical illustrations (e.g. the number of policies adopted) while in other contexts an examination of change occurring over time (e.g. percentage change in policies adopted) might be more informative.
The examples illustrate the importance of assessing the enabling environment (e.g. the number of policies developed and adopted) when evaluating the impact of policy and administrative management. This should be followed by an evaluation of whether the directives adopted are implemented in practice (e.g. the number of climate change adaptation projects implemented) and how many people, communities or regions are benefitting from such activities (e.g. 500 households benefit from projects). The final indicator should illustrate whether beneficiaries have internalised lessons and subsequently become more resilient to climate change impacts. The identification of relevant actors can also provide a useful context. Sida measured the “number and types of decision makers convinced for integrating ecosystem values into poverty reduction processes” in one of their studies. It would be overly burdensome to include all groups of indicators for every activity, but it is useful to consider the broad categories.
ENV/WKP(2011)8
33
It is necessary to combine quantitative or binary indicators on the development or adoption of climate change policies with qualitative measures on their application and sustainability. The challenge is to ensure that qualitative measures can be objectively evaluated. When trying to assess the level of integration of a policy or the quality of such integration, indicators may require a scale against which progress can be assessed. The usefulness of quantitative indicators on the other hand, depends on the nature of the data, scale and time horizon. In the short-term, the use of numerical targets, such as the number of policies developed and implemented by the third year might be easiest. However, in order to measure impact in the long-term, a percentage change in policies or advisories contributing to the enabling environment may be more informative.
4.3 Indicators on Environmental Education and Training
Environmental education and training includes initiatives related to the diffusion of information on climate change risks, training aimed at changing people’s behaviour or improving their disaster preparedness, and adoption of training curricula in schools and businesses. Under this category of indicators quantitative indicators are common in the sample. These range from the number of articles published and trainings conducted to the number of visits on relevant websites. Complementing some of the quantitative targets are binary indicators such as development of knowledge platforms and advocacy campaigns. Examples of qualitative indicators include the ability of village groups and commune officials to conduct risk assessments and identify adaptation measures. With no information on the means of verification it is unclear how evaluators will assess indicators of this type. Table 15 summarises common indicators on education and training identified in the sample across the agencies.
Table 15. Common Indicators on Education and Training
INDICATORS CIDA DFID DGIS JICA SDC Sida No. and quality of publications, articles, TV programmes √ √ √ √ √
No. of training sessions/workshops conducted/no. of people trained √ √ √ √ √ √
Development of knowledge platforms/ website √ √ √ No. of training modules/materials published and disseminated √ √ √ √
No. of hits on web-based platform √ √ No. of stakeholders participating in knowledge sharing/training √ √ √ √ No. of policy reviews √
Advocacy campaign developed √ Extent of use and outreach of education material/training facilities √ √ Increased community capacity through implementation of pilot projects √
No. of trained committees that developed and adopted risk reduction plans √
Adaptation in government staff training curricula √
No. of knowledge communication centres/dialogue platforms √
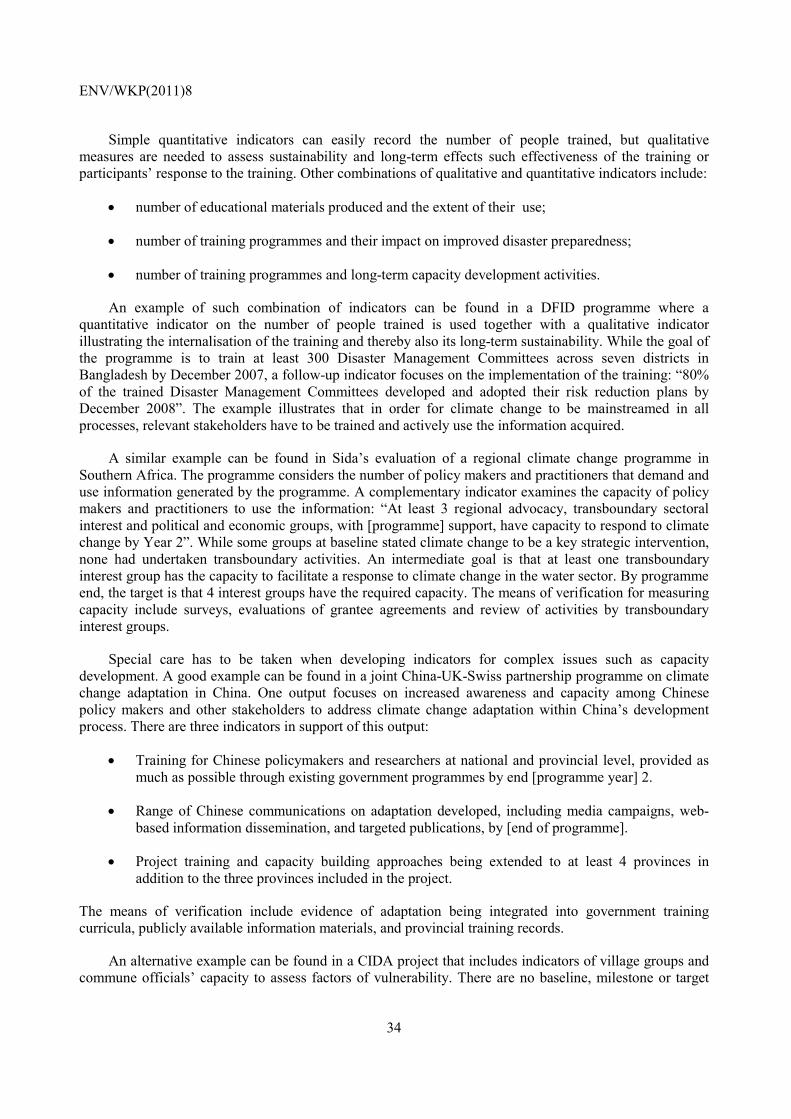
ENV/WKP(2011)8
34
Simple quantitative indicators can easily record the number of people trained, but qualitative measures are needed to assess sustainability and long-term effects such effectiveness of the training or participants’ response to the training. Other combinations of qualitative and quantitative indicators include:
• number of educational materials produced and the extent of their use;
• number of training programmes and their impact on improved disaster preparedness;
• number of training programmes and long-term capacity development activities.
An example of such combination of indicators can be found in a DFID programme where a quantitative indicator on the number of people trained is used together with a qualitative indicator illustrating the internalisation of the training and thereby also its long-term sustainability. While the goal of the programme is to train at least 300 Disaster Management Committees across seven districts in Bangladesh by December 2007, a follow-up indicator focuses on the implementation of the training: “80% of the trained Disaster Management Committees developed and adopted their risk reduction plans by December 2008”. The example illustrates that in order for climate change to be mainstreamed in all processes, relevant stakeholders have to be trained and actively use the information acquired.
A similar example can be found in Sida’s evaluation of a regional climate change programme in Southern Africa. The programme considers the number of policy makers and practitioners that demand and use information generated by the programme. A complementary indicator examines the capacity of policy makers and practitioners to use the information: “At least 3 regional advocacy, transboundary sectoral interest and political and economic groups, with [programme] support, have capacity to respond to climate change by Year 2”. While some groups at baseline stated climate change to be a key strategic intervention, none had undertaken transboundary activities. An intermediate goal is that at least one transboundary interest group has the capacity to facilitate a response to climate change in the water sector. By programme end, the target is that 4 interest groups have the required capacity. The means of verification for measuring capacity include surveys, evaluations of grantee agreements and review of activities by transboundary interest groups.
Special care has to be taken when developing indicators for complex issues such as capacity development. A good example can be found in a joint China-UK-Swiss partnership programme on climate change adaptation in China. One output focuses on increased awareness and capacity among Chinese policy makers and other stakeholders to address climate change adaptation within China’s development process. There are three indicators in support of this output:
• Training for Chinese policymakers and researchers at national and provincial level, provided as much as possible through existing government programmes by end [programme year] 2.
• Range of Chinese communications on adaptation developed, including media campaigns, web-based information dissemination, and targeted publications, by [end of programme].
• Project training and capacity building approaches being extended to at least 4 provinces in addition to the three provinces included in the project.
The means of verification include evidence of adaptation being integrated into government training curricula, publicly available information materials, and provincial training records.
An alternative example can be found in a CIDA project that includes indicators of village groups and commune officials’ capacity to assess factors of vulnerability. There are no baseline, milestone or target

ENV/WKP(2011)8
35
values. Instead, there is a risk analysis with corresponding mitigation measures. On the capacity for village groups and commune officials, the risk is rated as medium on the basis that resistance to adopt new practices or techniques for anticipatory adaptation must be overcome. Possible mitigation measures include the identification of motivated partners at the local level, strong support in the early stages of the project, inclusion of a phase out plan, and support to the application of new knowledge through co-financing of pilot projects. It is important to recognise that achievement of some indicators is only feasible when these pre-conditions are in place.
A further CIDA project includes an indicator of district officials’ ability to conduct participatory risk assessments. It is not clear how ‘ability’ will be measured. For a different CIDA project, level of capacity is measured through “seminar material, reports prepared by the facilitator and structured participant evaluation”. Although this provides a measure for understanding the topic discussed, attribution to the seminar is difficult unless evaluations are done at the beginning and the end of the seminar. An additional goal of the project is to increase the level of knowledge of the participating communities on climate change adaptation. Also here, it is unclear how the knowledge level will be measured since identified data sources include the project communication strategy and an awareness raising information package.
The examples illustrate the prevalent use of quantitative indicators when evaluating education and training initiatives in the sample. While such indicators concisely outline the amount of training sessions conducted or educational material published, they do not capture the impact of these activities on adaptive capacity. In order to assess impact, the quantitative measures need to be combined with qualitative indicators on the use or outreach of material published and impact of training sessions. Furthermore, when assessing progress in achieving set targets, the evaluator needs to be aware of possible barriers to programme success. For example, if multiple projects are implemented in the same area, there is a risk that stakeholders will comply with the conditions of the activity from which they will gain the most.
An additional challenge when evaluating education and training activities is the development of appropriate indicators for complex issues such as ability, level of knowledge and capacity development. This may require the use of surveys and a review of activities by relevant stakeholders. Alternatively, a combination of quantitative and qualitative indicators with both short- and longer-term objectives can be used. This is for example the case when evaluating training courses, where a combination of the number of people trained and the level of internalisation should be used.
4.4 Indicators on Research
Unlike the previous categories of indicators discussed, there is less overlap between agencies funding research activities, as illustrated in Table 16. There is however some overlap on the development of climate change models and tools, and the production of climate scenarios. The majority of these indicators are either binary indicators monitoring the development of new models and tools, or quantitative measures such as the number of stakeholders or organisations requesting knowledge products or engaging with knowledge networks.
ENV/WKP(2011)8
36
Table 16. Common Indicators on Research
INDICATORS CIDA DFID DGIS JICA SDC Sida
Development of models and tools produced √ √
Availability of relevant data √ √
Production of climate predictions under different scenarios (indicators, projections, maps, desertification indices)
√ √ √
Studies identify risk and benefits of managing environmental resource(s) √
Increased capacity to assess vulnerabilities and risks of climate change √ √
Vulnerability profile developed √ √ No. of stakeholders requesting and accessing knowledge products √ Extent of research dissemination √ √ No. of organisations engaging with knowledge network √
The majority of binary indicators are clear and unproblematic. These include “scenarios developed, and integrated into national development plans and water resources management policies”, “tools developed for climate and hydrological analysis to assess climate change threats” and “conceptual framework available and agencies/peers ready to apply it”. However, dealing with an abstract concept such as knowledge (creation and diffusion) leads to the challenge of choosing objective indicators. Similarly, when using am indicator such as “robust studies identify risks and benefits of managing specific transboundary rivers” is only useful if an exact definition of “robust” must be provided. Otherwise the evaluation requires a value judgment by the evaluator.
For one SDC project on adaptive capacity of rural communities in India, the objective is to strengthen people’s own capacity to take ownership of community-led sustainable adaptation strategies. One approach in doing so is through action research on adaptation strategies for water, organic farming and energy. Indicators for measuring progress include:
• areas of research are collectively identified and developed;
• appropriate dialogue platforms at the district level are promoted and organised;
• community needs and concerns are adequately reflected in the research agenda.
For all three indicators, “collective”, “appropriate” and “adequately” were not defined in the project documentation.
A Sida project on adaption in the Mekong River Basin included the development of tools to analyse the expected climate change impacts. The indicator on the development of the tools (“tools for assessment and adaptation planning developed and the climate change database for the Mekong basin established”) is associated with an indicator on the overall assessment of climate change impacts (“basin-wide assessment of climate change, its impacts and adaptation to climate change”). In this way the evaluation does not only consider the development of the tools but also their longer term effects.
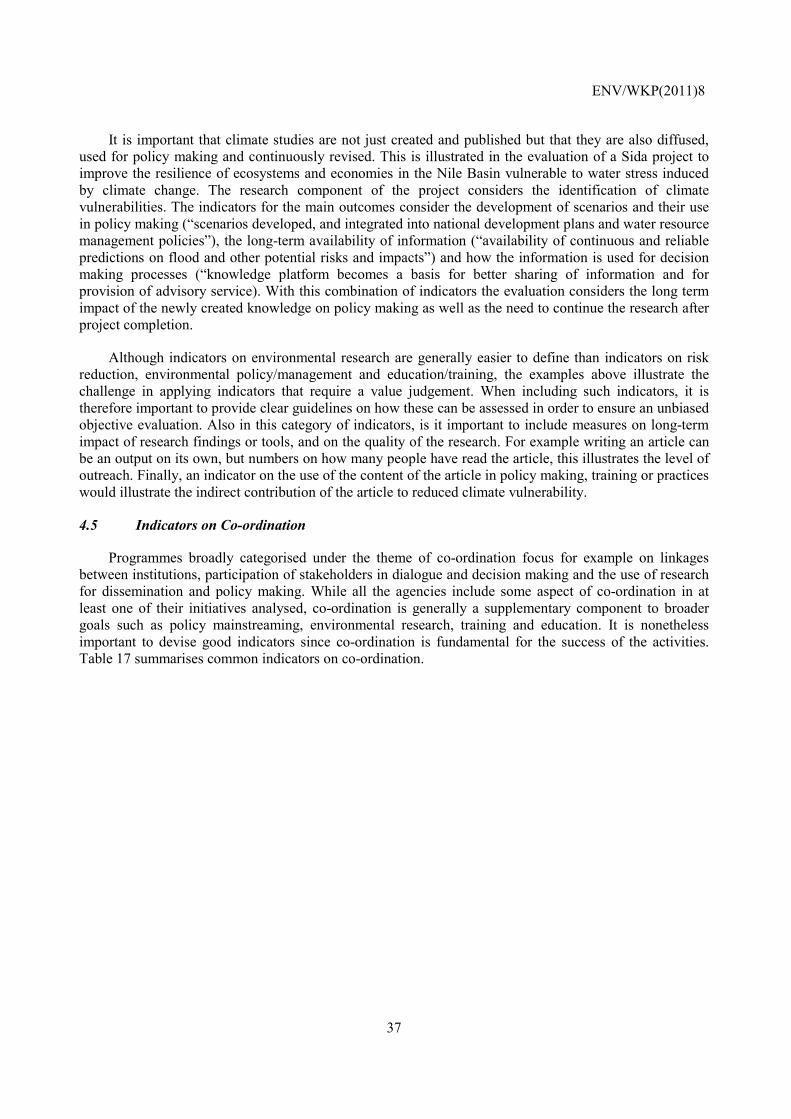
ENV/WKP(2011)8
37
It is important that climate studies are not just created and published but that they are also diffused, used for policy making and continuously revised. This is illustrated in the evaluation of a Sida project to improve the resilience of ecosystems and economies in the Nile Basin vulnerable to water stress induced by climate change. The research component of the project considers the identification of climate vulnerabilities. The indicators for the main outcomes consider the development of scenarios and their use in policy making (“scenarios developed, and integrated into national development plans and water resource management policies”), the long-term availability of information (“availability of continuous and reliable predictions on flood and other potential risks and impacts”) and how the information is used for decision making processes (“knowledge platform becomes a basis for better sharing of information and for provision of advisory service). With this combination of indicators the evaluation considers the long term impact of the newly created knowledge on policy making as well as the need to continue the research after project completion.
Although indicators on environmental research are generally easier to define than indicators on risk reduction, environmental policy/management and education/training, the examples above illustrate the challenge in applying indicators that require a value judgement. When including such indicators, it is therefore important to provide clear guidelines on how these can be assessed in order to ensure an unbiased objective evaluation. Also in this category of indicators, is it important to include measures on long-term impact of research findings or tools, and on the quality of the research. For example writing an article can be an output on its own, but numbers on how many people have read the article, this illustrates the level of outreach. Finally, an indicator on the use of the content of the article in policy making, training or practices would illustrate the indirect contribution of the article to reduced climate vulnerability.
4.5 Indicators on Co-ordination
Programmes broadly categorised under the theme of co-ordination focus for example on linkages between institutions, participation of stakeholders in dialogue and decision making and the use of research for dissemination and policy making. While all the agencies include some aspect of co-ordination in at least one of their initiatives analysed, co-ordination is generally a supplementary component to broader goals such as policy mainstreaming, environmental research, training and education. It is nonetheless important to devise good indicators since co-ordination is fundamental for the success of the activities. Table 17 summarises common indicators on co-ordination.
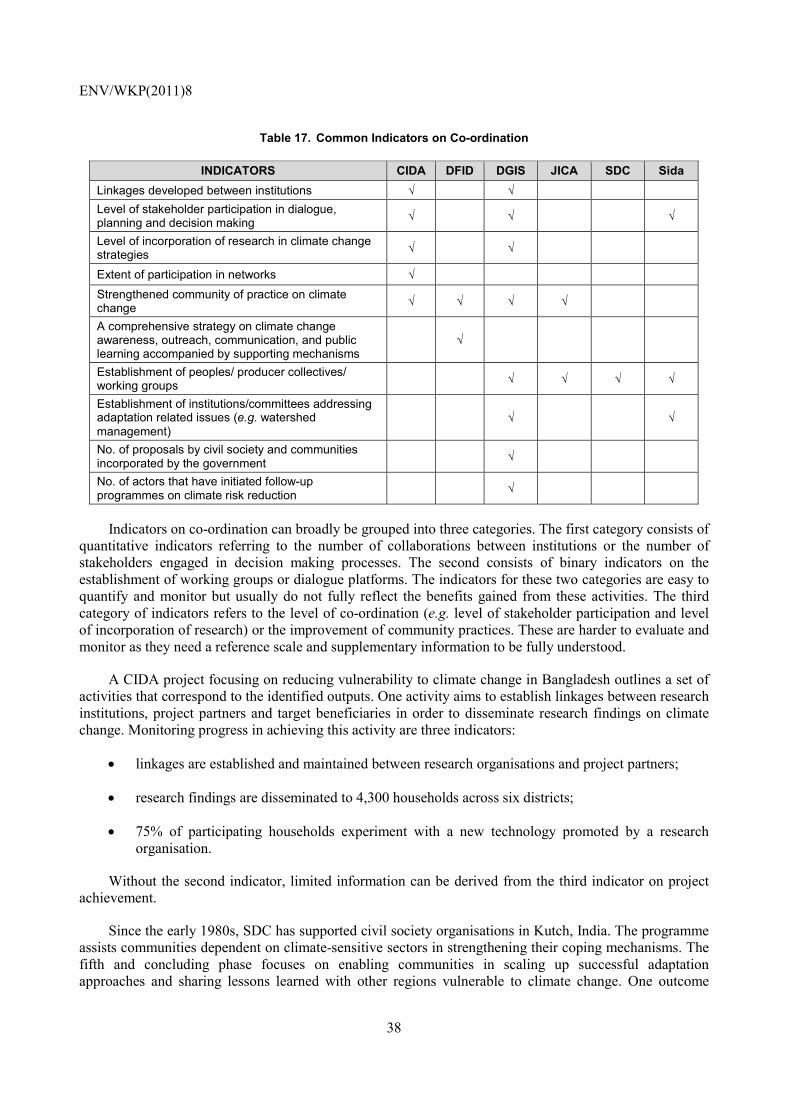
ENV/WKP(2011)8
38
Table 17. Common Indicators on Co-ordination
INDICATORS CIDA DFID DGIS JICA SDC Sida Linkages developed between institutions √ √ Level of stakeholder participation in dialogue, planning and decision making √ √ √
Level of incorporation of research in climate change strategies √ √ Extent of participation in networks √ Strengthened community of practice on climate change √ √ √ √ A comprehensive strategy on climate change awareness, outreach, communication, and public learning accompanied by supporting mechanisms
√
Establishment of peoples/ producer collectives/ working groups √ √ √ √
Establishment of institutions/committees addressing adaptation related issues (e.g. watershed management)
√ √
No. of proposals by civil society and communities incorporated by the government √ No. of actors that have initiated follow-up programmes on climate risk reduction √
Indicators on co-ordination can broadly be grouped into three categories. The first category consists of quantitative indicators referring to the number of collaborations between institutions or the number of stakeholders engaged in decision making processes. The second consists of binary indicators on the establishment of working groups or dialogue platforms. The indicators for these two categories are easy to quantify and monitor but usually do not fully reflect the benefits gained from these activities. The third category of indicators refers to the level of co-ordination (e.g. level of stakeholder participation and level of incorporation of research) or the improvement of community practices. These are harder to evaluate and monitor as they need a reference scale and supplementary information to be fully understood.
A CIDA project focusing on reducing vulnerability to climate change in Bangladesh outlines a set of activities that correspond to the identified outputs. One activity aims to establish linkages between research institutions, project partners and target beneficiaries in order to disseminate research findings on climate change. Monitoring progress in achieving this activity are three indicators:
• linkages are established and maintained between research organisations and project partners;
• research findings are disseminated to 4,300 households across six districts;
• 75% of participating households experiment with a new technology promoted by a research organisation.
Without the second indicator, limited information can be derived from the third indicator on project achievement.
Since the early 1980s, SDC has supported civil society organisations in Kutch, India. The programme assists communities dependent on climate-sensitive sectors in strengthening their coping mechanisms. The fifth and concluding phase focuses on enabling communities in scaling up successful adaptation approaches and sharing lessons learned with other regions vulnerable to climate change. One outcome
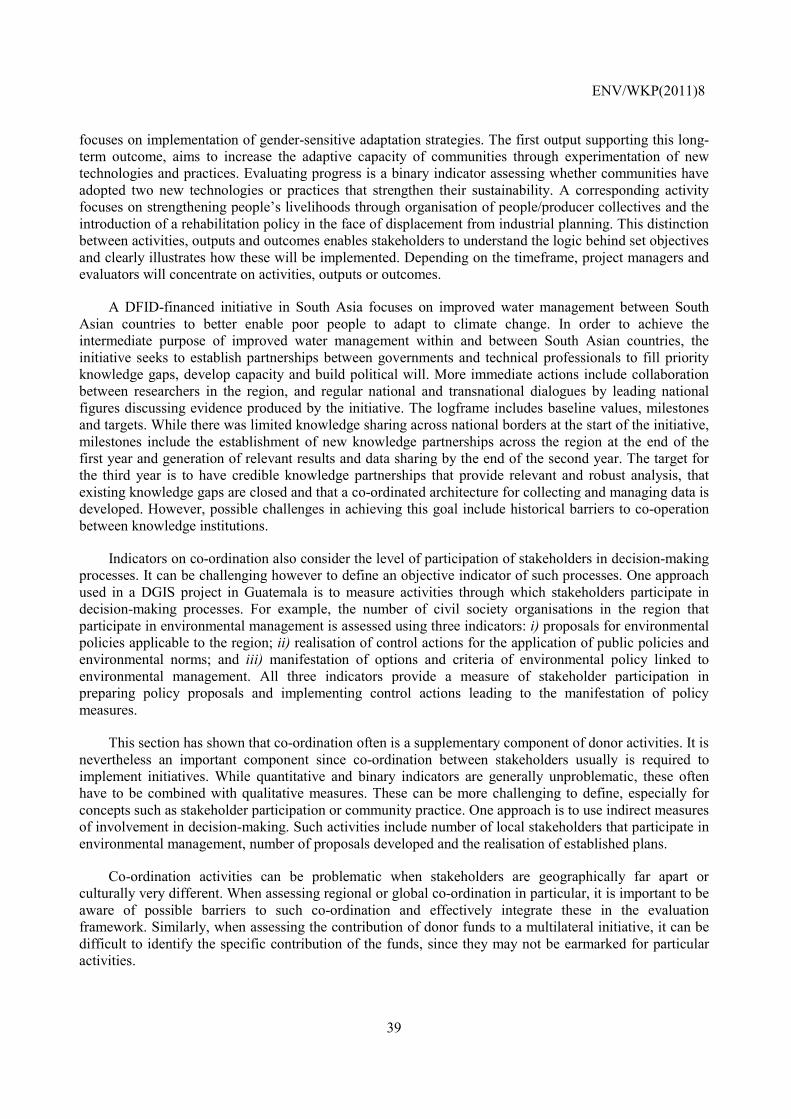
ENV/WKP(2011)8
39
focuses on implementation of gender-sensitive adaptation strategies. The first output supporting this long-term outcome, aims to increase the adaptive capacity of communities through experimentation of new technologies and practices. Evaluating progress is a binary indicator assessing whether communities have adopted two new technologies or practices that strengthen their sustainability. A corresponding activity focuses on strengthening people’s livelihoods through organisation of people/producer collectives and the introduction of a rehabilitation policy in the face of displacement from industrial planning. This distinction between activities, outputs and outcomes enables stakeholders to understand the logic behind set objectives and clearly illustrates how these will be implemented. Depending on the timeframe, project managers and evaluators will concentrate on activities, outputs or outcomes.
A DFID-financed initiative in South Asia focuses on improved water management between South Asian countries to better enable poor people to adapt to climate change. In order to achieve the intermediate purpose of improved water management within and between South Asian countries, the initiative seeks to establish partnerships between governments and technical professionals to fill priority knowledge gaps, develop capacity and build political will. More immediate actions include collaboration between researchers in the region, and regular national and transnational dialogues by leading national figures discussing evidence produced by the initiative. The logframe includes baseline values, milestones and targets. While there was limited knowledge sharing across national borders at the start of the initiative, milestones include the establishment of new knowledge partnerships across the region at the end of the first year and generation of relevant results and data sharing by the end of the second year. The target for the third year is to have credible knowledge partnerships that provide relevant and robust analysis, that existing knowledge gaps are closed and that a co-ordinated architecture for collecting and managing data is developed. However, possible challenges in achieving this goal include historical barriers to co-operation between knowledge institutions.
Indicators on co-ordination also consider the level of participation of stakeholders in decision-making processes. It can be challenging however to define an objective indicator of such processes. One approach used in a DGIS project in Guatemala is to measure activities through which stakeholders participate in decision-making processes. For example, the number of civil society organisations in the region that participate in environmental management is assessed using three indicators: i) proposals for environmental policies applicable to the region; ii) realisation of control actions for the application of public policies and environmental norms; and iii) manifestation of options and criteria of environmental policy linked to environmental management. All three indicators provide a measure of stakeholder participation in preparing policy proposals and implementing control actions leading to the manifestation of policy measures.
This section has shown that co-ordination often is a supplementary component of donor activities. It is nevertheless an important component since co-ordination between stakeholders usually is required to implement initiatives. While quantitative and binary indicators are generally unproblematic, these often have to be combined with qualitative measures. These can be more challenging to define, especially for concepts such as stakeholder participation or community practice. One approach is to use indirect measures of involvement in decision-making. Such activities include number of local stakeholders that participate in environmental management, number of proposals developed and the realisation of established plans.
Co-ordination activities can be problematic when stakeholders are geographically far apart or culturally very different. When assessing regional or global co-ordination in particular, it is important to be aware of possible barriers to such co-ordination and effectively integrate these in the evaluation framework. Similarly, when assessing the contribution of donor funds to a multilateral initiative, it can be difficult to identify the specific contribution of the funds, since they may not be earmarked for particular activities.
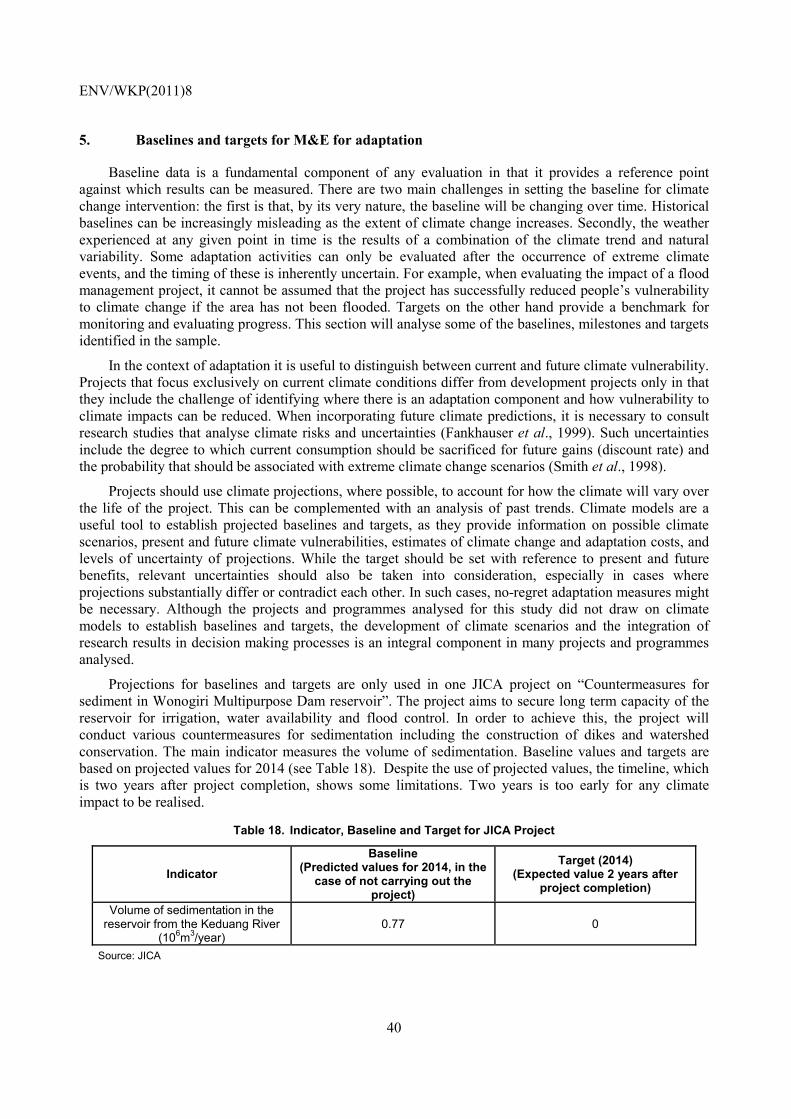
ENV/WKP(2011)8
40
5. Baselines and targets for M&E for adaptation
Baseline data is a fundamental component of any evaluation in that it provides a reference point against which results can be measured. There are two main challenges in setting the baseline for climate change intervention: the first is that, by its very nature, the baseline will be changing over time. Historical baselines can be increasingly misleading as the extent of climate change increases. Secondly, the weather experienced at any given point in time is the results of a combination of the climate trend and natural variability. Some adaptation activities can only be evaluated after the occurrence of extreme climate events, and the timing of these is inherently uncertain. For example, when evaluating the impact of a flood management project, it cannot be assumed that the project has successfully reduced people’s vulnerability to climate change if the area has not been flooded. Targets on the other hand provide a benchmark for monitoring and evaluating progress. This section will analyse some of the baselines, milestones and targets identified in the sample.
In the context of adaptation it is useful to distinguish between current and future climate vulnerability. Projects that focus exclusively on current climate conditions differ from development projects only in that they include the challenge of identifying where there is an adaptation component and how vulnerability to climate impacts can be reduced. When incorporating future climate predictions, it is necessary to consult research studies that analyse climate risks and uncertainties (Fankhauser et al., 1999). Such uncertainties include the degree to which current consumption should be sacrificed for future gains (discount rate) and the probability that should be associated with extreme climate change scenarios (Smith et al., 1998).
Projects should use climate projections, where possible, to account for how the climate will vary over the life of the project. This can be complemented with an analysis of past trends. Climate models are a useful tool to establish projected baselines and targets, as they provide information on possible climate scenarios, present and future climate vulnerabilities, estimates of climate change and adaptation costs, and levels of uncertainty of projections. While the target should be set with reference to present and future benefits, relevant uncertainties should also be taken into consideration, especially in cases where projections substantially differ or contradict each other. In such cases, no-regret adaptation measures might be necessary. Although the projects and programmes analysed for this study did not draw on climate models to establish baselines and targets, the development of climate scenarios and the integration of research results in decision making processes is an integral component in many projects and programmes analysed.
Projections for baselines and targets are only used in one JICA project on “Countermeasures for sediment in Wonogiri Multipurpose Dam reservoir”. The project aims to secure long term capacity of the reservoir for irrigation, water availability and flood control. In order to achieve this, the project will conduct various countermeasures for sedimentation including the construction of dikes and watershed conservation. The main indicator measures the volume of sedimentation. Baseline values and targets are based on projected values for 2014 (see Table 18). Despite the use of projected values, the timeline, which is two years after project completion, shows some limitations. Two years is too early for any climate impact to be realised.
Table 18. Indicator, Baseline and Target for JICA Project
Indicator Baseline
(Predicted values for 2014, in the case of not carrying out the
project)
Target (2014) (Expected value 2 years after
project completion)
Volume of sedimentation in the reservoir from the Keduang River
(106m3/year) 0.77 0
Source: JICA

ENV/WKP(2011)8
41
The need to consider long term impacts in adaptation also affects the timing of monitoring and evaluation. Whereas development agencies usually perform evaluations 2 to 5 years after project completion, in the context of adaptation a longer-term review is needed. This would enable agencies to compare actual results with values projected in climate scenarios.
Only a few projects and programmes include long-term targets. One example is DFID’s project “South Asia Water Initiative (SAWI)”, running from 2009 to 2011. Outcome indicators have final targets set for the third year after project completion. However, for the long-term goal the target year is seven years after project completion. For the indicator “countries in South Asia co-operating at a regional level to invest in improving water management”, the corresponding baseline, milestone and target are:
• Baseline: Major water insecurity with natural scarcity and variability, weak management, increasing demand, climate change, limited co-operation on water across borders, insufficient data sharing or joint investments to manage water variability, floods and droughts having significant impact.
• Milestone (2011): 3 significant investment projects in development, with at least one involving co-operation between 2 or more countries.
• Target (2018): Substantial investment at scale in regional water management being underway in the three major river basins, reducing the impacts of climate change and reducing vulnerability of the 700 million people living in these basins.
This illustrates the value of including milestones and targets that help track progress and guide project managers in prioritising inputs. The majority of the projects analysed for this study outline target values for each indicator. In a few cases, milestones are also specified to help track progress. In Sida’s “Regional Climate Change Programme”, baseline and target values are complemented with two or three milestones. For example, the indicator “capacity of target audience to deal with climate change issues” has the following reference levels:
• Baseline: limited capacity.
• Milestone 1: establishment of a forum for ongoing climate change response dialogue.
• Milestone 2: capacity is built to negotiate in international climate fora.
• Milestone 3: regional nodes are established and operating to support their sub-regions in ongoing scientific analysis and development funding proposals.
• Target: the relevant decision and policy makers in the region are active in transboundary and national adaptive capacity management and supported by civil society.
This brief assessment on the use of baseline values, intermediate milestones and targets has outlined the distinction between benchmarks based on current and future climate vulnerability. While the latter demands a certain level of technical expertise in order to effectively incorporate model scenarios into project and programme development, it is particularly important for large infrastructural projects. Consideration of future climate vulnerability also applies to activities that for example are dependent on water availability or are vulnerable to extreme weather events. A second observation is the need to adjust the timing of evaluations. For many adaptation initiatives no discernable change may take place over the lifetime of the project. Further complicating the matter is that in some cases no change may be the desired outcome. In those cases, the question is whether assessing if status quo has been maintained is enough or if alternative measures are needed. Finally, the use of intermediate milestones is useful in monitoring progress and allocating inputs. However, this applies to all development activities and is not unique to adaptation interventions.
ENV/WKP(2011)8
42
6. Conclusion
Monitoring and evaluation is inherently challenging for any development project, but this is particularly the case for climate change adaptation projects. Reasons for this include the uncertainty relating to climate, long-time horizons and in some cases the need to separate out the effects of current climate variability from climate change. In the context of scaled up funding for climate change adaptation, it is more important than ever to ensure the effectiveness, equity and efficiency of adaptation interventions. Fortunately, there is already a body of work on this that can be used to inform future efforts. This analysis has identified some of the difficulties faced by previous studies, but also examples of best practice that should help to inform future work in this area.
Lessons learned
Result Based Management, the Logical Framework Approach and the accompanying logframe are the most common M&E approaches applied by the six agencies analysed in this study to adaptation related and specific activities. This is no different than for their mainstream development activities. However, given the longer-term perspective of most adaptation initiatives, it is particularly important to clearly differentiate between outcomes, outputs and activities. Such differentiation helps clarify the relative contribution of each activity towards the long-term objective.
The type of activity will to a large extent determine the choice of indicators. However, a general lesson from these case studies is that a combination of qualitative, quantitative and binary indicators should be used. On their own, any category of indicator is not enough. For instance, the development of a policy framework does not ensure its implementation and sustainability. While such indicators describe whether a goal has been achieved, they do not provide information on the extent to which change has taken place and resulted in improved adaptive capacity. This requires the use of complementary indicators that measure the level of implementation on the ground and the potential coverage of related activities. Examples include the number of projects and activities that have been developed in response to the policy, the number of households benefitting and how.
The use of complementary indicators is particularly important when assessing the long-term outcome of an activity. A small set of indicators with different foci can highlight the various aspects of the project. For example, when evaluating training activities, participation in a training session does on its own not make people less vulnerable to climate change. Complementary information is needed on the content of the training, what the desired outcomes are and if these have been achieved in partice. In order to assess the outcome of that training, it is ultimately necessary to evaluate the extent to which participants have done things differently as a result. Such differentiation helps clarify the relative contribution of each activity towards the long-term objective. Surveys, focus group discussions or other means of consultation with beneficiaries.
When choosing indicators, it is important to carefully define baseline values and make the scale of the project explicit. Quantitative indicators, such as the number of villages or regions with new strategies or policy forums, are on their own not enough since they do not explain the contribution of the project. Instead, the number of villages with new climate change strategies should be referenced in relation to the total number of villages vulnerable to climate change impacts. These can be represented either as the number of localities at risk or as percentages depending on the context. In order to better understand the contribution of a project to adaptation and to differentiate adaptation from general development, such reference points are crucial.
ENV/WKP(2011)8
43
When evaluating adaptation, an additional issue to keep in mind are the possible barriers to programme or project success. Commonly identified barriers include the need to co-ordinate a diverse set of stakeholders which may be geographically separated or culturally different. This is particularly the case with large multilateral initiatives. Another barrier may arise if there is poor coordination between development agencies operating in the same area. In this case, a potential risk is whether the project can compete with other initiatives in the area, some of which will provide to local officials or stakeholders. This is a challenge in the context of adaptation where potential gains often do not materialise until many years after project or programme completion, creating little incentives for beneficiaries to comply with conditions attached. Such barriers need to be reflected in the evaluation framework and carefully monitored over time.
Finally, the different approaches used by the agencies – particularly in the context of climate risk reduction – raise the question of whether to use detailed indicators corresponding to every component of an intervention or if a more aggregate measure that captures reduction in overall climate vulnerability is preferable. The answer for this is likely to depend on the type and the scale of the activity. For risk reduction measures, a general assessment on vulnerability may be more appropriate than, for example, for training activities aimed at increasing people’s adaptive capacity through the introduction of new livelihood activities.
Approaches to consider
There are a few issues that would be useful to consider when developing M&E frameworks for adaptation that were not identified in the sample analysed. For example, the incorporation of future climate risk in baselines is limited in the documents analysed. Although this demands a certain level of technical expertise, the inclusion of climate risk is particularly important in risk reduction activities such as large infrastructural projects. The application of milestones and targets is not unique to adaptation projects. In the context of adaptation however, the timing of monitoring and evaluation activities need to be adjusted to the longer time horizon of potential climate change impacts. For example, additional evaluations should be planned after the project end date to verify longer-term impacts.
Furthermore, when setting targets, it is important that these are carefully selected to ensure that the corresponding indicators can monitor progress and evaluate results. The analysis identified some vaguely defined targets, such as “ability”, “robustness” or “wellbeing”. These are difficult to monitor unless carefully defined and in some cases combined with guidelines on how they should be assessed or a scoring system against which they can be ranked. In the absence of these, evaluators will have to make a value judgment, biasing the evaluation. An explicit statement of the assumptions made when defining indicators can also help clarifying complex concepts.
Possible future research
This analysis has shown that many adaptation projects and programmes do not differ significantly from other development activities. Development agencies have for a long time included adaptation-related components in their initiatives, particularly in climate sensitive areas. Most adaptation-specific activities aim to reduce people’s vulnerability to climate change by ensuring that the enabling environment is in place (e.g. policy mainstreaming) or by reducing potential risks to climate change impacts (e.g. introduction of climate resilient crops). While these projects have a clear focus on adaptation, they are, at their core, development projects. As such, there is scope to bring in insights from areas ranging from education to conflict resolution and health policy. Beyond the context of developing countries, it would also be helpful to develop closer links between the work that’s underway on M&E of adaptation within industrialised countries and that within developing countries.

ENV/WKP(2011)8
44
Another lesson that can be brought in from the wider development community is the need to situate the evaluation of specific interventions within broader country objectives. In the context of adaptation, this would mean complementing individual project and programme evaluations with overall assessments of trends in countries’ vulnerability to climate change. A framework for linking individual assessments with national level assessments could help to broaden the focus from the means of achieving outcomes (individual interventions) to the desired end result (countries’ becoming less vulnerable to climate change). By doing so, the combination of country-level monitoring and project level M&E should highlight the issues of whether the overall level of action is sufficient, how the distribution of vulnerability is changing and whether the composition of interventions is coherent. There is a need for further research to operationalise this type of approach.

ENV/WKP(2011)8
45
BIBLIOGRAPHY
Adger, W. N., N. Brooks, G. Bentham, M. Agnew and S. Eriksen (2004). New Indicators of Vulnerability and Adaptive Capacity, Tyndall Centre for Climate Change Research, Technical Report 7.
Bakewell, O., & Garbutt, A. (2005). The use and abuse of the logical framework approach. Sweden: Sida.
Brooks, N., W. N. Adger and P. Mick Kelly (2005). The Determinants of Vulnerability and Adaptive Capacity at the National Level and the Implications for Adaptation, Global Environmental Change, 15: 151-163.
De Franca Doria, M., E. Boyd, E. L. Tompkins and N. W. Adger (2009). Using Expert Elicitation to Define Successful Adaptation to Climate Change, Environmental Science and Policy, 12: 810-819.
DFID (UK Department for International Development) (2009a) Guidance on using the revised Logical Framework. How to Note, February 2009. London: DFID.
DFID (2009b) Standard indicators. How to Note, October 2009. London: DFID.
European Commission (EC) (2004). Aid Delivery Methods. Vol 1. Project Cycle Management Guidelines. Brussels: European Commission.
Fankhauser, S., J. B. Smith and R. Tol (1999). Weathering Climate Change. Some Simple Rules to Guide Adaptation Investments, Ecological Economics, 30(1): 67-78.
Frankel-Reed, J. & N. Brooks (2008) Proposed Framework for Monitoring Adaptation to Climate Change. UNDP. Paper prepared for the GEF international workshop on evaluating climate change and development.
GEF (Global Environment Fund) (2010) The GEF Monitoring and Evaluation Policy 2010. Washington DC: GEF.
GEF (2008) Background and Elements for a GEF Monitoring and Evaluation Framework on Adaptation. Lessons from GEF Climate Change Adaptation projects. Washington DC: GEF.
Hallegatte, S., (2006). A Cost-Benefit Analysis of the New Orleans Flood Protection System, Working paper 184, Regulation2point0.
HMRC (Her Majesty's Revenue and Customs) (n.d.) Exchange Rates – Yearly Lists, www.hmrc.gov.uk/exrate/exchangerates-1011.pdf, accessed 28 July 2011.
Hummelbrunner, R. (2010). Beyond Logframe: Critique, Variations and Alternatives. In N. Fujita, Beyond Logframe: Using Systems Concepts in Evaluation (pp. 1-34). Japan: Foundation for Advanced Studies on International Development (FASID).
ENV/WKP(2011)8
46
Intergovernmental Panel on Climate Change (IPCC) (2007), Climate Change 2007: Synthesis Report. Contribution of Working Groups I , II and II to the Fourth Assessment Report of the Intergovernmental Panel on Climate Change [Core Writing Team, Pachauri, R .K and Reisinger, A. (eds.)]. I CC, Geneva, Switzerland, 104 pp.
IRS (US Internal Revenue Service) (n.d.) Yearly Average Exchange Rates for Converting Foreign Currencies into U.S. Dollars, www.irs.gov/businesses/small/international/article/0,,id=206089,00.html, accessed 28 July 2011.
McGray, H. and M. Spearman (2011) Making adaptation count: Concepts and Options for Monitoring and Evaluation of Climate Change Adaptation, Eschborn, GIZ.
McGray, H., A. Hamill, R. Bradley, L. Schipper and J.-E. Parry (2007). Weathering the Storm: Options for Framing Adaptation and Development, World Resources Institute.
OECD (Organisation for Economic Co-operation and Development) (2010) Evaluating Development Co-operation: Summary of Key Norms and Standards. Second Edition. Paris, OECD.
OECD (2005) Bridge Over Troubled Waters: Linking climate change and development. Paris, OECD.
OECD (2002) Glossary of Key Terms in Evaluation and Result Based Management. Paris, OECD.
OECD (2001) Result Based Management in the Development Co-operation Agencies: A Review of Experience. Paris, OECD.
Rogers, P. (1997), Engineering Design and Uncertainties Related to Climate Change, Climatic Change, 37: 229-242.
Smith, J. B., R. Tol, S. Ragland, and S. Fankhauser (1998). Proactive Adaptation to Climate Change. Three Case Studies on Infrastructure Investments, Working Paper D-98/03, Institute for Environmental Studies, Free University, Amsterdam, The Netherlands.
Tompkins, E., W. N. Adger, E. Boyd, S. Nicholson-Cole, K. Weatherhead, N. Arnell (2010). Observed Adaptation to Climate Change: UK Evidence of Transition to a Well-Adapting Society, Global Environmental Change, doi: 10.1016/j.gloenvcha.2010.05.001.
Örtengren, K. (2004). The Logical Framework Approach: A summary of the theory behind the LFA method. Methods Development Unit: Sida.
UNFCCC (United Nations Framework Convention on Climate Change) (2011), The Cancun agreements: outcome of the work of the ad hoc working group on long-term cooperative action under the convention (Decision 1/CP.16).
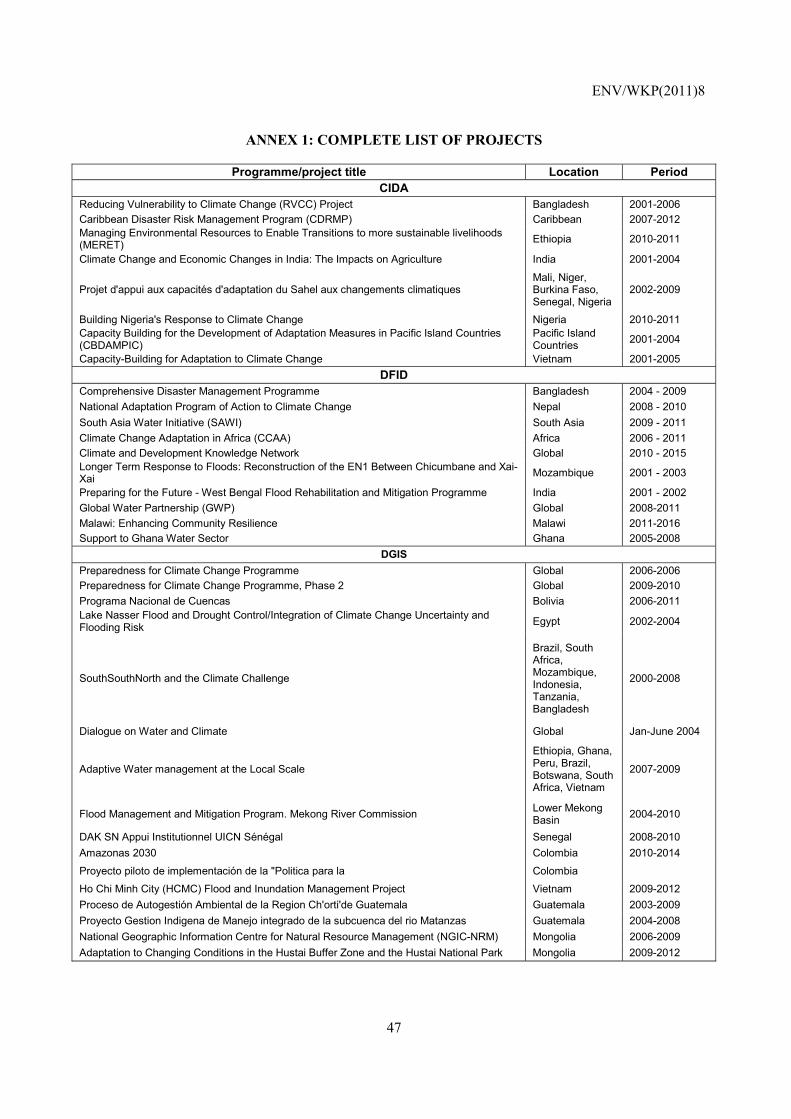
ENV/WKP(2011)8
47
ANNEX 1: COMPLETE LIST OF PROJECTS
Programme/project title Location Period CIDA
Reducing Vulnerability to Climate Change (RVCC) Project Bangladesh 2001-2006 Caribbean Disaster Risk Management Program (CDRMP) Caribbean 2007-2012 Managing Environmental Resources to Enable Transitions to more sustainable livelihoods (MERET) Ethiopia 2010-2011
Climate Change and Economic Changes in India: The Impacts on Agriculture India 2001-2004
Projet d'appui aux capacités d'adaptation du Sahel aux changements climatiques Mali, Niger, Burkina Faso, Senegal, Nigeria
2002-2009
Building Nigeria's Response to Climate Change Nigeria 2010-2011 Capacity Building for the Development of Adaptation Measures in Pacific Island Countries (CBDAMPIC)
Pacific Island Countries 2001-2004
Capacity-Building for Adaptation to Climate Change Vietnam 2001-2005 DFID
Comprehensive Disaster Management Programme Bangladesh 2004 - 2009 National Adaptation Program of Action to Climate Change Nepal 2008 - 2010 South Asia Water Initiative (SAWI) South Asia 2009 - 2011 Climate Change Adaptation in Africa (CCAA) Africa 2006 - 2011 Climate and Development Knowledge Network Global 2010 - 2015 Longer Term Response to Floods: Reconstruction of the EN1 Between Chicumbane and Xai-Xai Mozambique 2001 - 2003
Preparing for the Future - West Bengal Flood Rehabilitation and Mitigation Programme India 2001 - 2002 Global Water Partnership (GWP) Global 2008-2011 Malawi: Enhancing Community Resilience Malawi 2011-2016 Support to Ghana Water Sector Ghana 2005-2008
DGIS Preparedness for Climate Change Programme Global 2006-2006 Preparedness for Climate Change Programme, Phase 2 Global 2009-2010 Programa Nacional de Cuencas Bolivia 2006-2011 Lake Nasser Flood and Drought Control/Integration of Climate Change Uncertainty and Flooding Risk Egypt 2002-2004
SouthSouthNorth and the Climate Challenge
Brazil, South Africa, Mozambique, Indonesia, Tanzania, Bangladesh
2000-2008
Dialogue on Water and Climate Global Jan-June 2004
Adaptive Water management at the Local Scale
Ethiopia, Ghana, Peru, Brazil, Botswana, South Africa, Vietnam
2007-2009
Flood Management and Mitigation Program. Mekong River Commission Lower Mekong Basin 2004-2010
DAK SN Appui Institutionnel UICN Sénégal Senegal 2008-2010 Amazonas 2030 Colombia 2010-2014
Proyecto piloto de implementación de la "Politica para la Colombia
Ho Chi Minh City (HCMC) Flood and Inundation Management Project Vietnam 2009-2012 Proceso de Autogestión Ambiental de la Region Ch'orti'de Guatemala Guatemala 2003-2009 Proyecto Gestion Indigena de Manejo integrado de la subcuenca del rio Matanzas Guatemala 2004-2008 National Geographic Information Centre for Natural Resource Management (NGIC-NRM) Mongolia 2006-2009 Adaptation to Changing Conditions in the Hustai Buffer Zone and the Hustai National Park Mongolia 2009-2012
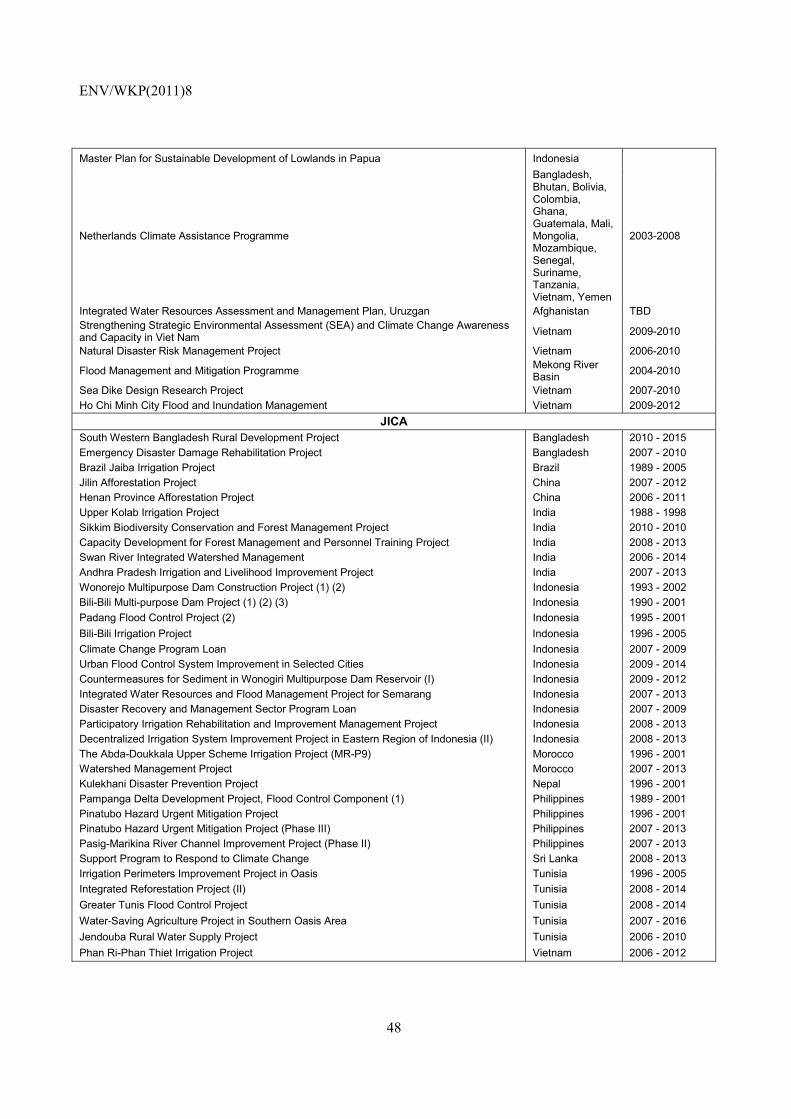
ENV/WKP(2011)8
48
Master Plan for Sustainable Development of Lowlands in Papua Indonesia
Netherlands Climate Assistance Programme
Bangladesh, Bhutan, Bolivia, Colombia, Ghana, Guatemala, Mali, Mongolia, Mozambique, Senegal, Suriname, Tanzania, Vietnam, Yemen
2003-2008
Integrated Water Resources Assessment and Management Plan, Uruzgan Afghanistan TBD Strengthening Strategic Environmental Assessment (SEA) and Climate Change Awareness and Capacity in Viet Nam Vietnam 2009-2010
Natural Disaster Risk Management Project Vietnam 2006-2010
Flood Management and Mitigation Programme Mekong River Basin 2004-2010
Sea Dike Design Research Project Vietnam 2007-2010 Ho Chi Minh City Flood and Inundation Management Vietnam 2009-2012
JICA South Western Bangladesh Rural Development Project Bangladesh 2010 - 2015 Emergency Disaster Damage Rehabilitation Project Bangladesh 2007 - 2010 Brazil Jaiba Irrigation Project Brazil 1989 - 2005 Jilin Afforestation Project China 2007 - 2012 Henan Province Afforestation Project China 2006 - 2011 Upper Kolab Irrigation Project India 1988 - 1998 Sikkim Biodiversity Conservation and Forest Management Project India 2010 - 2010 Capacity Development for Forest Management and Personnel Training Project India 2008 - 2013 Swan River Integrated Watershed Management India 2006 - 2014 Andhra Pradesh Irrigation and Livelihood Improvement Project India 2007 - 2013 Wonorejo Multipurpose Dam Construction Project (1) (2) Indonesia 1993 - 2002 Bili-Bili Multi-purpose Dam Project (1) (2) (3) Indonesia 1990 - 2001 Padang Flood Control Project (2) Indonesia 1995 - 2001 Bili-Bili Irrigation Project Indonesia 1996 - 2005 Climate Change Program Loan Indonesia 2007 - 2009 Urban Flood Control System Improvement in Selected Cities Indonesia 2009 - 2014 Countermeasures for Sediment in Wonogiri Multipurpose Dam Reservoir (I) Indonesia 2009 - 2012 Integrated Water Resources and Flood Management Project for Semarang Indonesia 2007 - 2013 Disaster Recovery and Management Sector Program Loan Indonesia 2007 - 2009 Participatory Irrigation Rehabilitation and Improvement Management Project Indonesia 2008 - 2013 Decentralized Irrigation System Improvement Project in Eastern Region of Indonesia (II) Indonesia 2008 - 2013 The Abda-Doukkala Upper Scheme Irrigation Project (MR-P9) Morocco 1996 - 2001 Watershed Management Project Morocco 2007 - 2013 Kulekhani Disaster Prevention Project Nepal 1996 - 2001 Pampanga Delta Development Project, Flood Control Component (1) Philippines 1989 - 2001 Pinatubo Hazard Urgent Mitigation Project Philippines 1996 - 2001 Pinatubo Hazard Urgent Mitigation Project (Phase III) Philippines 2007 - 2013 Pasig-Marikina River Channel Improvement Project (Phase II) Philippines 2007 - 2013 Support Program to Respond to Climate Change Sri Lanka 2008 - 2013 Irrigation Perimeters Improvement Project in Oasis Tunisia 1996 - 2005 Integrated Reforestation Project (II) Tunisia 2008 - 2014 Greater Tunis Flood Control Project Tunisia 2008 - 2014 Water-Saving Agriculture Project in Southern Oasis Area Tunisia 2007 - 2016 Jendouba Rural Water Supply Project Tunisia 2006 - 2010 Phan Ri-Phan Thiet Irrigation Project Vietnam 2006 - 2012
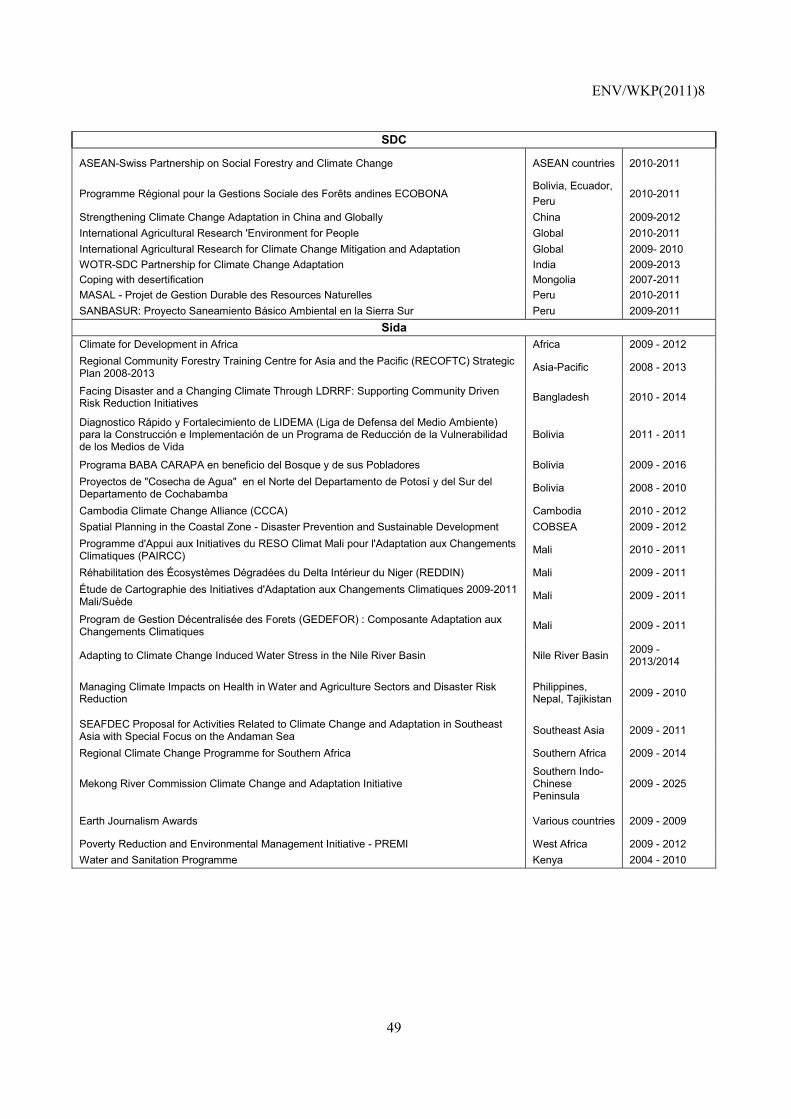
ENV/WKP(2011)8
49
SDC
ASEAN-Swiss Partnership on Social Forestry and Climate Change ASEAN countries 2010-2011
Programme Régional pour la Gestions Sociale des Forêts andines ECOBONA Bolivia, Ecuador,
2010-2011 Peru
Strengthening Climate Change Adaptation in China and Globally China 2009-2012 International Agricultural Research 'Environment for People Global 2010-2011 International Agricultural Research for Climate Change Mitigation and Adaptation Global 2009- 2010 WOTR-SDC Partnership for Climate Change Adaptation India 2009-2013 Coping with desertification Mongolia 2007-2011 MASAL - Projet de Gestion Durable des Resources Naturelles Peru 2010-2011 SANBASUR: Proyecto Saneamiento Básico Ambiental en la Sierra Sur Peru 2009-2011
Sida Climate for Development in Africa Africa 2009 - 2012 Regional Community Forestry Training Centre for Asia and the Pacific (RECOFTC) Strategic Plan 2008-2013 Asia-Pacific 2008 - 2013
Facing Disaster and a Changing Climate Through LDRRF: Supporting Community Driven Risk Reduction Initiatives Bangladesh 2010 - 2014
Diagnostico Rápido y Fortalecimiento de LIDEMA (Liga de Defensa del Medio Ambiente) para la Construcción e Implementación de un Programa de Reducción de la Vulnerabilidad de los Medios de Vida
Bolivia 2011 - 2011
Programa BABA CARAPA en beneficio del Bosque y de sus Pobladores Bolivia 2009 - 2016 Proyectos de "Cosecha de Agua" en el Norte del Departamento de Potosí y del Sur del Departamento de Cochabamba Bolivia 2008 - 2010
Cambodia Climate Change Alliance (CCCA) Cambodia 2010 - 2012 Spatial Planning in the Coastal Zone - Disaster Prevention and Sustainable Development COBSEA 2009 - 2012 Programme d'Appui aux Initiatives du RESO Climat Mali pour l'Adaptation aux Changements Climatiques (PAIRCC) Mali 2010 - 2011
Réhabilitation des Écosystèmes Dégradées du Delta Intérieur du Niger (REDDIN) Mali 2009 - 2011 Étude de Cartographie des Initiatives d'Adaptation aux Changements Climatiques 2009-2011 Mali/Suède Mali 2009 - 2011
Program de Gestion Décentralisée des Forets (GEDEFOR) : Composante Adaptation aux Changements Climatiques Mali 2009 - 2011
Adapting to Climate Change Induced Water Stress in the Nile River Basin Nile River Basin 2009 - 2013/2014
Managing Climate Impacts on Health in Water and Agriculture Sectors and Disaster Risk Reduction
Philippines, Nepal, Tajikistan 2009 - 2010
SEAFDEC Proposal for Activities Related to Climate Change and Adaptation in Southeast Asia with Special Focus on the Andaman Sea Southeast Asia 2009 - 2011
Regional Climate Change Programme for Southern Africa Southern Africa 2009 - 2014
Mekong River Commission Climate Change and Adaptation Initiative Southern Indo-Chinese Peninsula
2009 - 2025
Earth Journalism Awards Various countries 2009 - 2009
Poverty Reduction and Environmental Management Initiative - PREMI West Africa 2009 - 2012 Water and Sanitation Programme Kenya 2004 - 2010