Embed Size (px)
Citation preview

Monitoring and Assessment of Tidal Wetlands in the Delaware Estuary
Danielle KreegerScience Director
Partnership for the Delaware Estuary

The Watershed

Rich History as a “Working River”
1762 map showing Philadelphia on the Delaware River
Slide adapted from Jonathan Sharp’s

Also a “Living River”

Delaware Estuary

Delaware Estuary Science Conference
Goals:
•Assess science and management needs
•Assess knowledgeParticipation:Hundreds, 10 States>240 Presentations to date

NEP Responses to NeedsTop Six Operational Needs
1. Strengthen Linkages Between Science and Management
2. Develop a Conceptual Framework Describing the Ecosystem
3. Implement an Ecosystem Management Approach
4. Grow the Monitoring Infrastructure and Link to ImprovedIndicators and Goals
5. Improve Data Coordination, Compatibility, Quality, Sharing, Accessand Archiving
6. Educate Public and Build Identity for Defining Traits and Issues

Monitoring Infrastructure
Benefits of Expanded Monitoring:•Add new real-time data collection
e.g. chlorophyll, TSS, currents
•Broaden biomonitoring of contaminants
•Improve satellite sensing of SST, chlorophyll, TSS, CDOM
•Add ferry monitoring across baymouth
•Better linkages to living resources such as oysters
MonitoringInfrastructure
The Delaware Estuary Watershed to Ocean Observing System(DEWOOS)A Pilot Integrated ObservingSystem Linking Monitoringof Watershed, Estuaryand Coastal Ocean
A Planning Concept from: Delaware River Basin CommissionUniversity of DelawareRutgers UniversityUS Geological SurveyNOAAStates of New Jersey and DelawarePartnership for the Delaware EstuaryDE, NJ and PA Sea Grant

Tidal Wetlands
A Signature Trait of System
•Near Contiguous Band•Diverse: Freshwater Tidal Marshes
Brackish MarshesSalt Marshes
Ecological Values:Structural
habitat for fish and wildlifenurseries for imperiled taxa
Functionalfood webwater qualityflood protection
Rutgers University

Technical Needs1. Contaminants (forms, sources, fates & effects for different classes)
2. Tidal Wetlands (status, trends and relative importance of different types)
3. Ecologically Significant Species & Critical Habitats (benthos, horseshoe crabs)
4. Ecological Flows (effects of flow changes on salt balance & biota)
5. Physical-Chemical-Biological Linkages (e.g., sediment budgets, toxics & biota)
6. Food Web Dynamics (key trophic connections among functional dominant biota)
7. Nutrients (forms, concentrations and balance of macro- and micronutrients)
8. Ecosystem Functions (assessment and economic valuation of ecosystem services)
9. Habitat Restoration and Enhancement (science & policy)
10. Invasive Species (monitoring, management & control)

Tidal Range up to 9’ Tidal Range up to 9’ Salinity <0.5 Salinity <0.5 ppmppm
Delaware Estuary Delaware Estuary SpartinaSpartina MarshMarsh

High High ProductionProduction

Nursery HabitatNursery Habitat
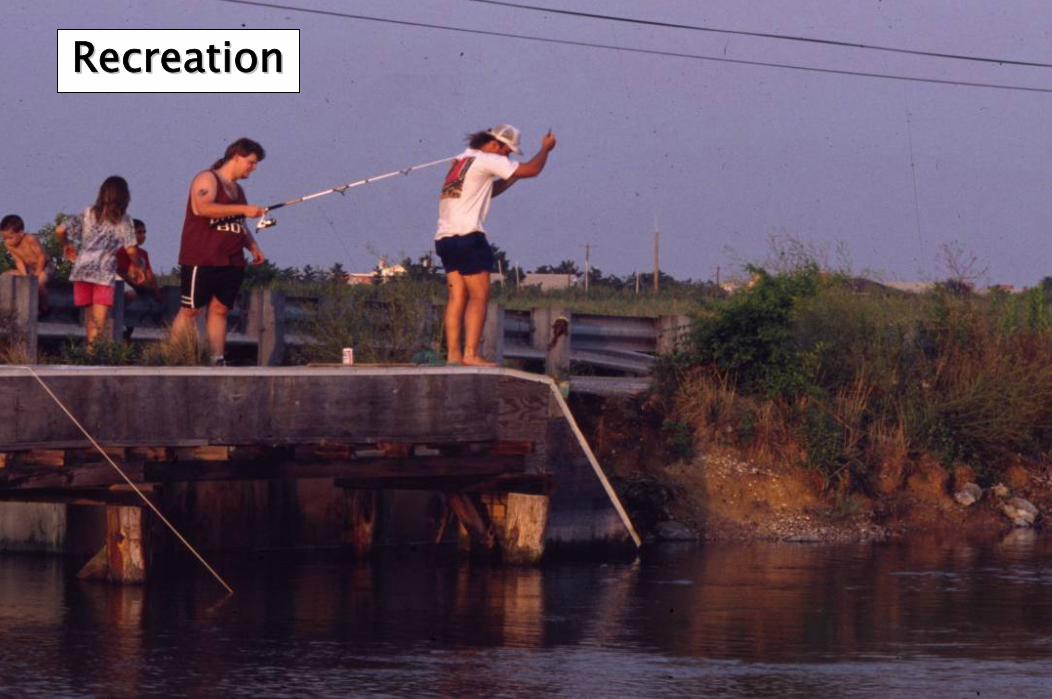
RecreationRecreation
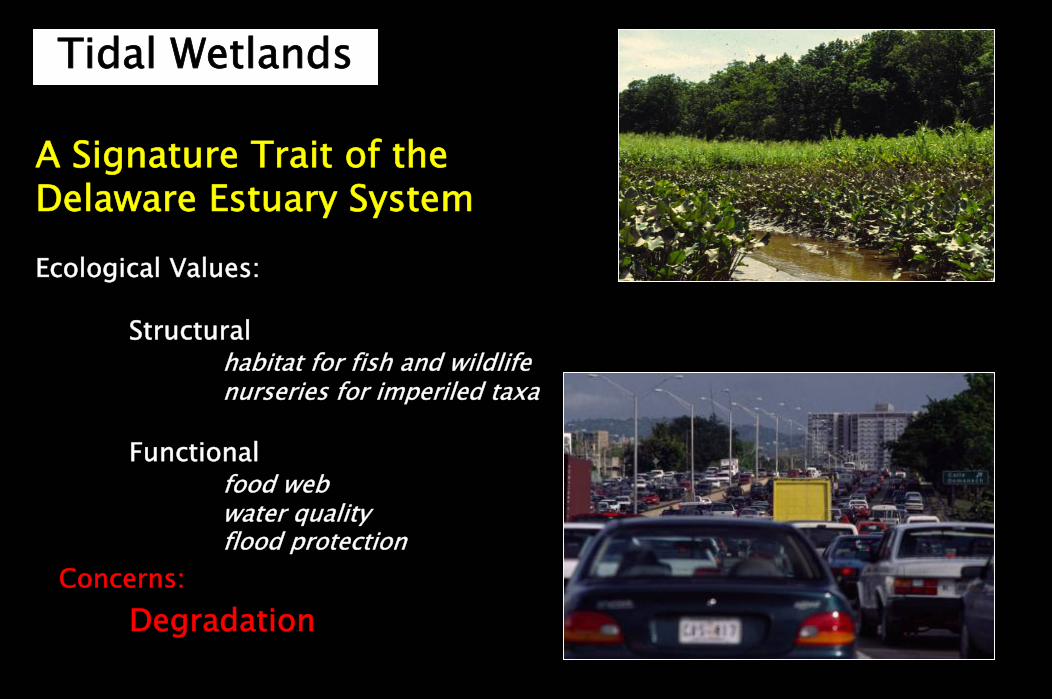
Tidal Wetlands
A Signature Trait of the Delaware Estuary System
Ecological Values:
Structuralhabitat for fish and wildlifenurseries for imperiled taxa
Functionalfood webwater qualityflood protection
Concerns: Degradation

A
C
B
D
Slide from Chris Bason (Center for Inland Bays, DE)

DegradationDegradation
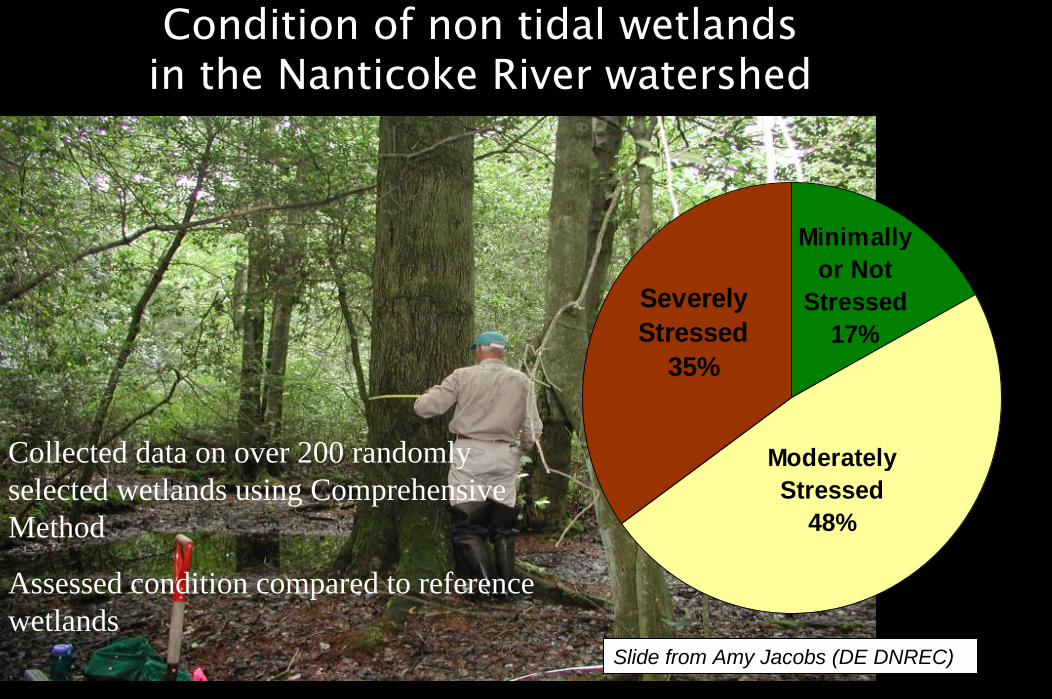
Condition of non tidal wetlands in the Nanticoke River watershed
Moderately Stressed
48%
Severely Stressed
35%
Minimally or Not
Stressed 17%
Collected data on over 200 randomly selected wetlands using Comprehensive Method
Assessed condition compared to reference wetlands
Slide from Amy Jacobs (DE DNREC)

Changes in Wetland FunctionNatural versus Restored
time
Func
tion
Reference Wetland Condition
Restored Wetlands
Existing Wetlands
Slide from Amy Jacobs (DE DNREC)

Tidal Wetlands
Ecological Values:
Structuralhabitat
Functionalfood webwater qualityflood protection
Concerns:Degradation
Conversion & Loss
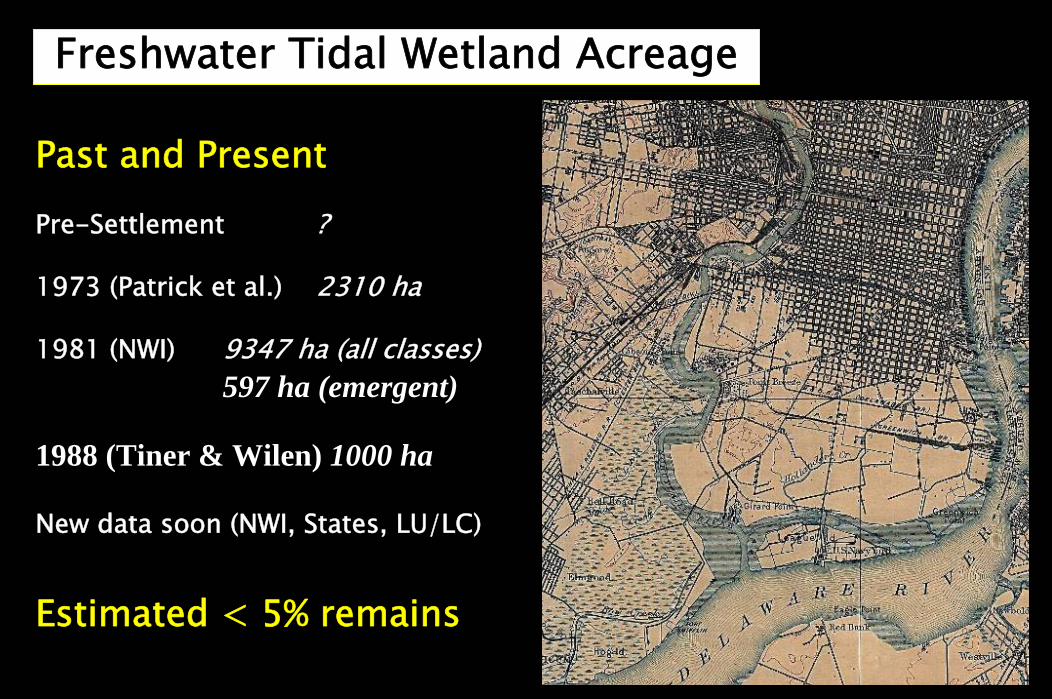
Freshwater Tidal Wetland Acreage
Past and Present
Pre-Settlement ?
1973 (Patrick et al.) 2310 ha
1981 (NWI) 9347 ha (all classes)597 ha (emergent)
1988 (Tiner & Wilen) 1000 ha
New data soon (NWI, States, LU/LC)
Estimated < 5% remains

Tidal Wetlands
Ecological Values:
Structuralhabitat
Functionalfood webwater qualityflood protection
Concerns:DegradationConversion & LossSea level rise
Canary Creek Marsh, DE
1992
2006

Courtesy J. Gebert, ACOE
Courtesy D. Bushek, Rutgers
ShorelineErosion

Tidal Wetlands
Ecological Values:
Structuralhabitat
Functionalfood webwater qualityflood protection
Storms
Concerns:DegradationConversion & LossSea Level Rise

Tidal Wetlands
Ecological Values:
Structuralhabitat
Functionalfood webwater qualityflood protection
Concerns:Degradation Conversion and LossSea Level RiseStorms
Sediment budget

Angola Neck – Rehoboth Bay, DESummer, 2006
Slide from Chris Bason (Center for Inland Bays, DE)
Sudden Wetland Dieback Sudden Wetland Dieback –– Marsh BrowningMarsh Browning


So What Can We Do?

What Can We Do? 1. Build Resiliency
Protect and Conserve

Reed et al., unpublished draft as of Feb. 2008
Vulnerability: will wetlands be converted to open water?
Slide adapted from Michael Craghan, Rutgers
Slide adapted from Michael Craghan, Rutgers
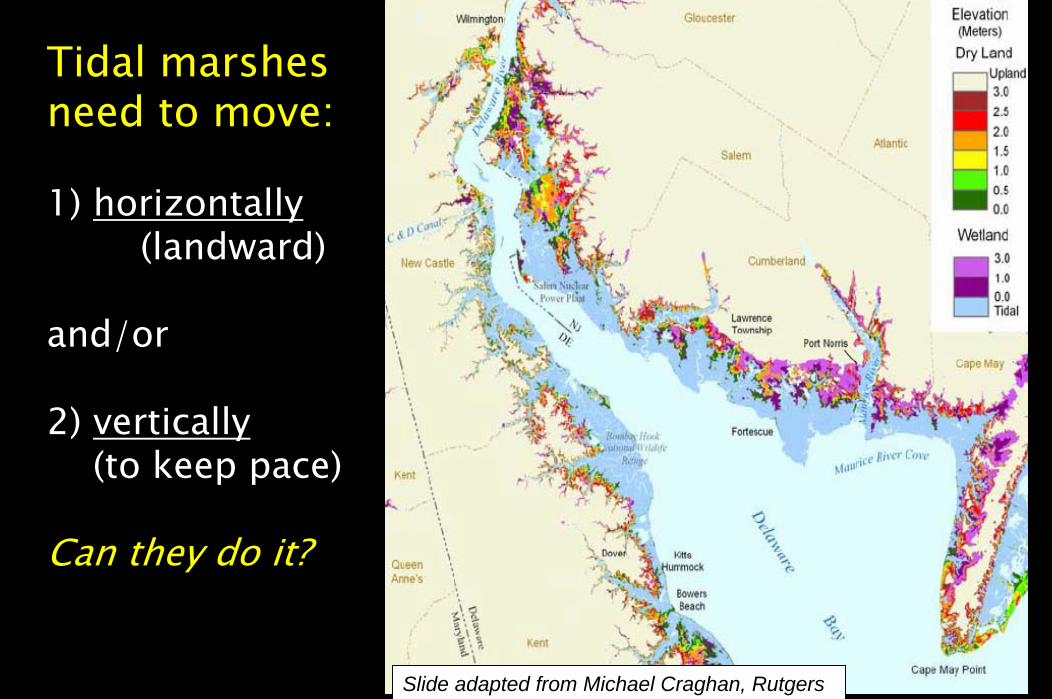
Tidal marshes need to move:
1) horizontally(landward)
and/or
2) vertically(to keep pace)
Can they do it?

SLR and transgression
Env’l types are controlled bythe frequency, depth, andsalinity oftidal flooding.
As sea-level rises, the environmentsshift with thechanging floodconditions.
Slide from Michael Craghan, Rutgers

Stepped terrain
The terrain isnot always as orderly asshown in blockdiagrams.
Elevation steps (which could be bluffs, roads, bulkheads, etc.) are often part of the landscape.
Slide from Michael Craghan, Rutgers
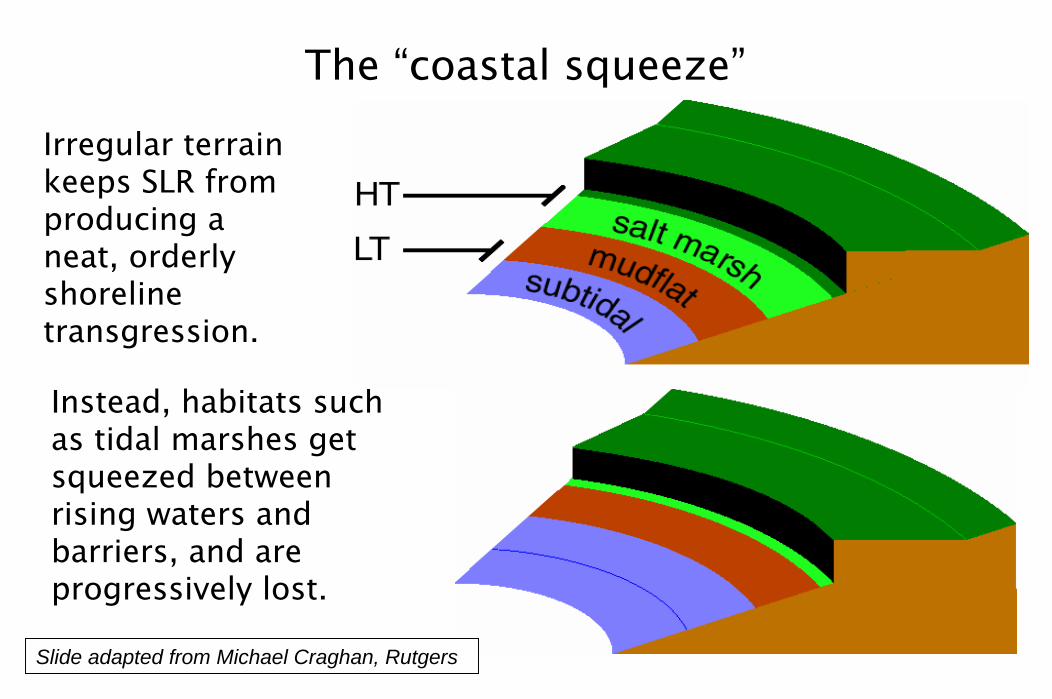
The “coastal squeeze”
Irregular terrainkeeps SLR from producing aneat, orderly shoreline transgression.
Instead, habitats such as tidal marshes get squeezed between rising waters and barriers, and are progressively lost.
Slide adapted from Michael Craghan, Rutgers

0
200
400
600
800
1000
1200
1400
1600
1800
2000
100 200 300 400 500 600 700 800 900 1000
Distance from Shoreline (100m zones)
Are
a (h
ecta
res)
WETLANDSFOREST/SHRUBLANDAGRICULTURAL LANDSALINE/FRESHWATER MARSHESCOMMERICAL/INDUSTRIAL/RESIDENTIAL
Land Use in Tidal Marsh Buffer Zone inthe Lower Estuary of NJ (LE3)
Buffers Buffers Buffers = Resiliency
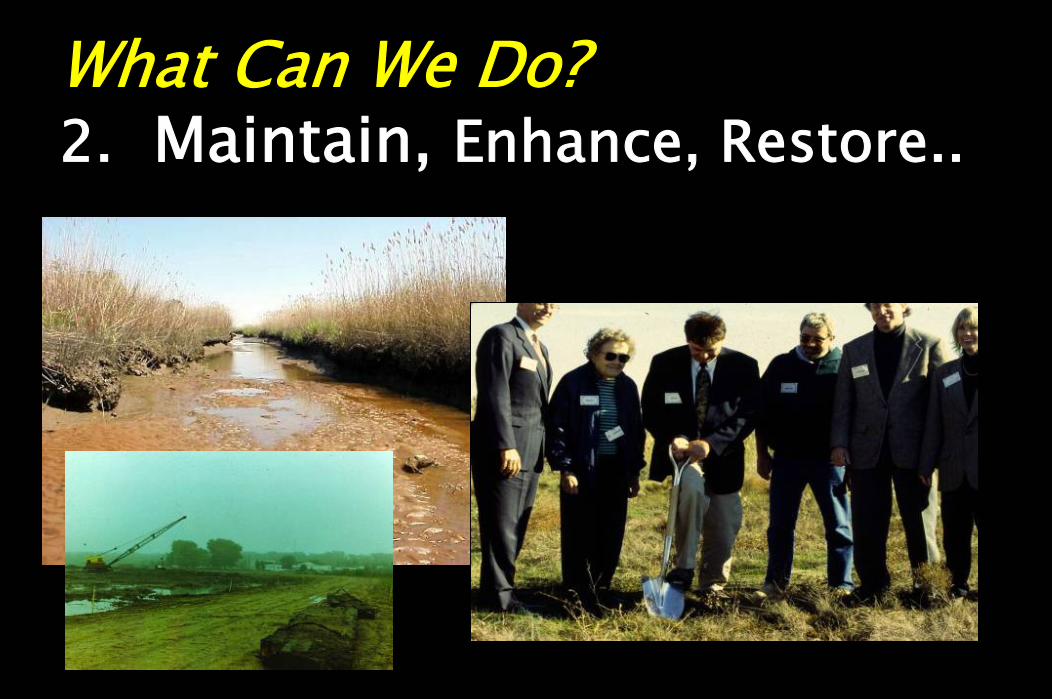
What Can We Do? 2. Maintain, Enhance, Restore..

…But Smartly
Regional Restoration
CoordinationUS Climate Change Science Program
Draft Prospectus Section 4.1
Coastal Elevations and Sensitivity to Sea Level Rise
http://www.climatescience.gov/

• Reduce wave energy • Trap silt• Reduce bank erosion• Protect salt marsh
Shellfish as Natural Breakwaters
Slide from Dave Bushek, Rutgers
DDelaware elaware EEstuary stuary LLiving iving SShoreline horeline IInitiativenitiative

What Can We Do? 3. Monitor & Study

Development of a Estuary-WideStrategy for Tidal WetlandMonitoring & Assessment:
What parameters to monitor?
How to measure spatial extent?
How to detect precursors of wetland decline?
How to set up a meaningful sampling strategy?
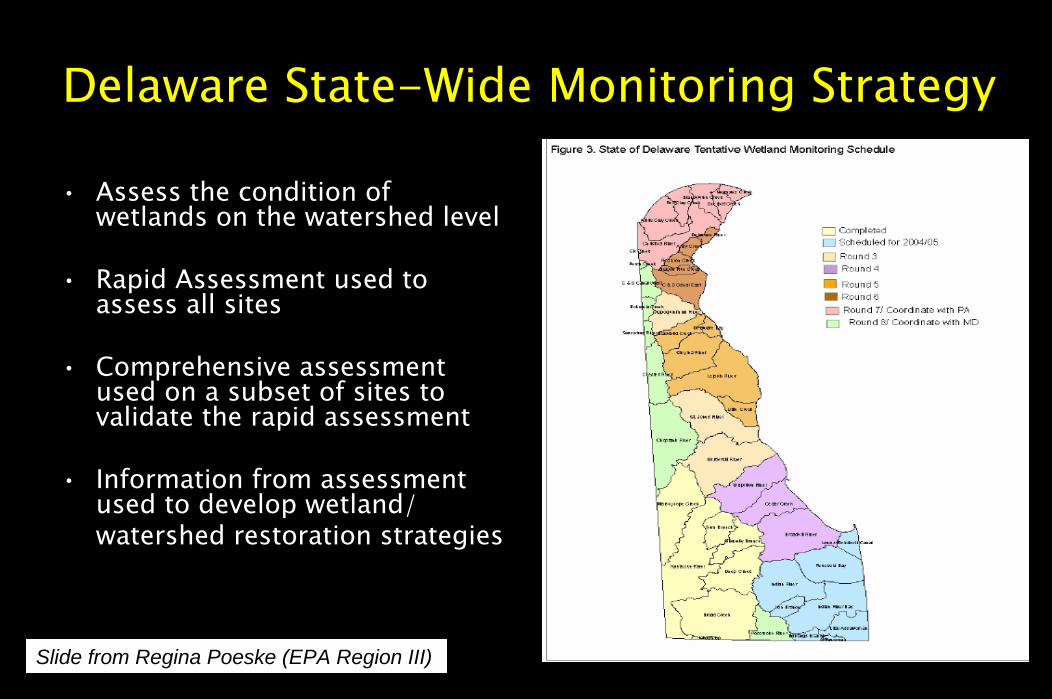
Delaware State-Wide Monitoring Strategy
• Assess the condition of wetlands on the watershed level
• Rapid Assessment used to assess all sites
• Comprehensive assessment used on a subset of sites to validate the rapid assessment
• Information from assessment used to develop wetland/watershed restoration strategies
Slide from Regina Poeske (EPA Region III)

March 2003 EPA document, Elements of a State Water Monitoring and Assessment Program (EPA 841-B-03-003)
April 2006 EPA document, Applications of ….http://www.epa.gov/owow/wetlands/monitor/
Tiered Approach with Core Indicators & Supplemental Indicators- Census (comprehensive)- Probability sampling (extrapolate to broad scale)- Target sampling (e.g., gradient from reference to impacted)
Guidance from EPA
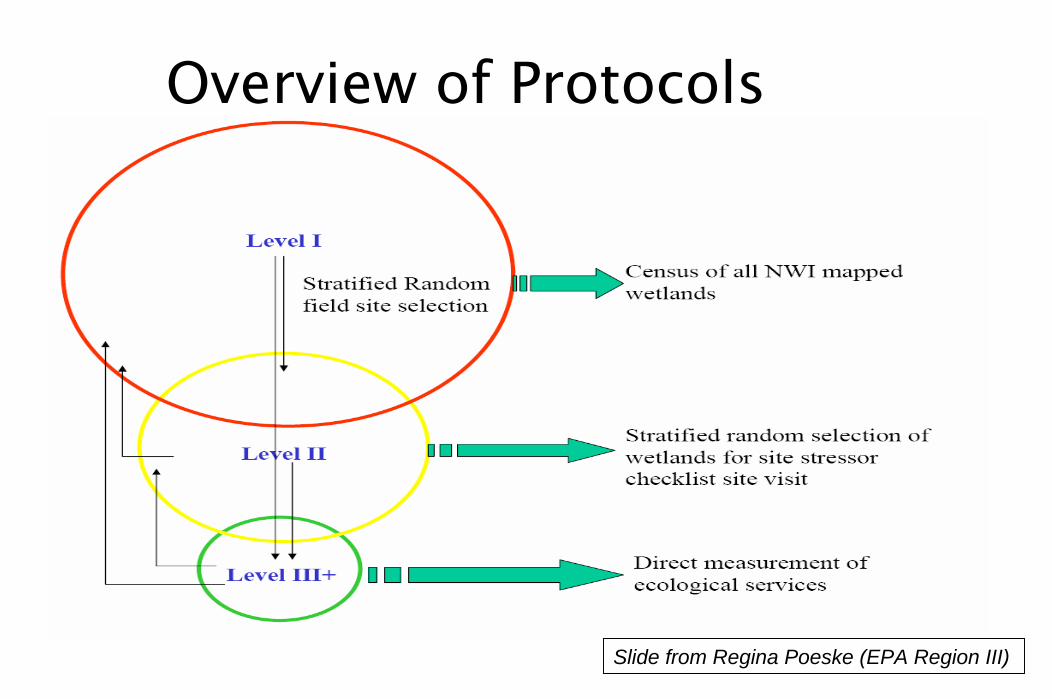
Overview of Protocols
Slide from Regina Poeske (EPA Region III)

AcknowledgementsTidal Wetland Component of the National Water Quality Monitoring Network Delaware Basin Pilot Danielle Kreeger and Amy Jacobs, 11/19/07
The Delaware Estuary Wetland Monitoring and Assessment Program (DEWMAP) :
• Sample Frameall tidal wetlands in the Delaware Estuary
• Subpopulationswetland type (oligohaline, mesohaline, polyhaline)state (DE, NJ, PA)

Tier I - Landscape assessment based on remote sensing techniques to evaluate the general condition of all tidal wetlands. Indicator metrics would include surrounding land use and wetland vegetation characteristics (e.g. Kearney et al. (2002).
Tier II - Probabilistic “rapid” sampling to determine the condition of wetlands stratified by wetland type and state. Sites will be randomly located and assessed with numerous field measurements.
Tier III - Fixed monitoring stations that assess changes associated with major stressors and shifts in base forcing functions in theestuary (e.g., sea level rise, sediment budgets, temperature). These stations will be located in each subpopulation and sampledwith intensive measurements of wetland function and condition.
DEWMAP Design:

DEWMAPDesign:
Design Component Example Indicators Example Metrics
Wetland Extent wetland acreage (hectares) per subpopulation and NWI attribute type Wetland Buffer Condition adjacent land use (e.g., % natural vs. developed in 100m band) Wetland Contiguousness connectivity (inter/intra); patch sizes and fragmentation Historic Change loss or gain in acreage for different subpopulations & attributes Wetland Morphology percent open water; edge to area ratios
Plant Community Integrity vegetation community/type (e.g., Phragmites vs. Spartina, high marsh vs. low marsh, bare soil, open water)
Shoreline Condition edge status (e.g., hardening, erosion)
Tier 1
Anthropogenic Alterations channel straightening, ditching, tide gates, groundwater withdrawals vegetation community type (description of species assemblage) invasive species (percent cover of Phragmites) species list (floristic quality assessment index)
Plant Community Integrity
vegetation structure board Primary Production below and above ground biomass Wetland Morphology percent open water; edge to area ratios Invertebrate Community Integrity (sessile species)
presence and relative abundance of functional dominant and bioindicator species
Wildlife Habitat Integrity (mobile species) evidence of fish and mobile shellfish; avian IBI
Hydrological and Shoreline Integrity
evidence of hydrological alterations or impairment (e.g. depressions, dikes, rip rap)
Substrate Integrity percent organic matter and sediment description
Tier 2
Elevation and Sediment Budget
relative elevation, evidence of accretion or subsidence, wrack accumulation fixed monitoring stations in second order tidal creek (temperature, specific conductivity, pH, turbidity, DO, water level)
Water Quality grab samples in tidal creek for dissolved nutrients and seston quantity & quality, ebb & flood tides (TSS, chlorophyll, proximate biochemistry and stoichiometry)
Biogeochemical Cycling sediment porewater nutrient concentrations, forms, stoichiometric ratios; denitrification rates
Carbon Storage carbon sequestration in belowground biomass; litter accumulation Elevation and Sediment Budget
Sediment Elevation Table (SET), elevation relative to sea level (in addition to Tier 2 metrics)
Plant Community Integrity vegetation robustness (percent cover and stem counts per species) (in addition to Tier 2 metrics)
Tier 3
Functional Dominant Fauna Integrity
invertebrate and vertebrate species lists along intertidal edge and high marsh, biofiltration capacity of bivalves
Tier 1
Tier 2
Tier 3

Euryhaline, Spartina salt marshRutgersNJMaurice River5
Euryhaline, Spartina salt marshDNRECDESt. Jones River4
Mesohaline, brackish tidal marshDNREC/ PDEDEChristina River3
Oligohaline, freshwater tidal marshANSP/RutgersNJCrosswick Creek2
Oligohaline, freshwater tidal marshPADEP/ANSPPATinicum NWR1
DescriptionLead EntitiesStateLocationStation
Tier 3 Fixed Stations:
Water Quality Elevation and Sediment BudgetBiogeochemical Cycling Plant Community IntegrityCarbon Storage Functional Dominant Fauna Integrity
Tier 3 Example Metrics

Tier 3 Costs:Year Activities Costs PA (n=1) DE
(n=2) NJ (n=2) Regional Total
probe and SET $11,000 $22,000 $22,000 - $55,000 staff time to install
and calibrate $4,000 $8,000 $8,000 $5,000 $25,000 1
Planning, purchasing, final site selection, ground-truthing
coordination and baseline field/lab
work - - - $20,000 $20,000
calibrate and maintain probes $3,000 $6,000 $6,000 - $15,000
Field staffing - - - $55,000 $55,000 2
Instrument calibration, maintenance and finish baseline
coordination and lab work - - - $25,000 $25,000
calibrate and maintain probes $3,250 $6,500 $6,500 - $16,250
Field staffing - - - $60,000 $60,000 3
probe maintenance, seasonal analyses, writeups
Coordination, lab work, report - - - $35,000 $35,000
4 repeat year 3 repeat year 3 $3,250 $6,500 $6,500 $95,000 111,250 5 repeat year 3 repeat year 3 $3,250 $6,500 $6,500 $95,000 111,250
Total - - - - - - $528,750

Total DEWMAP Cost:
Tier Year 1 Year 2 Year 3 Year 4 Year 5 Total
1 $25,000 $125,000 $30,000 - - $180,000
2 $25,000 $140,000 $60,000 - - $225,000
3 $100,000 $95,000 111,250 $111,250 $111,250 $528,750
Total $150,000 $360,000 $201,250 $111,250 $111,250 $933,750

• In the Delaware Estuary, the diversity of tidal wetlands may provide an opportunity to establish biological criteria for water quality, in particular for high nutrient concentrations and unbalanced nutrient ratios.
• Longer monitoring of some sites may be needed to evaluate the functions and services provided, which is especially important for “restored” marshes
Additional Notes

• Tidal wetlands are a hallmark feature of the Delaware Estuary
• Better coordination of monitoring and assessment across the region would facilitate management, planning for climate change, and goal-setting
• Efforts to monitor the condition of existing wetlands are needed in addition to assessing wetlands extent
• The Delaware Estuary provides an excellent laboratory for testing new monitoring and assessment design criteria for coastal marshes, such as that proposed by the National Water Quality Monitoring Council and the Delaware River Basin Pilot.
Summary

• Amy Jacobs, DNREC• Regina Poeske, EPA Region III• Chris Bason, DE Center for Inland Bays
Acknowledgements
Contact Info
Danielle [email protected]
www.DelawareEstuary.org

National Waters Assessment
FY06 FY07 FY08 FY09 FY10 FY11 FY12
Lakes Design Field Lab,data Report* Research Design Field
Rivers Research Design Field Lab,data Report Research Design
Streams Report Research Design Field Lab,data Report Research
Coastal Labdata Report Research Design Field Lab,data Report
Wetlands Research Research Research Research Design Field Lab,data
WetlandsWetlands are included in National Waters Assessmentare included in National Waters Assessment
Slide from Regina Poeske (EPA Region III)