Embed Size (px)
Citation preview
IW policy paper 17/2016
Contributions to the political debate by the Cologne Institute for Economic Research
Money supply and inflation in Europe: is there still a connection?
Authors:
Matthias Diermeier Telephone: 0221 4981-605 E-mail: [email protected] Henry Goecke Telephone: 0221 4981-606 E-mail: [email protected]
12th December 2016
© Institut der deutschen Wirtschaft Köln
Postfach 101942 - 50459 Köln
Konrad-Adenauer-Ufer 21 - 50668 Köln
www.iwkoeln.de
Reproduction is permitted
2
Content
Summary .................................................................................................................... 3
1. Initial position ....................................................................................................... 4
2. Analysis of the current situation in Europe ........................................................... 7
3. Conclusion ......................................................................................................... 17
References ............................................................................................................... 19
JEL classification:
E31: Price level, inflation, deflation
E52: Monetary policy
E58: Central banks and monetary policy measures
3
Summary
Since the outbreak of the European financial and economic crisis in 2008, the
monetary policy of the European Central Bank (ECB) has been in crisis mode. The
central bankers are attempting to get a grasp on the current low inflation rates and
inflation expectations by, among other things, introducing a policy of extreme
quantitative easing. The expansion of the Eurosystem's balance sheet was problem-
free on this occasion, and the ECB also managed to eventually increase the money
supply again. However, ensuring that the growth in the money supply transmutes into
higher inflation or inflation expectations has been much more difficult.
Results of the empirical assessment
1. The formulation of an appropriate monetary policy for the heterogeneous
country groups of the euro area remains a challenge.
2. Controlling the money supply is now the last option remaining out of three
monetary policy instruments.
3. Monetary developments have become disconnected from inflation
developments. At present a structural break exists for the various euro area
countries.
4. The ECB's asset purchase programme and the accompanying shift from long-
term to short-term assets on banks’ balance sheets is partly responsible for
this development.
5. In the current regime of extremely low interest rates, there is a strong
connection between the liabilities and lending of commercial banks and
inflation for individual countries.
6. Two problems stand in the way of a universally effective monetary policy in the
euro area: real economy divergence and the different ways in which financial
intermediation works in the different countries.
Recommendations
1. Monetary policy must focus on boosting private demand through increased
lending in order to achieve the inflation target.
2. On the demand side, a reduction in the general and political uncertainty is
necessary, while on the supply side, critical reflection on the regulatory
guidelines is required.
3. In order for monetary policy to once again be effective in all euro area
countries, the banks must be able to fulfil their roles properly. A clean-up of
banks’ balance sheets and the write-off of non-performing loans are
desperately needed.
4. Recommendations 2 and 3 cannot be resolved through monetary policy. The
governments of the respective Member States must take action. These must
raise the employment intensity of growth and push ahead with the regulatory
and supervisory clean-up of banks’ balance sheets.
4
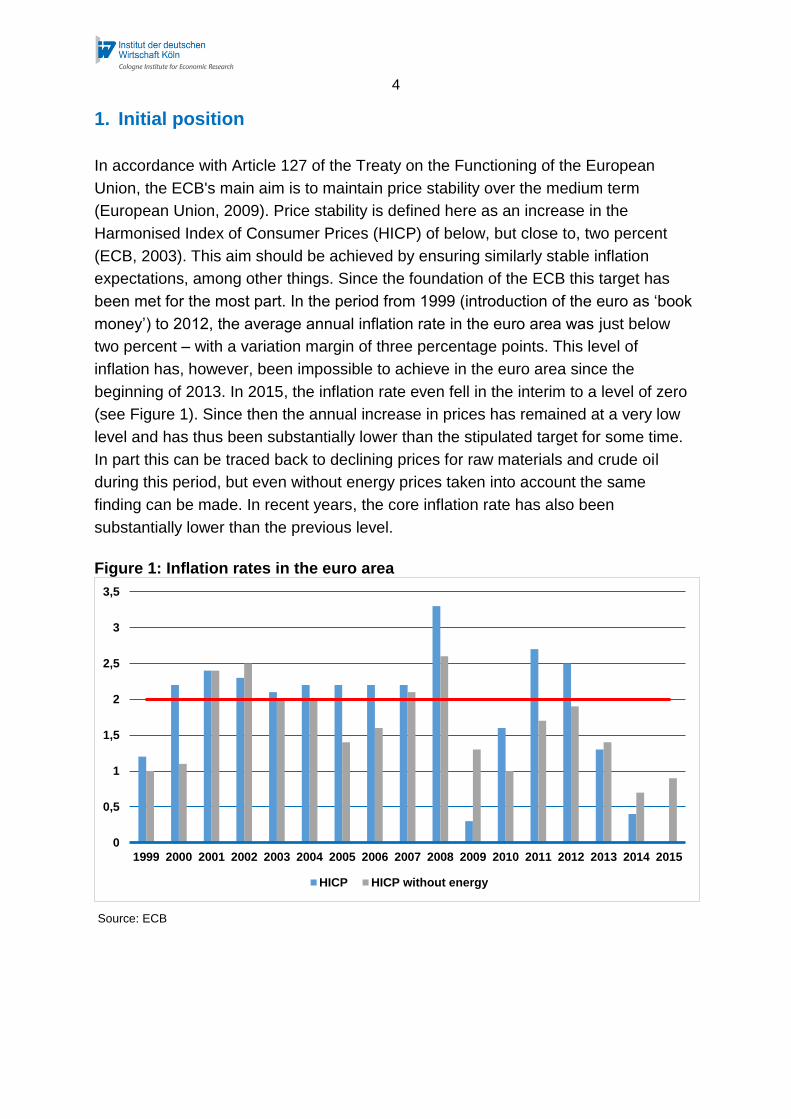
1. Initial position
In accordance with Article 127 of the Treaty on the Functioning of the European
Union, the ECB's main aim is to maintain price stability over the medium term
(European Union, 2009). Price stability is defined here as an increase in the
Harmonised Index of Consumer Prices (HICP) of below, but close to, two percent
(ECB, 2003). This aim should be achieved by ensuring similarly stable inflation
expectations, among other things. Since the foundation of the ECB this target has
been met for the most part. In the period from 1999 (introduction of the euro as ‘book
money’) to 2012, the average annual inflation rate in the euro area was just below
two percent – with a variation margin of three percentage points. This level of
inflation has, however, been impossible to achieve in the euro area since the
beginning of 2013. In 2015, the inflation rate even fell in the interim to a level of zero
(see Figure 1). Since then the annual increase in prices has remained at a very low
level and has thus been substantially lower than the stipulated target for some time.
In part this can be traced back to declining prices for raw materials and crude oil
during this period, but even without energy prices taken into account the same
finding can be made. In recent years, the core inflation rate has also been
substantially lower than the previous level.
Figure 1: Inflation rates in the euro area
Source: ECB
0
0,5
1
1,5
2
2,5
3
3,5
1999 2000 2001 2002 2003 2004 2005 2006 2007 2008 2009 2010 2011 2012 2013 2014 2015
HICP HICP without energy
5
In order to achieve the target level set for price stability once again, the ECB
essentially has three monetary policy instruments at its disposal:
interest rate setting
controlling the money supply and
influencing inflation expectations through its communications.
The remaining potential of these three instruments currently looks like this. Since
March 2016, the ECB’s base rate has been at 0.00 percent. Irrespective of the
debate surrounding which interest rates can be dropped further, even into negative
territory, the following is true: a reduction in the ECB’s base rate to low but still
positive rates is no longer causing interest rates in all countries of the currency union
to fall (Demary and Hüther, 2015a). The transmission mechanism seems to be
disturbed in the low interest environment, or at least in comparison with normal times
it seems to follow different rules (zero lower bound problem; McCallum, 2000). As
such, this instrument has practically reached its limit in terms of being able to
stimulate inflation. A current indicator for the lack of effectiveness of a further
broadening of the expansive monetary policy is the Wu-Xia shadow rate (Wu and
Xia, 2015). This interest rate approximates the non-observed interest rate under the
zero-rate level, which is valid for the wider economy. In the case of Europe, the Wu-
Xia shadow rate was already in negative territory in 2015 and has been falling ever
since, up until the present day – without stimulating inflation or providing a lasting
boost to inflation expectations.
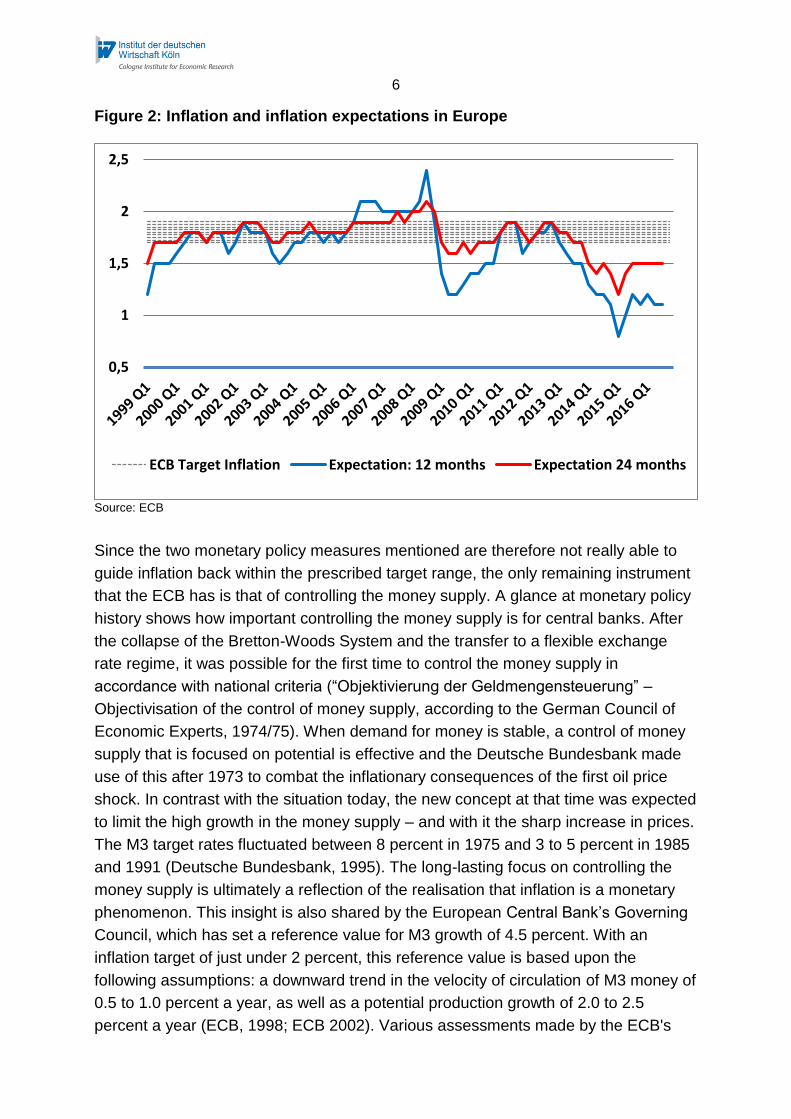
Controlling inflation through inflation expectations is also proving to be increasingly
difficult (see Figure 2). For a long time inflation expectations were fixed at a level of
close to two percent, yet this anchor disappeared thanks to the persistently low
inflation. The ECB is obviously not able to keep inflation expectations in line with its
inflation target over the long term in an environment of low inflation rates. After Mario
Draghi’s “Whatever it takes” speech in July 2012, the expectations slipped even
further downwards out of the ECB’s target range. It is not only Europe that is failing to
anchor inflation expectations, rather this has been experienced across the globe
(Afrouzi et al., 2015). For the ECB this means that it cannot use what is known as
“forward guidance”, that is to say either the announcement of future interest rate
movements or the announcement of expansive monetary policy measures, to anchor
inflation expectations within the original target range again. As such the
communication instrument also seems to have more or less lost its influence, at least
over inflation expectations. Nevertheless, through the announcement of its
unconventional measures, the ECB has managed to once again anchor two-year
inflation expectations at 1.5 percent.
6
Figure 2: Inflation and inflation expectations in Europe
Source: ECB
Since the two monetary policy measures mentioned are therefore not really able to
guide inflation back within the prescribed target range, the only remaining instrument
that the ECB has is that of controlling the money supply. A glance at monetary policy
history shows how important controlling the money supply is for central banks. After
the collapse of the Bretton-Woods System and the transfer to a flexible exchange
rate regime, it was possible for the first time to control the money supply in
accordance with national criteria (“Objektivierung der Geldmengensteuerung” –
Objectivisation of the control of money supply, according to the German Council of
Economic Experts, 1974/75). When demand for money is stable, a control of money
supply that is focused on potential is effective and the Deutsche Bundesbank made
use of this after 1973 to combat the inflationary consequences of the first oil price
shock. In contrast with the situation today, the new concept at that time was expected
to limit the high growth in the money supply – and with it the sharp increase in prices.
The M3 target rates fluctuated between 8 percent in 1975 and 3 to 5 percent in 1985
and 1991 (Deutsche Bundesbank, 1995). The long-lasting focus on controlling the
money supply is ultimately a reflection of the realisation that inflation is a monetary
phenomenon. This insight is also shared by the European Central Bank’s Governing
Council, which has set a reference value for M3 growth of 4.5 percent. With an
inflation target of just under 2 percent, this reference value is based upon the
following assumptions: a downward trend in the velocity of circulation of M3 money of
0.5 to 1.0 percent a year, as well as a potential production growth of 2.0 to 2.5
percent a year (ECB, 1998; ECB 2002). Various assessments made by the ECB's
0,5
1
1,5
2
2,5
ECB Target Inflation Expectation: 12 months Expectation 24 months
7
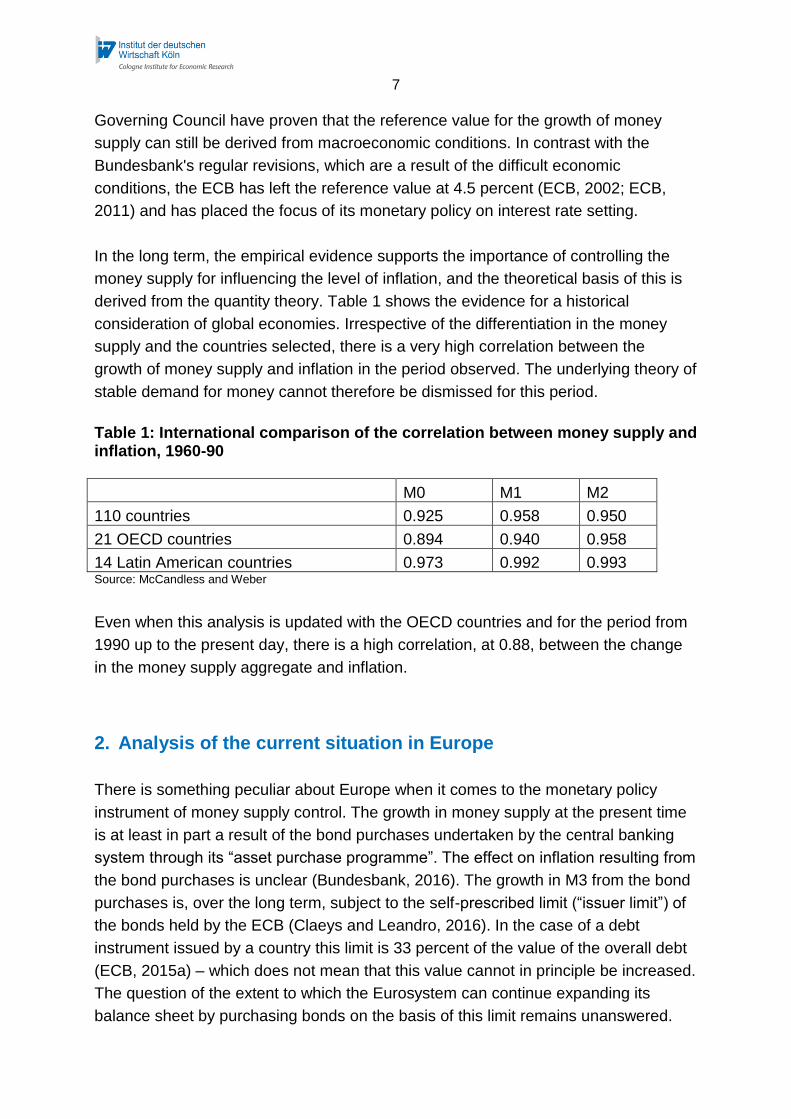
Governing Council have proven that the reference value for the growth of money
supply can still be derived from macroeconomic conditions. In contrast with the
Bundesbank's regular revisions, which are a result of the difficult economic
conditions, the ECB has left the reference value at 4.5 percent (ECB, 2002; ECB,
2011) and has placed the focus of its monetary policy on interest rate setting.
In the long term, the empirical evidence supports the importance of controlling the
money supply for influencing the level of inflation, and the theoretical basis of this is
derived from the quantity theory. Table 1 shows the evidence for a historical
consideration of global economies. Irrespective of the differentiation in the money
supply and the countries selected, there is a very high correlation between the
growth of money supply and inflation in the period observed. The underlying theory of
stable demand for money cannot therefore be dismissed for this period.
Table 1: International comparison of the correlation between money supply and inflation, 1960-90
M0 M1 M2
110 countries 0.925 0.958 0.950
21 OECD countries 0.894 0.940 0.958
14 Latin American countries 0.973 0.992 0.993 Source: McCandless and Weber
Even when this analysis is updated with the OECD countries and for the period from
1990 up to the present day, there is a high correlation, at 0.88, between the change
in the money supply aggregate and inflation.
2. Analysis of the current situation in Europe
There is something peculiar about Europe when it comes to the monetary policy
instrument of money supply control. The growth in money supply at the present time
is at least in part a result of the bond purchases undertaken by the central banking
system through its “asset purchase programme”. The effect on inflation resulting from
the bond purchases is unclear (Bundesbank, 2016). The growth in M3 from the bond
purchases is, over the long term, subject to the self-prescribed limit (“issuer limit”) of
the bonds held by the ECB (Claeys and Leandro, 2016). In the case of a debt
instrument issued by a country this limit is 33 percent of the value of the overall debt
(ECB, 2015a) – which does not mean that this value cannot in principle be increased.
The question of the extent to which the Eurosystem can continue expanding its
balance sheet by purchasing bonds on the basis of this limit remains unanswered.
8
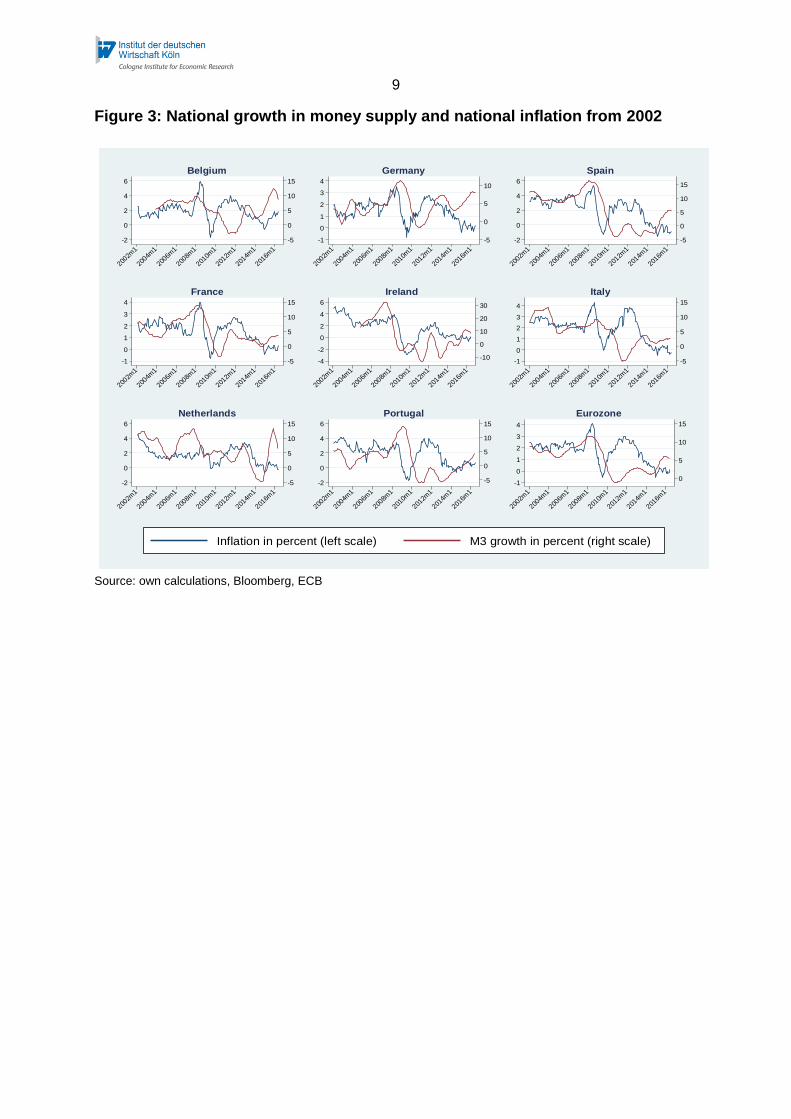
If the historical perspective is still held, contrary to the current debate surrounding the
effectiveness of the ECB’s bond purchases, however, there is hope for the ECB that
it could, via a high growth rate for the money supply, generate positive momentum for
an increase in inflation. In fact, over the last 12 months the ECB has managed to
increase the growth rate of money supply back to a level of around five percent.
Nevertheless, it was clear that at the same time inflation was falling further or
remains at a very low level. As a result the correlation between money growth and
inflation rates in the euro area since the outbreak of the euro crisis no longer exists –
obviously there was a structural break here. The statistics substantiate this change.
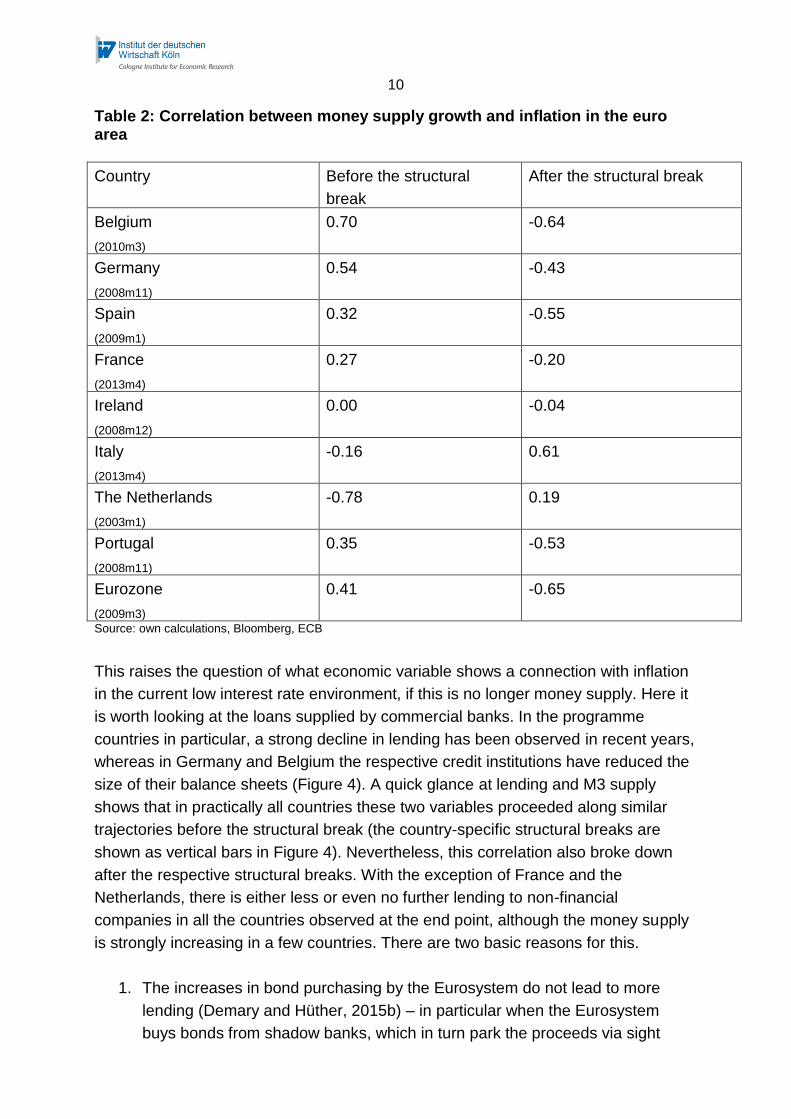
Table 2 shows the correlations before and after a structural break. Figure 3 depicts
the connection between M3 and inflation for the whole of the euro area and in certain
member countries. The moment that the structural break happened in each country is
defined separately through an econometric approach using a “Supremum Wald” test
for structural breaks with an unknown date for the Eurozone aggregate and for the
individual countries of the currency union. The timing of the structural break in each
country that has been defined in this way is entered in the table. The different timings
of the structural breaks can be explained in part by the extreme differences in the
financial and economic systems of the Eurozone member states.
It seems that in all countries, with the exception of Ireland, Italy and the Netherlands,
the positive correlations that existed before the respective structural breaks have
disappeared, or have switched to strong negative correlations. From a monetary
policy perspective the Netherlands is an exception because the structural break was
identified as happening very early (January 2003). The missing connection between
inflation and the growth of the money supply at the current time is also true for the
Netherlands – with money supply growth of up to 15 percent and inflation around 0.5
percent. It is only covered by the long time period after the country-specific structural
breaks. In Ireland, neither before nor after the structural break, has there been an
empirical correlation between money supply growth and inflation. A positive
correlation after the structural break could be seen in Italy, but even here a
divergence of the two variables has been observed since 2015. Overall, the majority
of euro countries show a homogeneous picture of the relationship at the current time:
the situation is characterised by low inflation rates at the same time as increasing
money supply.
9
Figure 3: National growth in money supply and national inflation from 2002
Source: own calculations, Bloomberg, ECB
-5
0
5
10
15
-2
0
2
4
6
2002m
1
2004m
1
2006m
1
2008m
1
2010m
1
2012m
1
2014m
1
2016m
1
Belgium
-5
0
5
10
-1
0
1
2
3
4
2002m
1
2004m
1
2006m
1
2008m
1
2010m
1
2012m
1
2014m
1
2016m
1
Germany
-5
0
5
10
15
-2
0
2
4
6
2002m
1
2004m
1
2006m
1
2008m
1
2010m
1
2012m
1
2014m
1
2016m
1
Spain
-5
0
5
10
15
-1
0
1
2
3
4
2002m
1
2004m
1
2006m
1
2008m
1
2010m
1
2012m
1
2014m
1
2016m
1
France
-10
0
10
20
30
-4
-2
0
2
4
6
2002m
1
2004m
1
2006m
1
2008m
1
2010m
1
2012m
1
2014m
1
2016m
1
Ireland
-5
0
5
10
15
-1
0
1
2
3
4
2002m
1
2004m
1
2006m
1
2008m
1
2010m
1
2012m
1
2014m
1
2016m
1
Italy
-5
0
5
10
15
-2
0
2
4
6
2002m
1
2004m
1
2006m
1
2008m
1
2010m
1
2012m
1
2014m
1
2016m
1
Netherlands
-5
0
5
10
15
-2
0
2
4
6
2002m
1
2004m
1
2006m
1
2008m
1
2010m
1
2012m
1
2014m
1
2016m
1
Portugal
0
5
10
15
-1
0
1
2
3
4
2002m
1
2004m
1
2006m
1
2008m
1
2010m
1
2012m
1
2014m
1
2016m
1
Eurozone
Inflation in percent (left scale) M3 growth in percent (right scale)
10
Table 2: Correlation between money supply growth and inflation in the euro area
Country Before the structural
break
After the structural break
Belgium
(2010m3)
0.70 -0.64
Germany
(2008m11)
0.54 -0.43
Spain
(2009m1)
0.32 -0.55
France
(2013m4)
0.27 -0.20
Ireland
(2008m12)
0.00 -0.04
Italy
(2013m4)
-0.16 0.61
The Netherlands
(2003m1)
-0.78 0.19
Portugal
(2008m11)
0.35 -0.53
Eurozone
(2009m3)
0.41 -0.65
Source: own calculations, Bloomberg, ECB
This raises the question of what economic variable shows a connection with inflation
in the current low interest rate environment, if this is no longer money supply. Here it
is worth looking at the loans supplied by commercial banks. In the programme
countries in particular, a strong decline in lending has been observed in recent years,
whereas in Germany and Belgium the respective credit institutions have reduced the
size of their balance sheets (Figure 4). A quick glance at lending and M3 supply
shows that in practically all countries these two variables proceeded along similar
trajectories before the structural break (the country-specific structural breaks are
shown as vertical bars in Figure 4). Nevertheless, this correlation also broke down
after the respective structural breaks. With the exception of France and the
Netherlands, there is either less or even no further lending to non-financial
companies in all the countries observed at the end point, although the money supply
is strongly increasing in a few countries. There are two basic reasons for this.
1. The increases in bond purchasing by the Eurosystem do not lead to more
lending (Demary and Hüther, 2015b) – in particular when the Eurosystem
buys bonds from shadow banks, which in turn park the proceeds via sight
11
deposits in the respective commercial banks. The bond purchases are
recorded (at least in part) in the M3 aggregate, but they do not pertain to the
loans given by commercial banks. Even when the central bank buys high-risk
securities, it is possible that, as a result of the Wallace neutrality, no real
economy effects emerge. This is the case when private entities expect an
increased tax burden in the future as a result of the assumption of risk by a
government (Wallace, 1981; Bundesbank, 2016).
2. A change in the maturity towards more short-term lending and increased
purchases of long-term securities (ECB, 2015b; Bundesbank and BaFin,
2015). This pure asset shift has no effect on the overall level of lending by the
commercial banks, but increases the supply of M3.
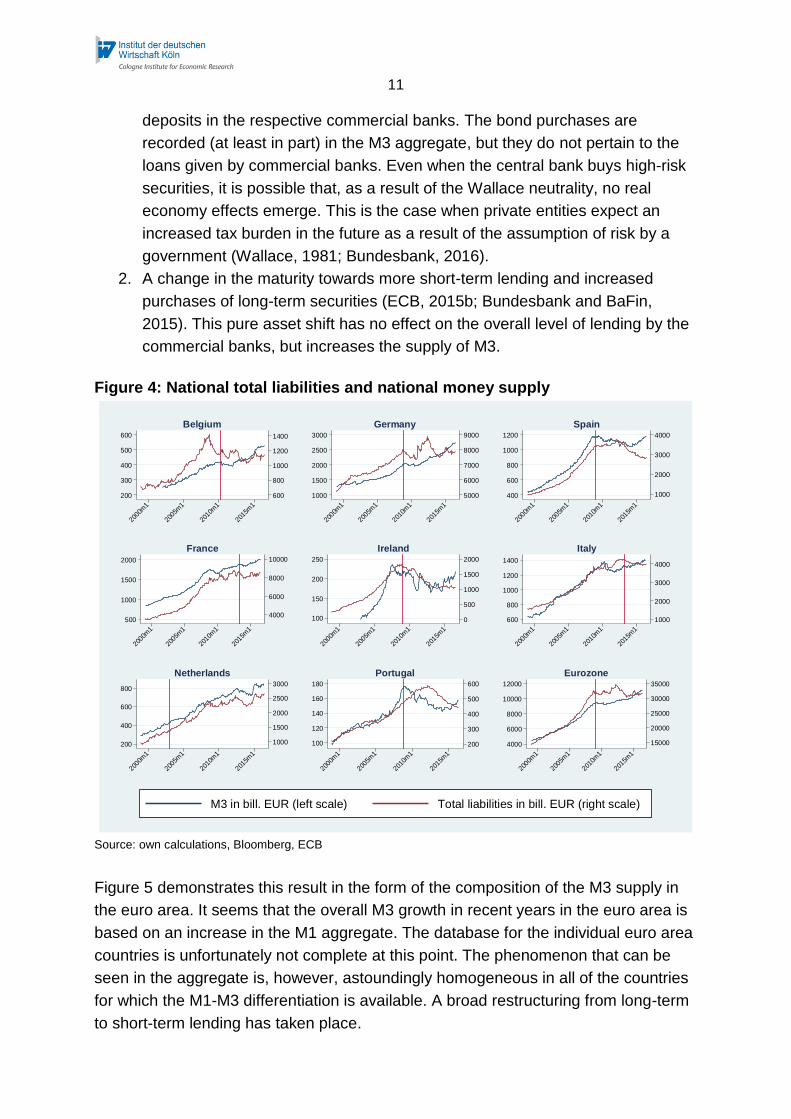
Figure 4: National total liabilities and national money supply
Source: own calculations, Bloomberg, ECB
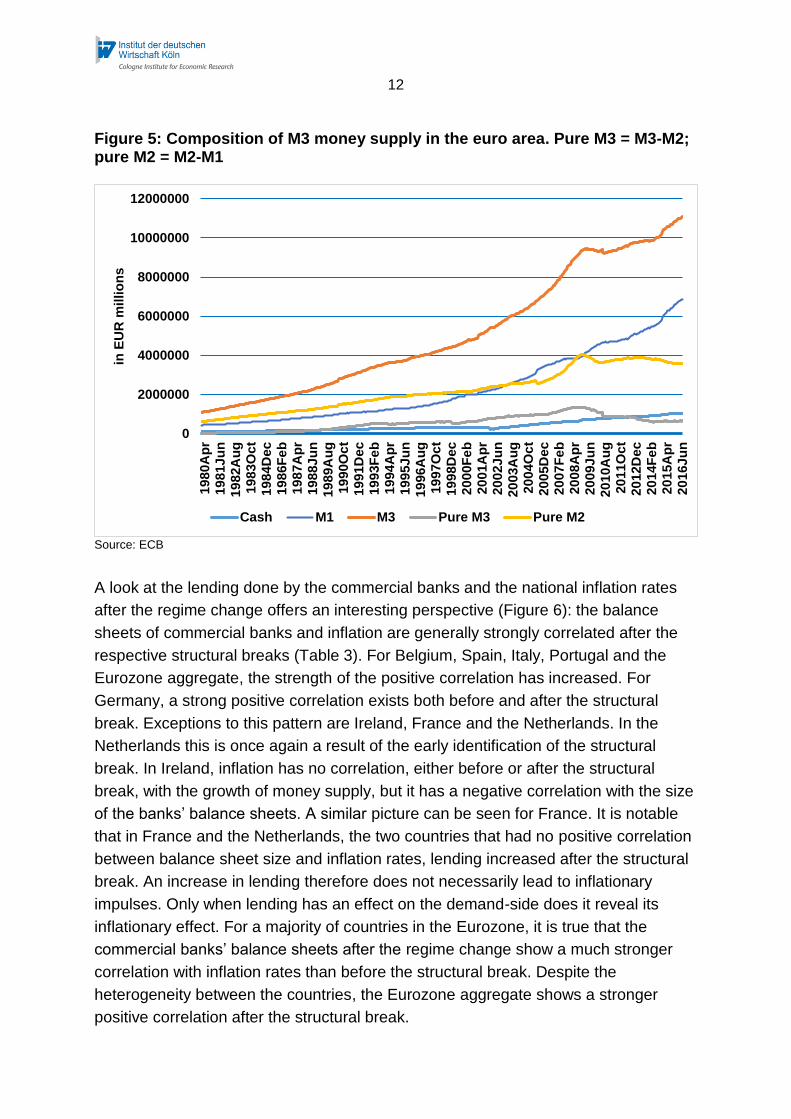
Figure 5 demonstrates this result in the form of the composition of the M3 supply in
the euro area. It seems that the overall M3 growth in recent years in the euro area is
based on an increase in the M1 aggregate. The database for the individual euro area
countries is unfortunately not complete at this point. The phenomenon that can be
seen in the aggregate is, however, astoundingly homogeneous in all of the countries
for which the M1-M3 differentiation is available. A broad restructuring from long-term
to short-term lending has taken place.
1000 2000 3000 4000
600 800
1000 1200 1400
Italy
1000 1500 2000 2500 3000
200 400 600 800
The Netherlands
200 300 400 500 600
100 120 140 160 180
Portugal
15000 20000 25000 30000 35000
4000 6000 8000
10000 12000
EU
M3 in EUR billions (left axis) Total liabilities in EUR billions (right axis)
600
800
1000
1200
1400
200
300
400
500
600
2000
m1
2005
m1
2010
m1
2015
m1
Belgium
5000
6000
7000
8000
9000
1000
1500
2000
2500
3000
2000
m1
2005
m1
2010
m1
2015
m1
Germany
1000
2000
3000
4000
400
600
800
1000
1200
2000
m1
2005
m1
2010
m1
2015
m1
Spain
4000
6000
8000
10000
500
1000
1500
2000
2000
m1
2005
m1
2010
m1
2015
m1
France
0
500
1000
1500
2000
100
150
200
250
2000
m1
2005
m1
2010
m1
2015
m1
Ireland
1000
2000
3000
4000
600
800
1000
1200
1400
2000
m1
2005
m1
2010
m1
2015
m1
Italy
1000
1500
2000
2500
3000
200
400
600
800
2000
m1
2005
m1
2010
m1
2015
m1
Netherlands
200
300
400
500
600
100
120
140
160
180
2000
m1
2005
m1
2010
m1
2015
m1
Portugal
15000
20000
25000
30000
35000
4000
6000
8000
10000
12000
2000
m1
2005
m1
2010
m1
2015
m1
Eurozone
M3 in bill. EUR (left scale) Total liabilities in bill. EUR (right scale)
12
Figure 5: Composition of M3 money supply in the euro area. Pure M3 = M3-M2; pure M2 = M2-M1
Source: ECB
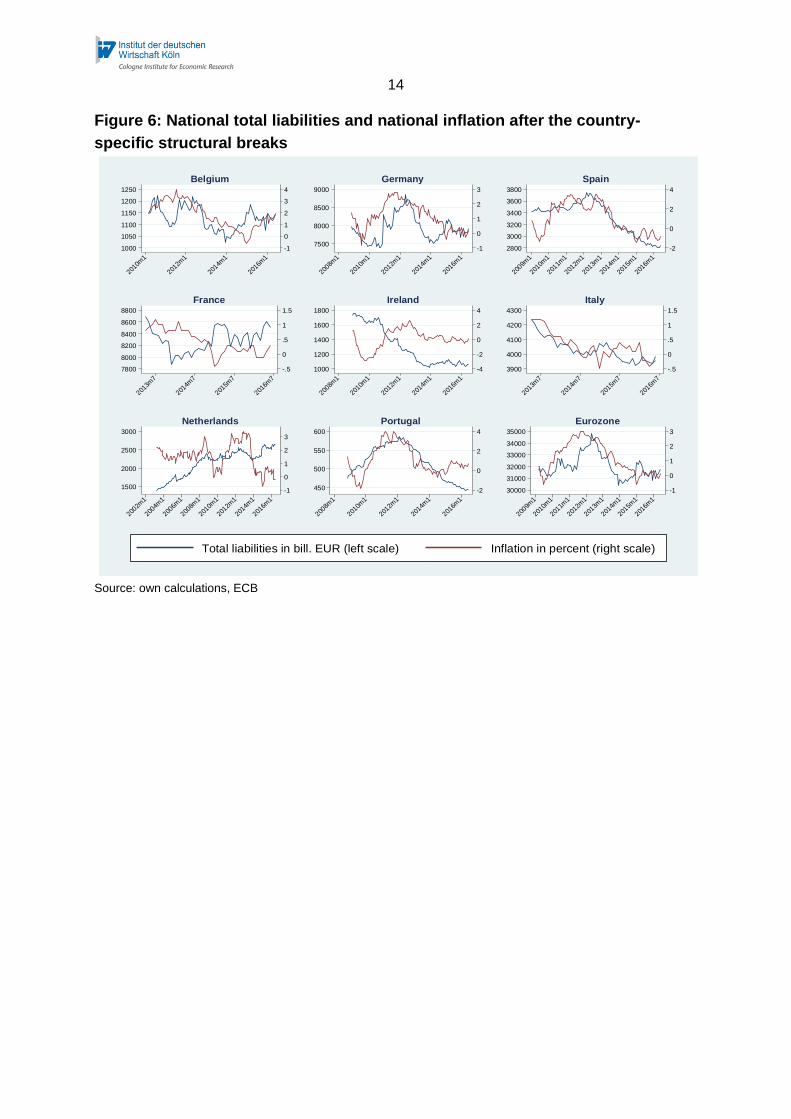
A look at the lending done by the commercial banks and the national inflation rates
after the regime change offers an interesting perspective (Figure 6): the balance
sheets of commercial banks and inflation are generally strongly correlated after the
respective structural breaks (Table 3). For Belgium, Spain, Italy, Portugal and the
Eurozone aggregate, the strength of the positive correlation has increased. For
Germany, a strong positive correlation exists both before and after the structural
break. Exceptions to this pattern are Ireland, France and the Netherlands. In the
Netherlands this is once again a result of the early identification of the structural
break. In Ireland, inflation has no correlation, either before or after the structural
break, with the growth of money supply, but it has a negative correlation with the size
of the banks’ balance sheets. A similar picture can be seen for France. It is notable
that in France and the Netherlands, the two countries that had no positive correlation
between balance sheet size and inflation rates, lending increased after the structural
break. An increase in lending therefore does not necessarily lead to inflationary
impulses. Only when lending has an effect on the demand-side does it reveal its
inflationary effect. For a majority of countries in the Eurozone, it is true that the
commercial banks’ balance sheets after the regime change show a much stronger
correlation with inflation rates than before the structural break. Despite the
heterogeneity between the countries, the Eurozone aggregate shows a stronger
positive correlation after the structural break.
0
2000000
4000000
6000000
8000000
10000000
12000000
20
16J
un
20
15A
pr
20
14F
eb
20
12D
ec
20
11O
ct
20
10A
ug
20
09J
un
20
08A
pr
20
07F
eb
20
05D
ec
20
04O
ct
20
03A
ug
20
02J
un
20
01A
pr
20
00F
eb
19
98D
ec
19
97O
ct
19
96A
ug
19
95J
un
19
94A
pr
19
93F
eb
19
91D
ec
19
90O
ct
19
89A
ug
19
88J
un
19
87A
pr
19
86F
eb
19
84D
ec
19
83O
ct
19
82A
ug
19
81J
un
19
80A
pr
in E
UR
millio
ns
Cash M1 M3 Pure M3 Pure M2
13
After the outbreak of the euro crisis, many commercial banks reduced their balance
sheets predominantly by removing high-risk loans. As a consequence of stronger
regulation in the banking sector, such as the introduction of counter-cyclical capital
buffers, lending institutions are forced to prioritise very liquid assets, such as AAA-
rated bonds or even demand deposits, ahead of other assets (Demary, 2015). At the
same time, commercial banks in the euro area limited the volume of loans made to
new customers. The muted demand for goods that happened as a result went,
unsurprisingly, hand in hand with low inflation.
14
Figure 6: National total liabilities and national inflation after the country-
specific structural breaks
Source: own calculations, ECB
-1
0
1
2
3
4
1000
1050
1100
1150
1200
1250
2010m
1
2012m
1
2014m
1
2016m
1
Belgium
-1
0
1
2
3
7500
8000
8500
9000
2008m
1
2010m
1
2012m
1
2014m
1
2016m
1
Germany
-2
0
2
4
2800
3000
3200
3400
3600
3800
2009m
1
2010m
1
2011m
1
2012m
1
2013m
1
2014m
1
2015m
1
2016m
1
Spain
-.5
0
.5
1
1.5
7800
8000
8200
8400
8600
8800
2013m
7
2014m
7
2015m
7
2016m
7
France
-4
-2
0
2
4
1000
1200
1400
1600
1800
2008m
1
2010m
1
2012m
1
2014m
1
2016m
1
Ireland
-.5
0
.5
1
1.5
3900
4000
4100
4200
4300
2013m
7
2014m
7
2015m
7
2016m
7
Italy
-1
0
1
2
3
1500
2000
2500
3000
2002m
1
2004m
1
2006m
1
2008m
1
2010m
1
2012m
1
2014m
1
2016m
1
Netherlands
-2
0
2
4
450
500
550
600
2008m
1
2010m
1
2012m
1
2014m
1
2016m
1
Portugal
-1
0
1
2
3
30000
31000
32000
33000
34000
35000
2009m
1
2010m
1
2011m
1
2012m
1
2013m
1
2014m
1
2015m
1
2016m
1
Eurozone
Total liabilities in bill. EUR (left scale) Inflation in percent (right scale)
15
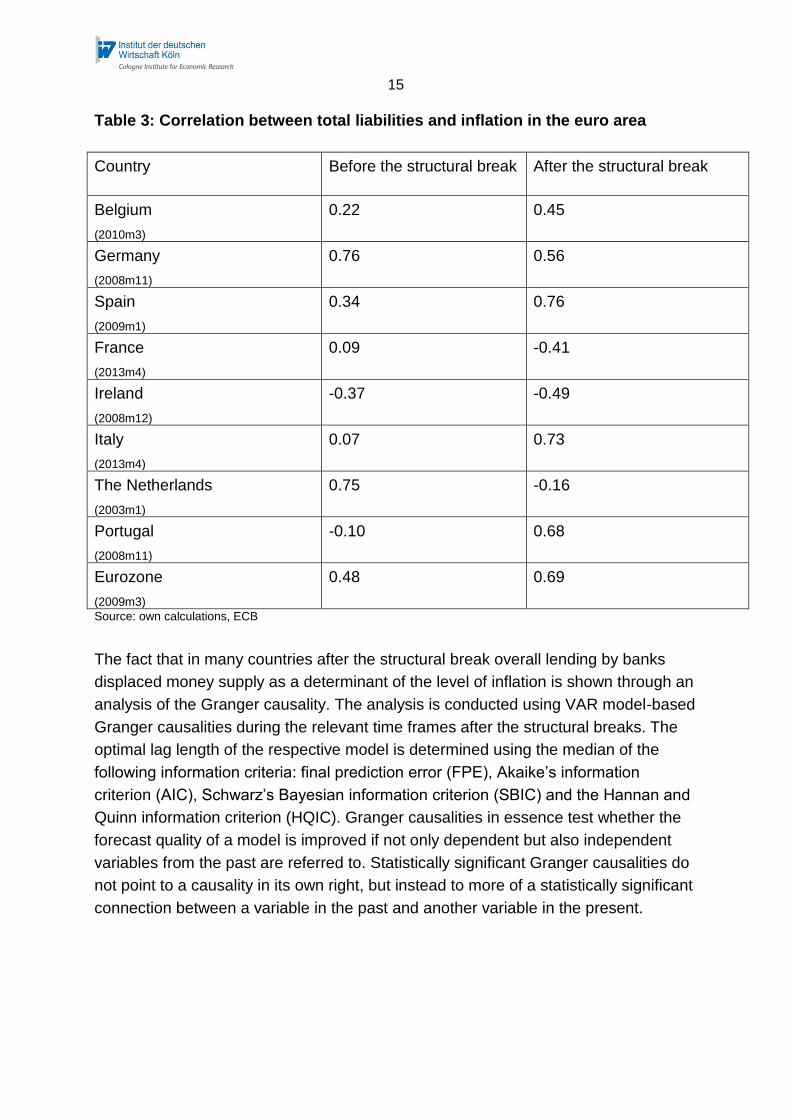
Table 3: Correlation between total liabilities and inflation in the euro area
Country Before the structural break After the structural break
Belgium
(2010m3)
0.22 0.45
Germany
(2008m11)
0.76 0.56
Spain
(2009m1)
0.34 0.76
France
(2013m4)
0.09 -0.41
Ireland
(2008m12)
-0.37 -0.49
Italy
(2013m4)
0.07 0.73
The Netherlands
(2003m1)
0.75 -0.16
Portugal
(2008m11)
-0.10 0.68
Eurozone
(2009m3)
0.48 0.69
Source: own calculations, ECB
The fact that in many countries after the structural break overall lending by banks
displaced money supply as a determinant of the level of inflation is shown through an
analysis of the Granger causality. The analysis is conducted using VAR model-based
Granger causalities during the relevant time frames after the structural breaks. The
optimal lag length of the respective model is determined using the median of the
following information criteria: final prediction error (FPE), Akaike’s information
criterion (AIC), Schwarz’s Bayesian information criterion (SBIC) and the Hannan and
Quinn information criterion (HQIC). Granger causalities in essence test whether the
forecast quality of a model is improved if not only dependent but also independent
variables from the past are referred to. Statistically significant Granger causalities do
not point to a causality in its own right, but instead to more of a statistically significant
connection between a variable in the past and another variable in the present.
16
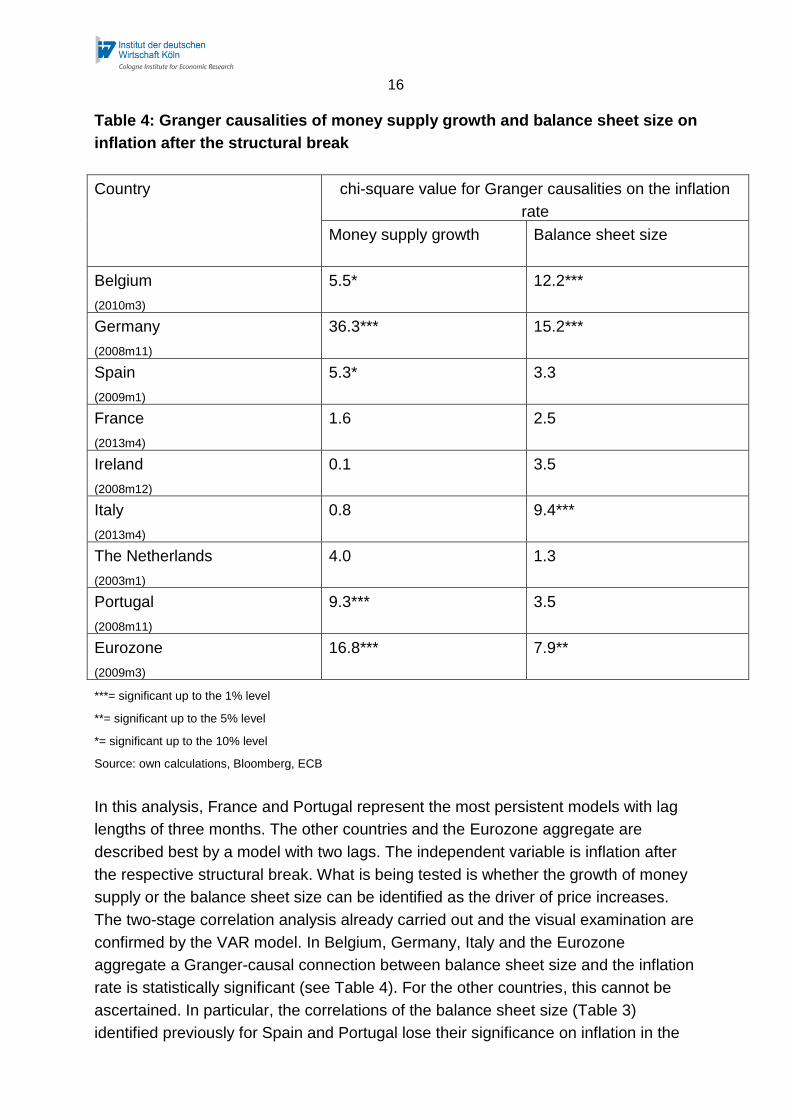
Table 4: Granger causalities of money supply growth and balance sheet size on
inflation after the structural break
Country chi-square value for Granger causalities on the inflation
rate
Money supply growth
Balance sheet size
Belgium
(2010m3)
5.5* 12.2***
Germany
(2008m11)
36.3*** 15.2***
Spain
(2009m1)
5.3* 3.3
France
(2013m4)
1.6 2.5
Ireland
(2008m12)
0.1 3.5
Italy
(2013m4)
0.8 9.4***
The Netherlands
(2003m1)
4.0 1.3
Portugal
(2008m11)
9.3*** 3.5
Eurozone
(2009m3)
16.8*** 7.9**
***= significant up to the 1% level
**= significant up to the 5% level
*= significant up to the 10% level
Source: own calculations, Bloomberg, ECB
In this analysis, France and Portugal represent the most persistent models with lag
lengths of three months. The other countries and the Eurozone aggregate are
described best by a model with two lags. The independent variable is inflation after
the respective structural break. What is being tested is whether the growth of money
supply or the balance sheet size can be identified as the driver of price increases.
The two-stage correlation analysis already carried out and the visual examination are
confirmed by the VAR model. In Belgium, Germany, Italy and the Eurozone
aggregate a Granger-causal connection between balance sheet size and the inflation
rate is statistically significant (see Table 4). For the other countries, this cannot be
ascertained. In particular, the correlations of the balance sheet size (Table 3)
identified previously for Spain and Portugal lose their significance on inflation in the
17
VAR model. As in the majority of analyses to date there is no Granger causality
whatsoever for Ireland, France and the Netherlands, either for the money supply or
for balance sheet size. In considering the Granger causality between the growth of
money supply and inflation, it can be seen that in Germany in particular this is still of
significance after the structural break.
Overall, the various euro area countries show a very heterogeneous picture. The
disconnect between the growth of money supply and inflation is just as varied as the
relatively new connection between the balance sheet sizes of commercial banks and
the increase in prices.
3. Conclusion
Of the three monetary policy instruments that are available to the European Central
Bank – interest rate setting, money supply control and forward guidance – money
supply control is the only remaining method left. The huge expansion of the
Eurosystem’s balance sheet has led to another significant increase in the money in
circulation and in many countries it is above the reference growth value of 4.5
percent. The increased growth in money supply, however, does not result in an
increased price level. Instead, at the current time in the various euro area countries a
structural break can be identified after which the growth in money supply
disconnected itself from developments in inflation.
The lack of correlation between money supply growth and price increases can be
traced in part back to the ECB’s bond purchasing programme and the shift that
accompanied it from long-term to short-term assets in the banks’ balance sheets.
The difficulty the ECB has had in implementing an appropriate monetary policy for
such a heterogeneous group of countries is clear. For Belgium, Germany, Italy and
the aggregate for the European economic and currency union, for example, it is
currently possible to see a strong connection between the liabilities of the commercial
banks and inflation. For some other countries during the current regime of extremely
low interest rates, the lending made by commercial banks has also had some
significance for inflation.
In order to bring inflation back towards the inflation target, ultimately an increase in
private demand is vital. From a monetary policy perspective this can be delivered, in
particular, through increased lending to the private sector. On the demand-side a
reduction in general and political instability would help. On the supply-side of banks,
regulatory provisions, such as the intensification of the capital ratio, should be
critically scrutinised. In the long term the connection between money supply growth
18
and inflation holds true. In the short and medium term the regulatory measures
mentioned promise a positive effect on inflation rates, if lending is expanded.
In order for monetary policy to become more effective in all euro area countries
again, the banks must be able to properly fulfil their roles. At present two problems
are standing in the way of a universally effective monetary policy: real economy
divergence and the different ways in which financial intermediation works in the
various countries.
Real economy convergence was one of the political promises of European
integration, which – in relation to per capita income – has no longer been met
since the crisis of 2008. Alongside structural reforms, for example labour
market regulation, relief can come in the form of regional support for growth-
stimulating sectors, such as transport infrastructure. Of course, this must
always be done taking into consideration the individual properties and
conditions of the respective regions.
When looking at financial intermediation, despite a common currency and
monetary policy, it has not been possible to achieve harmonisation between
the countries over the past one and a half decades. The financial and
economic crisis has left in its wake a high proportion of bad loans, not only,
but in particular, on the balance sheets of southern European banks. These
must eventually be cleaned up in a consistent manner – without, however,
setting off a systemic crisis. At the same time there are still institutional
differences. While in some countries the credit channel is more pronounced,
companies in other countries rely more on direct financing through the capital
market.
Neither real economy convergence nor the differences in financial intermediation are
problems, however, that can be or should be addressed by monetary policy. The
governments of the respective member states must take action. This refers on the
one hand to the necessary measures for strengthening competitiveness and thus the
employment intensity of growth, and on the other hand to a thorough regulatory and
supervisory clean-up of banks’ balance sheets. In both policy areas much time has
elapsed that even monetary policy cannot get back. For anyone seriously wishing to
free the ECB from its dilemma, they must now call upon the governments to
undertake rigorous action.
19
References
Afrouzi, H, Coibion, O., Gorodnichenko, Y, Kumar, S., „Inflation Targeting Does Not Anchor Inflation Expectations: Evidence from Firms in New Zealand”, Brookings Papers on Economic Activity, 2015.
Bundesbank, „Zu den gesamtwirtschaftlichen Auswirkungen der quantitativen Lockerung im Euro-Raum“, Monthly Report June 2016, 68(6), 2016.
Bundesbank and BaFin, „Die Auswirkungen niedriger Zinsen - Ergebnisse einer Umfrage unter deutschen Banken“ Statement from Bundesbank and BaFin, 2015.
Claeys, G. and Leandro, A., „The European Central Bank’s Quantitative Easing Programme: Limits and Risks”, Bruegel Policy Contribution, Issue 2016/04, February, 2016.
Demary, M. and Hüther, M., „Gefährden die unkonventionellen Maßnahmen der EZB den Ausstieg aus dem Niedrigzinsumfeld?“, IW policy paper 7/2015, 2015a.
Demary, M. and Hüther, M., „IW Monetary Outlook December 2015: Weak Credit Growth Hinders Eurozone Inflation to Increase”, IW policy paper 37/2015, 2015b.
Demary, M, „IW-Bankenmonitor 2015“, IW-Trends 3, 2015.
Deutsche Bundesbank, „Die Geldpolitik der Bundesbank”, irregular publication, October 1995.
European Union, Treaty on the Functioning of the European Union, 2009.
ECB, „Decision (EU) 2015/774 of the European Central Bank”, Official Journal of the European Union L 121/20, 14/5/2015a.
ECB, Economic report, Mai 2015b.
ECB, The monetary policy of the ECB, 3rd. Edition, ECB Publications, 2011.
ECB, „The ECB’s monetary policy strategy”, press release, 8th Mai 2003.
20
ECB, „Überprüfung des quantitativen Referenzwerts für das Geldmengenwachstum”, press release, 5. December 2002.
ECB, „The quantitative reference value for monetary growth”, press release, 1. December 1998.
McCallum, B. T., „Theoretical Analysis Regarding a Zero Lower Bound on Nominal Interest Rates”, Journal of Money, Credit and Banking, Vol. 32, No. 4, S. 870-904, 2000.
McCandless, G. T. and Weber, W. E., „Some Monetary Facts“, Federal Reserve Bank of Minneapolis Quarterly Review, Vol. 19, No. 3, 1995.
Sachverständigenrat, „Vollbeschäftigung für Morgen”, Jahresgutachten 1974/75.
Wallace, N, „A Modigliani-Miller theorem for open-market operations”, The American Economic Review 71 (3), S. 267–274, 1981.
Wu, J. C. and Xia, F. D., „Measuring the Macroeconomic Impact of Monetary Policy at the Zero Lower Bound“, Chicago Booth, Working Paper No. 13-77, 2015.