Embed Size (px)
Citation preview

Money in Politics with a Gender Lens
A project of the National Council for Research on Women,
in collaboration with the Center for American Women and Politics at Rutgers University’s Eagleton Institute of Politics
and the Center for Responsive Politics
Funded by the Piper Fund, a Proteus Fund Initiative

Money in Politics with a Gender Lensi A collaboration between
the National Council for Research on Women, the Center for American Women and Politics at Rutgers University’s Eagleton Institute of Politics,
and the Center for Responsive Politics
Executive Summary
The role of money in political campaigns has grown significantly in the last 20 years and has drastically altered the landscape for campaigns, elections, and political participation. The cost of winning a congressional election has nearly doubled in 2012 dollars,ii with the average cost of winning a U.S. House seat at $1.6 million, while a successful U.S. Senate bid averages $10.35 million. The Citizens United v. Federal Election Commission (FEC) decision, which allowed for unlimited spending by outside groups on election campaigns, has led to the proliferation of groups such as “Super PACs” and a significant rise in overall campaign spending. Each election cycle offers opportunities to analyze and better understand the potential short- and long-term effects of this decision. This report focuses on one dimension of the new monetary environment: gender.
“Money in Politics with a Gender Lens” is the first attempt to explore the effects of the Citizens United decision by looking specifically at how women fared as candidates and acted as donors in elections held after the U.S. Supreme Court decision in 2010. The report compares data from the 2008, 2010, and 2012 federal election campaigns; not only does this approach offer a “before and after” snapshot of the monetary environment of campaigns for men and women, but it also establishes a strong baseline of analysis for future explorations.
Highlights from the report include:
Who Gives Money? Campaign Donors and Gender • Women remain significantly underrepresented among campaign “mega-donors,” including top overall
donors and top donors to Super PACs. • Male donors outnumber and outspend female donors in reported political giving ($200 and over).
Though the gender gap in political giving is significant at every level of giving, men make up an even greater proportion of donors at the highest levels (above $95,000).
• More men than women donate to outside groups. This gender gap closed slightly from 2010 to 2012, as overall outside group donations increased dramatically.iii
• In both 2010 and 2012, men focused a greater proportion of their political giving on outside groups (versus individual candidates, party committees, and other political entities) than did women.
i This report was generously funded by the Piper Fund / Proteus Fund Initiative. It was researched and written by Kelly Dittmar, assistant research professor at the Center for American Women and Politics at Rutgers University’s Eagleton Institute of Politics. Sarah Bryner, research director at the Center for Responsive Politics, contributed research, data, and analysis. Gail Cooper, vice president for programs at the National Council for Research on Women, was project editor. ii In nominal dollars, the cost of winning has nearly tripled. iii For the purposes of this report, “outside groups” are defined as organizations that can receive unlimited funds for the purposes of making independent expenditures or electioneering communications. These include Super PACs, 501(c)4 organizations voluntarily disclosing their donors, or 527s reporting donors to the Federal Election Commission (FEC). Party committees and traditional PACs that make independent expenditures are excluded from this measure as they are not able to receive unlimited funds.

Who Gets Money? Campaign Receipts, Expenditures, and Gender • Candidate gender was not a significant predictor of outside spending for or against congressional
candidates in 2010 or 2012 independent of other factors, but there is limited evidence showing that gender does interact with variables like candidate status (incumbent, challenger, open seat) and party to influence the amount of Super PAC money spent in support of a particular candidate.iv
• It does not appear from these initial analyses that greater Super PAC spending will disparately reach men or women candidates, but further research is necessary after additional electoral cycles and with deeper analysis of the spending data and effects (beyond total and proportional spending).
• Women candidates appear more likely than men to support and participate in statewide public financing systems at the state legislative level, suggesting that public financing may be a particular incentive for women running for office. However, analyses of candidate and representation data do not show strong effects of public financing on women’s candidate emergence or representation.
Who Cares? The Impact of Campaign Money on Citizens in Our Democracy • Men and women are equally opposed to increased campaign spending, particularly by outside
organizations, based on recent public opinion polls.
Further research is needed to fully understand the gender dynamics of campaign fundraising and spending in a post–Citizens United context. Future research questions could include, but are not limited to: • How do women at the “mega-donor” level differ from men in their spending priorities? More
specifically, do the women who donate the most show any preference for women candidates and/or “women’s issues,” often defined as issues with the greatest or most direct impact on women and children?
• What is the presence and role of women donors at the lowest levels (under $200)? Additional gender data among the smallest donors would help to affirm or clarify if gender differences (in presence and giving totals) among donors are reduced at the lower levels of giving, as Federal Election Commission (FEC) data and American National Election Studies (ANES) reports indicate.
• Do men and women benefit from different types of Super PACs? And how does outside / Super PAC spending influence men and women candidates’ chances of electoral success? Understanding the effects of outside spending necessitates recognizing the diversity among the growing number of Super PACs, including their motivations, tactics, and strategies in spending decisions. In addition to looking at spending targets and totals, more research is needed to determine actual electoral effects of outside group / Super PAC involvement in federal campaigns.
• Are women and/or women’s organizations adapting to this new campaign environment or advocating for campaign finance reform? As the power and influence of Super PACs grows, are women and/or women’s organizations creating and funding Super PACs of their own to remain competitive? Or are proposals for reforms such as public financing receiving greater support in this new monetary environment?
• What is the potential policy impact of Citizens United, and how might it affect women? While this report focuses on the influence of Citizens United on political campaigns, more research is needed to determine whether, where, and how this decision might influence the post-election activities of candidates-turned-officeholders. More specifically with regard to gender, does Citizens United affect the ways in which so-called “women’s issues” are addressed, and degree to which they are prioritized, in Congress? And does the increased influence of outside spending shape policy debates and decisions on issues that uniquely affect women?
iv For the purposes of this report, “outside spending” refers to spending by outside groups, as defined in footnote ii.

Money in Politics with a Gender Lens
A collaboration between
the National Council for Research on Women,
the Center for American Women and Politics at Rutgers University’s Eagleton Institute of Politics,
and
the Center for Responsive Politics
January 2014
Photo credit: DonkeyHotey

ABOUT THIS REPORT This report was made possible by funding from the Piper Fund, a Proteus Fund Initiative. It is a collaboration between:
The National Council for Research on Women works to end gender inequity and discrimination against girls and women by exposing root causes and advancing research-informed action. Our network, which connects research, policy, and practice, is comprised of national, state, and local-level cross-sector individuals and institutions. Institutions include academia, business, government, labor, philanthropy, and nonprofit organizations—such as social justice, cultural, health-related, and women's organizations. Individual members include advocates, change agents, policy thinkers, practitioners, public intellectuals, researchers, and other allies. We work with multiple sectors and disciplines to shape a world that demands fairness across difference.
The Center for American Women and Politics at Rutgers University’s Eagleton Institute of Politics, a unit of the Eagleton Institute of Politics at Rutgers, the State University of New Jersey, is a university-based research, education, and public service center. Its mission is to promote greater knowledge and understanding about women’s changing relationship to politics and government and to enhance women’s influence and leadership in public life. CAWP is a leading authority in its field and a respected bridge between the academic and political worlds.
The Center for Responsive Politics is the nation's premier research group tracking money in U.S. politics and its effect on elections and public policy. Nonpartisan, independent, and nonprofit, the organization aims to create a more educated voter, an involved citizenry, and a more transparent and responsive government. In short, the center's mission is to: inform citizens about how money in politics affects their lives; empower voters and activists by providing unbiased information; and advocate for a transparent and responsive government. We pursue our mission largely through our award-winning website, OpenSecrets.org, which is the most comprehensive resource for federal campaign contributions, lobbying data, and analysis available anywhere. And for other organizations and news media, the center's exclusive data powers their online features tracking money in politics—counting cash to make change.
The report was researched and written by Kelly Dittmar, assistant research professor at
the Center for American Women and Politics, Eagleton Institute of Politics, Rutgers University. Sarah Bryner, research director at the Center for Responsive Politics, contributed research, data, and analysis to the overall project. Gail Cooper, vice president for programs at the National Council for Research on Women, was the project editor.
We would like to thank the Piper Fund, a Proteus Fund Initiative, for their funding
support, including Marc Caplan, Piper Fund senior program officer, and Melissa Spatz, Piper Fund program officer. Sincere appreciation goes also to Hildy Karp and Nancy Meyer, for their feedback during the ongoing development of the report. In addition, several groups and individuals contributed research and expertise, participated in meetings, and reviewed drafts. They include: Susan Anderson, senior program advisor, Public Campaign; Denise Roth Barber, managing director, Follow the Money; Pamela Behrsin, vice president of communication, MapLight; J. Mijin Cha, senior policy analyst, Dēmos; Tam Doan, research director, Public Campaign; Karen Hobert Flynn, senior vice president for strategy and programs, Common Cause; Jennifer Merolla, associate professor, Claremont Graduate University; Rosalba M. Messina, interim executive director, Third Wave Foundation; Nicholas Nyhart, president and CEO, Public Campaign; Susan Scanlan, president, Women’s Research & Education Institute; Jean Schroedel, professor, Claremont Graduate University; Eleanor Smeal, president, Feminist Majority Foundation; Rye Young, interim program officer, Third Wave Foundation; and Shauné Zunzanyika, program director, Women’s Funding Network. © January 2014

Money in Politics with a Gender Lens
The cost of winning a congressional election has doubled in 2012 dollars over the last two decades (Ornstein et al. 2013).1 In 2012, the average cost of winning a U.S. House seat was $1.6 million, and the price tag for a successful U.S. Senate bid averaged $10.35 million. As the cost of campaigns has risen, so, too, has outside campaign spending. From 1992 to 2012, nonparty independent expenditures have increased nearly 50-fold in U.S. House races and nearly 100-fold in U.S. Senate contests (Ornstein et al. 2013).2 But independent expenditures are only one component of outside spending, which also includes electioneering communication and issue advocacy. Bowie and Lioz (2013) define “outside spending” as “spending intended to influence a federal election that is not conducted by or coordinated with a candidate for federal office or a political party” (4).
In Citizens United v. FEC (2010), the Supreme Court opened the door to a sharp spike in outside spending in the 2012 election cycle by permitting new forms of spending, including spending from 501(c)(4) and 501(c)(6) organizations and Super PACs.3 The proliferation of Super PACs and Super PAC spending since the 2010 ruling has been staggering. According to the Center for Responsive Politics, the number of active Super PACs rose from 83 in the 2010 cycle to 1,310 in 2012 races; Super PAC spending rose from $62.6 million in 2010 to $609.4 million in 2012, accounting for more than 60 percent of outside spending reported in 2012 (Bowie and Lioz 2013). As of July 2013, 786 Super PACs have already registered for the 2014 election. The role of money in politics in this new reality is not only undeniably strong but growing.
Debates about the role and implications of money in politics are not new to American political discourse. The Citizens United decision has only intensified this conversation as political observers and ordinary citizens consider whose interests are best served by this new state of affairs. However, few studies have considered the role of gender in these debates, investigating how women fare in and/or confront this financial reality of American campaigns and elections, and how this has changed the landscape of political influence. This report begins to fill that gap, applying a gender lens to research, data, and arguments about money in politics. More specifically, we pose the following questions:
• What role do women play, as donors, in financing campaigns? • How do female candidates fare in campaign fundraising? And, in particular, how do female candidates
fare when it comes to outside spending in the post–Citizens United electoral context? • What does this new reality mean for democratic citizenship for men and women?
This report applies preliminary research to begin answering these questions, finding greater gender disparities in who gives to political campaigns and Super PACs than in who benefits electorally from increased Super PAC spending. These findings generate additional questions worthy of further study, some of which are outlined in the report’s concluding section.
Who Gives Money? Campaign Donors and Gender
Data on political donors from 2008 to 2012 show that women donors remain underrepresented at all levels, but especially at the highest levels of campaign giving. Women’s underrepresentation persists when the data is narrowed to donations made to outside groups like Super PACs, but the trend from 2010 to 2012—albeit limited to two cycles—shows that female donors may be recognizing the new rules of the game. Female donors increased their giving to outside groups from 2010 to 2012—both in amount and proportion—at the

Money in Politics with a Gender Lens 6
same time that these groups increased their presence and spending in campaigns. Still, if political giving equals political voice, men’s voices remain louder in today’s campaigns due to their overall giving.
The Women’s Philanthropy Institute’s “Women Give 2012” report challenges perceptions about gender and philanthropic giving, revealing that baby boomer and older women equal or exceed their male counterparts in philanthropic giving. However, that gender parity does not translate to political giving. Research has repeatedly found that women are less likely than men to give money to political candidates and organizations and, when they do give, women give less (Burns, Schlozman, and Verba 2001; Burrell 2005; Francia et al. 2003; WCF 2007). Though women have increased their presence in the electoral donor pool, they are still outspent and outnumbered by men (Francia et al. 2003; Green et al. 1999). A 2007 study done by the Women’s Campaign Fund revealed two key factors that help explain why women invest in campaigns at lower rates than men: (1) they do not see the connection between money, political leadership, and positive social change, and (2) they do not view political giving as a civic responsibility like voting or volunteering (WCF 2007).
The most recent data on political giving shows that these gender disparities persist. According to the Center for Responsive Politics, in 2012, 0.67 percent of all adult males gave $200 or more to political campaigns, which is double the proportion of all adult women, 0.32 percent, who made itemized donations in 2012. These proportions, while very small, have increased for both men and women over time, but a gender gap has remained.
To analyze the gender gap in political giving in the most recent election cycles in greater depth, we examined individual donor data from the Center for Responsive Politics in 2008, 2010, and 2012 federal races.4 Unless specified otherwise, data includes donations made to candidates and outside groups, not including party committees. Taken collectively, these data reveal that men consistently represent more than 60 percent of donors and donations of $200 or more in 2008–2012.5 Women represent both a significantly lower number of all donors for whom donations are itemized and an even lower percentage of total giving in these years (see table 1). The percentage of women donors was greatest in 2008, when 31.1 percent of donors were women. In 2012, 30.3 percent of donors were women and, in the 2010 midterm election, just over one-quarter of all donors were women.6 Women’s donations did not exceed more than 30 percent of all giving in 2008, 2010, or 2012 (see table 2). In both 2008 and 2010, men gave $2.2 billion dollars to candidates and outside groups and women gave $1.8 billion. In 2012, men’s donations totaled $2.9 billion dollars, about $600 million more than women’s $2.3 billion in giving.7
Table 1. Donor Demographics, 2008–2012
Source: Center for Responsive Politics NOTE: Percentages do not add up to 100 due to donors without available identifier for gender. Data excludes donations made to party committees.

Money in Politics with a Gender Lens 7
Table 2: Mean Political Giving by Gender and Year
Source: Center for Responsive Politics NOTE: Data excludes donations made to party committees.
Outside Group Donations
Women are more likely than men to direct their giving to Democratic and female candidates. Men, on the other hand, are more likely than women to give to outside groups, defined here as groups that can raise unlimited funds for the purposes of making independent expenditures or electioneering communications. 8 Interestingly, however, the gender gap in giving to outside groups narrowed from 2010 to 2012 (see table 3). Men represented nearly 90 percent of total individual giving to outside groups in 2010, and were 64.3 percent of individual donors to outside groups. In 2012, nearly 80 percent of giving to outside groups was by men, and 60.5 percent of individual donors to outside organizations were men.
As table 3 shows, both men and women significantly increased their donations to outside groups from 2010 to 2012, reflecting the impact of the Citizens United decision and the proliferation of Super PACs. In fact, women increased their giving to outside groups twenty-fold from 2010 to 2012, compared to men’s ten-fold jump. Even with such a large increase in giving to outside groups, in both 2010 and 2012, men still dedicated a greater proportion of their total giving to outside groups than did women, demonstrating that men are more likely than women to seek and have influence in this realm of campaign spending. In 2010, 3.5 percent of men’s total giving and 1.2 percent of women’s total giving went to outside groups. In 2012, greater proportions of both men’s (18.5 percent) and women’s (11.1 percent) giving went to outside groups, consistent with the rise in overall donations to and spending by outside groups.
Table 3: Political Giving to Outside Groups by Gender and Year
Source: Center for Responsive Politics NOTE: All data reflects donations only to outside groups who can raise unlimited funds (see footnote 1). Percentages do not add up to 100 due to donors without available identifier for gender.
Donations below $200
While men represent strong majorities of donors overall and donors to outside groups, there may be greater gender parity among donors at levels below $200. This level of giving is not inconsequential, as was evident in President Barack Obama’s 2008 victory. In the 2008 presidential election, Obama received about one-third of his campaign donations from individuals who donated $200 or less throughout the election cycle (Corrado et al. 2010).9 Moreover, the $114 million Obama received from donors giving $200 or less in the general election
Money in Politics with a Gender Lens 8
exceeded the total public funding ($85 million) that his Republican opponent John McCain received for the general election (Malbin 2010).
Because donations below $200 are not disclosed, we rely on self-reports from donors to gauge gender differences at this level of giving. The American National Election Studies (ANES) asks survey respondents to report whether or not they “gave money to help a campaign” in each election cycle. Their data reveal a closing gender gap in responses to this question since 2004. 10 In 2000, 11 percent of men and 7 percent of women reported making political donations. Moreover, Ondercin and Jones-White (2011) pooled ANES data from 1984 to 2000 to reveal that 9 percent of men and 6 percent of women reported giving throughout this time, a significant gender difference. In both 2004 and 2008 surveys, however, 13 percent of both women and men reported giving money to a campaign.
Small Giving: Donations between $200 and $2399
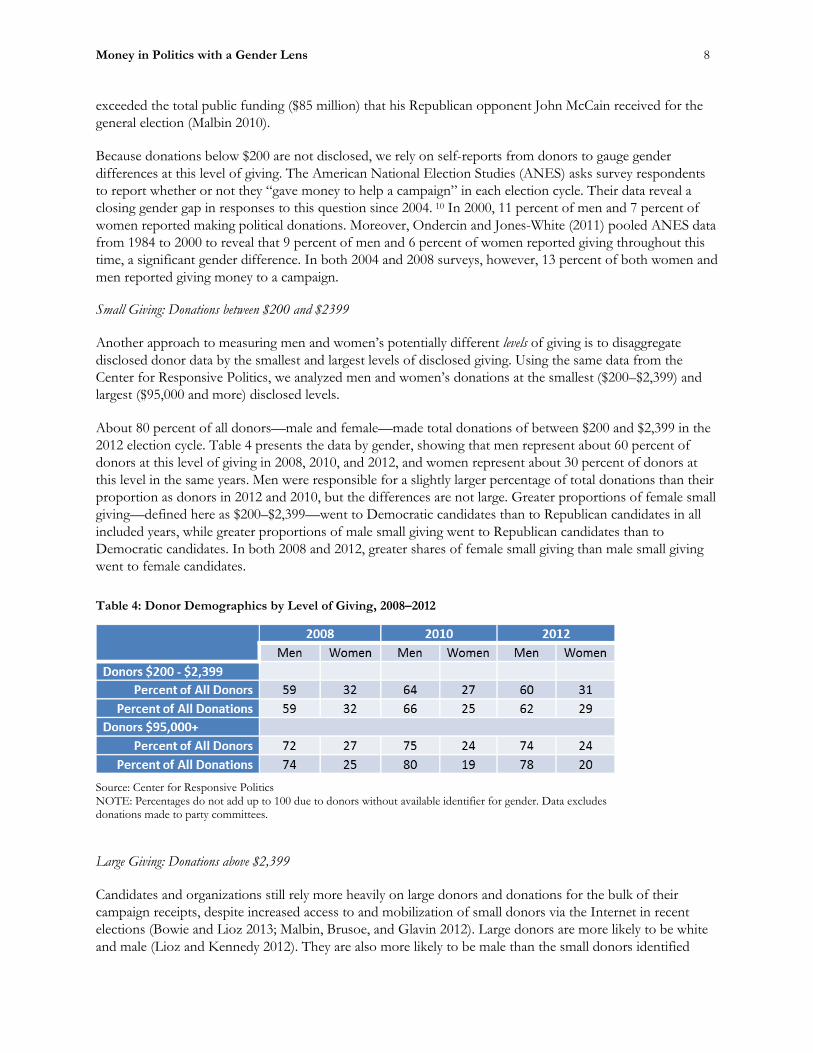
Another approach to measuring men and women’s potentially different levels of giving is to disaggregate disclosed donor data by the smallest and largest levels of disclosed giving. Using the same data from the Center for Responsive Politics, we analyzed men and women’s donations at the smallest ($200–$2,399) and largest ($95,000 and more) disclosed levels.
About 80 percent of all donors—male and female—made total donations of between $200 and $2,399 in the 2012 election cycle. Table 4 presents the data by gender, showing that men represent about 60 percent of donors at this level of giving in 2008, 2010, and 2012, and women represent about 30 percent of donors at this level in the same years. Men were responsible for a slightly larger percentage of total donations than their proportion as donors in 2012 and 2010, but the differences are not large. Greater proportions of female small giving—defined here as $200–$2,399—went to Democratic candidates than to Republican candidates in all included years, while greater proportions of male small giving went to Republican candidates than to Democratic candidates. In both 2008 and 2012, greater shares of female small giving than male small giving went to female candidates.
Table 4: Donor Demographics by Level of Giving, 2008–2012
Source: Center for Responsive Politics NOTE: Percentages do not add up to 100 due to donors without available identifier for gender. Data excludes donations made to party committees.
Large Giving: Donations above $2,399
Candidates and organizations still rely more heavily on large donors and donations for the bulk of their campaign receipts, despite increased access to and mobilization of small donors via the Internet in recent elections (Bowie and Lioz 2013; Malbin, Brusoe, and Glavin 2012). Large donors are more likely to be white and male (Lioz and Kennedy 2012). They are also more likely to be male than the small donors identified

Money in Politics with a Gender Lens 9
above. Using Center for Responsive Politics donor data, we find that men represented more than 70 percent of all donors giving $95,000 or more to candidates and outside organizations in 2008, 2010, and 2012 elections. In those same cycles, women represented about 25 percent of large donors, a smaller proportion than they were among small donors giving between $200 and $2,399. As table 4 shows, men were responsible for an even larger percentage of total giving at this level. In both 2010 and 2012, men made about 80 percent of all donations by large donors, indicating that they are giving some of the highest amounts in this cohort. Consistent with trends among small donors, greater proportions of female large giving went to Democratic candidates and greater proportions of male large giving went to Republican candidates, and greater shares of female large giving than male large giving went to women candidates in 2008 and 2012 contests.
Gender disparities are even more striking at the very highest levels of giving, both overall and to Super PACs. Recent attention to “mega-donors” has included some commentary on the dearth of women among them. Writing in July 2013 in Politico, Tarini Parti and Byron Tau describe a “mega-donor glass ceiling” and investigate both the causes and effects of women’s underrepresentation at the upper echelons of campaign giving. They write, “In a universe in which mega-donors rule and increasingly are able to impact a primary or general election all by themselves, women aren’t always at the table in the same way as men,” adding, “And that has an impact on what gets discussed on the campaign trail or rises to the top of the agenda in Congress.” While men outnumber women on the lists of top donors published by groups like the Center for Responsive Politics, wealthy couples are often listed together—with their donations combined—instead of separately. This method of reporting is a challenge for analyses and will likely change as dated expectations that women participate in politics on behalf of their male spouses are replaced by expectations that women participate independently of the men they marry.
For example, mega-donor Steve Mostyn recently challenged perceptions that his wife, Amber Mostyn, was “doing his bidding” in her political giving.11 Looking more closely at each spouse’s donations, Amber—who often donates under the name Amber Anderson—gave to 21 candidates and PACs in 2012, while Steve gave only to five. According to the Center for Responsive Politics, Amber donated to eight female candidates and five male candidates, while Steve donated to two male candidates and no women candidates. On the contrary, Sheldon and Miriam Adelson—the largest donors in 2012—donated to the same PACs and candidates in the 2012 election. Some argue that there should be little distinction between the couple’s individual giving.
Our analysis disentangles these spousal cohorts by looking at the top individual donors overall (to candidates and outside groups) and to outside groups, regardless of their marital connections. Using Center for Responsive Politics donor data, we find that 11 of the 100 top individual donors to candidates and outside groups in 2012 were women and 88 were men.12 Of those 100 donors, 96 gave over $1 million in the 2012 cycle, including all 11 women. Women were better represented among top individual donors in 2010 and 2008 cycles; 17 women ranked in the top 100 in 2010 and one-fifth of top individual donors in 2008 were women. Narrowing the list further, women were two of the top twenty individual donors in both 2012 and 2010, and four of the top twenty individual donors in 2008.
In investigating the particular and potential impact of the Citizens United ruling on men and women’s giving, we looked more specifically at top donors to outside groups receiving unlimited funds in 2010 and 2012, the only cycles in which Super PACs were permitted. Of the top 100 individual donors to these outside groups, 12 were women in 2012 and 15 were women in 2010, very similar to women’s representation among the top individual donors overall (see above). Together, these data show that women’s underrepresentation among donors worsens at the highest levels, but is about equally poor among mega-donors overall and among donors to outside groups.

Money in Politics with a Gender Lens 10
Who Gets Money? Campaign Receipts, Expenditures, and Gender
Individuals giving political money seek influence on political outcomes and priorities. Candidates and officeholders receiving political money are generally those individuals able to directly shape the political agenda and make policy decisions. Thus, in investigating the role of money in politics, we must analyze gender differences in which candidates receive more or less campaign money and how outside money is apportioned among candidates.
Gender and Fundraising
There has long been a perception among candidates, practitioners, and some scholars that campaign fundraising poses a more significant challenge for women candidates than for men, in part because women often lack the personal and professional networks that benefit men’s political advancement (Lawless and Fox 2005; La Raja 2007; Sanbonmatsu 2006). As Uhlaner and Schlozman (1986) wrote nearly three decades ago, “It is widely believed that ‘the mother’s milk of politics’ flows less well for daughters than sons” (31). This perception persists among women candidates, who believe that fundraising is harder for them than for their male counterparts (Sanbonmatsu, Carroll, and Walsh 2008).
There is research, however, finding that women can and do raise amounts of money comparable to men in comparable races. Studies from the 1980s to today have found that campaign receipts for women and men running for the U.S. House are not significantly different when controls for electoral context and candidate status are included (Burrell 1994, 2005, 2008; Fox 2010; Uhlaner and Schlozman 1986; Wilhite and Theilmann 1986).13 In fact, some research has found that women candidates have outraised their male counterparts in recent U.S. House elections, at least when comparing candidates of the same type (incumbent, challenger, open seat) or looking at particular types of campaign receipts, such as individual donations (Crespin and Deitz 2010; She Should Run 2012).14
However, equitable campaign receipts may mask the unique difficulties women face to achieve that equity. Additional research has shown that women raise money in smaller amounts, which means they must cultivate higher numbers of smaller individual contributions to reach aggregate totals comparable to men (Crespin and Deitz 2010; Dabelko and Herrnson 1997). In analyzing U.S. House races from 1998 to 2002, Crespin and Deitz (2010) find women’s comparative advantage relative to men in overall individual donations hinged on the advantage they have at lower contribution levels; that “advantage” is perhaps diminished by the fact that female candidates must dedicate greater time and energy to remain financially competitive. And while women’s donor networks and PACs have also helped to close fundraising gaps between men and women candidates, they primarily benefit Democratic women (Crespin and Deitz 2010; Francia 2001; Hannagan, Pimlott, and Littvay 2010).
Gender parity in campaign receipts and expenditures also does not always translate into equal chances of electoral success (Burrell 1985; Herrick 1996; Green 1998, 2003). In some cases, women candidates see differential returns on their campaign investments, indicating women may actually require greater amounts of campaign funds in order to achieve levels of success comparable to their male counterparts. For example, Green (1998) argues that women candidates must spend more money to counteract gender stereotypes, particularly those that cast doubt on their electability and capability to serve. Regardless of why women may receive a smaller “bang for their buck” in campaigns, these findings caution scholars and practitioners alike against assuming that fundraising or electoral barriers for women candidates disappear when they raise and spend the same as men.
Finally, only limited research has been done on levels and influence of outside spending on male and female candidates. Carne (2010) analyzes independent expenditures in congressional contests from 2002 to 2006 and

Money in Politics with a Gender Lens 11
finds that women are the subjects of a greater share of independent spending than men, both for and against their candidacies. However, in a new electoral context where outside spending has increased exponentially, there has been no research analyzing whether or not it has had gendered targets or effects.
Gender and Outside Spending after Citizens United v. FEC
As mentioned above, the Supreme Court’s 2010 ruling in Citizens United v. FEC has opened the door to new types and levels of outside spending in federal campaigns. The proliferation of outside organizations that can raise unlimited funds—including Super PACs—may have differential impacts on men and women candidates, depending on how that money is spent. Data from the Center for Responsive Politics allows us to do preliminary analyses on outside spending on men and women’s campaigns post–Citizens United to see if, at the least, any gender differences emerge in how much money is spent for or against congressional candidates in 2010 and 2012 races.15 In addition to general comparisons, we also performed statistical analyses to account for effects of election year (2010 or 2012), candidate status (open, challenger, incumbent), party, and chamber (U.S. House or Senate).
Simple comparisons of outside spending for and against candidates by party reveal disparities favoring Republicans in both election years since new spending rules went into effect. In 2010, there was little difference in the amount of outside money spent in favor of Democratic ($16.5 million) and Republican ($15.1 million). In contrast, $75.5 million was spent against Democratic candidates, while only $30.9 million was spent opposing Republican candidates (see figure 1). Spending jumped exponentially in 2012—consistent with trends reported above—and partisan differences were slightly more pronounced. Nearly $54 million was spent to support Republican candidates, compared to $34.9 million in support of Democratic candidates, and while $170.1 million was spent opposing Democratic candidates, $129.4 million was spent against Republican candidates (see figure 2).
Source: Center for Responsive Politics NOTE: All data reflects spending by outside organizations that can raise unlimited funds (see footnotes 1 and 2).
Money in Politics with a Gender Lens 12
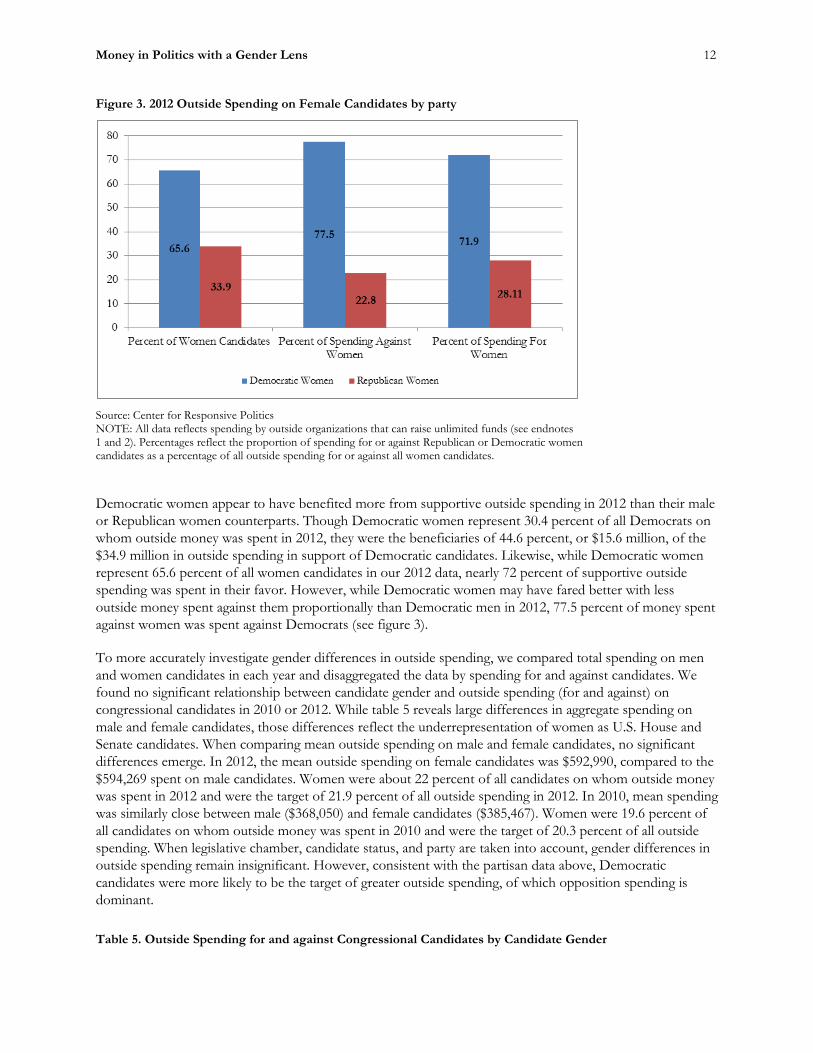
Figure 3. 2012 Outside Spending on Female Candidates by party
Source: Center for Responsive Politics NOTE: All data reflects spending by outside organizations that can raise unlimited funds (see endnotes 1 and 2). Percentages reflect the proportion of spending for or against Republican or Democratic women candidates as a percentage of all outside spending for or against all women candidates.
Democratic women appear to have benefited more from supportive outside spending in 2012 than their male or Republican women counterparts. Though Democratic women represent 30.4 percent of all Democrats on whom outside money was spent in 2012, they were the beneficiaries of 44.6 percent, or $15.6 million, of the $34.9 million in outside spending in support of Democratic candidates. Likewise, while Democratic women represent 65.6 percent of all women candidates in our 2012 data, nearly 72 percent of supportive outside spending was spent in their favor. However, while Democratic women may have fared better with less outside money spent against them proportionally than Democratic men in 2012, 77.5 percent of money spent against women was spent against Democrats (see figure 3).
To more accurately investigate gender differences in outside spending, we compared total spending on men and women candidates in each year and disaggregated the data by spending for and against candidates. We found no significant relationship between candidate gender and outside spending (for and against) on congressional candidates in 2010 or 2012. While table 5 reveals large differences in aggregate spending on male and female candidates, those differences reflect the underrepresentation of women as U.S. House and Senate candidates. When comparing mean outside spending on male and female candidates, no significant differences emerge. In 2012, the mean outside spending on female candidates was $592,990, compared to the $594,269 spent on male candidates. Women were about 22 percent of all candidates on whom outside money was spent in 2012 and were the target of 21.9 percent of all outside spending in 2012. In 2010, mean spending was similarly close between male ($368,050) and female candidates ($385,467). Women were 19.6 percent of all candidates on whom outside money was spent in 2010 and were the target of 20.3 percent of all outside spending. When legislative chamber, candidate status, and party are taken into account, gender differences in outside spending remain insignificant. However, consistent with the partisan data above, Democratic candidates were more likely to be the target of greater outside spending, of which opposition spending is dominant.
Table 5. Outside Spending for and against Congressional Candidates by Candidate Gender

Money in Politics with a Gender Lens 13
2010 2012
Male Candidates
Female Candidates
Male Candidates
Female Candidates
Total Outside Spending $133,234,076 $33,921,135 $310,208,210 $87,169,523
Mean Outside Spending $368,050 $385,467 $594,269 $592,990
Percent of Candidates on whom Outside Money was Spent 80.4 19.6 78 22
Percent of Outside Spending Targeting Group 79.7 20.3 78.1 21.9
Source: Center for Responsive Politics NOTE: All data reflects combined spending for or against candidates by outside organizations that can raise unlimited funds (see footnotes 1 and 2).
Outside Spending against Candidates
Table 6 provides gender breakdowns for outside spending against male and female candidates. While female candidates were the target of slightly more opposition spending than men, proportionate to their candidacies, there are no significant gender differences in the amounts of outside spending against candidates in the 2010 or 2012 elections. Women were 19.7 percent of all candidates against whom outside money was spent in 2012 and were the target of 20.8 percent of outside opposition spending. An average of $978,319 was spent against female candidates and $916,035 was spent against male candidates. In 2010, mean opposition spending differed little between male ($395,529) and female candidates ($401,717). Women were 17.6 percent of all candidates against whom outside money was spent in 2010 and were the target of 17.9 percent of all outside opposition spending.
When analyzed separately by legislative chamber and election year, candidate status and party are more likely to predict levels of opposition spending than is gender. In 2012 House contests, Democratic candidates were more likely to be the target of opposition spending than their Republican counterparts, and challengers faced greater opposition spending than incumbents or candidates for open seat races. No candidate traits, including party, status, and gender, were significant predictors of opposition spending amounts in 2010 House contests.16

Money in Politics with a Gender Lens 14
Table 6. Outside Spending against Congressional Candidates by Candidate Gender
Source: Center for Responsive Politics NOTE: All data reflects combined spending against candidates by outside organizations that can raise unlimited funds (see footnotes 1 and 2).
Outside Spending in Support of Candidates
Finally, table 7 reports data on gender differences in outside spending in support of male and female candidates in 2010 and 2012 cycles. Gender is not a significant independent predictor of outside spending in support of congressional candidates in either year, but it does interact with party and status in 2012 House races to predict the amount of outside spending for candidates. Overall, the amount of outside money spent in support of all candidates is much lower than the money spent opposing them. Thus, mean supportive spending is also lower for male and female candidates. In 2012, outside organizations spent on average $149,414 in support of female candidates and $139,304 in support of male candidates. Women were 22.8 percent of all candidates for whom outside money was spent in 2012 and were the target of 24.1 percent of supportive outside spending. In 2010, outside organizations spent an average of $107,040 supporting female candidates and $82,759 in support of male candidates. Women were 20.5 percent of all candidates for whom outside money was spent in 2010 and were the target of 25 percent of all outside supportive spending.
While it appears women candidates may actually benefit more from outside spending than their male counterparts based on this data, our analyses reveal that certain types of women candidates may benefit more from supportive outside spending than others. Helping to explain the significant three-way interaction between gender, party, and status in our analysis of 2012 House races, it appears that more money was spent, on average, to support Democratic women challengers and Democratic women running for open seats than Republican women candidates of any statuses. However, more outside money was spent, on average, favoring Republican women incumbents than Democratic women incumbents. Among male candidates, however, average supportive spending for Republicans exceed that for Democrats of every status.17
In terms of average supportive spending on their behalf, challengers fared best within each gender-party grouping. For Democratic men, Democratic women, and Republican men, open seat candidates were the target of the next highest levels of average supportive spending. However, the least average spending among Republican women candidates was spent on those running for open seats. It is logical that challengers and open seat candidates may require greater supportive spending than incumbents, as they are new to the voters they seek to persuade. Thus, Democratic women appear to be at an advantage over Democratic men and Republican women in this context, while Republican women may not be benefitting as much as Republican men from outside spending on their behalf. These initial findings, then, show that being a woman may be more or less beneficial in terms of outside campaign spending depending on the party to which you belong

Money in Politics with a Gender Lens 15
and status with which you enter the race. To better investigate these interactive effects, more data is needed over time and controlling for unique campaign contexts.
Table 7. Outside Spending for Congressional Candidates by Candidate Gender
Source: Center for Responsive Politics NOTE: All data reflects combined spending against candidates by outside organizations that can raise unlimited funds (see footnotes 1 and 2).
Overall, our analyses demonstrate that while candidate gender may play a minor role in spending choices by outside groups, its predictive power is not strong and its influence is not isolated.18 Instead, when and where gender does predict outside spending levels for candidates—in supportive spending in 2012 U.S. House races—it interacts with other influential factors like candidate party and status. Mean outside spending levels in support of and against women are slightly greater than those for men in 2010 and 2012, demonstrating that women are not being left out of this new financial environment. In fact, in 2012, outside spending by groups who can receive unlimited funds made up a greater percentage of all outside spending (including that by traditional PACs) for (84 percent) and against (95 percent) women than for (79 percent) or against (91 percent) men.
The only significant results for gender, interacting with party and status, may reflect the strength and influence of progressive women’s organizations like EMILY’s List who have developed their own Super PAC—Women Vote!—to support Democratic women candidates. Thus, while Crespin and Deitz (2011) found that women’s donor networks gave Democratic women candidates a competitive edge among individual donors, these findings may indicate that the same organizations are adapting to new campaign rules to be sure that progressive women candidates are, at the least, not disadvantaged by the increased role and influence of Super PAC spending. Still, women are also more likely than men, proportionately, to be targets of greater opposition spending, largely due to their increased likelihood of being Democrats.19 And because opposition spending strongly dominates outside spending totals, the boost in supportive spending—albeit for some women candidates—may only buffer Super PAC spending against them.
The lack of gender effects in predicting outside spending in 2010 and 2012 campaigns may also reflect the dominant influence of campaign competitiveness in fueling overall campaign spending, regardless of new rules. According to the Center for Responsive Politics, in 2012, women were major party candidates in 10 of the top 20 Senate races by level of outside spending. Two female Senate candidates, Tammy Baldwin (D-WI) and Shelley Berkley (D-NV), ranked among the top ten candidates by level of outside spending for or against them. In 2012 House races, women were major party candidates in five of the top 10 highest outside-spending races. Three female House candidates—Tammy Duckworth (D-IL), Val Demings (D-FL), and Gloria Negrete McLeod (D-CA)—were among the 10 candidates on whom the most outside money was spent. While we do not include a variable for competitiveness in our statistical analyses above, these data

Money in Politics with a Gender Lens 16
alone raise an important flag, demonstrating that women running in competitive, high-money races are understandably the target of greater outside spending (both supportive and opposition spending).
The robustness of these findings is limited because there are only two election cycles since the Citizens United decision from which data can be analyzed, and many would argue that the decision had much less effect in 2010 due to its proximity to Election Day. Thus, gender effects may emerge over time as the proliferation and influence of Super PACs grow.
More data from future election cycles and more analysis, including controls for competitiveness of race, are needed to determine whether women are targets of any more or less outside spending in similarly competitive contests. Other variables to include are measures of candidates’ total campaign receipts and expenditures and spending by party committees on candidates’ behalves. Finally, as we discuss in concluding this report, additional analysis of campaign spending data is needed to determine whether equitable levels of spending have equal effects on candidates’ victory or defeat. As existing research has shown, campaign funds may have different effects for men and women candidates, and this may be true for outside spending as well. We discuss the need to explore this question further in concluding this report.
Public Financing
In order to level the financial playing field in today’s campaigns, some have argued that all interests and individuals—Democrat, Republican, women, and men—need to adapt to the new rules of the game by creating Super PACs and outside spending organizations of their own. Some of the evidence presented above indicates that this may be happening in the women’s community, helping to maintain relative parity in outside spending for and against men and women candidates. However, many other advocates argue that the field would be better leveled for all candidates by reducing the role, presence, and influence of money in campaigns overall. The most obvious method to limiting the amount of money raised and spent in campaigns is adoption of public financing systems nationally and at the state level. By reducing the role of money in campaigns, publicly financed campaigns would be expected to foster greater campaign competition, broaden and diversify the pool of potential candidates by reducing fundraising as a barrier to recruitment or success, and engage more citizens in the electoral process (Malbin, Brusoe, and Glavin 2012).
There are two primary types of publicly funded—or “clean”—elections: partial matching fund programs and full public financing (Public Citizen 2012).20 According to Public Citizen, 14 states and about a dozen local jurisdictions have also enacted some form of public campaign financing. The three states with full public financing programs for state legislative candidates are Arizona, Connecticut, and Maine. Participation rates in each state are high, with the greatest popularity in Connecticut and Maine, where more than two-thirds of state legislative candidates took public funding in the most recent elections (Powell 2010).
Initial findings on the impact of public financing from these states foreshadow potential effects of enacting public financing nationwide. Moreover, they help us decipher whether or not there are uniquely gendered benefits of promoting publicly funded campaigns. First, Mayer and Werner (2007) find that public financing increases electoral competitiveness, encouraging challengers to step forward when they otherwise might not.21 Public financing has also reduced funding disparities between winners and losers and permitted candidates and legislators to spend more time with a more diverse set of constituents and less time fundraising (Cha and Rapoport 2013; Malbin, Brusoe, and Glavin 2012; Maine Commission 2007; Powell 2010).22 When less time is spent raising money, more time can be spent on legislative substance. That substance is more aligned with constituents’ policy concerns instead of lobbyists’ agendas when constituents are given more equitable attention by candidates and officeholders (Cha and Rapoport 2014).

Money in Politics with a Gender Lens 17
Finally, public financing systems increase the diversity of both donors and candidates. For example, Malbin, Brusoe, and Glavin (2012) find that New York City’s enactment of a matching funds program has increased the number of small donors and demographically diversified the donor pool. While some scholars question whether campaign contributions represent substantive political engagement (Putnam 2000; Verba, Schlozman, and Brady 1995), the diversification of the donor pool at least has the effect of diluting the dominant role of large donors (Malbin, Brusoe, and Glavin 2012). Evaluations of the introduction and implementation of publicly funded systems also suggest that the candidate pool is diversified, whether by class/income, race/ethnicity, gender, or experience (Cha and Rapoport 2013; La Raja 2007; Maine Commission 2007). Diversity among candidates increases the potential to shift the demographic profile and characteristics of elected officials as well, with implications for legislative representation, process, and policy.
Many pro-reform advocates have argued that women are even more likely than men to both benefit from and participate in public financing systems for a number of reasons. First, as reported above, women are more likely than men to cite fundraising as a hurdle in launching or waging their campaigns. In a 2007 study of potential candidates in Connecticut, 27 percent of respondents said that public funding would increase the likelihood of their running for office, and those respondents who reported the greatest fundraising challenges were the most likely to identify public financing as a potential game changer (La Raja 2007). Second, publicly funded programs reduce candidates’ reliance on parties, which have often posed hurdles to recruitment and support of women candidates (Cha and Rapoport 2013; Sanbonmatsu 2002). Arizona Representative Leah Landrum Taylor (D) told Northeast Action, “Women who run using Clean Elections don’t have to compete in the ‘good ol’ boy’ networks,” affirming this reform as a particular boon to candidates who have traditionally been marginalized from established political networks (Palmer 2006). Finally, Palmer (2006) adds that clean elections play to women candidates’ strengths, allowing them to spend more time with constituents and cultivate individual, small donors.
Program Participation
To test the claim that women will be more likely than men to participate in public financing programs, we look to existing research and more recent data on state program participation. Looking at participation rates from 2000 to 2006, Werner and Mayer (2007) find that women were significantly more likely than men to accept public funds in campaigns for the lower chambers of the Arizona and Maine legislatures.23 This gender difference remains even after controlling for candidate experience, incumbency, partisanship, and strategic context (Werner and Mayer 2007). Looking within party, Werner and Mayer (2007) find that both Democratic and Republican women are more likely to accept public financing than their male partisan peers, but that the gap in participation is greater between Republican women and men. Analyzing more recent election cycles, we looked at public financing participation rates in Arizona and Connecticut from 2008 to 2012 to see if similar gender differences exist. As table 8 shows, a greater proportion of female than male candidates in Connecticut’s and Arizona’s state legislative general elections opted into their state’s public funding program. This is true for the states’ upper and lower chambers, though gender differences are greater in Connecticut participation rates.24 Additional controls, like those included in Werner and Mayer’s (2007) study, are needed to better account for the influence of factors other than gender in explaining these differences. However, these initial findings seem to indicate that women are at least slightly more likely than men to take advantage of public funding programs in state legislative contests.

Money in Politics with a Gender Lens 18
Table 8. Percent of State Legislative Candidates Participating in State Public Financing Program
Source: Connecticut Office of Governmental Accountability, State Elections Enforcement Commission; Arizona Citizens Clean Elections Commission NOTE: Data only includes candidates in general election contests for state legislative seats in each state.
Women’s Representation
While Werner and Mayer (2007) find that women are more likely than men to opt in to public financing programs, they report that the enactment of public funding does not change the overall composition of the candidate pool or gender composition of state legislatures. Despite their finding, scholars, advocates, and officeholders alike have long argued that campaign finance reforms would present unique benefits for women (Burrell 1994; Carroll 1994). In a May 2013 article for the Nation, Katrina Vanden Heuvel observes, “The #1 issue given by prospective women candidates who consider but then do not run is that they don’t think they can raise the necessary money,” and argues, “Defeat or delay for clean elections means fewer women in office.” Maine Senate President Beth Edmonds told Northeast Action, “Traditionally, women don’t see themselves as having access to the places where money resides,” arguing that Maine’s Clean Elections system has opened the doors for women to the Maine legislature (Palmer 2006). A survey of Maine legislative candidates supports that conclusion, as 71 percent of women and 53 percent of men said that Maine’s Clean Election program was very important in their decision to run for office (Maine Commission 2007).
To better investigate these potential effects on women’s representation, we look to the trends in women’s candidacies and legislative representation in Maine, Arizona, and Connecticut from program enactment to present. Since the first cycle of Maine’s Clean Elections program in 2002, there has been a rise in the number of major party women state legislative candidates, particularly in 2006 and 2008, but that rise did not remain steady through 2012. The percentage of women in the Maine state legislature reached a high point after the 2006 elections, but the current numbers of women in office fall below the percentage of women who served in 2000, right before Clean Elections went into place (see figure 4).

Money in Politics with a Gender Lens 19
Figure 4. Maine Trends
Number of Women Candidates Percentage of Women in the State Legislature
Source: Center for American Women and Politics, Rutgers University NOTE: Shaded area reflects years in which public financing laws were in effect. In Arizona, women’s state legislative representation reached its height in 1998, the year that the state’s public financing program was passed and two years before it went into effect. Since enactment of the law, there has been a slight rise in the number of women in the Arizona state senate, but relative stasis in both the numbers of women running for and serving in the state house (see figure 5).
Finally, Connecticut’s public funding system began only five years ago, in the 2008 cycle. The percentage of women in the Connecticut state legislature rose in the first session after enactment—actually reaching the state’s highest level of women’s representation to date, but Connecticut has now returned to preenactment levels. The number of women general election candidates for the Connecticut legislature increased slightly in 2008 and 2010, but not significantly (see figure 6).
Figure 5. Arizona Trends
Number of Women Candidates Percentage of Women in the State Legislature
Source: Center for American Women and Politics, Rutgers University NOTE: Shaded area reflects years in which public financing laws were in effect.

Money in Politics with a Gender Lens 20
Figure 6. Connecticut Trends
Number of Women Candidates Percentage of Women in the State Legislature
Source: Center for American Women and Politics, Rutgers University NOTE: Shaded area reflects years in which public financing laws were in effect.
These very preliminary analyses, limited in their explanatory power without the inclusion of additional predictors or controls, seem to indicate no strong or obvious connection between women’s levels of legislative representation and state public financing systems. The data on candidate emergence are particularly limited, however, in only accounting for general election candidacies, which may overlook the potential effect of public financing on influencing women to run in primary campaigns. And while there may not be a direct relationship between the number of women candidates and officeholders and the availability of public funding, more detailed analyses can better account for the indirect effects that easing campaign finance barriers have on women’s ability and/or willingness to run for and win elective office.
Who Cares? The Impact of Campaign Money on Citizens in Our Democracy
Some of the strongest arguments against an increased role of money in politics and campaigns have focused on the dangers it poses to democracy and, more specifically, the political voice, participation, and engagement of all citizens. These arguments encompass concerns about unequal representation among donors, candidates, and officeholders in an environment where unlimited funds are at play. However, they also include concerns about how increased campaign spending influences public perceptions of and engagement in the political system. At a time when confidence in government is at an all-time low, public distaste for political campaigns only makes it more likely that they detach from the process put in place to change a government they dislike.25 Women—who have long been marginalized in formal politics—are often less likely than men to see government as the site for positive social change.26 That tendency to look elsewhere to make change only grows, to the detriment of American democracy, when women (and men) feel that the game is rigged to benefit the richest.
In surveys immediately following the Supreme Court’s Citizens United decision, the public expressed nearly universal opposition to the ruling. In a February 2010 Washington Post / ABC News poll, 80 percent of respondents opposed the decision, with consistent majorities across subgroups by race, age, income, education, and party. In the same year, Citizens United was the singular Supreme Court decision that respondents to the Constitutional Attitudes Survey opposed. And by July of 2013, 16 states supported an amendment to overturn the ruling.27

Money in Politics with a Gender Lens 21
The opposition the public expressed toward the Citizens United verdict is indicative of perceptions about money’s influence in today’s politics and campaigns. Asked specifically about Super PACs, seven in ten voters in a March 2012 Washington Post / ABC News poll said that they would like the newly created organizations to be illegal. The same proportion of Americans told the Opinion Research Corporation (ORC) in April 2012 that they believe Super PAC spending will lead to corruption. Responses also showed that citizens’ trust in government—and, for some, likelihood of voting—declines as the influence of Super PACs increases. In both polls, men and women were equally concerned about Super PACs’ influence on American politics.28 Thus, concerns about the role of money in politics are not confined to scholars and advocates. Citizens—men and women alike—express similar concerns and report that their skepticism of money’s influence translates into less trust, and even less engagement and participation, in government and politics.
Applying a Gender Lens to Future Research on Money in Politics
Today’s political environment, particularly in campaigns and elections, has been notably altered by the rise in campaign spending, resulting—in large part—from the Supreme Court’s 2010 ruling in Citizens United v. FEC. While the effects of this ruling, and its combined impact with previous rulings that eased limitations on campaign spending, are still unclear, this report poses important questions and offers preliminary findings about how women fare—whether as citizens, voters, donors, or candidates—in the increasingly monetized electoral context. In applying a gender lens to existing research and investigating gender differences in campaign finance data, we find that women remain underrepresented among campaign donors as their potential for influence increases. Levels of outside spending for or against women candidates, however, do not differ significantly from those for men, though our data is limited in cycles studied and variables included. And, finally, while women appear more likely to opt into public financing programs, little evidence has yet emerged that public funding systems will boost women’s representation among candidates or in office. In concluding this report, we present multiple sites for additional research on money in politics with a gender lens, urging scholars and advocates alike to consider the potentially distinctive influence that increased campaign costs and expenditures have on women’s political influence, activity, and representation.
Women Donors
In this report, we show that women are underrepresented among political donors, particularly among large donors and donors to newly created Super PACs. We present some data on campaign mega-donors, noting debates over spousal influence and/or independence among the top donors. Further research should investigate the influence that women have among this class of political donors to candidates and Super PACs, asking how women—whether independent or spouses of other “mega-donors”—differ from men in their spending priorities. More specifically, do the largest women donors show any preference to women candidates and/or “women’s issues,” often defined as issues with the greatest or most direct impact on women and children? In 2012, top mega-donors James and Marilyn Simons contributed to largely progressive candidates and causes. However, while Marilyn gave to Planned Parenthood Votes and female candidates like Kirsten Gillibrand (D-NY) and Elizabeth Warren (D-MA), her husband did not donate to any female candidates or causes associated with women’s issues in particular. Investigating these differences in funding choices between spouses and among all top donors will indicate whether or not having more women among top political donors might change which candidates or what causes benefit from the increased money raised and spent in today’s campaigns.
Money in Politics with a Gender Lens 22
While investigating women’s influence among the biggest donors is of particular interest, it is also important to determine the presence and role of women donors at the smallest levels. FEC data is only available for those who donate $200 or more in any election cycle, leaving out the smallest donors, who are often only accounted for by individual campaigns or in surveys like the ANES, which ask citizens to self-report their political giving. FEC data on donors giving between $200 and $2,399 and ANES reports indicate that gender differences among donors—in presence and giving totals—may be reduced at lower levels of giving, and additional gender data among the smallest donors would further help to affirm or clarify this conclusion. Moreover, if women are better represented among small donors, a political environment in which giving limits are removed and average donations are rising exponentially is less than ideal for preserving women’s ability to participate in and potentially influence campaigns. Additional surveys of political participation, focusing more specifically on differences in levels and types of political giving, may better account for the presence of male and female donors at the smallest levels. Campaigns may also be helpful in reporting gender differences among their smallest donors where that information is available.
Women Candidates
Our initial analyses of outside spending for or against men and women candidates reveals few gender differences, with evidence that other factors—like candidate status and party—are more influential on how much money is spent in support or to oppose a particular candidate. However, to most accurately explain what predicts outside spending levels on a particular candidate or campaign, more variables—including competitiveness of race—need to be included in more complex statistical analyses. Controls for campaigns’ own spending should also be accounted for to better evaluate how outside spending complements or counters individual candidates’ campaign expenditures. Spending by party committees, excluded in our analyses, could also be included in future research as another measure of total money spent for or against individual candidates. Future analyses could also include candidates on whom no outside money is spent, to better account for potential gender differences between who benefits and who suffers from outside spending. Including these data will permit a more comprehensive analysis and understanding of where campaign money is being spent and for or against whom, as well as expose any sites of gender difference therein.
As the number of Super PACs and their spending grows, more research is also needed on the types of Super PACs giving to men and women candidates. Do men or women benefit from different types of Super PACs? More specifically, are women’s political organizations creating Super PACs to ensure that women candidates are able to compete in this new financial reality? And, finally, does outside and/or Super PAC spending influence men and women’s chances of electoral victory in the same, or different, ways?
Expanding further upon the latter question, new research is needed on the effects of campaign expenditures—whether by candidates or outside groups—on candidates’ likelihood of success or defeat. If existing research indicating that women must raise and spend more to be equally successful as men, then equitable rates of outside spending for or against men and women candidates may be unequal in impact. To better investigate money’s influence on campaigns, research must include campaign outcomes, vote percentages, and clearer distinctions between the influence of campaign money in primary versus general election settings.
As campaign finance reforms like public financing are debated and implemented in certain states or localities, additional research on which candidates take public funding—including disaggregation by gender—will help to determine whether limiting campaign spending will be any more or less beneficial to the men or women who run. In addition to collecting more extensive data on candidate participation in public financing systems over time and across states and localities, more detailed analyses are needed to determine whether or not these reforms have had any impact on women’s likelihood of running for or winning elected office. While our initial analyses from three states do not show any strong trend in either direction, additional data and

Money in Politics with a Gender Lens 23
accounting for primary over general election candidate emergence, and political context and climates can better indicate whether or not women might fare better in electoral settings where money’s role is reduced.
Women and Super PACs
As we investigate how women are faring in the post–Citizens United context, we must monitor the ways in which women are altering their own behavior—if at all—to meet new electoral demands. More specifically, are women and/or women’s organizations adapting to this new campaign environment by creating and funding Super PACs of their own? Or, as the number—and potential influence—of Super PACs grows, are women playing a lesser role as donors and/or organizational leaders? While our findings on donors seem to indicate greater gender disparities among donors to outside organizations and Super PACs—with men even more likely to fund these entities—the slight narrowing of the gender gap in outside giving and recent news on Super PAC creation indicates that women and women’s organizations are adapting to, not shying away from, this new funding environment.
In 2010, the first election cycle in which Super PACs were permitted, EMILY’s List launched a Super PAC called Women Vote! to make independent expenditures in competitive races in which they had endorsed female candidates.29 That year, Women Vote! spent $3.6 million dollars, $3 million of which was spent against Republican opponents of their endorsed women candidates. According to Center for Responsive Politics analysis, Women Vote! spent nearly $8 million in the 2012 elections, including $2 million in support of their endorsed candidates and $6 million against their opponents. The organization made news with its 84 percent spending success rate in the 2012 general election, demonstrating that its expenditures did have an effect on electoral outcomes and, more specifically, women candidates’ success.
More women-centered organizations are looking to follow this trend in the 2014 elections. Former EMILY’s List staffer and congressional candidate Kate Coyne-McCoy recently created American LeadHERship PAC to elect women governors in 2014, telling the Huffington Post, “To compete in today’s political environment, that’s [Super PACs] the tool you need.” In August 2013, More Women in Congress Super PAC filed with the FEC to, as its name implies, support women running for congressional seats.30 Looking past 2014 to 2016, Ready for Hillary PAC launched in January 2013 and has already amassed a war chest of $1.3 million to elect Hillary Clinton, should she decide to run, as the first woman president in 2016. Moreover, mega-donors Steve and Amber Mostyn have signed on as founding members of the PAC’s national finance council, joined by long-time Clinton supporter Susie Tompkins Buell.31 Joined by Super PACs on both sides of the reproductive choice issue, these filings demonstrate that organizations to elect women—particularly progressive or Democratic women—are using new funding methods to advance their cause.32 These developments should be monitored with a particular eye to both gender and party dynamics in an electoral context with a new financial reality.
Women and Policy Influence
This report looks at how women fare as candidates and donors in political elections in the wake of the Citizens United decision. However, concerns about money’s ultimate influence on public policy are central to skepticism of the rise in spending and growth of Super PACs in American politics. If money is an expression of political voice, more money may mean a louder voice in debates about public policy priorities and decisions. Thus, additional research is needed to investigate whether, when, and how outside spending in elections might influence the post-election activities of candidates-turned-officeholders. More specifically with regard to gender, does Citizens United affect the ways in which so-called “women’s issues” are addressed, and the degree to which they are prioritized, in Congress?

Money in Politics with a Gender Lens 24
Defining “women’s issues” is difficult, but often focuses on issue areas in which policy decisions have direct and disparate gendered effects, such as sex discrimination or reproductive rights. Most analyses also include issues addressing children and families—health care, education, and child care, for example—in this realm, due to the fact that women shoulder the majority of private sphere responsibilities. However, there is a growing consensus among women’s groups and advocates that nearly all policy issues are “women’s issues,” and that it is critical to understand the differential effects of public policy decisions on men and women in all realms.33 Thus, in investigating the potential policy impact of Citizens United for women, research should consider the ways in which “women’s issues” or legislation—such as the Violence Against Women Act (VAWA) and laws related to pay equity and reproductive rights, among others—are addressed and altered pre– and post–Citizens United. Moreover, analyses should also consider how policies and legislation that have unique gender effects—like changes to the minimum wage or cuts to the Supplemental Nutrition Assistance Program, among other social safety net programs—fare in both monetary environments.34 Analyzing the policy debates and decisions on these issues and legislation could help to identify as yet unseen patterns related to outside money in politics and its effects on gender-related issues.
This report applies a gender lens to the role of money in politics, offering initial findings and sites for future research. Our hope is that it will generate discussion and debate about how today’s evolving campaign finance rules and environments affect men and women—whether as donors, candidates, or citizens. As evaluations and analyses of Citizen’s United v. FEC’s effects are carried out in coming election cycles, our findings should, at the least, be a reminder that the influence and implications of money’s increased role in politics and campaigns are not gender neutral.

Money in Politics with a Gender Lens 25
Bibliography
Bonneau, Chris W. 2007. “Campaign Fundraising in State Supreme Court Elections.” Social Science Quarterly 88(1): 68–85.
Bowie, Blair, and Adam Lioz. 2013. “Billion-Dollar Democracy: The Unprecedented Role of Money in the 2012 Elections.” Demos and the U.S. PIRG Education Fund. http://www.demos.org/sites/default/files/publications/BillionDollarDemocracy_Demos.pdf.
Burns, Nancy, Kay Lehman Schlozman, and Sidney Verba. 2001. The Private Roots of Public Action: Gender, Equality, and Political Participation. Cambridge, MA: Harvard University Press.
Burrell, Barbara. 1985. “Women’s and Men’s Campaigns for the U.S. House of Representatives, 1972–1982: A Finance Gap?” American Politics Quarterly 13(3): 251–272.
———. 1994. A Woman’s Place Is in the House. Ann Arbor, MI: University of Michigan Press.
———. 2005. “Campaign Financing: Women’s Experience in the Modern Era.” In Women and Elective Office: Past, Present and Future, 2nd edition, eds. Sue Thomas and Clyde Wilcox. New York: Oxford University Press.
———. 2008. “Political Parties, Fund-raising, and Sex.” In Legislative Women: Getting Elected, Getting Ahead, ed. Beth Reingold. Boulder, CO: Lynne Reiner Publishers. Carne, Margaret. 2010. “The Role of Independent Expenditures in Men’s and Women’s Campaigns for the U.S. House of Representatives.” Presented at the Annual Meeting of the Midwest Political Science Association, Chicago, IL, April 22–25, 2010.
Carroll, Susan J. 1994. Women as Candidates in American Politics, 2nd edition. Bloomington, IN: Indiana University Press.
Cha, J. Mijin, and Miles Rapoport. 2013. “Fresh Start: The Impact of Public Campaign Financing in Connecticut.” Demos. http://www.demos.org/publication/fresh-start-impact-public-campaign-financing-connecticut.
Corrado, Anthony J., Michael J. Malbin, Thomas E. Mann, and Norman J. Ornstein. 2010. “Reform in an Age of Networked Campaigns: How to Foster Citizen Participation through Small Donors and Volunteers.” Campaign Finance Institute, American Enterprise Institute, and Brookings Institution. http://www.brookings.edu/research/reports/2010/01/14-campaign-finance-reform.
Crespin, Michael H., and Janna L. Deitz. 2010. “If You Can’t Join ’Em, Beat ’Em: The Gender Gap in Individual Donations to Congressional Candidates.” Political Research Quarterly 63(3): 581–593.
Dabelko, Kirsten la Cour and Paul S. Herrnson. 1997. “Women's and Men's Campaigns for the U.S. House of Representatives.” Political Research Quarterly 50: 121–135.
Fiber, Pamela and Richard Fox. 2005. “A Tougher Road for Women? Assessing the Role of Gender in Congressional Elections.” In Gender and American Politics, 2nd edition, eds. Sue Tolleson-Rinehart and Jyl Josephson. Armonk, NY: M.E. Sharpe, 64–81.

Money in Politics with a Gender Lens 26
Fox, Richard L. 2010. “Congressional Elections: Women's Candidacies and the Road to Gender Parity.” In Gender and Elections: Shaping the Future of American Politics, eds. Susan J. Carroll and Richard L. Fox. New York: Cambridge University Press, 187–209.
Francia, Peter. 2001. “Early Fundraising by Nonincumbent Female Congressional Candidates: The Importance of Women’s PACs.” Women and Politics 23(1): 7–20.
Francia, Peter L., John C. Green, Paul S. Herrnson, Lynda W. Powell, and Clyde Wilcox. 2003. The Financiers of Congressional Elections. New York: Columbia University Press.
Frohlich, Lauren. 2013. “5 Public Programs that Life Millions of Women and Children Out of Poverty.” National Women’s Law Center. http://www.nwlc.org/our-blog/5-public-programs-lift-millions-women-and-children-out-poverty.
Green, Joanne Connor. 1998. “The Role of Gender in Open-Seat Elections for the US House of Representatives: A District Level Test for a Differential Value for Campaign Resources.” Women and Politics 19: 33–55.
———. 2003. “The Times . . . Are They A-Changing? An Examination of the Impact of the Value of Campaign Resources for Women and Men Candidates for the US House of Representatives.” Women and Politics 25(4): 1–29.
Green, John C., Paul S. Herrnson, Lynda Powell, Clyde Wilcox. 1999. “Women Big Donors Mobilized in Congressional Elections.” http://www.gvpt.umd.edu/herrnson/women.html.
Hannagan, Rebecca, Jamie Pimlott, and Levente Littvay. 2010. “Does an EMILY’s List Endorsement Predict Electoral Success, or Does EMILY Pick the Winners?” PS: Political Science & Politics 43(3): 503–508.
Herrick, Rebekah. 1996. “Is There a Gender Gap in the Value of Campaign Resources?” American Politics Quarterly 24: 68–80.
Hogan, Robert E. 2010. “Candidate Gender and Voter Support in State Legislative Elections.” Journal of Women Politics & Policy 31(1): 44–66.
La Raja, Raymond. 2007. “Candidate Emergence in State Legislative Elections: Does Public Financing Make a Difference?” Presented at the Annual Meeting of the American Political Science Association, August 29–September 2, Chicago, IL.
Lawless, Jennifer and Richard L. Fox. 2005. It Takes A Candidate: Why Women Don't Run for Office. New York: Cambridge University Press.
Lioz, Adam and Liz Kennedy. 2012. “Democracy at Stake: Political Equality in the Super PAC Era.” Human Rights 39(1): 15–25.
Maine Commission on Governmental Ethics and Election Practices. 2007. “Has Public Funding Improved Maine Elections?” http://www.maine.gov/ethics/pdf/publications/2007_study_report.pdf.
Putnam, Robert. 2000. Bowling Alone: The Collapse and Revival of American Community. New York: Simon and Schuster.
Malbin, Michael J. January 8, 2010. “New Figures Show That Obama Raised about One-Third of His General Election Funds from Donors Who Gave $200 or Less.” Press Release. The Campaign Finance Institute.

Money in Politics with a Gender Lens 27
http://www.cfinst.org/press/releases_tags/10-01 08/Revised_and_Updated_2008_Presidential_Statistics.aspx.
Malbin, Michael J., Peter W. Brusoe, and Brendan Glavin. 2012. “Small Donors, Big Democracy: New York City’s Matching Funds as a Model for the Nation and States.” Election Law Journal 11(1): 3–20.
National Women’s Law Center. 2013. “60 Percent of Women’s Job Gains in the Recovery Are in the 10 Largest Low-Wage Jobs.” Fact Sheet. National Women’s Law Center. http://www.nwlc.org/sites/default/files/pdfs/60percentfactsheet.pdf.
Ondercin, Heather L., and Daniel Jones-White. 2011. “Gender Jeopardy: Do Women Really Know Less Than Men?” Social Science Quarterly 92(3):675–694.
Ornstein, Norman J., Thomas E. Mann, Michael J. Malbin, and Andrew Rugg. 2013. “Vital Statistics on Congress.” Brookings Institution. http://www.brookings.edu/research/reports/ 2013/07/vital-statistics-congress-mann-ornstein.
Palmer, Eric. 2006. “Women Speak Out in Support of Clean Elections.” Northeast Action.
Parti, Tarini and Byron Tau. 2013. “The Mega-Donor Glass Ceiling.” Politico. http://www.politico.com/story/2013/07/women-campaign-contributions-donors-93683.html.
Powell, Richard J. 2010. “Cleaning House? Assessing the Impact of Maine’s Clean Elections Act on Electoral Competitiveness.” Maine Policy Review 19(2): 46–54.
Public Citizen. 2012. “A Short History of Public Funding of Elections in the U.S.” http://www.citizen.org/documents/short-history-of-public-financing-of-elections.pdf.
Sanbonmatsu, Kira. 2002. Democrats, Republicans, and the Politics of Women’s Place. Ann Arbor, MI: University of Michigan Press.
———. 2006. Where Women Run: Gender and Party in the American States. Ann Arbor, MI: University of Michigan Press. Sanbonmatsu, Kira, Susan J. Carroll, and Debbie Walsh. 2008. “Poised to Run: Women’s Pathways to the State Legislatures.” Center for American Women and Politics, Rutgers University. http://cawp.rutgers.edu/research/reports/PoisedtoRun.pdf. She Should Run. 2012. “Vote with Your Purse: Lessons Learned—Women, Money, and Politics in the 2010 Election Cycle.” http://www.sheshouldrun.org/assets/documents/vote-with-your-purse.pdf.
Uhlaner, Carole Jean and Kay Lehman Schlozman. 1986. “Candidate Gender and Congressional Campaign Receipts.” Journal of Politics 48: 30–50.
Verba, Sidney, Kay Lehman Schlozman, and Henry Brady. 1995. Voice and Equality: Civic Voluntarism in American Politics. Cambridge, MA: Harvard University Press.
Volden, Craig, Alan E. Wiseman, and Dana E. Wittmer. 2013. “Women’s Issues and their Fate in Congress.” Working Paper. Center for the Study of Democratic Institutions, Vanderbilt University. http://www.vanderbilt.edu/csdi/research/CSDI_WP_07-2013.pdf.

Money in Politics with a Gender Lens 28
Werner, Brian. 1997. “Financing the Campaigns of Women Candidates and their Opponents: Evidence from Three States, 1982–1990." Women & Politics 19: 81–97.
Werner, Timothy and Kenneth R. Mayer. 2007. “Public Election Funding, Competition, and Candidate Gender.” PS: Political Science & Politics 40(4): 661–667.
Wilhite, Allen and John Theilman. 1986. “Women, Blacks, and PAC Discrimination.” Social Science Quarterly 67: 283–298.
Women’s Campaign Forum. 2007. “Vote with Your Purse.” http://www.wcffoundation.org/assets/documents/wcff-vote-with-your-purse-2007.pdf.

Money in Politics with a Gender Lens 29
Notes 1 In nominal dollars, the cost of winning has nearly tripled. 2 In nominal dollars, nonparty independent expenditures were $3.96 million in 1992 House races and $2.38 million in 1992 Senate races. In 2012, nonparty independent expenditures rose to $197.91 million in House races and $259.3 million in Senate races (Vital Statistics 2013). 3 In Citizens United v. FEC, the Supreme Court ruled that it is unconstitutional to limit contributions to political committees that only make independent expenditures, arguing that unlimited independent spending by corporations cannot be treated differently from constitutionally protected independent spending by individuals (Malbin, Brusoe, and Glavin 2012). 4 Donations at the primary and general election phases to U.S. House, Senate, and presidential (2008 and 2012) contests are included. 5 The Center for Responsive Politics (CRP) uses Melissa Data to gender code donor data. More information available at: http://www.melissadata.com/name-parsing/index.htm. CRP coded donor gender using name-parsing software, with codes provided for men, women, or unidentifiable. 6 These numbers are comparable to those found in She Should Run’s “Vote with Your Purse” (2012) report, which included donations to party committees in 2008 and 2010. 7 Gender differences in giving totals and number of donors are statistically significant for each election cycle (p<.01). 8 See footnote 1 9 In 2004, 26 percent of George W. Bush’s campaign donations from individuals donors were $200 or less, according to the Campaign Finance Institute (Corrado et al. 2010). 10 While this data does show a potentially changing trend in men and women’s probability of giving, its veracity is limited by individuals’ likelihood of overreporting and variance in how survey respondents define political giving. 11 See Molly Redden, “The Complicated Politics of Reporting on Female Mega-Donors,” New Republic, July 8, 2013. 12 One top donor’s gender could not be identified. Outside groups are defined here as in footnote 1. 13 See Fiber and Fox (2005) for findings challenging this conclusion. 14 Research on state legislative and state supreme court elections has also shown that women are equally capable as men to raise and spend campaign money (Bonneau 2007; Hogan 2007; Werner 1997). 15 See endnotes 1 and 2 for details on what is deemed “outside spending” in our analyses. 16 While factorial ANOVAs were calculated separately for U.S. House and Senate contests, the low number of Senate candidates in each category makes findings unreliable. We do not report Senate findings in this report. 17 The average amount of outside spending in support of Democratic women House challengers in 2012 was $297,851, compared to $26,921 for Democratic women House incumbents, and $92,017 for Democratic women running for open House seats. The average amount of outside spending in support of Republican women House challengers in 2012 was $89,306, compared to $58,096 for Republican women House incumbents, and $28,640 for Republican women running for open House seats. The average amount of outside spending in support of Democratic men House challengers in 2012 was $46,744, compared to $41,571 for Democratic men House incumbents, and $41,603 for Democratic men running for open House seats. The average amount of outside spending in support of Republican men House challengers in 2012 was $167,686, compared to $62,668 for Republican men House incumbents, and $100,824 for Republican men running for open House seats. 18 These findings are consistent with results from the same statistical analyses on spending data for all PACs and Super PACs, still excluding party committees. Those results are not reported here because the conclusions remain the same. 19 When disaggregated by cycle, party, and gender, average outside spending in opposition to men and women candidates of the same party differs little while differences between Democratic and Republican candidates remain significant (with more money spent opposing Democratic candidates, men and women). 20 In partial matching-fund programs, qualified candidates receive government funds to cover a portion of their campaign expenses, often at levels matching candidates’ receipts from private contributions or in a lump sum once candidates reach a set threshold in private contributions (Public Campaign 2012). Unlike partial programs, candidates agree not to accept any private contributions in fully public financed systems where the government covers nearly all of candidates’ campaign expenses after a modest threshold of private support is demonstrated (Public Campaign 2012). At the federal level, presidential candidates are eligible for partial public funding in primary contests and full public financing in the general election. 21 Powell (2010) does not find a significant increase in competitiveness in his analysis of Maine’s Clean Election system between 1994 and 2008, and Bardwell (2002) finds that the public funding does not lure more challengers in gubernatorial primaries between 1980 and 2000. 22 Cha and Rapoport (2013) find that the average state legislative candidate in a state without public financing spends 28 percent of their time fundraising, while candidates in public financing states spend just 11 percent of their time fundraising. 23 According to Werner and Mayer (2007) 63 percent of female Arizona House candidates from 2000 to 2006 accepted public grants, versus 48 percent of male candidates. In Maine, the overall opt-in rate was 70 percent for women and 61 percent for men in state House contests between 2000 and 2006. 24 Arizona’s clean elections program changed in 2011, after the Supreme Court declared the program’s matching funds provision—whereby participating candidates received additional public funds when their privately funded opponents outspent them—unconstitutional. The match was also suspended in the 2010 elections, at which time the law was being challenged in court. Without this match incentive, participating candidates can receive much less financial support. As a result, the participation rates of men and women candidates have declined significantly.

Money in Politics with a Gender Lens 30
25 A July 2013 CBS News poll reports the public approval rating for Congress at only 17 percent, an all-time low for the nation’s legislative branch. Full poll available at http://www.realclearpolitics.com/docs/2013/CBS_National_0724.pdf. 26 For example, women are less likely to see elected office as their best route toward making positive social change (CAWP 2008), and girls who want to change the world are less likely than their male counterparts to see running for office as the place to do it (Lawless 2013). 27 See Paul Blumenthal, “States Push Post-Citizens United reforms as Washington stands still,” Huffington Post, July 12, 2013. 28 In the Washington Post / ABC News poll, 69 percent of men and 68 percent of women said that Super PACs should be banned. Latinos and African Americans were more likely than whites to tell ORC that they are less likely to vote because big donors and Super PACs have so much more sway than average Americans. There are no significant gender differences on the same question. 29 See Russ Choma, “Female Donors Spent Big Backing Women Vote! Super PAC in August,” Open Secrets Blog, September 19, 2012 and Michael Beckel, “EMILY’s List ‘Super PAC’ Rakes in Cash from SEIU, Mega-Donors,” Open Secrets Blog, September 20, 2010. 30 See Michael Beckel, “New Super PAC to Boost Women Candidates,” Center for Public Integrity, August 9, 2013. 31 See David Steinbach, “Ready for Hillary PAC Moves Forward with Big Funders,” Open Secrets Blog, May 29, 2013. 32 According to the Center for Responsive Politics, Planned Parenthood Votes spent $6 million in the 2012 elections to help elect prochoice candidates, while conservative women’s organization Susan B. Anthony List created their own Super PAC—Women Speak Out PAC—in the fall of 2012 to oppose prochoice candidates. Susan B. Anthony List only spent $900,000. 33 Volden, Wiseman and Wittmer (2013) define “women’s issues” as issues that are associated with the private sphere, (including health care, child care, and education), affect women directly (such as sex discrimination and abortion), or are the focus of efforts by various women’s policy groups. 34 The Violence Against Women Act (VAWA) and the Supplemental Nutrition Assistance Program (SNAP) both disproportionately affect women and require congressional reauthorization, allowing for pre– and post–Citizens United analyses. Of the nearly two million adults kept out of poverty by SNAP in 2013, 1.1 million were women, and of the 335,000 elderly kept out of poverty by SNAP, 67 percent—or 223,000—were women (Frohlich 2013). Finally, women, who are just less than half of the workforce, comprise over 77 percent of the workforce among the 10 largest low-wage occupations. Women have also moved in greater numbers into low-paying sectors since the 2008 financial meltdown: 60 percent of the increase in employment for women between 2009 and 2012 was in the 10 largest occupations that typically pay less than $10.10 per hour (NWLC 2013).
Board of Directors As of January 2014
Lucie Lapovsky – Chair
Principal Lapovsky Consulting
Kathleen K. Lundquist President
APTMetrics, Inc.
Kathy Cloninger – Vice Chair Emeritus Chief Executive Officer
Girl Scouts of the USA
Layli Maparyan Director
Wellesley Centers for Women Wellesley University
Alfred Feliu – Secretary
Senior Partner Vandenberg & Feliu, LLP
Shari Miles-Cohen Senior Director
Women’s Programs Office American Psychological Association
Katie Grover -- Treasurer Immediate Past Board Chair
Ms. Foundation for Women
Linda M. Perkins Director
Applied Women’s Studies Claremont Graduate University
Áine Duggan
President National Council for Research on Women
Lynda M. Sagrestano Director
Center for Research on Women University of Memphis
R. Lawrence Ashe Senior Counsel
Parker, Hudson, Rainer & Dobbs, LLP
Eleanor Smeal Director
The Feminist Majority
Elizabeth L. Grayer President
Legal Momentum
Gloria Thomas Director
Center for the Education of Women University of Michigan
Beverly Guy-Sheftall
Director Women's Research and Resource Center
Spelman College
Debbie Walsh Director
Center for American Women & Politics Eagleton Institute of Politics
Rutgers University
Sarah Degnan Kambou President
International Center for Research on Women
Judith S. White President and Executive Director
HERS (Higher Education Resource Services) University of Denver
Deborah Slaner Larkin
Board Member National Women's Law Center
Melinda Wolfe Chief Human Resources Officer
Pearson