Embed Size (px)
Citation preview
MONEYAND THE
AMERICANFAMILY
Conducted for AARP’s Modern Maturity Magazine
May 2000
by Belden Russonel lo & Stewart , Washington, DC andResearch/Strategy/Management, Great Fal ls , VA
Money and the American Family
Prepared by
Belden Russonello & Stewart and Research/Strategy/Management for
AARP’s Modern Maturity Magazine
Copyright 2000 by AARP601 E Street, NW, Washington, DC 20049
www.aarp.orgAll rights reserved.
Reprinting with permission only.
May 2000
For more information, contact:
Constance Swank, Ph.D., AARP Research Group, 202-434-6173Linda Fisher, Ph.D., AARP Research Group, 202-434-6304
Xenia P. Montenegro, Ph.D., AARP Research Group, 202-434-3538
AARP is the nation’s leading organization of people age 50 and older. It serves their needs andinterests through information and education, research, advocacy and community services which areprovided by a network of local chapters and experienced volunteers throughout the country. Theorganization also offers members a wide range of special benefits and services, including ModernMaturity magazine and the monthly Bulletin.
PREPARED FOR AARP BY BELDEN RUSSONELLO & STEWART AND RESEARCH/STRATEGY/MANAGEMENT
TABLE OF CONTENTS
Page
I. Executive Summary 1
II. Background and Introduction 5
III. Brief Methodology 7
IV. Findings 8
1. Contentment with lifestyle and outlook 8
2. Values: Money takes a back seat to family and friends 12
3. Americans want to be wealthy but not be like the wealthy 25
4. How money makes a difference to families 30
5. Optimism about the future and retirement 33
6. Saving for the future 36
7. Holding debt 40
8. What it takes to be wealthy 43
V. Attitudinal Groups 47
Appendix A: Detailed Methodology and Statistical Methods
Appendix B: Questionnaire with response totals
PREPARED FOR AARP BY BELDEN RUSSONELLO & STEWART AND RESEARCH/STRATEGY/MANAGEMENT
LIST OF TABLES
Page
Table 1: Satisfaction with Financial Situation 11
Table 2: Importance of Earning a Lot of Money 14
Table 3: Reason for Money: Providing for Family 17
Table 4: Reason for Money: Getting Medical Attention 18
Table 5: Reason for Money: Staying Healthy 19
Table 6: Reason for Money: Helping Family and Friends 19
Table 7: Money Can Buy: Excitement in Life 21
Table 8: Money Can Buy: Freedom 21
Table 9: Money Cannot Buy: Good Health, Self-fulfillment,or Self-esteem 23
Table 10: Money Cannot Buy: Family Togetherness 23
Table 11: Money Cannot Buy: Peace of Mind 24
Table 12: Desire for Wealth 26
Table 13: What to do with a Million Dollars 27
Table 14: Wealthy People 29
Table 15: If Americans Became Wealthier … 29
Table 16: Impact of Money on Life Decisions by Race 32
Table 17: Impact of Money on Life Decisions by Generation 32
Table 18: Want to Retire 34
Table 19: Expect to Retire 34
PREPARED FOR AARP BY BELDEN RUSSONELLO & STEWART AND RESEARCH/STRATEGY/MANAGEMENT
LIST OF TABLES (Continued)
Page
Table 20: Living in Own Home After Retirement 35
Table 21: Saving for the Future 36
Table 22: What Americans Save For 38
Table 23: Not Saving or Investing Enough 39
Table 24: Credit Card Debt 41
Table 25: Mortgage 41
Table 26: Car Loan 42
Table 27: When is a Family of Four Wealthy? 44
Table 28: Who is Wealthy? 45
Table 29: Who is Poor? 46
Table 30: Demographics of Attitudinal Groups 59
Table 31: Importance of Money by Attitudinal Groups 60
Table 32: Contentment by Attitudinal Groups 60
PREPARED FOR AARP BY BELDEN RUSSONELLO & STEWART AND RESEARCH/STRATEGY/MANAGEMENT
LIST OF FIGURES
PageFigure 1: Contentment with Lifestyle and Assessmentof the Nation’s Economy 9
Figure 2: Assessment of Financial Status 9
Figure 3: How to Measure a Successful Life 12
Figure 4: Reasons for Having Money 16
Figure 5: What Money Can and Cannot Buy 22
Figure 6: Desire for Wealth 25
Figure 7: What Wealthy People Are Like… 28
Figure 8: Decisions Because of Lack of Money 31
Figure 9: Expectations and Desires About Retirement at 65 33
Figure 10: What Americans Save For 37
Figure 11: Americans and Debt 40
Figure 12: Reasons for Too Much Debt 42
PREPARED FOR AARP BY BELDEN RUSSONELLO & STEWART AND RESEARCH/STRATEGY/MANAGEMENT
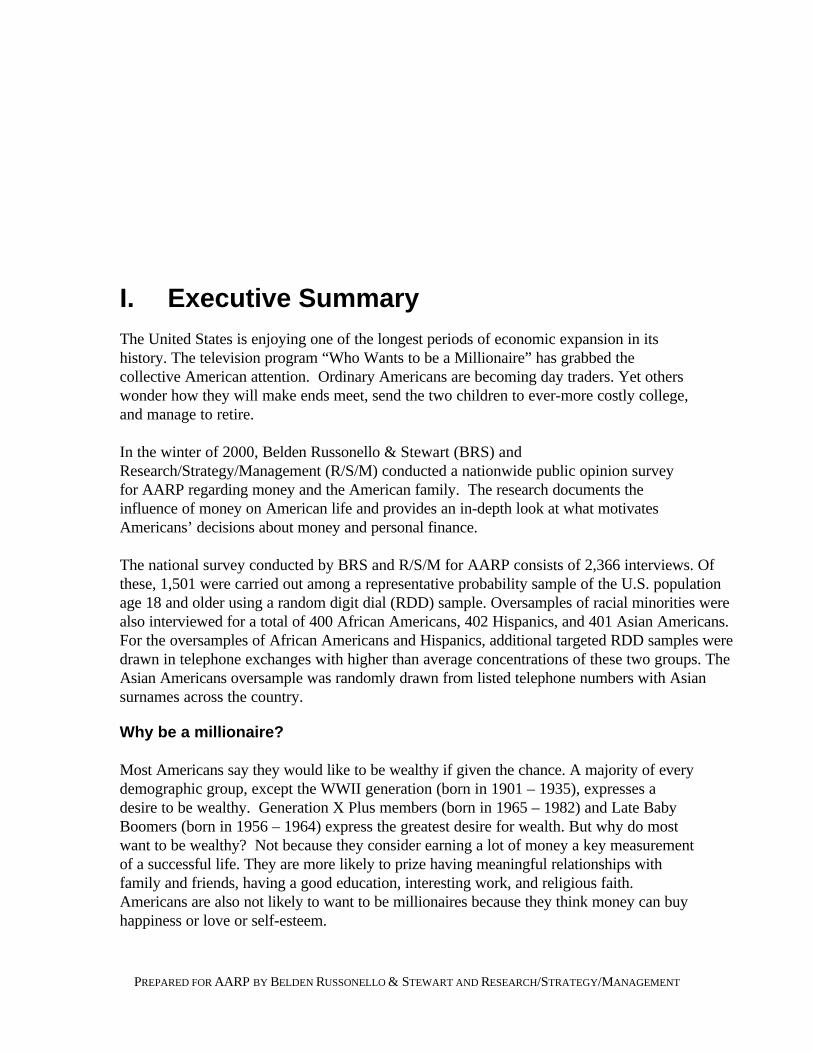
I. Executive SummaryThe United States is enjoying one of the longest periods of economic expansion in itshistory. The television program “Who Wants to be a Millionaire” has grabbed thecollective American attention. Ordinary Americans are becoming day traders. Yet otherswonder how they will make ends meet, send the two children to ever-more costly college,and manage to retire.
In the winter of 2000, Belden Russonello & Stewart (BRS) andResearch/Strategy/Management (R/S/M) conducted a nationwide public opinion surveyfor AARP regarding money and the American family. The research documents theinfluence of money on American life and provides an in-depth look at what motivatesAmericans’ decisions about money and personal finance.
The national survey conducted by BRS and R/S/M for AARP consists of 2,366 interviews. Ofthese, 1,501 were carried out among a representative probability sample of the U.S. populationage 18 and older using a random digit dial (RDD) sample. Oversamples of racial minorities werealso interviewed for a total of 400 African Americans, 402 Hispanics, and 401 Asian Americans.For the oversamples of African Americans and Hispanics, additional targeted RDD samples weredrawn in telephone exchanges with higher than average concentrations of these two groups. TheAsian Americans oversample was randomly drawn from listed telephone numbers with Asiansurnames across the country.
Why be a millionaire?
Most Americans say they would like to be wealthy if given the chance. A majority of everydemographic group, except the WWII generation (born in 1901 – 1935), expresses adesire to be wealthy. Generation X Plus members (born in 1965 – 1982) and Late BabyBoomers (born in 1956 – 1964) express the greatest desire for wealth. But why do mostwant to be wealthy? Not because they consider earning a lot of money a key measurementof a successful life. They are more likely to prize having meaningful relationships withfamily and friends, having a good education, interesting work, and religious faith.Americans are also not likely to want to be millionaires because they think money can buyhappiness or love or self-esteem.
AARP/Modern Maturity Survey on Money and the American FamilyMay 2000 Page 2
PREPARED FOR AARP BY BELDEN RUSSONELLO & STEWART AND RESEARCH/STRATEGY/MANAGEMENT
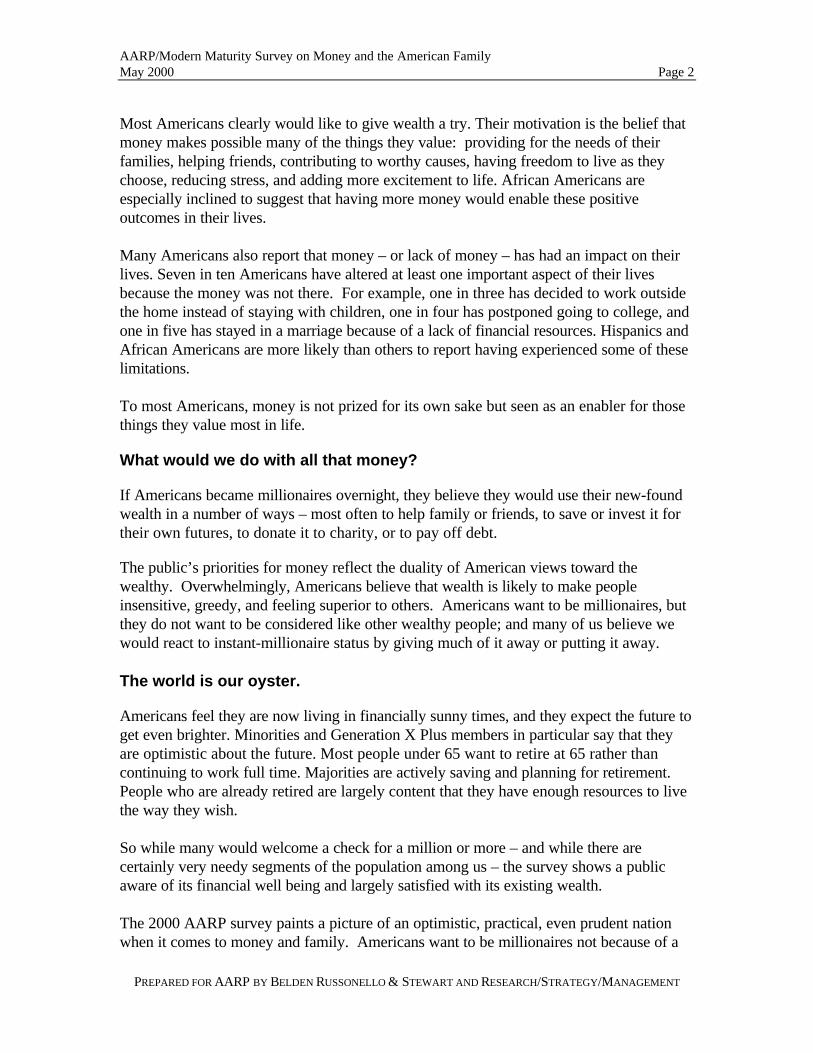
Most Americans clearly would like to give wealth a try. Their motivation is the belief thatmoney makes possible many of the things they value: providing for the needs of theirfamilies, helping friends, contributing to worthy causes, having freedom to live as theychoose, reducing stress, and adding more excitement to life. African Americans areespecially inclined to suggest that having more money would enable these positiveoutcomes in their lives.
Many Americans also report that money – or lack of money – has had an impact on theirlives. Seven in ten Americans have altered at least one important aspect of their livesbecause the money was not there. For example, one in three has decided to work outsidethe home instead of staying with children, one in four has postponed going to college, andone in five has stayed in a marriage because of a lack of financial resources. Hispanics andAfrican Americans are more likely than others to report having experienced some of theselimitations.
To most Americans, money is not prized for its own sake but seen as an enabler for thosethings they value most in life.
What would we do with all that money?
If Americans became millionaires overnight, they believe they would use their new-foundwealth in a number of ways – most often to help family or friends, to save or invest it fortheir own futures, to donate it to charity, or to pay off debt.
The public’s priorities for money reflect the duality of American views toward thewealthy. Overwhelmingly, Americans believe that wealth is likely to make peopleinsensitive, greedy, and feeling superior to others. Americans want to be millionaires, butthey do not want to be considered like other wealthy people; and many of us believe wewould react to instant-millionaire status by giving much of it away or putting it away.
The world is our oyster.
Americans feel they are now living in financially sunny times, and they expect the future toget even brighter. Minorities and Generation X Plus members in particular say that theyare optimistic about the future. Most people under 65 want to retire at 65 rather thancontinuing to work full time. Majorities are actively saving and planning for retirement.People who are already retired are largely content that they have enough resources to livethe way they wish.
So while many would welcome a check for a million or more – and while there arecertainly very needy segments of the population among us – the survey shows a publicaware of its financial well being and largely satisfied with its existing wealth.
The 2000 AARP survey paints a picture of an optimistic, practical, even prudent nationwhen it comes to money and family. Americans want to be millionaires not because of a
AARP/Modern Maturity Survey on Money and the American FamilyMay 2000 Page 3
PREPARED FOR AARP BY BELDEN RUSSONELLO & STEWART AND RESEARCH/STRATEGY/MANAGEMENT
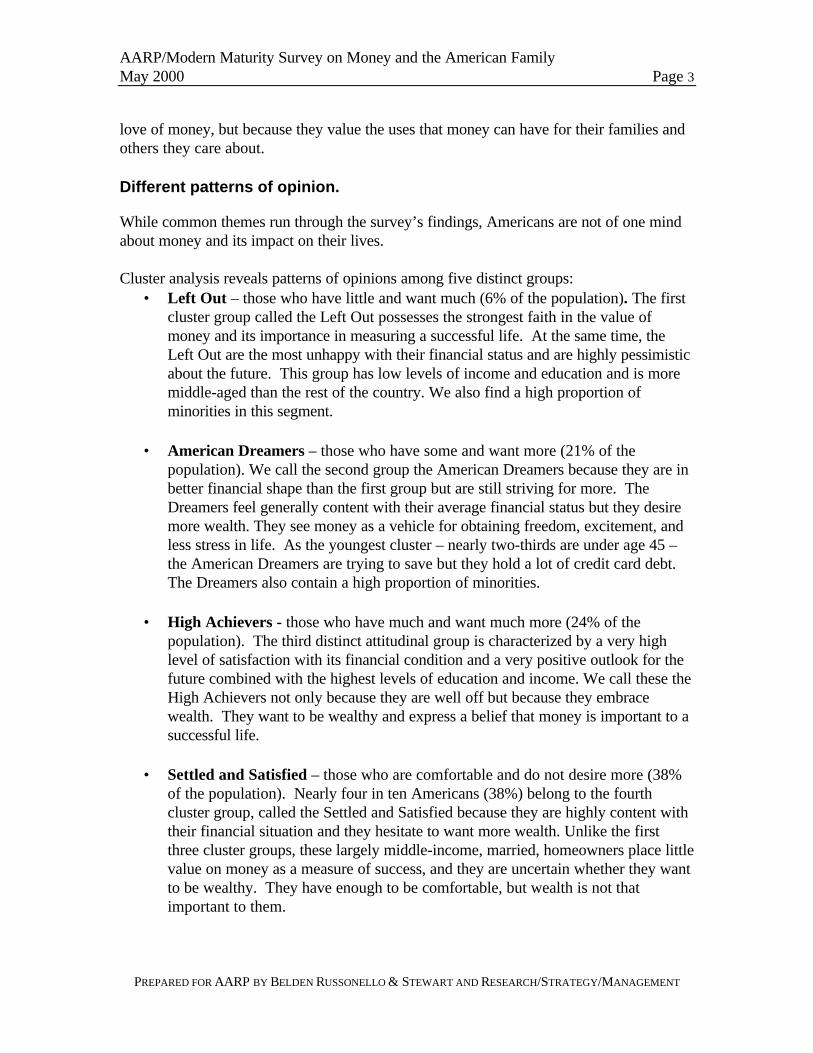
love of money, but because they value the uses that money can have for their families andothers they care about.
Different patterns of opinion.
While common themes run through the survey’s findings, Americans are not of one mindabout money and its impact on their lives.
Cluster analysis reveals patterns of opinions among five distinct groups:• Left Out – those who have little and want much (6% of the population). The first
cluster group called the Left Out possesses the strongest faith in the value ofmoney and its importance in measuring a successful life. At the same time, theLeft Out are the most unhappy with their financial status and are highly pessimisticabout the future. This group has low levels of income and education and is moremiddle-aged than the rest of the country. We also find a high proportion ofminorities in this segment.
• American Dreamers – those who have some and want more (21% of the
population). We call the second group the American Dreamers because they are inbetter financial shape than the first group but are still striving for more. TheDreamers feel generally content with their average financial status but they desiremore wealth. They see money as a vehicle for obtaining freedom, excitement, andless stress in life. As the youngest cluster – nearly two-thirds are under age 45 –the American Dreamers are trying to save but they hold a lot of credit card debt.The Dreamers also contain a high proportion of minorities.
• High Achievers - those who have much and want much more (24% of the
population). The third distinct attitudinal group is characterized by a very highlevel of satisfaction with its financial condition and a very positive outlook for thefuture combined with the highest levels of education and income. We call these theHigh Achievers not only because they are well off but because they embracewealth. They want to be wealthy and express a belief that money is important to asuccessful life.
• Settled and Satisfied – those who are comfortable and do not desire more (38%
of the population). Nearly four in ten Americans (38%) belong to the fourthcluster group, called the Settled and Satisfied because they are highly content withtheir financial situation and they hesitate to want more wealth. Unlike the firstthree cluster groups, these largely middle-income, married, homeowners place littlevalue on money as a measure of success, and they are uncertain whether they wantto be wealthy. They have enough to be comfortable, but wealth is not thatimportant to them.
AARP/Modern Maturity Survey on Money and the American FamilyMay 2000 Page 4
PREPARED FOR AARP BY BELDEN RUSSONELLO & STEWART AND RESEARCH/STRATEGY/MANAGEMENT
• Wealth-averse – those who have little and are reluctant to want more (11% of thepopulation). The fifth and final cluster, the Wealth-averse, rejects the importanceof money and decidedly does not want to be wealthy. These Americans aredecidedly non-materialistic, believing more than most that wealth makes a persongreedy and insensitive. This aversion to wealth does not mask the need thatmembers of this group have for more money in their lives. With low incomes, lowlevels of education, and a lot of debt, the Wealth-averse have had to foregomedical care, college, or retirement because of a lack of money. The Wealth-averse may need money, but they do not seek it.
Money and wealth are truly important to the first three cluster groups, about half the U.S.population. To the other half of America, money and wealth are not synonymous withsuccess. Yet they will play key roles in the lives of all.
AARP/Modern Maturity Survey on Money and the American FamilyMay 2000 Page 5
PREPARED FOR AARP BY BELDEN RUSSONELLO & STEWART AND RESEARCH/STRATEGY/MANAGEMENT
II. Background and Introduction
Does everyone want to be a millionaire?
With all the attention focused on money in America, AARP feels that developing new dataon the influence of money on American life would make a valuable contribution to ourunderstanding of the American public. To better serve its constituents, AARP wanted tocompare generational differences on attitudes toward money and how it affectsAmericans’ lives and families.
AARP commissioned BRS and R/S/M to conduct a national public opinion survey tomeasure attitudes and values relating to the influence of money on American family life.
The national survey questionnaire drew on information from eight public focus groups thatuncovered main themes of Americans’ attitudes toward money and the American family.
In carrying out our research, we paid special attention to the following:
• The values or core beliefs - such as caring for and protecting one’s own family,self-satisfaction, and need for security - that determine behavior and attitudesabout money.
• Americans’ desire to be wealthy, their priorities for money, and what they would
do with a million dollars. • Worry and satisfaction with one’s personal financial situation. • Outlooks and projections for the future: hopes and fears about what the financial
future holds for one’s self and family, opinions about retirement, and whethermoney will be a problem in the future for one’s self and children.
AARP/Modern Maturity Survey on Money and the American FamilyMay 2000 Page 6
PREPARED FOR AARP BY BELDEN RUSSONELLO & STEWART AND RESEARCH/STRATEGY/MANAGEMENT
• How the desire for or concern about money dictates what we do in our lives,including the impact of money on career and education decisions, marriage, andchild-bearing decisions.
To help you read this report
This report on Money and the American Family begins with an executive summary,followed by a detailed findings section which includes tables and charts to highlightselected survey findings. Data on these tables and charts are expressed in percentages.The base for each table and chart is all respondents (n = 2,366) unless otherwise noted.The detailed findings section is followed by a detailed methodology which includes adescription of the multivariate analysis used, and an appendix consisting of a questionnairewith response totals.
In reading these data, when the percent sign (%) appears at the top of a column, thenumbers add vertically; when the % appears at the left of a row, the numbers addhorizontally. An asterisk (*) indicates less than one percent; a double hyphen (--) indicateszero. All figures have been rounded so all tables may not add to 100%. This isdue to weighting, rounding, omission of “don’t know,” or “refused,” and other responses.In the case of multiple response questions, percentages may add to more than 100%.
The report discusses overall survey findings as well as differences based on gender,generation, racial or ethnic minority status, income, marital status, and livingarrangements. Only those differences that are statistically significant are reported in thetext. Subgroup samples are sufficiently large to support generalizations of findings to thetotal population for that subgroup.
AARP/Modern Maturity Survey on Money and the American FamilyMay 2000 Page 7
PREPARED FOR AARP BY BELDEN RUSSONELLO & STEWART AND RESEARCH/STRATEGY/MANAGEMENT
III. Brief Methodology
The national survey includes 2,366 interviews. Of these 1,501 were carried out among arepresentative probability sample of the U.S. population age 18 and older using a randomdigit dial (RDD) sample. In addition, we oversampled 220 additional African Americans(for a total of 400), 290 additional Hispanics (for a total of 402), and 355 more AsianAmericans (for a total of 401). For the oversamples of African Americans and Hispanics,additional targeted RDD samples were drawn in telephone exchanges with higher thanaverage concentrations of these two groups. The Asian American oversample wasrandomly drawn from listed telephone numbers with Asian surnames across the country.The survey results were weighted so that each racial and ethnic group is represented in thecorrect proportion for the nation as a whole.
The sampling tolerance for the basic sample of 1,501 is plus or minus 2.5 percentagepoints at the 95% confidence level. The sampling tolerance for non-Hispanic Whites(n=1,121) is plus or minus 2.8 percentage points; and for each of the three subsamples ofAfrican Americans (n=400), Hispanics (n=402), and Asian Americans (n=401), thesampling tolerance is plus or minus 4.9 percentage points.
The interviewing was conducted by telephone from January 23 through February 21,2000, using experienced, trained and monitored interviewers. The questionnaire wasdeveloped by BRS and R/S/M in collaboration with AARP. Before interviewing began,the questionnaire was pre-tested and translated into Spanish. A detailed description of themethodology is included in Appendix A.
AARP/Modern Maturity Survey on Money and the American FamilyMay 2000 Page 8
PREPARED FOR AARP BY BELDEN RUSSONELLO & STEWART AND RESEARCH/STRATEGY/MANAGEMENT
IV. Findings
1. Contentment with lifestyle and outlook
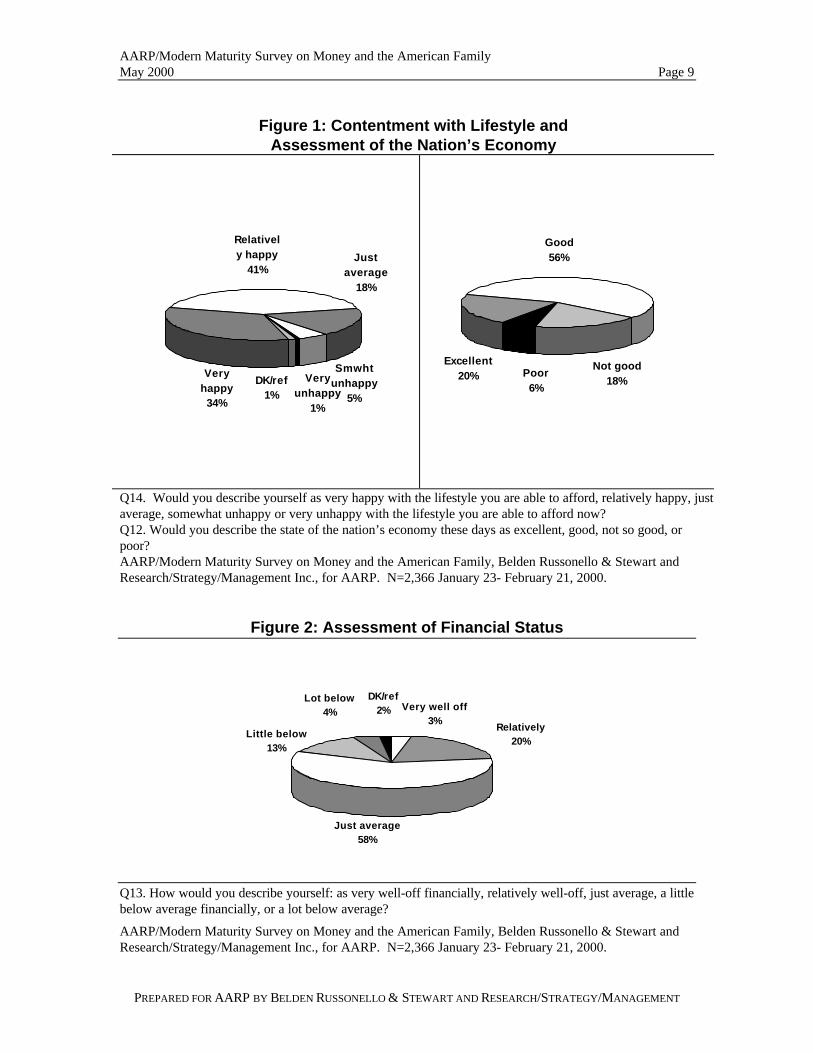
Americans’ attitudes toward money and their financial situations reflect the economicprosperity of recent times. Americans voice general contentment with their lifestyles andthe direction of the nation’s economy. They feel optimistic about the future, and theybelieve we are living in a time of growing prosperity.
Three out of four Americans (75%) are happy with the lifestyle they can afford and thesame proportion (76%) describe the state of the nation’s economy as excellent or good.
Nearly six in ten (58%) characterize their financial situation as “just average” compared toothers in the country. The other four in ten are more likely to see themselves as aboveaverage: (three percent “very well off,” 20% “relatively well off” financially) than belowaverage (13% “a little below average,” four percent “a lot below average” financially).
AARP/Modern Maturity Survey on Money and the American FamilyMay 2000 Page 9
PREPARED FOR AARP BY BELDEN RUSSONELLO & STEWART AND RESEARCH/STRATEGY/MANAGEMENT
Figure 1: Contentment with Lifestyle andAssessment of the Nation’s Economy
DK/ref1%
Very happy
34%
Relatively happy
41%Just
average18%
Smwht unhappy
5%
Very unhappy
1%
Poor6%
Excellent20%
Good56%
Not good18%
Q14. Would you describe yourself as very happy with the lifestyle you are able to afford, relatively happy, justaverage, somewhat unhappy or very unhappy with the lifestyle you are able to afford now?Q12. Would you describe the state of the nation’s economy these days as excellent, good, not so good, orpoor?AARP/Modern Maturity Survey on Money and the American Family, Belden Russonello & Stewart andResearch/Strategy/Management Inc., for AARP. N=2,366 January 23- February 21, 2000.
Figure 2: Assessment of Financial Status
Just average58%
Little below13%
Lot below4%
DK/ref2% Very well off
3%Relatively
20%
Q13. How would you describe yourself: as very well-off financially, relatively well-off, just average, a littlebelow average financially, or a lot below average?
AARP/Modern Maturity Survey on Money and the American Family, Belden Russonello & Stewart andResearch/Strategy/Management Inc., for AARP. N=2,366 January 23- February 21, 2000.
AARP/Modern Maturity Survey on Money and the American FamilyMay 2000 Page 10
PREPARED FOR AARP BY BELDEN RUSSONELLO & STEWART AND RESEARCH/STRATEGY/MANAGEMENT
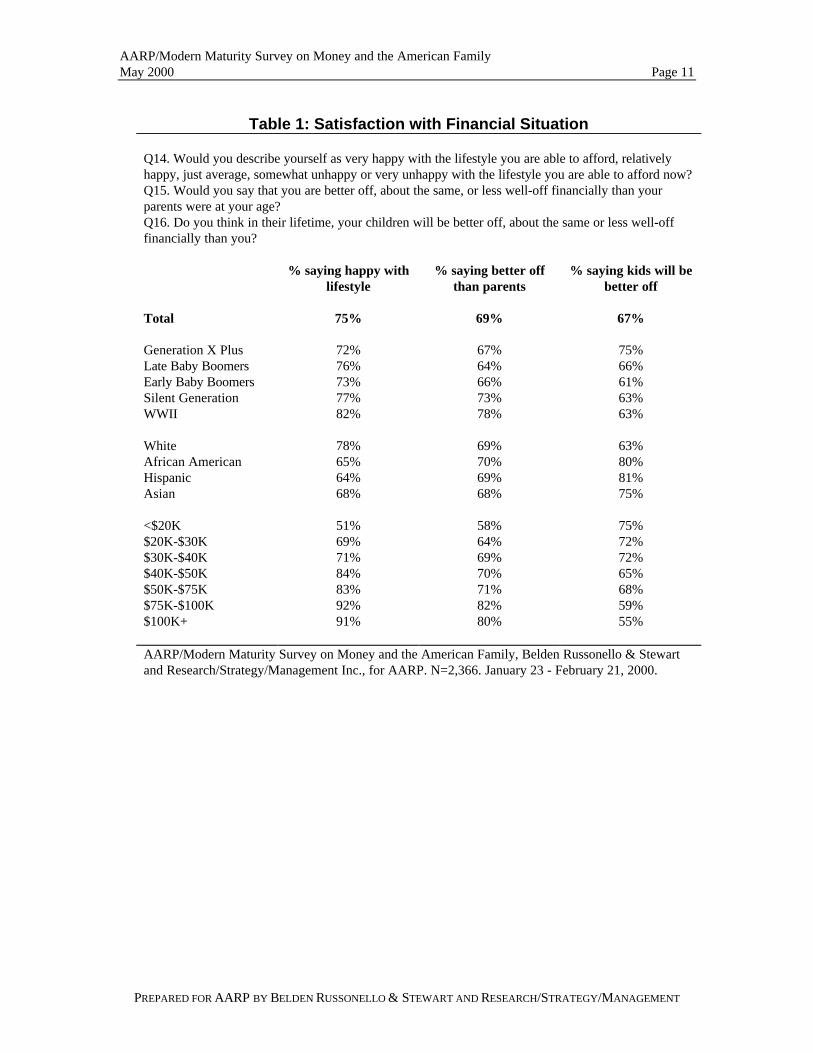
Majorities believe they are better off financially than their parents were at their age (69%)and that their children will be better off than they are (67%). Also, Americans largely donot begrudge others for making money: only 14% of Americans feel left out of the recenttrend of new millionaires and billionaires.
We analyze the survey responses by many demographic characteristics. One characteristicthat proves distinguishing throughout the study is age. We examine responses by fivedifferent age categories: Generation X Plus, the newest adult generation, born from 1965to 1982 (n = 860); late Baby Boomers born from 1956 to 1964 (n = 499); early BabyBoomers born from 1946 to 1955 (n = 417); Silent generation born from 1936 to 1945(n= 260); and the World War II generation born before 1936 (n = 330).
The data suggest that the older generations of Americans express greater contentmentthan the youngest Americans about their own lifestyle and finances, but the youngestgeneration holds higher expectations for the future. (See Table 1.)
Looking at race and income, we find non-Hispanic Whites (hereafter referred to asWhites) and those Americans in households earning over $75,000 a year are more contentwith their current lifestyle than minorities or people with lower incomes. Asian Americans,Hispanics, and African Americans as well as lower-income Americans voice greateroptimism for the future than Whites or financially well-off people. (See Table 1.)
AARP/Modern Maturity Survey on Money and the American FamilyMay 2000 Page 11
PREPARED FOR AARP BY BELDEN RUSSONELLO & STEWART AND RESEARCH/STRATEGY/MANAGEMENT
Table 1: Satisfaction with Financial Situation
Q14. Would you describe yourself as very happy with the lifestyle you are able to afford, relativelyhappy, just average, somewhat unhappy or very unhappy with the lifestyle you are able to afford now?Q15. Would you say that you are better off, about the same, or less well-off financially than yourparents were at your age?Q16. Do you think in their lifetime, your children will be better off, about the same or less well-offfinancially than you?
% saying happy withlifestyle
% saying better offthan parents
% saying kids will bebetter off
Total 75% 69% 67%
Generation X Plus 72% 67% 75%Late Baby Boomers 76% 64% 66%Early Baby Boomers 73% 66% 61%Silent Generation 77% 73% 63%WWII 82% 78% 63%
White 78% 69% 63%African American 65% 70% 80%Hispanic 64% 69% 81%Asian 68% 68% 75%
<$20K$20K-$30K$30K-$40K$40K-$50K$50K-$75K$75K-$100K$100K+
51%69%71%84%83%92%91%
58%64%69%70%71%82%80%
75%72%72%65%68%59%55%
AARP/Modern Maturity Survey on Money and the American Family, Belden Russonello & Stewartand Research/Strategy/Management Inc., for AARP. N=2,366. January 23 - February 21, 2000.
AARP/Modern Maturity Survey on Money and the American FamilyMay 2000 Page 12
PREPARED FOR AARP BY BELDEN RUSSONELLO & STEWART AND RESEARCH/STRATEGY/MANAGEMENT
2. Values: Money takes back seat to family and friends
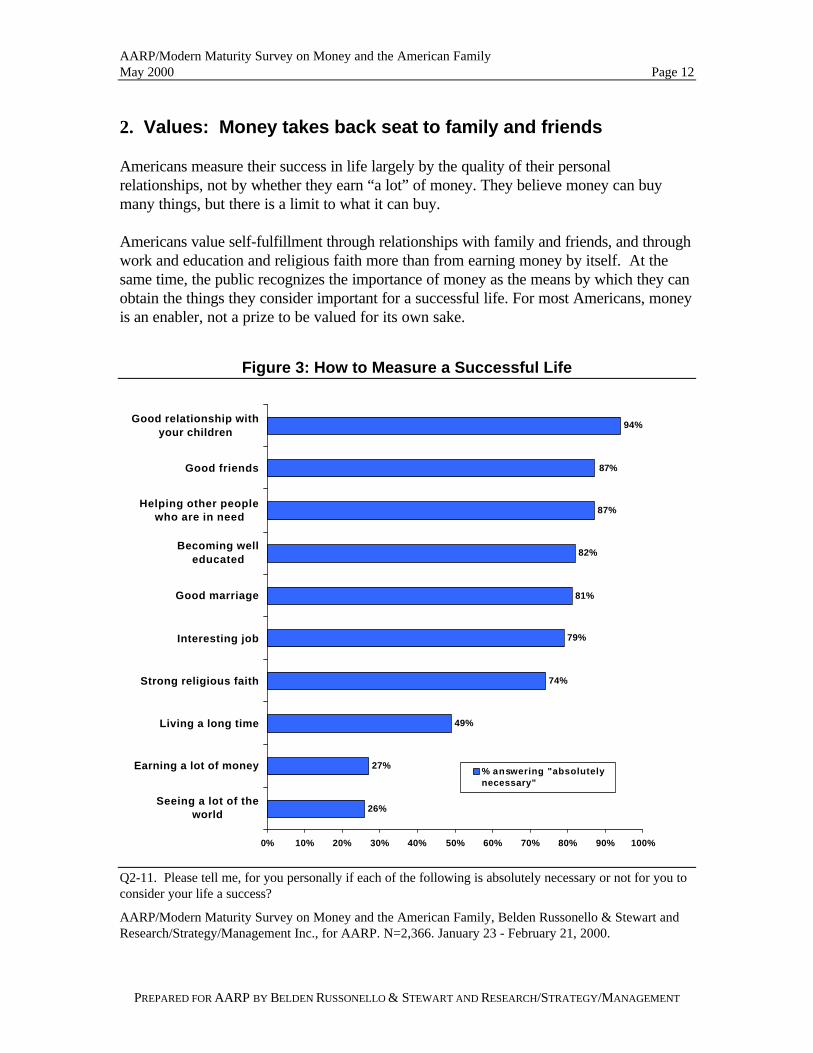
Americans measure their success in life largely by the quality of their personalrelationships, not by whether they earn “a lot” of money. They believe money can buymany things, but there is a limit to what it can buy.
Americans value self-fulfillment through relationships with family and friends, and throughwork and education and religious faith more than from earning money by itself. At thesame time, the public recognizes the importance of money as the means by which they canobtain the things they consider important for a successful life. For most Americans, moneyis an enabler, not a prize to be valued for its own sake.
Figure 3: How to Measure a Successful Life
94%
87%
82%
81%
79%
74%
49%
27%
26%
0% 10% 20% 30% 40% 50% 60% 70% 80% 90% 100%
Seeing a lot of theworld
Earning a lot of money
Living a long time
Strong religious faith
Interesting job
Good marriage
Becoming welleducated
Helping other peoplewho are in need
Good friends
Good relationship withyour children
% answering "absolutelynecessary"
87%
Q2-11. Please tell me, for you personally if each of the following is absolutely necessary or not for you toconsider your life a success?
AARP/Modern Maturity Survey on Money and the American Family, Belden Russonello & Stewart andResearch/Strategy/Management Inc., for AARP. N=2,366. January 23 - February 21, 2000.
AARP/Modern Maturity Survey on Money and the American FamilyMay 2000 Page 13
PREPARED FOR AARP BY BELDEN RUSSONELLO & STEWART AND RESEARCH/STRATEGY/MANAGEMENT
a. Having a lot of money is a lesser value
The best measure of a successful life according to the public is whether one has strongfamily relationships. Specifically, having a good relationship with one’s children is rated“absolutely necessary to consider your life a success” by over nine in ten Americans(94%). Other values considered absolutely necessary by at least three-quarters of thepublic include: having good friends (87%), helping people in need (87%), becoming well-educated (82%), having a good marriage (81%), having an interesting job (79%), and astrong religious faith (74%).
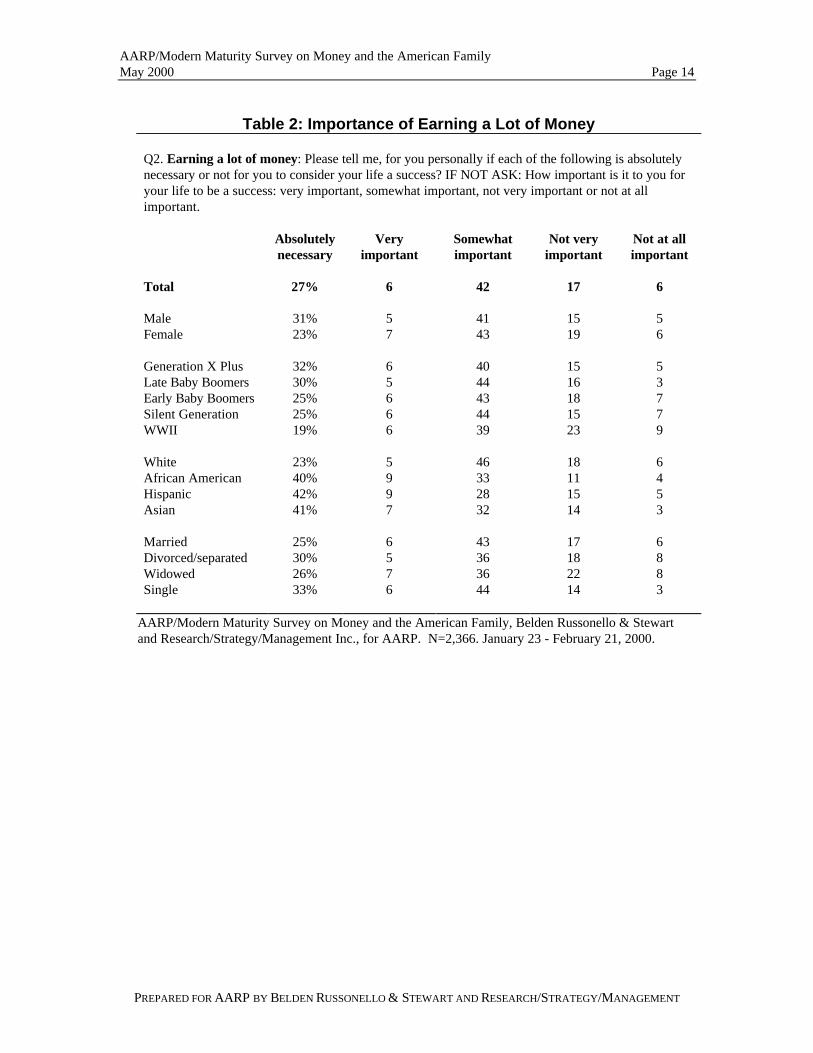
Earning a lot of money is rated as a much less important measure of success (27%absolutely necessary), as is seeing a lot of the world (26%). (See Table 2.)
Those who are more likely than their counterparts to consider earning a lot of money ameasure of a successful life include:
• African Americans, Hispanics, and Asian Americans
• men • younger generations (especially X Plusers)
• singles
AARP/Modern Maturity Survey on Money and the American FamilyMay 2000 Page 14
PREPARED FOR AARP BY BELDEN RUSSONELLO & STEWART AND RESEARCH/STRATEGY/MANAGEMENT
Table 2: Importance of Earning a Lot of Money
Q2. Earning a lot of money: Please tell me, for you personally if each of the following is absolutelynecessary or not for you to consider your life a success? IF NOT ASK: How important is it to you foryour life to be a success: very important, somewhat important, not very important or not at allimportant.
Absolutelynecessary
Veryimportant
Somewhatimportant
Not veryimportant
Not at allimportant
Total 27% 6 42 17 6
Male 31% 5 41 15 5Female 23% 7 43 19 6
Generation X Plus 32% 6 40 15 5Late Baby Boomers 30% 5 44 16 3Early Baby Boomers 25% 6 43 18 7Silent Generation 25% 6 44 15 7WWII 19% 6 39 23 9
White 23% 5 46 18 6African American 40% 9 33 11 4Hispanic 42% 9 28 15 5Asian 41% 7 32 14 3
Married 25% 6 43 17 6Divorced/separated 30% 5 36 18 8Widowed 26% 7 36 22 8Single 33% 6 44 14 3
AARP/Modern Maturity Survey on Money and the American Family, Belden Russonello & Stewartand Research/Strategy/Management Inc., for AARP. N=2,366. January 23 - February 21, 2000.
AARP/Modern Maturity Survey on Money and the American FamilyMay 2000 Page 15
PREPARED FOR AARP BY BELDEN RUSSONELLO & STEWART AND RESEARCH/STRATEGY/MANAGEMENT
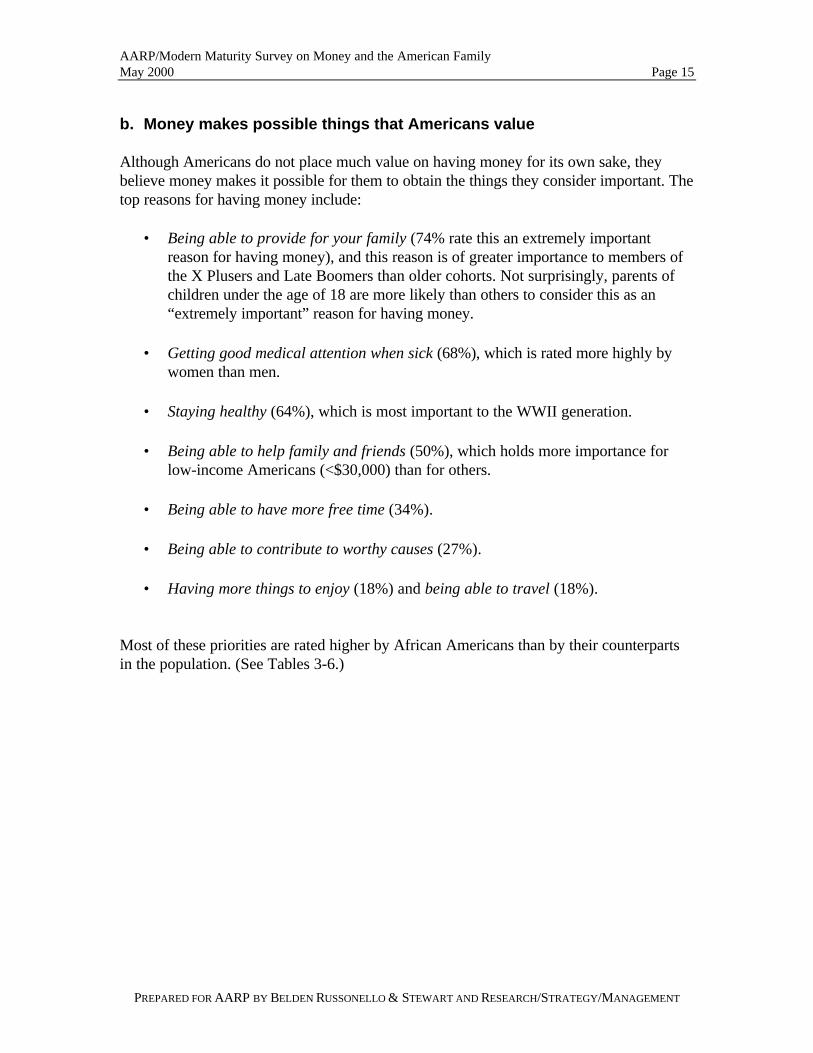
b. Money makes possible things that Americans value
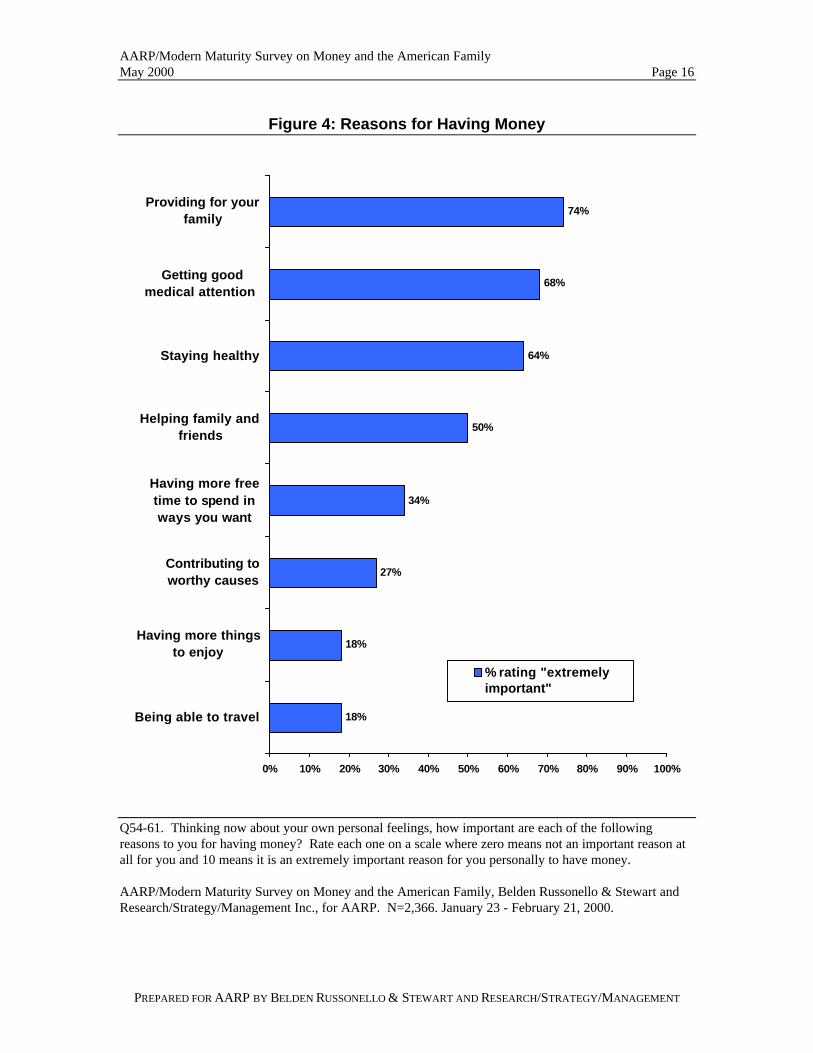
Although Americans do not place much value on having money for its own sake, theybelieve money makes it possible for them to obtain the things they consider important. Thetop reasons for having money include:
• Being able to provide for your family (74% rate this an extremely importantreason for having money), and this reason is of greater importance to members ofthe X Plusers and Late Boomers than older cohorts. Not surprisingly, parents ofchildren under the age of 18 are more likely than others to consider this as an“extremely important” reason for having money.
• Getting good medical attention when sick (68%), which is rated more highly by
women than men.
• Staying healthy (64%), which is most important to the WWII generation.
• Being able to help family and friends (50%), which holds more importance forlow-income Americans (<$30,000) than for others.
• Being able to have more free time (34%).
• Being able to contribute to worthy causes (27%).
• Having more things to enjoy (18%) and being able to travel (18%).
Most of these priorities are rated higher by African Americans than by their counterpartsin the population. (See Tables 3-6.)
AARP/Modern Maturity Survey on Money and the American FamilyMay 2000 Page 16
PREPARED FOR AARP BY BELDEN RUSSONELLO & STEWART AND RESEARCH/STRATEGY/MANAGEMENT
Figure 4: Reasons for Having Money
74%
68%
64%
50%
34%
27%
18%
18%
0% 10% 20% 30% 40% 50% 60% 70% 80% 90% 100%
Being able to travel
Having more thingsto enjoy
Contributing toworthy causes
Having more freetime to spend inways you want
Helping family andfriends
Staying healthy
Getting goodmedical attention
Providing for yourfamily
% rating "extremelyimportant"
Q54-61. Thinking now about your own personal feelings, how important are each of the followingreasons to you for having money? Rate each one on a scale where zero means not an important reason atall for you and 10 means it is an extremely important reason for you personally to have money.
AARP/Modern Maturity Survey on Money and the American Family, Belden Russonello & Stewart andResearch/Strategy/Management Inc., for AARP. N=2,366. January 23 - February 21, 2000.
AARP/Modern Maturity Survey on Money and the American FamilyMay 2000 Page 17
PREPARED FOR AARP BY BELDEN RUSSONELLO & STEWART AND RESEARCH/STRATEGY/MANAGEMENT
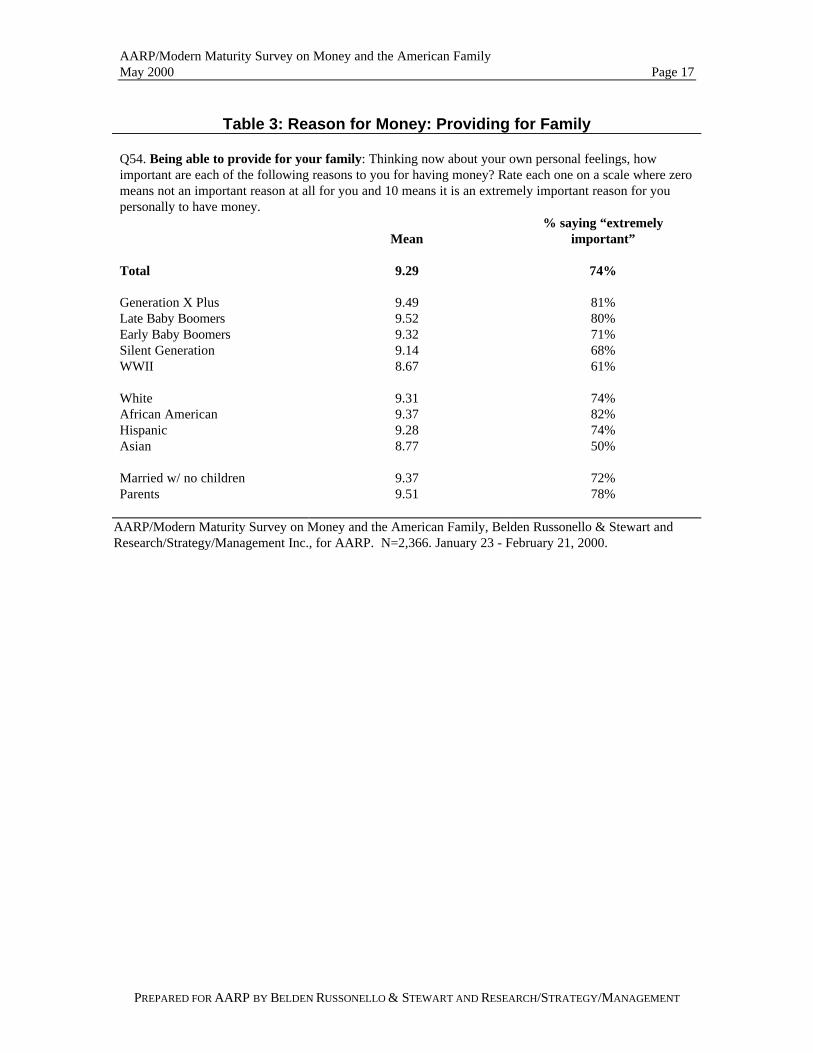
Table 3: Reason for Money: Providing for Family
Q54. Being able to provide for your family: Thinking now about your own personal feelings, howimportant are each of the following reasons to you for having money? Rate each one on a scale where zeromeans not an important reason at all for you and 10 means it is an extremely important reason for youpersonally to have money.
Mean% saying “extremely
important”
Total 9.29 74%
Generation X Plus 9.49 81%Late Baby Boomers 9.52 80%Early Baby Boomers 9.32 71%Silent Generation 9.14 68%WWII 8.67 61%
White 9.31 74%African American 9.37 82%Hispanic 9.28 74%Asian 8.77 50%
Married w/ no children 9.37 72%Parents 9.51 78%
AARP/Modern Maturity Survey on Money and the American Family, Belden Russonello & Stewart andResearch/Strategy/Management Inc., for AARP. N=2,366. January 23 - February 21, 2000.
AARP/Modern Maturity Survey on Money and the American FamilyMay 2000 Page 18
PREPARED FOR AARP BY BELDEN RUSSONELLO & STEWART AND RESEARCH/STRATEGY/MANAGEMENT
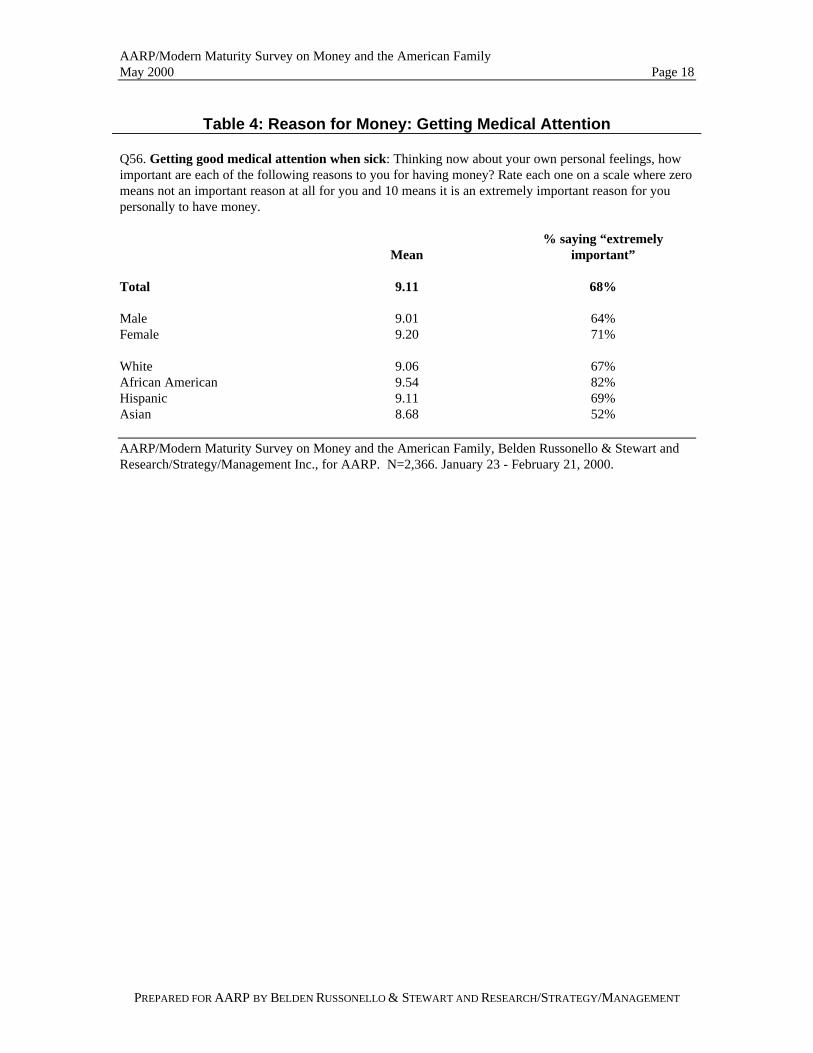
Table 4: Reason for Money: Getting Medical Attention
Q56. Getting good medical attention when sick: Thinking now about your own personal feelings, howimportant are each of the following reasons to you for having money? Rate each one on a scale where zeromeans not an important reason at all for you and 10 means it is an extremely important reason for youpersonally to have money.
Mean% saying “extremely
important”
Total 9.11 68%
Male 9.01 64%Female 9.20 71%
White 9.06 67%African American 9.54 82%Hispanic 9.11 69%Asian 8.68 52%
AARP/Modern Maturity Survey on Money and the American Family, Belden Russonello & Stewart andResearch/Strategy/Management Inc., for AARP. N=2,366. January 23 - February 21, 2000.
AARP/Modern Maturity Survey on Money and the American FamilyMay 2000 Page 19
PREPARED FOR AARP BY BELDEN RUSSONELLO & STEWART AND RESEARCH/STRATEGY/MANAGEMENT
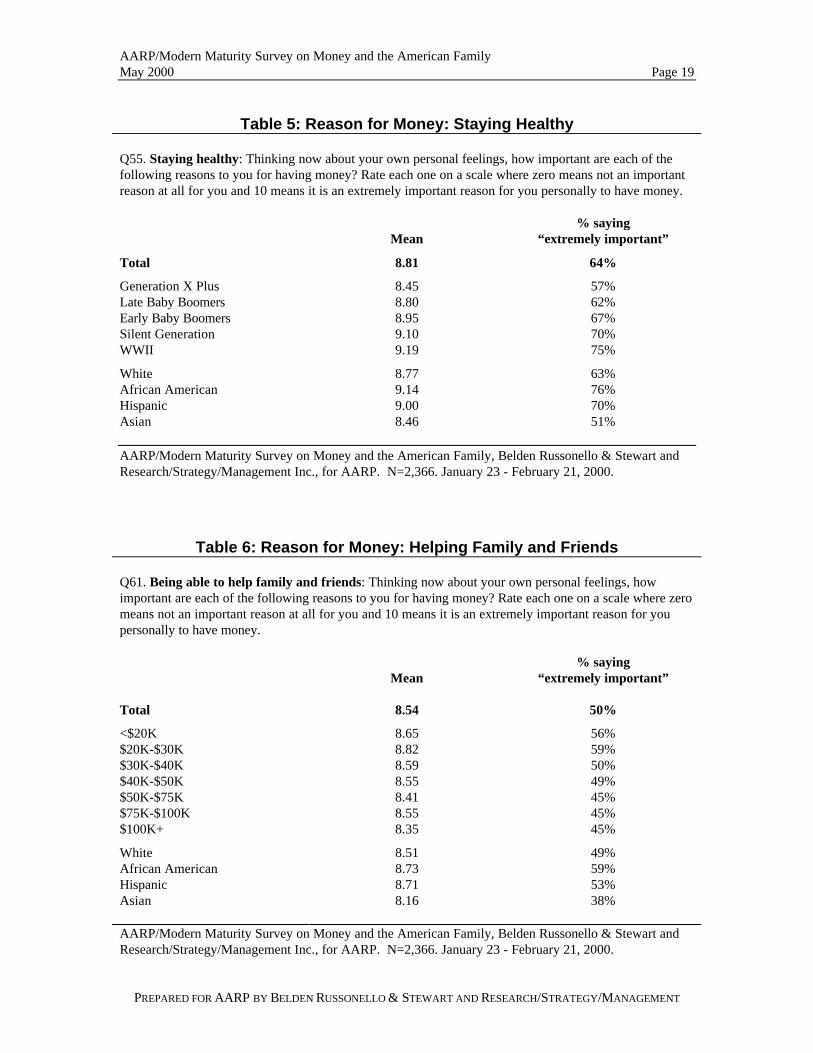
Table 5: Reason for Money: Staying Healthy
Q55. Staying healthy: Thinking now about your own personal feelings, how important are each of thefollowing reasons to you for having money? Rate each one on a scale where zero means not an importantreason at all for you and 10 means it is an extremely important reason for you personally to have money.
Mean% saying
“extremely important”
Total 8.81 64%
Generation X Plus 8.45 57%Late Baby Boomers 8.80 62%Early Baby Boomers 8.95 67%Silent Generation 9.10 70%WWII 9.19 75%
White 8.77 63%African American 9.14 76%Hispanic 9.00 70%Asian 8.46 51%
AARP/Modern Maturity Survey on Money and the American Family, Belden Russonello & Stewart andResearch/Strategy/Management Inc., for AARP. N=2,366. January 23 - February 21, 2000.
Table 6: Reason for Money: Helping Family and Friends
Q61. Being able to help family and friends: Thinking now about your own personal feelings, howimportant are each of the following reasons to you for having money? Rate each one on a scale where zeromeans not an important reason at all for you and 10 means it is an extremely important reason for youpersonally to have money.
Mean% saying
“extremely important”
Total 8.54 50%
<$20K 8.65 56%$20K-$30K 8.82 59%$30K-$40K 8.59 50%$40K-$50K 8.55 49%$50K-$75K 8.41 45%$75K-$100K 8.55 45%$100K+ 8.35 45%
White 8.51 49%African American 8.73 59%Hispanic 8.71 53%Asian 8.16 38%
AARP/Modern Maturity Survey on Money and the American Family, Belden Russonello & Stewart andResearch/Strategy/Management Inc., for AARP. N=2,366. January 23 - February 21, 2000.
AARP/Modern Maturity Survey on Money and the American FamilyMay 2000 Page 20
PREPARED FOR AARP BY BELDEN RUSSONELLO & STEWART AND RESEARCH/STRATEGY/MANAGEMENT
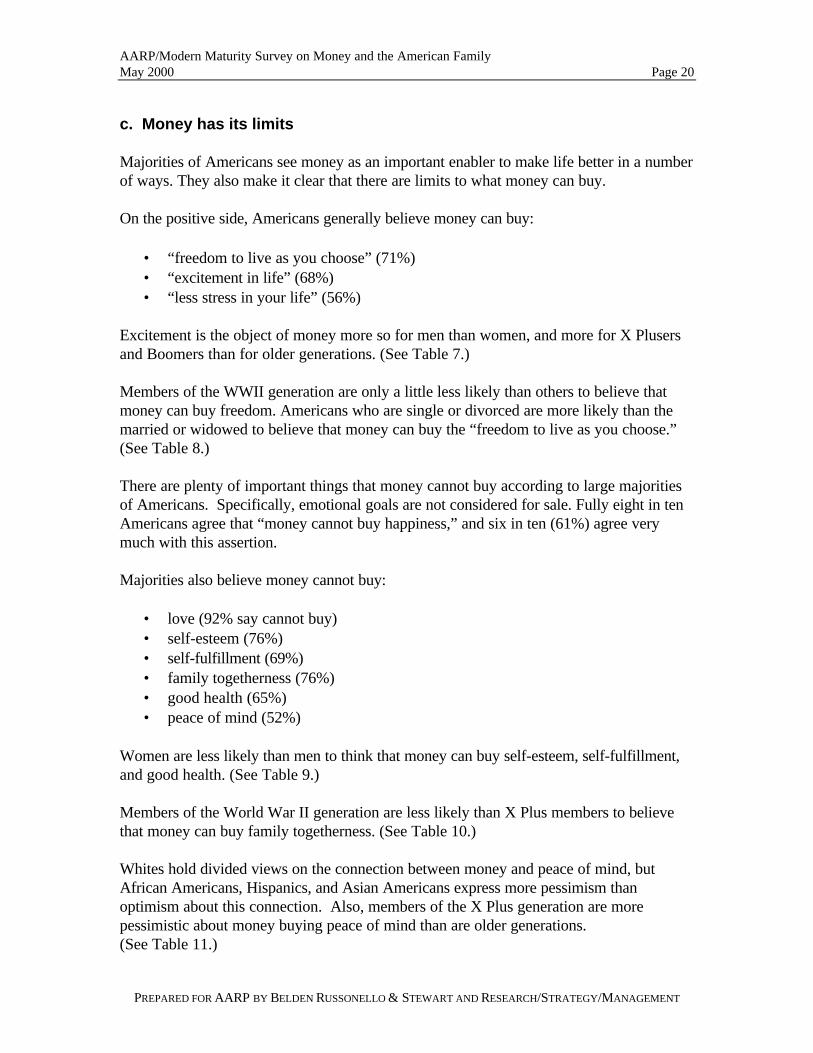
c. Money has its limits
Majorities of Americans see money as an important enabler to make life better in a numberof ways. They also make it clear that there are limits to what money can buy.
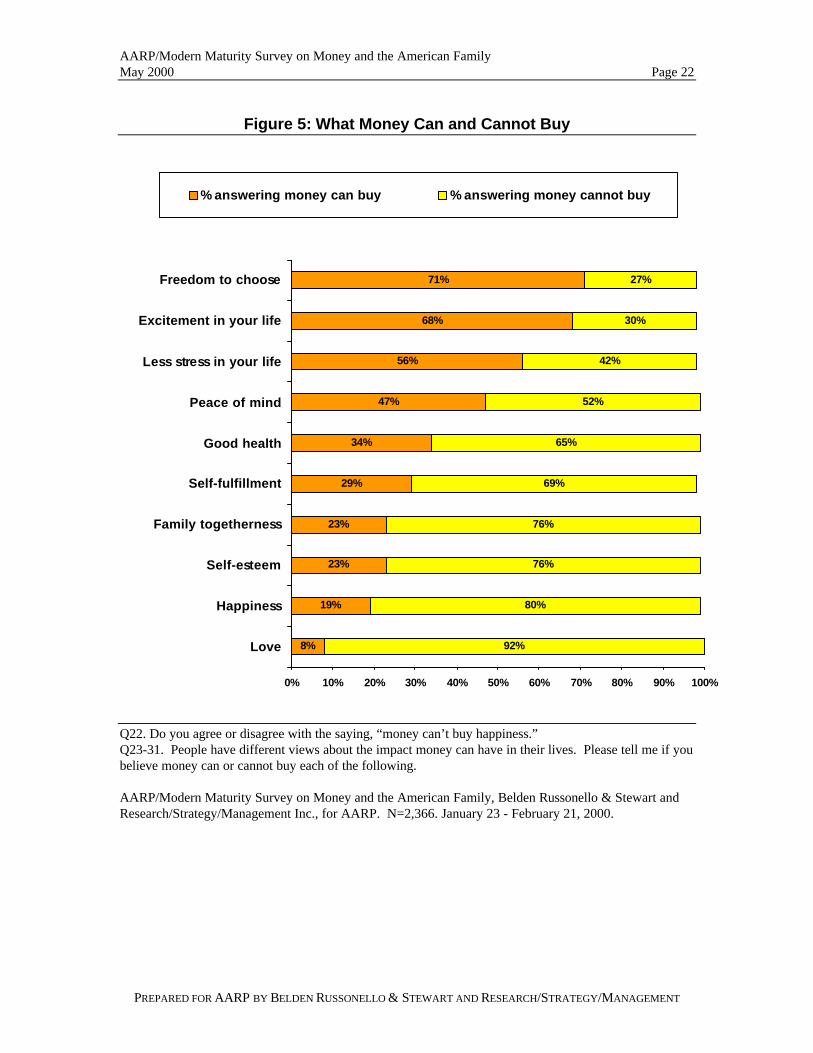
On the positive side, Americans generally believe money can buy:
• “freedom to live as you choose” (71%)• “excitement in life” (68%)• “less stress in your life” (56%)
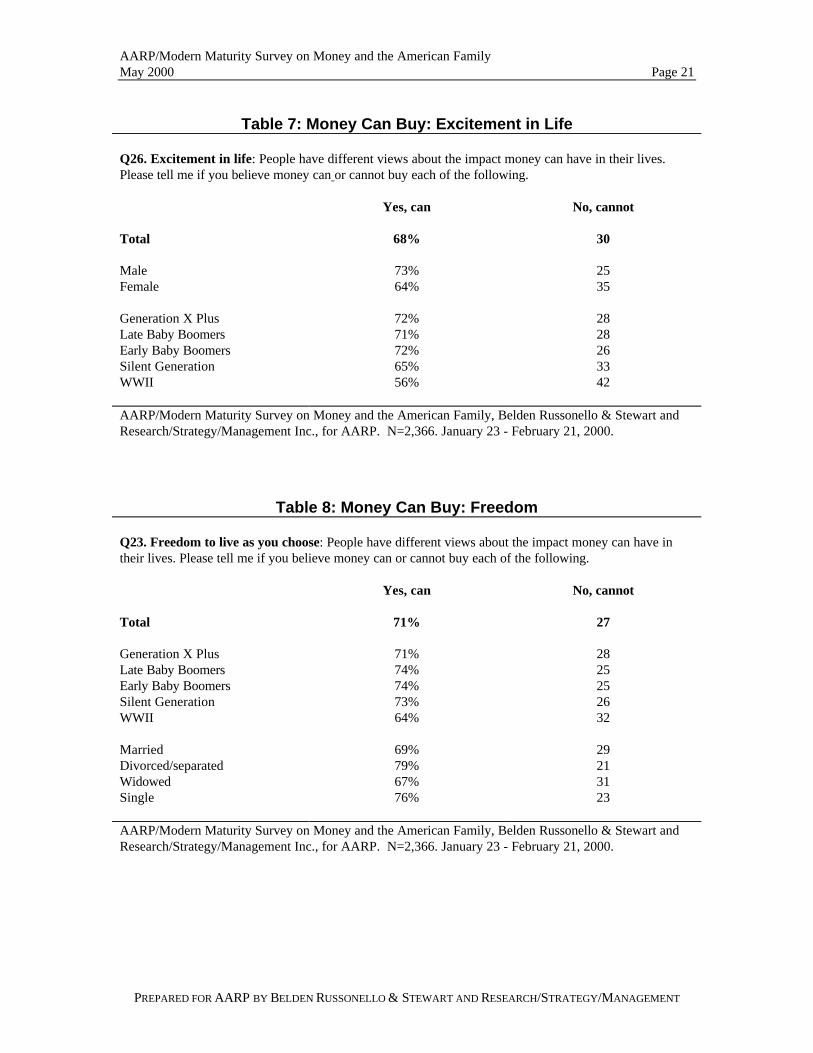
Excitement is the object of money more so for men than women, and more for X Plusersand Boomers than for older generations. (See Table 7.)
Members of the WWII generation are only a little less likely than others to believe thatmoney can buy freedom. Americans who are single or divorced are more likely than themarried or widowed to believe that money can buy the “freedom to live as you choose.”(See Table 8.)
There are plenty of important things that money cannot buy according to large majoritiesof Americans. Specifically, emotional goals are not considered for sale. Fully eight in tenAmericans agree that “money cannot buy happiness,” and six in ten (61%) agree verymuch with this assertion.
Majorities also believe money cannot buy:
• love (92% say cannot buy)• self-esteem (76%)• self-fulfillment (69%)• family togetherness (76%)• good health (65%)• peace of mind (52%)
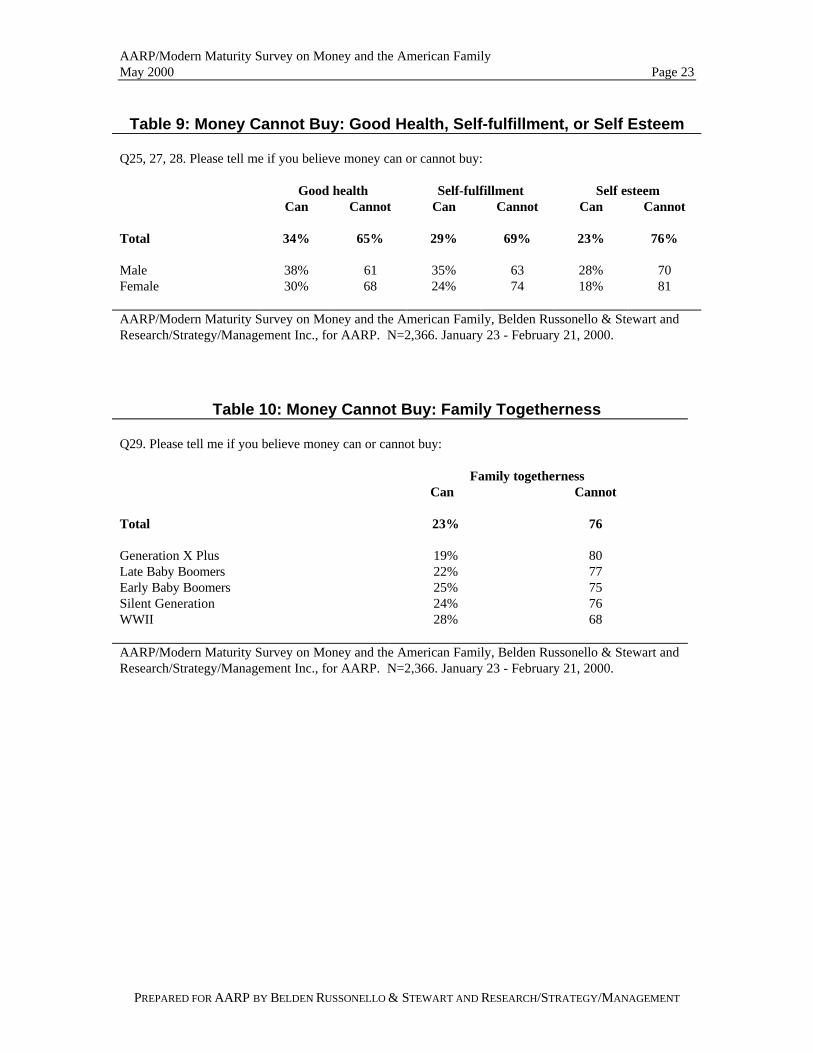
Women are less likely than men to think that money can buy self-esteem, self-fulfillment,and good health. (See Table 9.)
Members of the World War II generation are less likely than X Plus members to believethat money can buy family togetherness. (See Table 10.)
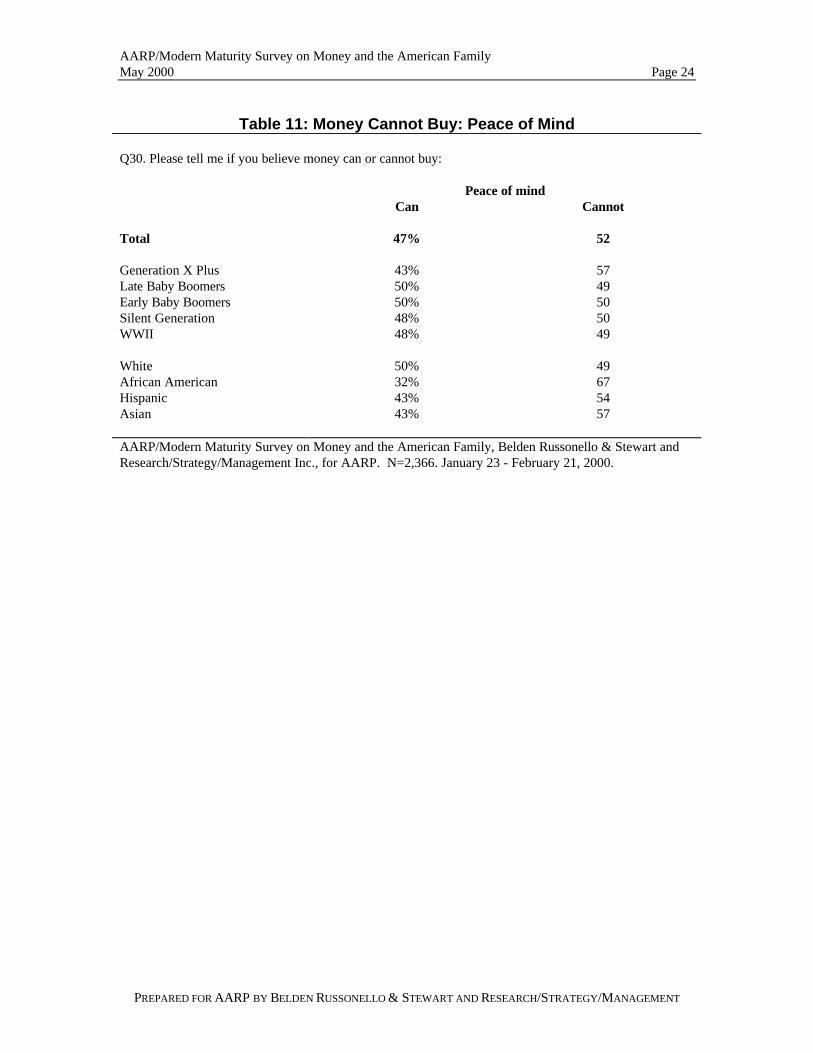
Whites hold divided views on the connection between money and peace of mind, butAfrican Americans, Hispanics, and Asian Americans express more pessimism thanoptimism about this connection. Also, members of the X Plus generation are morepessimistic about money buying peace of mind than are older generations.(See Table 11.)
AARP/Modern Maturity Survey on Money and the American FamilyMay 2000 Page 21
PREPARED FOR AARP BY BELDEN RUSSONELLO & STEWART AND RESEARCH/STRATEGY/MANAGEMENT
Table 7: Money Can Buy: Excitement in Life
Q26. Excitement in life: People have different views about the impact money can have in their lives.Please tell me if you believe money can or cannot buy each of the following.
Yes, can No, cannot
Total 68% 30
Male 73% 25Female 64% 35
Generation X Plus 72% 28Late Baby Boomers 71% 28Early Baby Boomers 72% 26Silent Generation 65% 33WWII 56% 42
AARP/Modern Maturity Survey on Money and the American Family, Belden Russonello & Stewart andResearch/Strategy/Management Inc., for AARP. N=2,366. January 23 - February 21, 2000.
Table 8: Money Can Buy: Freedom
Q23. Freedom to live as you choose: People have different views about the impact money can have intheir lives. Please tell me if you believe money can or cannot buy each of the following.
Yes, can No, cannot
Total 71% 27
Generation X Plus 71% 28Late Baby Boomers 74% 25Early Baby Boomers 74% 25Silent Generation 73% 26WWII 64% 32
Married 69% 29Divorced/separated 79% 21Widowed 67% 31Single 76% 23
AARP/Modern Maturity Survey on Money and the American Family, Belden Russonello & Stewart andResearch/Strategy/Management Inc., for AARP. N=2,366. January 23 - February 21, 2000.
AARP/Modern Maturity Survey on Money and the American FamilyMay 2000 Page 22
PREPARED FOR AARP BY BELDEN RUSSONELLO & STEWART AND RESEARCH/STRATEGY/MANAGEMENT
Figure 5: What Money Can and Cannot Buy
8%
19%
23%
23%
29%
34%
47%
56%
68%
71%
92%
80%
76%
76%
69%
65%
52%
42%
30%
27%
0% 10% 20% 30% 40% 50% 60% 70% 80% 90% 100%
Love
Happiness
Self-esteem
Family togetherness
Self-fulfillment
Good health
Peace of mind
Less stress in your life
Excitement in your life
Freedom to choose
% answering money can buy % answering money cannot buy
Q22. Do you agree or disagree with the saying, “money can’t buy happiness.”Q23-31. People have different views about the impact money can have in their lives. Please tell me if youbelieve money can or cannot buy each of the following.
AARP/Modern Maturity Survey on Money and the American Family, Belden Russonello & Stewart andResearch/Strategy/Management Inc., for AARP. N=2,366. January 23 - February 21, 2000.
AARP/Modern Maturity Survey on Money and the American FamilyMay 2000 Page 23
PREPARED FOR AARP BY BELDEN RUSSONELLO & STEWART AND RESEARCH/STRATEGY/MANAGEMENT
Table 9: Money Cannot Buy: Good Health, Self-fulfillment, or Self Esteem
Q25, 27, 28. Please tell me if you believe money can or cannot buy:
Good health Self-fulfillment Self esteemCan Cannot Can Cannot Can Cannot
Total 34% 65% 29% 69% 23% 76%
Male 38% 61 35% 63 28% 70Female 30% 68 24% 74 18% 81
AARP/Modern Maturity Survey on Money and the American Family, Belden Russonello & Stewart andResearch/Strategy/Management Inc., for AARP. N=2,366. January 23 - February 21, 2000.
Table 10: Money Cannot Buy: Family Togetherness
Q29. Please tell me if you believe money can or cannot buy:
Family togethernessCan Cannot
Total 23% 76
Generation X Plus 19% 80Late Baby Boomers 22% 77Early Baby Boomers 25% 75Silent Generation 24% 76WWII 28% 68
AARP/Modern Maturity Survey on Money and the American Family, Belden Russonello & Stewart andResearch/Strategy/Management Inc., for AARP. N=2,366. January 23 - February 21, 2000.
AARP/Modern Maturity Survey on Money and the American FamilyMay 2000 Page 24
PREPARED FOR AARP BY BELDEN RUSSONELLO & STEWART AND RESEARCH/STRATEGY/MANAGEMENT
Table 11: Money Cannot Buy: Peace of Mind
Q30. Please tell me if you believe money can or cannot buy:
Peace of mindCan Cannot
Total 47% 52
Generation X Plus 43% 57Late Baby Boomers 50% 49Early Baby Boomers 50% 50Silent Generation 48% 50WWII 48% 49
White 50% 49African American 32% 67Hispanic 43% 54Asian 43% 57
AARP/Modern Maturity Survey on Money and the American Family, Belden Russonello & Stewart andResearch/Strategy/Management Inc., for AARP. N=2,366. January 23 - February 21, 2000.
AARP/Modern Maturity Survey on Money and the American FamilyMay 2000 Page 25
PREPARED FOR AARP BY BELDEN RUSSONELLO & STEWART AND RESEARCH/STRATEGY/MANAGEMENT
3. Americans want to be wealthy but not be like the wealthy
Yes, most Americans would like to be millionaires, and many report they would be likelyto share newfound wealth with others. However, the desire to be wealthy is tempered bythe widespread belief that wealth often changes a person for the worse.
a. Desire to be wealthy
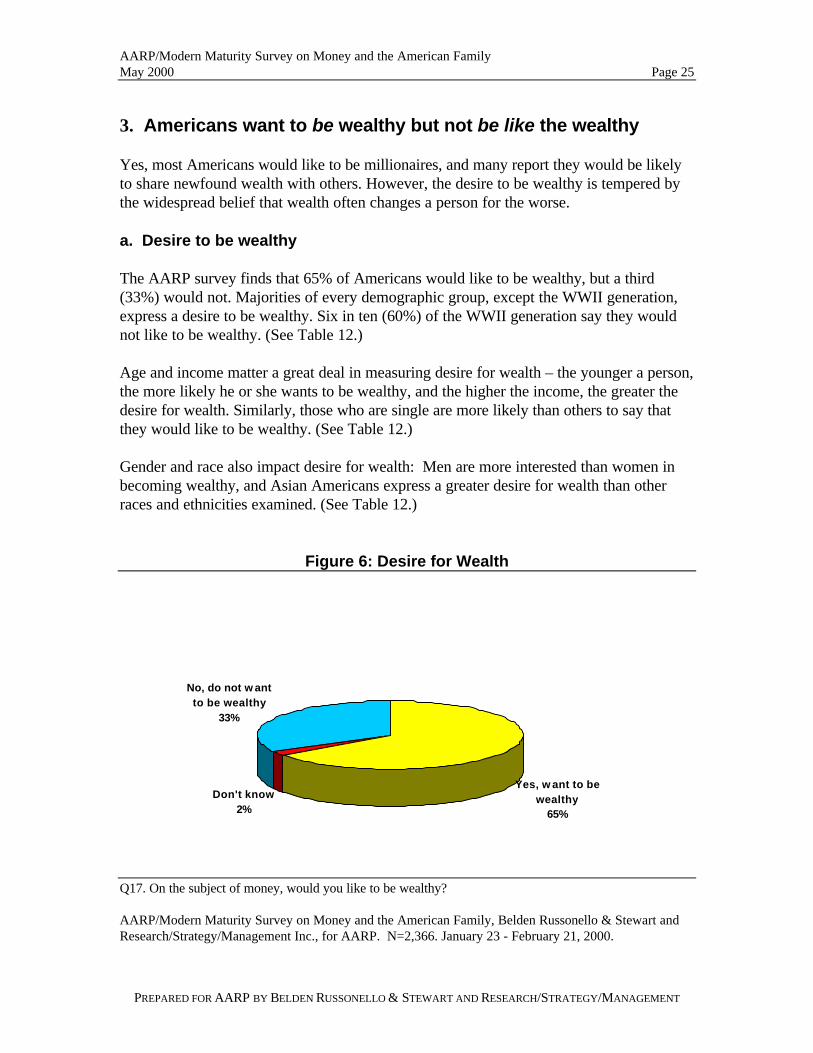
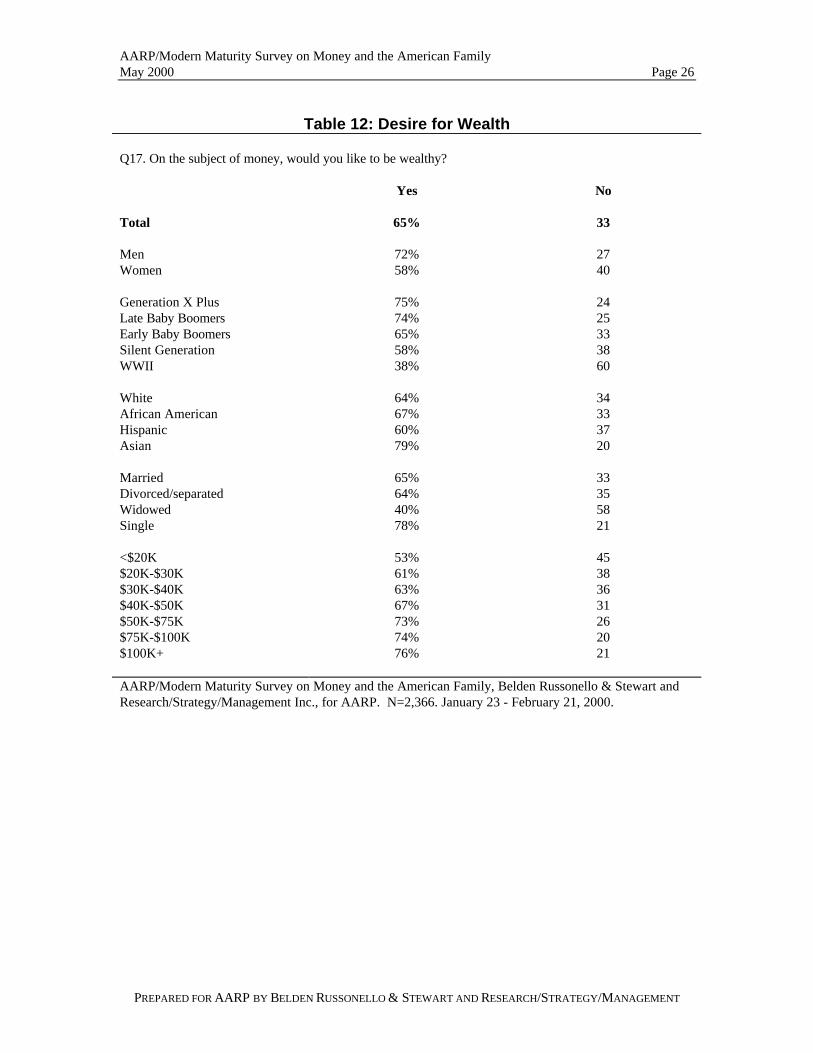
The AARP survey finds that 65% of Americans would like to be wealthy, but a third(33%) would not. Majorities of every demographic group, except the WWII generation,express a desire to be wealthy. Six in ten (60%) of the WWII generation say they wouldnot like to be wealthy. (See Table 12.)
Age and income matter a great deal in measuring desire for wealth – the younger a person,the more likely he or she wants to be wealthy, and the higher the income, the greater thedesire for wealth. Similarly, those who are single are more likely than others to say thatthey would like to be wealthy. (See Table 12.)
Gender and race also impact desire for wealth: Men are more interested than women inbecoming wealthy, and Asian Americans express a greater desire for wealth than otherraces and ethnicities examined. (See Table 12.)
Figure 6: Desire for Wealth
Yes, w ant to be wealthy
65%
Don't know2%
No, do not w ant to be wealthy
33%
Q17. On the subject of money, would you like to be wealthy?
AARP/Modern Maturity Survey on Money and the American Family, Belden Russonello & Stewart andResearch/Strategy/Management Inc., for AARP. N=2,366. January 23 - February 21, 2000.
AARP/Modern Maturity Survey on Money and the American FamilyMay 2000 Page 26
PREPARED FOR AARP BY BELDEN RUSSONELLO & STEWART AND RESEARCH/STRATEGY/MANAGEMENT
Table 12: Desire for Wealth
Q17. On the subject of money, would you like to be wealthy?
Yes No
Total 65% 33
Men 72% 27Women 58% 40
Generation X Plus 75% 24Late Baby Boomers 74% 25Early Baby Boomers 65% 33Silent Generation 58% 38WWII 38% 60
White 64% 34African American 67% 33Hispanic 60% 37Asian 79% 20
Married 65% 33Divorced/separated 64% 35Widowed 40% 58Single 78% 21
<$20K 53% 45$20K-$30K 61% 38$30K-$40K 63% 36$40K-$50K 67% 31$50K-$75K 73% 26$75K-$100K 74% 20$100K+ 76% 21
AARP/Modern Maturity Survey on Money and the American Family, Belden Russonello & Stewart andResearch/Strategy/Management Inc., for AARP. N=2,366. January 23 - February 21, 2000.
AARP/Modern Maturity Survey on Money and the American FamilyMay 2000 Page 27
PREPARED FOR AARP BY BELDEN RUSSONELLO & STEWART AND RESEARCH/STRATEGY/MANAGEMENT
b. What to do with a million dollars
While most Americans would like to become wealthy, they seem under no illusions aboutwhat it takes to achieve wealth. Becoming wealthy is mostly a matter of hard work (74%)rather than a matter of luck (21%), according to most Americans.
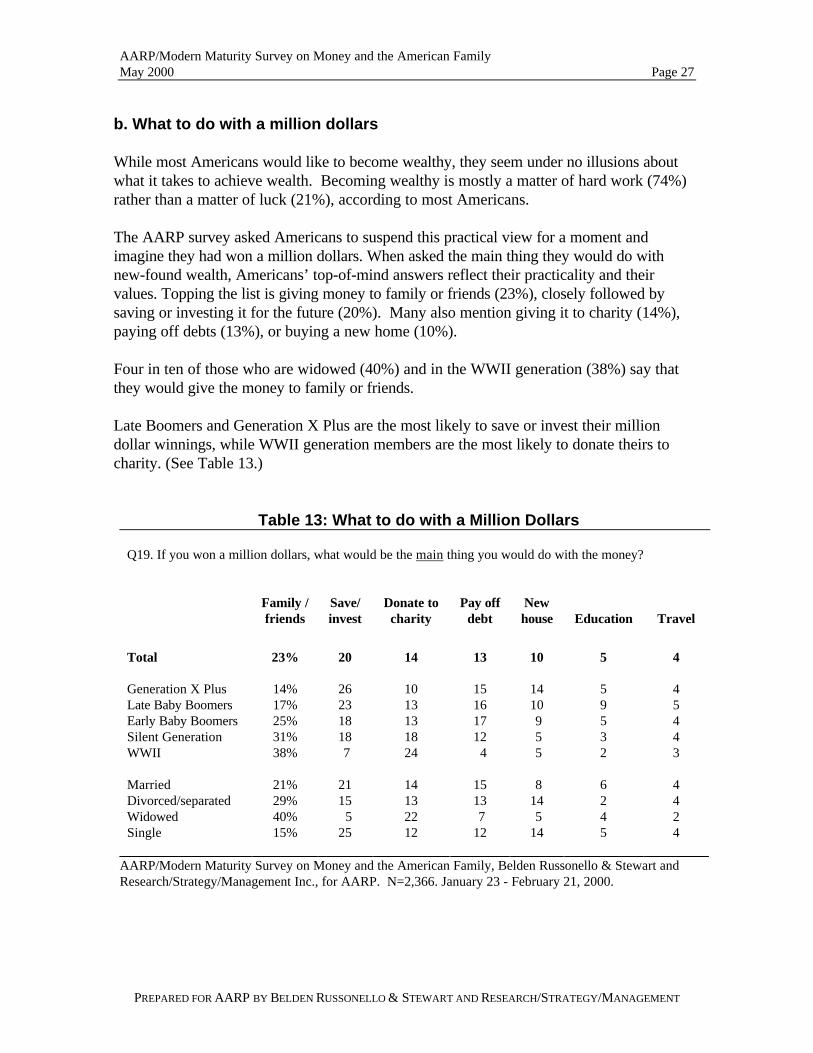
The AARP survey asked Americans to suspend this practical view for a moment andimagine they had won a million dollars. When asked the main thing they would do withnew-found wealth, Americans’ top-of-mind answers reflect their practicality and theirvalues. Topping the list is giving money to family or friends (23%), closely followed bysaving or investing it for the future (20%). Many also mention giving it to charity (14%),paying off debts (13%), or buying a new home (10%).
Four in ten of those who are widowed (40%) and in the WWII generation (38%) say thatthey would give the money to family or friends.
Late Boomers and Generation X Plus are the most likely to save or invest their milliondollar winnings, while WWII generation members are the most likely to donate theirs tocharity. (See Table 13.)
Table 13: What to do with a Million Dollars
Q19. If you won a million dollars, what would be the main thing you would do with the money?
Family /friends
Save/invest
Donate tocharity
Pay offdebt
Newhouse Education Travel
Total 23% 20 14 13 10 5 4
Generation X Plus 14% 26 10 15 14 5 4Late Baby Boomers 17% 23 13 16 10 9 5Early Baby Boomers 25% 18 13 17 9 5 4Silent Generation 31% 18 18 12 5 3 4WWII 38% 7 24 4 5 2 3
Married 21% 21 14 15 8 6 4Divorced/separated 29% 15 13 13 14 2 4Widowed 40% 5 22 7 5 4 2Single 15% 25 12 12 14 5 4
AARP/Modern Maturity Survey on Money and the American Family, Belden Russonello & Stewart andResearch/Strategy/Management Inc., for AARP. N=2,366. January 23 - February 21, 2000.
AARP/Modern Maturity Survey on Money and the American FamilyMay 2000 Page 28
PREPARED FOR AARP BY BELDEN RUSSONELLO & STEWART AND RESEARCH/STRATEGY/MANAGEMENT
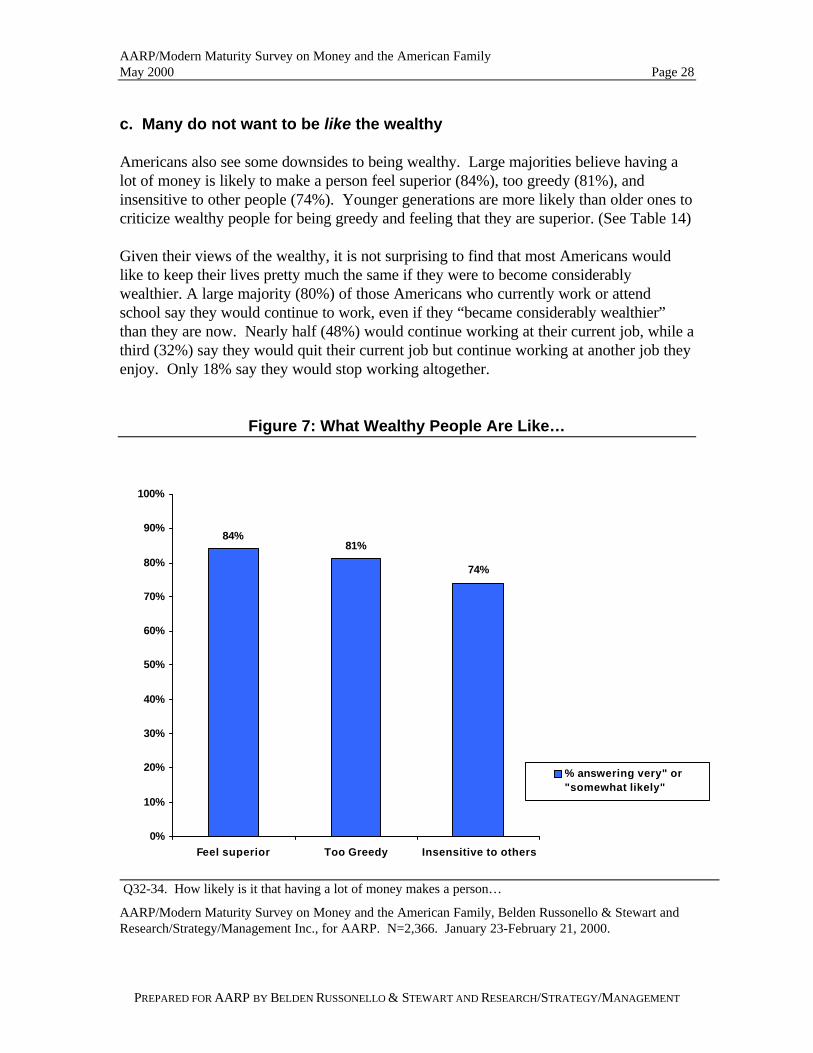
c. Many do not want to be like the wealthy
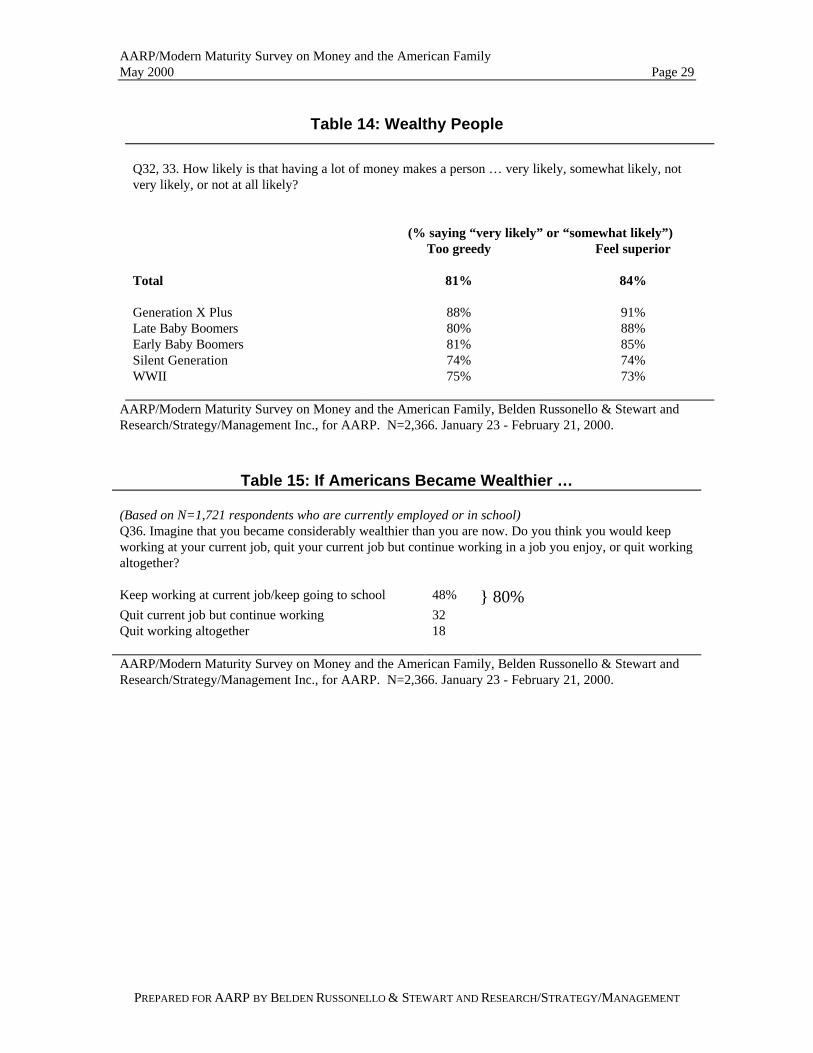
Americans also see some downsides to being wealthy. Large majorities believe having alot of money is likely to make a person feel superior (84%), too greedy (81%), andinsensitive to other people (74%). Younger generations are more likely than older ones tocriticize wealthy people for being greedy and feeling that they are superior. (See Table 14)
Given their views of the wealthy, it is not surprising to find that most Americans wouldlike to keep their lives pretty much the same if they were to become considerablywealthier. A large majority (80%) of those Americans who currently work or attendschool say they would continue to work, even if they “became considerably wealthier”than they are now. Nearly half (48%) would continue working at their current job, while athird (32%) say they would quit their current job but continue working at another job theyenjoy. Only 18% say they would stop working altogether.
Figure 7: What Wealthy People Are Like…
84%81%
74%
0%
10%
20%
30%
40%
50%
60%
70%
80%
90%
100%
Feel superior Too Greedy Insensitive to others
% answering very" or"somewhat likely"
Q32-34. How likely is it that having a lot of money makes a person…
AARP/Modern Maturity Survey on Money and the American Family, Belden Russonello & Stewart andResearch/Strategy/Management Inc., for AARP. N=2,366. January 23-February 21, 2000.
AARP/Modern Maturity Survey on Money and the American FamilyMay 2000 Page 29
PREPARED FOR AARP BY BELDEN RUSSONELLO & STEWART AND RESEARCH/STRATEGY/MANAGEMENT
Table 14: Wealthy People
AARP/Modern Maturity Survey on Money and the American Family, Belden Russonello & Stewart andResearch/Strategy/Management Inc., for AARP. N=2,366. January 23 - February 21, 2000.
Table 15: If Americans Became Wealthier …
(Based on N=1,721 respondents who are currently employed or in school)Q36. Imagine that you became considerably wealthier than you are now. Do you think you would keepworking at your current job, quit your current job but continue working in a job you enjoy, or quit workingaltogether?
Keep working at current job/keep going to school 48% } 80%Quit current job but continue working 32Quit working altogether 18
AARP/Modern Maturity Survey on Money and the American Family, Belden Russonello & Stewart andResearch/Strategy/Management Inc., for AARP. N=2,366. January 23 - February 21, 2000.
Q32, 33. How likely is that having a lot of money makes a person … very likely, somewhat likely, notvery likely, or not at all likely?
(% saying “very likely” or “somewhat likely”)Too greedy Feel superior
Total 81% 84%
Generation X Plus 88% 91%Late Baby Boomers 80% 88%Early Baby Boomers 81% 85%Silent Generation 74% 74%WWII 75% 73%
AARP/Modern Maturity Survey on Money and the American FamilyMay 2000 Page 30
PREPARED FOR AARP BY BELDEN RUSSONELLO & STEWART AND RESEARCH/STRATEGY/MANAGEMENT
4. How money makes a difference to families
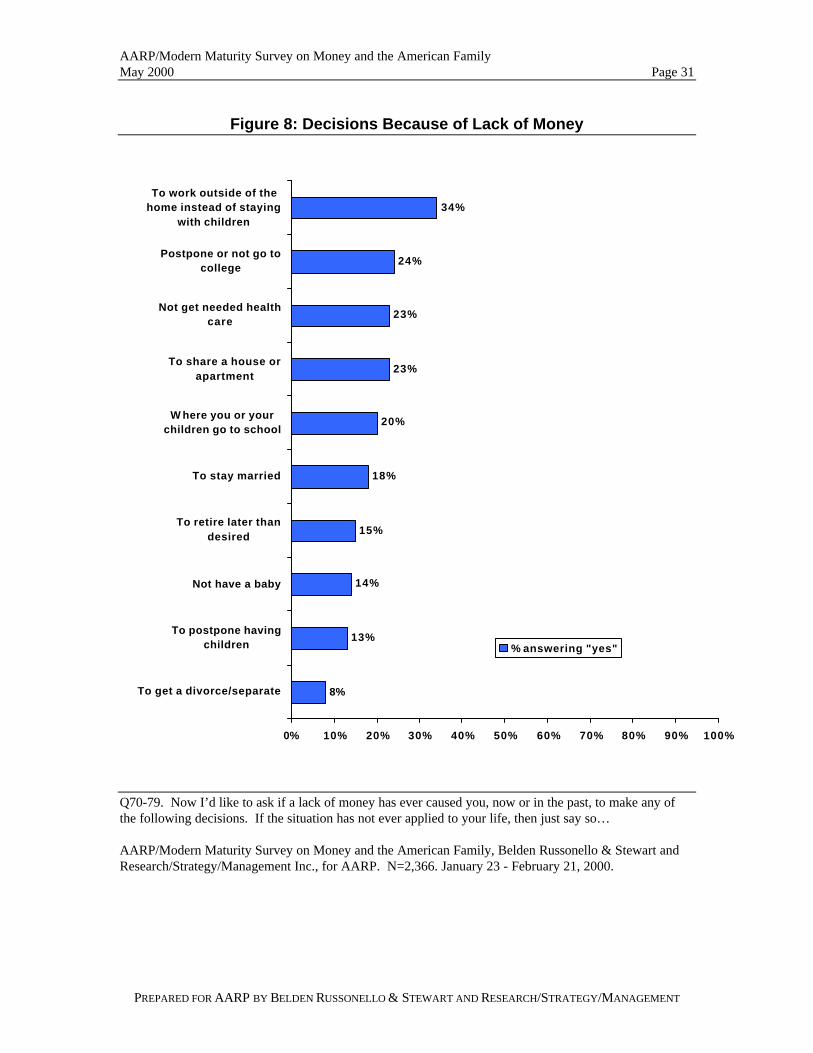
Although having money is not as important to Americans as their relationships with familyand friends, for some segments of the population having or not having money has made amajor difference in their lives. Seven in ten report lack of money dictated at least oneimportant decision in their lives. In particular, lack of money has led some Americans tomake the following life choices:
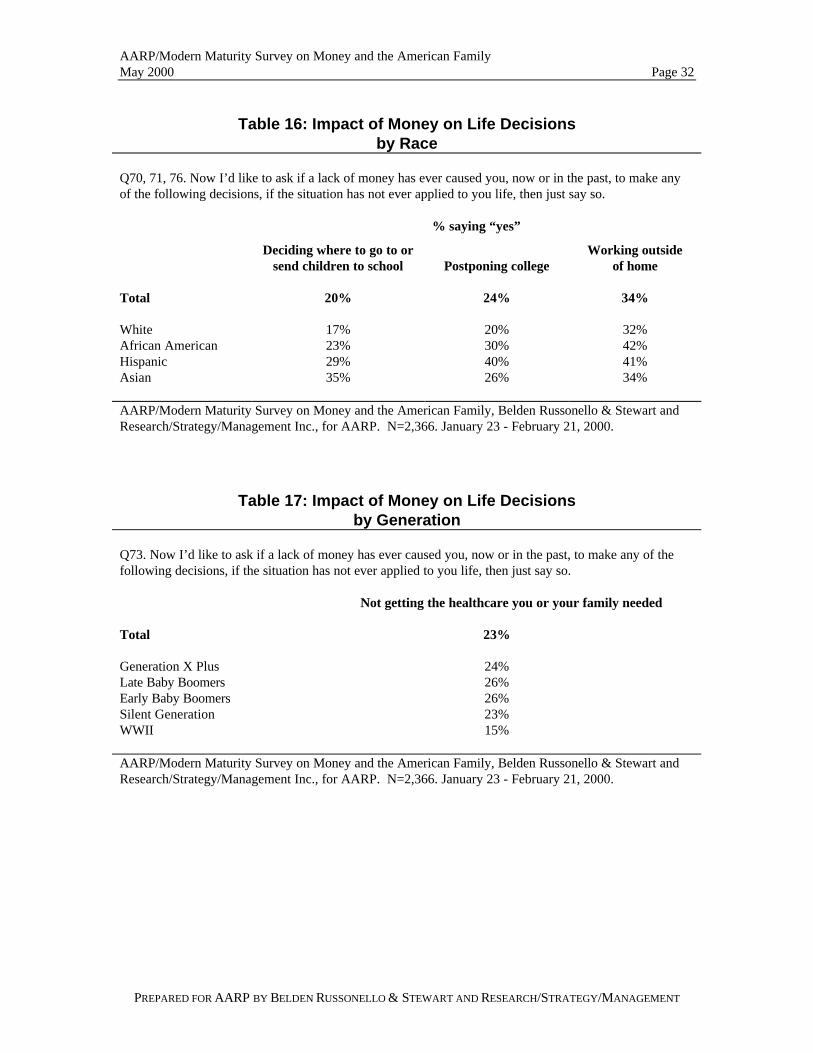
• Thirty-four percent decided to work outside the home instead of staying homewith children. The proportions of African Americans and Hispanics who havemade this decision are higher than those of other groups. (See Table 16.)
• Twenty-four percent have postponed or not gone to college because they could
not foot the bill. This is more true for Hispanics than for other groups. (See Table16.)
• Twenty-three percent have gone without the health care they themselves or their
family members needed when money was tight. This is less the case among WWIIgeneration than among younger generations. (See Table 17.)
• Twenty-three percent have decided to share a house or apartment instead of living
alone.
• Two in ten (20%) have made a decision about where to send a child to schoolbecause of a lack of money. Hispanics and Asian Americans have made more ofthese types of decisions than have other groups. (See Table 16.)
• Two in ten (18%) have decided to stay married instead of getting a divorce, while
8% have decided to get divorced or separated because of lack of money.
AARP/Modern Maturity Survey on Money and the American FamilyMay 2000 Page 31
PREPARED FOR AARP BY BELDEN RUSSONELLO & STEWART AND RESEARCH/STRATEGY/MANAGEMENT
Figure 8: Decisions Because of Lack of Money
8%
13%
14%
15%
18%
20%
23%
23%
24%
34%
0% 10% 20% 30% 40% 50% 60% 70% 80% 90% 100%
To get a divorce/separate
To postpone havingchildren
Not have a baby
To retire later thandesired
To stay married
W here you or yourchildren go to school
To share a house orapartment
Not get needed healthcare
Postpone or not go tocollege
To work outside of thehome instead of staying
with children
% answering "yes"
Q70-79. Now I’d like to ask if a lack of money has ever caused you, now or in the past, to make any ofthe following decisions. If the situation has not ever applied to your life, then just say so…
AARP/Modern Maturity Survey on Money and the American Family, Belden Russonello & Stewart andResearch/Strategy/Management Inc., for AARP. N=2,366. January 23 - February 21, 2000.
AARP/Modern Maturity Survey on Money and the American FamilyMay 2000 Page 32
PREPARED FOR AARP BY BELDEN RUSSONELLO & STEWART AND RESEARCH/STRATEGY/MANAGEMENT
Table 16: Impact of Money on Life Decisionsby Race
Q70, 71, 76. Now I’d like to ask if a lack of money has ever caused you, now or in the past, to make anyof the following decisions, if the situation has not ever applied to you life, then just say so.
% saying “yes”
Deciding where to go to orsend children to school Postponing college
Working outsideof home
Total 20% 24% 34%
White 17% 20% 32%African American 23% 30% 42%Hispanic 29% 40% 41%Asian 35% 26% 34%
AARP/Modern Maturity Survey on Money and the American Family, Belden Russonello & Stewart andResearch/Strategy/Management Inc., for AARP. N=2,366. January 23 - February 21, 2000.
Table 17: Impact of Money on Life Decisionsby Generation
Q73. Now I’d like to ask if a lack of money has ever caused you, now or in the past, to make any of thefollowing decisions, if the situation has not ever applied to you life, then just say so.
Not getting the healthcare you or your family needed
Total 23%
Generation X Plus 24%Late Baby Boomers 26%Early Baby Boomers 26%Silent Generation 23%WWII 15%
AARP/Modern Maturity Survey on Money and the American Family, Belden Russonello & Stewart andResearch/Strategy/Management Inc., for AARP. N=2,366. January 23 - February 21, 2000.
AARP/Modern Maturity Survey on Money and the American FamilyMay 2000 Page 33
PREPARED FOR AARP BY BELDEN RUSSONELLO & STEWART AND RESEARCH/STRATEGY/MANAGEMENT
5. Optimism about the future and retirement
a. Optimism about retirement
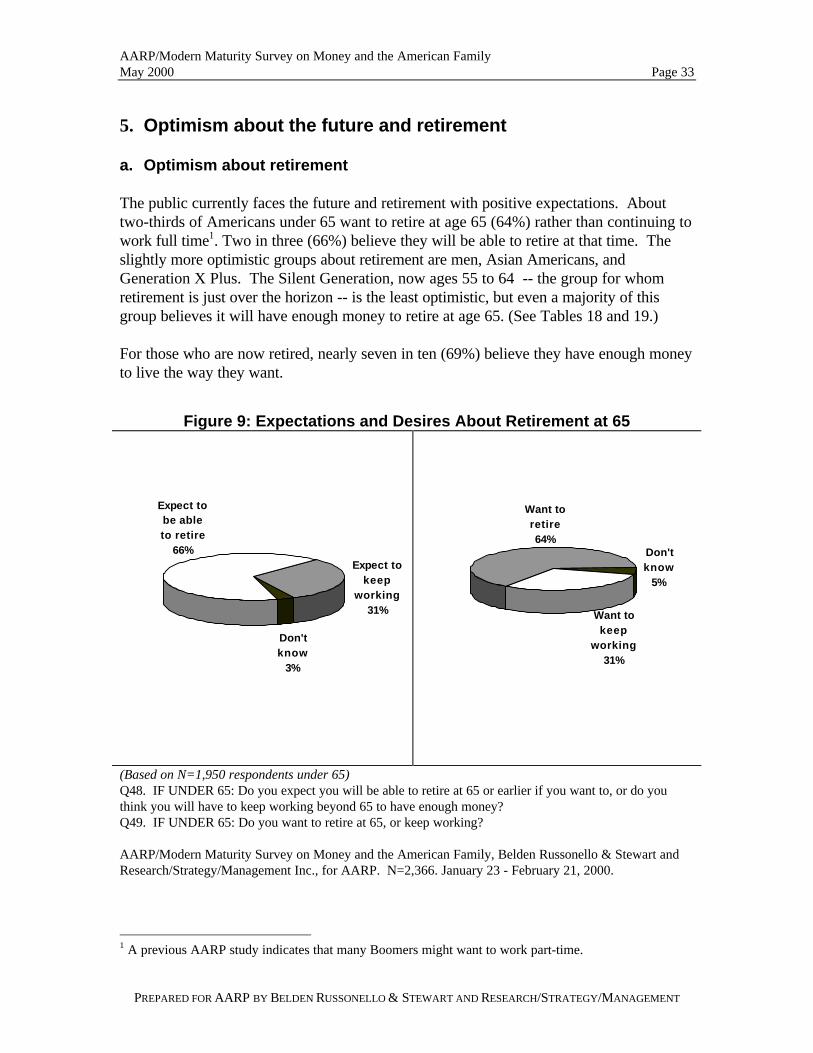
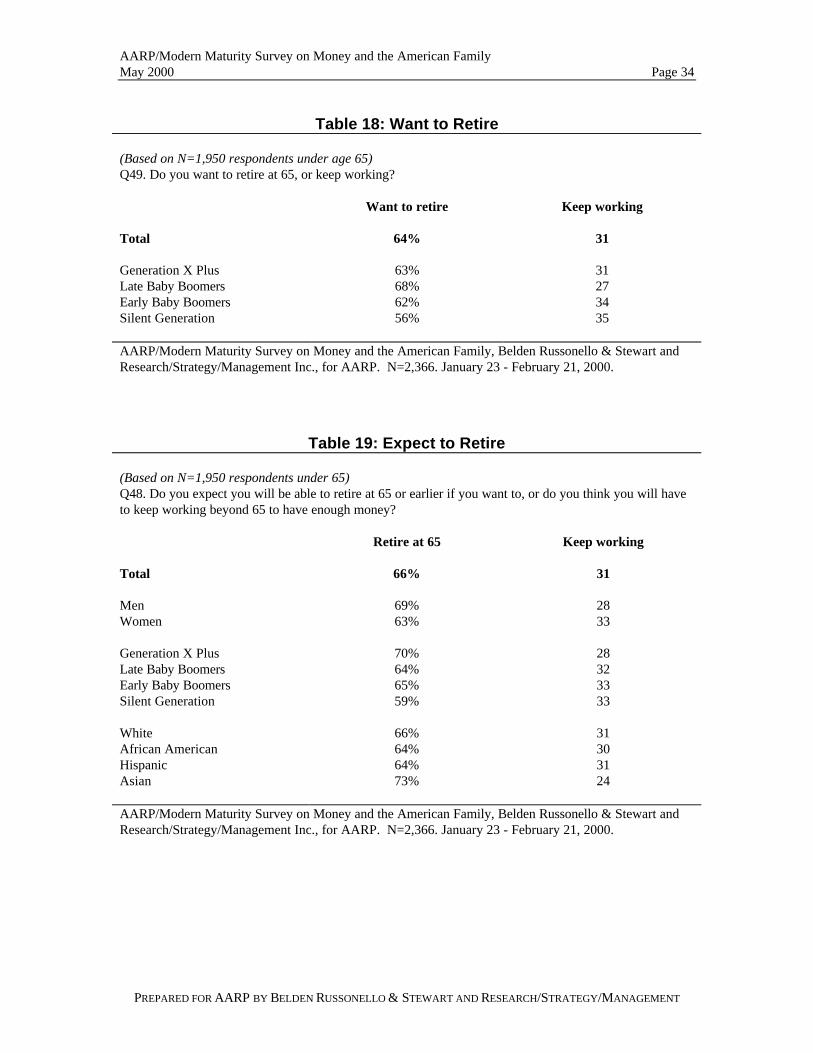
The public currently faces the future and retirement with positive expectations. Abouttwo-thirds of Americans under 65 want to retire at age 65 (64%) rather than continuing towork full time1. Two in three (66%) believe they will be able to retire at that time. Theslightly more optimistic groups about retirement are men, Asian Americans, andGeneration X Plus. The Silent Generation, now ages 55 to 64 -- the group for whomretirement is just over the horizon -- is the least optimistic, but even a majority of thisgroup believes it will have enough money to retire at age 65. (See Tables 18 and 19.)
For those who are now retired, nearly seven in ten (69%) believe they have enough moneyto live the way they want.
1 A previous AARP study indicates that many Boomers might want to work part-time.
Figure 9: Expectations and Desires About Retirement at 65
Expect to be able to retire
66%
Don't know
3%
Expect to keep
working31%
Want to retire 64%
Don't know
5%
Want to keep
working31%
(Based on N=1,950 respondents under 65)Q48. IF UNDER 65: Do you expect you will be able to retire at 65 or earlier if you want to, or do youthink you will have to keep working beyond 65 to have enough money?Q49. IF UNDER 65: Do you want to retire at 65, or keep working?
AARP/Modern Maturity Survey on Money and the American Family, Belden Russonello & Stewart andResearch/Strategy/Management Inc., for AARP. N=2,366. January 23 - February 21, 2000.
AARP/Modern Maturity Survey on Money and the American FamilyMay 2000 Page 34
PREPARED FOR AARP BY BELDEN RUSSONELLO & STEWART AND RESEARCH/STRATEGY/MANAGEMENT
Table 18: Want to Retire
(Based on N=1,950 respondents under age 65)Q49. Do you want to retire at 65, or keep working?
Want to retire Keep working
Total 64% 31
Generation X Plus 63% 31Late Baby Boomers 68% 27Early Baby Boomers 62% 34Silent Generation 56% 35
AARP/Modern Maturity Survey on Money and the American Family, Belden Russonello & Stewart andResearch/Strategy/Management Inc., for AARP. N=2,366. January 23 - February 21, 2000.
Table 19: Expect to Retire
(Based on N=1,950 respondents under 65)Q48. Do you expect you will be able to retire at 65 or earlier if you want to, or do you think you will haveto keep working beyond 65 to have enough money?
Retire at 65 Keep working
Total 66% 31
Men 69% 28Women 63% 33
Generation X Plus 70% 28Late Baby Boomers 64% 32Early Baby Boomers 65% 33Silent Generation 59% 33
White 66% 31African American 64% 30Hispanic 64% 31Asian 73% 24
AARP/Modern Maturity Survey on Money and the American Family, Belden Russonello & Stewart andResearch/Strategy/Management Inc., for AARP. N=2,366. January 23 - February 21, 2000.
AARP/Modern Maturity Survey on Money and the American FamilyMay 2000 Page 35
PREPARED FOR AARP BY BELDEN RUSSONELLO & STEWART AND RESEARCH/STRATEGY/MANAGEMENT
b. Living on their own in retirement
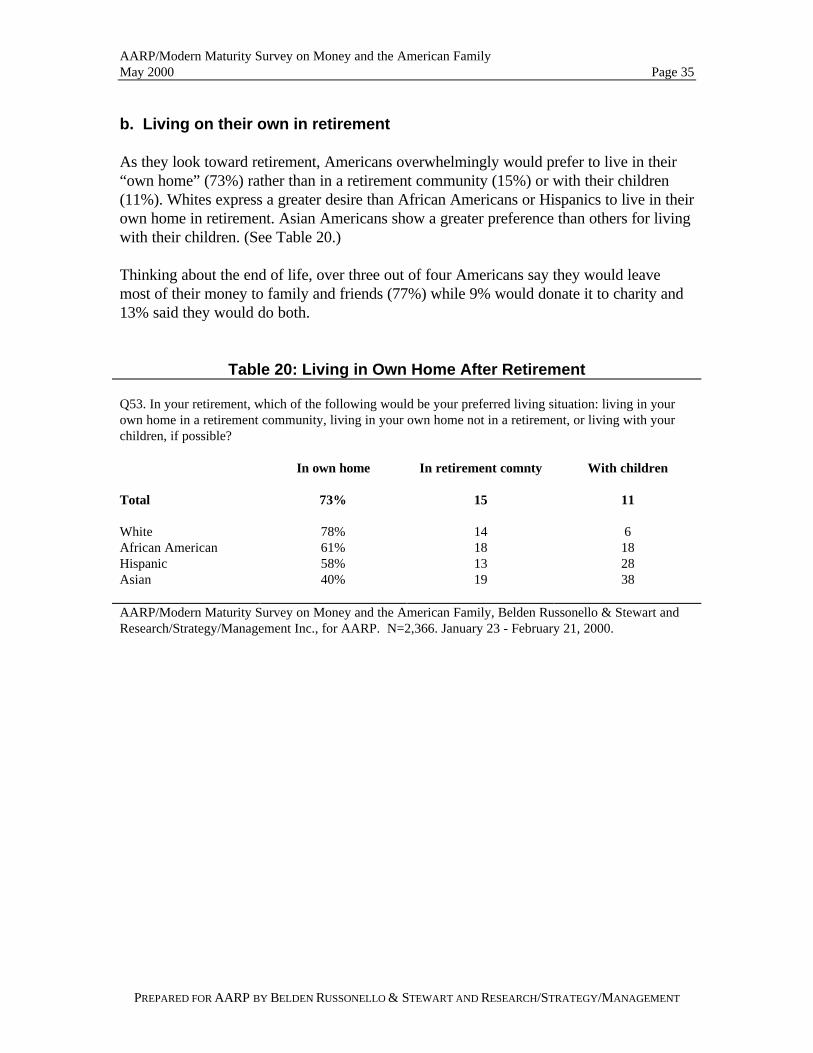
As they look toward retirement, Americans overwhelmingly would prefer to live in their“own home” (73%) rather than in a retirement community (15%) or with their children(11%). Whites express a greater desire than African Americans or Hispanics to live in theirown home in retirement. Asian Americans show a greater preference than others for livingwith their children. (See Table 20.)
Thinking about the end of life, over three out of four Americans say they would leavemost of their money to family and friends (77%) while 9% would donate it to charity and13% said they would do both.
Table 20: Living in Own Home After Retirement
Q53. In your retirement, which of the following would be your preferred living situation: living in yourown home in a retirement community, living in your own home not in a retirement, or living with yourchildren, if possible?
In own home In retirement comnty With children
Total 73% 15 11
White 78% 14 6African American 61% 18 18Hispanic 58% 13 28Asian 40% 19 38
AARP/Modern Maturity Survey on Money and the American Family, Belden Russonello & Stewart andResearch/Strategy/Management Inc., for AARP. N=2,366. January 23 - February 21, 2000.
AARP/Modern Maturity Survey on Money and the American FamilyMay 2000 Page 36
PREPARED FOR AARP BY BELDEN RUSSONELLO & STEWART AND RESEARCH/STRATEGY/MANAGEMENT
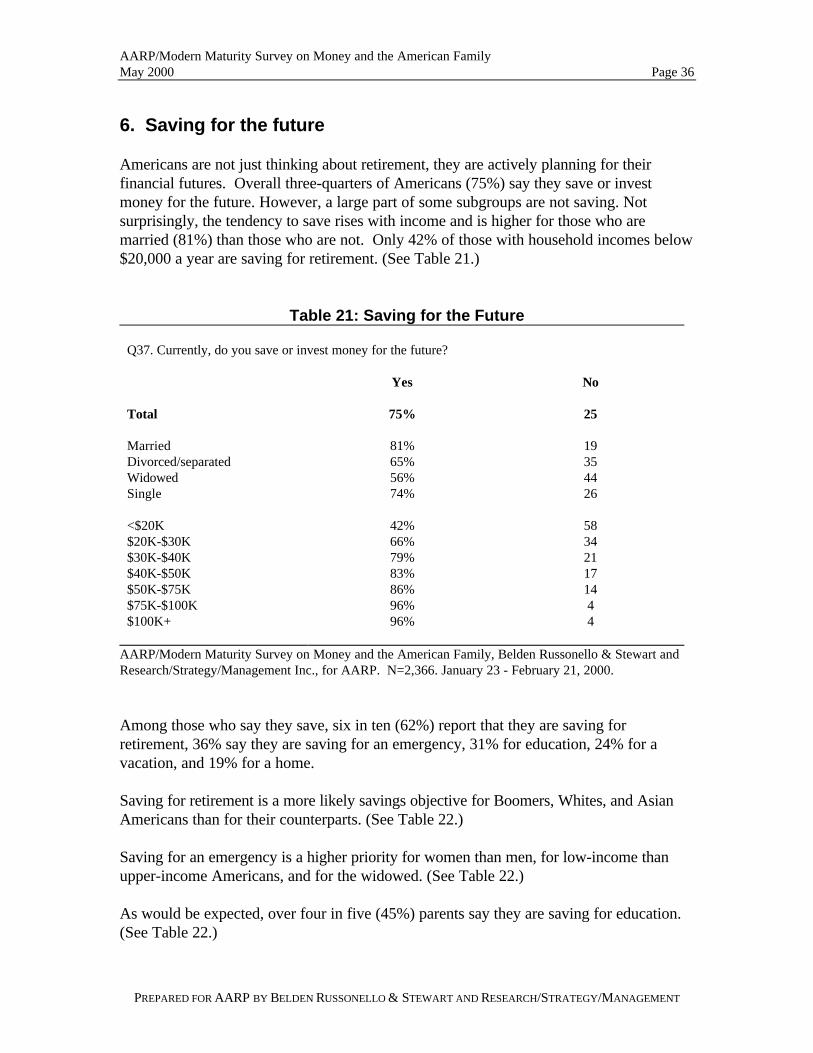
6. Saving for the future
Americans are not just thinking about retirement, they are actively planning for theirfinancial futures. Overall three-quarters of Americans (75%) say they save or investmoney for the future. However, a large part of some subgroups are not saving. Notsurprisingly, the tendency to save rises with income and is higher for those who aremarried (81%) than those who are not. Only 42% of those with household incomes below$20,000 a year are saving for retirement. (See Table 21.)
Table 21: Saving for the Future
Q37. Currently, do you save or invest money for the future?
Yes No
Total 75% 25
Married 81% 19Divorced/separated 65% 35Widowed 56% 44Single 74% 26
<$20K 42% 58$20K-$30K 66% 34$30K-$40K 79% 21$40K-$50K 83% 17$50K-$75K 86% 14$75K-$100K 96% 4$100K+ 96% 4
AARP/Modern Maturity Survey on Money and the American Family, Belden Russonello & Stewart andResearch/Strategy/Management Inc., for AARP. N=2,366. January 23 - February 21, 2000.
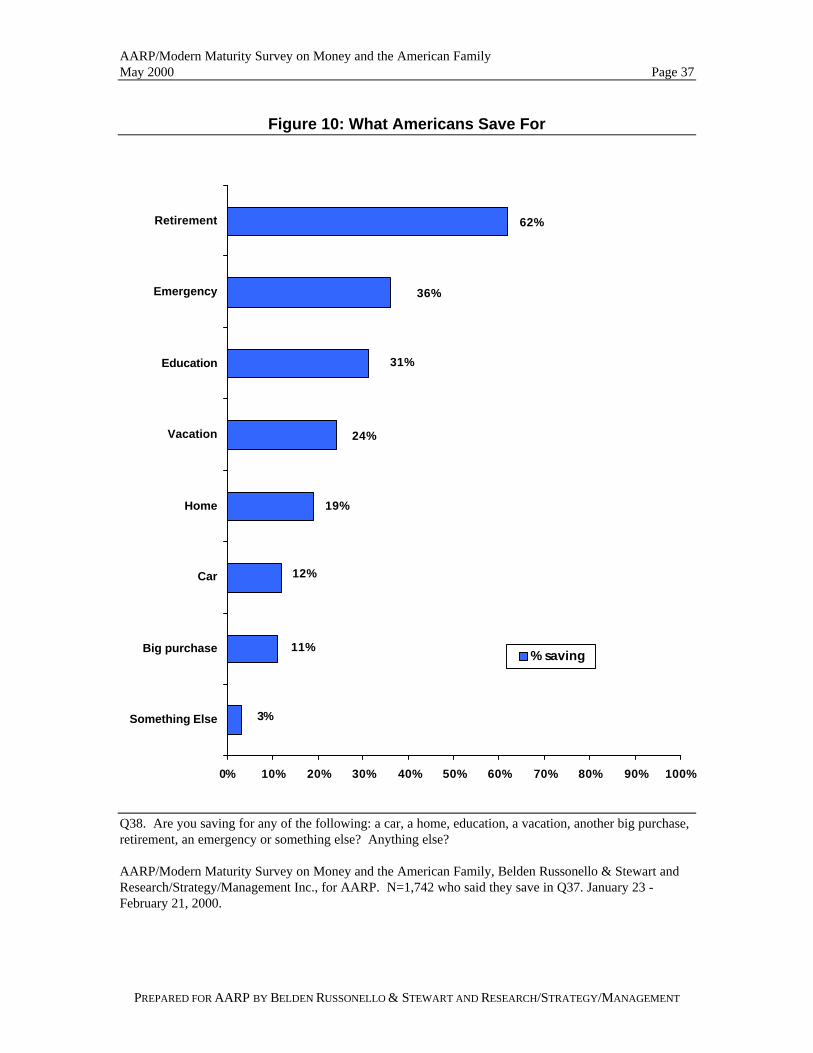
Among those who say they save, six in ten (62%) report that they are saving forretirement, 36% say they are saving for an emergency, 31% for education, 24% for avacation, and 19% for a home.
Saving for retirement is a more likely savings objective for Boomers, Whites, and AsianAmericans than for their counterparts. (See Table 22.)
Saving for an emergency is a higher priority for women than men, for low-income thanupper-income Americans, and for the widowed. (See Table 22.)
As would be expected, over four in five (45%) parents say they are saving for education.(See Table 22.)
AARP/Modern Maturity Survey on Money and the American FamilyMay 2000 Page 37
PREPARED FOR AARP BY BELDEN RUSSONELLO & STEWART AND RESEARCH/STRATEGY/MANAGEMENT
Figure 10: What Americans Save For
3%
11%
12%
19%
24%
31%
36%
62%
0% 10% 20% 30% 40% 50% 60% 70% 80% 90% 100%
Something Else
Big purchase
Car
Home
Vacation
Education
Emergency
Retirement
% saving
Q38. Are you saving for any of the following: a car, a home, education, a vacation, another big purchase,retirement, an emergency or something else? Anything else?
AARP/Modern Maturity Survey on Money and the American Family, Belden Russonello & Stewart andResearch/Strategy/Management Inc., for AARP. N=1,742 who said they save in Q37. January 23 -February 21, 2000.
AARP/Modern Maturity Survey on Money and the American Family May 2000 Page 38
PREPARED FOR AARP BY BELDEN RUSSONELLO & STEWART AND RESEARCH/STRATEGY /MANAGEMENT
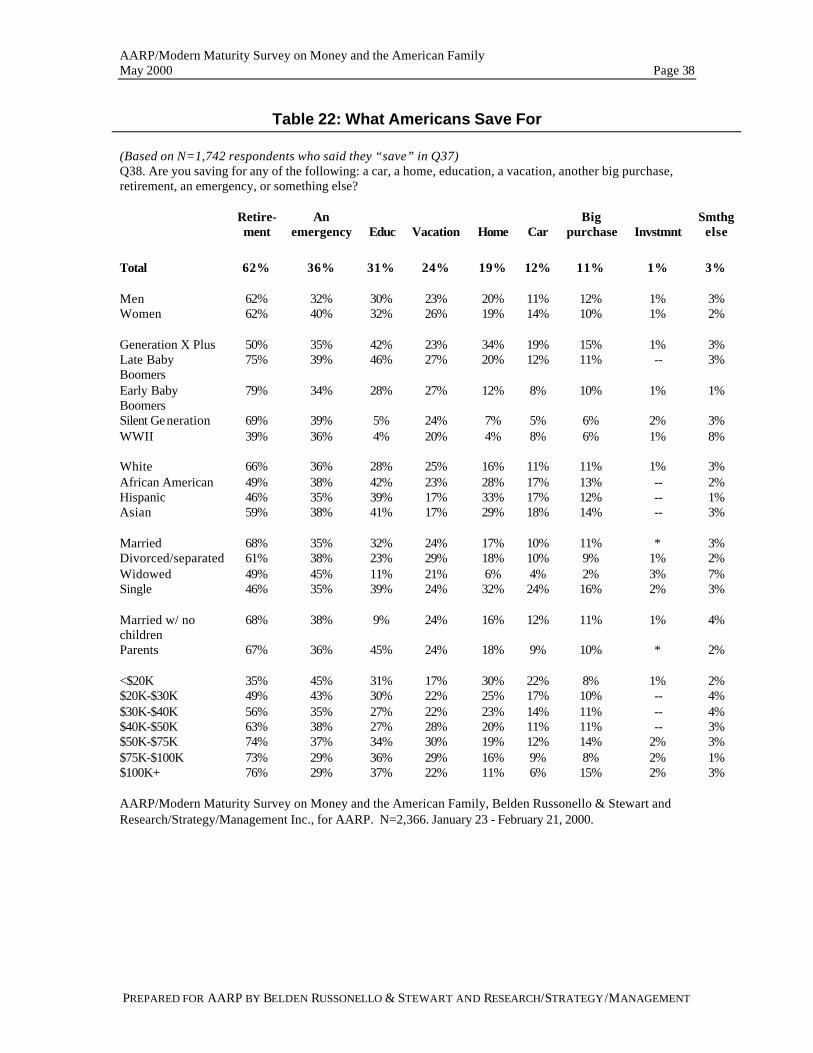
Table 22: What Americans Save For
AARP/Modern Maturity Survey on Money and the American Family, Belden Russonello & Stewart and Research/Strategy/Management Inc., for AARP. N=2,366. January 23 - February 21, 2000.
(Based on N=1,742 respondents who said they “save” in Q37) Q38. Are you saving for any of the following: a car, a home, education, a vacation, another big purchase, retirement, an emergency, or something else?
Retire- ment
An emergency
Educ
Vacation
Home
Car
Big purchase
Invstmnt
Smthg else
Total 62% 36% 31% 24% 19% 12% 11% 1% 3% Men 62% 32% 30% 23% 20% 11% 12% 1% 3% Women 62% 40% 32% 26% 19% 14% 10% 1% 2% Generation X Plus 50% 35% 42% 23% 34% 19% 15% 1% 3% Late Baby Boomers
75% 39% 46% 27% 20% 12% 11% -- 3%
Early Baby Boomers
79% 34% 28% 27% 12% 8% 10% 1% 1%
Silent Generation 69% 39% 5% 24% 7% 5% 6% 2% 3% WWII 39% 36% 4% 20% 4% 8% 6% 1% 8% White 66% 36% 28% 25% 16% 11% 11% 1% 3% African American 49% 38% 42% 23% 28% 17% 13% -- 2% Hispanic 46% 35% 39% 17% 33% 17% 12% -- 1% Asian 59% 38% 41% 17% 29% 18% 14% -- 3% Married 68% 35% 32% 24% 17% 10% 11% * 3% Divorced/separated 61% 38% 23% 29% 18% 10% 9% 1% 2% Widowed 49% 45% 11% 21% 6% 4% 2% 3% 7% Single 46% 35% 39% 24% 32% 24% 16% 2% 3% Married w/ no children
68% 38% 9% 24% 16% 12% 11% 1% 4%
Parents 67% 36% 45% 24% 18% 9% 10% * 2% <$20K 35% 45% 31% 17% 30% 22% 8% 1% 2% $20K-$30K 49% 43% 30% 22% 25% 17% 10% -- 4% $30K-$40K 56% 35% 27% 22% 23% 14% 11% -- 4% $40K-$50K 63% 38% 27% 28% 20% 11% 11% -- 3% $50K-$75K 74% 37% 34% 30% 19% 12% 14% 2% 3% $75K-$100K 73% 29% 36% 29% 16% 9% 8% 2% 1% $100K+ 76% 29% 37% 22% 11% 6% 15% 2% 3%
AARP/Modern Maturity Survey on Money and the American FamilyMay 2000 Page 39
PREPARED FOR AARP BY BELDEN RUSSONELLO & STEWART AND RESEARCH/STRATEGY/MANAGEMENT
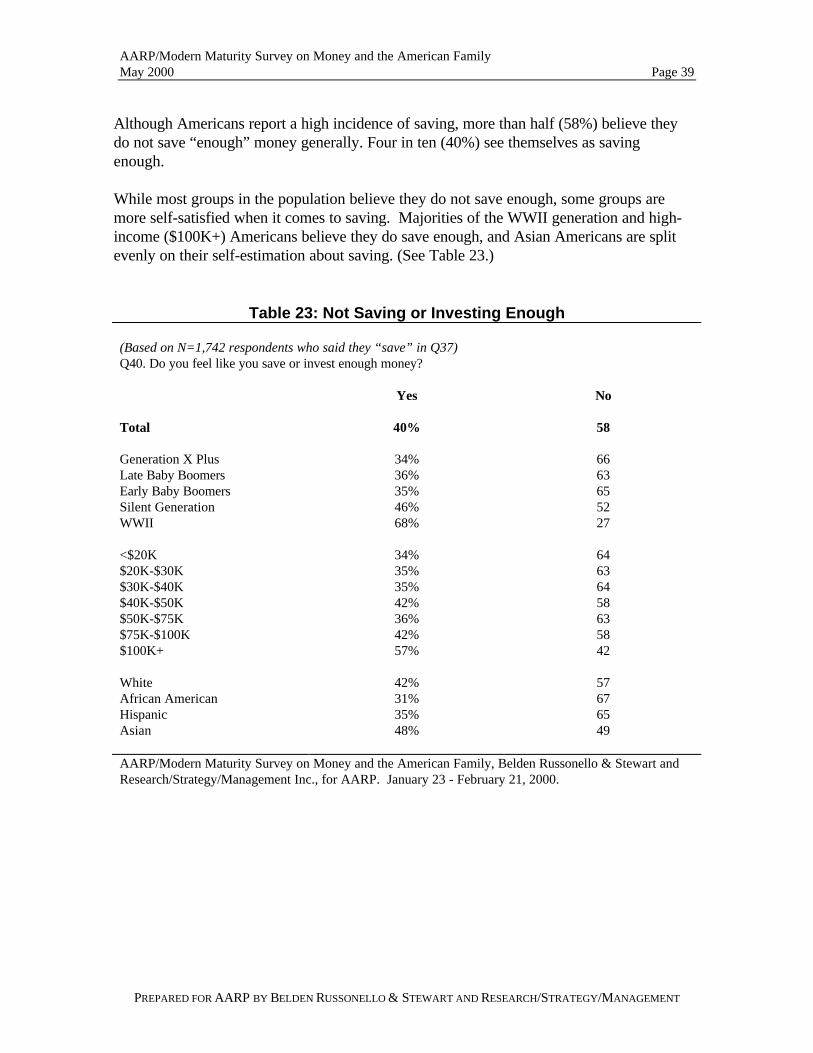
Although Americans report a high incidence of saving, more than half (58%) believe theydo not save “enough” money generally. Four in ten (40%) see themselves as savingenough.
While most groups in the population believe they do not save enough, some groups aremore self-satisfied when it comes to saving. Majorities of the WWII generation and high-income ($100K+) Americans believe they do save enough, and Asian Americans are splitevenly on their self-estimation about saving. (See Table 23.)
Table 23: Not Saving or Investing Enough
(Based on N=1,742 respondents who said they “save” in Q37)Q40. Do you feel like you save or invest enough money?
Yes No
Total 40% 58
Generation X Plus 34% 66Late Baby Boomers 36% 63Early Baby Boomers 35% 65Silent Generation 46% 52WWII 68% 27
<$20K 34% 64$20K-$30K 35% 63$30K-$40K 35% 64$40K-$50K 42% 58$50K-$75K 36% 63$75K-$100K 42% 58$100K+ 57% 42
White 42% 57African American 31% 67Hispanic 35% 65Asian 48% 49
AARP/Modern Maturity Survey on Money and the American Family, Belden Russonello & Stewart andResearch/Strategy/Management Inc., for AARP. January 23 - February 21, 2000.
AARP/Modern Maturity Survey on Money and the American FamilyMay 2000 Page 40
PREPARED FOR AARP BY BELDEN RUSSONELLO & STEWART AND RESEARCH/STRATEGY/MANAGEMENT
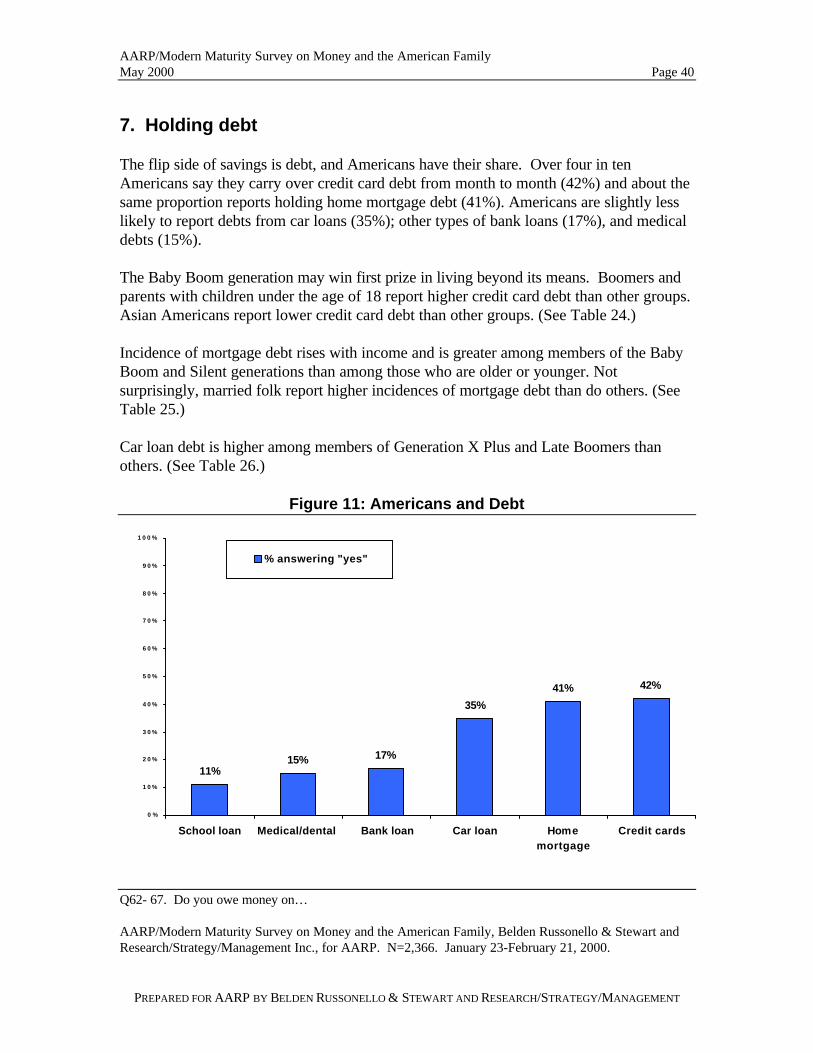
7. Holding debt
The flip side of savings is debt, and Americans have their share. Over four in tenAmericans say they carry over credit card debt from month to month (42%) and about thesame proportion reports holding home mortgage debt (41%). Americans are slightly lesslikely to report debts from car loans (35%); other types of bank loans (17%), and medicaldebts (15%).
The Baby Boom generation may win first prize in living beyond its means. Boomers andparents with children under the age of 18 report higher credit card debt than other groups.Asian Americans report lower credit card debt than other groups. (See Table 24.)
Incidence of mortgage debt rises with income and is greater among members of the BabyBoom and Silent generations than among those who are older or younger. Notsurprisingly, married folk report higher incidences of mortgage debt than do others. (SeeTable 25.)
Car loan debt is higher among members of Generation X Plus and Late Boomers thanothers. (See Table 26.)
Figure 11: Americans and Debt
11%15% 17%
35%
41% 42%
0 %
1 0 %
2 0 %
3 0 %
4 0 %
5 0 %
6 0 %
7 0 %
8 0 %
9 0 %
1 0 0 %
School loan Medical/dental Bank loan Car loan Homemortgage
Credit cards
% answering "yes"
Q62- 67. Do you owe money on…
AARP/Modern Maturity Survey on Money and the American Family, Belden Russonello & Stewart andResearch/Strategy/Management Inc., for AARP. N=2,366. January 23-February 21, 2000.
AARP/Modern Maturity Survey on Money and the American FamilyMay 2000 Page 41
PREPARED FOR AARP BY BELDEN RUSSONELLO & STEWART AND RESEARCH/STRATEGY/MANAGEMENT
Table 24: Credit Card Debt
AARP/Modern Maturity Survey on Money and the American Family, Belden Russonello & Stewart andResearch/Strategy/Management Inc., for AARP. N=2,366. January 23 - February 21, 2000.
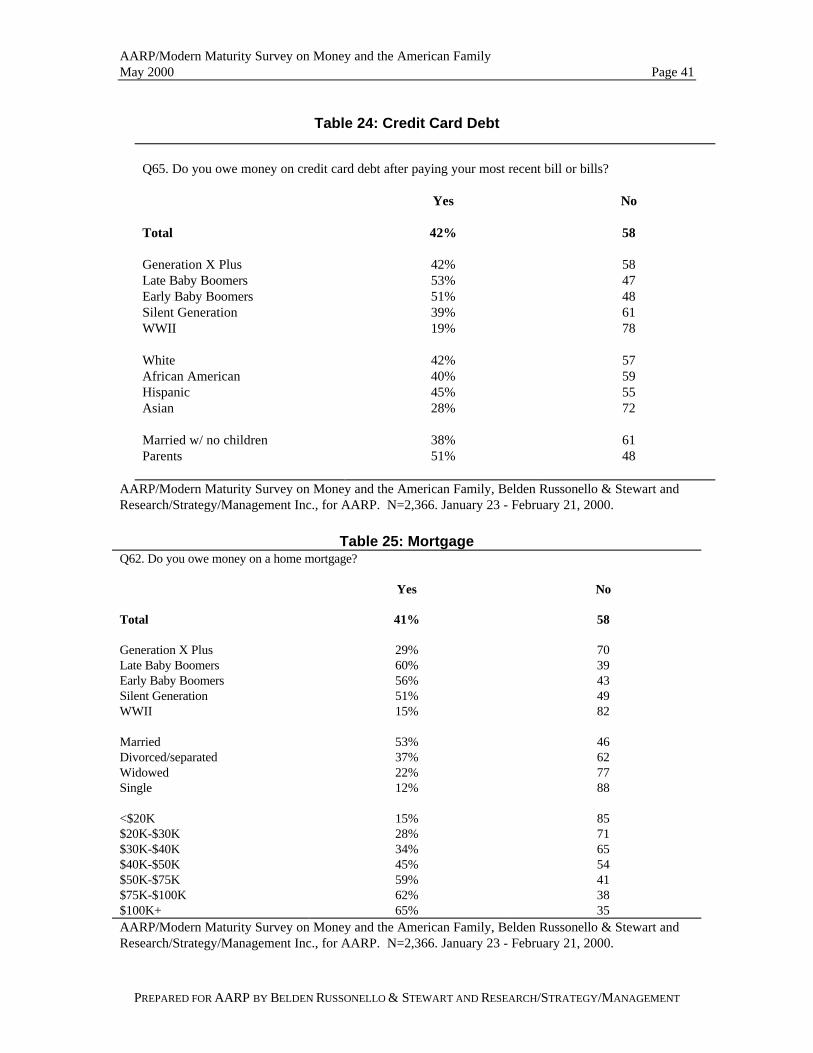
Table 25: MortgageQ62. Do you owe money on a home mortgage?
Yes No
Total 41% 58
Generation X Plus 29% 70Late Baby Boomers 60% 39Early Baby Boomers 56% 43Silent Generation 51% 49WWII 15% 82
Married 53% 46Divorced/separated 37% 62Widowed 22% 77Single 12% 88
<$20K 15% 85$20K-$30K 28% 71$30K-$40K 34% 65$40K-$50K 45% 54$50K-$75K 59% 41$75K-$100K 62% 38$100K+ 65% 35AARP/Modern Maturity Survey on Money and the American Family, Belden Russonello & Stewart andResearch/Strategy/Management Inc., for AARP. N=2,366. January 23 - February 21, 2000.
Q65. Do you owe money on credit card debt after paying your most recent bill or bills?
Yes No
Total 42% 58
Generation X Plus 42% 58Late Baby Boomers 53% 47Early Baby Boomers 51% 48Silent Generation 39% 61WWII 19% 78
White 42% 57African American 40% 59Hispanic 45% 55Asian 28% 72
Married w/ no children 38% 61Parents 51% 48
AARP/Modern Maturity Survey on Money and the American FamilyMay 2000 Page 42
PREPARED FOR AARP BY BELDEN RUSSONELLO & STEWART AND RESEARCH/STRATEGY/MANAGEMENT
Table 26: Car Loan
Q64. Do you owe money on a car loan?
Yes No
Total 35% 64
Generation X Plus 44% 56Late Baby Boomers 42% 58Early Baby Boomers 37% 62Silent Generation 32% 68WWII 11% 87
AARP/Modern Maturity Survey on Money and the American Family, Belden Russonello & Stewart andResearch/Strategy/Management Inc., for AARP. N=2,366. January 23 - February 21, 2000.
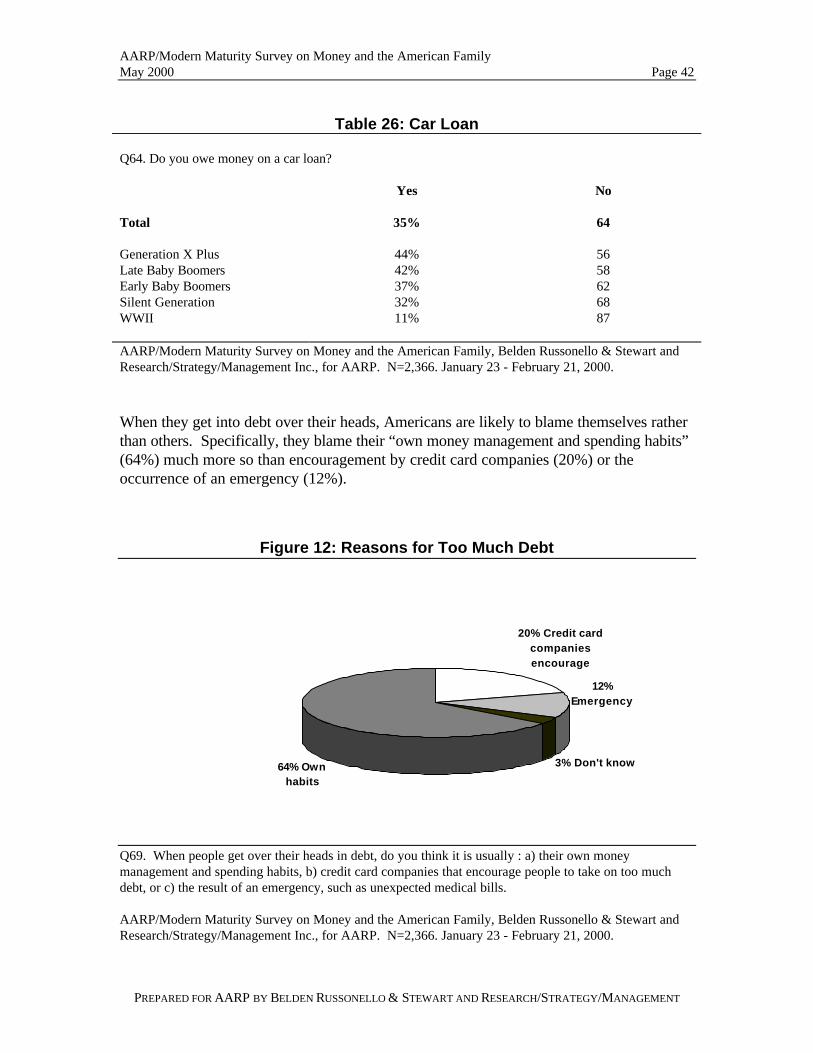
When they get into debt over their heads, Americans are likely to blame themselves ratherthan others. Specifically, they blame their “own money management and spending habits”(64%) much more so than encouragement by credit card companies (20%) or theoccurrence of an emergency (12%).
Figure 12: Reasons for Too Much Debt
3% Don't know
12% Emergency
20% Credit card companies encourage
64% Own habits
Q69. When people get over their heads in debt, do you think it is usually : a) their own moneymanagement and spending habits, b) credit card companies that encourage people to take on too muchdebt, or c) the result of an emergency, such as unexpected medical bills.
AARP/Modern Maturity Survey on Money and the American Family, Belden Russonello & Stewart andResearch/Strategy/Management Inc., for AARP. N=2,366. January 23 - February 21, 2000.
AARP/Modern Maturity Survey on Money and the American FamilyMay 2000 Page 43
PREPARED FOR AARP BY BELDEN RUSSONELLO & STEWART AND RESEARCH/STRATEGY/MANAGEMENT
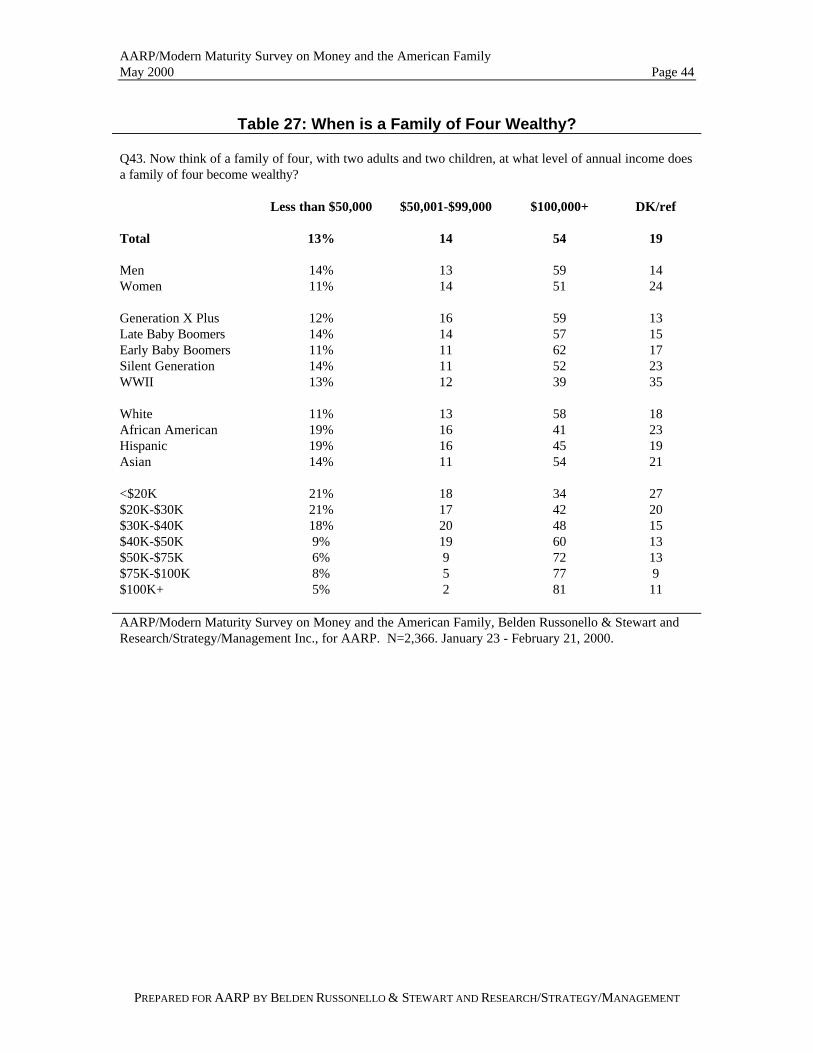
8. What it takes to be wealthy
When thinking about wealth, Americans hold a realistic view. A majority of Americans(54%) thinks a family of four needs an income of at least $100,000 to be consideredwealthy. This figure is well above the $55,886 median household income for a four-personhousehold in 1998, according to the U.S. Census.
Overall, two in ten (18%) say an income of $100,000 is necessary to be consideredwealthy; another 18% say a family’s income needs to be between $100,000 and $200,000;and still another 18% set a higher annual income hurdle of over $200,000. Fourteenpercent set the annual income floor for wealth lower, at between $50,000 and $99,000,while 13% set it at less than $50,000. The $100,000 mark is less of a benchmark forwealth among women than men, and among the WWII generation than other age groups.Not surprisingly, upper-income Americans are more likely than those with lower incomesto use the $100,000 floor for wealth. (See Table 27.)
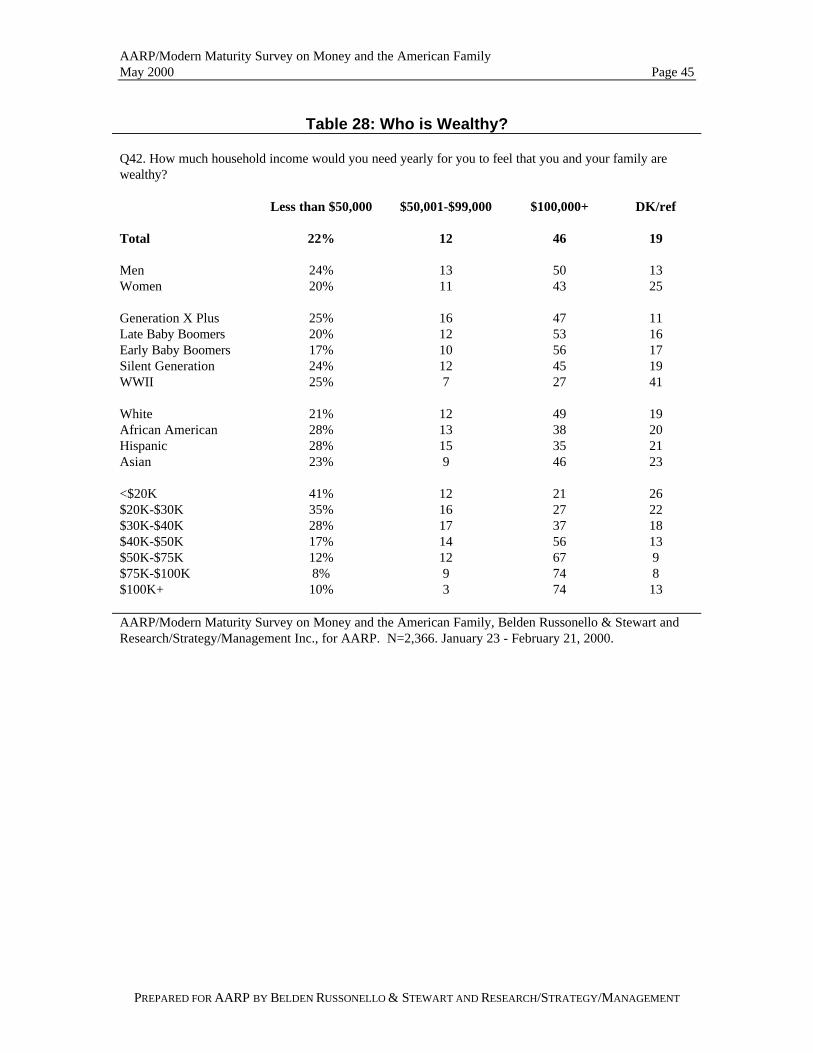
When thinking about their own personal finances, over four in ten (46%) Americansbelieve they themselves would need a yearly income of at least $100,000 to be wealthy.Two in ten (19%) set the bar for personal wealth at an annual income of $100,000; 12%set it between $100,000 and $200,000; and 15% set it at $200,000. A number ofAmericans would consider themselves wealthy while earning under $100,000. One in ten(12%) say they would need between $50,000 and $99,000, and 22% say they would needless than $50,000 to feel that they were wealthy. Using $100,000 or greater as abenchmark for personal wealth is more common among men than women, among youngergenerations than the WWII generation, among Whites and Asian Americans than AfricanAmericans and Hispanics, and among those of higher incomes. (See Table 28.)
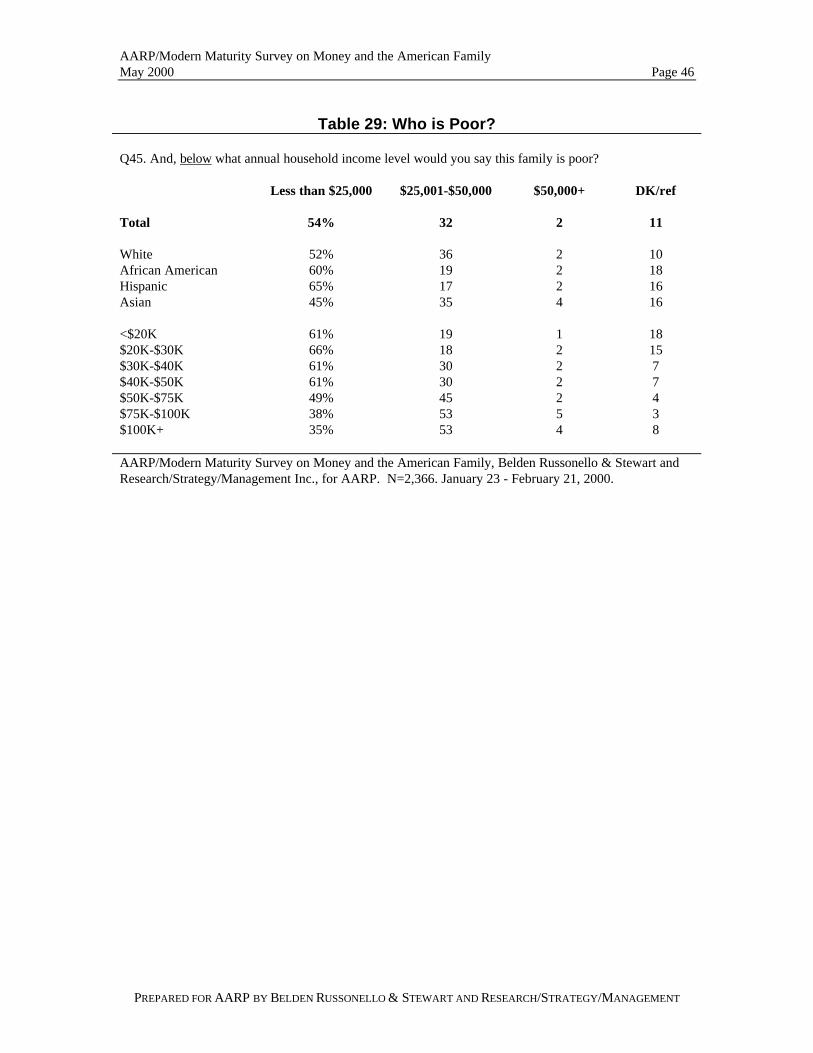
Considering the opposite end of the income scale, over five in ten Americans (54%)consider a family of four to be poor if it makes an income of $25,000 or less. Whites andAsian Americans and upper-income Americans are more likely than their counterparts toset a higher threshold for being poor. (See Table 29.)
AARP/Modern Maturity Survey on Money and the American FamilyMay 2000 Page 44
PREPARED FOR AARP BY BELDEN RUSSONELLO & STEWART AND RESEARCH/STRATEGY/MANAGEMENT
Table 27: When is a Family of Four Wealthy?
Q43. Now think of a family of four, with two adults and two children, at what level of annual income doesa family of four become wealthy?
Less than $50,000 $50,001-$99,000 $100,000+ DK/ref
Total 13% 14 54 19
Men 14% 13 59 14Women 11% 14 51 24
Generation X Plus 12% 16 59 13Late Baby Boomers 14% 14 57 15Early Baby Boomers 11% 11 62 17Silent Generation 14% 11 52 23WWII 13% 12 39 35
White 11% 13 58 18African American 19% 16 41 23Hispanic 19% 16 45 19Asian 14% 11 54 21
<$20K 21% 18 34 27$20K-$30K 21% 17 42 20$30K-$40K 18% 20 48 15$40K-$50K 9% 19 60 13$50K-$75K 6% 9 72 13$75K-$100K 8% 5 77 9$100K+ 5% 2 81 11
AARP/Modern Maturity Survey on Money and the American Family, Belden Russonello & Stewart andResearch/Strategy/Management Inc., for AARP. N=2,366. January 23 - February 21, 2000.
AARP/Modern Maturity Survey on Money and the American FamilyMay 2000 Page 45
PREPARED FOR AARP BY BELDEN RUSSONELLO & STEWART AND RESEARCH/STRATEGY/MANAGEMENT
Table 28: Who is Wealthy?
Q42. How much household income would you need yearly for you to feel that you and your family arewealthy?
Less than $50,000 $50,001-$99,000 $100,000+ DK/ref
Total 22% 12 46 19
Men 24% 13 50 13Women 20% 11 43 25
Generation X Plus 25% 16 47 11Late Baby Boomers 20% 12 53 16Early Baby Boomers 17% 10 56 17Silent Generation 24% 12 45 19WWII 25% 7 27 41
White 21% 12 49 19African American 28% 13 38 20Hispanic 28% 15 35 21Asian 23% 9 46 23
<$20K 41% 12 21 26$20K-$30K 35% 16 27 22$30K-$40K 28% 17 37 18$40K-$50K 17% 14 56 13$50K-$75K 12% 12 67 9$75K-$100K 8% 9 74 8$100K+ 10% 3 74 13
AARP/Modern Maturity Survey on Money and the American Family, Belden Russonello & Stewart andResearch/Strategy/Management Inc., for AARP. N=2,366. January 23 - February 21, 2000.
AARP/Modern Maturity Survey on Money and the American FamilyMay 2000 Page 46
PREPARED FOR AARP BY BELDEN RUSSONELLO & STEWART AND RESEARCH/STRATEGY/MANAGEMENT
Table 29: Who is Poor?
Q45. And, below what annual household income level would you say this family is poor?
Less than $25,000 $25,001-$50,000 $50,000+ DK/ref
Total 54% 32 2 11
White 52% 36 2 10African American 60% 19 2 18Hispanic 65% 17 2 16Asian 45% 35 4 16
<$20K 61% 19 1 18$20K-$30K 66% 18 2 15$30K-$40K 61% 30 2 7$40K-$50K 61% 30 2 7$50K-$75K 49% 45 2 4$75K-$100K 38% 53 5 3$100K+ 35% 53 4 8
AARP/Modern Maturity Survey on Money and the American Family, Belden Russonello & Stewart andResearch/Strategy/Management Inc., for AARP. N=2,366. January 23 - February 21, 2000.
AARP/Modern Maturity Survey on Money and the American FamilyMay 2000 Page 47
PREPARED FOR AARP BY BELDEN RUSSONELLO & STEWART AND RESEARCH/STRATEGY/MANAGEMENT
V. Attitudinal Groups
The BRS/R/S/M survey for AARP on Money and the American Family documentsAmericans’ attitudes toward money and its role in their lives. Americans are not of onemind on the importance of money, the impact it has on their lives, their uses of money, northeir general contentment with their financial situations. One way to better understand thepublic’s attitudes on these topics is to segment the population into groups according totheir views on money and personal financial situations. We have used a technique calledcluster analysis to identify discreet groups that possess similar attitudes toward money andthe American family.
This analysis is different than cross-tab reporting which divides the population accordingto demographic characteristics. Cross-tabs inform us about the differences in opinions ofwomen versus men, or African Americans from other racial or ethnic groups; but clusteranalysis makes clear that not all women or African Americans think alike on these issues.Cluster or segmentation analysis illustrates how attitudes divide the population.Segmentation reveals the distinctions of opinions between and within demographicgroups, separating respondents to minimize intragroup variance (the attitudes ofindividuals in each group do not vary greatly from one to the next) and maximizeintergroup variance (the attitudes of one group are dissimilar to those of other groups) onkey variables.
The cluster definitions in this analysis are formed around responses to two sets of surveyquestions.
1) Importance of money, which consists of answers to questions about:• The need to “earn a lot of money” to be successful in life (Q2)• The desire to be wealthy (Q17)
2) Contentment with one’s own financial situation as measured by Americans:• Evaluation of personal finances (Q13) and contentment with lifestyle (Q14)• Comparison to their parents’ financial security (Q15) and outlook for their
children’s potential financial situations (Q16)• Perception of the nation’s economy (Q12)
AARP/Modern Maturity Survey on Money and the American FamilyMay 2000 Page 48
PREPARED FOR AARP BY BELDEN RUSSONELLO & STEWART AND RESEARCH/STRATEGY/MANAGEMENT
In addition to these two sets of questions, the segmentation analysis looks at responses toall other attitudinal, demographic, and lifestyle questions in the survey.
The segmentation analysis identifies five attitudinal clusters in the population:
1. Left Out 6% of total population
2. American Dreamers 21%
3. Happy Achievers 24%
4. Settled and Satisfied 38%
5. Wealth-averse 11%
Analyzing the five clusters, we find:
The first three clusters, which represent over half (51%) of the U.S. population,place a high importance on having money. Although each of these three groupsbrings its own perspective to the issues covered in the survey, they share acommon trait: the desire to be wealthy. The American Dreamers and HappyAchievers, in particular, consider earning a lot of money to be a good measure ofsuccess in life.
The Left Out are much less content with their current financial status than are theAmerican Dreamers or the Happy Achievers. The Dreamers are content but wishfor more, while the Achievers are very satisfied. The Achievers have the highesthousehold incomes and most live in dual-income households with no children.Therefore, many of this group have more disposable income than the first twoclusters which are much more likely to be spending their money on necessities.
The last two clusters, which consist of 49% of the American public, place lowerimportance on money and are less sure they would like to be wealthy themselves.Both of these groups are much less likely than the first three to believe that moneycan buy the important things in life, such as happiness and close relationships withfamily and friends. The Settled and Satisfied are more likely to disregard moneyand be satisfied with what they have now. The Wealth-averse have lower incomesbut dread the idea of becoming wealthy.
AARP/Modern Maturity Survey on Money and the American FamilyMay 2000 Page 49
PREPARED FOR AARP BY BELDEN RUSSONELLO & STEWART AND RESEARCH/STRATEGY/MANAGEMENT
1. Left Out 6% of total population
The Left Out possess the strongest faith in the value of money. They are the most likelycluster to believe that earning a lot of money is absolutely necessary for a successful life,and they hold a broad desire to be wealthy. They are the group that most often has tomake life decisions – such as going without health care or postponing education – becauseof a lack of money. It is this combination of faith in the value of money and their lack ofmoney that characterizes the Left Out.
The nation’s recent economic prosperity has passed over the Left Out, and they know it.Of all five clusters, they are the most discontented with their own financial situation. Mostmembers of this group describe themselves as “below average” financially, and they arethe most likely to feel they are worse off financially than their parents were at this point inlife.
Not surprisingly, this cluster reports the lowest household incomes. They hold high creditcard debt and low expectations for retirement at age 65. They are the least likely to saveor invest for the future.
Who they are. The Left Out account for 6% of adults. Demographically, this groupconsists of mostly members of the Baby Boom and Silent generations (62% are betweenages 36 and 65), and has more women (57%) than men (43%).
The Left Out possess the lowest levels of education and household income. Nine in ten(90%) have not graduated from college and three in ten (29%) have not finished highschool. Two-thirds (67%) earn less than $30,000 annually and nearly half (48%) less than$20,000. They are more likely to rent (51%) than own a home, and are more likely thanother groups to be divorced or separated (20%), and to have children at home (49%).
The Left Out contain relatively high proportions of African Americans (17%) andHispanics (12%), versus 11% and 10% respectively in the general population.
A third (33%) of this group does not have health insurance, which is more than twice theaverage rate of Americans who say they do not have health insurance (14%). The Left Outalso carry a great deal of debt: over four in ten (44%) report month-to-month credit carddebt, and they are among the most likely clusters to report medical or dental debt (30%)or debt to family members (18%).
Given their current financial status, it is not surprising that this group is the least likely tobe investing for the future (45% save or invest) and the least likely to expect to retire at 65(33% expect to retire).
AARP/Modern Maturity Survey on Money and the American FamilyMay 2000 Page 50
PREPARED FOR AARP BY BELDEN RUSSONELLO & STEWART AND RESEARCH/STRATEGY/MANAGEMENT
Role of money: The lack of money has played a significant role in the lives of the LeftOut. More so than any other group, members of this group report that because of a lack ofmoney they have:
Not gotten needed health care (58%)Postponed or not gone to college (45%)Shared a home or apartment (38%)Retired later (33%)Worked outside the home instead of staying home with children (53%)Not had children (35%)Postponed children (23%)Decided to divorce or separate (24%) or decided to stay married (32%)
Importance of money: Throughout the survey, the Left Out place a great deal ofimportance on obtaining and having more money:
• Close to eight in ten (79%) of this group would like to be wealthy, and nearlyseven in ten (68%) believe earning a lot of money is absolutely necessary for asuccessful life.
• Most Left Out believe that money can buy the freedom to live as one chooses
(74%), excitement (73%), and less stress (66%).
• If a member of this cluster won a million dollars, he or she would mainly pay offdebt (20%), give it to family or friends (19%), buy a house (18%), or save it(16%).
• While a sizable majority of every cluster expresses the belief that being wealthy has
more to do with hard work (67%) than luck, the Left Out are somewhat lessinclined to this view than other groups.
Contentment: The Left Out are the most discontented with their current financialsituations and do not appear to be benefiting from the strong economy.
• Half of the Left Out report being unhappy with the lifestyle they are able to afford(50% unhappy, 37% “just average,” 12% happy), and this cluster is the most likelyto report being “worse off” financially (44%) than their parents were at the sameage.
• Seven in ten (70%) describe themselves as “below average” financially (34% “a
lot” below average). • The good economic times in the country have passed by this group. The Left Out
do not see the nation’s economy doing well (48% say not so good, 35% poor, andonly 16% say excellent or good), and are the most likely to feel “left out” of thecurrent trend of overnight millionaires and billionaires (37%).
AARP/Modern Maturity Survey on Money and the American FamilyMay 2000 Page 51
PREPARED FOR AARP BY BELDEN RUSSONELLO & STEWART AND RESEARCH/STRATEGY/MANAGEMENT
2. American Dreamers 21% of total population
The American Dreamers are so named because they combine the strongest desire to bewealthy with the values of caring for family and friends and work and religious faith. Thisgroup is characterized by its youth, its desire for wealth, its faith in the power of money tobestow important things in life, such as freedom, excitement, and less stress, and its beliefthat money is essential for a successful life.
The American Dreamers voice general contentment with their financial situation, but theywant more than their current means allow. The Dreamers hold a relatively high rate ofmonthly credit card debt, and they are uncertain about their chances of retiring by age 65.They recognize the road to wealth is not easy street, but they are dreaming of achievingwealth any way they can. They generally believe that becoming wealthy is a matter of hardwork. Nonetheless, more of them than any other segment put their faith in lottery tickets.
Who they are. This group accounts for 21% of adults. Demographically, this is theyoungest of the five clusters: 64% are 18 to 45 years old, covering the late Baby Boomeras well as the X Plus generations. While a majority of the Dreamers are married (53%),there are more singles (25%) among this segment than any other.
Their income and education levels register slightly lower than average, and this groupcontains a relatively high proportion of African Americans (17%) and Hispanics (13%).
The American Dreamers are striving to get ahead financially. They are among the mostlikely to dream of retiring at age 65 (66%). However, the road ahead looks more difficultto them than it does for some other groups. They are less certain than other groups thatthey will be able to retire at 65 (58%). While seven in ten (72%) Dreamers say theycurrently save or invest for their futures, almost half of Dreamers (46%) carry credit carddebt from month to month.
The American Dreamers may be hoping to acquire the money they need to pay off debtand to retire at 65 by winning the lottery. They are the most likely cluster to havepurchased a lottery ticket in the last year (57%).
Importance of money: American Dreamers place a great deal of importance on obtainingand having more money:
• Close to nine in ten Dreamers (88%) – more than any other segment – would liketo be wealthy, and close to six in ten Dreamers (59%) believe earning a lot ofmoney is absolutely necessary for a successful life.
AARP/Modern Maturity Survey on Money and the American FamilyMay 2000 Page 52
PREPARED FOR AARP BY BELDEN RUSSONELLO & STEWART AND RESEARCH/STRATEGY/MANAGEMENT
• Most Dreamers believe that money can buy excitement in life (76%), the freedomto live as one chooses (74%), and less stress in life (61%).
• If a Dreamer won a million dollars, he or she would mainly give it to family
members or friends (20%), pay off debts (19%), or save or invest it (17%). • Over seven in ten Dreamers (72%) put their faith in hard work over luck as the
way to wealth.
Contentment: The American Dreamers express general contentment about their currentfinancial situation, but they are less satisfied than some other segments. Their attitudesreflect their desire to improve their situation.
• Small majorities of Dreamers report being “happy with the lifestyle” they are ableto afford (56% happy, 37% “just average,” and 8% unhappy) and being “betteroff” financially (56%) than their parents were at the same age.
• However, nearly three out of four Dreamers describe themselves as “just average”
financially (72%). Also, the Dreamers are more likely than most other groupsexcept the Left Out group to feel “left out” of the recent rash of millionaires andbillionaires (25%).
AARP/Modern Maturity Survey on Money and the American FamilyMay 2000 Page 53
PREPARED FOR AARP BY BELDEN RUSSONELLO & STEWART AND RESEARCH/STRATEGY/MANAGEMENT
3. Happy Achievers 24% of total population
Happy Achievers combine the highest contentment with their financial situation with adesire for even more wealth. They place high importance on having money. This groupreports the highest household incomes and the highest percentage of full-time workers.
Their high level of satisfaction sets them apart from the first two cluster groups, but theHappy Achievers are similar to the Left Out and the Americans Dreamers in that they toobelieve money can help them achieve many important things in life, such as freedom,excitement, less stress, and peace of mind.
The Achievers are also savers and investors and homeowners. If members of this groupwon a million dollars, they would save and invest the money rather than spend it or give itaway. A large proportion of the Achievers expect to retire at 65.
Who they are. The group accounts for 24% of adults. Demographically, there are moremen (59%) than women (41%) among the Achievers, and they can be found across thegenerations.
The Achievers possess high levels of education (39% are college graduates) and very highhousehold incomes (21% earn $100,000 or more). They contain a high proportion of dual-income households. Over two-thirds (68%) of the Achievers are married and six in ten(63%) work full-time outside the home. They are less likely to have children in theirhousehold (39% with children) than are the other segments. The Achievers are also likelyto own their own homes (72%).
Given their current financial status, it is not surprising that they are the most likely to beinvesting for the future (88%), and the most likely to expect to retire at 65 (82%).
Importance of money: The Achievers place importance on obtaining and having moremoney:
• Eight in ten (80%) of this group would like to be wealthy, and over four in ten(45%) believe earning a lot of money is absolutely necessary for a successful life.
• Large majorities of Achievers believe money can buy freedom to live as one
chooses (78%), excitement in life (73%), less stress (64%), and peace of mind(57%).
• If an Achiever won a million dollars, he or she would mainly save or invest it(27%) or give it to family or friends (20%).
AARP/Modern Maturity Survey on Money and the American FamilyMay 2000 Page 54
PREPARED FOR AARP BY BELDEN RUSSONELLO & STEWART AND RESEARCH/STRATEGY/MANAGEMENT
• The Achievers are among the most likely to believe hard work (78%) is the key tobeing wealthy.
Contentment: The Achievers are very satisfied with their current financial situation; andas they look to the future - they are optimistic about their own children’s earning power.
• Almost everyone in this group (98%) reports being happy with the lifestyle theycan afford (65% very happy and 33% relatively happy).
• Nine in ten (90%) describe themselves as “better off” financially than their parents
were at this stage in life, and over three-quarters (76%) believe their children willbe “better off” than they are financially.
• Unlike the Left Out, the Achievers have benefited from the economic good times.
Six in ten (60%) describe themselves as “well-off” financially, and they are themost likely group to believe the nation’s economy is doing well (46% excellent,53% good).
AARP/Modern Maturity Survey on Money and the American FamilyMay 2000 Page 55
PREPARED FOR AARP BY BELDEN RUSSONELLO & STEWART AND RESEARCH/STRATEGY/MANAGEMENT
4. Settled and Satisfied 38% of total population
The Settled and Satisfied place little value on obtaining and having money and are amongthe most certain that money does not buy happiness. As a group, they are divided aboutwhether they would even want to be wealthy.
The Settled and Satisfied get their name from their relatively high level of contentmentwith their present financial situation and their demographic profile. The Settled andSatisfied are more middle-income, married, homeowners, retired than the nation as awhole. For those who are not retired, a majority expects that life will treat them well andthat they will be able to stop working at age 65 if they wish. They have what they want,but unlike the Happy Achievers they are not sure they are looking for more.
Who they are. The Settled and Satisfied account for 38% of adults. Demographically,there are more women (58%) than men (42%) in the group, and compared to the nation asa whole, the Settled and Satisfied are slightly older (22% 65 years old or over), moremarried (61%), and more Caucasian (80%). Half of this group (49%) have householdincomes between $30,000 and $75,000, a higher proportion of middle-income Americansthan any other segment.
We also find a high proportion of retired persons (23%) and homeowners (73%) amongthe Settled and Satisfied.
Eight in ten (80%) of the Settled and Satisfied – more than any group except the HappyAchievers – say they are investing and saving for their futures.
Importance of money: This group places little importance on obtaining and having moremoney:
• None of the Settled and Satisfied believes earning a lot of money is absolutelynecessary for a successful life. About half say it is only somewhat important (53%)and four in ten (42%) believe money has no relation to living a successful life.
• This group is uncertain whether it wants to be wealthy. Attitudes divide 50% against
and 47% in favor of wanting to be wealthy.
• They feel more strongly than most that “money can’t buy happiness” (68% verymuch agree). They are less likely than others to seek money for themselves. Ifthey won a million dollars, more than any other segment they would mainly give itto family or friends (25%). They would also use a million-dollar windfall to saveand invest (19%) and donate to charity (17%).
AARP/Modern Maturity Survey on Money and the American FamilyMay 2000 Page 56
PREPARED FOR AARP BY BELDEN RUSSONELLO & STEWART AND RESEARCH/STRATEGY/MANAGEMENT
Contentment: The Settled and Satisfied are decidedly content with their financialsituation.
• Seven in ten (72%) describe themselves as “just average” financially, but “average”status is just fine for this group. Nine in ten (89%) report being happy with thelifestyle they can afford.
• Three-quarters (76%) describe themselves as “better off” financially than their
parents were at the same stage in life.
AARP/Modern Maturity Survey on Money and the American FamilyMay 2000 Page 57
PREPARED FOR AARP BY BELDEN RUSSONELLO & STEWART AND RESEARCH/STRATEGY/MANAGEMENT
5. Wealth-averse 11% of total population
Of all the groups, the Wealth-averse place the lowest importance on obtaining and havinga lot of money. Money itself possesses little worth for this group. A majority of theWealth-averse would reject an offer to become wealthy, and it is the most likely group tobelieve money cannot buy happiness or other important things in life. The Wealth-aversealso hold the most negative views toward the wealthy, believing more than most thatwealth makes people greedy and insensitive.
While this group is not interested in wealth, it could probably use a little more income.The Wealth-averse express less satisfaction with their own financial situation than do othersegments, and they are more likely to have credit card debt, medical bills, and owe moneyto family members. Similar to the Left Out, the Wealth-averse have been forced to makemajor life decisions because of a lack of money. But they still do not want to be wealthy.Unlike the Left Out, they do not see money playing a role in leading a successful life.
Who they are. This group accounts for 11% of adults. Demographically, there are morewomen (56%) than men (44%) among the Wealth-averse, and they can be found acrossthe generations.
The Wealth-averse possess low levels of education (59% did not attend college) and lowlevels of household income (57% earn less than $30,000). The Wealth-averse are also themost likely group to contain single parents (9%).
Similar to the Left Out, the Wealth-averse are less likely to be investing for the future(54%) and less likely to expect to retire at 65 (41%). They are also among the most likelygroups to have credit card debt (46%), medical debt (27%), and family debt (11%).
Role of money: The lack of money has played a significant role in the lives of the Wealth-averse. They are among the most likely to report that because of a lack of money theyhave:
Not gotten needed health care (41%)Postponed or not gone to college (34%)Retired later (22%)
Importance of money: Of all the groups, the Wealth-averse place the lowest importanceon obtaining and having more money:
• A majority of this group says earning a lot of money is not important for a successfullife (53% not important 43% somewhat important, zero percent absolutelynecessary), and nearly six in ten (58%) say they would not like to be wealthy.
AARP/Modern Maturity Survey on Money and the American FamilyMay 2000 Page 58
PREPARED FOR AARP BY BELDEN RUSSONELLO & STEWART AND RESEARCH/STRATEGY/MANAGEMENT
• They are the most likely to strongly believe that money cannot buy happiness (70%
very much agree, 13% agree somewhat). They also have more fear than others doabout the impact that wealth has on people. The Wealth-averse are the most likely tosay wealth makes a person too greedy (50% very likely, 35% somewhat likely) andinsensitive to others (37% very, 44% somewhat).
• Their rejection of wealth is reflected in their choices of what they would do if they
won a million dollars. A member of this group would mainly give it away to familyor friends (22%), donate to charity (20%), or pay off debt (17%).
Contentment: The Wealth-averse are relatively discontented with their current financialsituations.
• Less than a majority of the Wealth-averse are “happy with the lifestyle” they areable to afford (45% happy, 39% “just average,” and 15% unhappy), and nearly half(49%) describe themselves as “below average” financially.
• While a plurality describe themselves as “better off” (43%) financially than their
parents, a sizable percentage see themselves as “less well off” (30%) or the same(18%).
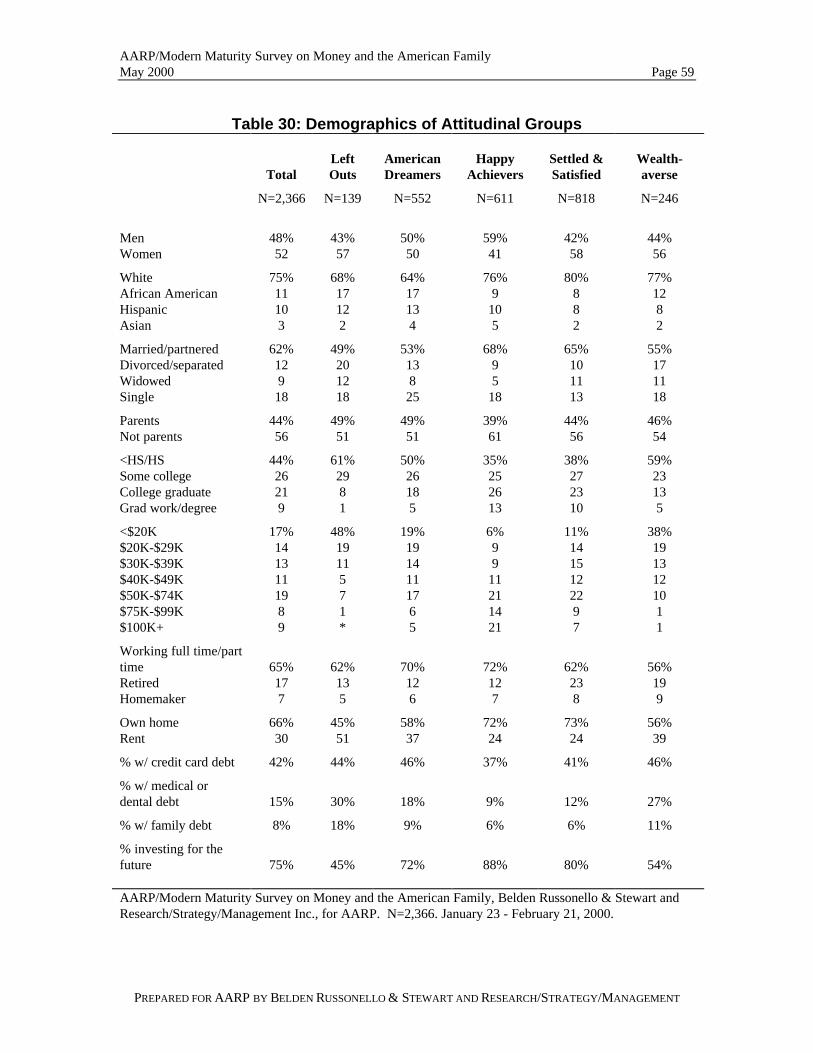
AARP/Modern Maturity Survey on Money and the American FamilyMay 2000 Page 59
PREPARED FOR AARP BY BELDEN RUSSONELLO & STEWART AND RESEARCH/STRATEGY/MANAGEMENT
Table 30: Demographics of Attitudinal Groups
TotalLeftOuts
AmericanDreamers
HappyAchievers
Settled &Satisfied
Wealth-averse
N=2,366 N=139 N=552 N=611 N=818 N=246
Men 48% 43% 50% 59% 42% 44%Women 52 57 50 41 58 56
White 75% 68% 64% 76% 80% 77%African American 11 17 17 9 8 12Hispanic 10 12 13 10 8 8Asian 3 2 4 5 2 2
Married/partnered 62% 49% 53% 68% 65% 55%Divorced/separated 12 20 13 9 10 17Widowed 9 12 8 5 11 11Single 18 18 25 18 13 18
Parents 44% 49% 49% 39% 44% 46%Not parents 56 51 51 61 56 54
<HS/HS 44% 61% 50% 35% 38% 59%Some college 26 29 26 25 27 23College graduate 21 8 18 26 23 13Grad work/degree 9 1 5 13 10 5
<$20K 17% 48% 19% 6% 11% 38%$20K-$29K 14 19 19 9 14 19$30K-$39K 13 11 14 9 15 13$40K-$49K 11 5 11 11 12 12$50K-$74K 19 7 17 21 22 10$75K-$99K 8 1 6 14 9 1$100K+ 9 * 5 21 7 1
Working full time/parttime 65% 62% 70% 72% 62% 56%Retired 17 13 12 12 23 19Homemaker 7 5 6 7 8 9
Own home 66% 45% 58% 72% 73% 56%Rent 30 51 37 24 24 39
% w/ credit card debt 42% 44% 46% 37% 41% 46%
% w/ medical ordental debt 15% 30% 18% 9% 12% 27%
% w/ family debt 8% 18% 9% 6% 6% 11%
% investing for thefuture 75% 45% 72% 88% 80% 54%
AARP/Modern Maturity Survey on Money and the American Family, Belden Russonello & Stewart andResearch/Strategy/Management Inc., for AARP. N=2,366. January 23 - February 21, 2000.
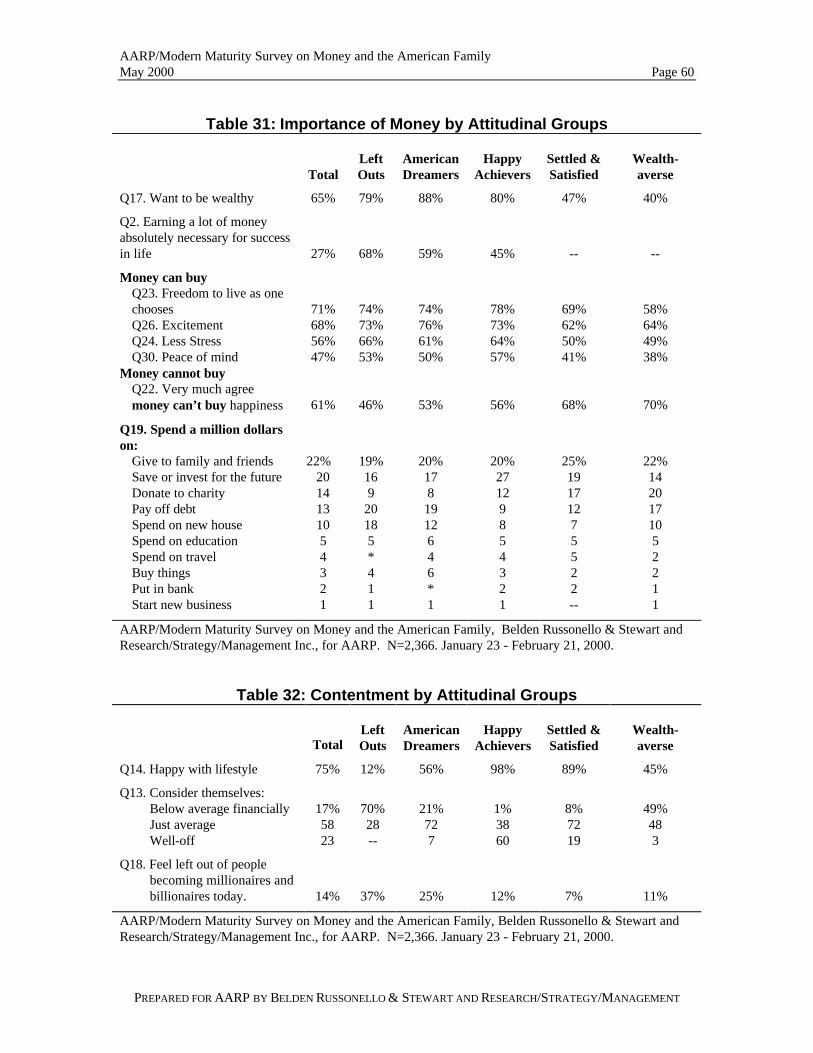
AARP/Modern Maturity Survey on Money and the American FamilyMay 2000 Page 60
PREPARED FOR AARP BY BELDEN RUSSONELLO & STEWART AND RESEARCH/STRATEGY/MANAGEMENT
Table 31: Importance of Money by Attitudinal Groups
TotalLeftOuts
AmericanDreamers
HappyAchievers
Settled &Satisfied
Wealth-averse
Q17. Want to be wealthy 65% 79% 88% 80% 47% 40%
Q2. Earning a lot of moneyabsolutely necessary for successin life 27% 68% 59% 45% -- --
Money can buyQ23. Freedom to live as onechooses 71% 74% 74% 78% 69% 58%Q26. Excitement 68% 73% 76% 73% 62% 64%Q24. Less Stress 56% 66% 61% 64% 50% 49%Q30. Peace of mind 47% 53% 50% 57% 41% 38%
Money cannot buyQ22. Very much agreemoney can’t buy happiness 61% 46% 53% 56% 68% 70%
Q19. Spend a million dollarson:
Give to family and friends 22% 19% 20% 20% 25% 22%Save or invest for the future 20 16 17 27 19 14Donate to charity 14 9 8 12 17 20Pay off debt 13 20 19 9 12 17Spend on new house 10 18 12 8 7 10Spend on education 5 5 6 5 5 5Spend on travel 4 * 4 4 5 2Buy things 3 4 6 3 2 2Put in bank 2 1 * 2 2 1Start new business 1 1 1 1 -- 1
AARP/Modern Maturity Survey on Money and the American Family, Belden Russonello & Stewart andResearch/Strategy/Management Inc., for AARP. N=2,366. January 23 - February 21, 2000.
Table 32: Contentment by Attitudinal Groups
TotalLeftOuts
AmericanDreamers
HappyAchievers
Settled &Satisfied
Wealth-averse
Q14. Happy with lifestyle 75% 12% 56% 98% 89% 45%
Q13. Consider themselves:Below average financially 17% 70% 21% 1% 8% 49%Just average 58 28 72 38 72 48Well-off 23 -- 7 60 19 3
Q18. Feel left out of peoplebecoming millionaires andbillionaires today. 14% 37% 25% 12% 7% 11%
AARP/Modern Maturity Survey on Money and the American Family, Belden Russonello & Stewart andResearch/Strategy/Management Inc., for AARP. N=2,366. January 23 - February 21, 2000.
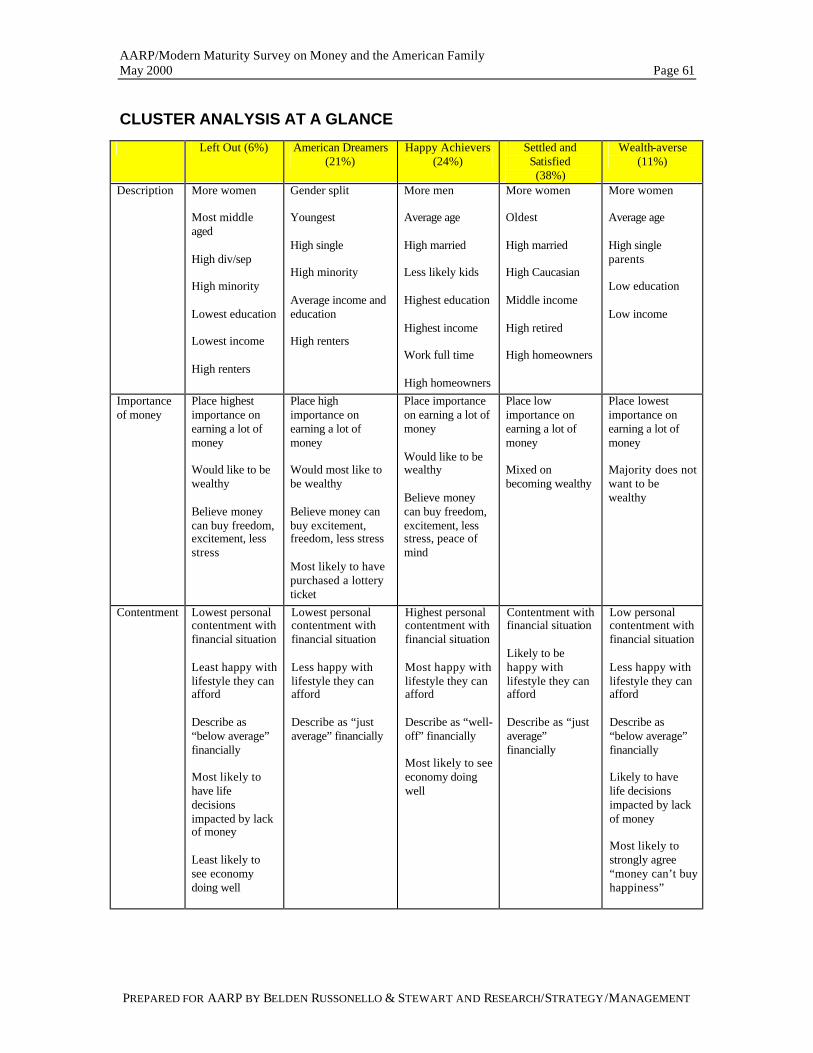
AARP/Modern Maturity Survey on Money and the American Family May 2000 Page 61
PREPARED FOR AARP BY BELDEN RUSSONELLO & STEWART AND RESEARCH/STRATEGY /MANAGEMENT
CLUSTER ANALYSIS AT A GLANCE Left Out (6%) American Dreamers
(21%) Happy Achievers
(24%) Settled and Satisfied (38%)
Wealth-averse (11%)
Description More women Most middle aged High div/sep High minority Lowest education Lowest income High renters
Gender split Youngest High single High minority Average income and education High renters
More men Average age High married Less likely kids Highest education Highest income Work full time High homeowners
More women Oldest High married High Caucasian Middle income High retired High homeowners
More women Average age High single parents Low education Low income
Importance of money
Place highest importance on earning a lot of money Would like to be wealthy Believe money can buy freedom, excitement, less stress
Place high importance on earning a lot of money Would most like to be wealthy Believe money can buy excitement, freedom, less stress Most likely to have purchased a lottery ticket
Place importance on earning a lot of money Would like to be wealthy Believe money can buy freedom, excitement, less stress, peace of mind
Place low importance on earning a lot of money Mixed on becoming wealthy
Place lowest importance on earning a lot of money Majority does not want to be wealthy
Contentment
Lowest personal contentment with financial situation Least happy with lifestyle they can afford Describe as “below average” financially Most likely to have life decisions impacted by lack of money Least likely to see economy doing well
Lowest personal contentment with financial situation Less happy with lifestyle they can afford Describe as “just average” financially
Highest personal contentment with financial situation Most happy with lifestyle they can afford Describe as “well-off” financially Most likely to see economy doing well
Contentment with financial situation Likely to be happy with lifestyle they can afford Describe as “just average” financially
Low personal contentment with financial situation Less happy with lifestyle they can afford Describe as “below average” financially Likely to have life decisions impacted by lack of money Most likely to strongly agree “money can’t buy happiness”
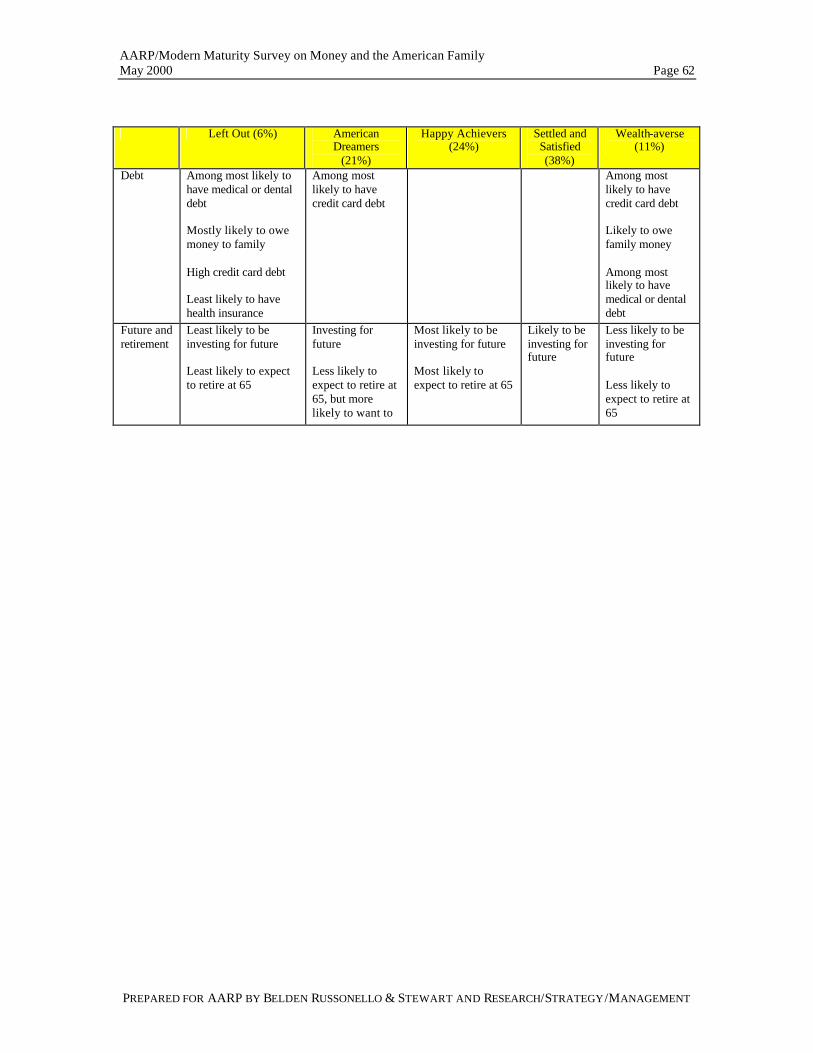
AARP/Modern Maturity Survey on Money and the American Family May 2000 Page 62
PREPARED FOR AARP BY BELDEN RUSSONELLO & STEWART AND RESEARCH/STRATEGY /MANAGEMENT
Left Out (6%) American
Dreamers (21%)
Happy Achievers (24%)
Settled and Satisfied (38%)
Wealth-averse (11%)
Debt
Among most likely to have medical or dental debt Mostly likely to owe money to family High credit card debt Least likely to have health insurance
Among most likely to have credit card debt
Among most likely to have credit card debt Likely to owe family money Among most likely to have medical or dental debt
Future and retirement
Least likely to be investing for future Least likely to expect to retire at 65
Investing for future Less likely to expect to retire at 65, but more likely to want to
Most likely to be investing for future Most likely to expect to retire at 65
Likely to be investing for future
Less likely to be investing for future Less likely to expect to retire at 65
PREPARED FOR AARP BY BELDEN RUSSONELLO & STEWART AND RESEARCH/STRATEGY/MANAGEMENT
Appendix A:Detailed Methodology and Statistical Methods
Appendix A: Detailed Methodology and Statistical MethodsAARP/Modern Maturity Survey on Money and the American Family
PREPARED FOR AARP BY BELDEN RUSSONELLO & STEWART AND RESEARCH/STRATEGY/MANAGEMENT
Detailed Methodology and Statistical Methods
A. Detailed Methodology
Introduction
This section contains descriptions of the basic research and sample designs for the study. It also presentsbrief summaries of the research procedures (focus groups, questionnaire construction, pretests, andinterviewing procedures) used to implement the research design. Each of the four sample frames isdescribed. Finally, the weighting scheme devised for the study is explained.
Research Design
With all the attention focused on money in America, AARP feels that developing new data on the influenceof money on American life would make a valuable contribution to our understanding of the Americanpublic. To better serve its constituents, AARP wanted to compare generational differences on attitudestoward money and how it affects Americans’ lives and families. The research team from Belden Russonello& Stewart (BRS), Research/Strategy/Management (RSM), and AARP designed a multi-faceted attitudinalresearch project. This design called for conducting a series of focus groups, drafting and pretesting aquestionnaire for a nationwide survey, devising a series of sample frames to include a nationallyrepresentative sample and oversamples for three racial/ethnic groups (African Americans,Hispanics/Latinos, and Asians), and interviewing members of the general public. A description of each ofthese components of the research design follows.
Focus Groups
A total of eight focus groups were conducted in three locations across the United States between January11 and 17, 2000. The groups were held in Chicago, New York City, and Los Angeles. Participants ineach group were of a particular race/ethnic group (White, African American, Hispanic, Asian), annualhousehold income (over/under $60,000), and education level (college graduate or not).
The research team developed a discussion guide to explore feelings and opinions in a number of areasrelating to money and the American family. The groups discussed the place that money holds along aspectrum of American values. They considered the impact of money or lack of it on family life.Participants shared their perceptions of wealth, spending, and saving. Finally, we assessed their attitudestoward money and their expectations for the future and retirement. Finding from the focus groups guideddevelopment of the survey questionnaire.
Questionnaire Design
The themes uncovered in the focus groups were incorporated into a draft questionnaire for thenationwide survey. The draft questionnaire was reviewed by the research team and otherinterested parties within AARP, undergoing several iterative revisions. When a final draft wascompleted, it was programmed into a CATI system and pretested. Twenty-three (23) interviewswere conducted by trained interviewers and monitored by members of the research team. Based
Appendix A: Detailed Methodology and Statistical MethodsAARP/Modern Maturity Survey on Money and the American Family Page 2
PREPARED FOR AARP BY BELDEN RUSSONELLO & STEWART AND RESEARCH/STRATEGY/MANAGEMENT
on the results of the pretest and a debriefing of the interviewers, the questionnaire was revised inseveral areas and reprogrammed. Another pretest of 28 interviews was conducted which wasalso monitored by members of the research team. Final, minor revisions were made in thequestionnaire which was then fielded. It was translated into Spanish for Spanish-speakingrespondents who preferred to be interviewed in their native language.
Field Methodology
This study contains the results of 2,366 telephone interviews with residents of the 50 UnitedStates who are 18 years of age or older. Of these, 1,501 interviews were carried out among arepresentative probability sample of the U.S. population age 18 and older. In addition, weoversampled 220 African Americans (for a total of 400), 290 Hispanic Americans (for a total of402), and 355 Asian Americans (for a total of 401). The margin of sampling error for a sample of1,501 is + 2.5 percentage points at the 95% level of confidence. Margin of sampling error foreach of the race and ethnicity subsamples of 400, 401, and 402 is + 4.9 percentage points. A moredetailed explanation of the sample frames is provided below.
The survey was conducted from January 23 through February 21, 2000. Each interview lastedapproximately 20 minutes and contained 100 questions.
The national probability sample was stratified by the four Census regions: Northeast, South,Midwest, and West. Within each region, a set of telephone numbers was generated proportionateto the population with a total pool of about 10,000 numbers after cleaning for disconnected,government, business, fax and computer tones, and non-working numbers. A combination ofrandom and fixed-digit sampling procedures was used to introduce both listed and unlistednumbers as well as new households into the available sample. The response and refusal ratesproduced by utilizing these procedures are provided elsewhere in this appendix.
The telephone numbers were organized by region into three or four “replicates” of about 1,000numbers each. Each number in the first replicate was dialed three times before interviewersmoved to a second replicate. We redialed the first replicate numbers up to ten times in an attemptto obtain an interview before replacing the number with one from the second replicate.
When contact was established, the interviewer screened for an appropriate respondent based onrace and age. For White respondents, the person in the household over 18 with the most recentbirthday was selected. For minority respondents, the oldest person in the household was selectedbecause of the sparse proportion of minorities in the World War II age cohort in the totalpopulation. The application of these procedures produced a calculable probability of beingincluded in the survey sample for each member of the target population.
Appendix A: Detailed Methodology and Statistical MethodsAARP/Modern Maturity Survey on Money and the American Family Page 3
PREPARED FOR AARP BY BELDEN RUSSONELLO & STEWART AND RESEARCH/STRATEGY/MANAGEMENT
Sample Designs
Three sampling techniques were used for the four samples. The national sample design was astraightforward random-digit dial (RDD) telephone number sample frame. It was stratified bygeographic region and gender. It produced a representative probability sample of the adultAmerican population.
The research design called for large enough samples of African and Hispanic Americans to makeaccurate projections for these groups as a whole and to examine subgroups, specifically agegenerations, gender, and income. Budgetary and time constraints required a more efficientmethod of contacting members of these groups than through a RDD sample frame where theincidence of each is relatively small. So a second sample design consisting of two parts wasdeveloped to produce targeted RDD telephone sample frames for each group.
For the first part, telephone exchange areas were overlaid with Census data on race and ethnicity.Those exchanges from areas where the density of the African American or Hispanic populationwas at least 50 percent were selected. This increased significantly the likelihood of reaching anAfrican American or Hispanic household.
To obtain a cross-section of these ethnic populations, the second part of these targeted sampleframes focused on reaching group members with higher socio-economic status. These AfricanAmericans and Hispanics would likely live in areas less densely populated with members of theirracial/ethnic groups. Once again telephone exchange areas were overlaid with Census data onrace and ethnicity for the same geographic regions. This time those exchanges from areas wherethe density of the African American or Hispanic was population was less than 50 percent wereselected. These exchanges were then crossed with neighborhood lifestyle segmentation clustersthat identified telephone exchanges that had higher than average proportions of these populationgroups and whose areas had above average income and education profiles.
These two sampling techniques produced sample frames with telephone numbers having a greaterincidence for each population group overall as well as an above average frequency of telephonenumbers likely to reach members of the groups with high socio-economic status. RDD telephoneprocedures were employed with these sample frames, and respondent race was screened at thebeginning of the interview. The resulting African American sample contains African Americans fromareas with a highly dense African American population and African Americans with high socio-economic status who do not live in largely African American neighborhoods. The resulting Hispanicsample contains Hispanics from similar strata of the Hispanic-American population.
Because of the extremely low incidence of Asian Americans in the population (less than 4 percent),another sample frame had to be developed to reach these respondents in a cost-effective and timelymanner. A national list of telephone numbers with Asian (Japanese, Korean, Chinese, Filipino,Vietnamese, and Indian) names was generated with the names that were also likely to come from otherethnic groups (e.g., Lee, Park) excluded. RDD telephone procedures were employed with the numberson the list, and respondent race was screened at the beginning of the interview.
Appendix A: Detailed Methodology and Statistical MethodsAARP/Modern Maturity Survey on Money and the American Family Page 4
PREPARED FOR AARP BY BELDEN RUSSONELLO & STEWART AND RESEARCH/STRATEGY/MANAGEMENT
Sample Weights
The racial/ethnic oversamples created disproportionate numbers of these groups in the wholesample. It became necessary to weight by race and ethnicity to align the sample on a moreproportionate basis. The screening techniques used in the interviewing also created adisproportionate number of older respondents in the oversamples. This was done purposely tohave sufficient members of the World War II generation within the racial/ethnic groups toexamine them as unique subgroups. The oversamples also produced some misalignment in thegender of each of the groups. While the overall U.S. adult population is about 52 percent femaleand 48 percent male, these proportions vary within the racial/ethnic samples. Males compose 46percent of the African American population, 51 percent of the Hispanic population, and 47percent of the Asian population. Therefore, it became necessary to weight the sample for genderas well.
The combined weight factors then are based on race/ethnicity, age, and gender. Using July 1998Census data for these factors, weights were created for the study so that it would represent theU.S. population accurately. The proportions for determining the weights are presented in thefollowing table. The weighted sample represents 2,351 cases (17 respondents in the nationalsample refused to identify a race or ethnicity and are excluded from the weight procedures). Itaccurately reflects the U.S. population for race/ethnicity, age, gender, and geographic location.
A table of the composition of the survey respondents is located below.
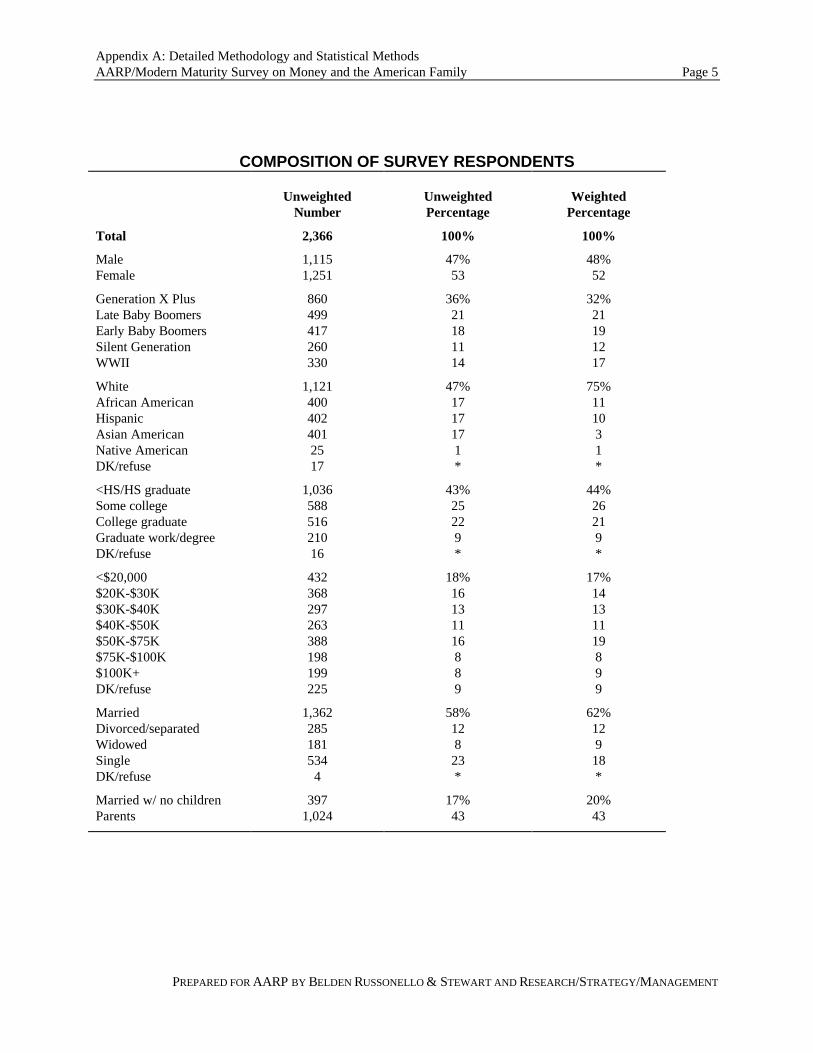
Appendix A: Detailed Methodology and Statistical MethodsAARP/Modern Maturity Survey on Money and the American Family Page 5
PREPARED FOR AARP BY BELDEN RUSSONELLO & STEWART AND RESEARCH/STRATEGY/MANAGEMENT
COMPOSITION OF SURVEY RESPONDENTS
UnweightedNumber
UnweightedPercentage
WeightedPercentage
Total 2,366 100% 100%
Male 1,115 47% 48%Female 1,251 53 52
Generation X Plus 860 36% 32%Late Baby Boomers 499 21 21Early Baby Boomers 417 18 19Silent Generation 260 11 12WWII 330 14 17
White 1,121 47% 75%African American 400 17 11Hispanic 402 17 10Asian American 401 17 3Native American 25 1 1DK/refuse 17 * *
<HS/HS graduate 1,036 43% 44%Some college 588 25 26College graduate 516 22 21Graduate work/degree 210 9 9DK/refuse 16 * *
<$20,000 432 18% 17%$20K-$30K 368 16 14$30K-$40K 297 13 13$40K-$50K 263 11 11$50K-$75K 388 16 19$75K-$100K 198 8 8$100K+ 199 8 9DK/refuse 225 9 9
Married 1,362 58% 62%Divorced/separated 285 12 12Widowed 181 8 9Single 534 23 18DK/refuse 4 * *
Married w/ no children 397 17% 20%Parents 1,024 43 43
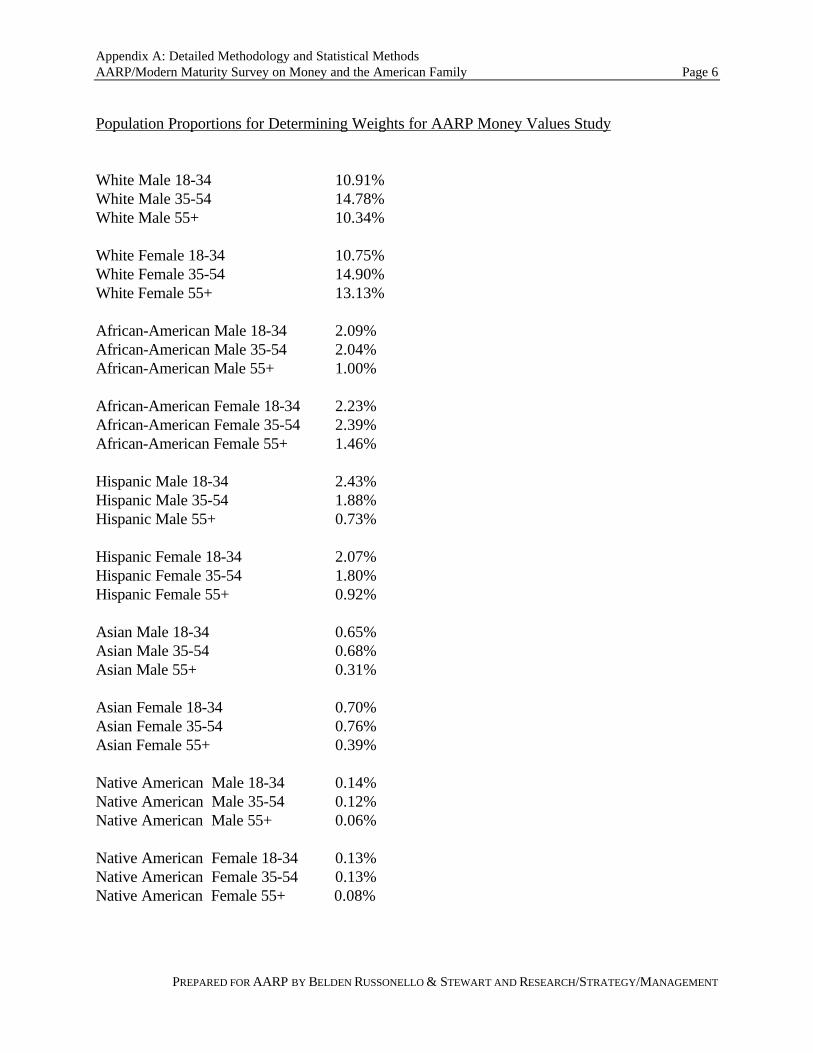
Appendix A: Detailed Methodology and Statistical MethodsAARP/Modern Maturity Survey on Money and the American Family Page 6
PREPARED FOR AARP BY BELDEN RUSSONELLO & STEWART AND RESEARCH/STRATEGY/MANAGEMENT
Population Proportions for Determining Weights for AARP Money Values Study
White Male 18-34 10.91%White Male 35-54 14.78%White Male 55+ 10.34%
White Female 18-34 10.75%White Female 35-54 14.90%White Female 55+ 13.13%
African-American Male 18-34 2.09%African-American Male 35-54 2.04%African-American Male 55+ 1.00%
African-American Female 18-34 2.23%African-American Female 35-54 2.39%African-American Female 55+ 1.46%
Hispanic Male 18-34 2.43%Hispanic Male 35-54 1.88%Hispanic Male 55+ 0.73%
Hispanic Female 18-34 2.07%Hispanic Female 35-54 1.80%Hispanic Female 55+ 0.92%
Asian Male 18-34 0.65%Asian Male 35-54 0.68%Asian Male 55+ 0.31%
Asian Female 18-34 0.70%Asian Female 35-54 0.76%Asian Female 55+ 0.39%
Native American Male 18-34 0.14%Native American Male 35-54 0.12%Native American Male 55+ 0.06%
Native American Female 18-34 0.13%Native American Female 35-54 0.13%Native American Female 55+ 0.08%
Appendix A: Detailed Methodology and Statistical MethodsAARP/Modern Maturity Survey on Money and the American Family Page 7
PREPARED FOR AARP BY BELDEN RUSSONELLO & STEWART AND RESEARCH/STRATEGY/MANAGEMENT
B. Statistical Methods
Introduction
In survey research, statistics serve two essential functions. The first role is to provide a methodfor organizing, summarizing, and communicating the data that represent the opinions, attitudes,behaviors, and personal characteristics measured in the surveys. The set of mathematicalprocedures serving this function is called descriptive statistics because it characterizes the basicnature of the data. Frequency counts, percentages, and means or averages are mathematicalmethods for effectively organizing, displaying, and communicating survey data recognizable tomost people.
The second function, inferential statistics, is a body of mathematical procedures for arriving atconclusions advancing beyond the description of the survey data to the relationship among them.One group of procedures displays and measures the relation among two variables and thesignificance of the measures of associations. For example, common to most users of surveyresearch is bivariate statistics such as a cross tabulation--the display of data from two categoricalvariables in a simple tabular format with tests of significance (e.g., chi-squares) and a simpleregression -- the measure of the linear relationship between two quantitative variables that can bedepicted in a graph with tests of significance (e.g., correlations).
Somewhat less common to survey research users is multivariate statistics such as multiple linearregression, factor analysis, and cluster analysis. There are often several variables and sometimesmany variables each of which may contribute to the understanding of the relation among thevariables in the survey data. These statistical procedures help to tease out such relationships andassociations. Because some of these techniques were used to guide the analysis of the data in thissurvey project, a brief explanation of the ones used and a description of how they were applied tothe data and used in the analysis are presented below.
Factor Analysis
Factor analysis is an appropriate technique to examine large numbers of variables by groupingthem according to how they correlate with each other. Variables in one group or factor are morecorrelated with each other than they are with variables in other factors. This summarizes manyvariables into a few factors, essentially reducing the number of items necessary to analyze. It alsocreates the opportunity to interpret each factor according to the meaning of the variables makingup the factor. In essence, it permits underlying attitudinal dimensions to be identified to helpunravel and understand the structure of the variables measured in the survey.
Appendix A: Detailed Methodology and Statistical MethodsAARP/Modern Maturity Survey on Money and the American Family Page 8
PREPARED FOR AARP BY BELDEN RUSSONELLO & STEWART AND RESEARCH/STRATEGY/MANAGEMENT
For this study, factor analyses were performed for each of three sets of questions: the valuequestions (2-11); the money can buy questions (23-31); and the money is important questions(54-61), and for all three sets of questions combined. Following accepted practices, individualvariables were dropped if they did not load strongly (above .40) with any factor (both in theseparate and combined factor runs). Basically, seven underlying attitudinal dimensions emergefrom the data in these three sets of questions:
Money Important to Provide the Basics (for health and getting medical attention, for the family,and for helping friends and family -- Q54-56, and 61)
Money Can Buy Inner Peace (money can buy togetherness, self-fulfillment, love, self-esteem --Q27-29 and 31)
Money Important for Tangible Things (travel, having more things, free time -- Q57-59)
Tangible Values Necessary for Success (interesting job, earning lots of money, getting aneducation, seeing the world, and a long life -- Q2-4, 7, and 9)
Money Can Buy External Relief (freedom, less stress, peace of mind -- Q23, 24, and 30)
Faith and Charity (help others value -- Q8, money is important for charity -- Q60, and strong faithvalue -- Q11) -- this is only factor that crosses questionnaire section lines
Family Values (importance of a good marriage and good relationship with one’s children -- Q5and 6)
Scales were created for each of these factors. Two other scales of groups of questions wherethere were high correlations between the variables were also created -- A Money Matters Scalebased on Q2 and Q17 and Contentment Scale for Q12 through Q16. Scales were used asdependent variables for the multiple regression discussed below.
Multiple Linear Regression
Multiple linear regression investigates the extent to which all independent variables (e.g., age,income, race, sex) considered together influence the dependent variable(s) (the various attitudesunder investigation). Furthermore, regression analyses may indicate which of the independentvariables have the greater affect on the various attitudes and opinions being examined.Regression also helps determine whether a statistically significant influence of an independentvariable (such as race) on a dependent variable (such as vote behavior) indicates a real orsuperficial relationship by controlling for other independent variables (such as income andeducation).
Appendix A: Detailed Methodology and Statistical MethodsAARP/Modern Maturity Survey on Money and the American Family Page 9
PREPARED FOR AARP BY BELDEN RUSSONELLO & STEWART AND RESEARCH/STRATEGY/MANAGEMENT
For this study, multiple linear regression analyses were run against the nine scales to determinewhat the dominant predictor variables would be for each one. Predictors for the Contentmentscale were not too surprising. One's income and health are the two strongest predictors, and thenage (older), education (better), home ownership, Asian, and Hispanic contribute in a positive way.That is to say that those who are older, well-educated, home owners, or of Asian or Hispanicancestry are more content than their counterparts. Being a woman and being divorced orseparated (regardless of gender) contribute in a negative direction (i.e., these two groups are lesscontent). Living alone is not related to one's level of contentment, but being a lone adult withchildren under 18 is definitely related to low contentment. These variables account for a sizeablepercent of the variance being explained, indicating good differentiation on the scale betweendifferent types of people.
We then ran regressions on the seven factor scales and also looked at the individual variables(Q17 -- be wealthy, Q2 -- importance of money to success) of the Money Matters scale. Wefound a variety of patterns.
The Money Matters, Tangible Values Necessary for Success, and Money Important for TangibleThings scales have common predictors:
Income (+) -- the better off you are the more money you want and want to spendAge (-) -- the younger you are the more money you want and want to spendMinority status -- Asian and African Americans and Hispanics show up consistently but not in anyone definite patternHealth (-) -- the poorer you think your health is the more money mattersGender -- men are more positive than women on these scales and variables
Some of these predictors are quite different than the predictors for the Contentment Scale and thisbecame important when the cluster analyses were performed.
The Money Can Buy External Relief scale had a slightly different set of predictors:
Income (+)Education (+)Living alone, being divorced/separatedWhiteGender (men)
Appendix A: Detailed Methodology and Statistical MethodsAARP/Modern Maturity Survey on Money and the American Family Page 10
PREPARED FOR AARP BY BELDEN RUSSONELLO & STEWART AND RESEARCH/STRATEGY/MANAGEMENT
The three less tangible scales, Money Can Buy Inner Peace, Faith and Charity, and Family Valuesusually had similar predictors but different ones than the more tangible scales:
Non-WhiteEducation (-) -- Less-well educated have these views more than the well-educatedAge (+) -- Older respondents have these views more than younger onesIncome (-) -- Lower income have these views more than more affluent peopleMarried -- gender varied, men on Factor 2, women on Factor 6
Money Important to Provide the Basics scale is a near universal value with most people scoringtoward the high end of the scale. The regression identified a rather odd set of predictors:
Education (-)Non-AsianAge (-) but not too strongNot live aloneDivorced/Separated
The single parent/guardian type family did not show up on any of the regressions except for theContentment scale.
Cluster Analysis
Cluster analysis is another multivariate tool for discovering groupings in the data. It is used whenthe data do not appear to be homogeneous and one wants to determine whether distinct groups ofpeople exist or to classify the data into groups of people based on particular variables. Unlikefactor analysis, which has an underlying theoretical model, cluster analysis is more ad hoc. Onemay change the variables in the analysis and specify how many clusters or groupings to create andrepeat this process until distinct groups of people emerge that fit the context of the study.
These procedures were followed for this study. Based on the regression results, several of thefactor scales and individual variables were tested in a series of cluster analyses to see if there wereany groupings of people with distinct demographic characteristics and attitudes about money.Initially, none of the various combinations proved very successful, usually because the scales didnot differentiate enough or the demographics did not always vary from cluster to cluster in adistinct way.
Re-examining the predictors of the Contentment scale (Q12-16) and the Money Matters scale (Q2and Q17) revealed that they had different and sometimes opposite groups of predictors (e.g.,older people are more content, younger ones see money as necessary for success and want to bewealthy) as well as similar ones (men are higher on each scale than women). A series of clusteranalyses were run on these two scales without any demographics, looking for the best fit ofcontentment (high/low) and money matters (does/does not).
Appendix A: Detailed Methodology and Statistical MethodsAARP/Modern Maturity Survey on Money and the American Family Page 11
PREPARED FOR AARP BY BELDEN RUSSONELLO & STEWART AND RESEARCH/STRATEGY/MANAGEMENT
The best statistical fit of the data was a 5-cluster grouping based on their positions on the twoscales:
Among the clusters, the Left Out group is the most discontented and has a very high moneymatters score.American Dreamer cluster is below average contentment and has a very high money mattersscore.Happy Achiever segment is highly contented and also scores high on the money matters scale.The Settled & Satisfied group is above average in contentment but has a low money mattersscore.Finally, the Wealth-averse cluster is fairly discontent and is lowest on money matters.
To determine the attitudinal and demographic make-up of these clusters, mean analyses againstthe factor scales and crosstables against the demographics and other descriptor variables wereexecuted. These show that the Contentment and Money Matters scales actually fit nicely togetherto create very distinct demographic, household, health, debt, retirement, and money or valuegroupings. These groupings were the best arrangement of all the variables in the study identifiedand became the basis for a portion of the report.
Summary
The report contains findings based on several analytical approaches. Descriptive statistics areused to describe, organize and display the basic findings. Then inferential statistics are employedto advance the findings in several areas. Bivariate analyses identify basic relations among thedata. Multiple regression specifies which independent variables are the most important in thoserelationships. Factor analysis groups the variables into similar dimensions, reducing the amount ofdata one has to analyze. It also permits unobserved associations to be identified among the data.Finally, cluster analysis groups the sample into unique clusters of people with distinctdemographic and attitudinal profiles.
Appendix A: Detailed Methodology and Statistical MethodsAARP/Modern Maturity Survey on Money and the American Family Page 12
PREPARED FOR AARP BY BELDEN RUSSONELLO & STEWART AND RESEARCH/STRATEGY/MANAGEMENT
C. Response and Refusal Rates for AARP Money Values Survey
Introduction
The response and refusal rates calculated below are based on the Standard Definitions of theAmerican Association for Public Opinion Research (AAPOR) for the final dispositions of casescodes and outcome rates for RDD telephone surveys. The Standard Definitions are taken fromAAPOR’s website (www.aapor.org) as of December 9, 1999. We also take into account therecommendation from the AAPOR Council in a January 31, 2000 letter from AAPOR’s presidentto provide information about what happened to every element in the sample [to] permit aknowledgeable consumer to calculate any of the different rates described at the end of theStandard Definitions document.
While AAPOR provides standard definitions for disposition codes for sample units, it does notprovide a singular standard response or refusal rate formula. AAPOR suggests a number ofoutcome dispositions consisting of six formulae for response rates, three formulae for refusalrates, four formulae for cooperation rates, and three formulae for contact rates. We provide theinformation so that any of the formulae can be used. We also calculate response and refusal ratesfor the national sample, and each of the oversamples (African American, Hispanic, and Asian)based on one of the formulae offered by AAPOR for determining each of these rates.
Sample Unit Final Dispositions
The accompanying table displays the final disposition outcomes and codes for the sample units(telephone numbers) used for each of the samples in the study. The nature of each of the samplesis slightly different (see section on Sample Design) so rates can only be calculated for each of thesamples. Therefore, there is no overall response or refusal rate for the study. The codes are thosedesignated by AAPOR and will be used in the formulae for determining response and refusalrates.
The final dispositions are fairly clear. The sampling units produced completed interviews,refusals, non-contacts (eligible persons unavailable to be interviewed), other cases where therewas an inability to interview eligible persons (usually due to a language barrier), numbers withunknown statuses (no answer or busy on every contact attempt for up to ten attempts in somecases), and ineligible cases. This information can be used to calculate any of the AAPOR rates foroutcome distributions.
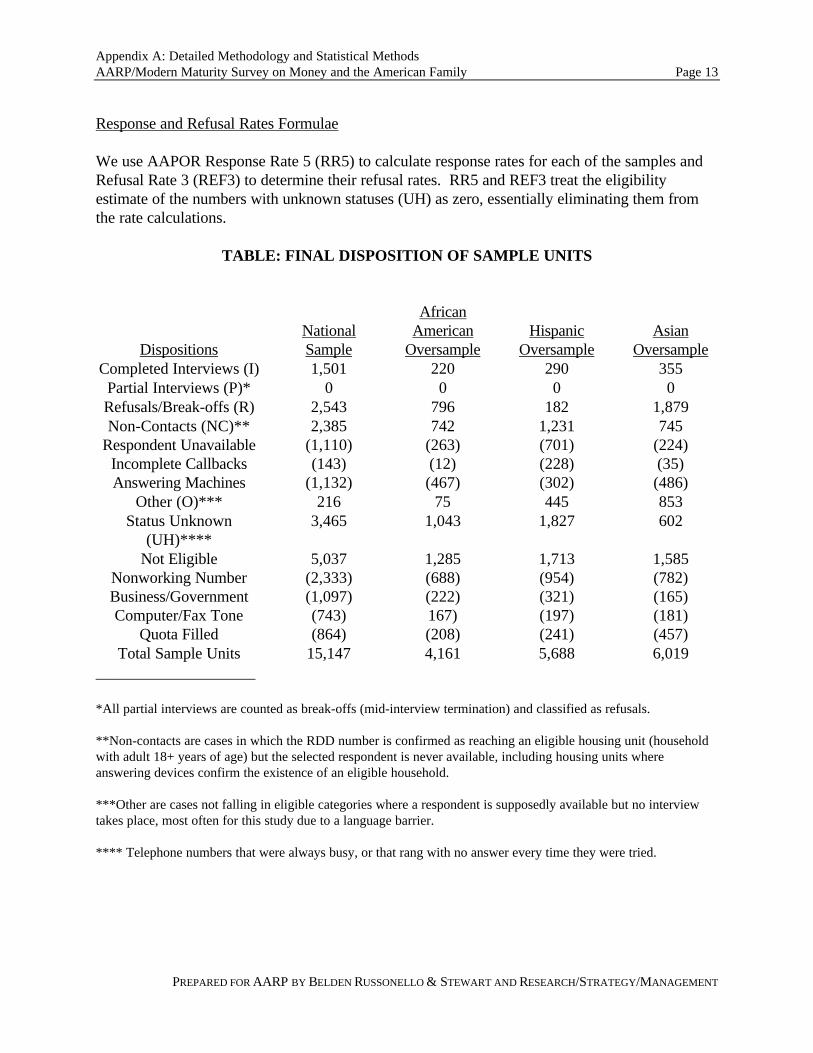
Appendix A: Detailed Methodology and Statistical MethodsAARP/Modern Maturity Survey on Money and the American Family Page 13
PREPARED FOR AARP BY BELDEN RUSSONELLO & STEWART AND RESEARCH/STRATEGY/MANAGEMENT
Response and Refusal Rates Formulae
We use AAPOR Response Rate 5 (RR5) to calculate response rates for each of the samples andRefusal Rate 3 (REF3) to determine their refusal rates. RR5 and REF3 treat the eligibilityestimate of the numbers with unknown statuses (UH) as zero, essentially eliminating them fromthe rate calculations.
TABLE: FINAL DISPOSITION OF SAMPLE UNITS
DispositionsNationalSample
AfricanAmerican
OversampleHispanic
OversampleAsian
OversampleCompleted Interviews (I) 1,501 220 290 355
Partial Interviews (P)* 0 0 0 0Refusals/Break-offs (R) 2,543 796 182 1,879Non-Contacts (NC)**
Respondent UnavailableIncomplete CallbacksAnswering Machines
2,385(1,110)(143)
(1,132)
742(263)(12)(467)
1,231(701)(228)(302)
745(224)(35)(486)
Other (O)*** 216 75 445 853Status Unknown
(UH)****3,465 1,043 1,827 602
Not EligibleNonworking NumberBusiness/GovernmentComputer/Fax Tone
Quota Filled
5,037(2,333)(1,097)(743)(864)
1,285(688)(222)167)(208)
1,713(954)(321)(197)(241)
1,585(782)(165)(181)(457)
Total Sample Units 15,147 4,161 5,688 6,019____________________
*All partial interviews are counted as break-offs (mid-interview termination) and classified as refusals.
**Non-contacts are cases in which the RDD number is confirmed as reaching an eligible housing unit (householdwith adult 18+ years of age) but the selected respondent is never available, including housing units whereanswering devices confirm the existence of an eligible household.
***Other are cases not falling in eligible categories where a respondent is supposedly available but no interviewtakes place, most often for this study due to a language barrier.
**** Telephone numbers that were always busy, or that rang with no answer every time they were tried.
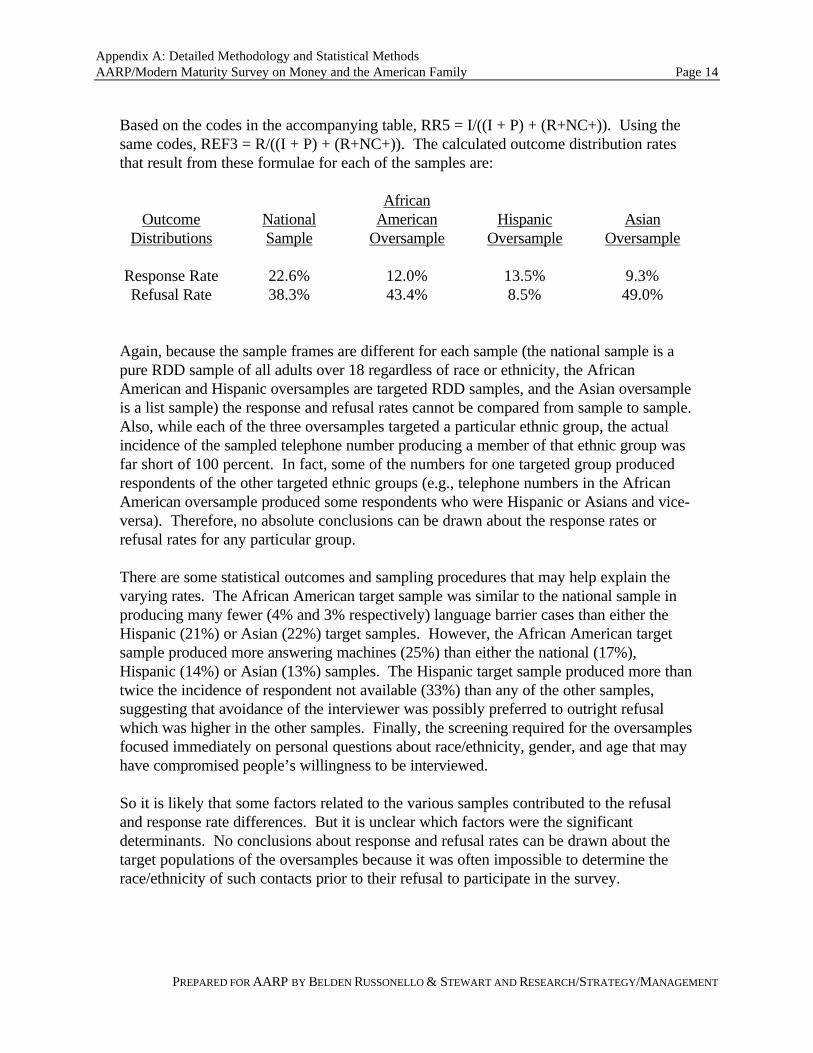
Appendix A: Detailed Methodology and Statistical MethodsAARP/Modern Maturity Survey on Money and the American Family Page 14
PREPARED FOR AARP BY BELDEN RUSSONELLO & STEWART AND RESEARCH/STRATEGY/MANAGEMENT
Based on the codes in the accompanying table, RR5 = I/((I + P) + (R+NC+)). Using thesame codes, REF3 = R/((I + P) + (R+NC+)). The calculated outcome distribution ratesthat result from these formulae for each of the samples are:
OutcomeDistributions
NationalSample
AfricanAmerican
OversampleHispanic
OversampleAsian
Oversample
Response Rate 22.6% 12.0% 13.5% 9.3%Refusal Rate 38.3% 43.4% 8.5% 49.0%
Again, because the sample frames are different for each sample (the national sample is apure RDD sample of all adults over 18 regardless of race or ethnicity, the AfricanAmerican and Hispanic oversamples are targeted RDD samples, and the Asian oversampleis a list sample) the response and refusal rates cannot be compared from sample to sample.Also, while each of the three oversamples targeted a particular ethnic group, the actualincidence of the sampled telephone number producing a member of that ethnic group wasfar short of 100 percent. In fact, some of the numbers for one targeted group producedrespondents of the other targeted ethnic groups (e.g., telephone numbers in the AfricanAmerican oversample produced some respondents who were Hispanic or Asians and vice-versa). Therefore, no absolute conclusions can be drawn about the response rates orrefusal rates for any particular group.
There are some statistical outcomes and sampling procedures that may help explain thevarying rates. The African American target sample was similar to the national sample inproducing many fewer (4% and 3% respectively) language barrier cases than either theHispanic (21%) or Asian (22%) target samples. However, the African American targetsample produced more answering machines (25%) than either the national (17%),Hispanic (14%) or Asian (13%) samples. The Hispanic target sample produced more thantwice the incidence of respondent not available (33%) than any of the other samples,suggesting that avoidance of the interviewer was possibly preferred to outright refusalwhich was higher in the other samples. Finally, the screening required for the oversamplesfocused immediately on personal questions about race/ethnicity, gender, and age that mayhave compromised people’s willingness to be interviewed.
So it is likely that some factors related to the various samples contributed to the refusaland response rate differences. But it is unclear which factors were the significantdeterminants. No conclusions about response and refusal rates can be drawn about thetarget populations of the oversamples because it was often impossible to determine therace/ethnicity of such contacts prior to their refusal to participate in the survey.
PREPARED FOR AARP BY BELDEN RUSSONELLO & STEWART AND RESEARCH/STRATEGY/MANAGEMENT
Appendix B:Questionnaire with Response Totals
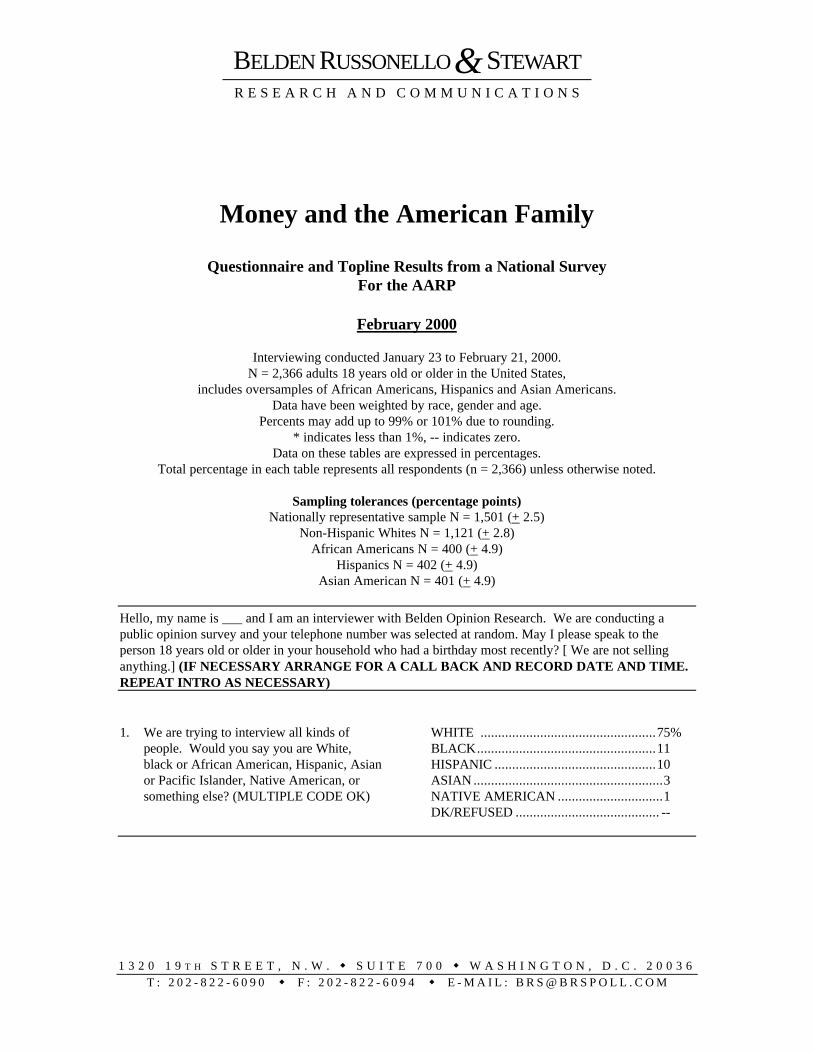
BELDEN RUSSONELLO & STEWARTR E S E A R C H A N D C O M M U N I C A T I O N S
1 3 2 0 1 9 T H S T R E E T , N . W . w S U I T E 7 0 0 w W A S H I N G T O N , D . C . 2 0 0 3 6T : 2 0 2 - 8 2 2 - 6 0 9 0 w F : 2 0 2 - 8 2 2 - 6 0 9 4 w E - M A I L : B R S @ B R S P O L L . C O M
Money and the American Family
Questionnaire and Topline Results from a National SurveyFor the AARP
February 2000
Interviewing conducted January 23 to February 21, 2000.N = 2,366 adults 18 years old or older in the United States,
includes oversamples of African Americans, Hispanics and Asian Americans.Data have been weighted by race, gender and age.
Percents may add up to 99% or 101% due to rounding.* indicates less than 1%, -- indicates zero.
Data on these tables are expressed in percentages.Total percentage in each table represents all respondents (n = 2,366) unless otherwise noted.
Sampling tolerances (percentage points)Nationally representative sample N = 1,501 (+ 2.5)
Non-Hispanic Whites N = 1,121 (+ 2.8)African Americans N = 400 (+ 4.9)
Hispanics N = 402 (+ 4.9)Asian American N = 401 (+ 4.9)
Hello, my name is ___ and I am an interviewer with Belden Opinion Research. We are conducting apublic opinion survey and your telephone number was selected at random. May I please speak to theperson 18 years old or older in your household who had a birthday most recently? [ We are not sellinganything.] (IF NECESSARY ARRANGE FOR A CALL BACK AND RECORD DATE AND TIME.REPEAT INTRO AS NECESSARY)
1. We are trying to interview all kinds ofpeople. Would you say you are White,black or African American, Hispanic, Asianor Pacific Islander, Native American, orsomething else? (MULTIPLE CODE OK)
WHITE ..................................................75%BLACK...................................................11HISPANIC ..............................................10ASIAN ......................................................3NATIVE AMERICAN ..............................1DK/REFUSED ......................................... --
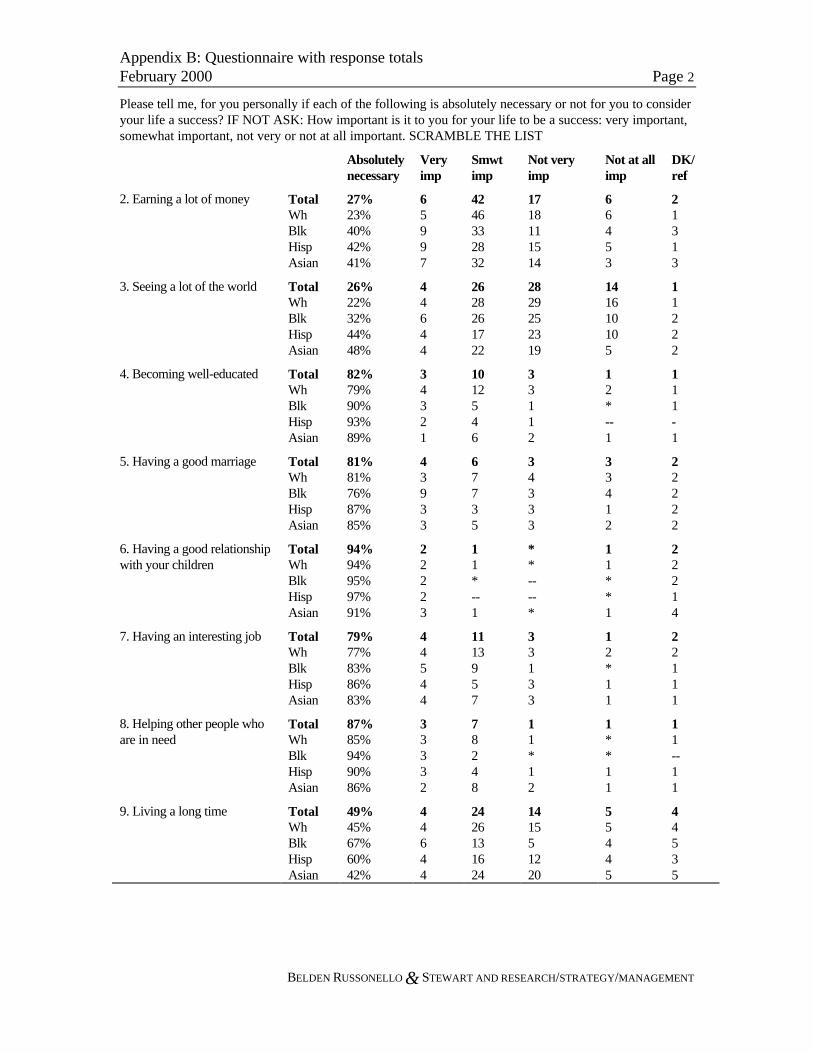
Appendix B: Questionnaire with response totalsFebruary 2000 Page 2
BELDEN RUSSONELLO & STEWART AND RESEARCH/STRATEGY/MANAGEMENT
Please tell me, for you personally if each of the following is absolutely necessary or not for you to consideryour life a success? IF NOT ASK: How important is it to you for your life to be a success: very important,somewhat important, not very or not at all important. SCRAMBLE THE LIST
Absolutelynecessary
Veryimp
Smwtimp
Not veryimp
Not at allimp
DK/ref
2. Earning a lot of money TotalWhBlkHispAsian
27%23%40%42%41%
65997
4246332832
1718111514
66453
21313
3. Seeing a lot of the world TotalWhBlkHispAsian
26%22%32%44%48%
44644
2628261722
2829252319
141610105
11222
4. Becoming well-educated TotalWhBlkHispAsian
82%79%90%93%89%
34321
1012546
33112
12*--1
111-1
5. Having a good marriage TotalWhBlkHispAsian
81%81%76%87%85%
43933
67735
34333
33412
22222
6. Having a good relationshipwith your children
TotalWhBlkHispAsian
94%94%95%97%91%
22223
11*--1
**----*
11**1
22214
7. Having an interesting job TotalWhBlkHispAsian
79%77%83%86%83%
44544
1113957
33133
12*11
22111
8. Helping other people whoare in need
TotalWhBlkHispAsian
87%85%94%90%86%
33332
78248
11*12
1**11
11--11
9. Living a long time TotalWhBlkHispAsian
49%45%67%60%42%
44644
2426131624
141551220
55445
44535
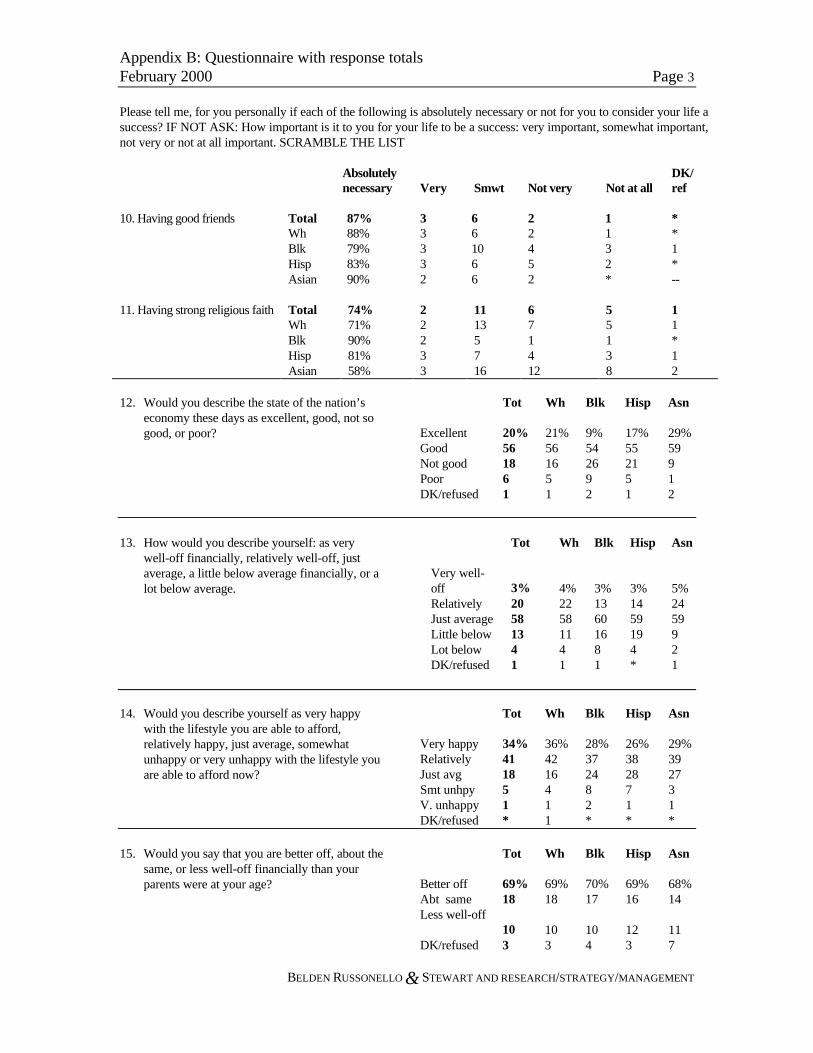
Appendix B: Questionnaire with response totalsFebruary 2000 Page 3
BELDEN RUSSONELLO & STEWART AND RESEARCH/STRATEGY/MANAGEMENT
Please tell me, for you personally if each of the following is absolutely necessary or not for you to consider your life asuccess? IF NOT ASK: How important is it to you for your life to be a success: very important, somewhat important,not very or not at all important. SCRAMBLE THE LIST
Absolutelynecessary Very Smwt Not very Not at all
DK/ref
10. Having good friends TotalWhBlkHispAsian
87%88%79%83%90%
33332
661066
22452
1132*
**1*--
11. Having strong religious faith TotalWhBlkHispAsian
74%71%90%81%58%
22233
11135716
671412
55138
11*12
12. Would you describe the state of the nation’seconomy these days as excellent, good, not sogood, or poor?
Tot Wh Blk Hisp Asn
Excellent 20% 21% 9% 17% 29%Good 56 56 54 55 59Not good 18 16 26 21 9Poor 6 5 9 5 1DK/refused 1 1 2 1 2
13. How would you describe yourself: as verywell-off financially, relatively well-off, justaverage, a little below average financially, or alot below average.
Tot Wh Blk Hisp Asn
Very well-off 3% 4% 3% 3% 5%Relatively 20 22 13 14 24Just average 58 58 60 59 59Little below 13 11 16 19 9Lot below 4 4 8 4 2DK/refused 1 1 1 * 1
14. Would you describe yourself as very happywith the lifestyle you are able to afford,relatively happy, just average, somewhatunhappy or very unhappy with the lifestyle youare able to afford now?
Tot Wh Blk Hisp Asn
Very happy 34% 36% 28% 26% 29%Relatively 41 42 37 38 39Just avg 18 16 24 28 27Smt unhpy 5 4 8 7 3V. unhappy 1 1 2 1 1DK/refused * 1 * * *
15. Would you say that you are better off, about thesame, or less well-off financially than yourparents were at your age?
Tot Wh Blk Hisp Asn
Better off 69% 69% 70% 69% 68%Abt same 18 18 17 16 14Less well-off
10 10 10 12 11DK/refused 3 3 4 3 7
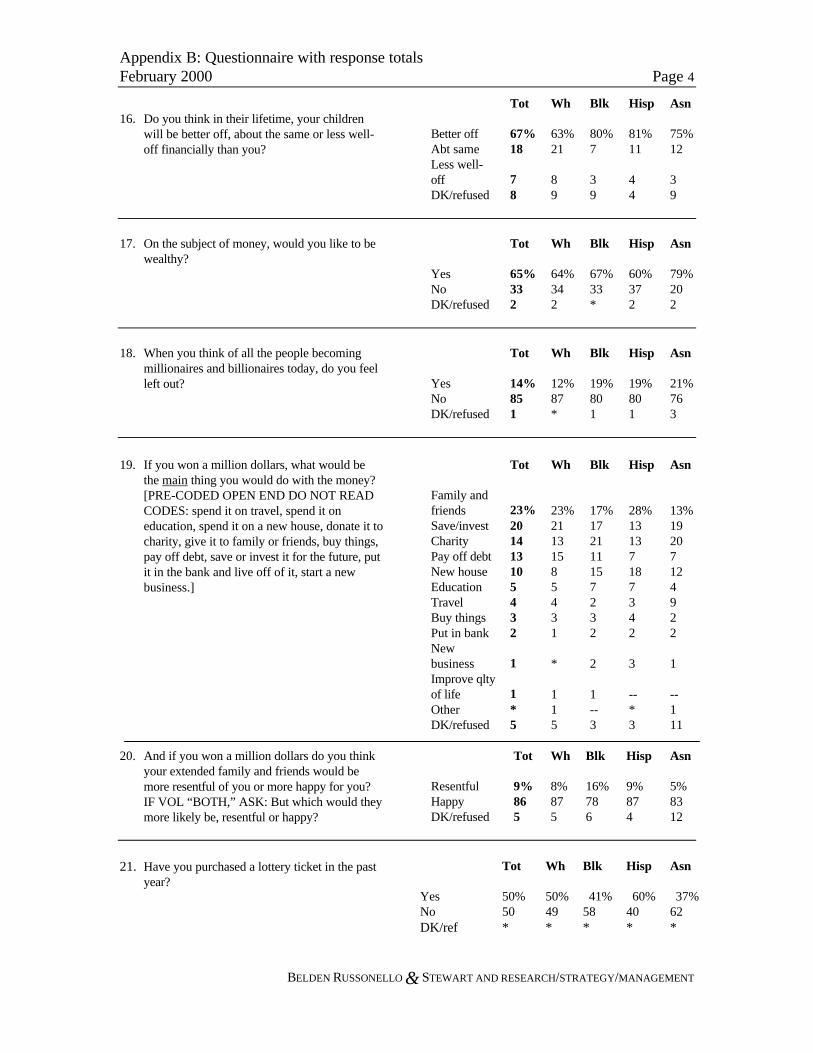
Appendix B: Questionnaire with response totalsFebruary 2000 Page 4
BELDEN RUSSONELLO & STEWART AND RESEARCH/STRATEGY/MANAGEMENT
16. Do you think in their lifetime, your childrenwill be better off, about the same or less well-off financially than you?
Tot Wh Blk Hisp Asn
Better off 67% 63% 80% 81% 75%Abt same 18 21 7 11 12Less well-off 7 8 3 4 3DK/refused 8 9 9 4 9
17. On the subject of money, would you like to bewealthy?
Tot Wh Blk Hisp Asn
Yes 65% 64% 67% 60% 79%No 33 34 33 37 20DK/refused 2 2 * 2 2
18. When you think of all the people becomingmillionaires and billionaires today, do you feelleft out?
Tot Wh Blk Hisp Asn
Yes 14% 12% 19% 19% 21%No 85 87 80 80 76DK/refused 1 * 1 1 3
19. If you won a million dollars, what would bethe main thing you would do with the money?[PRE-CODED OPEN END DO NOT READCODES: spend it on travel, spend it oneducation, spend it on a new house, donate it tocharity, give it to family or friends, buy things,pay off debt, save or invest it for the future, putit in the bank and live off of it, start a newbusiness.]
Tot Wh Blk Hisp Asn
Family andfriends 23% 23% 17% 28% 13%Save/invest 20 21 17 13 19Charity 14 13 21 13 20Pay off debt 13 15 11 7 7New house 10 8 15 18 12Education 5 5 7 7 4Travel 4 4 2 3 9Buy things 3 3 3 4 2Put in bank 2 1 2 2 2Newbusiness 1 * 2 3 1Improve qltyof life 1 1 1 -- --Other * 1 -- * 1DK/refused 5 5 3 3 11
20. And if you won a million dollars do you thinkyour extended family and friends would bemore resentful of you or more happy for you?IF VOL “BOTH,” ASK: But which would theymore likely be, resentful or happy?
Tot Wh Blk Hisp Asn
Resentful 9% 8% 16% 9% 5%Happy 86 87 78 87 83DK/refused 5 5 6 4 12
21. Have you purchased a lottery ticket in the pastyear?
Tot Wh Blk Hisp Asn
Yes 50% 50% 41% 60% 37%No 50 49 58 40 62DK/ref * * * * *
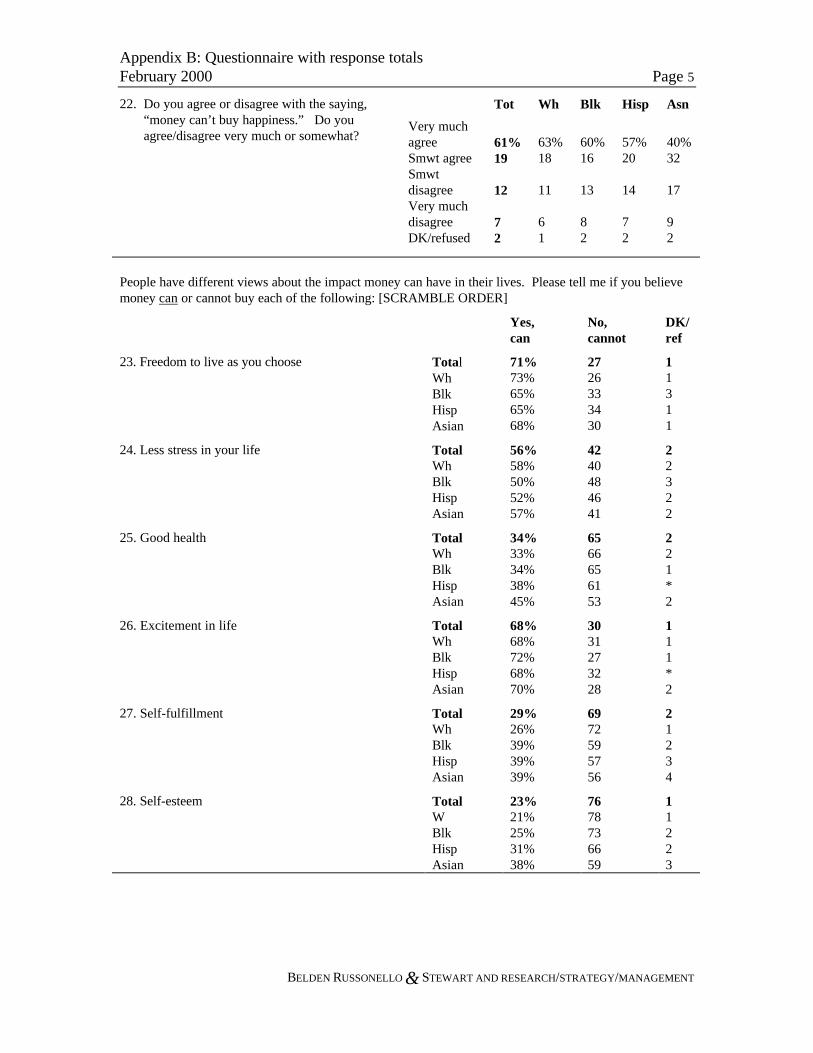
Appendix B: Questionnaire with response totalsFebruary 2000 Page 5
BELDEN RUSSONELLO & STEWART AND RESEARCH/STRATEGY/MANAGEMENT
22. Do you agree or disagree with the saying,“money can’t buy happiness.” Do youagree/disagree very much or somewhat?
Tot Wh Blk Hisp Asn
Very muchagree 61% 63% 60% 57% 40%Smwt agree 19 18 16 20 32Smwtdisagree 12 11 13 14 17Very muchdisagree 7 6 8 7 9DK/refused 2 1 2 2 2
People have different views about the impact money can have in their lives. Please tell me if you believemoney can or cannot buy each of the following: [SCRAMBLE ORDER]
Yes,can
No,cannot
DK/ref
23. Freedom to live as you choose TotalWhBlkHispAsian
71%73%65%65%68%
2726333430
11311
24. Less stress in your life TotalWhBlkHispAsian
56%58%50%52%57%
4240484641
22322
25. Good health TotalWhBlkHispAsian
34%33%34%38%45%
6566656153
221*2
26. Excitement in life TotalWhBlkHispAsian
68%68%72%68%70%
3031273228
111*2
27. Self-fulfillment TotalWhBlkHispAsian
29%26%39%39%39%
6972595756
21234
28. Self-esteem TotalWBlkHispAsian
23%21%25%31%38%
7678736659
11223
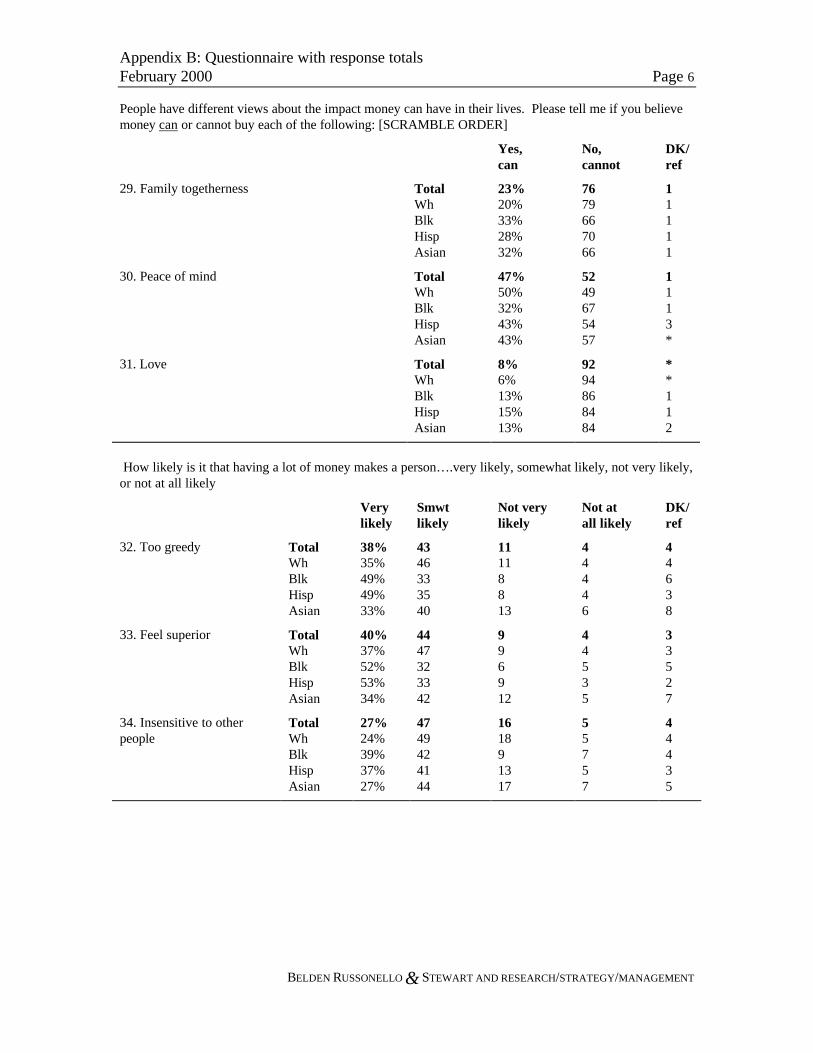
Appendix B: Questionnaire with response totalsFebruary 2000 Page 6
BELDEN RUSSONELLO & STEWART AND RESEARCH/STRATEGY/MANAGEMENT
People have different views about the impact money can have in their lives. Please tell me if you believemoney can or cannot buy each of the following: [SCRAMBLE ORDER]
Yes,can
No,cannot
DK/ref
29. Family togetherness TotalWhBlkHispAsian
23%20%33%28%32%
7679667066
11111
30. Peace of mind TotalWhBlkHispAsian
47%50%32%43%43%
5249675457
1113*
31. Love TotalWhBlkHispAsian
8%6%13%15%13%
9294868484
**112
How likely is it that having a lot of money makes a person….very likely, somewhat likely, not very likely,or not at all likely
Verylikely
Smwtlikely
Not verylikely
Not atall likely
DK/ref
32. Too greedy TotalWhBlkHispAsian
38%35%49%49%33%
4346333540
11118813
44446
44638
33. Feel superior TotalWhBlkHispAsian
40%37%52%53%34%
4447323342
996912
44535
33527
34. Insensitive to otherpeople
TotalWhBlkHispAsian
27%24%39%37%27%
4749424144
161891317
55757
44435
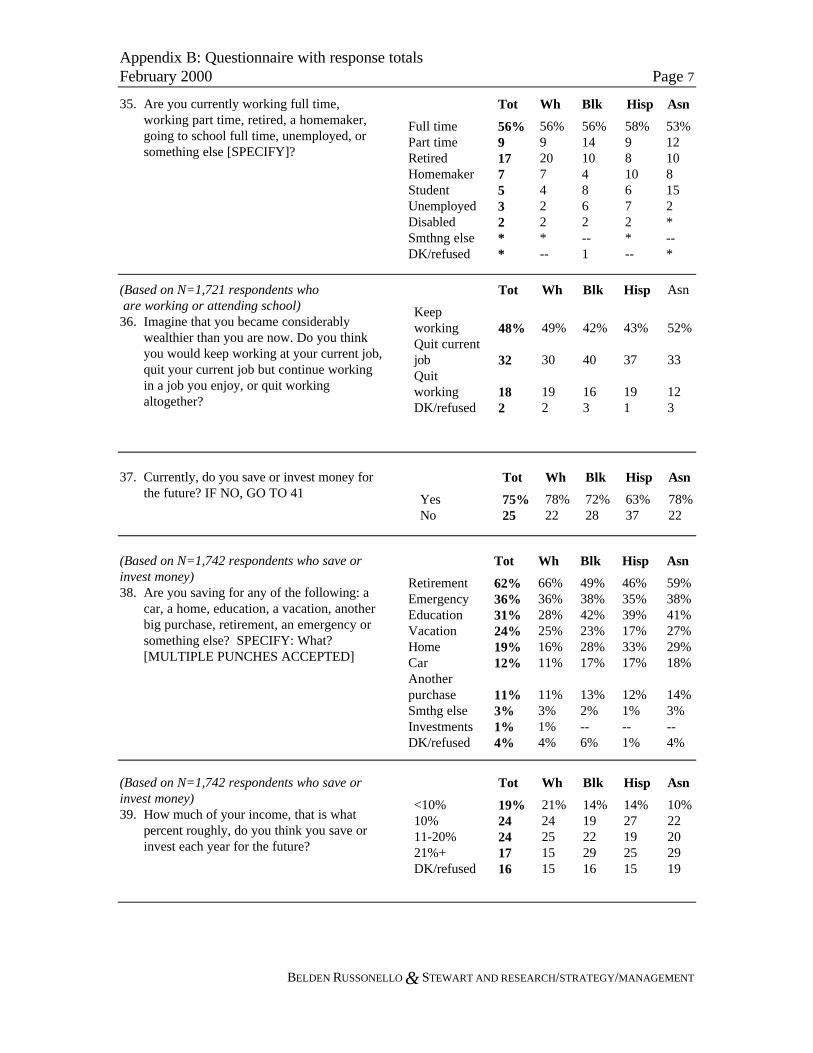
Appendix B: Questionnaire with response totalsFebruary 2000 Page 7
BELDEN RUSSONELLO & STEWART AND RESEARCH/STRATEGY/MANAGEMENT
35. Are you currently working full time,working part time, retired, a homemaker,going to school full time, unemployed, orsomething else [SPECIFY]?
Tot Wh Blk Hisp Asn
Full time 56% 56% 56% 58% 53%Part time 9 9 14 9 12Retired 17 20 10 8 10Homemaker 7 7 4 10 8Student 5 4 8 6 15Unemployed 3 2 6 7 2Disabled 2 2 2 2 *Smthng else * * -- * --DK/refused * -- 1 -- *
(Based on N=1,721 respondents who are working or attending school)36. Imagine that you became considerably
wealthier than you are now. Do you thinkyou would keep working at your current job,quit your current job but continue workingin a job you enjoy, or quit workingaltogether?
Tot Wh Blk Hisp Asn
Keepworking 48% 49% 42% 43% 52%Quit currentjob 32 30 40 37 33Quitworking 18 19 16 19 12DK/refused 2 2 3 1 3
37. Currently, do you save or invest money forthe future? IF NO, GO TO 41
Tot Wh Blk Hisp Asn
Yes 75% 78% 72% 63% 78%No 25 22 28 37 22
(Based on N=1,742 respondents who save orinvest money)38. Are you saving for any of the following: a
car, a home, education, a vacation, anotherbig purchase, retirement, an emergency orsomething else? SPECIFY: What?[MULTIPLE PUNCHES ACCEPTED]
Tot Wh Blk Hisp Asn
Retirement 62% 66% 49% 46% 59%Emergency 36% 36% 38% 35% 38%Education 31% 28% 42% 39% 41%Vacation 24% 25% 23% 17% 27%Home 19% 16% 28% 33% 29%Car 12% 11% 17% 17% 18%Anotherpurchase 11% 11% 13% 12% 14%Smthg else 3% 3% 2% 1% 3%Investments 1% 1% -- -- --DK/refused 4% 4% 6% 1% 4%
(Based on N=1,742 respondents who save orinvest money)39. How much of your income, that is what
percent roughly, do you think you save orinvest each year for the future?
Tot Wh Blk Hisp Asn
<10% 19% 21% 14% 14% 10%10% 24 24 19 27 2211-20% 24 25 22 19 2021%+ 17 15 29 25 29DK/refused 16 15 16 15 19
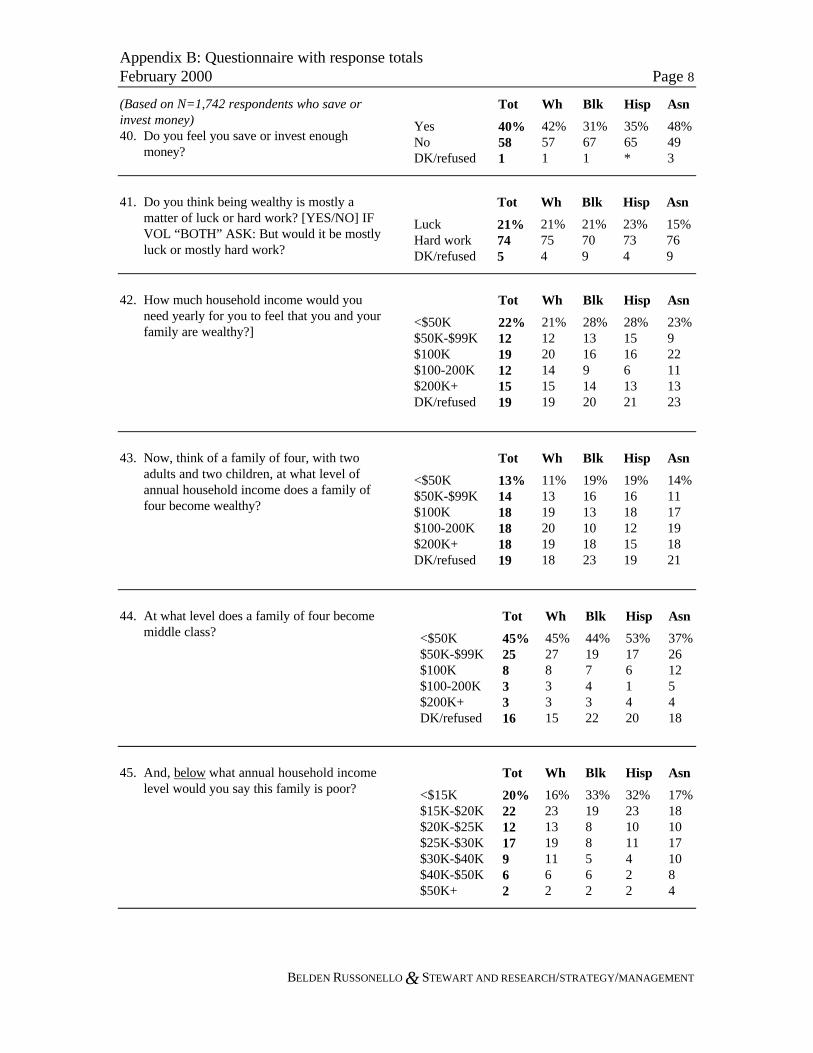
Appendix B: Questionnaire with response totalsFebruary 2000 Page 8
BELDEN RUSSONELLO & STEWART AND RESEARCH/STRATEGY/MANAGEMENT
(Based on N=1,742 respondents who save orinvest money)40. Do you feel you save or invest enough
money?
Tot Wh Blk Hisp Asn
Yes 40% 42% 31% 35% 48%No 58 57 67 65 49DK/refused 1 1 1 * 3
41. Do you think being wealthy is mostly amatter of luck or hard work? [YES/NO] IFVOL “BOTH” ASK: But would it be mostlyluck or mostly hard work?
Tot Wh Blk Hisp Asn
Luck 21% 21% 21% 23% 15%Hard work 74 75 70 73 76DK/refused 5 4 9 4 9
42. How much household income would youneed yearly for you to feel that you and yourfamily are wealthy?]
Tot Wh Blk Hisp Asn
<$50K 22% 21% 28% 28% 23%$50K-$99K 12 12 13 15 9$100K 19 20 16 16 22$100-200K 12 14 9 6 11$200K+ 15 15 14 13 13DK/refused 19 19 20 21 23
43. Now, think of a family of four, with twoadults and two children, at what level ofannual household income does a family offour become wealthy?
Tot Wh Blk Hisp Asn
<$50K 13% 11% 19% 19% 14%$50K-$99K 14 13 16 16 11$100K 18 19 13 18 17$100-200K 18 20 10 12 19$200K+ 18 19 18 15 18DK/refused 19 18 23 19 21
44. At what level does a family of four becomemiddle class?
Tot Wh Blk Hisp Asn
<$50K 45% 45% 44% 53% 37%$50K-$99K 25 27 19 17 26$100K 8 8 7 6 12$100-200K 3 3 4 1 5$200K+ 3 3 3 4 4DK/refused 16 15 22 20 18
45. And, below what annual household incomelevel would you say this family is poor?
Tot Wh Blk Hisp Asn
<$15K 20% 16% 33% 32% 17%$15K-$20K 22 23 19 23 18$20K-$25K 12 13 8 10 10$25K-$30K 17 19 8 11 17$30K-$40K 9 11 5 4 10$40K-$50K 6 6 6 2 8$50K+ 2 2 2 2 4
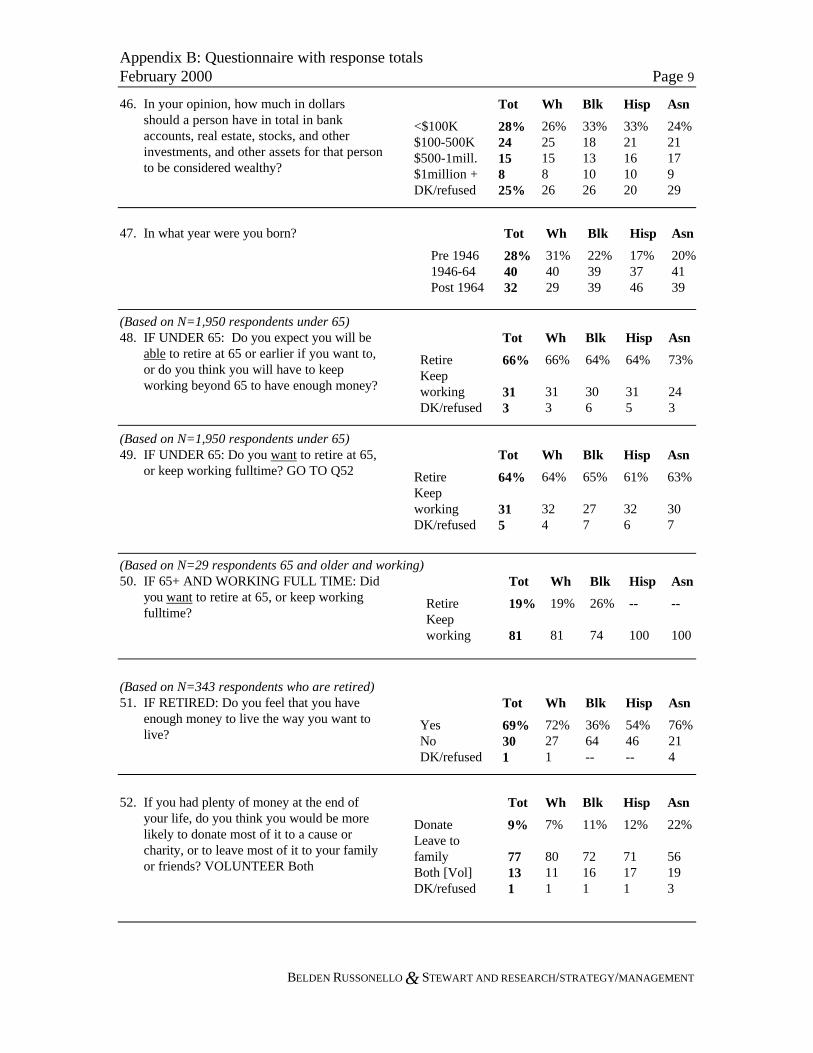
Appendix B: Questionnaire with response totalsFebruary 2000 Page 9
BELDEN RUSSONELLO & STEWART AND RESEARCH/STRATEGY/MANAGEMENT
46. In your opinion, how much in dollarsshould a person have in total in bankaccounts, real estate, stocks, and otherinvestments, and other assets for that personto be considered wealthy?
Tot Wh Blk Hisp Asn
<$100K 28% 26% 33% 33% 24%$100-500K 24 25 18 21 21$500-1mill. 15 15 13 16 17$1million + 8 8 10 10 9DK/refused 25% 26 26 20 29
47. In what year were you born? Tot Wh Blk Hisp Asn
Pre 1946 28% 31% 22% 17% 20%1946-64 40 40 39 37 41Post 1964 32 29 39 46 39
(Based on N=1,950 respondents under 65)48. IF UNDER 65: Do you expect you will be
able to retire at 65 or earlier if you want to,or do you think you will have to keepworking beyond 65 to have enough money?
Tot Wh Blk Hisp Asn
Retire 66% 66% 64% 64% 73%Keepworking 31 31 30 31 24DK/refused 3 3 6 5 3
(Based on N=1,950 respondents under 65)49. IF UNDER 65: Do you want to retire at 65,
or keep working fulltime? GO TO Q52Tot Wh Blk Hisp Asn
Retire 64% 64% 65% 61% 63%Keepworking 31 32 27 32 30DK/refused 5 4 7 6 7
(Based on N=29 respondents 65 and older and working)50. IF 65+ AND WORKING FULL TIME: Did
you want to retire at 65, or keep workingfulltime?
Tot Wh Blk Hisp Asn
Retire 19% 19% 26% -- --Keepworking 81 81 74 100 100
(Based on N=343 respondents who are retired)51. IF RETIRED: Do you feel that you have
enough money to live the way you want tolive?
Tot Wh Blk Hisp Asn
Yes 69% 72% 36% 54% 76%No 30 27 64 46 21DK/refused 1 1 -- -- 4
52. If you had plenty of money at the end ofyour life, do you think you would be morelikely to donate most of it to a cause orcharity, or to leave most of it to your familyor friends? VOLUNTEER Both
Tot Wh Blk Hisp Asn
Donate 9% 7% 11% 12% 22%Leave tofamily 77 80 72 71 56Both [Vol] 13 11 16 17 19DK/refused 1 1 1 1 3
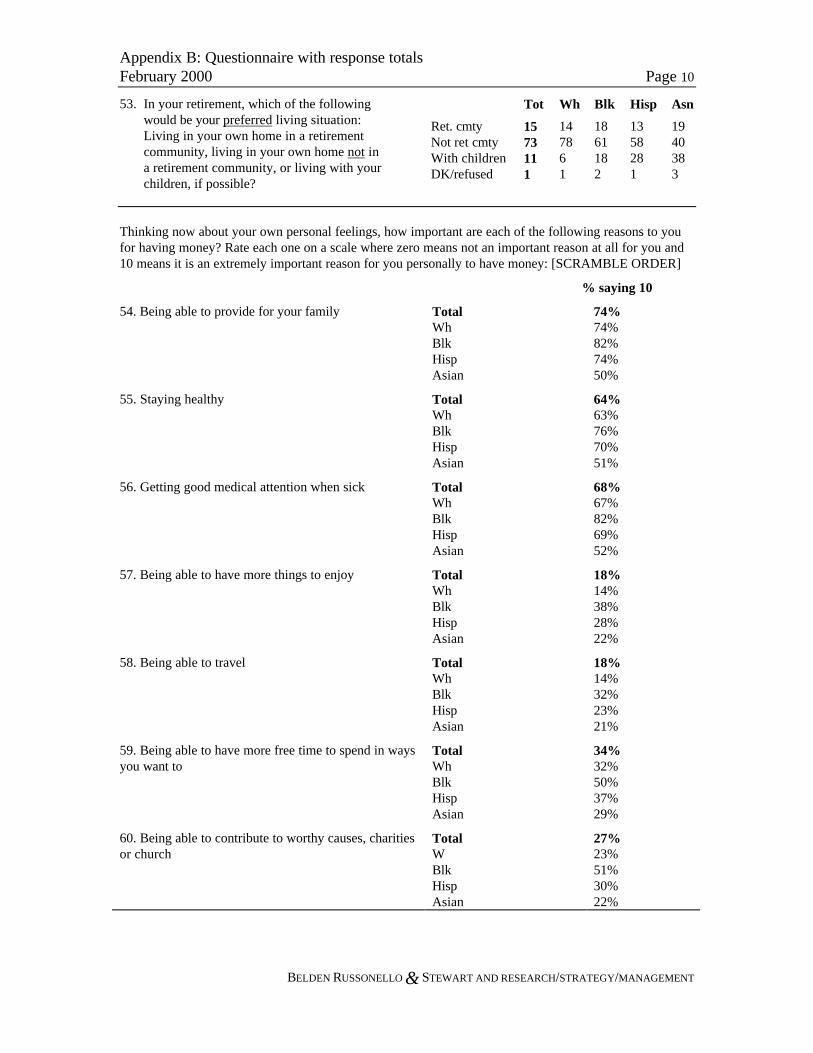
Appendix B: Questionnaire with response totalsFebruary 2000 Page 10
BELDEN RUSSONELLO & STEWART AND RESEARCH/STRATEGY/MANAGEMENT
53. In your retirement, which of the followingwould be your preferred living situation:Living in your own home in a retirementcommunity, living in your own home not ina retirement community, or living with yourchildren, if possible?
Tot Wh Blk Hisp Asn
Ret. cmty 15 14 18 13 19Not ret cmty 73 78 61 58 40With children 11 6 18 28 38DK/refused 1 1 2 1 3
Thinking now about your own personal feelings, how important are each of the following reasons to youfor having money? Rate each one on a scale where zero means not an important reason at all for you and10 means it is an extremely important reason for you personally to have money: [SCRAMBLE ORDER]
% saying 10
54. Being able to provide for your family TotalWhBlkHispAsian
74%74%82%74%50%
55. Staying healthy TotalWhBlkHispAsian
64%63%76%70%51%
56. Getting good medical attention when sick TotalWhBlkHispAsian
68%67%82%69%52%
57. Being able to have more things to enjoy TotalWhBlkHispAsian
18%14%38%28%22%
58. Being able to travel TotalWhBlkHispAsian
18%14%32%23%21%
59. Being able to have more free time to spend in waysyou want to
TotalWhBlkHispAsian
34%32%50%37%29%
60. Being able to contribute to worthy causes, charitiesor church
TotalWBlkHispAsian
27%23%51%30%22%
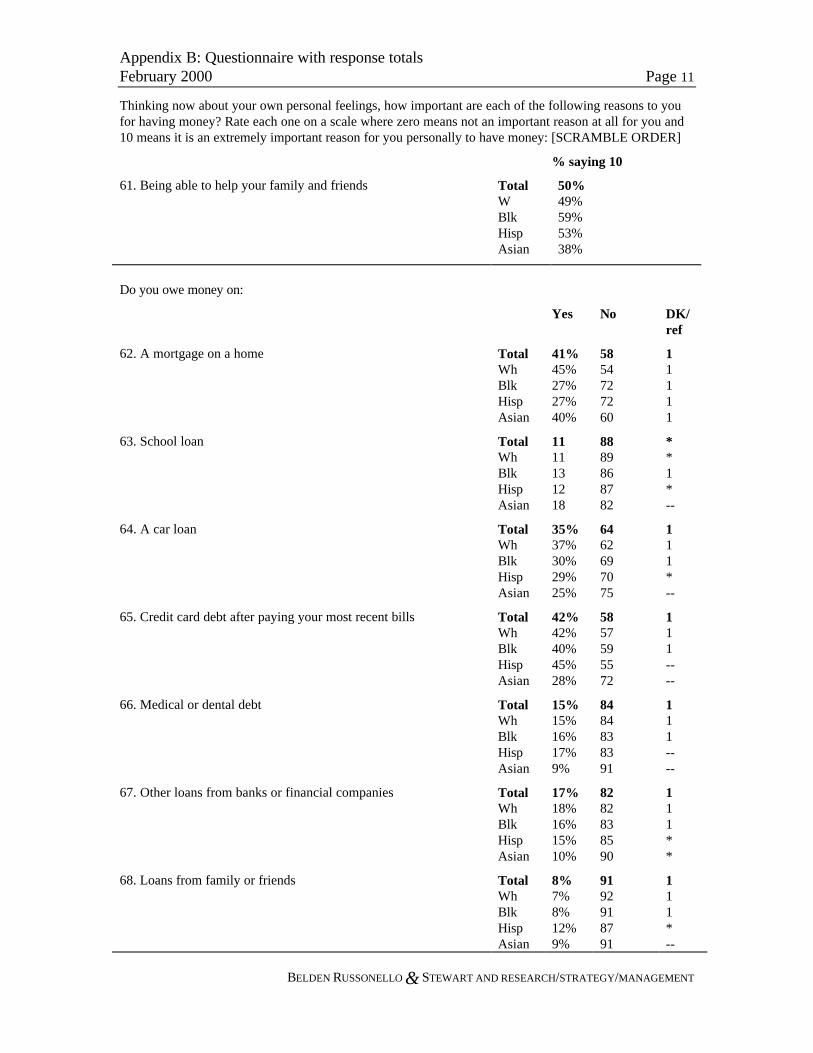
Appendix B: Questionnaire with response totalsFebruary 2000 Page 11
BELDEN RUSSONELLO & STEWART AND RESEARCH/STRATEGY/MANAGEMENT
Thinking now about your own personal feelings, how important are each of the following reasons to youfor having money? Rate each one on a scale where zero means not an important reason at all for you and10 means it is an extremely important reason for you personally to have money: [SCRAMBLE ORDER]
% saying 10
61. Being able to help your family and friends TotalWBlkHispAsian
50%49%59%53%38%
Do you owe money on:
Yes No DK/ref
62. A mortgage on a home TotalWhBlkHispAsian
41%45%27%27%40%
5854727260
11111
63. School loan TotalWhBlkHispAsian
1111131218
8889868782
**1*--
64. A car loan TotalWhBlkHispAsian
35%37%30%29%25%
6462697075
111*--
65. Credit card debt after paying your most recent bills TotalWhBlkHispAsian
42%42%40%45%28%
5857595572
111----
66. Medical or dental debt TotalWhBlkHispAsian
15%15%16%17%9%
8484838391
111----
67. Other loans from banks or financial companies TotalWhBlkHispAsian
17%18%16%15%10%
8282838590
111**
68. Loans from family or friends TotalWhBlkHispAsian
8%7%8%12%9%
9192918791
111*--
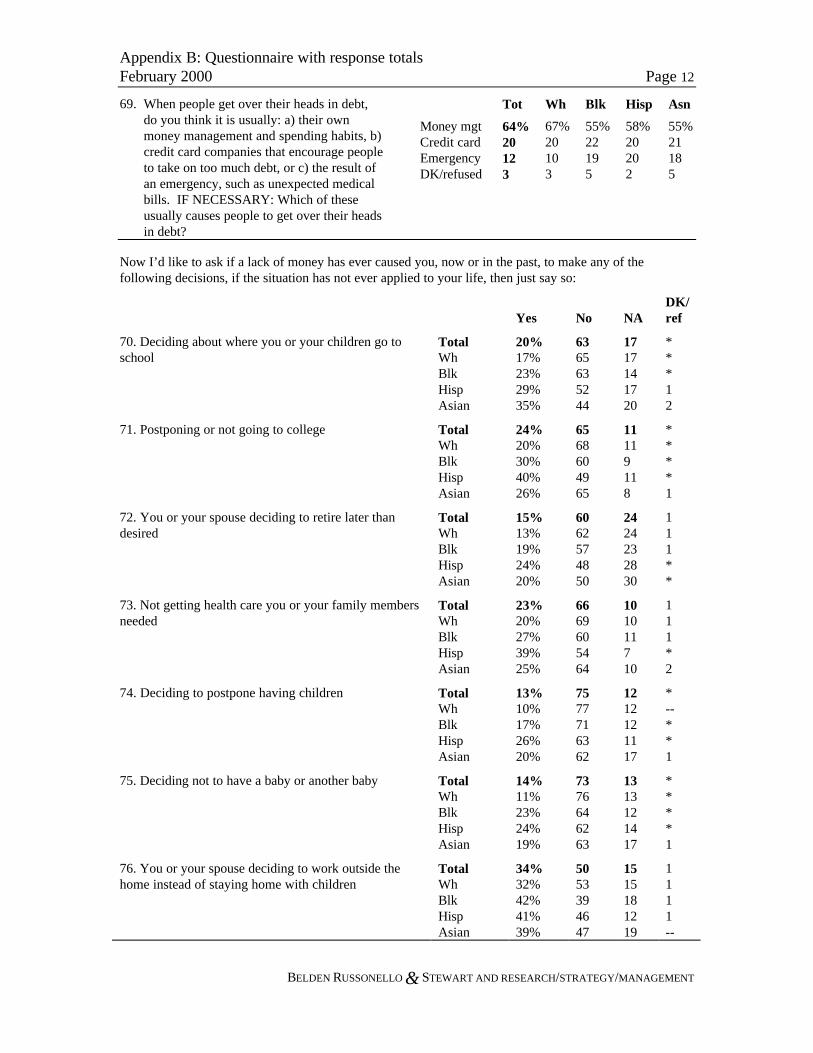
Appendix B: Questionnaire with response totalsFebruary 2000 Page 12
BELDEN RUSSONELLO & STEWART AND RESEARCH/STRATEGY/MANAGEMENT
69. When people get over their heads in debt,do you think it is usually: a) their ownmoney management and spending habits, b)credit card companies that encourage peopleto take on too much debt, or c) the result ofan emergency, such as unexpected medicalbills. IF NECESSARY: Which of theseusually causes people to get over their headsin debt?
Tot Wh Blk Hisp Asn
Money mgt 64% 67% 55% 58% 55%Credit card 20 20 22 20 21Emergency 12 10 19 20 18DK/refused 3 3 5 2 5
Now I’d like to ask if a lack of money has ever caused you, now or in the past, to make any of thefollowing decisions, if the situation has not ever applied to your life, then just say so:
Yes No NADK/ref
70. Deciding about where you or your children go toschool
TotalWhBlkHispAsian
20%17%23%29%35%
6365635244
1717141720
***12
71. Postponing or not going to college TotalWhBlkHispAsian
24%20%30%40%26%
6568604965
11119118
****1
72. You or your spouse deciding to retire later thandesired
TotalWhBlkHispAsian
15%13%19%24%20%
6062574850
2424232830
111**
73. Not getting health care you or your family membersneeded
TotalWhBlkHispAsian
23%20%27%39%25%
6669605464
101011710
111*2
74. Deciding to postpone having children TotalWhBlkHispAsian
13%10%17%26%20%
7577716362
1212121117
*--**1
75. Deciding not to have a baby or another baby TotalWhBlkHispAsian
14%11%23%24%19%
7376646263
1313121417
****1
76. You or your spouse deciding to work outside thehome instead of staying home with children
TotalWhBlkHispAsian
34%32%42%41%39%
5053394647
1515181219
1111--
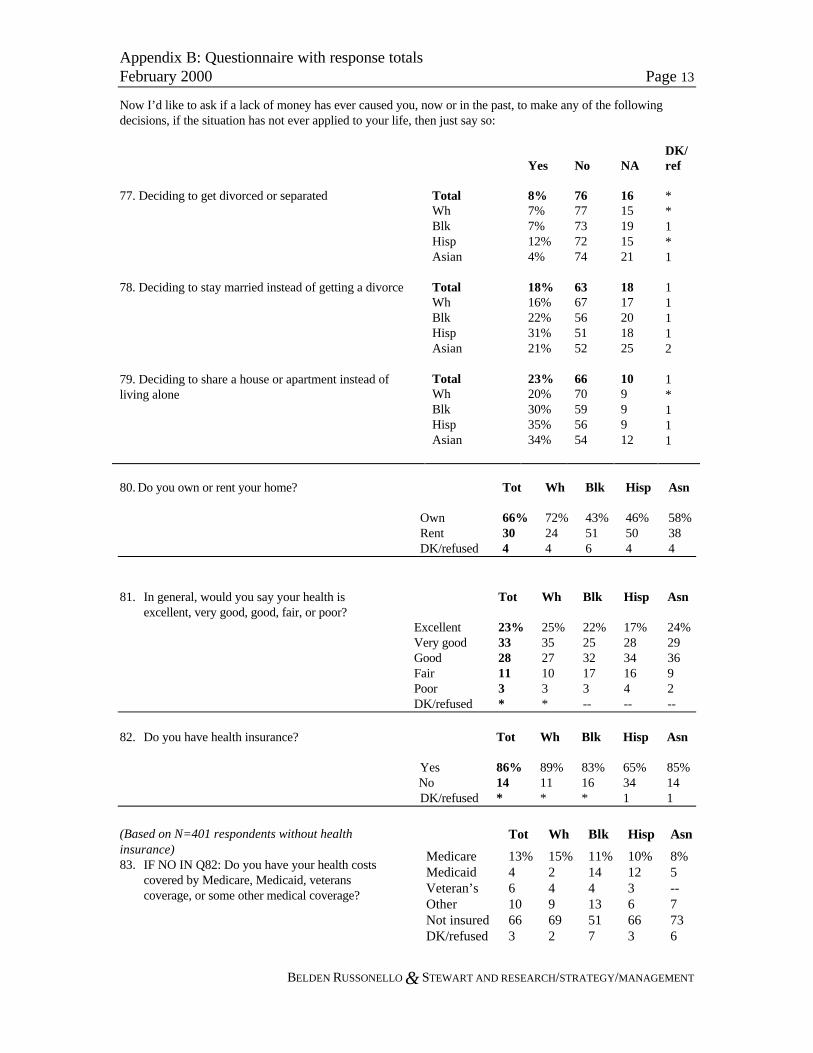
Appendix B: Questionnaire with response totalsFebruary 2000 Page 13
BELDEN RUSSONELLO & STEWART AND RESEARCH/STRATEGY/MANAGEMENT
Now I’d like to ask if a lack of money has ever caused you, now or in the past, to make any of the followingdecisions, if the situation has not ever applied to your life, then just say so:
Yes No NADK/ref
77. Deciding to get divorced or separated TotalWhBlkHispAsian
8%7%7%12%4%
7677737274
1615191521
**1*1
78. Deciding to stay married instead of getting a divorce TotalWhBlkHispAsian
18%16%22%31%21%
6367565152
1817201825
11112
79. Deciding to share a house or apartment instead ofliving alone
TotalWhBlkHispAsian
23%20%30%35%34%
6670595654
1099912
1*111
80. Do you own or rent your home? Tot Wh Blk Hisp Asn
Own 66% 72% 43% 46% 58%Rent 30 24 51 50 38DK/refused 4 4 6 4 4
81. In general, would you say your health isexcellent, very good, good, fair, or poor?
Tot Wh Blk Hisp Asn
Excellent 23% 25% 22% 17% 24%Very good 33 35 25 28 29Good 28 27 32 34 36Fair 11 10 17 16 9Poor 3 3 3 4 2DK/refused * * -- -- --
82. Do you have health insurance? Tot Wh Blk Hisp Asn
Yes 86% 89% 83% 65% 85%No 14 11 16 34 14DK/refused * * * 1 1
(Based on N=401 respondents without healthinsurance)83. IF NO IN Q82: Do you have your health costs
covered by Medicare, Medicaid, veteranscoverage, or some other medical coverage?
Tot Wh Blk Hisp Asn
Medicare 13% 15% 11% 10% 8%Medicaid 4 2 14 12 5Veteran’s 6 4 4 3 --Other 10 9 13 6 7Not insured 66 69 51 66 73DK/refused 3 2 7 3 6
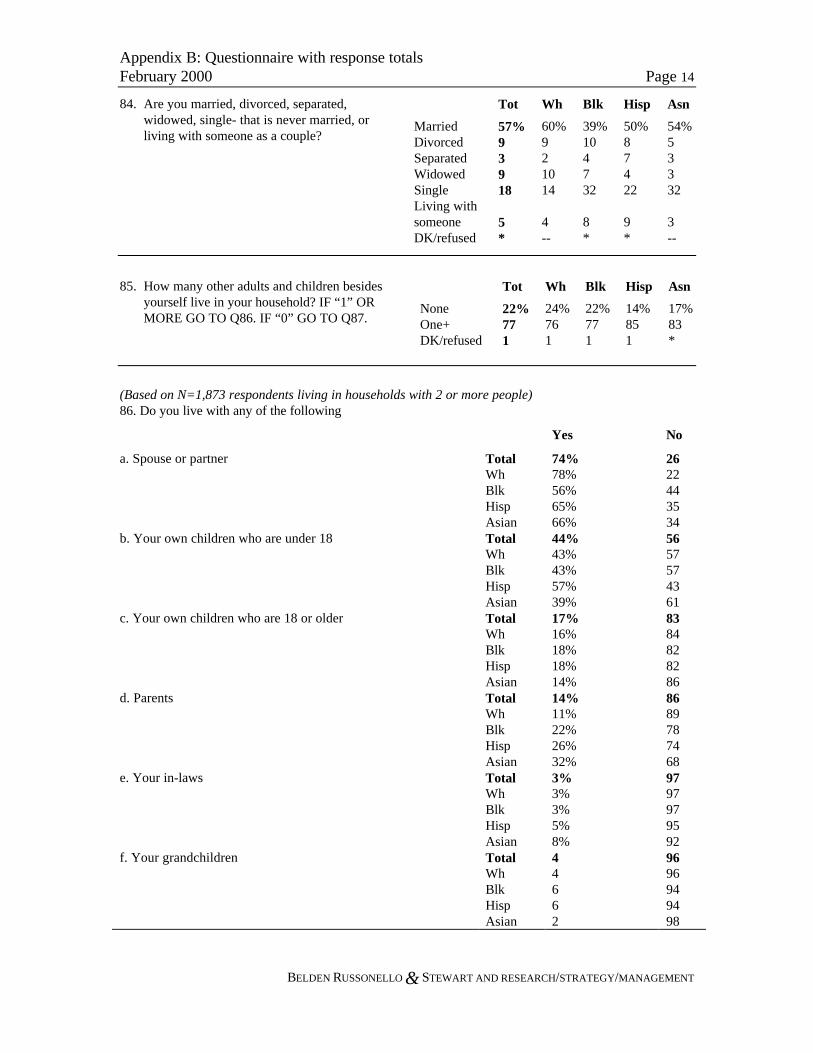
Appendix B: Questionnaire with response totalsFebruary 2000 Page 14
BELDEN RUSSONELLO & STEWART AND RESEARCH/STRATEGY/MANAGEMENT
84. Are you married, divorced, separated,widowed, single- that is never married, orliving with someone as a couple?
Tot Wh Blk Hisp Asn
Married 57% 60% 39% 50% 54%Divorced 9 9 10 8 5Separated 3 2 4 7 3Widowed 9 10 7 4 3Single 18 14 32 22 32Living withsomeone 5 4 8 9 3DK/refused * -- * * --
85. How many other adults and children besidesyourself live in your household? IF “1” ORMORE GO TO Q86. IF “0” GO TO Q87.
Tot Wh Blk Hisp Asn
None 22% 24% 22% 14% 17%One+ 77 76 77 85 83DK/refused 1 1 1 1 *
(Based on N=1,873 respondents living in households with 2 or more people)86. Do you live with any of the following
Yes No
a. Spouse or partner TotalWhBlkHispAsian
74%78%56%65%66%
2622443534
b. Your own children who are under 18 TotalWhBlkHispAsian
44%43%43%57%39%
5657574361
c. Your own children who are 18 or older TotalWhBlkHispAsian
17%16%18%18%14%
8384828286
d. Parents TotalWhBlkHispAsian
14%11%22%26%32%
8689787468
e. Your in-laws TotalWhBlkHispAsian
3%3%3%5%8%
9797979592
f. Your grandchildren TotalWhBlkHispAsian
44662
9696949498
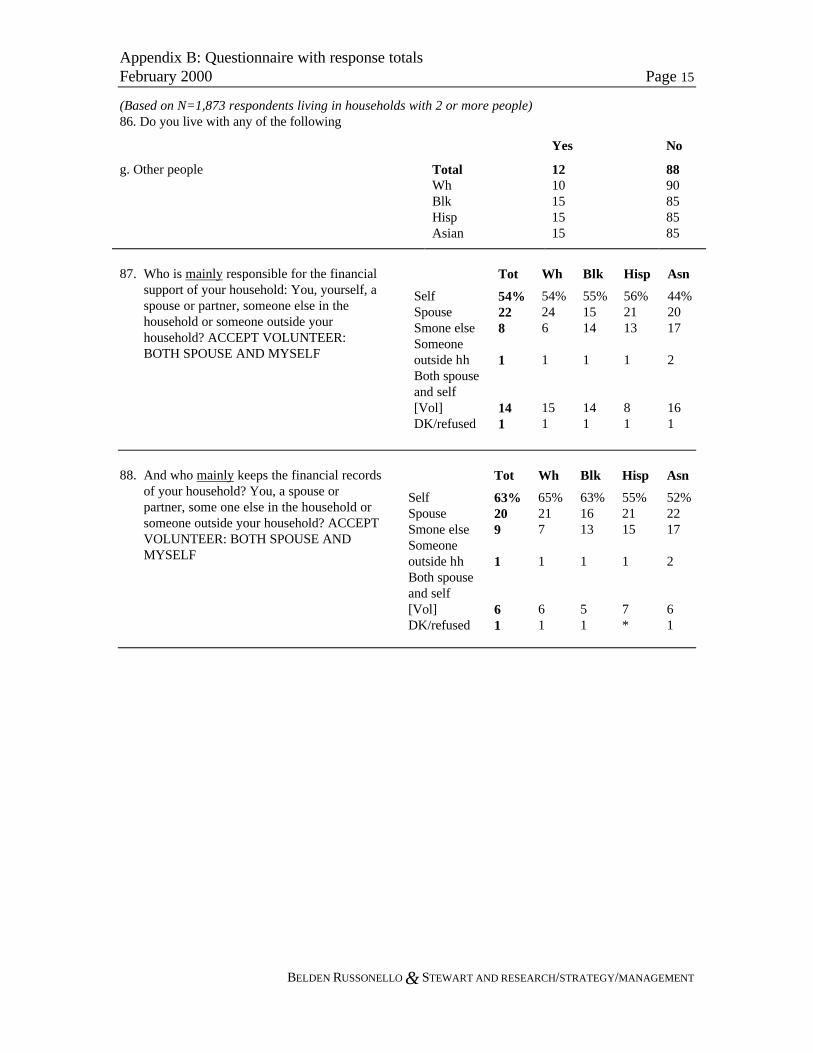
Appendix B: Questionnaire with response totalsFebruary 2000 Page 15
BELDEN RUSSONELLO & STEWART AND RESEARCH/STRATEGY/MANAGEMENT
(Based on N=1,873 respondents living in households with 2 or more people)86. Do you live with any of the following
Yes No
g. Other people TotalWhBlkHispAsian
1210151515
8890858585
87. Who is mainly responsible for the financialsupport of your household: You, yourself, aspouse or partner, someone else in thehousehold or someone outside yourhousehold? ACCEPT VOLUNTEER:BOTH SPOUSE AND MYSELF
Tot Wh Blk Hisp Asn
Self 54% 54% 55% 56% 44%Spouse 22 24 15 21 20Smone else 8 6 14 13 17Someoneoutside hh 1 1 1 1 2Both spouseand self[Vol] 14 15 14 8 16DK/refused 1 1 1 1 1
88. And who mainly keeps the financial recordsof your household? You, a spouse orpartner, some one else in the household orsomeone outside your household? ACCEPTVOLUNTEER: BOTH SPOUSE ANDMYSELF
Tot Wh Blk Hisp Asn
Self 63% 65% 63% 55% 52%Spouse 20 21 16 21 22Smone else 9 7 13 15 17Someoneoutside hh 1 1 1 1 2Both spouseand self[Vol] 6 6 5 7 6DK/refused 1 1 1 * 1
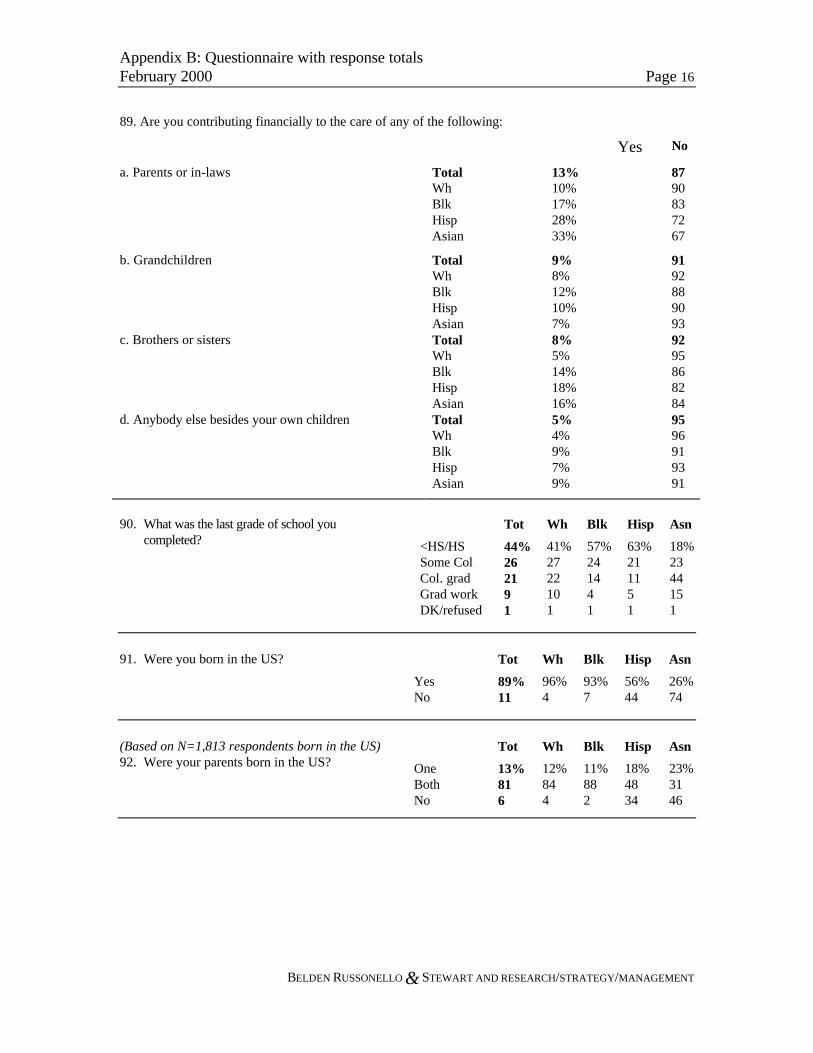
Appendix B: Questionnaire with response totalsFebruary 2000 Page 16
BELDEN RUSSONELLO & STEWART AND RESEARCH/STRATEGY/MANAGEMENT
89. Are you contributing financially to the care of any of the following:
Yes No
a. Parents or in-laws TotalWhBlkHispAsian
13%10%17%28%33%
8790837267
b. Grandchildren TotalWhBlkHispAsian
9%8%12%10%7%
9192889093
c. Brothers or sisters TotalWhBlkHispAsian
8%5%14%18%16%
9295868284
d. Anybody else besides your own children TotalWhBlkHispAsian
5%4%9%7%9%
9596919391
90. What was the last grade of school youcompleted?
Tot Wh Blk Hisp Asn
<HS/HS 44% 41% 57% 63% 18%Some Col 26 27 24 21 23Col. grad 21 22 14 11 44Grad work 9 10 4 5 15DK/refused 1 1 1 1 1
91. Were you born in the US? Tot Wh Blk Hisp Asn
Yes 89% 96% 93% 56% 26%No 11 4 7 44 74
(Based on N=1,813 respondents born in the US)92. Were your parents born in the US?
Tot Wh Blk Hisp Asn
One 13% 12% 11% 18% 23%Both 81 84 88 48 31No 6 4 2 34 46
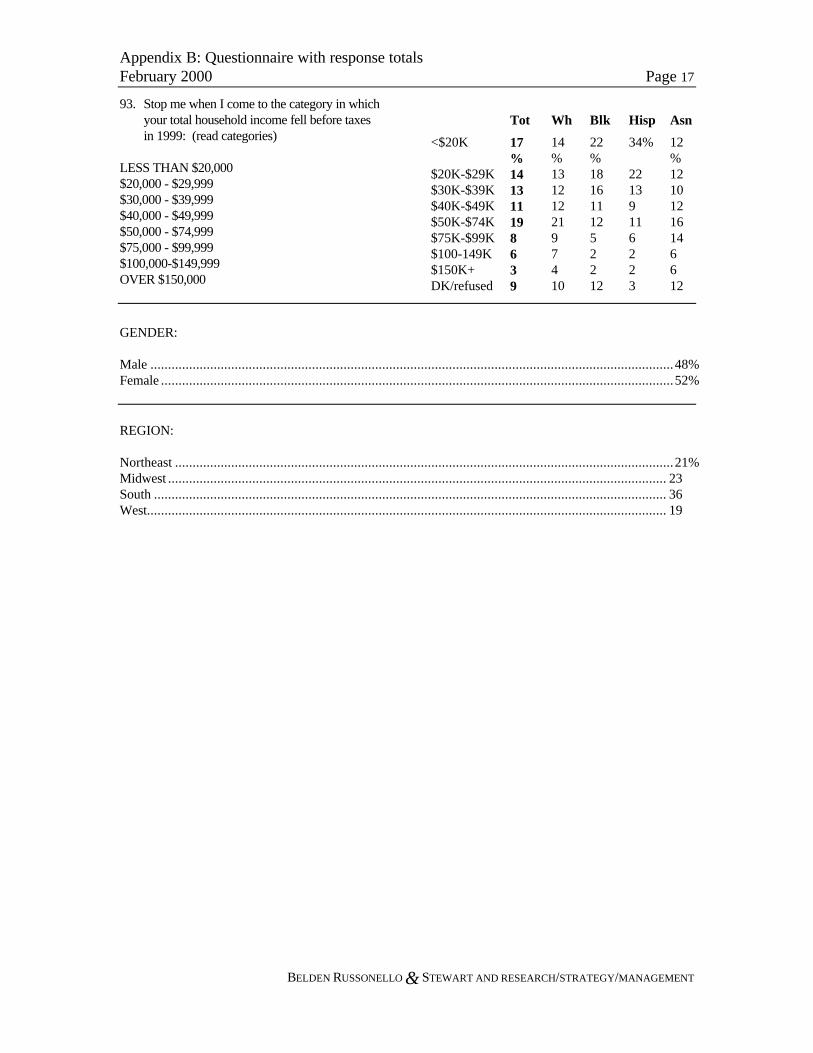
Appendix B: Questionnaire with response totalsFebruary 2000 Page 17
BELDEN RUSSONELLO & STEWART AND RESEARCH/STRATEGY/MANAGEMENT
93. Stop me when I come to the category in whichyour total household income fell before taxesin 1999: (read categories)
LESS THAN $20,000$20,000 - $29,999$30,000 - $39,999$40,000 - $49,999$50,000 - $74,999$75,000 - $99,999$100,000-$149,999OVER $150,000
Tot Wh Blk Hisp Asn
<$20K 17%
14%
22%
34% 12%
$20K-$29K 14 13 18 22 12$30K-$39K 13 12 16 13 10$40K-$49K 11 12 11 9 12$50K-$74K 19 21 12 11 16$75K-$99K 8 9 5 6 14$100-149K 6 7 2 2 6$150K+ 3 4 2 2 6DK/refused 9 10 12 3 12
GENDER:
Male .....................................................................................................................................................48%Female ..................................................................................................................................................52%
REGION:
Northeast ..............................................................................................................................................21%Midwest .............................................................................................................................................. 23South .................................................................................................................................................. 36West.................................................................................................................................................... 19

6 0 1 E S t r e e t , N W • W a s h i n g t o n , D C 2 0 0 4 9 • w w w . a a r p . o r g
AARP is the nation’s leading organization for people age 50 and older. It serves theirneeds and interests through information and education, advocacy, and communityservices which are provided by a network of local chapters and experienced volunteersthroughout the country. The organization also offers members a wide range of specialbenefits and services, including Modern Maturity magazine and the monthly Bulletin.
©2000 AARP. Reprinting by permission only.