Embed Size (px)
Citation preview


Digitized by the Internet Archive
in 2011 with funding from
Boston Library Consortium Member Libraries
http://www.archive.org/details/moneypricesinearOOkess
DEWEY'hB31
.M415
^^ Massachusetts Institute of Technology
Departnnent of EconomicsWorking Paper Series
MONEY AND PRICES INTHE EARLY ROMAN EMPIRE
David Kessler
Peter Temin
Working Paper 05-1
1
April 1 4, 2005
Room E52-251
50 Memorial Drive
Cambridge, MA 021 42
This paper can be downloaded without charge from the
Social Science Research Network Paper Collection at
http://ssni.com/abstract=704724
f^^^^^iii^i;!^!
APR 2 6 ^005
LIBRARIES.
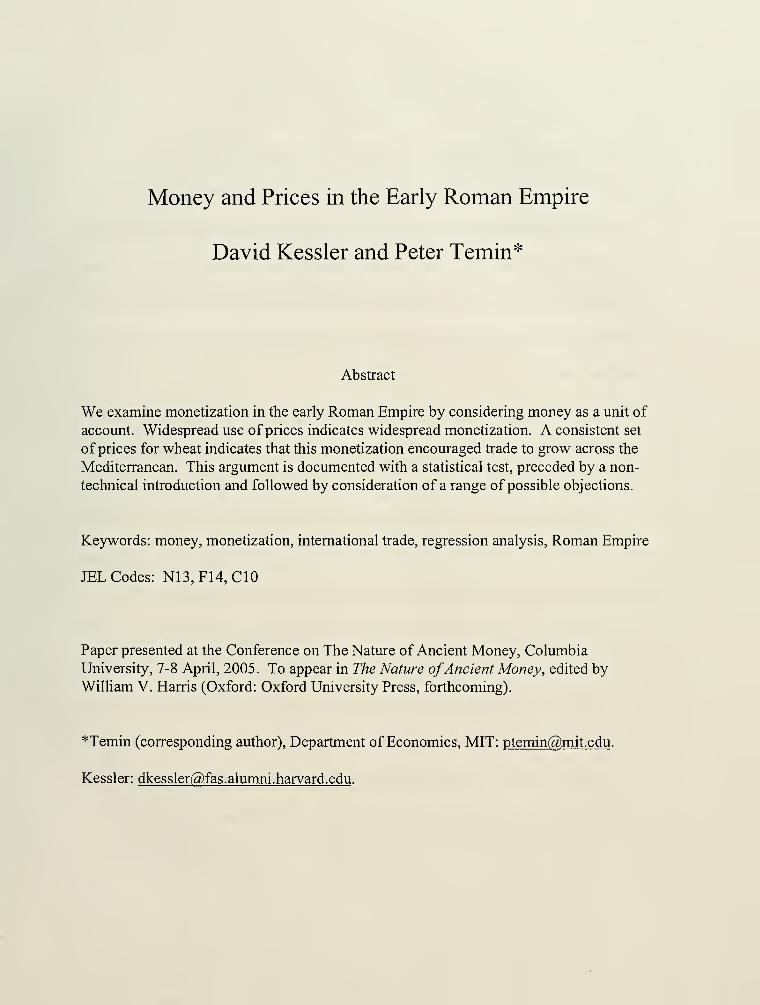
Money and Prices in the Early Roman Empire
David Kessler and Peter Temin*
Abstract
We examine monetization in the early Roman Empire by considering money as a unit of
account. Widespread use of prices indicates widespread monetization. A consistent set
of prices for wheat indicates that this monetization encouraged trade to grow across the
Mediterranean. This argument is documented with a statistical test, preceded by a non-
technical introduction and followed by consideration of a range of possible objections.
Keywords: money, monetization, intemational trade, regression analysis, Roman Empire
JEL Codes: N13, F14, CIO
Paper presented at the Conference on The Nature of Ancient Money, Columbia
University, 7-8 April, 2005. To appear in The Nature ofAncient Money, edited byWilliam V. Harris (Oxford: Oxford University Press, forthcoming).
*Temin (corresponding author). Department of Economics, MIT: [email protected] .
Kessler: dkessler(5),fas.alumni.harvard.edu .

Money and Prices in the Early Roman Empire
Money serves as a medium of exchange and a standard unit in which prices and
debts can be expressed.' Most research on the extent of monetization in the Roman
world has focused on the first fimction of money, a medium of exchange. Hopkins'
famous article on taxes and trade argued that money would be needed throughout the
empire to pay taxes; Duncan-Jones inferred geographically limited coin usage from the
location of com hoards. This paper examines the second fimction ofmoney, its role as a
standard of value. We argue that monetization in the sense ofusing monetary measures
was virtually universal in the early Roman Empire. This assertion verges on the obvious
in view of recent compilations ofRoman prices. ^ We go further to make the stronger
and less obvious claim that there was unified monetary integration across the whole
Mediterranean in the early Roman Empire. We make this argument through an
examination ofwheat prices.
We approach the issue of monetization from a new angle, emphasizing the role of
money in supplying a unit of account. This leads us to look for Roman uses of this unit,
hi other words, we look for Roman prices instead ofRoman coins. Monetization in this
view is measured by the extent to which people used prices to keep track of their
activities. This may appear less direct than analyzing coins, but it is not. We are
interested in monetization as an aspect ofRoman society, and we focus on how the
Romans used money instead of asking how much money they had. The use of prices is
our index of monetization.
We assume that money was used as money in the ancient world. Some historians
have seen coins as symbols of imperial power or as art objects. These characteristics may
be important for the question of which coins were used, but they do not approach the
question why the ancients minted coins in the first place. Perhaps Roman emperors
spread Roman coins widely to symbolize their suzerainty, but with coins came the
practice of using money to value commodities and services. Actually, this practice
preceded coins in the East and became more accurate and prevalent with coins. Uniform
sestertii—linked to earlier drachmae in the East—encouraged the use of prices in
transactions. Consistent valuations and ease ofpayment (the first function ofmoney)
encouraged the growth of trade."*
Prices were used widely in Rome, and the letters and accounts of the time are full
of references to them. Unhappily for the modem scholar, the prices almost always are for
goods or services that are unique, ranging fi-om dirmer parties to monuments. The
accounts reveal that people thought in terms of prices, but they do not provide a data set
with which to examine prices. Prices for a uniform commodity are needed for that
purpose. Wheat is the obvious candidate for such a price because wheat was both
uniform and universal. Rathbone used the price ofwheat in Roman Egypt to measure
inflation.^ We compare wheat prices across space rather than through time to
demonstrate market integration around the Mediterranean. Market integration indicates
widespread monetization, which facilitated trade by providing a standard imit of account.
Just as the euro promotes European trade today, the wide use oi sestertii and drachmae
encouraged trade throughout the Roman Mediterranean.
Despite the availability ofRoman price evidence, it is difficult to find comparable
prices for many locations. We take our sample to be a set ofwheat prices hsted by
Rickman in his account of its supply for the city of Rome. ^ This is a small sample of
prices, but we think it is a good one for three reasons. First, Rickman searched the
literature for mentions ofwheat prices in outlying areas. Second, he compared prices in
these outlying areas with prices in Rome, and we use this roughly contemporaneous
comparison in our work. Third, we are not aware of another attempt to provide a set of
prices for a uniform commodity in many different parts of the late Roman Republic and
early Roman Empire.
We proceed in three steps. We first explain this small data set and its strengths
and weaknesses, construct a graph showing the relation of wheat prices in Rome to those
elsewhere around the Mediterranean, and present our hypothesis in the form of a graph.
Then we ask if this graph could be a fluke, that is, a chance result ofputting together
prices that in fact were not the result of an integrated market. If not, then the collection
of prices fi-om distant places would reveal nascent monetization (since prices were used)
but not comprehensive monetization (that would encourage trade). There would be no
relationship between the various prices. This test requires a short introduction to
statistics that tries to be informative without being too technical. Finally, we discuss a
variety of objections to this finding that might be raised, showing that they do not vitiate
our results.
Data and Hypothesis
We collected wheat prices from varied locations, as reported by Rickman. More
prices come to light all the time, but we thought that this familiar sample would provide a
way to examine monetary integration at least provisionally. Our requirements were price
pairs in outlying locations and in Rome at roughly the same time. We found six price
pairs in almost two centuries ranging from the late Republic to the early Empire. This is
not an overwhelming amount of evidence, but it is enough to test whether the patterns in
the data are random or not. hi each case the Roman price was subtracted from the price
at the distant location to give a price differential. Wheat prices at Rome were subject to
slow inflation according to Rickman, a view that has been supported by Duncan-Jones.^
We describe the price observations in the order of their distance from Rome,
which we calculated as straight-line distances on a map. This of course is only an
approximation to the actual distance that wheat traveled; we emphasize the approximate
nature of our data since this randomness reduces the possibihty of finding evidence of
comprehensive monetization. The closest price was from Sicily and came from Cicero's
Verrine Orations. One of his accusations was that Verres did not transact business at the
market price, even though he acknowledged its level in a letter (Cicero, 2 Verr. 3. 189).
This observation, like most of the others, reports the prevailing local price in round
numbers. Since the observation is general rather than the record of any fransaction, it is
likely to be only approximate. This casual quality of the data militates against finding
any systematic relationship between prices. It introduces noise into any relationship of
the prices being paid because of the unknovm difference between the reported averages
and actual prices. We analyze the effects of this noise on our test below.
The second price came from Polybius (Polyb. 34.8.7) in his discussion of
conditions in Lusitania. As before, this is a general statement about the prevaihng price.
While it is good to have an average, the casual quality of the averaging process again
adds noise into any comparison of prices in different places.
The third price comes from the Po Valley in Italy; it is another observation by
Polybius (Polyb. 2.15.1). While this observation is closer to Rome than the first two
prices, we have made an exception to our general rule. The Po valley was linked to
Rome by rivers rather than sea. Diocletian's Price Edict fixed river transport prices at
five times the level of sea transport, and we consider the cost of transport from the Po
valley to have been five times as expensive as its actual distance if taken by sea. This
evidence however dates from over a century later than any of the prices we observed.
We assumed the ratio of sea and river transport costs remained constant over time
—
which others have confirmed—and we included the Po valley in our data by multiplying
the distance from Rome by five. Despite our small sample, we have enough data to test
the usefulness of this assumption.
The fourth price comes from an official intervention in the local market. An
inscription records that the wheat price was limited in a time of scarcity (AEPigr (1925),
126b). The normal price was eight or nine asses per modius; the acceptable limit price
was one denarius per modius.^ This inscription reveals several important aspects of the
Mediterranean wheat market in addition to reporting the normal price. The need to damp
down famine prices indicates that local markets were subject to local scarcities; they were
not so well linked that wheat from elsewhere would be brought in instantly in response to
a local shortage. The apparent success of such interventions, in this case limiting the price
to double its normal range, indicates that many famines were not severe.
For Egypt, we preserve the spirit of Rickman's data but improve on his data since
Rathbone collected actual sale prices that are superior to the observations of average
levels. We averaged seven Eg3q3tian prices from the "famine" of 45-47 CE to get a price
for Egypt. Rathbone argued that these prices were unusual, but the previous discussion
suggests that they may not be far from average. '° We of course cannot know how
unusual these prices were, and any special conditions infroduce noise into our data. The
Egyptian prices also come from agricultural areas, not from a Mediterranean port. The
purported famine would have raised the price, but using country prices would have
depressed it compared to those at a port. These offsets introduce added uncertainty into
the accuracy of this observation since there is no reason to expect them to be exact
offsets. The average of Rathbone' s seven prices was seven drachmae per artaba. These
prices in Egyptian currency and units were converted to HS per modius by following
Duncan-Jones and dividing by 4.5.^^
Our final observation from distant Palestine, is taken from Tenney Frank's
Economic Survey; it too is an average of a few actual transactions.''^ All of these prices
were compared with roughly contemporaneous prices at Rome. Rickman argued that the
price of wheat at Rome was between three and four HS per modius in the late Republic,
rising to five to six HS in the early Empire. Duncan-Jones confirmed the general price
level; Rathbone confirmed the inflation, at least for Egypt where the data are more
abundant. The order of observations turns out to be almost chronological even though
the order of exposition was by distance.
The prices and the differences between the prices at Rome and the local prices are
shown in Table 1 . The price differences are graphed against the distance from Rome in
Figure 1. It is readily apparent that prices were lower outside ofRome than in Rome
itself; all the price differences are all negative. This difference has been noted before.^^
It also looks as if the price differential between various locales and Rome became more
negative as the locales were ftirther from Rome. In other words, wheat prices everywhere
were lower than in Rome and lowest at the farthest reaches of the Mediterranean, that is,
at places farthest from Rome.
What could have produced such a pattern? We suggest that the whole
Mediterranean basin was monetized in the sense that money provided a standard of value
for wheat and presumably other goods as well. This standardization of the monetary unit,
taking into account the different currencies in the East, promoted the development of a
unified market for wheat, along the lines suggested by Schaps.'"^
If there had been a unified wheat market, how would it have worked? The main
center of consumption would have been in Rome, where the largest number of potential
consumers lived and the Roman government was located. In other words, Rome was
where the largest excess supplies and demands for wheat would have come together and
where the price ofwheat consequently would have been set. The price would be lower in
exporting regions in view of the transport costs to Rome. They would vary over time as
supplies fluctuated due to harvests across the Roman world, storms affected the cost of
transportation, and government actions altered the value of the currency. Normal
variations in supplies and demands elsewhere in the empire would have affected the price
in Rome, although most fluctuations would have been small relative to the total
production and the consumption at Rome. Most places outside of Rome would have had
an excess supply of wheat, and the price would have been set in Rome where the excess
supplies and the largest excess demand came together. When local places were isolated,
there could be excess local demand as well as excess local supply, that is, local famines
as well as local gluts.
Under these circumstances, wheat outside ofRome would be valued by what it
was worth in Rome. Wheat at Palermo in Sicily, for example, normally would be worth
less than wheat in Rome because it would have to be transported to Rome to be sold. The
price of wheat in Sicily would be the price of wheat in Rome less the cost of getting
wheat from Sicily to Rome. This would be true almost always, but there undoubtedly
were circumstances when it was not. If storms prevented the shipment of grain to Rome,
the Sicilian price might temporarily deviate from the level set by the price in Rome. If a
harvest failure in Sicily created a local famine, the price ofwheat in Sicily would rise
above the level indicated by the Roman price until new wheat supplies could be brought
in. In the absence of extreme events like these, a unified market would keep Sicilian
prices near the Roman price less the fransportation cost.
The market is an abstraction; it is misleading to say the market would determine
Sicilian prices. More correctly, competition would determine Sicilian prices if there were
a unified market. If the Sicilian price ofwheat rose above the Roman level minus
transportation costs, merchants would not buy wheat in Sicily to sell in Rome. The
amount ofwheat demanded in Sicily would fall, and the price consequently would fall as
well. If the Sicilian price of wheat fell below the Roman level minus transportation costs,
merchants would increase the amount ofwheat they would try to buy in Sicily, for they
could make an unusually high profit by taking it to Rome and selling it there. Merchants
would bid against each other, raising the Sicilian price.
Wheat at Lusitania in Spain would be worth less than wheat at Palermo because it
was further from Rome. The cost oftransporting wheat from Spain to Rome was larger
than the cost of bringing it from Sicily, and the price of wheat in Spain correspondingly
would be lower. The reasoning is exactly like that for Sicily, only the transport cost is
different. But while each price is compared to that in Rome, the price in Spain would be
lower relative to the price in Sicily ifthere were a unified market. In fact, wheat around
the Mediterranean would be worth less than the price at Rome, with the amount less
depending on the distance from Rome. We do not know the transport cost in any detail,
but we are reasonably sure that it rose with distance. If there was a unified wheat market,
therefore, the price of wheat would have decreased as one moved farther and farther from
Rome.
All this presumes monetization throughout the Mediterranean. The comparisons
assvime that there were monetary units in which prices could be compared. In fact, most
of the observations were in the same monetary units, and the others were franslated to
these units by a standard exchange rate. The anticipation of profits from frade
presupposes that the value of the wheat could be compared with the value of other goods
and services and traded for them. Without monetization, there can be only the simplest
kind of trade because the opportunities are very hard to evaluate.
This hypothetical account of frade sounds impossibly modem. But if it is not an
accurate picture of the Roman world, we need to think of the relevant alternative.
Phrased differently, what is the alternative to this view? If there were not a unified
currency or market, if there were only independent local currencies and markets, then we
would not expect to find any relationship between local and Roman prices. Prices in
local prices and markets would be determined by local conditions. The prices might
move together at some times, if storms around the Mediterranean caused simultaneous
harvest failures everywhere or currency debasements caused prices to rise everywhere,
but the prices would not in general be related one to another. Any single identity of
prices could be a coincidence, and it is impossible to say if similar miners' wages in
Egypt and Dacia were the result of coincidence, government regulation, or a market for
miners.'^ Ifwe could fmd several wheat prices in different places, however, we could
test whether the pattern we find is due to coincidence or an underlying market process.
The question is not whether one or the other of these ideal tj^es was observed,
either that there was a single monetary area and an efficient market or that there were no
factors unifying separate local moneys and markets. It is rather whether the historical
experience hes closer to one end of a continuum than the other. There must have been at
least occasional local shortages and famines. The question then is whether the normal
state of affairs was one of interconnected currencies and markets, so that prices in
different places typically were related, or one of separated and independent currencies
and markets. In the latter case, we should not observe any systematic relationship
between the location and the price of grain. If the economies in these places had not been
monetized, of course, we would not have observed any prices at all.
A Test of Market Integration
\.
10
It may appear as if the picture in Figure 1 could only be suggestive of such a
story. It seems like a tiny bit of evidence on which to hang such a grand story of
universal monetization and market integration. There is hov^ever a statistical technique
that can be used to evaluate how likely it is that a picture like Figure 1 could arise by
chance. In other words, we can test the probability that the separate areas of the early
Roman Empire were isolated and out of economic connection with Rome. Their prices
would have been determined by local conditions, including perhaps the degree of
monetization. There would have been no connection between the distance to Rome and
the level of local prices.
This statistical technique is known as regression analysis. In this type of analysis
we can evaluate the likelihood that there is a relation between the local price and the
distance from Rome. We start by trying to draw a line that relates the price difference
between the local price and the Roman price to the distance from Rome. We then adjust
the line to make it the best description of the data in the sense that it minimizes the
squared distance of the individual observations from the line. (We use the square of the
distance to minimize the distance from points both above and below the line and to
simplify the mathematics.) This process is knovm as regression analysis or the method of
least squares, and the resulting "least-squares" line is the regression line. It is shown in
Figure 2.
One of the values of regression analysis is that it generates tests of the hypotheses
being tested. We can ask if an apparent relationship between the price discount and the
distance from Rome is illusory, a result of observing only a few prices, rather than the
result of a systematic process. In order to draw this line, we assumed that there was a
11
relationship between the distance from Rome and the price discount. Regression analysis
provides a test whether there is such an association in the data. This test tells us how
unlikely it is for us to find a line like the one shown in Figure 2 by chance. Assume that
the prices we gathered from Rickman were randomly drawn from an underlying
distribution of price observations. In another world, different prices would have survived
from this same distribution. Taking account of the random quality of the observations we
actually have, how unlikely is it for us to find the line in Figure 2 by chance?
Regression analysis acknowledges that the slope of the line in Figure 2 is not
known with certainty. It is the best line that can be drawTi with the data at hand, but it is
subject to errors deriving from the incomplete sampling of the underlying distribution. In
the jargon of regression analysis, the slope of the line has a standard error. If all the
points in Figure 1 and 2 lay in a sfraight line, then the slope of the regression line would
be clear, and the standard error of the slope would be close to zero. If the points are
spread out as they are in the figures here, then the line is not known as clearly, and there
is a chance that the line has no slope at all, that is, that there is no relationship between
the distance from Rome and the price difference.
The test is to compare the size of the slope, the coefficient in the regression, with
the size of its standard error. If the coefficient is large relative to the standard error, then
it is unlikely that the line was a random finding without support in the price data. On the
other hand, if the coefficient is small relative to its standard error, then it is possible that
even though the regression line has a slope, there is no underlying relationship between
the price and distance. Statisticians call this ratio a t-statistic, and they have calculated
tables that can franslate t-statistics into probabilities that the line is observed by chance.
12
The tables take account of degrees of freedom, that is, the number of observations
minus the number of coefficients. It takes two variables to define a line, its slope and its
position (height in the figures). With six observations and two variables, there are four
degrees of freedom. Omitting the observation with river transport reduces the number of
observations by one and the degrees of fireedom to three. The t-statistic has to be larger
with such few degrees of fi^eedom than with more degrees of freedom to show that a
given regression line is unlikely to be the result of chance.
One might think that the data—composed of only a few, badly observed values
—
are too poor for statistical analysis. Nothing could be flirther from the truth. Statistics
are the best way of distinguishing signal fi"om noise; they are particularly usefiil when
there is a lot of noise in the system. They give us a precise sense ofhow unlikely it is
that any putative pattern we think we observe would have been generated by random
processes, that is, how unlikely it is that what looks like a pattern actually is noise. The
value of statistics is that we can test a formal hypothesis, namely that wheat prices around
the Mediterranean Sea were related in a simple way to those at Rome. We also can
derive an explicit probability that this hypothesis is true, given the observations we have.
In particular, errors in variables are a common problem in doing regressions. We
often hypothesize a relationship between two variables—like the price in Rome and the
price in Egjqjt—^but cannot observe one or the other ofthem precisely. We then use a
proxy such as the occasional price that happens to be mentioned in a surviving document,
as we have done here for most of our prices. The errors introduced by such a procedure
have been studied, and their effects are well known. The extra uncertainty introduced by
using imperfect proxies reduces the explanatory power ofregressions and tends to result
13
in coefficients and t-statistics that are near zero; the addition of noise through imperfect
observations makes the results look more hke noise. The well-known scarcity ofRoman
prices makes it very hard to find a pattern in them. When a pattern is found, however, it
indicates that there is a strong relationship between the prices.
The price differentials are graphed against the distance to Rome in Figure 1 . The
results are quite striking; prices were lower in places fiuther from Rome, and the price
differentials appear almost proportional to the distance from Rome. These prices come
from all over the Mediterranean and from various times in the late Republic and early
Empire. If there were not a unified monetary system or if there were not a unified grain
market, there would be no reason to expect a pattern in-these^ricesr'Everrif there was a
unified market, our inability to find more prices or more accurate fransportation costs
might have obscured any true relationship among the prices. Yet Figure 1 reveals a clear
picture.
While the graph is clear, a statistical test is needed to tell if the observed pattern
could be the result of chance. Accordingly we ran regressions of the price differential on
the distance from Rome, with the results shown in Figure 2 and Table 2. There are four
separate regressions in the table. Since the transportation from the Po valley was by river
rather than sea, we were not sure that the correction for the relative cost of fransport was
accurate, and we tried the regressions both with and without the Po valley data point, hi
addition, we expressed the distance in logarithms to measure the proportional change in it
to allow the relationship between price and distance to be non-linear. The dependent
variable is the premium of the Roman price over the local price instead of the discount of
the local price from the Roman price.
14
Each row of Table 2 contains the result of a separate regression. The first two
columns identify the regression by whether we used the distance or its log and whether
we included the Po valley. The next two columns give the coefficients resulting from the
regression with the relevant t-statistic below it in parentheses.'^ There are two columns
because a straight line is defined by two parameters, a constant and a slope. The first
column gives the constant. It measures the difference between the price in Rome and
elsewhere that was not related to distance. The second column gives the slope of the line
in Figure 2. It measures the speed at which the discount fi-om the price in Rome grew as
distance fi^om Rome increased.
How can we be sure that the price discount increased with distance? The t-
statistics below the coefficients indicate that it is highly unlikely that there is no
relationship between the local price and the distance from Rome. They are all larger than
three. A t-statistic above three indicates that there is less than one chance in twenty that
the observed relationship between distance and price differentials was due to chance.'' In
other words, we confirm with very high probability that there was a unified wheat market
that extended from one end to the other of the Mediterranean Sea, that transport costs
were roughly proportional to distance, and that the effects of distance were larger than the
idiosyncratic influences of particular markets, currencies and places. This level of
confidence is taken as conclusive in most economic and medical tests done today.
The R shown in the final column measures the share of the variance of the price
differentials that is explained by these simple regressions. Using the price differentials
themselves, the regression explains almost four-fifths of the variation. Using logarithms
of distance, the regressions explain even more. This result confirms the impression in
15
Figure 2 that distance from Rome is a powerful explanatory factor in determining wheat
prices around the Roman Mediterranean.
The constant terms in these regressions were negative in the regressions for price
discounts (and positive in the regressions for the logarithms). They were not estimated as
precisely as the relationship between distance and the price differentials, so we cannot be
as sure that they are not the result of chance (as indicated by smaller t-statistics). The
constant terms suggest that there were some costs to bring wheat to Rome that were not
proportional to distance, albeit smaller and less well observed. These other costs could
have been physical—the costs of transshipping wheat to and from sea-going ships—or
adminisfrative—like port charges or taxes. Their presence does not detract from the
effect of distance or the evidence in favor of a unified wheat market.
It does not make a big difference whether the Po valley is included or not.
Without this observation, the standard error of the slope coefficient is slightly larger,
making the t-statistic slightly smaller. The required t-statistic to show the probability that
the slope is not zero also rises due to the fewer degrees of freedom. Nonetheless, the
probability that there was no relationship between price and distance from Rome is still
less than one in twenty. The slope of the hne and the percentage of the price variation
that is explained by distance do not change. As can be seen in Figure 2, the observation
for the Po valley Ues close to the regression line; removing it does not change the line.
This graph and these regressions provide powerftil evidence for the existence of
extensive monetization and unified wheat markets in the later Roman Republic and the
early Roman Empire. Other authors have inferred the existence of such markets from
isolated observations, but we have demonstrated the existence of a relationship between
16
prices in far-flung places that almost certainly is not the result of chance. Such a
relationship could only exist where the standard of value, money, was used throughout
the Mediterranean.
\ Possible Objections
We discuss in this section possible objections that can be raised to this test and
our conclusion. The first objection is that prices were low outside Rome because coined
money was scarce, not because transport to Rome was costly. This alternative cannot
explain the prices in Table 1 . Coins may have been scarce in Lusitania at the time of
Polybius, but coins were abundant in the eastern Mediterranean where the monetized
Greek economy preceded the Roman one. Wheat prices there were lower than in
Lusitania, as can be seen fi-om the figures. Distance from Rome is a much better
predictor of prices than coin scarcity.
A second objection is that the prices are unrepresentative because they are
notional, biased because the observers had political motives, or unrepresentative due to
price fluctuations. We acknowledge that such errors in the price observations may have
been present, although Polybius was a very careful historian, not liable to falsify his
evidence to make a rhetorical point. As noted already, such errors in recording the "true"
prices introduce noise into the relationship between the price differential and distance
from Rome. If there was a great deal of this distortion, any existing relationship might be
obscured. Since we find such a relation, it means that the relationship between distance
and price was a sfrong one, visible even through the noise introduced by casual or
distorted price observations. More formally, we can thirik of the observed prices being
17

determined by the true prevailing prices, which we observe with an error due to our
approximation. Then the dependent variable we used in the regression is the true
distance plus an error. That error would add onto the error of the regression and result in
a lower t-statistic and R^. Given that they both are large, we conclude that this rough
assumption in fact is quite good, that the observed prices appear to represent prevailing
prices in a reasonable fashion.
Another, related objection is that prices fluctuated during the year and
observations may have come from different seasons. Again, this source of noise
strengthens our results because the seasonal price variation introduces another source of
noise into the hypothesized relationship. We suspect that the casual nature of the price
observations has helped us here. Travelers were told of the prevailing price, not
sometimes the extreme price that obtains just before the harvest comes in and sometimes
the low price following the harvest. The result appears to be a consistent set of prices.
Phrased differently, we regard the few prices that have survived for two millennia as
quite random, but it is perverse to insist that any pattern we find has to be spurious.
There does not seem to be a reason to throw out evidence from the ancient world on the
grounds that it must be random.
Yet another objection to the use of these prices is that the argument is circular:
we assume the data are sound because they support the hj'pothesis, but the test of the
hypothesis requires the data to be sound. Not at all. We assume that the prices we
observe are dravm from a distribution of prices in the early Roman Empire (and late
Republic). We do not assume they are accurate or come from a particular kind of
investigation or a particular time of year (as in the previous paragraph). In fact, we only
18
assume that they are prices. Given that we are sampling from the population of wheat
prices, the t-statistic tells us whether there is a relationship between price and distance.
There is no more circularity here than in any statistical test of a hypothesis.
Another objection is that the sample is tiny, only six price pairs. This small
sample is unfortunate, but no barrier to the test of our hypothesis. As we said above, the
standard errors and t-statistics are corrected for degrees of freedom. Having few
observations makes it easier to reject hypotheses, but it does not affect the validity of the
test. We would of course like to have many more prices, but there are not more to be
found at this time. Perhaps our analysis of these few prices will stimulate other historians
to find more price pairs and to provide more evidence for or against our hypothesis.
A little thought experiment might be usefiil here. Imagine that we discover a
steady sfream ofnew wheat prices from various locations. If they all lie near the
regression line in Figure 2, they provide more evidence for our hj^othesis. Prices that do
not lie near the regression line indicate that the locations in question were isolated from
the general Mediterranean wheat market or the main currency area at the times of the
price observations. Ifwe only find a few such observations, that would enrich the
historical record without vitiating the hypothesis of a generally unified market. Ifwe
found a lot of such prices, that would suggest that conditions where markets were isolated
were more prevalent than times when they were integrated. The Roman world in that
case would be monetized, but not composed of a unified monetary system.
We remarked earlier that imperial officials often intervened in the market for
wheat. If the government was administering prices, then the prices might not be the
result of market forces at all. To check this possibility, we searched for price
19
interventions in Rome. The government repeatedly attempted to avoid the hardships of
price spikes when suppHes ran short. In 74 BCE, the government sold grain cheaply to
offset the loss ofwheat in Sicilian floods. In 57 BCE Pompey negotiated extra purchases
himself, sailing from province to province in search of wheat. In 24 BCE Augustus gave
400 HS apiece to 250,000 people, allowing them to purchase wheat that was temporarily
expensive. In 1 9 CE Tiberius placed a price ceiling on grain and offered to compensate
merchants two HS per modhis, suggesting that the price before his intervention was at
least two HS above the price he thought people could bear. In 64 CE Nero set another
price ceiling for wheat, this time at three HS per modius}^
Government interventions like these are summarized in Table 3. It is clear that
the government intervened in the wheat market from time to time, particularly under
Augustus. It also is clear, even from what must be a partial list, that these interventions
were intermittent. Ifwe assume that these interventions are only half of the actual
actions, the others being unrecorded in our sources, the years in which there were
interventions were still clearly a minority. The market for wheat was allowed to work on
its own in most years. In addition, if traders expected the government to interfere when
famine loomed, they might have been discouraged from trying to comer the market in
adversity. Government intervention therefore may have damped speculation and made
the underlying pattern of prices easier to see.
The largest government activity in the wheat market was the annona. The
government gave 60 modii per year to each male head of a household. The number of
households receiving this largess is unclear, but it is generally thought to be between
200,000 and 250,000 during the reign of Augustus.'^ If the population ofRome was
20
around one million people, the annona used between half and a quarter of the wheat
imported into Rome. More than half of the wheat imported to Rome at the time of
Augustus therefore was imported privately. Sirks argued that the share of grain imported
into Rome for the annona was even smaller, only around 15 percent, making the private
share correspondingly larger.
The government also obtained the wheat for the annona privately. They let
contracts to societates to provide wheat, and they offered inducements for private
merchants to participate in this process. Claudius rewarded private merchants who used
their own ships, carrying at least 10,000 modii, to import grain to Rome for the annona
for five years. If the merchant was a citizen, he would be exempt from the lex Papia
Poppaea, which penalized the childless. If the merchant was a woman, she could make a
will without the intervention of a male tutor. And if the merchant was not a citizen, he
would be granted citizenship. Hadrian extended these rewards by exempting any
merchant devoting the greater part of his resources to the annona from compulsory
services imposed by municipal authorities.
The wheat market in Rome consequently was a mixture ofpublic and private
activity. There was enough private activity to provide work for many merchants and
shippers who would gather wheat from the far comers of the Mediterranean. But the
public presence means that the price ofwheat in Rome may have been distorted by the
annona. We have discussed price variation already, and government actions probably
stabilized prices more than they destabilized them. The presence of so much free wheat
in Rome however may have decreased the price of wheat in that city at all times. If this
price was received by importers, then the graphs and regressions record the proper
21
relation between Roman and provincial prices. If the price we observe was different
from the price paid to importers, this would change the constant in the regression and
move the line in Figure 2 up or down. It would not affect the relationship in Table 2 or
the slope of the line in Figure 2 (unless of course the officials of the annona paid
different prices for wheat from different places—for which there is no evidence at all).
Coming back to monetary conditions, there is evidence of inflation in the early
Roman Empire. The pay of soldiers was increased in infrequent large jumps, and wheat
prices in Egypt rose. We used the price difference between Roman and provincial
prices in order to avoid problems of inflation. As shown in Table 1, we take account of
inflation in Rome. While the incomplete evidence on inflation suggests there were a few
jumps in prices, it is more likely that they were drifting upward more or less steadily. In
any case, the use of a price difference insulates our test from an inflationary bias.
Turning to the other variable, distance, we acknowledge that a straight-line
distance is only a rough approximation to the actual distance traveled by wheat on its way
to Rome. This defect of the data however is an advantage for our test; it biases our test
toward rejecting our hypothesis. The approximate nature of the distance estimate
introduces another kind of error in the variables. Since this is our independent variable,
the effect is slightly different from the effect of an error in observing the price. Any error
in observing distance has the effect of reducing the size of the resulting coefficient. Since
is large, as can be seen in Figure 2, straight-line distances appear to give a good
representation of the comparative distance from Rome despite the waywardness of any
specific voyage to the capital city.
22
Finally, this is a very simple model ofRoman monetization and trade. We have
argued that there was a single monetary system and a single wheat market across the
whole Mediterranean. We tested this hypothesis with a simple regression and few
degrees of freedom. Why should any ancient historian believe such a simple model and
test? We argue that the purpose of a model is to provide an overall view ofmoney and
trade in Rome. It does not explain every detail; instead it provides an overview that can
help our thinking. There are only a few observations because that is all we have. If we
studied more recent times, we would have more data, but we do the best we can with
ancient history. As we said above, we hope that our exploration will stimulate ancient
historians to search for added price observations. We will be as interested as any reader
to see if this simple model survives a test with more data.
Conclusion
We have argued here that the early Roman Empire was thoroughly monetized.
We do not argue that people everywhere had adequate supplies ofRoman coins, but
rather that people throughout the empire used a single monetary standard to value their
activities. This single monetary standard was based on sestertii in the western empire
and on drachmae in the eastern empire, with a fixed exchange rate between them. The
result was to create a single currency area like the euro zone today. Whether or not all
regions had adequate supplies of coin, the survival of prices from all comers of the
empire indicate that the Roman economy was thoroughly monetized.
We argued also that this monetization set the conditions for market integration by
reducing the transactions cost of trading across large distances. This allowed a single
23
market for wheat to emerge, whose existence we could verify from surviving prices. The
enormous size ofRome also encouraged the growth of trade, since all the residents of the
capital needed to eat. Food must have traveled around the Mediterranean for eons before
the Roman conquest. The quantities shipped were too small, however, to make a
unified market. Only when the Romans imposed a political settlement on the area and
created a unified monetary system could trade expand enough to unify prices across the
Mediterranean.
24
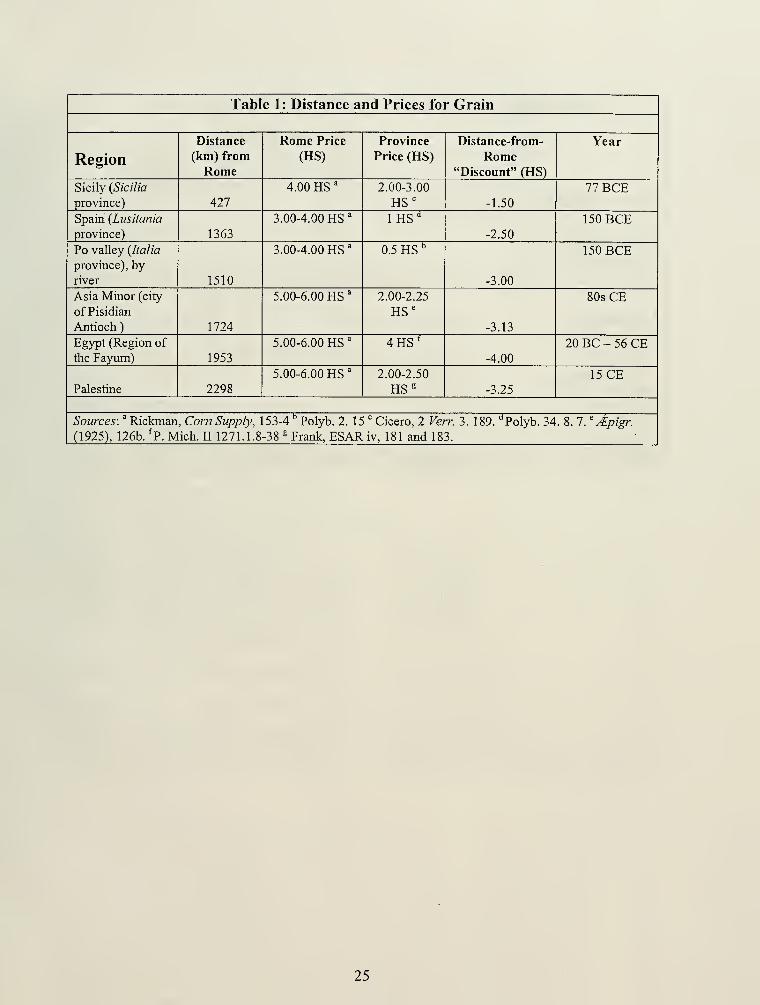
Table 1: Distance and Prices for Grain
Region
Distance
(km) from
Rome
Rome Price
(HS)
Province
Price (HS)
Distance-from-
Rome"Discount" (HS)
Year
Sicily {Sicilia
province) 427
4.00 HS '2.00-3.00
HS' -1.50
77BCE
Spain {Lusitania
province) 1363
3.00-4.00 HS' 1 HS"*
-2.50
150 BCE
Po valley {Italia
province), by
river 1510
3.00-4.00 HS
'
0.5 HS
"
-3.00
150 BCE
Asia Minor (city
ofPisidian
Antioch
)
1724
5.00-6.00 HS' 2.00-2.25
HS'-3.13
80sCE
Egypt (Region of
the Fayum) 1953
5.00-6.00 HS
'
4HS'-4.00
20 EC - 56 CE
Palestine 2298
5.00-6.00 HS
'
2.00-2.50
HS^ -3.25
15 CE
Sources: ^ Rickman
(1925), 126b. ^P. M, Corn Supply,
ich. II 1271.1.8
53-4 " Polyb. 2. 15 " Cicero, 2 Verr. 3. 189. 'Polyb. 34
-38 ^ Frank, ESAR iv, 181 and 183.
.S.l.^Apigr.
25
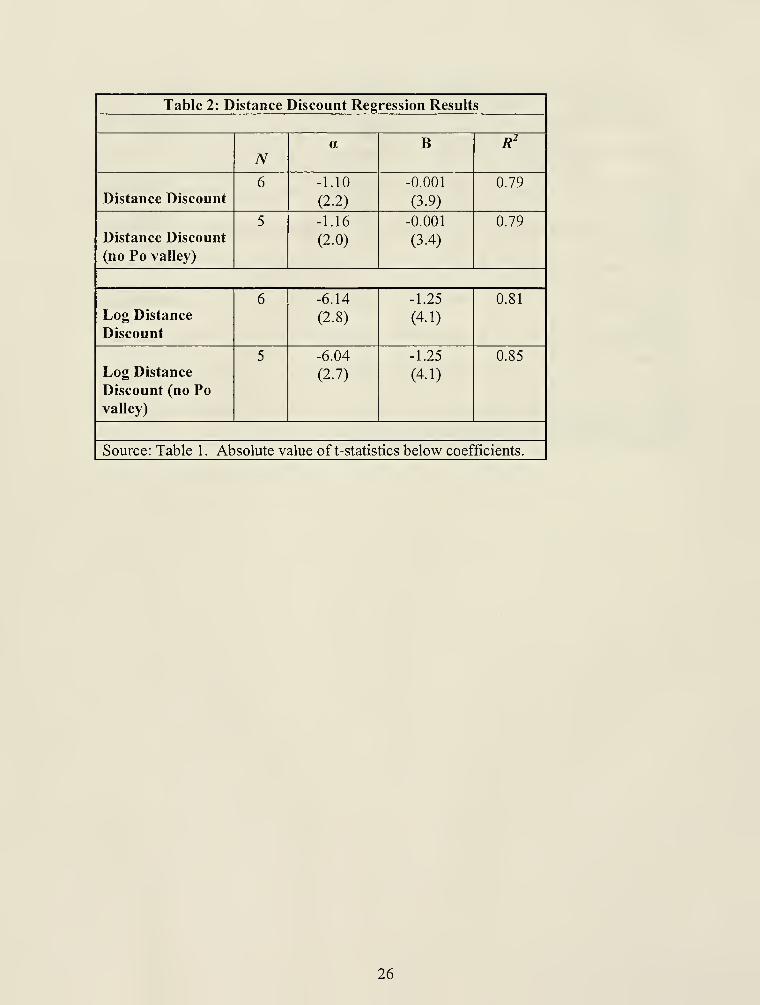
Table 2: Distance Discount Regression Results
TV
a B R'
Distance Discount6 -1.10
(2.2)
-0.001
(3.9)
0.79
Distance Discount
(no Po valley)
5 -1.16
(2.0)
-0.001
(3.4)
0.79
Log Distance
Discount
6 -6.14
(2.8)
-1.25
(4.1)
0.81
Log Distance
Discount (no Po
valley)
5 -6.04
(2.7)
-1.25
(4.1)
0.85
Source: Table 1. Absolute value of t-statistics below coefficients.
26
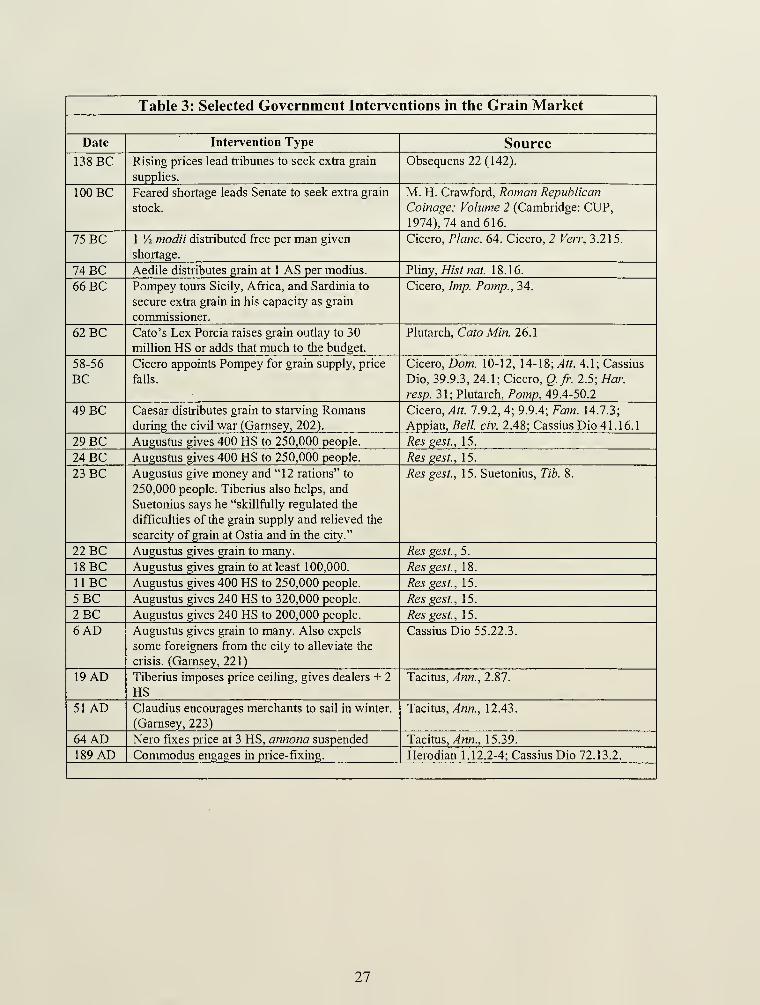
Table 3: Selected Government Interventions in the Grain Market
Date Intervention Type Source
138 BC Rising prices lead tribunes to seek extra grain
supplies.
Obsequens22(142).
100 BC Feared shortage leads Senate to seek extra grain
stock.
M. H. Crawford, Roman Republican
Coinage: Volume 2 (Cambridge: CUP,
1974), 74 and 616.
75 BC 1 Vi modii distributed free per man given
shortage.
Cicero, Plane. 64. Cicero, 2 Veir, 3.215.
74 BC Aedile distributes grain at 1 AS per modius. nmy,Histnat. 18.16.
66 BC Pompey tours Sicily, Africa, and Sardinia to
secure extra grain in his capacity as grain
commissioner.
Cicero, Imp. Pomp., 34.
62 BC Cato's Lex Porcia raises grain outlay to 30
million HS or adds that much to the budget.
Plutarch, Ca/o M/w. 26.1
58-56
BCCicero appoints Pompey for grain supply, price
falls.
Cicero, Dom. 10-12, 14-18; ^«. 4.1; Cassius
Dio, 39.9.3, 24.1; Cicero, Q.fr. 2.5; Har.
resp. 31; Plutarch, Pomp, 49.4-50.2
49 BC Caesar distributes grain to starving Romansduring the civil war (Gamsey, 202).
Cicero, Att. 7.9.2, 4; 9.9.4; Fam. 14.7.3;
Appian, Bell. civ. 2.48; Cassius Dio 41.16.1
29 BC Augustus gives 400 HS to 250,000 people. Resgest., 15.
24 BC Augustus gives 400 HS to 250,000 people. Res gest., 15.
23 BC Augustus give money and "12 rations" to
250,000 people. Tiberius also helps, and
Suetonius says he "skillfully regulated the
difficulties of the grain supply and relieved the
scarcity of grain at Ostia and in the city."
Res gest., 15. Suetonius, Tib. 8.
22 BC Augustus gives grain to many. Res gest., 5.
18 BC Augustus gives grain to at least 100,000. Resgest, 18.
11 BC Augustus gives 400 HS to 250,000 people. Resgest., 15.
5BC Augustus gives 240 HS to 320,000 people. Resgest., 15.
2BC Augustus gives 240 HS to 200,000 people. Resgest., 15.
6 AD Augustus gives grain to many. Also expels
some foreigners from the city to alleviate the
crisis. (Gamsey, 221)
Cassius Dio 55.22.3.
19 AD Tiberius imposes price ceiling, gives dealers + 2
HSTacitus, y4/7«., 2.87.
51 AD Claudius encourages merchants to sail in winter.
(Gamsey, 223)
Tacitus, ^««., 12.43.
64 AD Nero fixes price at 3 HS, annona suspended Tacitus, Ann., 15.39.
189 AD Commodus engages in price-fixing. Herodian 1.12.2-4; Cassius Dio 72.13.2.
27
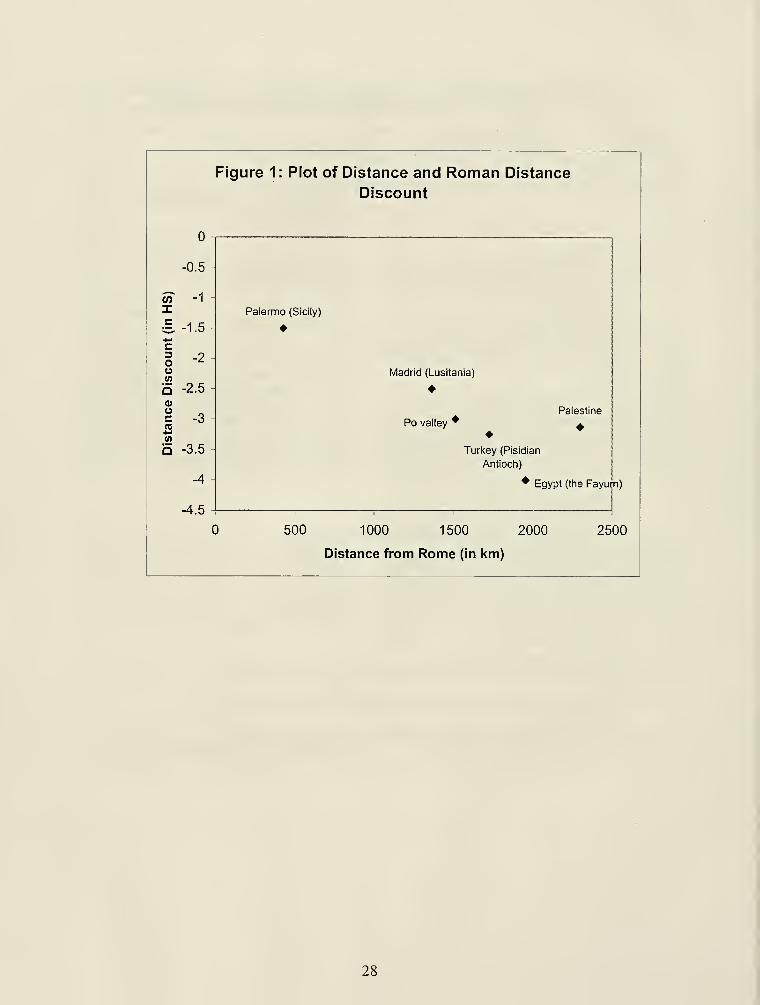
Figure 1 : Plot of Distance and Roman Distance
Discount
nU
-0.5
w -1
X Palermo (Sicily)
;E-1.5
c
i -2
Madrid (Lusitania)
Q -2.5 -
0)Palestine
c -3 -
wPo valley * ^
5 -3.5 - Turkey (Pisidian
Antioch)
-4 -
Egypt (the Fayum)
-4 R -~H.D 11 1 1 f
500 1000 1500 2000 2500
Distance from Rome (in km)
28
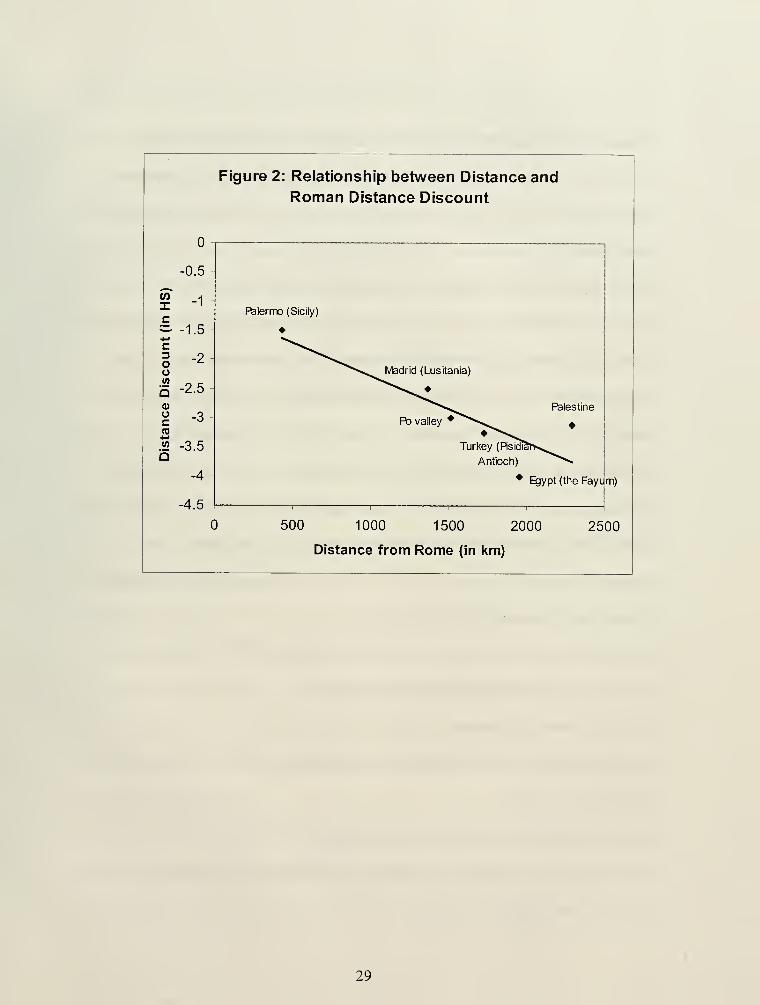
Figure 2: Relationship between Distance and
Roman Distance Discount
-
-0.5 -
. .w -1 -XF^lermo (Sicily)
-1.5 -
4.J ^^^c ^"*^«^^
3ou
-2 ^^*»s^.^ Madrid (Lusitania)
(0
Q -2.5 ^^*>^^^»
0) ^*"^>^_^_^ Palestineu -3 Po valley *"^«>,,,^ ^ns **«v^_^w -3.5 - Turkey (Rsidi^hs,,,^^
Q Antioch) ^*^*^
-4Egypt (the Fayi
-4.5-1
'1
1 11
500 1000 1500 2000
Distance from Rome (in km)
2500
29
Endnotes
' Sometimes a third function, a store of value, is added, but this is not relevant here.
Kevin Greene, The Archaeology ofthe Roman Economy (Berkeley, CA: University of
California Press, 1986), pp. 50-51. This assertion can be found in almost any elementary
economics text.
^ Keith Hopkins, "Taxes and Trade in the Roman Empire (200 B.C.-A.D. 400)," Journal
ofRoman Studies 70 (1980), 101-125; Richard Duncan-Jones, "The Denarii of Septimus
Severus and the Mobility ofRoman Coin," Numismatic Chronicle, 161 (2001), 75-89.
^ Richard Duncan-Jones, The Economy ofthe Roman Empire: Quantitative Studies
Second Edition (Cambridge: Cambridge University Press, 1982); Hans-Joachim
Drexhage, Preise, Mieten/Pachten, Kosten und Lohne im romischen Agypten bis zum
Regierungsantritt Diokletians (St. Katharinen: Scripta Mercaturae, 1991); Dominic
Rathbone, "Prices and Price Formation in Roman Egypt," Economic antique. Prix et
formation des prix dans les economies antiques (Saint-Bertrand-de-Comminges: Musee
archeologique departmental, 1997), 183-244.
David M. Schaps, The Invention ofCoinage and the Monetization ofAncient Greece
(Ann Arbor, MI: University of Michigan Press, 2004).
^ Rathbone, "Prices," pp. 191-92.
^ Geoffrey Rickman, The Corn Supply ofAncient Rome (Oxford: Oxford University
Press, 1980), pp. 143-55.
' Duncan-Jones, The Economy ofthe Roman Empire.
^ Kevin Greene, The Archaeology ofthe Roman Empire (Berkeley: University of
Cahfomia Press, 1986), p. 40.
30
^ William Mitchell Ramsay, "Studies in the 'Roman Province Galatia' VI—Some
Inscriptions of Colonial Caesarea Antiochea," Journal ofRoman Studies 14 (1924), pp.
172-205, at 180.
'°Rathbone, "Prices," 193.
'^ Duncan-Jones, Economy ofthe Roman Empire, 372. For information about transport
within Egypt, although not its cost, see Adam Biilow-Jacobsen, "The Traffic on the Road
and the Provisioning of the Station," in La route de Myos Hormos, edited by Helene
Cuvigny (Le Caire: Institute fran9aise d'archeology orientale, 2003), Vol 2, pp. 399-426.
^^ Tenney Frank, An Economic Survey ofAncient Rome (Paterson, NJ: Pageant Books,
1959), Vol. 4 (Heichelheim), 181-83.
'^ Gamsey, for example, observed casually and without apparent need for documentation
that oil and wine cost more in Rome than elsewhere. Peter Gamsey, Cities, Peasants and
Food in Classical Antiquity (Cambridge: Cambridge University Press, 1998), 241.
Schaps, Invention ofCoinage.
^^ Helene Cuvigny, "The Amount ofWages Paid to the Quarry-Workers at Mons
Claudianus," Journal ofRoman Studies, 86 (1996), 139-45.
The sizes of the coefficients rise when we use logarithms since the logarithm of a
number typically is smaller than the number. T-statistics are the same sign as the
coefficient, but we have reversed the signs of the t-statistics in Table 2 to make the
description more intuitive.
17In the more precise language normally used for regressions, the probability of
observing the coefficients in the table if there were no relationship between the price of
wheat and the distance from Rome is less than five percent in three out of four
31
regressions and close to that probability in the fourth. The five percent value of the t-
statistic for four degrees of freedom (six observations) is 2.8; for three degrees of
fi"eedom (five observations), 3.2. Higher t-statistics indicate lower probabilities that the
observed relationship is the result of chance.
'^ Peter Gamsey, Famine and Food Supply in the Graeco-Roman World (Cambridge:
Cambridge University Press, 1988) 195-222; Rickman, Corn Supply, 150-54.
' Catherine Virlouvet, Tesserafrumentaria: les procedures de distribution du ble public
a lafin de la Republic et au debut de I 'Empire (Rome: Ecole Fran9aise de Rome, 1995);
Gamsey, Cities, Peasants and Food, 236.
^° Boudewijn Sirks, Foodfor Rome (Amsterdam: Gieben, 1991), 21 . Jongman argues
that the annona provided bare subsistence for half the free population ofRome, that is,
less than half of total wheat imports. Willem M. Jongman, "Consumption in the early
Roman Empire," in Richard P. Sailer, Ian Morris and Walter Scheidel (eds.), The
Cambridge Economic History ofthe Greco-Roman World (Cambridge: Cambridge
University Press, 2006).
^' E. Badian, Publicans and Sinners (Oxford: Basil Blackwell, 1972); Gamsey, Famine
and Food Supply, 234; Sirks, Foodfor Rome, 63.
^^ George R. Watson, The Roman Soldier (Itahaca, NY: Cornell University Press, 1969),
89-92; Rathbone, "Prices."
^^ Peter Temin, "Mediterranean Trade in Biblical Times," in Eli F. Heckscher: A
Celebratory Symposium, edited by Ronald Findlay and Mats Lindahl (Cambridge: MIT
Press, forthcoming).
^^836 27
32

Date Due

MIT LIBRARIES
3 9080 02618 3068