Embed Size (px)
Citation preview

Money and Banking
Published by:
Flat World Knowledge, Inc. 13 N. Mill StreetNyack, NY 10960
This work is licensed under theCreative Commons Attribution-Noncommercial-Share Alike 3.0 Unported License.To view a copy of this license, visit http://creativecommons.org/licenses/by-nc-sa/3.0/or send a letter toCreative Commons, 171 Second Street, Suite 300, San Francisco, California, 94105, USA.
Printed in the United States of America
Money and Banking
Chapter 1Chapter 2Chapter 3Chapter 4Chapter 5Chapter 6Chapter 7
Chapter 8Chapter 9Chapter 10Chapter 11Chapter 12Chapter 13Chapter 14Chapter 15Chapter 16Chapter 17Chapter 18Chapter 19Chapter 20Chapter 21Chapter 22Chapter 23Chapter 24Chapter 25Chapter 26
Brief Contents
About the AuthorsAcknowledgmentsPreface
Money, Banking, and Your WorldThe Financial SystemMoneyInterest RatesThe Economics of Interest-Rate FluctuationsThe Economics of Interest-Rate Spreads and Yield CurvesRational Expectations, Efficient Markets, and the Valuation of CorporateEquitiesFinancial Structure, Transaction Costs, and Asymmetric InformationBank ManagementInnovation and Structure in Banking and FinanceThe Economics of Financial RegulationThe Financial Crisis of 2007–2008Central Bank Form and FunctionThe Money Supply ProcessThe Money Supply and the Money MultiplierMonetary Policy ToolsMonetary Policy Targets and GoalsForeign ExchangeInternational Monetary RegimesMoney DemandIS-LMIS-LM in ActionAggregate Supply and Demand, the Growth Diamond, and Financial ShocksMonetary Policy Transmission MechanismsInflation and MoneyRational Expectations Redux: Monetary Policy Implications
Index

1
2
3
5Chapter 1
57889
11Chapter 2
111213151720212324
25Chapter 3
2527
2930333334
35Chapter 4
35363840434546
Contents
About the Authors
Acknowledgments
Preface
Money, Banking, and Your World
Dreams DashedHope SpringsSuggested BrowsingSuggested ReadingEndnotes
The Financial System
Evil and Brilliant Financiers?Financial SystemsAsymmetric Information: The Real EvilFinancial MarketsFinancial IntermediariesCompetition Between Markets and IntermediariesRegulationSuggested ReadingEndnotes
Money
Of Love, Money, and Transactional EfficiencyBetter to Have Had Money and Lost It Than to Have Never Had Money atAllA Short History of MoolahCommodity and Credit MoniesMeasuring MoneySuggested ReadingEndnotes
Interest Rates
The Interest of InterestPresent and Future ValueCompounding PeriodsPricing Debt InstrumentsWhat’s the Yield on That?Calculating ReturnsInflation and Interest Rates
4849
51Chapter 5
515458616364
65Chapter 6
6567707374
75Chapter 7
757780838687
89Chapter 8
899093959799
100
101Chapter 9
101104106111113115116117
Suggested ReadingEndnotes
The Economics of Interest-Rate Fluctuations
Interest Rate FluctuationsShifts in Supply and Demand for BondsLiquidity PreferencePredictions and EffectsSuggested ReadingEndnotes
The Economics of Interest-Rate Spreads and Yield Curves
A Short History of Interest RatesInterest-Rate Determinants I: The Risk StructureThe Determinants of Interest Rates II: The Term StructureSuggested ReadingEndnotes
Rational Expectations, Efficient Markets, and the Valuation of CorporateEquities
The Theory of Rational ExpectationsValuing Corporate EquitiesFinancial Market EfficiencyEvidence of Market EfficiencySuggested ReadingEndnotes
Financial Structure, Transaction Costs, and Asymmetric Information
The Sources of External FinanceTransaction Costs, Asymmetric Information, and the Free-Rider ProblemAdverse SelectionMoral HazardAgency ProblemsSuggested ReadingEndnotes
Bank Management
The Balance SheetAssets, Liabilities, and T-AccountsBank Management PrinciplesCredit RiskInterest-Rate RiskOff the Balance SheetSuggested ReadingEndnotes
119Chapter 10
119120122123125129130
131Chapter 11
131133136139140142143
145Chapter 12
145146148150151152154156
157Chapter 13
157159161162165166
167Chapter 14
167168171173174
175Chapter 15
175
Innovation and Structure in Banking and Finance
Early Financial InnovationsInnovations GaloreLoophole Mining and LobbyingBanking on TechnologyBanking Industry Profitability and StructureSuggested ReadingEndnotes
The Economics of Financial Regulation
Public Interest versus Private InterestThe Great Depression as Regulatory FailureThe Savings and Loan Regulatory DebacleBetter but Still Not Good: U.S. Regulatory ReformsBasel II’s Third PillarSuggested ReadingEndnotes
The Financial Crisis of 2007–2008
Financial CrisesAsset BubblesFinancial PanicsLender of Last ResortBailoutsThe Crisis of 2007–2008Suggested ReadingEndnotes
Central Bank Form and Function
America’s Central BanksThe Federal Reserve System’s StructureOther Important Central BanksCentral Bank IndependenceSuggested ReadingEndnotes
The Money Supply Process
The Central Bank’s Balance SheetOpen Market OperationsA Simple Model of Multiple Deposit CreationSuggested ReadingEndnotes
The Money Supply and the Money Multiplier
A More Sophisticated Money Multiplier for M1
180181183184
185Chapter 16
185187190191192
193Chapter 17
193195196198200201
203Chapter 18
203205207209213215216
217Chapter 19
217219221224226227
229Chapter 20
229230232235236
237Chapter 21
237
The M2 Money MultiplierSummary and ExplanationSuggested ReadingEndnotes
Monetary Policy Tools
The Federal Funds Market and ReservesOpen Market Operations and the Discount WindowThe Monetary Policy Tools of Other Central BanksSuggested ReadingEndnotes
Monetary Policy Targets and Goals
A Short History of Fed BlundersCentral Bank Goal Trade-offsCentral Bank TargetsThe Taylor RuleSuggested ReadingEndnotes
Foreign Exchange
The Economic Importance of Currency MarketsDetermining the Exchange RateLong-Run Determinants of Exchange RatesShort-Run Determinants of Exchange RatesModeling the Market for Foreign ExchangeSuggested ReadingEndnotes
International Monetary Regimes
The Trilemma, or Impossible TrinityTwo Systems of Fixed Exchange RatesThe Managed or Dirty FloatThe Choice of International Policy RegimeSuggested ReadingEndnotes
Money Demand
The Quantity TheoryLiquidity Preference TheoryHead to Head: Friedman versus KeynesSuggested ReadingEndnotes
IS-LM
Aggregate Output and Keynesian Cross Diagrams
241244245
247Chapter 22
247249251251
253Chapter 23
253255256259261264265
267Chapter 24
267268270271272
273Chapter 25
273276278279
281Chapter 26
281283284285287
288
The IS-LM ModelSuggested ReadingEndnotes
IS-LM in Action
Shifting Curves: Causes and EffectsImplications for Monetary PolicyAggregate Demand CurveSuggested Reading
Aggregate Supply and Demand, the Growth Diamond, and Financial Shocks
Aggregate DemandAggregate SupplyEquilibrium AnalysisThe Growth DiamondFinancial ShocksSuggested ReadingEndnotes
Monetary Policy Transmission Mechanisms
Modeling RealityHow Important Is Monetary Policy?Transmission MechanismsSuggested ReadingEndnotes
Inflation and Money
Empirical Evidence of a Money-Inflation LinkWhy Have Central Bankers So Often Gotten It Wrong?Suggested ReadingEndnotes
Rational Expectations Redux: Monetary Policy Implications
Rational ExpectationsNew KeynesiansInflation BustingSuggested ReadingEndnotes
Index

About the Authors
ABOUT ROBERT E. WRIGHTI attribute my enduring interest in money and banking, political economy, and economic history to the troubled economic condi-tions of my youth. Born in 1969 in Rochester, New York, to two self-proclaimed factory rats, I recall little of my earliest days exceptthe Great Inflation and oil embargo, which stretched the family budget past the breaking point. My only other noneconomicmemories are of the Planet of the Apes films (all five of them!) and the 1972 Olympics massacre in Munich; my very young mindconflated the two because of the aural similarity of the words gorilla and guerilla. The recession in the early 1980s also injured myfamily’s material welfare and was seared into my brain.
After taking degrees in history from Buffalo State College (B.A., 1990) and the University of Buffalo (M.A., 1994; Ph.D., 1997), Ibegan teaching a variety of courses in business, economics, evolutionary psychology, finance, history, and sociology at TempleUniversity, the University of Virginia, sundry liberal arts colleges, and, since 2003, New York University’s Stern School of Business.I’ve also been an active researcher, editing, authoring, and co-authoring books about the development of the U.S. financial system(Origins of Commercial Banking, Hamilton Unbound, Wealth of Nations Rediscovered, The First Wall Street, Financial FoundingFathers, One Nation Under Debt), construction economics (Broken Buildings, Busted Budgets), life insurance (Mutually Beneficial),and publishing (Knowledge for Generations). Due to my unique historical perspective on public policies and the financial system, I’vealso become something of a media maven, showing up on NPR and other radio shows, as well as various television programs, andgetting quoted in major newspapers like the Wall Street Journal, New York Times, Chicago Tribune, and the Los Angeles Times. Ipublish op-eds and make regular public speaking appearances nationally and, increasingly, internationally, and I curate for the Mu-seum of American Finance.
I wrote this textbook because I strongly believe in the merits of financial literacy for all. Our financial system is struggling inpart because so many people remain feckless financially. My hope is that people who read this book carefully, dutifully complete theexercises, and attend class regularly will be able to follow the financial news and even critique it when necessary. I also hope they willmake informed choices in their own financial lives.
ABOUT DR. VINCENZO QUADRINII was born and raised in a small town in the Marche region in Italy. In 1990 I received a B.A. in Economics and Business from An-cona University and in 1991 a one-year Master in Economics from Coripe-Piemonte in Turin. After fulfilling a one-year mandatorymilitary service between 1991 and 1992, I moved to the United States to start my Ph.D. in Economics at the University ofPennsylvania, where I graduated in 1996. Since my Ph.D. graduation I have been teaching at several institutions: Pompeu FabraUniversity in Barcelona, Duke University, New York University, and University of Southern California. I have been teaching courseson monetary economics, macroeconomics, international trade, and international finance. My research interests are in similar topics,and since my graduation in 1996 I have published several articles in scholarly journals including American Economic Review, Journalof Monetary Economics, Journal of Political Economy, and Review of Economic Studies.
My current research projects focus on the macroeconomic impact of credit and financial shocks similar to the ones that are cur-rently affecting the U.S. economy. I am also interested in understanding how these shocks are propagated internationally to othereconomies. Another research interest focuses on the understanding of how differences in financial markets across countries can leadto large financial imbalances, that is, a situation in which some countries, like the United States, borrow heavily from other countrieslike China and Japan.
AcknowledgmentsMany people have helped to make this project a reality. At Flat World Knowledge, Shannon Gattens and Jeff Shelstad helped toshepherd the concept and the manuscript through the standard trials and tribulations. Along the way, a score of anonymous aca-demic readers helped to keep our economic analyses and prose on the straight and narrow. Paul Wachtel and Richard Sylla, two col-leagues at New York University’s Stern School of Business, also aided us along the way with measured doses of praise and criticism.We thank them all. Thanks too to the University of Virginia’s Department of Economics, especially the duo of economic historiansand “money guys” there, Ron Michener and John James, for putting up with Wright one very hot summer in Charlottesville. Veryspecial thanks go to the members of Wright’s Summer I 2007 Money and Banking class at the University of Virginia, who sufferedthrough a free but error-prone first draft, mostly with good humor and always with helpful comments: Kevin Albrecht, Adil Arora,Eric Bagden, Michelle Coffey, Timothy Dalbey, Karina Delgadillo, Christopher Gorham, Joshua Hefner, Joseph Henderson, JamieJackson, Anthony Jones, Robert Jones, Risto Keravuori, Heather Koo, Sonia Kwak, Yiding Li, Patrick Lundquist, Maria McLemore,Brett Murphy, Daniel Park, Bensille Parker, Rose Phan, Patrick Reams, Arjun Sharma, Cole Smith, Sandy Su, Paul Sullivan, NedimUmur, Will van der Linde, Neal Wood, and June Yang.
It’s customary at this point for authors to assume full responsibility for the facts and judgments in their books. We will not buckthat tradition: the buck stops here! Unlike a journal article or academic monograph, textbooks afford ample room for revision insubsequent editions, of which we hope there will be many. So if you spot a problem, contact the publisher and we’ll fix it at the earli-est (economically justifiable) opportunity.
Robert E. Wright, February 2009, Abington, PennsylvaniaVincenzo Quadrini, February 2009, Los Angeles, California
Preface“Dad,” my kids regularly ask me, “why do you write such boring books?” They then giggle and run away before I have a chance totickle them to tears. They are still too young to realize that boring, like beauty, is in the eye of the beholder. The financial crisis of2007–2008 has made the study of money and banking almost as exciting as sex, drugs, and rock ’n’ roll because it has made clear toall observers just how important the financial system is to our well-being. This is the first textbook to emerge from that crisis, towhich my co-author, Vincenzo Quadrini, and I have devoted an entire chapter, and we have included numerous references to itthroughout the book. This book is also exciting, or at least not boring, because of the writing style we have employed. Numerous hu-morous links are provided and slang terms are peppered throughout. Seemingly complex subjects like money, interest rates, bank-ing, financial regulation, and the money supply are treated in short, snappy sections, not longwinded treatises. Yet we have sacrificedlittle in the way of analytical rigor.
This book is designed to help you internalize the basics of money and banking. There is a little math, some graphs, and somesophisticated vocabulary, but nothing terribly difficult, if you put your brain to it. The text’s most important goal is to get you tothink for yourselves. To fulfill that goal, each section begins with one or more questions, called Learning Objectives, and ends withKey Takeaways that provide short answers to the questions and smartly summarize the section in a few bullet points. Most sectionsalso contain a sidebar called Stop and Think. Rather than ask you to simply repeat information given in the chapter discussion, theStop and Think sidebars require that you apply what you (should have) learned in the chapter to a novel situation. You won’t getthem all correct, but that isn’t the point. The point is to stretch your brain. Where appropriate, the book also drills you on specificskills, like calculating bond prices. Key terms and chapter-level objectives also help you to navigate and master the subject matter.The book is deliberately short and right to the point. If you hunger for more, read one or more of the books listed in the SuggestedReading section at the end of each chapter. Keep in mind, however, that the goal is to internalize, not to memorize. Allow this bookto inform your view of the world and you will be the better for it, and so will your loved ones.

4 MONEY AND BANKING
C H A P T E R 1Money, Banking, and YourWorld
C H A P T E R O B J E C T I V E S
By the end of this chapter, students should be able to:
1. Describe how ignorance of the principles of money and banking has injured the lives ofeveryday people.
2. Describe how understanding the principles of money and banking has enhanced the livesof everyday people.
3. Explain how bankers can simultaneously be entrepreneurs and lend to entrepreneurs.
1. DREAMS DASHED
L E A R N I N G O B J E C T I V E
1. How can ignorance of the principles of money and banking destroy your dreams?
At 28, Ben is in his prime. Although tall, dark, and handsome enough to be a movie star, Ben’s real pas-sion is culinary, not thespian. Nothing pleases him more than applying what he learned earning his de-grees in hospitality and nutrition to prepare delicious yet healthy appetizers, entrees, and desserts forrestaurant-goers. He chafes, therefore, when the owner of the restaurant for which he works forces himto use cheaper, but less nutritional, ingredients in his recipes. Ben wants to be his own boss and thinkshe sees a demand for his style of tasty, healthy cuisine. Trouble is, Ben, like most people, came fromhumble roots. He doesn’t have enough money to start his own restaurant, and he’s having difficultyborrowing what he needs because of some youthful indiscretions concerning money. If Ben is right,and he can obtain financing, his restaurant could become a chain that might revolutionize America’seating habits, rendering Eric Schlosser’s exposé of the U.S. retail food industry, Fast Food Nation(2001),[1] as obsolete as The Jungle (1901),[2] Upton Sinclair’s infamous description of the disgustingside of the early meatpacking industry. If Ben can get some financial help but is wrong about Americ-ans preferring natural ingredients to hydrogenized this and polysaturated that, he will have wasted histime and his financial backers may lose some money. If he cannot obtain financing, however, the worldwill never know whether his idea was a good one or not. Ben’s a good guy, so he probably won’t turn todrugs and crime but his life will be less fulfilling, and Americans less healthy, if he never has a chanceto pursue his dream.
negative amortizationmortgage
A mortgage with periodicpayments lower than whatwould be required to pay theinterest on the loan. Insteadof declining over time, theprincipal owed increases asunpaid interest is added to it.
balloon payment
A principal payment due in alarge lump sum, usually atthe end of the loan period.
interest rate
The price of borrowedmoney.
foreign exchange
Buying and selling of foreigncurrencies, for example, theBritish pound, the Japaneseyen, and the EuropeanUnion’s euro.
life insurance
A contract that promises topay a sum of money tobeneficiaries upon the deathof an insured person.
Married for a decade, Rose and Joe also had a dream, the American Dream, a huge house with abig, beautiful yard in a great neighborhood. The couple could not really afford such a home, but theyfound a lender that offered them low monthly payments. It seemed too good to be true because it was.Rose and Joe unwittingly agreed to a negative amortization mortgage with a balloon payment.Their monthly payments were so low because they paid just part of the interest due each year and noneof the (growing) principal. When housing prices in their area began to slide downward, the lender fore-closed, although they had never missed a payment. They lost their home and, worse, their credit. Thecouple now rents a small apartment and harbors a deep mistrust of the financial system.
Rob and Barb had a more modest dream of a nice house in a good location with many conveni-ences, a low crime rate, and a decent public school system. They found a suitable home, had their offeraccepted, and obtained a conventional thirty-year mortgage. But they too discovered that their ignor-ance of the financial system came with a price when they had difficulty selling their old house. They putit up for sale just as the Federal Reserve,[3] America’s central bank (monetary authority), decided toraise the interest rate because the economy, including the housing market, was too hot (growing tooquickly), portending a higher price level across the economy (inflation). Higher interest meant it wasmore expensive to borrow money to buy a house (or anything else for that matter). To compensate,buyers decreased the amount they were willing to offer and in some cases stopped looking for a newhome entirely. Unable to pay the mortgage on both houses, Rob and Barb eventually sold their oldhouse for much less than they had hoped. The plasma TV, new carpeting, playground set in the yard,sit-down mower, and other goods they planned to buy evaporated. That may have been good for theeconomy by keeping inflation in check, but Rob and Barb, like Rose, Joe, and Ben, wished they knew moreabout the economics of money, banking, and interest rates.
Samantha too wished that she knew more about the financial system, particularly foreign ex-change. Sam, as her friends called her, had grown up in Indiana, where she developed a vague sensethat people in other countries use money that is somehow different from the U.S. dollar. But she nevergave the matter much thought, until she spent a year in France as an exchange student. With only$15,000 in her budget, she knew that things would be tight. As the dollar depreciated (lost value) vis-à-vis France’s currency, the euro, she found that she had to pay more and more dollars to buy each euro.Poor Sam ran through her budget in six months. Unable to obtain employment in France, she returnedhome embittered, her conversational French still vibrating with her Indiana twang.
Jorge would have been a rich man today if his father had not invested his inheritance in U.S. govern-ment bonds in the late 1960s. The Treasury promptly paid the interest contractually due on thosebonds, but high rates of inflation and interest in the 1970s and early 1980s reduced their prices andwiped out most of their purchasing power. Instead of inheriting a fortune, Jorge received barelyenough to buy a midsized automobile. That his father had worked so long and so hard for so littlesaddened Jorge. If only his father had understood a few simple facts: when the supply of money in-creases faster than the demand for it, prices rise and inflation ensues. When inflation increases, so toodo nominal interest rates. And when interest rates rise, the prices of bonds (and many other types ofassets that pay fixed sums) fall. Jorge’s father didn’t lack intelligence, and he wasn’t even atypical. Manypeople, even some otherwise well-educated ones, do not understand the basics of money, banking, andfinance. And they and their loved ones pay for it, sometimes dearly.
Madison knows that all too well. Her grandparents didn’t understand the importance of portfoliodiversification (the tried-and-true rule that you shouldn’t put all of your eggs in one basket), so they in-vested their entire life savings in a single company, Enron.[4] They lost everything (except their SocialSecurity checks)[5] after that bloated behemoth went bankrupt in December 2001. Instead of lavishingher with gifts, Madison’s grandparents drained resources away from their granddaughter by constantlyseeking handouts from Madison’s parents. When the grandparents died—without life insurance, yetanother misstep—Madison’s parents had to pay big bucks for their “final expenses.”[6]
Stop and Think Box
History textbooks often portray the American Revolution as a rebellion against unjust taxation, but the colon-ists of British North America had other, more important grievances. For example, British imperial policies set inLondon made it difficult for the colonists to control the supply of money or interest rates. When money be-came scarce, as it often did, interest rates increased dramatically, which in turn caused the value of colonists’homes, farms, and other real estate to decrease quickly and steeply. As a consequence, many lost their prop-erty in court proceedings and some even ended up in special debtors’ prisons. Why do history books fail todiscuss this important monetary cause of the American Revolution?
Most historians, like many people, generally do not fully understand the principles of money and banking.
6 MONEY AND BANKING
exchange rate
The price of one currency interms of another.
K E Y T A K E A W A Y
< People who understand the principles of money and banking are more likely to lead happy, successful,fulfilling lives than those who remain ignorant about them.
2. HOPE SPRINGS
L E A R N I N G O B J E C T I V E
1. How can knowledge of the principles of money and banking help you to achieve your dreams?
Of course, sometimes things go right, especially when one knows what one is doing. Henry Kauf-man,[7] who as a young Jewish boy fled Nazi persecution in the 1930s, is now a billionaire because heunderstood what made interest rates (and as we’ll see, by extension, the prices of all sorts of financialinstruments) rise and fall. A little later, another immigrant from Central Europe, George Soros, made alarge fortune correctly predicting changes in exchange rates.[8] Millions of other individuals have im-proved their lot in life (though most not as much as Kaufman and Soros!) by making astute life decisionsinformed by knowledge of the economics of money and banking. Your instructor and I cannot guaranteeyou riches and fame, but we can assure you that, if you read this book carefully, attend class dutifully,and study hard, your life will be the better for it.
The study of money and banking can be a daunting one for students. Seemingly familiar terms heretake on new meanings. Derivatives refer not to calculus (though calculus helps to calculate their value)but to financial instruments for trading risks. Interest is not necessarily interesting; stocks are not alivenor are they holding places for criminals; zeroes can be quite valuable; CDs don’t contain music; yieldcurves are sometimes straight lines; and the principal is a sum of money or an owner, not the adminis-trative head of a high school. In finance, unlike in retail or publishing, returns are a good thing.Military-style acronyms and jargon also abound: 4X, A/I, Basel II, B.I.G., CAMELS, CRA, DIDMCA,FIRREA, GDP, IMF, LIBOR, m, NASDAQ, NCD, NOW, OTS, r, SOX, TIPS, TRAPS, and on and on.[9]
People who learn this strange new language and who learn to think like a banker (or other type offinancier) will be rewarded many times over in their personal lives, business careers, and civic life. Theywill make better personal decisions, run their businesses or departments more efficiently, and be better-in-formed citizens. Whether they seek to climb the corporate ladder or start their own companies, theywill discover that interest, inflation, and foreign exchange rates are as important to success as are cellphones, computers, and soft people skills. And a few will find a career in banking to be lucrative andfulfilling. Some, eager for a challenging and rewarding career, will try to start their own banks fromscratch. And they will be able to do so, provided they are good enough to pass muster with investorsand with government regulators charged with keeping the financial system, one of the most importantsectors of the economy, safe and sound.
One last thing. This book is about Western financial systems, not Islamic ones. Islamic financeperforms the same functions as Western finance but tries to do so in a way that is sharia-compliant, or,in other words, a way that accords with the teachings of the Quran and its modern interpreters, whofrown upon interest. To learn more about Islamic finance, which is currently growing and developingvery rapidly, you can refer to one of the books listed in Suggested Readings.
Stop and Think Box
Gaining regulatory approval for a new bank has become so treacherous that consulting firms specializing inhelping potential incorporators to navigate regulator-infested waters have arisen and some, like Nubank,[10]
have thrived. Why are regulations so stringent, especially for new banks? Why do people bother to form newbanks if it is so difficult?
Banking is such a complex and important part of the economy that the government cannot allow anyone todo it. For similar reasons, it cannot allow just anyone to perform surgery or fly a commercial airliner. People runthe regulatory gauntlet because establishing a new bank can be extremely profitable and exciting.
CHAPTER 1 MONEY, BANKING, AND YOUR WORLD 7
K E Y T A K E A W A Y
< Not everyone will, or can, grow as wealthy as Henry Kaufman, George Soros, and other storied financiers,but everyone can improve their lives by understanding the financial system and their roles in it.
3. SUGGESTED BROWSING
3.1 Financial Literacy Foundation: http://www.finliteracy.org/The FLF “is a nonprofit organization created to address the growing problem of financial illiteracyamong young consumers.” Similar organizations include the Foundation for Financial Literacy(http://www.ffliteracy.org/) and the Institute for Financial Literacy (http://www.ffltx.org/).
3.2 Museum of American Finance: http://www.moaf.org/indexIn addition to its Web site and its stunning new physical space at the corner of William and Wall inManhattan’s financial district, the Museum of American Finance publishes a financial historymagazine. One of this book’s authors (Wright) sits on the editorial board.
4. SUGGESTED READINGAyub, Muhammed. Understanding Islamic Finance. Hoboken, NJ: John Wiley and Sons, 2008.El-Gamal, Mahmoud. Islamic Finance: Law, Economics, and Practice. New York: Cambridge
University Press, 2008.Kaufman, Henry. On Money and Markets: A Wall Street Memoir. New York: McGraw Hill, 2001.Soros, George. Soros on Soros: Staying Ahead of the Curve. Hoboken, NJ: John Wiley and Sons,
1995.
8 MONEY AND BANKING

1.
2.
3.
4.5.6.7.8.9.
10.
ENDNOTES
www.amazon.com/Fast-Food-Nation-Eric-Schlosser/dp/0060838582/sr=8-1/qid=1168386508/ref=pd_bbs_sr_1/104-9795105-9365527?ie=UTF8&s=books
http://sinclair.thefreelibrary.com/Jungle;http://sunsite.berkeley.edu/Literature/Sinclair/TheJungle/
sinclair.thefreelibrary.com/Jungle;http://sunsite.berkeley.edu/Literature/Sinclair/TheJungle/
http://www.federalreserve.gov/
www.riskglossary.com/link/enron.htm
www.ssa.gov/
www.fincalc.com/ins_03.asp?id=6
www.theglobalist.com/AuthorBiography.aspx?AuthorId=126
www.georgesoros.com/
www.acronym-guide.com/financial-acronyms.html; http://www.garlic.com/~lynn/fingloss.htm
www.nubank.com/
CHAPTER 1 MONEY, BANKING, AND YOUR WORLD 9

10 MONEY AND BANKING
C H A P T E R 2The Financial System
C H A P T E R O B J E C T I V E S
By the end of this chapter, students should be able to:
1. Critique cultural stereotypes of financiers.
2. Describe the financial system and the work that it performs.
3. Define asymmetric information and sketch the problems that it causes.
4. List the major types of financial markets and describe what distinguishes them.
5. List the major types of financial instruments or securities and describe what distinguishesthem.
6. List the major types of intermediaries and describe what distinguishes them.
7. Describe and explain the most important trade-offs facing investors.
8. Describe and explain borrowers’ major concerns.
9. Explain the functions of financial regulators.
1. EVIL AND BRILLIANT FINANCIERS?
L E A R N I N G O B J E C T I V E
1. Are bankers, insurers, and other financiers innately good or evil?
Ever notice that movies and books tend to portray financiers as evil and powerful monsters, bent ondestroying all that decent folks hold dear for the sake of a fast buck? In his best-selling 1987 novelBonfire of the Vanities,[1] for example, Tom Wolfe depicts Wall Street bond trader Sherman McCoy(played by Tom Hanks in the movie version)[2] as a slimy “Master of the Universe”: rich, powerful, anda complete butthead. Bashing finance is not a passing fad; you may recall the unsavory Shylock charac-ter from Shakespeare’s play The Merchant of Venice.[3] And who could forget Danny DeVito[4] as thearrogant little donut-scarfing “Larry the Liquidator” juxtaposed against the adorable old factory ownerAndrew Jorgenson (played by Gregory Peck)[5] in Other People’s Money.[6] Even the Christmas classicIt’s a Wonderful Life[7] contains at best a dual message. In the film, viewers learn that George Bailey, thelovable president of the local building and loan association (a type of community bank) played byJimmy Stewart, saved Bedford Falls from the clutches of a character portrayed by Lionel Barrymore,actress Drew Barrymore’s grand-uncle, the ancient and evil financier Henry F. Potter. (No relation toHarry, I’m sure.) That’s hardly a ringing endorsement of finance.[8]
Truth be told, some financiers have done bad things. Then again, so have members of every occu-pational, geographical, racial, religious, and ethnic group on the planet. But most people, most of thetime, are pretty decent, so we should not malign entire groups for the misdeeds of a few, especially whenthe group as a whole benefits others. Financiers and the financial systems they inhabit benefit manypeople in wealthier countries. The financial system does so much good for the economy, in fact, thatsome people believe that financiers are brilliant rocket scientists or at least “the smartest guys in theroom.”[9] This positive stereotype, however, is as flawed as the negative one. While some investmentbankers, insurance actuaries, and other fancy financiers could have worked for NASA, they are farfrom infallible. The financial crisis that began in 2007 reminds us, once again, that complex mathemat-ical formulas are less useful in economics (and other social sciences) than in astrophysics. Financiers,like politicians, religious leaders, and, yes, college professors, have made colossal mistakes in the past andwill undoubtedly do so again in the future.
So rather than lean on stereotypes, this chapter will help you to form your own view of the finan-cial system. In the process, it will review the entire system. It’s well worth your time and effort to read
financial system
A densely interconnectednetwork of financialintermediaries, facilitators,and markets that allocatescapital, shares risks, andfacilitates intertemporal trade.
positive net present valueproject
A project likely to beprofitable at a given interestrate after comparing thepresent values of bothexpenditures and revenues.This will make more senseafter you navigate Chapter 4.
this chapter carefully because it contains a lot of descriptive information and definitions that will help youlater in the text.
K E Y T A K E A W A Y S
< Financiers are not innately good or evil but rather, like other people, can be either, or can even be bothsimultaneously.
< While some financiers are brilliant, they are not infallible, and fancy math does not reality make.
< Rather than follow prevalent stereotypes, students should form their own views of the financial system.
< This important chapter will help students to do that, while also bringing them up to speed on key termsand concepts that will be used throughout the book.
2. FINANCIAL SYSTEMS
L E A R N I N G O B J E C T I V E
1. What is a financial system and why do we need one?
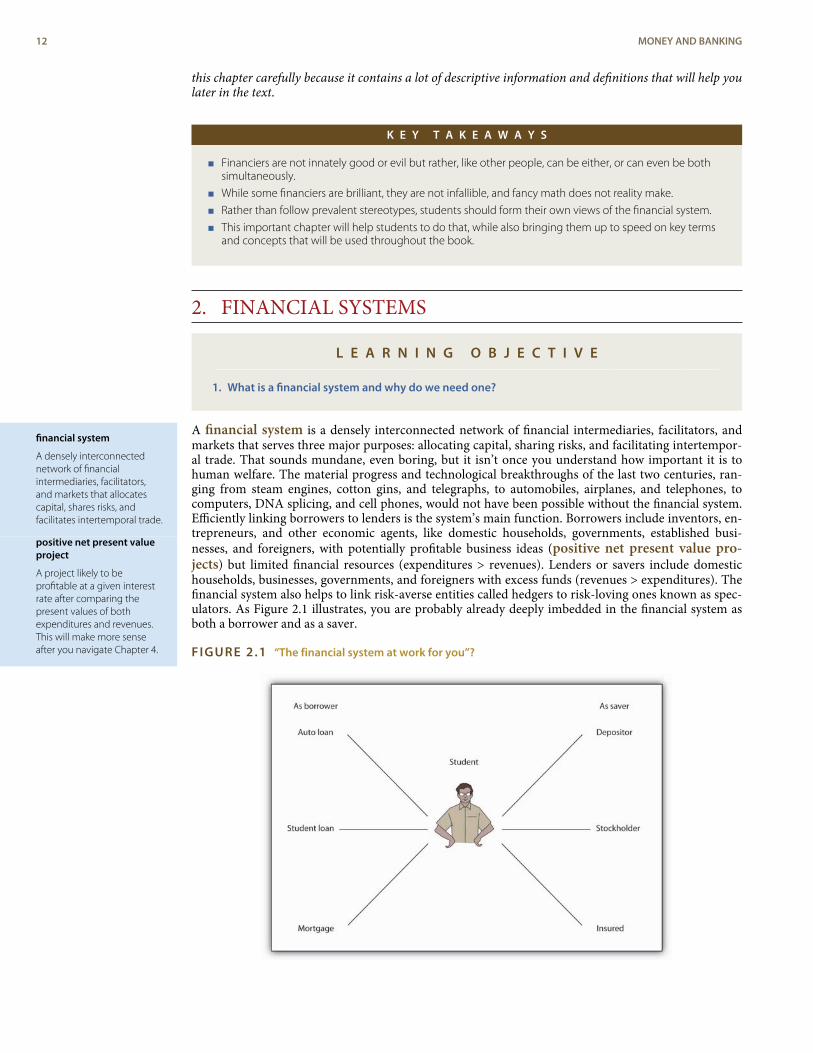
A financial system is a densely interconnected network of financial intermediaries, facilitators, andmarkets that serves three major purposes: allocating capital, sharing risks, and facilitating intertempor-al trade. That sounds mundane, even boring, but it isn’t once you understand how important it is tohuman welfare. The material progress and technological breakthroughs of the last two centuries, ran-ging from steam engines, cotton gins, and telegraphs, to automobiles, airplanes, and telephones, tocomputers, DNA splicing, and cell phones, would not have been possible without the financial system.Efficiently linking borrowers to lenders is the system’s main function. Borrowers include inventors, en-trepreneurs, and other economic agents, like domestic households, governments, established busi-nesses, and foreigners, with potentially profitable business ideas (positive net present value pro-jects) but limited financial resources (expenditures > revenues). Lenders or savers include domestichouseholds, businesses, governments, and foreigners with excess funds (revenues > expenditures). Thefinancial system also helps to link risk-averse entities called hedgers to risk-loving ones known as spec-ulators. As Figure 2.1 illustrates, you are probably already deeply imbedded in the financial system asboth a borrower and as a saver.
FIGURE 2.1 “The financial system at work for you”?
12 MONEY AND BANKING
internal finance
Financing that comes fromthe company itself, theplowing of profits back intothe business.
external finance
Obtaining short- or long-termfunding from outside sources(those external to thecompany).
minimum efficient scale
The smallest a business canbe and still remain efficientand/or profitable.
scarcity
The finite availability ofresources coupled with theinfinite demand for them; thefact that goods are notavailable in sufficient quantityto satisfy everyone’s wants.
adverse selection
The fact that the leastdesirable borrowers andthose who seek insurancemost desire loans andinsurance policies.
moral hazard
Any postcontractual changein behavior that injures otherparties to the contract.
Occasionally, people and companies, especially small businesses or ones that sell into rapidly growingmarkets, have enough wealth (a stock) and income (a flow) to implement their ideas without outsidehelp by plowing back profits (aka internal finance). Most of the time, however, people and firms withgood ideas do not have the savings or cash needed to draw up blueprints, create prototypes, lease office orproduction space, pay employees, obtain permits and licenses, or suffer the myriad risks of bringing a newor improved good to market. Without savings, a rich uncle or close friend, or some other form of ex-ternal finance, people remain wannabe entrepreneurs and companies cannot complete their projects.That should concern you because the world is a poorer place for it.[10]
Why do we need a financial system? Why can’t individuals and companies simply borrow fromother individuals and companies when they need to? Lending, like supplying many other types of goods,is most efficiently and cheaply conducted by specialists, companies that do only one thing (or a couple ofrelated activities) very well because they have much practice doing it and because they tap economies ofscale. The fixed costs of making loans—advertising for borrowers, buying and maintaining computers,leasing suitable office space, and the like—are fairly substantial. To recoup those fixed costs, to drivethem toward insignificance, lenders have to do quite a volume of business. Little guys usually just can’tbe profitable. This is not to say, however, that bigger is always better, only that to be efficient financialcompanies must exceed minimum efficient scale.
K E Y T A K E A W A Y S
< The financial system is a dense network of interrelated markets and intermediaries that allocates capitaland shares risks by linking savers to spenders, investors to entrepreneurs, lenders to borrowers, and therisk-averse to risk-takers.
< It also increases gains from trade by providing payment services and facilitating intertemporal trade.
< A financial system is necessary because few businesses can rely on internal finance alone.
< Specialized financial firms that have achieved minimum efficient scale are better at connecting investorsto entrepreneurs than nonfinancial individuals and companies.
3. ASYMMETRIC INFORMATION: THE REAL EVIL
L E A R N I N G O B J E C T I V E
1. What is asymmetric information, what problems does it cause, and what can mitigate it?
Finance also suffers from a peculiar problem that is not easily overcome by just anybody. Undoubtedly,you’ve already encountered the concept of opportunity costs, the nasty fact that to obtain X you mustgive up Y, that you can’t have your cake and eat it too. You may not have heard of asymmetric inform-ation, another nasty fact that makes life much more complicated. Like scarcity, asymmetric informa-tion inheres in nature, the devil incarnate. That is but a slight exaggeration. When a seller (borrower, aseller of securities) knows more than a buyer (lender or investor, a buyer of securities), only trouble canresult. Like the devil in Dante’s Inferno,[11] this devil has two big ugly heads, adverse selection, whichraises Cain before a contract is signed, and moral hazard, which entails sinning after contract con-summation. (Later, we’ll learn about a third head, the principal-agency problem, a special type of moralhazard.)
Due to adverse selection, the fact that the riskiest borrowers are the ones who most strongly desireloans, lenders attract sundry rogues, knaves, thieves, and ne’er-do-wells, like pollen-laden flowers at-tract bees (Natty Light[12] attracts frat boys?). If they are unaware of that selection bias, lenders will findthemselves burned so often that they will prefer to keep their savings under their mattresses rather thanrisk lending it. Unless recognized and effectively countered, moral hazard will lead to the same subop-timal outcome. After a loan has been made, even good borrowers sometimes turn into thieves becausethey realize that they can gamble with other people’s money. So instead of setting up a nice little icecream shop with the loan as they promised, a disturbing number decide instead to try to get rich quickby taking a quick trip to Vegas or Atlantic City[13] for some potentially lucrative fun at the blackjacktable. If they lose, they think it is no biggie because it wasn’t their money.
CHAPTER 2 THE FINANCIAL SYSTEM 13
liquidity
The ease, speed, and cost ofsale of an asset.
capital
In this context, long-termfinancing.
facilitators
In this context, businessesthat help markets to functionmore efficiently.
markets
Institutions where thequantity and price of goodsare determined.
intermediaries
Businesses that connectinvestors to entrepreneurs viavarious financial contracts,like checking accounts andinsurance policies.
One of the major functions of the financial system is to tangle with those devilish informationasymmetries. It never kills asymmetry, but it usually reduces its influence enough to let businesses andother borrowers obtain funds cheaply enough to allow them to grow, become more efficient, innovate,invent, and expand into new markets. By providing relatively inexpensive forms of external finance, fin-ancial systems make it possible for entrepreneurs and other firms to test their ideas in the marketplace.They do so by eliminating, or at least reducing, two major constraints on liquidity and capital, or theneed for short-term cash and long-term dedicated funds. They reduce those constraints in two majorways: directly (though often with the aid of facilitators) via markets and indirectly via intermediar-ies. Another way to think about that is to realize that the financial system makes it easy to trade inter-temporally, or across time. Instead of immediately paying for supplies with cash, companies can usethe financial system to acquire what they need today and pay for it tomorrow, next week, next month,or next year, giving them time to produce and distribute their products.
Stop and Think Box
You might think that you would never stoop so low as to take advantage of a lender or insurer. That may betrue, but financial institutions are not worried about you per se; they are worried about the typical reaction toasymmetric information. Besides, you may not be as pristine as you think. Have you ever done any of thefollowing?
< Stolen anything from work?
< Taken a longer break than allowed?
< Deliberately slowed down at work?
< Cheated on a paper or exam?
< Lied to a friend or parent?
If so, you have taken advantage (or merely tried to, if you were caught) of asymmetric information.
K E Y T A K E A W A Y S
< Asymmetric information occurs when one party knows more about an economic transaction or asset thanthe other party does.
< Adverse selection occurs before a transaction takes place. If unmitigated, lenders and insurers will attractthe worst risks.
< Moral hazard occurs after a transaction takes place. If unmitigated, borrowers and the insured will takeadvantage of lenders and insurers.
< Financial systems help to reduce the problems associated with both adverse selection and moral hazard.
14 MONEY AND BANKING
derivatives
Derivatives are complexfinancial instruments, theprices of which are based onthe prices of underlyingassets, variables, or indices.Some investors use them tohedge (reduce) risks, whileothers (speculators) use themto increase risks.
dealers
Businesses that buy and sellsecurities continuously at bidand ask prices, profiting fromthe difference or spreadbetween the two prices.
FIGURE 2.2Nineteenth-centurypicture of male telegraphoperator
© 2010 Jupiterimages Corporation
collateral
Property pledged as securityfor the repayment of a loan.
4. FINANCIAL MARKETS
L E A R N I N G O B J E C T I V E
1. In what ways can financial markets and instruments be grouped?
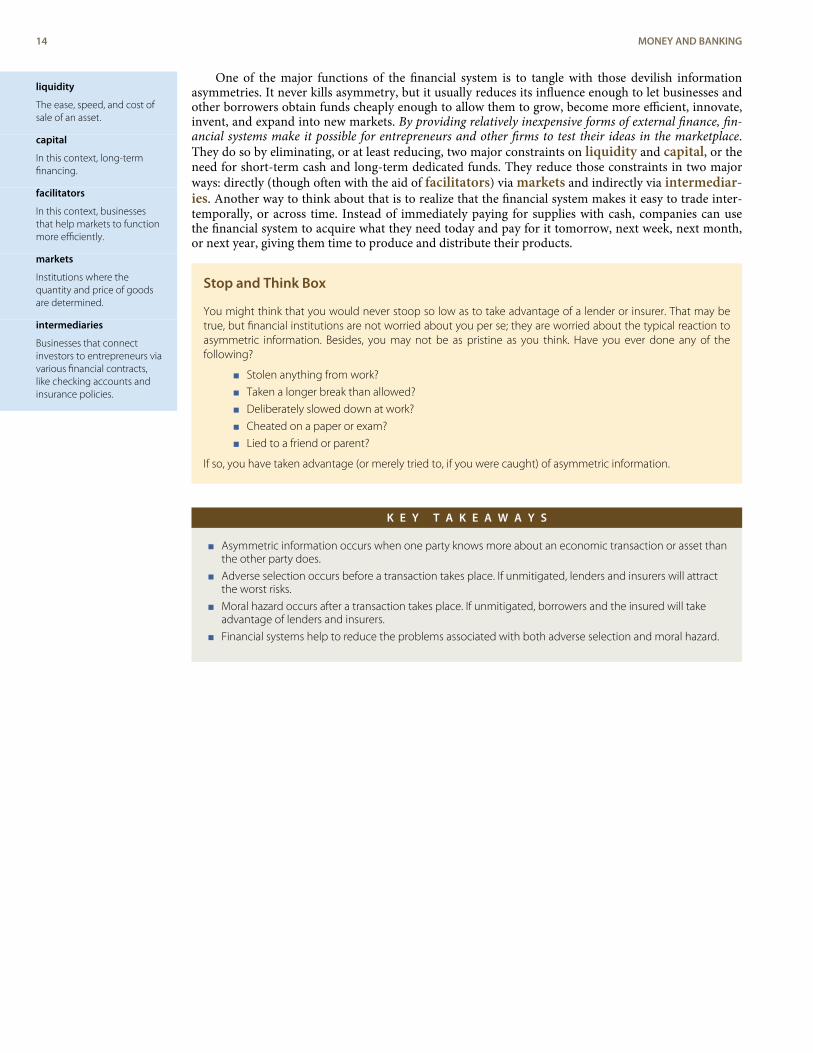
Financial markets come in a variety of flavors to accommodate the wide array of financial instruments orsecurities that have been found beneficial to both borrowers and lenders over the years. Primary marketsare where newly created (issued) instruments are sold for the first time. Most securities are negotiable.In other words, they can be sold to other investors at will in what are called secondary markets. Stockexchanges, or secondary markets for ownership stakes in corporations called stocks (aka shares orequities), are the most well-known type, but there are also secondary markets for debt, including bonds(evidences of sums owed, IOUs), mortgages, and derivatives and other instruments. Not all secondarymarkets are organized as exchanges, centralized locations, like the New York Stock Exchange or theChicago Board of Trade, for the sale of securities. Some are over-the-counter (OTC) markets run bydealers connected via various telecom devices (first by post and semaphore [flag signals], then by tele-graph, then telephone, and now computer). Completely electronic stock markets have gained muchground in recent years.[14]
Money markets are used to trade instruments with less than a year to maturity (repayment of prin-cipal). Examples include the markets for T-bills (Treasury bills or short-term government bonds), com-mercial paper (short-term corporate bonds), banker’s acceptances (guaranteed bank funds, like a cash-ier’s check), negotiable certificates of deposit (large-denomination negotiable CDs, called NCDs), Fedfunds (overnight loans of reserves between banks), call loans (overnight loans on the collateral ofstock), repurchase agreements (short-term loans on the collateral of T-bills), and foreign exchange(currencies of other countries).
Securities with a year or more to maturity trade in capital markets. Some capital market instru-ments, called perpetuities, never mature or fall due. Equities (ownership claims on the assets and in-come of corporations) and perpetual interest-only loans are prime examples. (Some interest-only loansmature in fifteen or thirty years with a so-called balloon payment, in which the principal falls due all atonce at the end of the loan.) Most capital market instruments, including mortgages (loans on real estatecollateral), corporate bonds, government bonds, and commercial and consumer loans, have fixed ma-turities ranging from a year to several hundred years, though most capital market instruments issuedtoday have maturities of thirty years or less. Figure 2.3 briefly summarizes the differences between vari-ous types of financial markets.
FIGURE 2.3 Types of financial markets
Derivatives contracts trade in a third type of financial market. Derivatives allow investors to spread andshare a wide variety of risks, from changes in interest rates and stock market indices[15] to undesirableweather conditions[16] (too sunny for farmers, too rainy for amusement parks, too cold for orangegrowers, too hot for ski resorts). Financial derivatives are in some ways even more complicated thanthe derivatives in calculus, so they are usually discussed in detail only in more specialized or advancedcourses. (Here is a spot where your instructor might provide custom content.)
CHAPTER 2 THE FINANCIAL SYSTEM 15
direct placement
A sale of financial securities,usually bonds, via directnegotiations with buyers,usually large institutionalinvestors like insurance andinvestment companies.
merger
A merger occurs when two ormore extant business firmscombine into one through apooling of interests orthrough purchase.
acquisition
When one company takes acontrolling interest inanother; when one businessbuys another.
Some call financial markets “direct finance,” though most admit the term is a misnomer because thefunctioning of the markets is usually aided by one or more market facilitators, including brokers, dealers,brokerages, and investment banks. Brokers facilitate secondary markets by linking sellers to buyers ofsecurities in exchange for a fee or a commission, a percentage of the sale price. Dealers “make a mar-ket” by continuously buying and selling securities, profiting from the spread, or the difference betweenthe sale and purchase prices. (For example, a dealer might buy a certain type of bond at, say, $99 andresell it at $99.125, ten thousand times a day.) Brokerages engage in both brokering and dealing andusually also providing their clients with advice and information. Investment banks facilitate primarymarkets by underwriting stock and bond offerings, including initial public offerings (IPOs) of stocks,and by arranging direct placements of bonds. Sometimes investment banks act merely as brokers, in-troducing securities issuers to investors, usually institutional investors like the financial intermediariesdiscussed below. Sometimes they act as dealers, buying the securities themselves for later (hopefullysoon!) resale to investors. And sometimes they provide advice, usually regarding mergers and acquis-itions. Investment banks took a beating during the financial crisis that began in 2007. Most of the ma-jor ones went bankrupt or merged with large commercial banks. Early reports of the death of invest-ment banking turned out to be premature, but the sector is depressed at present; two large ones andnumerous small ones, niche players called boutiques, remain.[17]
Stop and Think Box
In eighteenth-century Pennsylvania and Maryland, people could buy real estate, especially in urban areas, onso-called ground rent, in which they obtained clear title and ownership of the land (and any buildings or otherimprovements on it) in exchange for the promise to pay some percentage (usually 6) of the purchase priceforever. What portion of the financial system did ground rents (some of which are still being paid) inhabit?How else might ground rents be described?
Ground rents were a form of market or direct finance. They were financial instruments or, more specifically,perpetual mortgages akin to interest-only loans.
Financial markets are increasingly international in scope. Integration of transatlantic financial marketsbegan early in the nineteenth century and accelerated after the mid-nineteenth-century introduction ofthe transoceanic telegraph systems. The process reversed early in the twentieth century due to WorldWars I and II and the cold war; the demise of the gold standard;[18] and the rise of the BrettonWoods[19] system of fixed exchange rates, discretionary monetary policy, and capital immobility. (We’llexplore these topics and a related matter, the so-called trilemma, or impossible trinity, in Chapter 19.)With the end of the Bretton Woods arrangement in the early 1970s and the cold war in the late 1980s/early 1990s, financial globalization reversed course once again. Today, governments, corporations, andother securities issuers (borrowers) can sell bonds, called foreign bonds, in a foreign country denomin-ated in that foreign country’s currency. (For example, the Mexican government can sell dollar-denom-inated bonds in U.S. markets.) Issuers can also sell Eurobonds or Eurocurrencies, bonds issued (createdand sold) in foreign countries but denominated in the home country’s currency. (For example, U.S.companies can sell dollar-denominated bonds in London and U.S. dollars can be deposited in non-U.S.banks. Note that the term Euro has nothing to do with the euro, the currency of the European Union,but rather means “outside.” A Euro loan, therefore, would be a loan denominated in euro but made inLondon, New York, Tokyo, or Perth.) It is now also quite easy to invest in foreign stock exchanges,[20]
many of which have grown in size and importance in the last few years, even if they struggled throughthe panic of 2008.
Stop and Think Box
To purchase the Louisiana Territory from Napoleon in 1803, the U.S. government sold long-term, dollar-de-nominated bonds in Europe. What portion of the financial system did those bonds inhabit? Be as specific aspossible.
Those government bonds were Eurobonds because the U.S. government issued them overseas but denomin-ated them in U.S. dollars.
16 MONEY AND BANKING
assets
Assets are “things owned” asopposed to liabilities, whichare “things owed.”
risk
The probability of loss.
return
The percentage gain or lossfrom an investment.
liabilities
Liabilities are “things owed”to others, as opposed toassets, which are “thingsowned.”
deregulation
Generally, deregulation refersto any industry whereregulations are eliminated orsignificantly reduced. In thiscontext, deregulation refersto a series of regulatoryreforms of the financialindustry undertaken in the1980s and 1990s.
premium
In this context, a sum paid foran insurance contract.
nonnegotiable
Nontransferable to thirdparties.
redeemable
In this context, changeableinto cash money by the fund.
K E Y T A K E A W A Y S
< Financial markets can be categorized or grouped by issuance (primary vs. secondary markets), type ofinstrument (stock, bond, derivative), or market organization (exchange or OTC).
< Financial instruments can be grouped by time to maturity (money vs. capital) or type of obligation (stock,bond, derivative).
5. FINANCIAL INTERMEDIARIES
L E A R N I N G O B J E C T I V E
1. In what ways can financial intermediaries be classified?
Like financial markets, financial intermediaries are highly specialized. Sometimes called the indirectmethod of finance, intermediaries, like markets, link investors/lenders/savers to borrowers/entrepreneurs/spenders but do so in an ingenious way, by transforming assets. Unlike facilitators, which, as we haveseen, merely broker or buy and sell the same securities, intermediaries buy and sell instruments withdifferent risk, return, and/or liquidity characteristics. The easiest example to understand is that of abank that sells relatively low risk (which is to say, safe), low return, and highly liquid liabilities, calleddemand deposits, to investors called depositors and buys the relatively risky, high return, and nonli-quid securities of borrowers in the form of loans, mortgages, and/or bonds. Note, too, that in-vestor–depositors own claims on the bank itself rather than on the bank’s borrowers.
Financial intermediaries are sometimes categorized according to the type of asset transformationsthey undertake. As noted above, depository institutions, including commercial banks, savings banks,and credit unions, issue short-term deposits and buy long-term securities. Traditionally, commercialbanks specialized in issuing demand, transaction, or checking deposits and making loans to businesses.Savings banks issued time or savings deposits and made mortgage loans to households and businesses,while credit unions issued time deposits and made consumer loans. (Finance companies also specializein consumer loans but are not considered depository institutions because they raise funds by sellingcommercial paper, bonds, and equities rather than by issuing deposits.)
Due to deregulation, though, the lines between different types of depository institutions haveblurred in recent years. Ownership structure, charter terms, and regulatory agencies now represent theeasiest way to distinguish between different types of depository institutions. Almost all commercial andmany savings banks are joint-stock corporations. In other words, stockholders own them. Some sav-ings banks and all credit unions are mutual corporations and hence are owned by those who have madedeposits with them.
Insurance companies are also divided between mutual and joint-stock corporations. They issue con-tracts or policies that mature or come due should some contingency occur, which is a mechanism forspreading and sharing risks. Term life insurance policies pay off if the insured dies within the contractperiod, while life annuities pay off if the insured is still alive. Health insurance pays when an insuredneeds medical assistance. Property or casualty insurance, such as fire or automobile insurance, comesdue in the event of a loss, like a fire or an accident. Liability insurance pays off when someone is suedfor a tort (damages). Insurers invest policyholder premiums in stocks, corporate and governmentbonds, and various money market instruments, depending on the nature of the contingencies they in-sure against. Life insurance companies, for example, invest in longer-term assets than automobile orhealth insurers because, on average, life insurance claims occur much later than property or healthclaims. (In the parlance of insurance industry insiders, life insurance has a much longer “tail” thanproperty insurance.)
The third major type of intermediary is the investment company, a category that includes pensionand government retirement funds, which transform corporate bonds and stocks into annuities, and mu-tual funds and money market mutual funds, which transform diverse portfolios of capital and moneymarket instruments, respectively, into nonnegotiable but easily redeemable “shares.”
CHAPTER 2 THE FINANCIAL SYSTEM 17
GDP
GDP, or gross domesticproduct, is one of severaldifferent measures ofaggregate output, the totalvalue of all final goods andservices produced in aneconomy.
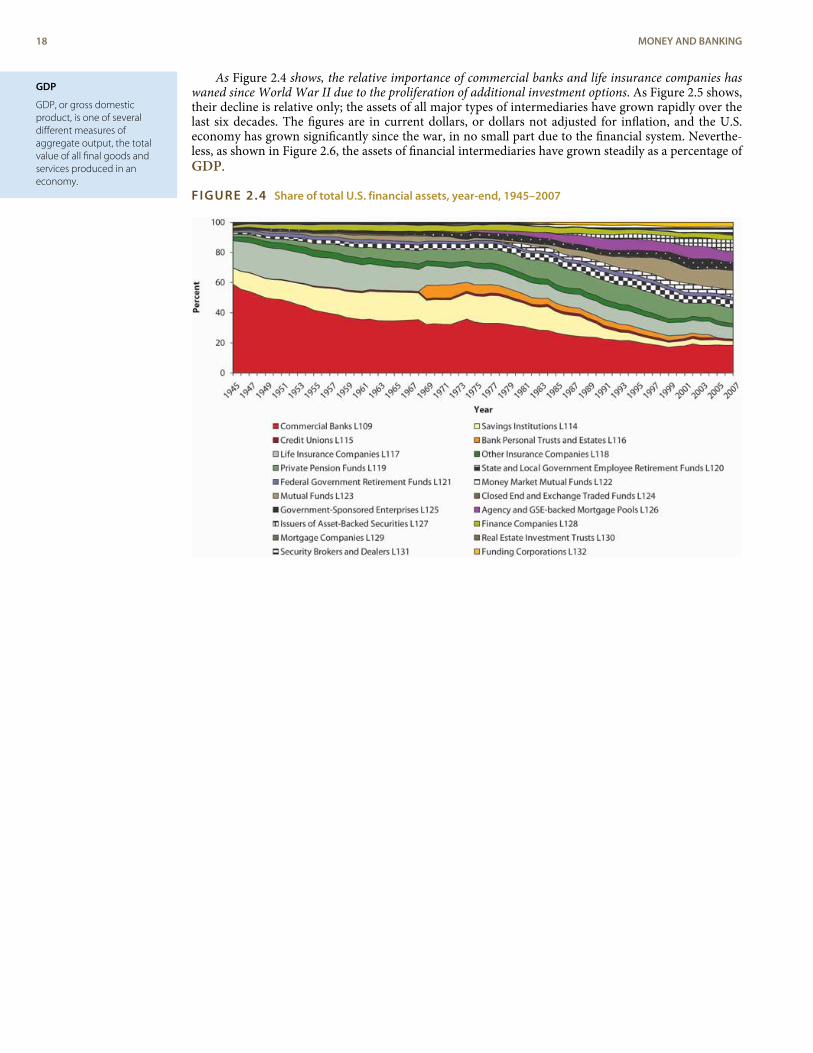
As Figure 2.4 shows, the relative importance of commercial banks and life insurance companies haswaned since World War II due to the proliferation of additional investment options. As Figure 2.5 shows,their decline is relative only; the assets of all major types of intermediaries have grown rapidly over thelast six decades. The figures are in current dollars, or dollars not adjusted for inflation, and the U.S.economy has grown significantly since the war, in no small part due to the financial system. Neverthe-less, as shown in Figure 2.6, the assets of financial intermediaries have grown steadily as a percentage ofGDP.
FIGURE 2.4 Share of total U.S. financial assets, year-end, 1945–2007
18 MONEY AND BANKING
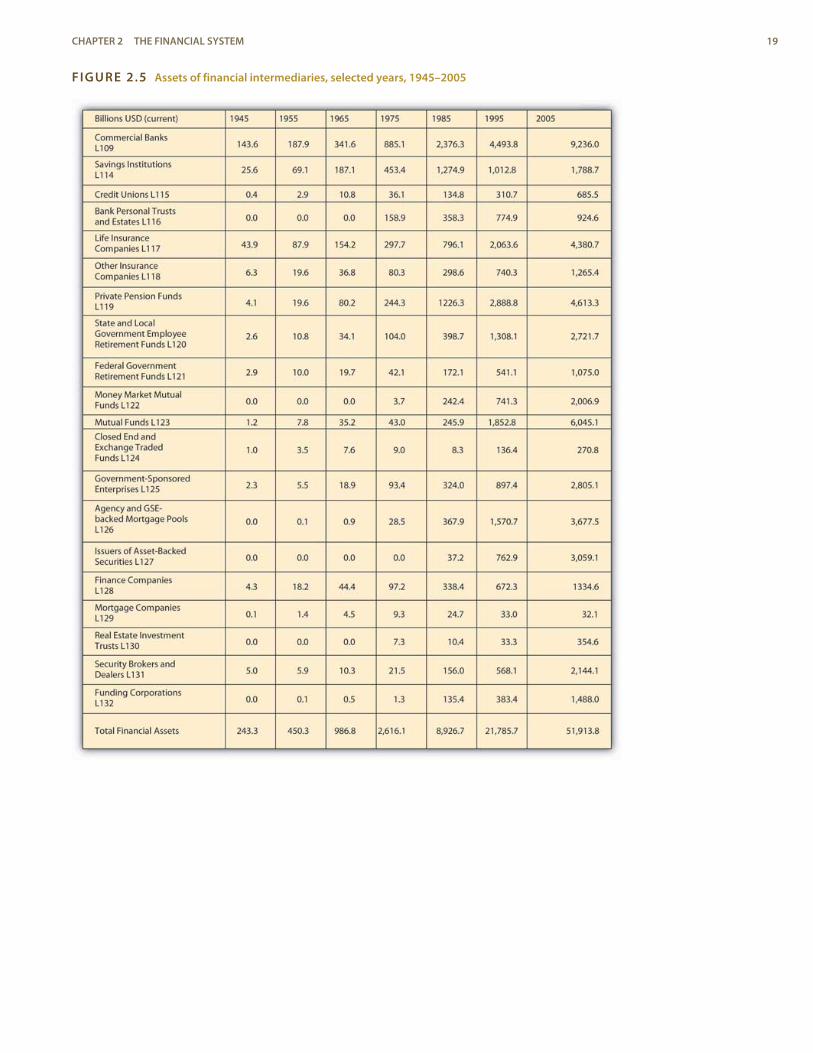
FIGURE 2.5 Assets of financial intermediaries, selected years, 1945–2005
CHAPTER 2 THE FINANCIAL SYSTEM 19
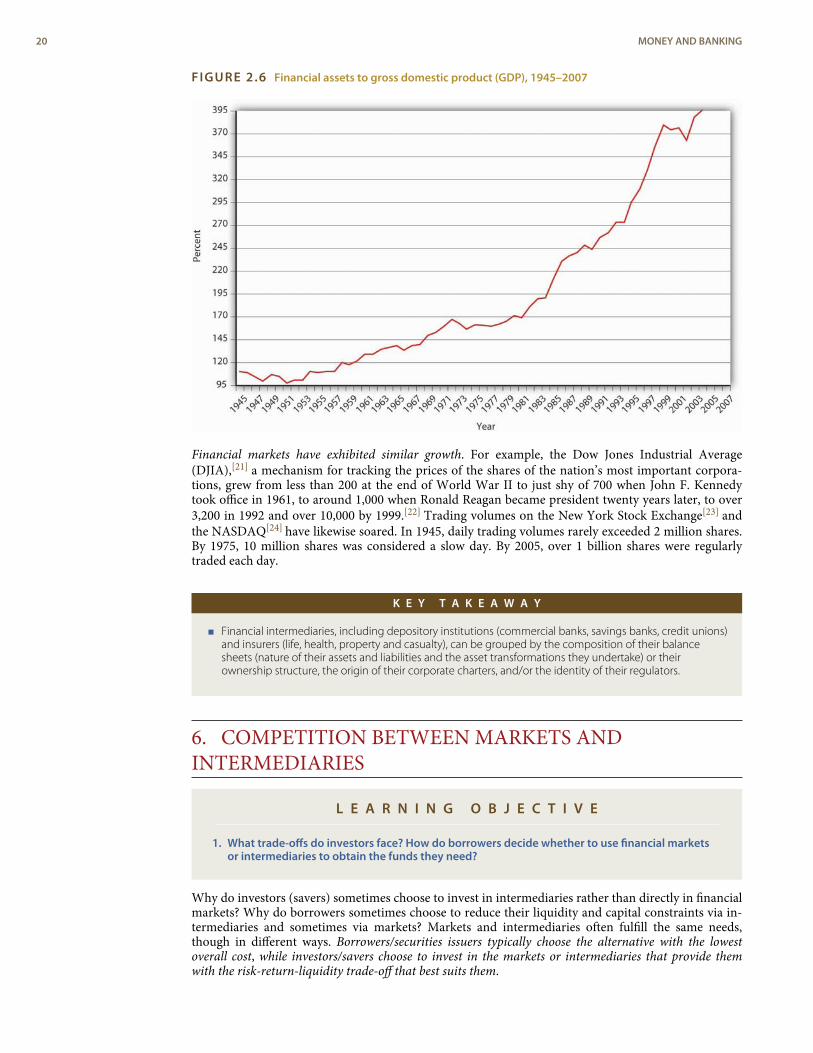
FIGURE 2.6 Financial assets to gross domestic product (GDP), 1945–2007
Financial markets have exhibited similar growth. For example, the Dow Jones Industrial Average(DJIA),[21] a mechanism for tracking the prices of the shares of the nation’s most important corpora-tions, grew from less than 200 at the end of World War II to just shy of 700 when John F. Kennedytook office in 1961, to around 1,000 when Ronald Reagan became president twenty years later, to over3,200 in 1992 and over 10,000 by 1999.[22] Trading volumes on the New York Stock Exchange[23] andthe NASDAQ[24] have likewise soared. In 1945, daily trading volumes rarely exceeded 2 million shares.By 1975, 10 million shares was considered a slow day. By 2005, over 1 billion shares were regularlytraded each day.
K E Y T A K E A W A Y
< Financial intermediaries, including depository institutions (commercial banks, savings banks, credit unions)and insurers (life, health, property and casualty), can be grouped by the composition of their balancesheets (nature of their assets and liabilities and the asset transformations they undertake) or theirownership structure, the origin of their corporate charters, and/or the identity of their regulators.
6. COMPETITION BETWEEN MARKETS ANDINTERMEDIARIES
L E A R N I N G O B J E C T I V E
1. What trade-offs do investors face? How do borrowers decide whether to use financial marketsor intermediaries to obtain the funds they need?
Why do investors (savers) sometimes choose to invest in intermediaries rather than directly in financialmarkets? Why do borrowers sometimes choose to reduce their liquidity and capital constraints via in-termediaries and sometimes via markets? Markets and intermediaries often fulfill the same needs,though in different ways. Borrowers/securities issuers typically choose the alternative with the lowestoverall cost, while investors/savers choose to invest in the markets or intermediaries that provide themwith the risk-return-liquidity trade-off that best suits them.
20 MONEY AND BANKING
ceteris paribus
All else equal.
default
Non- or partial payment of aloan, bond, or other paymentobligation.
Risk is a bad thing, while return and liquidity are good things. Therefore, every saver wants to investin riskless, easily saleable investments that generate high returns. Of course, such opportunities occurinfrequently because investors bid up their prices, thus reducing their returns. (As we’ll see in Chapter4, the higher the price of an investment, the lower its return, ceteris paribus.) To keep returns high,some investors will be willing to give up some liquidity or to take on more risk. For example, theymight buy securities not backed by collateral (assets like buildings, businesses, or safe financial instru-ments like T-bills that the borrower promises to forfeit in case of default). As a result of the competi-tion between investors, and between borrowers, the financial system offers instruments with a widevariety of characteristics, ranging from highly liquid, very safe, but low-return T-bills and demand de-posits, to medium-risk, medium-liquidity, medium-return mortgages, to risky but potentially lucrativeand easily sold derivatives like put options and foreign exchange futures contracts.
Investors care about more than risk, return, and liquidity, but generally other considerations are sec-ondary. For example, investors will pay more for investments with fixed redemption dates rather thanones that can be called (repaid) at the borrower’s option because fixed redemption dates reduce in-vestors’ uncertainty. They will also sometimes pay a little more for instruments issued by environment-ally or socially conscious companies and countries and less for those issued by dirty, rude ones.
Stop and Think Box
In the fall of 2006, interest rates on conventional thirty-year home mortgages without a prepayment penaltywere about 6.5 percent per year. But mortgages with otherwise identical terms that contained a prepaymentpenalty for the first seven years of the loan could be had for 6.25 percent per year. Why was that the case?
In addition to risk, return, and liquidity, investors are concerned about the uncertainty of repayment terms.They are willing to receive a lower return (ceteris paribus, of course) in exchange for a guarantee that a loanwill not be repaid for a significant period of time.
As noted above, borrowers also compete with each other for the lowest cost methods of meeting theirexternal financing needs. Obviously, borrowers want to pay as little for funds as possible and would likenothing better than to borrow huge sums forever, unconditionally, and at zero interest. Nobody wantsto lend on those terms, though, so borrowers compete with each other for funds by offering investorshigher returns, less risk, or more liquid instruments. They use whichever part of the financial system,markets or intermediaries, offers them the best deal. A company may sell commercial paper in themoney market rather than obtain a bank loan, for example, if it is large enough and well-knownenough to interest enough investors and market facilitators. A smaller, newer company, though, mayfind that a bank loan is much easier and cheaper to obtain.
K E Y T A K E A W A Y S
< Investors primarily trade off among risk, return, and liquidity, and to a lesser extent they also value thecertainty of redemption terms.
< Borrowers want to obtain funds as cheaply as possible and on repayment terms as flexible as possible.
7. REGULATION
L E A R N I N G O B J E C T I V E
1. What are the major goals of financial regulation?
Like investors, borrowers are concerned about the total net costs (all costs plus all benefits) of differenttypes of finance. One big consideration is government and self-regulation. Compared to most other partsof modern capitalist economies, the financial system is relatively heavily regulated. Regulators like the Se-curities and Exchange Commission (SEC, which oversees exchanges and OTC markets), the New YorkStock Exchange (NYSE, which oversees itself), and the Commodities Futures Trading Commission(CFTC, which oversees futures market exchanges) monitor and regulate financial markets. Other regu-lators, including the Office of the Comptroller of the Currency (which oversees federally charteredcommercial banks), the Federal Deposit Insurance Corporation (FDIC, which oversees almost all de-positories), and sundry state banking and insurance commissions, monitor financial intermediaries.
CHAPTER 2 THE FINANCIAL SYSTEM 21
transparency
In general, the opposite ofopacity. In this context,transparency means arelatively low degree ofasymmetric information.
lender of last resort
During a financial crisis orpanic, a lender of last resortmakes loans when no oneelse will.
deposit insurance
Insurance that pays off if abank defaults on its depositliabilities.
too big to fail (TBTF) policy
The notion that somefinancial institutions cannotbe allowed to go bankruptbecause they owe so muchmoney to so many peopleand companies that theirfailure to continue makingpayments would havecatastrophic negativeconsequences for theeconomy.
Great Inflation
Peacetime inflation rates inthe United States in the1970s were higher than anytime before or since.
Companies that wish to avoid direct regulatory scrutiny due to its high cost tend to use intermediariesrather than markets. For example, instead of selling shares to the public, which would require followingthe many rules of the SEC and the NYSE (or other exchange or OTC market), a company might decidethat it would be cheaper to obtain a long-term bank loan or sell bonds to life insurers, mutual funds,and other institutional investors in a direct placement.
Regulators serve four major functions. First, they try to reduce asymmetric information by encour-aging transparency. That usually means requiring both financial markets and intermediaries to dis-close accurate information to investors in a clear and timely manner. A second and closely related goalis to protect consumers from scammers, shysters, and assorted other grifters. Third, they strive to pro-mote financial system competition and efficiency by ensuring that the entry and exit of firms is as easyand cheap as possible, consistent with their first two goals. For example, new banks can form but onlyafter their incorporators (founders) and initial executives have been carefully screened. Insurance com-panies can go out of business (exit) but only after they have made adequate provision to fulfill theirpromises to policyholders.
Finally, regulators also try to ensure the soundness of the financial system by acting as a lender oflast resort, mandating deposit insurance, and limiting competition through restrictions on entry andinterest rates. The first two forms of regulation are generally not controversial, although many believethat the lender of last resort function should not be combined with a too big to fail (TBTF) policy.Limiting competition is a highly controversial means of ensuring safety because it extends privileges toexisting institutions over new ones. Little surprise, then, that the regulated companies themselves areoften the strongest supporters of that type of regulation!
Stop and Think Box
For decades, the Federal Reserve capped the interest rates that banks could pay on checking deposits at zeroand the interest rates that they could pay on time or savings deposits at around 6 percent per year. What wasthe intended economic effect of those restrictions? Why didn’t existing banks lobby for their repeal until theGreat Inflation of the 1970s?
The restrictions were put in place to limit competition among banks, allowing them to be profitable withoutassuming too much risk. Existing banks were more than happy to reap relatively riskless profits until inflationexceeded the interest rates that they could legally pay. At that point, disintermediation was rampant. In otherwords, many people pulled their money out of banks and put them directly into the market, via money marketand stock and bond mutual funds.
K E Y T A K E A W A Y S
< Regulators attempt to maximize macroeconomic stability and transparency and to minimize investor riskand loss.
< The policies they implement to do so, however, can be controversial and are not always effective.
22 MONEY AND BANKING
8. SUGGESTED READINGAnonymous, Finance for Managers. Cambridge: Harvard Business School Press, 2002.Barth, James, Gerard Caprio, and Ross Levine. Rethinking Bank Regulation: Till Angels Govern.
New York: Cambridge University Press, 2008.Bebczuk, Ricardo. Asymmetric Information in Financial Markets: Introduction and Applications.
New York: Cambridge University Press, 2003.Fabozzi, Frank. The Handbook of Financial Instruments. Hoboken, NJ: John Wiley and Sons, 2002.Ferguson, Niall. The Ascent of Money: A Financial History of the World. New York: Penguin Press,
2008.Landier, Augustin, and Vinay Nair. Investing for Change: Profit from Responsible Investment. New
York: Oxford University Press, 2008.Tyson, Eric. Personal Finance for Dummies, 5th ed. Hoboken, NJ: John Wiley and Sons, 2006.
CHAPTER 2 THE FINANCIAL SYSTEM 23
1.2.3.4.5.6.7.8.9.
10.11.12.
13.
14.15.16.17.
18.
19.20.21.22.23.24.
ENDNOTES
www.amazon.com/Bonfire-Vanities-Tom-Wolfe/dp/0553275976
www.imdb.com/title/tt0099165/
www.bibliomania.com/0/6/3/1050/frameset.html
www.imdb.com/name/nm0000362/
www.imdb.com/name/nm0000060/
www.imdb.com/title/tt0102609/
www.nndb.com/films/309/000033210/
video.google.com/videoplay?docid=4820768732160163488&pr=goog-sl
en.wikipedia.org/wiki/The_Smartest_Guys_in_the_Room
www.innovation-america.org/archive.php?articleID=79
danteworlds.laits.utexas.edu/utopia/circle9.html
www.urbandictionary.com/define.php?term=natty+light
www.pickeringchatto.com/index.php/pc_site/monographs/gambling_on_the_american_dream
“Stock Exchanges: The Battle of the Bourses,” The Economist (31 May 2008), 77–79.
quote.yahoo.com/m1?u
www.cme.com/trading/prd/weather/index.html
“American Finance: And Then There Were None. What the death of the investmentbank means for Wall Street,” The Economist (27 September 2008), 85–86.
videoplayer.thestreet.com/?clipId=1373_10370203&channel=Market+Strategy&cm_ven=&cm_cat=&cm_ite=&puc=&ts=1185544781203&bt=NS&bp=WIN&bst=NS&biec=false&format=flash&bitrate=300
economics.about.com/od/foreigntrade/a/bretton_woods.htm
www.foreign-trade.com/resources/financel.htm
www.djindexes.com/mdsidx/index.cfm?event=showAverages
www.measuringworth.org/DJA/
www.nyse.com/
www.nasdaq.com/
24 MONEY AND BANKING
consumer surplus
In a standard supply anddemand graph, that areaabove the price line andbelow the demand curve.
C H A P T E R 3Money
C H A P T E R O B J E C T I V E S
By the end of this chapter, students should be able to:
1. Define money.
2. Describe the work or economic functions that money performs.
3. Define barter and explain why it is economically inefficient.
4. Explain why some forms of commodity money are better than others.
5. Explain why representative money and credit money supplanted commodity money.
6. Define the money supply and explain how and why it is measured.
1. OF LOVE, MONEY, AND TRANSACTIONALEFFICIENCY
L E A R N I N G O B J E C T I V E
1. What is money and what economic functions does it perform?
Like love, money is ubiquitous, yet few of us feel that we have enough of either. As abstract concepts,money and love are both slippery, yet most of us believe that we know them when we see them. Despitethose similarities, mixing money and love can be dangerous. The love of money is said to be one of theseven deadly sins; the money of love, despite its hoariness, is illegal in many jurisdictions in the UnitedStates and abroad.
Jest and wordplay aside, money is, perhaps, the most important invention of all time. Like the othermajor contenders for the title, indoor plumbing, internal combustion engines, computers, and othermodern gadgets of too recent origin to consider; the wheel, which needs no introduction; the hearth, apit for controlling fire; and the atlatl, a spear thrower similar in concept to a lacrosse stick, money is aforce multiplier. In other words, it allows its users to complete much more work in a given amount oftime than nonusers can possibly do, just as the wheel let porters move more stuff, the hearth helpedcooks prepare more food, and the atlatl allowed hunters (warriors) to kill more prey (enemies).
What work does money do? It facilitates trade by making it easier to buy and sell goods compared tobarter, the exchange of one nonmoney good for another. (If you’ve ever traded baseball cards, clothes,beers, phone numbers, homework assignments, or any other nonmoney goods, you’ve engaged inbarter.) This is no minor matter because trade is the one thing that makes us human. As that greateighteenth-century Scottish economist Adam Smith (and others) pointed out, no other animal tradeswith nonrelatives of the same species. The inherent predisposition to trade may explain why humanshave relatively large brains and relatively small digestive tracts. Trade certainly explains why humanshave more material comforts by far than any other species on the planet. Each trade that is fairly con-summated enriches both the buyer and the seller. The good feeling people get when they buy (sell) agood is what economists call consumer surplus (producer surplus). By making trading relativelyeasy, money helps to make humanity happier. (Note that this is not the same as claiming that wealthmakes people happy. Although sometimes used synonymously with wealth in everyday speech, moneyis actually a special form of wealth.)
Imagine what life would be like without money. Suppose you try to fill up your automobile’s gasol-ine tank, or take mass transit to school, or acquire any good, without using money (or credit, money’sclose cousin). How would you do it? You would have to find something that the seller desired. Thatcould take a long time and quite possibly forever. If you don’t believe me, go to any Craigslist post-ing,[1] where you will find listings like the one below. It’s a fun diversion, but what would this person
think is a “fair” trade? A lava lamp and a Grateful Dead poster? Would she give you a ball of yarn inchange?
Date: 2006-11-30, 2:37 PM EST
Hello Craigslisters,
I recently moved to NYC and I have no use for the six items pictured below. Starting from theupper left going clockwise, I have: a working desk lamp, a hardcover copy of the NY Times best-selling book The Historian, an unused leather-bound photo album, a giant bouncy-ball that lightsup when it bounces, a pair of goofy sunglasses, and a hand-made tribal mask from Mexico.
Make me any offer for any or all of the items, and if it’s fair, we’ll trade.
Answer: Only if you have a lot of time to waste.In the lingo of economists, by serving as a means or medium of exchange, money eliminates one of
the major difficulties of barter, fulfilling this mutual or double coincidence of wants. And it does it quitewell as it zips across the country and the entire globe.
Another serious difficulty with barter helps us to see the second major type of work that moneydoes. Suppose that the gas station attendant or bus driver wanted chewing gum and you had some. Ex-change may still not take place because a crucial question remains unanswered: how many sticks ofgum is a gallon of gas or a bus trip worth? Ascertaining the answer turns out to be an insurmountablebarrier in most instances. In a money economy, the number of prices equals the number of traded goodsbecause each has a money price, the good’s cost in terms of the unit of account. In a barter economy, bycontrast, the number of prices equals the number of pairs of goods. So, for example, an economy withjust 1,000 goods (a very poor economy indeed) would require 499,500 different prices! Little wonder,then, that barter economies, when they exist, usually produce only ten or so tradable goods, whichmeans about forty-five different prices, each good paired with nine others. By serving as a unit of ac-count, a measuring rod of economic value, money makes price determination much easier.
The unit of account function of money is more abstract than its work as a medium of exchangeand hence is less well understood, but that does not mean that it is less important. To be an effectiveforce multiplier, money has to eliminate both of barter’s biggest deficiencies. In other words, it has to endthe double coincidence of wants problem and reduce the number of prices, ideally to one per good. Itdoes the former by acting as a medium of exchange, something that people acquire not for its own sakebut to trade away to another person for something of use. The latter it does by serving as a unit of ac-count, as a way of reckoning value. When functioning as a unit of account, money helps us to answerthe question, How much is that worth? much like inches help us to answer, How long is that? or de-grees Fahrenheit or Celsius help us to ascertain, What is the temperature of that? By helping us to reck-on value, money allows us to easily and quickly compare the economic value of unlike things, to com-pare apples and oranges, both literally and figuratively.
Stop and Think Box
After the demise of the Soviet Union, inflation reigned supreme as the Russian ruble lost more and more of itsvalue each day. Rubles remained a medium of exchange, but in many places in Russia, prices and debts beganto be denominated in “bucks.” What were bucks and why did they arise?
Bucks were essentially U.S. dollars, and they were used as a unit of account and standard of deferred payment,as a way of reckoning value in a stable unit. Physical U.S. dollar-denominated assets, like Federal Reserve notes,were a medium of exchange, but also, in this context, they were a good store of value because they could pur-chase more rubles each passing day.
Money also works as a store of value and as a standard of deferred compensation. By store of value,economists mean that money can store purchasing power over time. Of course, many other as-sets—real estate, financial securities, precious metals and gems—perform precisely the same function.Storing value, therefore, is not exclusively a trait of money. By standard of deferred compensation, eco-nomists mean that money can be used to denominate a debt, an obligation to make a payment in thefuture.
To help you to see the different functions of money, consider the following transaction:Customer: How much for a gallon of gasoline? (A)Attendant: $2.99 (A)Customer: Great, fill ’er up. (A)Attendant: Will that be cash (E), check (E), debit (E), or credit (D)?
26 MONEY AND BANKING
Federal Reserve notes
Fiat paper money issued byAmerica’s central bank, theFederal Reserve.
In the places labeled (A), money is working as a unit of account. The customer is trying to reckonthe value of the gasoline, information that the attendant quickly encapsulates by quoting a moneyprice. The customer just as quickly decides that she would rather have the gasoline than the money, ormore precisely the other goods that the money could acquire, and requests the trade. The attendant re-sponds by inquiring which medium of exchange (E) the customer wishes to use to pay for the good.Cash refers to physical currency, like Federal Reserve notes or Treasury coins. Check refers to a pa-per order for the transfer of money from a bank account. Debit refers to an electronic order for a trans-fer from a bank account or a prepaid declining balance debit card. Credit entails the prearranged trans-fer of funds from the customer’s creditor, a bank or other lender, in exchange for a small service feefrom the gas station[2] and the customer’s promise to repay the lender (and perhaps interest and ayearly fee). In the case of the credit transaction, money is working as a standard of deferred payment(D) because the customer promises to repay the lender the value of the gas at some point in the future.(We will speak of credit money below, but students should not allow the lingo to confuse them. Creditcards and other loans are not money per se but rather are ways of obtaining it. The distinction will be-come clearer as your course of study during the semester unfolds.)
Of course, conversations like the one above rarely occur today. Except in New Jersey and a fewother places, people pump their own gas; stations post their prices on big signs for all to see; and in ad-dition to dispensing the product, gas pumps handle credit and debit (and sometimes cash) purchaseswith ease. Money makes all that possible, saving humanity untold hours of waste over the trillions of ex-changes completed each year.
K E Y T A K E A W A Y S
< Barter entails the exchange of one good for another. It is inefficient because it requires satisfaction of thedouble coincidence of wants (party one must have what party two desires, and vice versa) and pricingproblems (the number of prices of goods equals the number of possible pairs).
< Perhaps the most important invention of all time, money is anything that reduces the transaction costs ofbarter, anything that is commonly accepted as payment or in exchange.
< Money serves as a medium of exchange (physical means of payment), unit of account (measure ofeconomic value), store of value (method of storing said value over time), and standard of deferredpayment (basis upon which debts are repaid).
2. BETTER TO HAVE HAD MONEY AND LOST IT THANTO HAVE NEVER HAD MONEY AT ALL
L E A R N I N G O B J E C T I V E
1. What usually happens when money is absent in an economy?
To further appreciate money’s importance, consider what happens when it is absent—universal dis-tress, followed quickly by money’s reintroduction or reinvention! After World War I, for example, theGerman government created too much money too quickly. Hyperinflation, a very rapid rise in theprices of all goods, ensued. Prices increased so fast that workers insisted on being paid twice daily sothey could run, not walk, to the nearest store to buy food before their hard-earned wages becameworthless. Before the hyperinflation, it was said that you could buy a wheelbarrow full of food with apurse full of cash. During the hyperinflation, you needed a wheelbarrow full of cash to purchase a pursefull of food. At the end of the debacle, you kept the wheelbarrow at home lest your most valuable asset,the wheelbarrow, be stolen! At the end of the crisis, the German economy was on a barter basis, butonly briefly before currency reforms stopped the inflation and restored a money economy.
CHAPTER 3 MONEY 27
commodity money
Forms of money that haveintrinsic value as acommodity.
Stop and Think Box
During its most recent financial crisis, in 2001–2002, Argentina faced a severe shortage of its money, calledpesos. Private firms responded by setting up giant flea markets where goods were priced and paid for usingthe firm’s notes, which in most instances were called creditós. The creditós could be used in subsequent fleamarkets run by the issuing firm but not in markets run by other firms. Creditós had very limited circulation out-side the flea markets. As soon as the peso crisis passed, the firms stopped running flea markets and no longerhonored the creditós they had issued. What happened in Argentina?
A new form of private credit money spontaneously arose to fill the vacuum created by the dearth of pesos. Al-though not as liquid or safe as pesos, creditós were far superior to barter. The end-game default can be inter-preted as seigniorage, the profit the issuers of creditós exacted for providing money to local Argentinecommunities.
In prisons, prisoner-of-war camps, and other settings where money is unavailable, inmates quicklylearn the inadequacies of barter firsthand and adopt the best available commodity as money—a mediumof exchange; unit of account; a store of value; and even, to the limited extent that credit is available insuch circumstances, a standard of deferred payment. Packs of cigarettes often emerge as the commod-ity money of choice. (Talk about one’s fortune going up in smoke!) There are good economic reasonsfor this preference. Although not perfect, cigarettes are a serviceable medium of exchange. First andforemost, sealed packs of cigarettes are easily authenticated because it would be extremely difficult tocounterfeit or adulterate them, especially under prison conditions. Although they differ somewhatfrom brand to brand, they are also relatively uniform in quality. If you gave up a bar of soap for twopacks, you could rest relatively well assured that you were not being cheated. Second, cigarette packsare divisible, into twenty individual cigarettes, or “loosies,” without giving up much of their ease of au-thentication. (A loosie is easier to adulterate than a sealed pack, say, by replacing the tobacco with saw-dust, but is still not easy.) Divisibility is important because supply and demand might well dictate anequilibrium price that includes a fraction of a pack, just as it often leads to prices that are a fraction of adollar ($), yen (¥), euro (€), or pound (£). Individual cigarettes are also somewhat divisible but onlywhen filterless or when consumed. One might, for instance, sell a good blanket for four packs, twoloosies, and five drags or puffs.
Cigarettes also have relatively high value-to-weight and value-to-bulk ratios. In other words, theyare relatively valuable given their size and weight. That portability is, of course, important to theirfunction as a medium of exchange. Although they eventually go stale and can be ruined if smashed ordrenched in water, sealed cigarettes packs are durable enough to also serve as an intermediate termstore of value. The elasticity of the supply of cigarette packs is volatile, however, because smokers find itdifficult to quit smoking, no matter the price and the fact that the quantity of packs in circulation de-pends on shipments from the outside world. In modern prisons, this is less of a problem, but inprisoner-of-war (POW) camps, sudden gluts caused the prices of goods (noncigarettes) to soar (that is,the value of cigarettes plummeted), only to be followed by long periods of deflation (lower prices fornoncigarettes) as the supply of cigarettes dried up and each cigarette gained in purchasing power.
K E Y T A K E A W A Y S
< Where money is absent, an available commodity with the best combination of ease of authentication,uniformity, divisibility, durability, portability, and elasticity of supply may emerge as money.
< In other instances, as in Argentina, private credit money may emerge.
28 MONEY AND BANKING
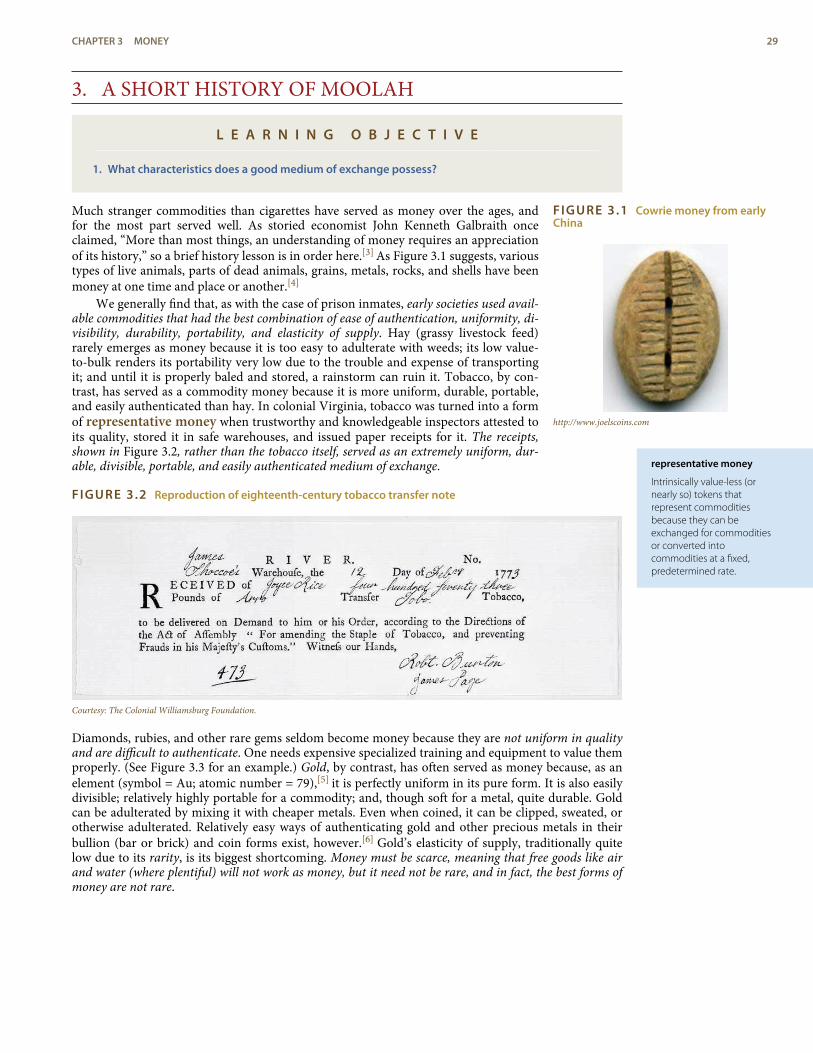
FIGURE 3.1 Cowrie money from earlyChina
http://www.joelscoins.com
representative money
Intrinsically value-less (ornearly so) tokens thatrepresent commoditiesbecause they can beexchanged for commoditiesor converted intocommodities at a fixed,predetermined rate.
3. A SHORT HISTORY OF MOOLAH
L E A R N I N G O B J E C T I V E
1. What characteristics does a good medium of exchange possess?
Much stranger commodities than cigarettes have served as money over the ages, andfor the most part served well. As storied economist John Kenneth Galbraith onceclaimed, “More than most things, an understanding of money requires an appreciationof its history,” so a brief history lesson is in order here.[3] As Figure 3.1 suggests, varioustypes of live animals, parts of dead animals, grains, metals, rocks, and shells have beenmoney at one time and place or another.[4]
We generally find that, as with the case of prison inmates, early societies used avail-able commodities that had the best combination of ease of authentication, uniformity, di-visibility, durability, portability, and elasticity of supply. Hay (grassy livestock feed)rarely emerges as money because it is too easy to adulterate with weeds; its low value-to-bulk renders its portability very low due to the trouble and expense of transportingit; and until it is properly baled and stored, a rainstorm can ruin it. Tobacco, by con-trast, has served as a commodity money because it is more uniform, durable, portable,and easily authenticated than hay. In colonial Virginia, tobacco was turned into a formof representative money when trustworthy and knowledgeable inspectors attested toits quality, stored it in safe warehouses, and issued paper receipts for it. The receipts,shown in Figure 3.2, rather than the tobacco itself, served as an extremely uniform, dur-able, divisible, portable, and easily authenticated medium of exchange.
FIGURE 3.2 Reproduction of eighteenth-century tobacco transfer note
Courtesy: The Colonial Williamsburg Foundation.
Diamonds, rubies, and other rare gems seldom become money because they are not uniform in qualityand are difficult to authenticate. One needs expensive specialized training and equipment to value themproperly. (See Figure 3.3 for an example.) Gold, by contrast, has often served as money because, as anelement (symbol = Au; atomic number = 79),[5] it is perfectly uniform in its pure form. It is also easilydivisible; relatively highly portable for a commodity; and, though soft for a metal, quite durable. Goldcan be adulterated by mixing it with cheaper metals. Even when coined, it can be clipped, sweated, orotherwise adulterated. Relatively easy ways of authenticating gold and other precious metals in theirbullion (bar or brick) and coin forms exist, however.[6] Gold’s elasticity of supply, traditionally quitelow due to its rarity, is its biggest shortcoming. Money must be scarce, meaning that free goods like airand water (where plentiful) will not work as money, but it need not be rare, and in fact, the best forms ofmoney are not rare.
CHAPTER 3 MONEY 29
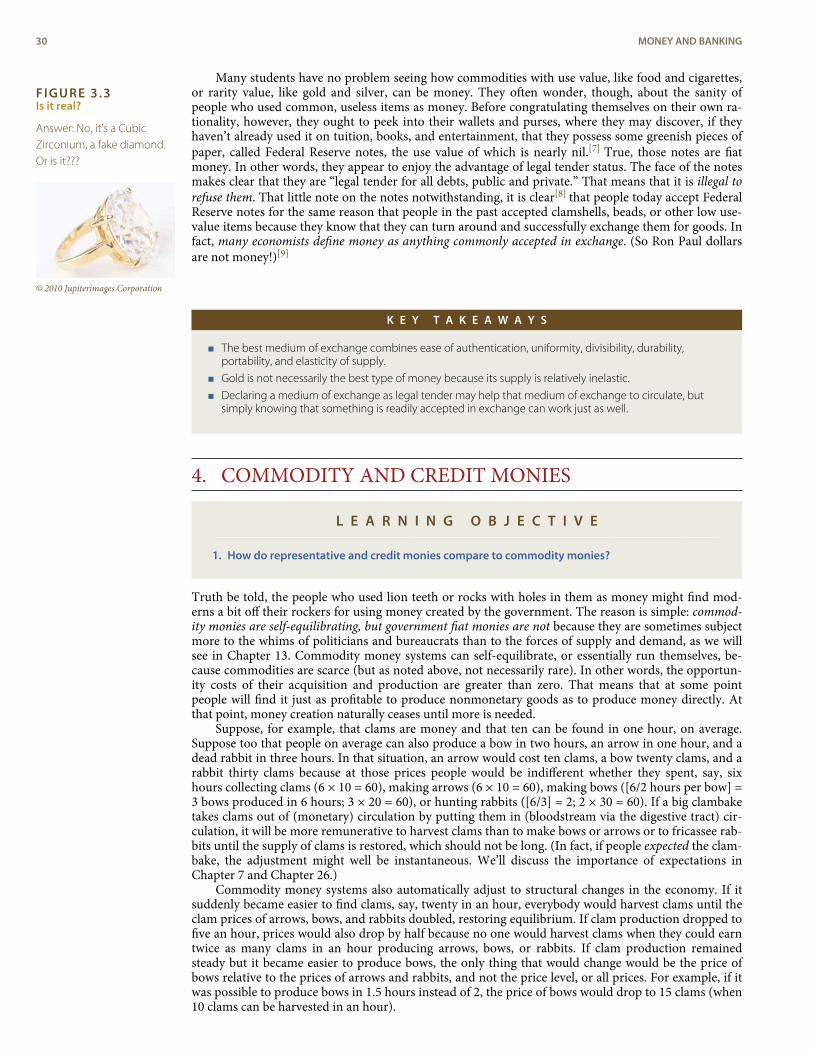
FIGURE 3.3Is it real?
Answer: No, it’s a CubicZirconium, a fake diamond.Or is it???
© 2010 Jupiterimages Corporation
Many students have no problem seeing how commodities with use value, like food and cigarettes,or rarity value, like gold and silver, can be money. They often wonder, though, about the sanity ofpeople who used common, useless items as money. Before congratulating themselves on their own ra-tionality, however, they ought to peek into their wallets and purses, where they may discover, if theyhaven’t already used it on tuition, books, and entertainment, that they possess some greenish pieces ofpaper, called Federal Reserve notes, the use value of which is nearly nil.[7] True, those notes are fiatmoney. In other words, they appear to enjoy the advantage of legal tender status. The face of the notesmakes clear that they are “legal tender for all debts, public and private.” That means that it is illegal torefuse them. That little note on the notes notwithstanding, it is clear[8] that people today accept FederalReserve notes for the same reason that people in the past accepted clamshells, beads, or other low use-value items because they know that they can turn around and successfully exchange them for goods. Infact, many economists define money as anything commonly accepted in exchange. (So Ron Paul dollarsare not money!)[9]
K E Y T A K E A W A Y S
< The best medium of exchange combines ease of authentication, uniformity, divisibility, durability,portability, and elasticity of supply.
< Gold is not necessarily the best type of money because its supply is relatively inelastic.
< Declaring a medium of exchange as legal tender may help that medium of exchange to circulate, butsimply knowing that something is readily accepted in exchange can work just as well.
4. COMMODITY AND CREDIT MONIES
L E A R N I N G O B J E C T I V E
1. How do representative and credit monies compare to commodity monies?
Truth be told, the people who used lion teeth or rocks with holes in them as money might find mod-erns a bit off their rockers for using money created by the government. The reason is simple: commod-ity monies are self-equilibrating, but government fiat monies are not because they are sometimes subjectmore to the whims of politicians and bureaucrats than to the forces of supply and demand, as we willsee in Chapter 13. Commodity money systems can self-equilibrate, or essentially run themselves, be-cause commodities are scarce (but as noted above, not necessarily rare). In other words, the opportun-ity costs of their acquisition and production are greater than zero. That means that at some pointpeople will find it just as profitable to produce nonmonetary goods as to produce money directly. Atthat point, money creation naturally ceases until more is needed.
Suppose, for example, that clams are money and that ten can be found in one hour, on average.Suppose too that people on average can also produce a bow in two hours, an arrow in one hour, and adead rabbit in three hours. In that situation, an arrow would cost ten clams, a bow twenty clams, and arabbit thirty clams because at those prices people would be indifferent whether they spent, say, sixhours collecting clams (6 × 10 = 60), making arrows (6 × 10 = 60), making bows ([6/2 hours per bow] =3 bows produced in 6 hours; 3 × 20 = 60), or hunting rabbits ([6/3] = 2; 2 × 30 = 60). If a big clambaketakes clams out of (monetary) circulation by putting them in (bloodstream via the digestive tract) cir-culation, it will be more remunerative to harvest clams than to make bows or arrows or to fricassee rab-bits until the supply of clams is restored, which should not be long. (In fact, if people expected the clam-bake, the adjustment might well be instantaneous. We’ll discuss the importance of expectations inChapter 7 and Chapter 26.)
Commodity money systems also automatically adjust to structural changes in the economy. If itsuddenly became easier to find clams, say, twenty in an hour, everybody would harvest clams until theclam prices of arrows, bows, and rabbits doubled, restoring equilibrium. If clam production dropped tofive an hour, prices would also drop by half because no one would harvest clams when they could earntwice as many clams in an hour producing arrows, bows, or rabbits. If clam production remainedsteady but it became easier to produce bows, the only thing that would change would be the price ofbows relative to the prices of arrows and rabbits, and not the price level, or all prices. For example, if itwas possible to produce bows in 1.5 hours instead of 2, the price of bows would drop to 15 clams (when10 clams can be harvested in an hour).
30 MONEY AND BANKING
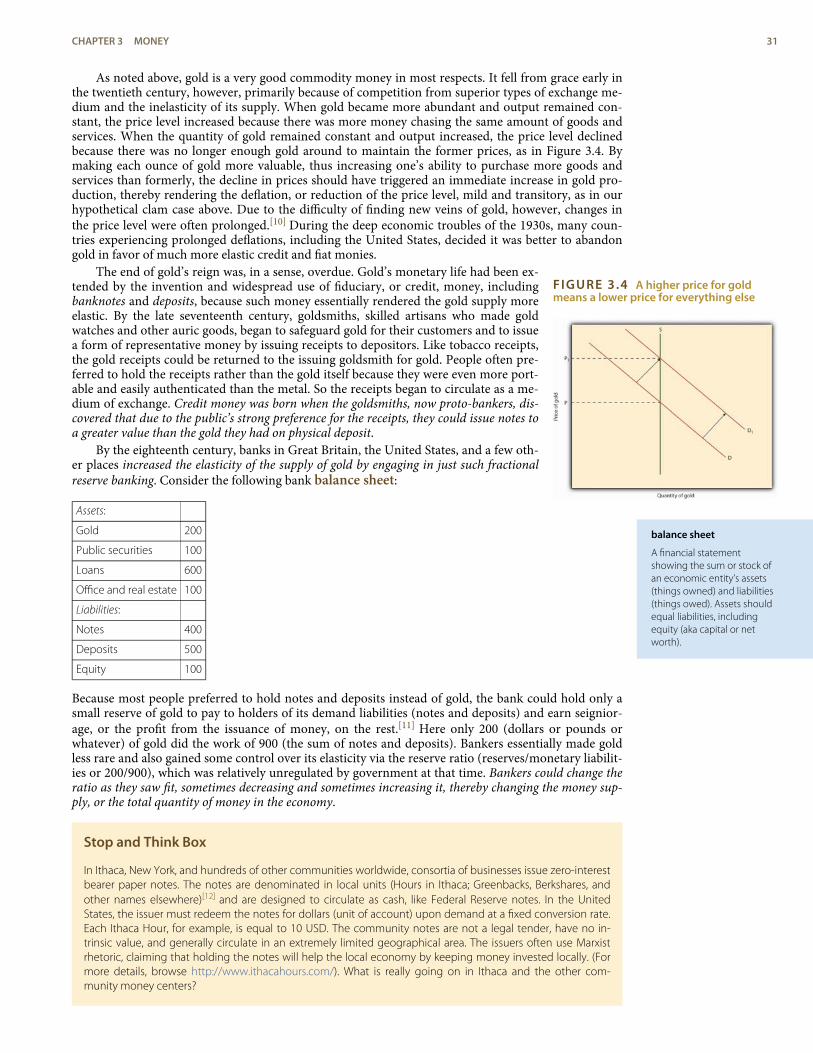
FIGURE 3.4 A higher price for goldmeans a lower price for everything else
balance sheet
A financial statementshowing the sum or stock ofan economic entity’s assets(things owned) and liabilities(things owed). Assets shouldequal liabilities, includingequity (aka capital or networth).
As noted above, gold is a very good commodity money in most respects. It fell from grace early inthe twentieth century, however, primarily because of competition from superior types of exchange me-dium and the inelasticity of its supply. When gold became more abundant and output remained con-stant, the price level increased because there was more money chasing the same amount of goods andservices. When the quantity of gold remained constant and output increased, the price level declinedbecause there was no longer enough gold around to maintain the former prices, as in Figure 3.4. Bymaking each ounce of gold more valuable, thus increasing one’s ability to purchase more goods andservices than formerly, the decline in prices should have triggered an immediate increase in gold pro-duction, thereby rendering the deflation, or reduction of the price level, mild and transitory, as in ourhypothetical clam case above. Due to the difficulty of finding new veins of gold, however, changes inthe price level were often prolonged.[10] During the deep economic troubles of the 1930s, many coun-tries experiencing prolonged deflations, including the United States, decided it was better to abandongold in favor of much more elastic credit and fiat monies.
The end of gold’s reign was, in a sense, overdue. Gold’s monetary life had been ex-tended by the invention and widespread use of fiduciary, or credit, money, includingbanknotes and deposits, because such money essentially rendered the gold supply moreelastic. By the late seventeenth century, goldsmiths, skilled artisans who made goldwatches and other auric goods, began to safeguard gold for their customers and to issuea form of representative money by issuing receipts to depositors. Like tobacco receipts,the gold receipts could be returned to the issuing goldsmith for gold. People often pre-ferred to hold the receipts rather than the gold itself because they were even more port-able and easily authenticated than the metal. So the receipts began to circulate as a me-dium of exchange. Credit money was born when the goldsmiths, now proto-bankers, dis-covered that due to the public’s strong preference for the receipts, they could issue notes toa greater value than the gold they had on physical deposit.
By the eighteenth century, banks in Great Britain, the United States, and a few oth-er places increased the elasticity of the supply of gold by engaging in just such fractionalreserve banking. Consider the following bank balance sheet:
Assets:
Gold 200
Public securities 100
Loans 600
Office and real estate 100
Liabilities:
Notes 400
Deposits 500
Equity 100
Because most people preferred to hold notes and deposits instead of gold, the bank could hold only asmall reserve of gold to pay to holders of its demand liabilities (notes and deposits) and earn seignior-age, or the profit from the issuance of money, on the rest.[11] Here only 200 (dollars or pounds orwhatever) of gold did the work of 900 (the sum of notes and deposits). Bankers essentially made goldless rare and also gained some control over its elasticity via the reserve ratio (reserves/monetary liabilit-ies or 200/900), which was relatively unregulated by government at that time. Bankers could change theratio as they saw fit, sometimes decreasing and sometimes increasing it, thereby changing the money sup-ply, or the total quantity of money in the economy.
Stop and Think Box
In Ithaca, New York, and hundreds of other communities worldwide, consortia of businesses issue zero-interestbearer paper notes. The notes are denominated in local units (Hours in Ithaca; Greenbacks, Berkshares, andother names elsewhere)[12] and are designed to circulate as cash, like Federal Reserve notes. In the UnitedStates, the issuer must redeem the notes for dollars (unit of account) upon demand at a fixed conversion rate.Each Ithaca Hour, for example, is equal to 10 USD. The community notes are not a legal tender, have no in-trinsic value, and generally circulate in an extremely limited geographical area. The issuers often use Marxistrhetoric, claiming that holding the notes will help the local economy by keeping money invested locally. (Formore details, browse http://www.ithacahours.com/). What is really going on in Ithaca and the other com-munity money centers?
CHAPTER 3 MONEY 31
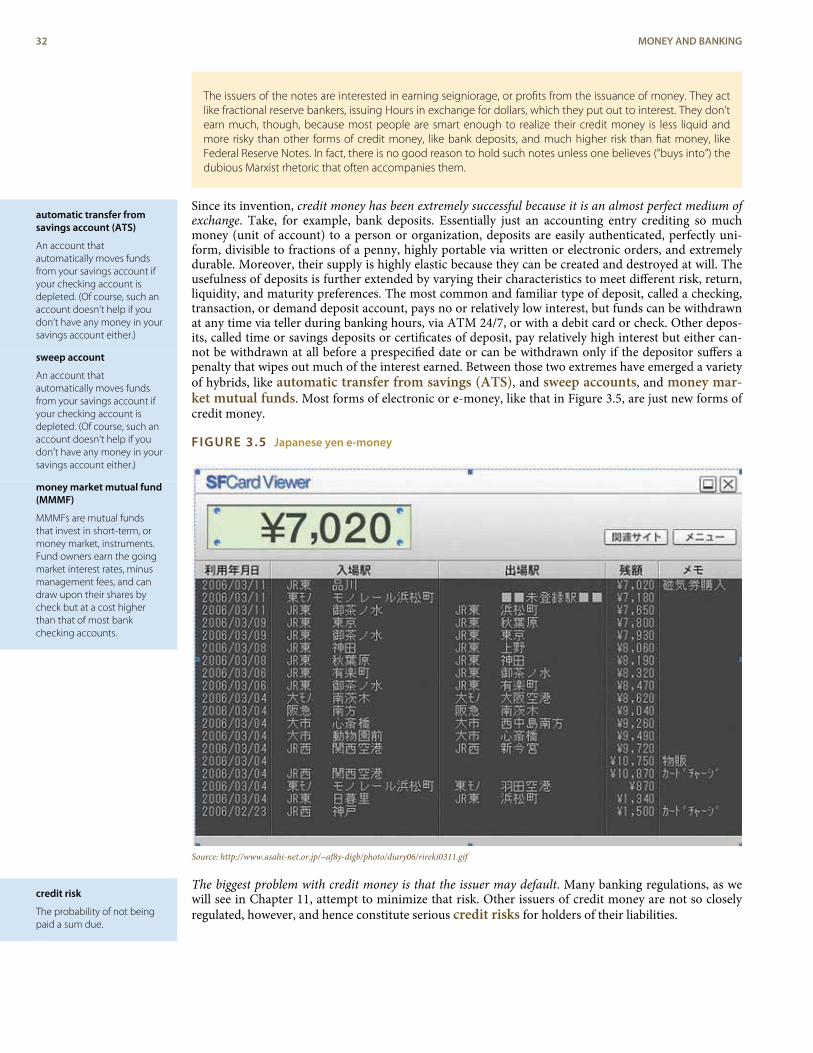
automatic transfer fromsavings account (ATS)
An account thatautomatically moves fundsfrom your savings account ifyour checking account isdepleted. (Of course, such anaccount doesn’t help if youdon’t have any money in yoursavings account either.)
sweep account
An account thatautomatically moves fundsfrom your savings account ifyour checking account isdepleted. (Of course, such anaccount doesn’t help if youdon’t have any money in yoursavings account either.)
money market mutual fund(MMMF)
MMMFs are mutual fundsthat invest in short-term, ormoney market, instruments.Fund owners earn the goingmarket interest rates, minusmanagement fees, and candraw upon their shares bycheck but at a cost higherthan that of most bankchecking accounts.
credit risk
The probability of not beingpaid a sum due.
The issuers of the notes are interested in earning seigniorage, or profits from the issuance of money. They actlike fractional reserve bankers, issuing Hours in exchange for dollars, which they put out to interest. They don’tearn much, though, because most people are smart enough to realize their credit money is less liquid andmore risky than other forms of credit money, like bank deposits, and much higher risk than fiat money, likeFederal Reserve Notes. In fact, there is no good reason to hold such notes unless one believes (“buys into”) thedubious Marxist rhetoric that often accompanies them.
Since its invention, credit money has been extremely successful because it is an almost perfect medium ofexchange. Take, for example, bank deposits. Essentially just an accounting entry crediting so muchmoney (unit of account) to a person or organization, deposits are easily authenticated, perfectly uni-form, divisible to fractions of a penny, highly portable via written or electronic orders, and extremelydurable. Moreover, their supply is highly elastic because they can be created and destroyed at will. Theusefulness of deposits is further extended by varying their characteristics to meet different risk, return,liquidity, and maturity preferences. The most common and familiar type of deposit, called a checking,transaction, or demand deposit account, pays no or relatively low interest, but funds can be withdrawnat any time via teller during banking hours, via ATM 24/7, or with a debit card or check. Other depos-its, called time or savings deposits or certificates of deposit, pay relatively high interest but either can-not be withdrawn at all before a prespecified date or can be withdrawn only if the depositor suffers apenalty that wipes out much of the interest earned. Between those two extremes have emerged a varietyof hybrids, like automatic transfer from savings (ATS), and sweep accounts, and money mar-ket mutual funds. Most forms of electronic or e-money, like that in Figure 3.5, are just new forms ofcredit money.
FIGURE 3.5 Japanese yen e-money
Source: http://www.asahi-net.or.jp/~af8y-digb/photo/diary06/rireki0311.gif
The biggest problem with credit money is that the issuer may default. Many banking regulations, as wewill see in Chapter 11, attempt to minimize that risk. Other issuers of credit money are not so closelyregulated, however, and hence constitute serious credit risks for holders of their liabilities.
32 MONEY AND BANKING
K E Y T A K E A W A Y S
< Representative money and credit money are more efficient than commodity money because they aresuperior media of exchange and units of account. Their quality is more uniform and easily ascertained,they have low weight-to-value ratios, they are more divisible and their divisibility is more flexible, and theirsupply is more elastic.
< However, the supply of representative and credit monies generally does not self-equilibrate the way thesupply of a commodity money does.
5. MEASURING MONEY
L E A R N I N G O B J E C T I V E
1. What is the money supply and how is it measured?
Due in part to the profusion of different types of credit money, measuring the money supply today is noeasy task. The Fed, or Federal Reserve System, America’s monetary authority and central bank, hastherefore developed a number of monetary aggregates, or different measures of the money supply. Themonetary base (MB or M0, the narrowest aggregate) is the unweighted total of Federal Reserve notesand Treasury coins in circulation, plus bank reserves (deposits with the Federal Reserve). M1 adds toM0 travelers’ checks and demand deposits. (Banks other than the Fed no longer issue notes. If they did,they would be considered components of M1.) A broader aggregate, M2, includes M1 as well as time/savings deposits and retail money market mutual fund shares. A yet broader aggregate, M3, includesM2 as well as institutional time deposits, money market mutual fund shares, repurchase agreements,and Eurodollars, but its publication was discontinued by the Fed in 2006.
The Fed continues to estimate the other three measures because their movements are not highlycorrelated and the appropriate monetary aggregate varies over time and question. As we will see, themoney supply helps to determine important macroeconomic variables like inflation, unemployment,and interest rates. Accurately measuring the money supply is so important that monetary economistsstill search for better ways of doing it. One approach, called divisia after its French inventor, FrançoisDivisia (1925), weighs credit instruments by their liquidity, or in other words, their degree of money-ness, or ease of use as a medium of exchange. The Federal Reserve Bank of Saint Louis tracks the U.S.money supply using various divisia formulas.[13]
Each Friday, the Wall Street Journal publishes the M1 and M2 monetary aggregates in its “FederalReserve Data” column. The data is also available on the Federal Reserve’s Web site:http://www.federalreserve.gov/releases/h6/. Students are cautioned, however, that the published dataare mere estimates; the Fed often revises the figures by as much as 2 or 3 percent. Other countries’ centralbanks also report their monetary aggregates. Links to the Web sites of other central banks can be foundhere: http://www.bis.org/cbanks.htm.
K E Y T A K E A W A Y S
< The money supply is the stock of all money in an economy.
< It is measured in a variety of ways to aid in the conduct of monetary policy and in macroeconomicforecasting.
6. SUGGESTED READINGBernstein, Peter. A Primer on Money, Banking, and Gold. Hoboken, NJ: John Wiley and Sons,
2008.Davies, Glyn. A History of Money: From Ancient Times to the Present Day. Cardiff: University of
Wales Press, 2002.Eagleton, Catherine, Jonathan Williams, Joe Cribb, Elizabeth Errington,. Money: A History. Rich-
mond Hill, Ontario, Canada: Firefly Books, 2007.
CHAPTER 3 MONEY 33
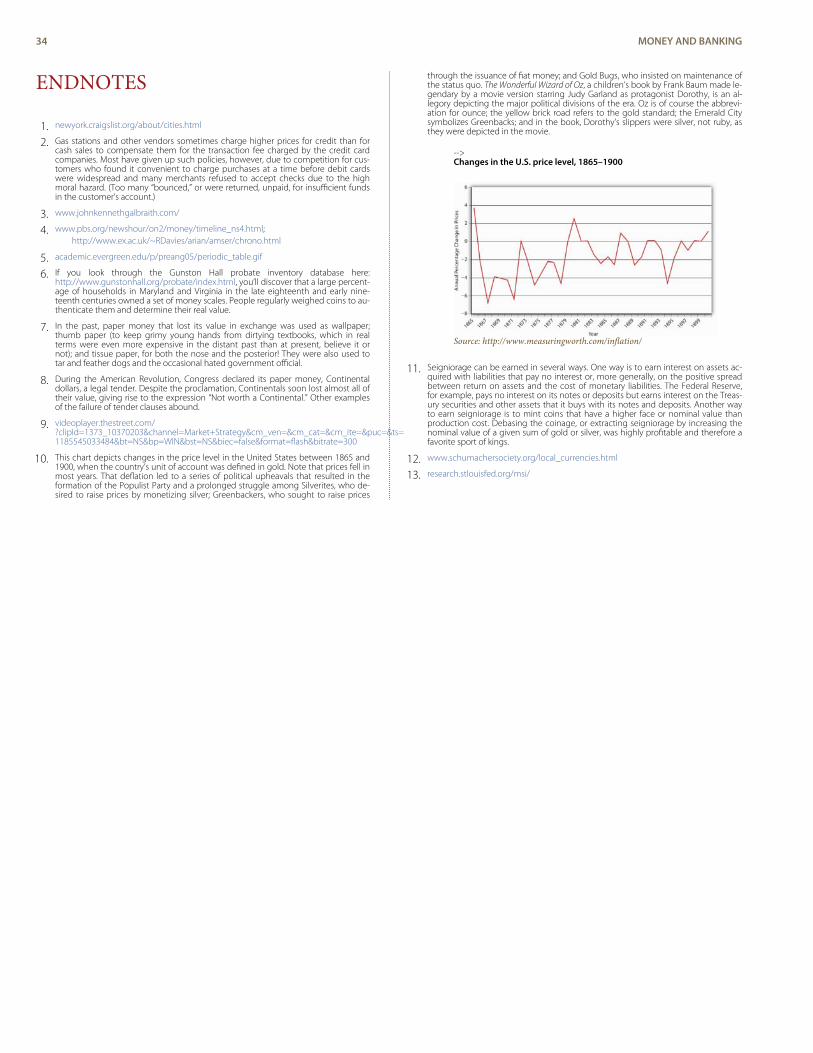
1.2.
3.4.
5.6.
7.
8.
9.
10.
11.
12.13.
ENDNOTES
newyork.craigslist.org/about/cities.html
Gas stations and other vendors sometimes charge higher prices for credit than forcash sales to compensate them for the transaction fee charged by the credit cardcompanies. Most have given up such policies, however, due to competition for cus-tomers who found it convenient to charge purchases at a time before debit cardswere widespread and many merchants refused to accept checks due to the highmoral hazard. (Too many “bounced,” or were returned, unpaid, for insufficient fundsin the customer’s account.)
www.johnkennethgalbraith.com/
www.pbs.org/newshour/on2/money/timeline_ns4.html;http://www.ex.ac.uk/~RDavies/arian/amser/chrono.html
academic.evergreen.edu/p/preang05/periodic_table.gif
If you look through the Gunston Hall probate inventory database here:http://www.gunstonhall.org/probate/index.html, you’ll discover that a large percent-age of households in Maryland and Virginia in the late eighteenth and early nine-teenth centuries owned a set of money scales. People regularly weighed coins to au-thenticate them and determine their real value.
In the past, paper money that lost its value in exchange was used as wallpaper;thumb paper (to keep grimy young hands from dirtying textbooks, which in realterms were even more expensive in the distant past than at present, believe it ornot); and tissue paper, for both the nose and the posterior! They were also used totar and feather dogs and the occasional hated government official.
During the American Revolution, Congress declared its paper money, Continentaldollars, a legal tender. Despite the proclamation, Continentals soon lost almost all oftheir value, giving rise to the expression “Not worth a Continental.” Other examplesof the failure of tender clauses abound.
videoplayer.thestreet.com/?clipId=1373_10370203&channel=Market+Strategy&cm_ven=&cm_cat=&cm_ite=&puc=&ts=1185545033484&bt=NS&bp=WIN&bst=NS&biec=false&format=flash&bitrate=300
This chart depicts changes in the price level in the United States between 1865 and1900, when the country’s unit of account was defined in gold. Note that prices fell inmost years. That deflation led to a series of political upheavals that resulted in theformation of the Populist Party and a prolonged struggle among Silverites, who de-sired to raise prices by monetizing silver; Greenbackers, who sought to raise prices
through the issuance of fiat money; and Gold Bugs, who insisted on maintenance ofthe status quo. The Wonderful Wizard of Oz, a children’s book by Frank Baum made le-gendary by a movie version starring Judy Garland as protagonist Dorothy, is an al-legory depicting the major political divisions of the era. Oz is of course the abbrevi-ation for ounce; the yellow brick road refers to the gold standard; the Emerald Citysymbolizes Greenbacks; and in the book, Dorothy’s slippers were silver, not ruby, asthey were depicted in the movie.
-->Changes in the U.S. price level, 1865–1900
Source: http://www.measuringworth.com/inflation/
Seigniorage can be earned in several ways. One way is to earn interest on assets ac-quired with liabilities that pay no interest or, more generally, on the positive spreadbetween return on assets and the cost of monetary liabilities. The Federal Reserve,for example, pays no interest on its notes or deposits but earns interest on the Treas-ury securities and other assets that it buys with its notes and deposits. Another wayto earn seigniorage is to mint coins that have a higher face or nominal value thanproduction cost. Debasing the coinage, or extracting seigniorage by increasing thenominal value of a given sum of gold or silver, was highly profitable and therefore afavorite sport of kings.
www.schumachersociety.org/local_currencies.html
research.stlouisfed.org/msi/
34 MONEY AND BANKING
interest
The opportunity cost ofmoney.
interest rate
The price of borrowedmoney.
economic growth
Real per capita GDP.
ceteris paribus
All else equal.
yield to maturity (YTM)
The most economicallyaccurate way of measuringinterest rates.
present value (PV)
The value of money today.
future value (FV)
The value of money at somepoint in the future.
C H A P T E R 4Interest Rates
C H A P T E R O B J E C T I V E S
By the end of this chapter, students should be able to:
1. Define interest and explain its importance.
2. Write and explain the present value formula.
3. Write and explain the future value formula.
4. Calculate present and future value for multiple periods with annual and more frequentcompounding.
5. Define and price major types of debt instruments including discount bonds, simple loans,fixed payment loans, and coupon bonds.
6. Define yield to maturity and identify the types of financial instruments for which it is relat-ively easy to calculate.
7. Explain why bond prices move inversely to market interest rates.
8. Explain why some bond prices are more volatile than others.
9. Define rate of return and explain how it differs from yield to maturity.
10. Explain the difference between real and nominal interest rates.
1. THE INTEREST OF INTEREST
L E A R N I N G O B J E C T I V E
1. What is interest and why is it important?
Interest, the opportunity cost of money, is far from mysterious, but it warrants our careful considerationbecause of its importance. Interest rates, the price of borrowing money, are crucial determinants of theprices of assets, especially financial instruments like stocks and bonds, and general macroeconomic condi-tions, including economic growth. In fact, ceteris paribus (like your grades!) the probability of youlanding a job upon graduation will depend in large part on prevailing interest rates. If rates are low,businesses will be more likely to borrow money, expand production, and hire you. If rates are high,businesses will be less likely to expand or to hire you. Without a job, you’ll be forced to move backhome. Best to pay attention then!
Interest can be thought of as the payment it takes to induce a lender to part with his, her, or itsmoney for some period of time, be it a day, week, month, year, decade, or century. To make comparis-ons between those payments easier, interest is almost always expressed as an annual percentage rate,the number of dollars (or other currency)[1] paid for the use of $100 per year. Several ways of measuringinterest rates exist, but here you’ll learn only yield to maturity, the method preferred by economists forits accuracy. The key is to learn to compare the value of money today, called present value(represented here by the variable PV and aka present discounted value or price), to the value of moneytomorrow, called future value (represented here by the variable FV).
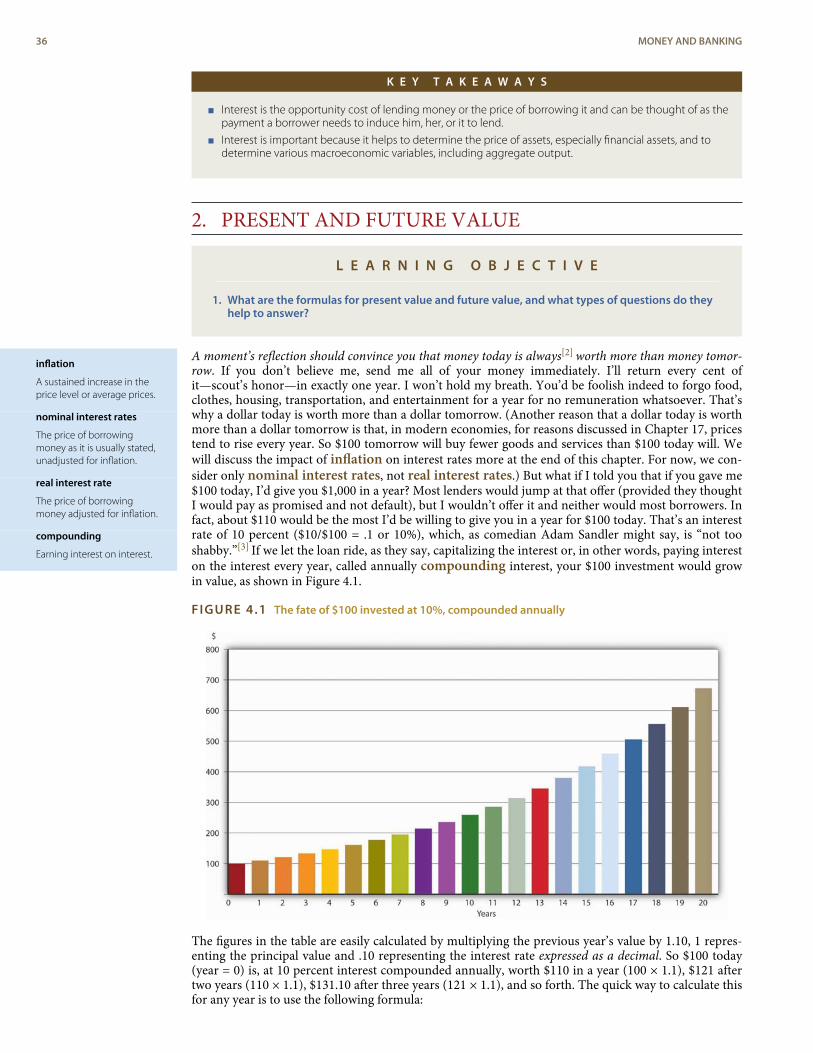
inflation
A sustained increase in theprice level or average prices.
nominal interest rates
The price of borrowingmoney as it is usually stated,unadjusted for inflation.
real interest rate
The price of borrowingmoney adjusted for inflation.
compounding
Earning interest on interest.
K E Y T A K E A W A Y S
< Interest is the opportunity cost of lending money or the price of borrowing it and can be thought of as thepayment a borrower needs to induce him, her, or it to lend.
< Interest is important because it helps to determine the price of assets, especially financial assets, and todetermine various macroeconomic variables, including aggregate output.
2. PRESENT AND FUTURE VALUE
L E A R N I N G O B J E C T I V E
1. What are the formulas for present value and future value, and what types of questions do theyhelp to answer?
A moment’s reflection should convince you that money today is always[2] worth more than money tomor-row. If you don’t believe me, send me all of your money immediately. I’ll return every cent ofit—scout’s honor—in exactly one year. I won’t hold my breath. You’d be foolish indeed to forgo food,clothes, housing, transportation, and entertainment for a year for no remuneration whatsoever. That’swhy a dollar today is worth more than a dollar tomorrow. (Another reason that a dollar today is worthmore than a dollar tomorrow is that, in modern economies, for reasons discussed in Chapter 17, pricestend to rise every year. So $100 tomorrow will buy fewer goods and services than $100 today will. Wewill discuss the impact of inflation on interest rates more at the end of this chapter. For now, we con-sider only nominal interest rates, not real interest rates.) But what if I told you that if you gave me$100 today, I’d give you $1,000 in a year? Most lenders would jump at that offer (provided they thoughtI would pay as promised and not default), but I wouldn’t offer it and neither would most borrowers. Infact, about $110 would be the most I’d be willing to give you in a year for $100 today. That’s an interestrate of 10 percent ($10/$100 = .1 or 10%), which, as comedian Adam Sandler might say, is “not tooshabby.”[3] If we let the loan ride, as they say, capitalizing the interest or, in other words, paying intereston the interest every year, called annually compounding interest, your $100 investment would growin value, as shown in Figure 4.1.
FIGURE 4.1 The fate of $100 invested at 10%, compounded annually
The figures in the table are easily calculated by multiplying the previous year’s value by 1.10, 1 repres-enting the principal value and .10 representing the interest rate expressed as a decimal. So $100 today(year = 0) is, at 10 percent interest compounded annually, worth $110 in a year (100 × 1.1), $121 aftertwo years (110 × 1.1), $131.10 after three years (121 × 1.1), and so forth. The quick way to calculate thisfor any year is to use the following formula:
36 MONEY AND BANKING
FV = PV(1 + i)n
whereFV = the future value (the value of your investment in the future)PV = the present value (the amount of your investment today)(1 + i)n = the future value factor (aka the present value factor or discount factor in the equation
below)i = interest rate (decimalized, for example, 6% = .06; 25% = .25, 2.763% = .02763, etc.)n = number of terms (here, years; elsewhere days, months, quarters)For $100 borrowed today at 10 percent compounded annually, in 100 years I’d owe you $1,378,061
(FV = 100 × 1.1100). (Good luck collecting that one!)What if someone offers to pay you, say, $1,000 in 5 years? How much would you be willing to pay
today for that? Clearly, something less than $1,000. Instead of taking a PV and expanding it via multi-plication to determine an FV, here you must do the opposite, or in other words, reduce or “discount”an FV to a PV. You do so by dividing, as in the following formula:
PV = FV / (1 + i)n
or PV = 1000 / (1 + i)5
Obviously, we can’t solve this equation unless one of the two remaining variables is given. If the in-terest rate is given as 5 percent, you would pay $783.53 today for $1,000 payable in 5 years (PV = 1000/1.055). If it is 20 percent, you’d give only $401.88 (PV = 1000/1.25). If it is 1 percent, you would give$951.47 (PV = 1000/1.015). Notice that as the interest rate rises (falls), the price of the bond falls (rises).In other words, the price of some future payment (some FV; generically, a bond) and the rate of interestare inversely related. You can see this algebraically by noting that the i term is in the denominator, so asit gets larger, PV must get smaller (holding FV constant, of course). Economically this makes sense be-cause a higher interest rate means a higher opportunity cost for money, so a sum payable in the futureis worth less the more dear money is.
If payment of the bond described just above were to be made in ten years instead of five, at 1 per-cent interest per year, you’d pay $905.29 (PV = 1000/1.0110). Note here that, holding the interest rate(and all other factors) constant, you give less today for a payment further in the future ($905.29 <$951.47). That too makes good sense because you’re without your money longer and need to be com-pensated for it by paying a lower price for the bond/promise/IOU today.
Stop and Think Box
Congratulations, you just won the Powerball: $100 million payable in $5 million installments over 20 years! Didyou really win $100 million? (Hint: Calculate the PV of the final payment with interest at 4 percent.)
No; 5 × 20 = 100, but the money payable next year and in subsequent years is not worth $5 million today if in-terest rates are above 0, and they almost always are. For example, the last payment, with interest rates at 4 per-cent compounded annually, has a PV of only 5,000,000/(1.04)20 = $2,281,934.73.
This is a great place to stop and drill until calculating present value and future value becomes secondnature to you. Work through the following problems until it hurts. Then do them again, standing onyour head or on one leg.
CHAPTER 4 INTEREST RATES 37
compounding period
The amount of time thatpasses before interest beginsto earn interest.
E X E R C I S E S
For all questions in this set, interest compounds annually and there are no transaction fees, defaults, etc.
1. On your seventieth birthday, you learn that your grandma, bless her soul, deposited $50.00 for you on theday of your birth in a savings account bearing 5 percent interest. How much is in the account?
2. You won $1 million in the lottery but unfortunately the money is payable in a year and you want to startspending it right away. If interest is at 8 percent, how much can you receive today in exchange for that $1million in year?
3. As a college freshman, you hoped to save $2,500 to “pimp your ride” as a college graduation present toyourself. You put $2,012.98 from your high school graduation haul in the bank at 5 percent interest. Willyou meet your goal?
4. You’ve won a scholarship for your senior year worth $1,500, but it is payable only after graduation, a yearhence. If interest is at 15 percent, how much is your scholarship worth today?
5. You determine that you need $1,750,000 saved in order to retire comfortably. When you turn 25, youinherit $350,017. If you invest that sum immediately at 4.42 percent, can you retire at age 65 if you have noother savings?
6. You own two bonds, each with a face, or payoff, value of $1,000. One falls due in exactly one year and theother in exactly three years. If interest is at 2.35 percent, how much are those bonds worth today? What ifinterest rates jump to 12.25 percent?
7. To purchase a car, you borrowed $10,000 from your brother. You offered to pay him 8 percent interest andto repay the loan in exactly three years. How much will you owe your bro?
8. As part of a lawsuit settlement, a major corporation offers you $100,000 today or $75,000 next year. Whichdo you choose if interest rates are 5 percent? If they are 13.47886 percent?
9. Exactly 150 years ago, the U.S. government promised to pay a certain Indian tribe $3,500, or 7 percentinterest until it did so. Somehow, the account was unpaid. How much does the government owe the tribefor this promise?
10. As part of an insurance settlement, you are offered $100,000 today or $125,000 in five years. If theapplicable interest rate is 1 percent, which option do you choose? What if the interest rate is 5 percent?
K E Y T A K E A W A Y S
< The present value formula is PV = FV/(1 + i)n where PV = present value, FV = future value, i = decimalizedinterest rate, and n = number of periods. It answers questions like, How much would you pay today for $xat time y in the future, given an interest rate and a compounding period.
< The future value formula is FV = PVx(1 + i)n. It answers questions like, How much will $x invested today atsome interest rate and compounding period be worth at time y?
3. COMPOUNDING PERIODS
L E A R N I N G O B J E C T I V E
1. If interest compounds other than annually, how does one calculate PV and FV?
Interest does not always compound annually, as assumed in the problems already presented in thischapter. Sometimes it compounds quarterly, monthly, daily, even continuously. The more frequent thecompounding period, the more valuable the bond or other instrument, all else constant. The mathem-atics remains the same (though a little more difficult when compounding is continuous), but you mustbe careful about what you plug into the equation for i and n. For example, $1,000 invested at 12 percentfor a year compounded annually would be worth $1,000 × (1.12)1 = $1,120.00. But that same sum in-vested for the same term at the same rate of interest but compounded monthly would grow to $1,000 ×(1.01)12 = $1,126.83 because the interest paid each month is capitalized, earning interest at 12 percent.Note that we represent i as the interest paid per period (.12 interest/12 months in a year = .01) and n asthe number of periods (12 in a year; 12 × 1 = 12), rather than the number of years. That same sum, andso forth with interest compounded quarterly (4 times a year) would grow to $1,000 × (1.03)4 =$1,125.51. The differences among annual, monthly, and quarterly compounding here is fairly trivial,amounting to less than $7 all told, but is important for bigger sums, higher interest rates, more fre-quent compounding periods, and longer terms. One million dollars at 4 percent for a year
38 MONEY AND BANKING
compounded annually comes to $1,000,000 × (1.04) = $1,040,000, while on the same terms compoun-ded quarterly, it produces $1,000,000 × (1.01)4 = $1,040,604.01. (I’ll take the latter sum over the formerany day and “invest” the surplus in a very nice dinner and concert tickets.) Likewise, $100 at 300 per-cent interest for 5 years compounded annually becomes 100 × (4)5 = $102,400. Compounded quarterly,that $100 grows to $100 × (1.75)20 = $7,257,064.34! A mere $1 at 6 percent compounded annually for100 years will be worth $1 × (1.06)100 = $339.30. The same buck at the same interest compoundedmonthly swells in a century to $1 × (1.005)1200 = $397.44. This all makes good sense because interest isbeing received sooner than the end of the year and hence is more valuable because, as we know, moneynow is better than money later.
Do a few exercises now to make sure you get it.
E X E R C I S E S
For all questions in this set, interest compounds quarterly (four times a year) and there are no transaction fees,defaults, etc.
1. On your seventieth birthday, you learn that your grandma, bless her soul, deposited $50.00 for you on theday of your birth in a savings account bearing 5 percent interest. How much is in the account?
2. You won $1 million in the lottery but unfortunately the money is payable in a year and you want to startspending it right away. If interest is at 8 percent, how much can you receive today in exchange for that $1million in year?
3. As a freshman, you hoped to save $2,500 to “pimp your ride” as a college graduation present to yourself.You put $2,012.98 from your high school graduation haul in the bank at 5 percent interest. Will you meetyour goal if you graduate in four years?
4. You’ve won a scholarship for your senior year worth $1,500, but it is payable only after graduation, a yearhence. If interest is at 15 percent, how much is your scholarship worth today?
K E Y T A K E A W A Y S
< Present and future value can be calculated for any compounding period using the same formulaspresented in this chapter.
< Care must be taken, however, to ensure that the i and n terms are adjusted appropriately.
CHAPTER 4 INTEREST RATES 39
debt instrument
A bond, IOU, or othercontract (like a discountbond, simple loan, fixedpayment loan, or couponbond) promising thepayment of money in thefuture.
discount bond
A debt instrument that makesonly one payment, its facevalue on its maturity orredemption date. Also knownas a zero coupon bond.
zero coupon bond
See discount bond.
zero
See discount bond.
simple loan
A debt instrument where theborrower repays the principaland interest at the end of theloan.
fixed-payment loan
A debt instrument in whichthe borrower makes periodicrepayments of principal andinterest.
4. PRICING DEBT INSTRUMENTS
L E A R N I N G O B J E C T I V E
1. What are debt instruments and how are they priced?
Believe it or not, you are now equipped to calculate the price of any debt instrument or contractprovided you know the rate of interest, compounding period, and the size and timing of the payments.Four major types of instruments that you are likely to encounter include discount coupon bonds,simple loans, fixed-payment loans, and coupon bonds. A discount bond (aka a zero coupon bondor simply a zero) makes only one payment, its face value on its maturity or redemption date, so itsprice is easily calculated using the present value formula. A simple loan is the name for a loan wherethe borrower repays the principal and interest at the end of the loan. Use the future value formula tocalculate the sum due upon maturity. A fixed-payment loan (aka a fully amortized loan) is one inwhich the borrower periodically (for example, weekly, bimonthly, monthly, quarterly, annually, etc.)repays a portion of the principal along with the interest. With such loans, which include most autoloans and home mortgages, all payments are equal. There is no big balloon or principal payment at theend because the principal shrinks, slowly at first but more rapidly as the final payment grows nearer, asin Figure 4.2.
Principal borrowed: $500,000.00; Annual number of payments: 12; Total number of payments:360; Annual interest rate: 6.00%; Regular monthly payment amount: $2,997.75
40 MONEY AND BANKING
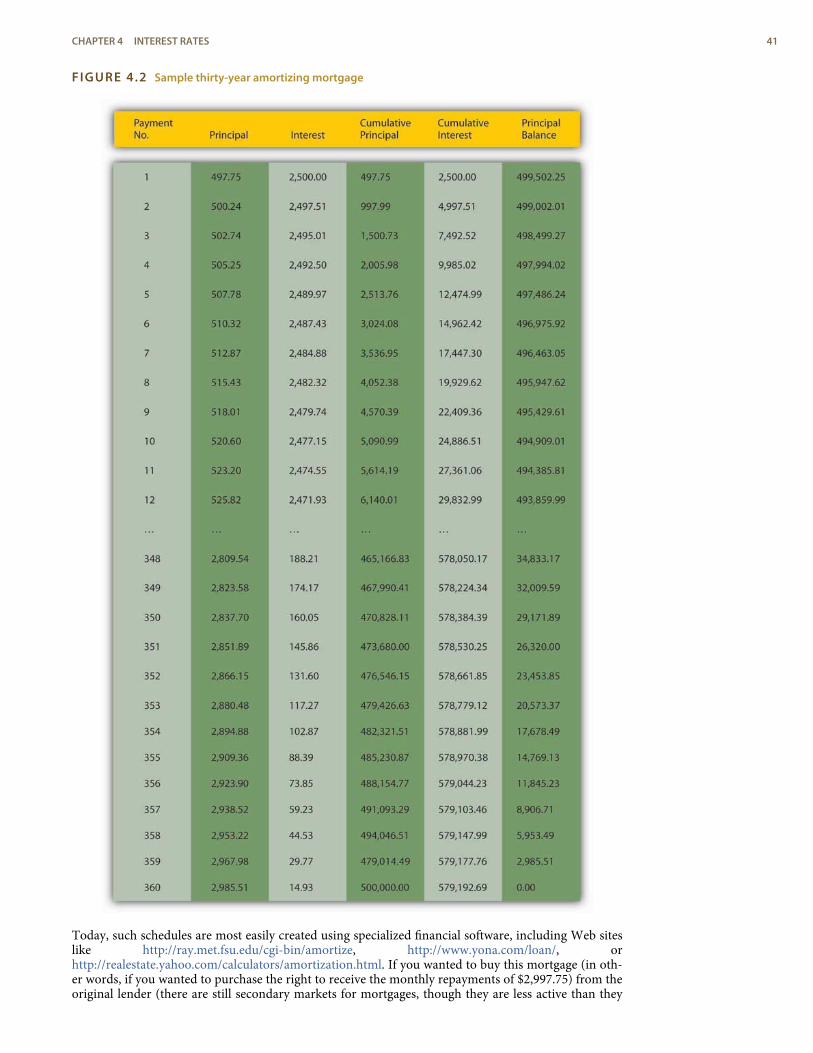
FIGURE 4.2 Sample thirty-year amortizing mortgage
Today, such schedules are most easily created using specialized financial software, including Web siteslike http://ray.met.fsu.edu/cgi-bin/amortize, http://www.yona.com/loan/, orhttp://realestate.yahoo.com/calculators/amortization.html. If you wanted to buy this mortgage (in oth-er words, if you wanted to purchase the right to receive the monthly repayments of $2,997.75) from theoriginal lender (there are still secondary markets for mortgages, though they are less active than they
CHAPTER 4 INTEREST RATES 41
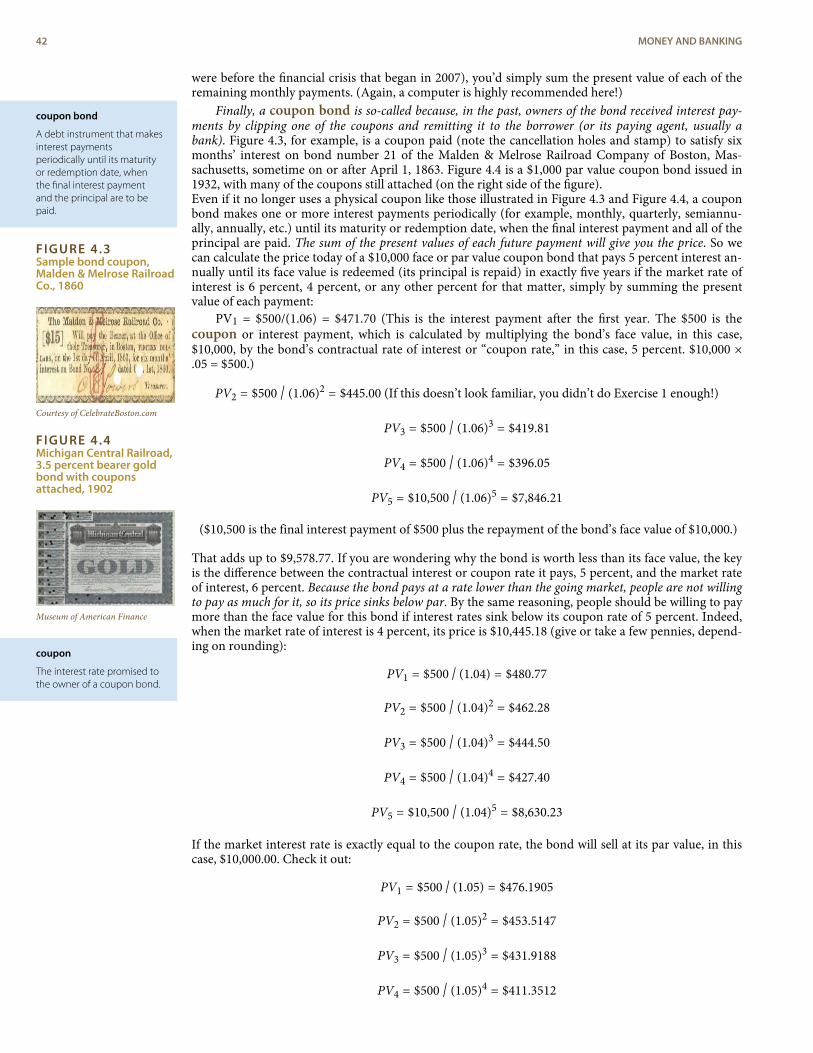
coupon bond
A debt instrument that makesinterest paymentsperiodically until its maturityor redemption date, whenthe final interest paymentand the principal are to bepaid.
FIGURE 4.3Sample bond coupon,Malden & Melrose RailroadCo., 1860
Courtesy of CelebrateBoston.com
FIGURE 4.4Michigan Central Railroad,3.5 percent bearer goldbond with couponsattached, 1902
Museum of American Finance
coupon
The interest rate promised tothe owner of a coupon bond.
were before the financial crisis that began in 2007), you’d simply sum the present value of each of theremaining monthly payments. (Again, a computer is highly recommended here!)
Finally, a coupon bond is so-called because, in the past, owners of the bond received interest pay-ments by clipping one of the coupons and remitting it to the borrower (or its paying agent, usually abank). Figure 4.3, for example, is a coupon paid (note the cancellation holes and stamp) to satisfy sixmonths’ interest on bond number 21 of the Malden & Melrose Railroad Company of Boston, Mas-sachusetts, sometime on or after April 1, 1863. Figure 4.4 is a $1,000 par value coupon bond issued in1932, with many of the coupons still attached (on the right side of the figure).Even if it no longer uses a physical coupon like those illustrated in Figure 4.3 and Figure 4.4, a couponbond makes one or more interest payments periodically (for example, monthly, quarterly, semiannu-ally, annually, etc.) until its maturity or redemption date, when the final interest payment and all of theprincipal are paid. The sum of the present values of each future payment will give you the price. So wecan calculate the price today of a $10,000 face or par value coupon bond that pays 5 percent interest an-nually until its face value is redeemed (its principal is repaid) in exactly five years if the market rate ofinterest is 6 percent, 4 percent, or any other percent for that matter, simply by summing the presentvalue of each payment:
PV1 = $500/(1.06) = $471.70 (This is the interest payment after the first year. The $500 is thecoupon or interest payment, which is calculated by multiplying the bond’s face value, in this case,$10,000, by the bond’s contractual rate of interest or “coupon rate,” in this case, 5 percent. $10,000 ×.05 = $500.)
PV2 = $500 / (1.06)2 = $445.00 (If this doesn’t look familiar, you didn’t do Exercise 1 enough!)
PV3 = $500 / (1.06)3 = $419.81
PV4 = $500 / (1.06)4 = $396.05
PV5 = $10,500 / (1.06)5 = $7,846.21
($10,500 is the final interest payment of $500 plus the repayment of the bond’s face value of $10,000.)
That adds up to $9,578.77. If you are wondering why the bond is worth less than its face value, the keyis the difference between the contractual interest or coupon rate it pays, 5 percent, and the market rateof interest, 6 percent. Because the bond pays at a rate lower than the going market, people are not willingto pay as much for it, so its price sinks below par. By the same reasoning, people should be willing to paymore than the face value for this bond if interest rates sink below its coupon rate of 5 percent. Indeed,when the market rate of interest is 4 percent, its price is $10,445.18 (give or take a few pennies, depend-ing on rounding):
PV1 = $500 / (1.04) = $480.77
PV2 = $500 / (1.04)2 = $462.28
PV3 = $500 / (1.04)3 = $444.50
PV4 = $500 / (1.04)4 = $427.40
PV5 = $10,500 / (1.04)5 = $8,630.23
If the market interest rate is exactly equal to the coupon rate, the bond will sell at its par value, in thiscase, $10,000.00. Check it out:
PV1 = $500 / (1.05) = $476.1905
PV2 = $500 / (1.05)2 = $453.5147
PV3 = $500 / (1.05)3 = $431.9188
PV4 = $500 / (1.05)4 = $411.3512
42 MONEY AND BANKING
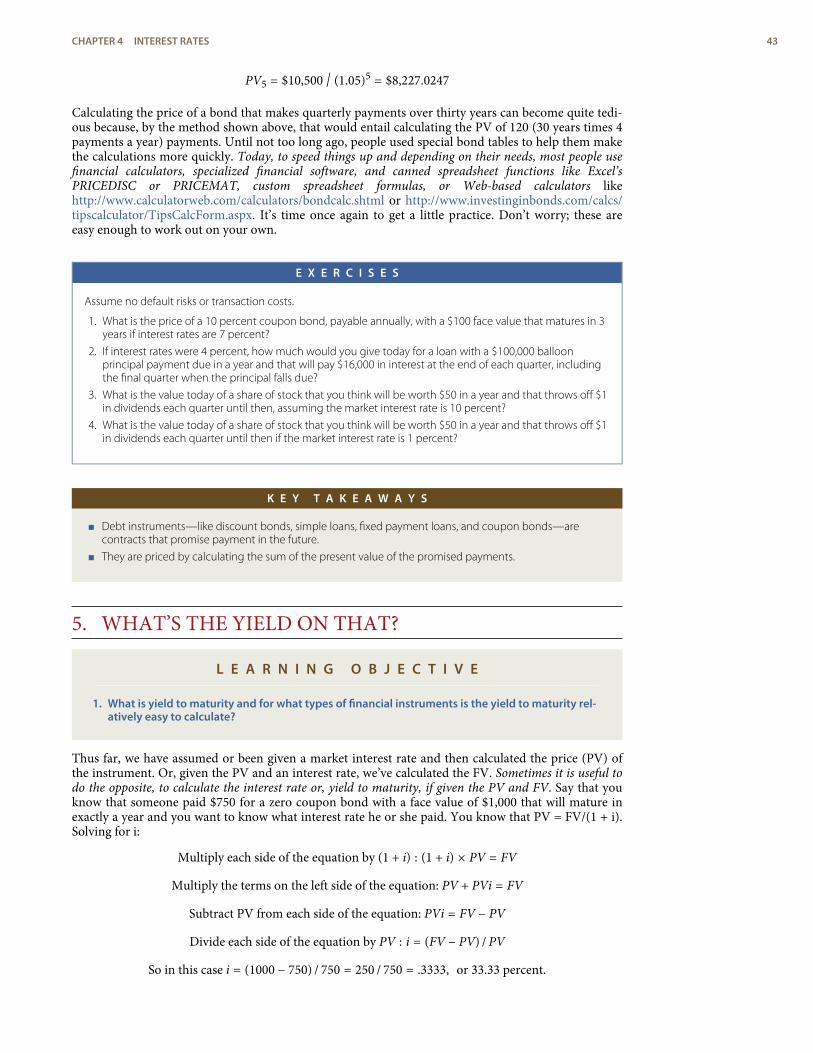
PV5 = $10,500 / (1.05)5 = $8,227.0247
Calculating the price of a bond that makes quarterly payments over thirty years can become quite tedi-ous because, by the method shown above, that would entail calculating the PV of 120 (30 years times 4payments a year) payments. Until not too long ago, people used special bond tables to help them makethe calculations more quickly. Today, to speed things up and depending on their needs, most people usefinancial calculators, specialized financial software, and canned spreadsheet functions like Excel’sPRICEDISC or PRICEMAT, custom spreadsheet formulas, or Web-based calculators likehttp://www.calculatorweb.com/calculators/bondcalc.shtml or http://www.investinginbonds.com/calcs/tipscalculator/TipsCalcForm.aspx. It’s time once again to get a little practice. Don’t worry; these areeasy enough to work out on your own.
E X E R C I S E S
Assume no default risks or transaction costs.
1. What is the price of a 10 percent coupon bond, payable annually, with a $100 face value that matures in 3years if interest rates are 7 percent?
2. If interest rates were 4 percent, how much would you give today for a loan with a $100,000 balloonprincipal payment due in a year and that will pay $16,000 in interest at the end of each quarter, includingthe final quarter when the principal falls due?
3. What is the value today of a share of stock that you think will be worth $50 in a year and that throws off $1in dividends each quarter until then, assuming the market interest rate is 10 percent?
4. What is the value today of a share of stock that you think will be worth $50 in a year and that throws off $1in dividends each quarter until then if the market interest rate is 1 percent?
K E Y T A K E A W A Y S
< Debt instruments—like discount bonds, simple loans, fixed payment loans, and coupon bonds—arecontracts that promise payment in the future.
< They are priced by calculating the sum of the present value of the promised payments.
5. WHAT’S THE YIELD ON THAT?
L E A R N I N G O B J E C T I V E
1. What is yield to maturity and for what types of financial instruments is the yield to maturity rel-atively easy to calculate?
Thus far, we have assumed or been given a market interest rate and then calculated the price (PV) ofthe instrument. Or, given the PV and an interest rate, we’ve calculated the FV. Sometimes it is useful todo the opposite, to calculate the interest rate or, yield to maturity, if given the PV and FV. Say that youknow that someone paid $750 for a zero coupon bond with a face value of $1,000 that will mature inexactly a year and you want to know what interest rate he or she paid. You know that PV = FV/(1 + i).Solving for i:
Multiply each side of the equation by (1 + i) : (1 + i) × PV = FV
Multiply the terms on the left side of the equation: PV + PVi = FV
Subtract PV from each side of the equation: PVi = FV − PV
Divide each side of the equation by PV : i = (FV − PV) / PV
So in this case i = (1000 − 750) / 750 = 250 / 750 = .3333, or 33.33 percent.
CHAPTER 4 INTEREST RATES 43
Consol
A type of perpetual bondissued by the Britishgovernment.
current yield
A quick (i = FV/PV) but flawedmethod for calculatinginterest rates of nonperpetualdebt.
You can check your work by reversing the problem—that is, asking how much you’d pay today for$1,000 in a year if interest was at 33.33 percent: PV = 1000/(1.3333333) = $750. Voilà!
Stop and Think Box
Suppose you have $1,000 to invest for a year and two ways of investing it (each equal in terms of risk and li-quidity): a discount bond due in one year with a face value of $1,000 for $912 or a bank account at 6.35 per-cent compounded annually. Which should you take?
Choose the bond, which will yield 9.65 percent: (1000 − 912)/912 = .0965. To maximize your haul, invest the$88 left over from the purchase of the bond in the bank account.
Calculating the yield to maturity for a perpetual debt, one with no maturity or repayment date, like aConsol, ground rent, or perpetual interest-only mortgage, is also quite easy. The price or PV of a per-petuity is equal to the yearly payment divided by the going rate of interest:
PV = FV / i (decimalized)
So a $1,000 ground rent that pays $50 a year (a 5 percent coupon rate) would be worth $1,000 if in-terest rates were 5 percent, less if rates are higher, more if lower:
PV = 50 / .05 = $1,000
PV = 50 / .10 = $500
PV = 50 / .01 = $5,000
Calculating the yield to maturity of a perpetuity, if given the PV and FV, is easily done by taking theequation and solving for i:
PV = FV / i
Multiply each side by i : PVi = FV
Divided by PV : i = FV / PV
So the yield to maturity of a ground rent that pays $60 per year and that currently sells for $600 wouldbe 10 percent: i = 60/600 = .10 = 10%.
Stop and Think Box
A ground rent contract consummated in Philadelphia, Pennsylvania, in 1756 is still being paid today. Someonerecently paid $455 for the $23.17 annual payment. What is the ground rent’s yield to maturity? If the interestrate rises to 10 percent, how much will the ground rent be worth? What if interest falls to 2 percent?
i = C/P so i = 23.17/455 = 0.05092 = 5.09%; PV = 23.17/.1 = $231.70; PV = 23.17/.02 = $1,158.50.
Calculating yield to maturity for coupon bonds and fixed-payment loans, however, is mathematicallynasty business without a computer or bond table. In the past, people used to estimate the yield to ma-turity on such instruments by pretending they were perpetuities or engaging in trial-and-error inter-polation. In the first method, you use the easy perpetuity equation above (i = FV/PV) to get a quick es-timate called the current yield. Unfortunately, current yield can be wide of the mark, especially forbonds with maturities less than twenty years and bonds whose prices are far from their par value.[4] Inthe second method, one backs into the yield to maturity by making successive guesses about i and plug-ging them into the PV formula. Not fun, but you’ll eventually get there. Most people today thereforeuse a financial calculator, spreadsheet, or Web-based utility rather than such erroneous (current yield)or laborious (interpolation) processes. You should be able to calculate the yield to maturity of one-yeardiscount bonds or perpetuities by hand, or at worst with the aid of simple (nonfinancial) calculator.Here is a little practice.
44 MONEY AND BANKING
rate of return
A measure of the profitabilityof an investment that takesinto account changes in thevalue of the bond or otherasset.
E X E R C I S E S
1. A $100 bond payable in a year sells for $97.56. What is the yield to maturity?
2. Sam promises to pay Joe $1,904 in a year if Joe gives him $1,498 today. What interest rate is Sam payingand what interest rate Joe is earning?
3. Every year, the U.S. government pays a certain Indian tribe $10,000 and, by terms of its treaty with thattribe, must do so forever. Mr. Trump offered to purchase the right to receive that stream for a one-timepayment of $143,500. What yield to maturity did Trump offer the Indians?
4. What is the yield to maturity of a British Consol paying £400 per year that sold for £27,653?
K E Y T A K E A W A Y S
< Yield to maturity is the most economically accurate way of measuring nominal interest rates.
< It is easily calculated for one-year discount bonds i = (FV–PV)/PV and perpetuities i = C/PV where C is thecoupon or annual payment.
6. CALCULATING RETURNS
L E A R N I N G O B J E C T I V E
1. What is the rate of return and how does it differ from yield to maturity?
This is not all you need to know about bonds if you were to become a bond trader because the bond mar-ket, which in the United States is over 200 years old, has some odd conventions that do not make mucheconomic sense. Most students will not become professional bond traders, so in the interest of sanity,yours and ours, we will not delve into the intricacies here. (If you do become a bond trader, you willquickly and easily pick up on the conventions anyway.) Our goal here is to understand the basics of PV,FV, yield to maturity (YTM), and, finally, rate of return. Students sometimes conflate the last twoconcepts. The yield to maturity is merely a measure of the interest rate. The rate of return is more ameasure of how lucrative an investment is because it accounts for changes in the price of the bond (orother asset, financial or otherwise). More formally,
R = (C + Pt1 − Pt0) / Pt0
where:R = return from holding the asset for some time period, t0 to t1Pt0 = the price at time t0 (this can also be thought of as the purchase price)Pt1 = the price at time t1 (this can also be thought of as the sale or going market price)C = coupon (or other) paymentSo imagine you purchased a 5 percent coupon bond with a $100 face value that matures in three
years when the interest rate is 5 percent. As we learned above, the market price of such a bond wouldequal its face value, or $100. We also learned that bond prices and interest rates are inversely related. Asthe market interest rate increases, the PV of the bond’s future payments decreases and the bond be-comes less valuable. As the rate decreases, the PV of future payments increases and the bond becomesmore valuable. If the interest rate increased (decreased) to 6 (4) percent, the value of the bond woulddecrease (increase), so the returns you earned on the bond would not equal the yield to maturity. Forexample, suppose you purchased the bond for $100 but its price a year hence stood at $103 because in-terest rates decreased a little. Your return would be R = (5 + 3)/100 = .08, or 8%. But if in the next year,interest rates soared, driving the market price of the bond down to $65, your return (from purchase)would be R = (10 − 35)/100 = −.25 or negative 25%. Yes, negative. It is quite possible to lose wealth byinvesting in bonds or other fixed-rate financial instruments, even if there is no default (i.e., even if pay-ments are punctually made as promised).
CHAPTER 4 INTEREST RATES 45
interest rate risk
The risk that the market priceof a bond or other debtinstrument will decrease dueto increases in the interestrate.
default risk
The risk that a bond or otherdebt instrument will notmake the promisedpayments.
Stop and Think Box
As part of its effort to repay the large debts it accrued during the Revolutionary War, the U.S. federal govern-ment in the early 1790s issued three types of bonds: a coupon bond that paid 6 percent per year, a couponbond that paid 3 percent per year, and a zero coupon bond that became a 6 percent coupon bond in 1801.For most of the 1790s and early 1800s, the price of the 6 percent bonds hovered around par. Given that in-formation, what was the yield to maturity on government debt in that period? What, in general terms, werethe prices of the 3 percent and zero coupon bonds?
The yield to maturity was about 6 percent because the 6 percent coupon bonds traded at around par. Theprice of the 3 percent coupon bonds must have been well below par because who would pay $100 to get $3a year when she could pay $100 and get $6 a year? Finally, the zeroes must have appreciated toward the priceof the 6 percent coupon bonds as the conversion date neared.
Note that the loss is not, repeat not, predicated on actually selling the bond. One way to think about thisis that the rate of return formula merely calculates the return if the bond were to be sold. Another wayto think about it is to realize that whether the bond is sold or not, its owner is still poorer by theamount of the loss because the value of his assets, and hence his net worth, has shrunk by that amount.The risk of such loss is known as interest rate risk to distinguish it from other types of risks, like de-fault risk (the risk of nonpayment). Interest rate risk is higher the longer the maturity of a bond be-cause more FVs are affected by increasing the interest rate, and the most distant ones are the mosthighly affected. Check this out: The PV of $1,000 in 10 years at 5% compounded annually is 1,000/(1.05)10 = $613.91. At 10% it is 1,000/(1.10)10 = $385.54, a loss of 37.2%. The PV of $1,000 in 30 yearsat 5% and 10% is 1,000/(1.05)30 = $231.38 and 1,000/(1.10)30 = $57.31, respectively, a loss of 75.23 per-cent. Duration is a technical measure of interest rate risk that we will not investigate here, where themain point is merely that rising interest rates hurt bond prices (and hence bondholders); falling in-terest rates help bond prices.
K E Y T A K E A W A Y S
< The rate of return accounts for changes in the market price of a bond or other asset while the yield tomaturity does not.
< Yield to maturity (YTM) is almost always positive but returns are often negative due to interest rate risk, therisk that interest rates will rise, depressing bond prices.
< When the market interest rate increases, bond prices decrease because the opportunity cost of lendingmoney has increased, making bonds less attractive investments unless their price falls.
< Algebraically, PV = FV/(1 + i)n. The interest rate is in the denominator, so as i gets bigger, PV must getsmaller.
< Bonds with longer periods to maturity have more volatile prices, ceteris paribus, because the PV of theirdistant FV shrinks more, to very small sums.
7. INFLATION AND INTEREST RATES
L E A R N I N G O B J E C T I V E
1. What is the difference between real and nominal interest rates and why is the distinctionimportant?
You might well ask at this point, What factors change interest rates? One big factor is inflation. As theprice level rises, so too do interest rates, or at least what economists call nominal interest rates, the typeof rates we’ve discussed so far. If nominal rates do not increase (and they often don’t, or can’t), lendersmight receive more nominal dollars than they lent but actually get back less purchasing power. Imagine,for example, that you lent $100 for one year at 6 percent interest when a loaf of bread, pack of chewinggum, and two-liter bottle of Mountain Dew each cost $1. At the end of the simple loan, you would getback $100 × 1.06 = $106 and be able to enjoy an extra $6 of goods, say, two loaves of bread, two packsof gum, and two bottles of the caffeine and sugar rush known as Doin’ the Dew. But what if pricesdoubled over that year? Instead of some combination of 106 goodies, you’d be able to buy only fifty-
46 MONEY AND BANKING
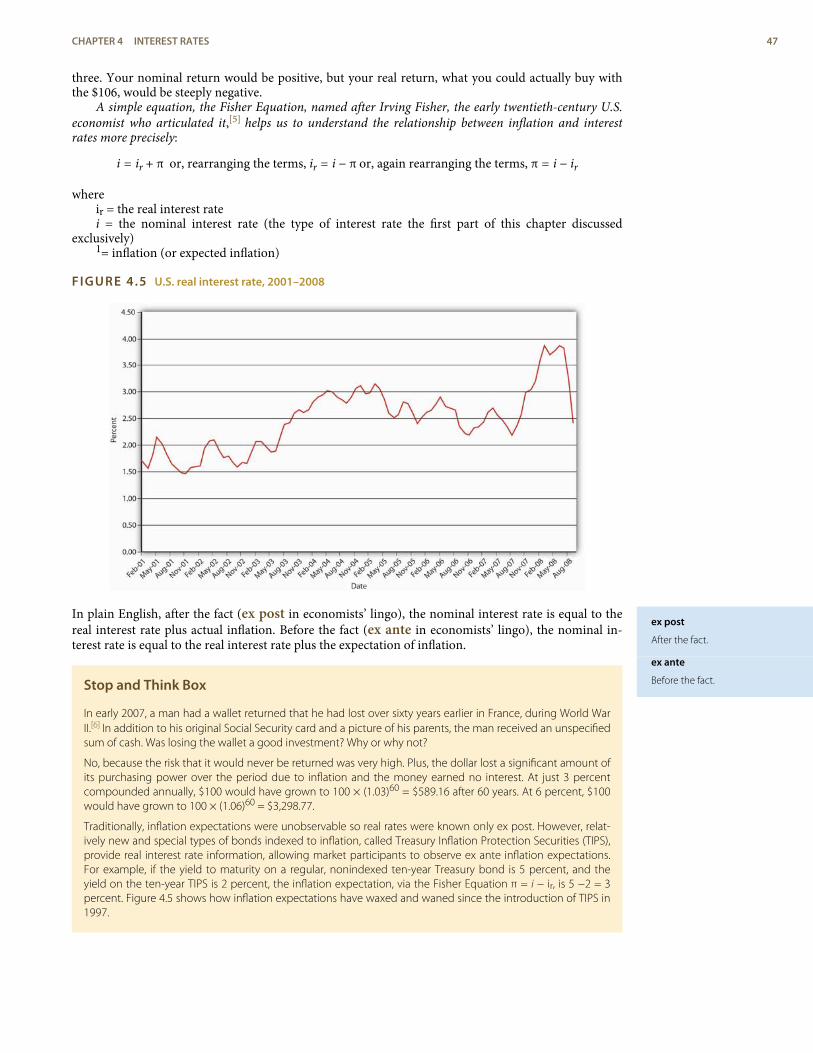
ex post
After the fact.
ex ante
Before the fact.
three. Your nominal return would be positive, but your real return, what you could actually buy withthe $106, would be steeply negative.
A simple equation, the Fisher Equation, named after Irving Fisher, the early twentieth-century U.S.economist who articulated it,[5] helps us to understand the relationship between inflation and interestrates more precisely:
i = ir + π or, rearranging the terms, ir = i − π or, again rearranging the terms, π = i − ir
whereir = the real interest ratei = the nominal interest rate (the type of interest rate the first part of this chapter discussed
exclusively)1= inflation (or expected inflation)
FIGURE 4.5 U.S. real interest rate, 2001–2008
In plain English, after the fact (ex post in economists’ lingo), the nominal interest rate is equal to thereal interest rate plus actual inflation. Before the fact (ex ante in economists’ lingo), the nominal in-terest rate is equal to the real interest rate plus the expectation of inflation.
Stop and Think Box
In early 2007, a man had a wallet returned that he had lost over sixty years earlier in France, during World WarII.[6] In addition to his original Social Security card and a picture of his parents, the man received an unspecifiedsum of cash. Was losing the wallet a good investment? Why or why not?
No, because the risk that it would never be returned was very high. Plus, the dollar lost a significant amount ofits purchasing power over the period due to inflation and the money earned no interest. At just 3 percentcompounded annually, $100 would have grown to 100 × (1.03)60 = $589.16 after 60 years. At 6 percent, $100would have grown to 100 × (1.06)60 = $3,298.77.
Traditionally, inflation expectations were unobservable so real rates were known only ex post. However, relat-ively new and special types of bonds indexed to inflation, called Treasury Inflation Protection Securities (TIPS),provide real interest rate information, allowing market participants to observe ex ante inflation expectations.For example, if the yield to maturity on a regular, nonindexed ten-year Treasury bond is 5 percent, and theyield on the ten-year TIPS is 2 percent, the inflation expectation, via the Fisher Equation π = i − ir, is 5 −2 = 3percent. Figure 4.5 shows how inflation expectations have waxed and waned since the introduction of TIPS in1997.
CHAPTER 4 INTEREST RATES 47
K E Y T A K E A W A Y S
< The difference between the real and the nominal interest rate is literally inflation or inflation expectations.
< According to the Fisher Equation, nominal interest equals real interest plus inflation (or inflationexpectations), or real interest equals nominal interest minus inflation (expectations).
< If actual inflation exceeds inflation expectations, real ex post (inflation-adjusted, after the fact) returns onbonds can be negative.
8. SUGGESTED READINGFisher, Irving. The Purchasing Power of Money: Its Determination and Relation to Credit Interest
and Crises. New York: Cosimo Classics, 2006.Strumeyer, Gary. Investing in Fixed Income Securities: Understanding the Bond Market. Hoboken,
NJ: John Wiley and Sons, 2005.Wild, Russell. Bond Investing for Dummies. Hoboken, NJ: John Wiley and Sons, 2007.
48 MONEY AND BANKING

1.2.
3.
4.
5.
6.
ENDNOTES
http://fx.sauder.ubc.ca/currency_table.html
Certain interest rates occasionally turn very slightly (−0.004%) negative. The phe-nomenon is so rare and minor that it need not detain us here.
www.tsrocks.com/a/adam_sandler_texts/the_chanukah_song.html
Current yield is simply the yield to maturity of a perpetuity, so the more like a per-petuity a bond is, the better the current yield will approximate its yield to maturity.The shorter the maturity of a bond, the less like a Consol it is, so the less accurate thecurrent yield formula will be. Similarly, the current yield works better the closer abond’s price is to par because yield to maturity equals the coupon rate when thebond is at par. As the price deviates further from par, the less well the current yieldcan approximate the yield to maturity.
To be frank, Benjamin Franklin and other colonists in eighteenth-century Americaunderstood it well.
ABC News video, “Wallet Returned, 60 Years Later, A World War II Veteran gets hiswallet returned to him sixty years later” (1/9/2007).
CHAPTER 4 INTEREST RATES 49

50 MONEY AND BANKING
C H A P T E R 5The Economics of Interest-Rate Fluctuations
C H A P T E R O B J E C T I V E S
By the end of this chapter, students should be able to
1. Describe, at the first level of analysis, the factors that cause changes in the interest rate.
2. List and explain four major factors that determine the quantity demanded of an asset.
3. List and explain three major factors that cause shifts in the bond supply curve.
4. Explain why the Fisher Equation holds; that is, explain why the expectation of higher infla-tion leads to a higher nominal interest rate.
5. Predict, in a general way, what will happen to the interest rate during an economic expan-sion or contraction and explain why.
6. Discuss how changes in the money supply may affect interest rates.
1. INTEREST RATE FLUCTUATIONS
L E A R N I N G O B J E C T I V E
1. As a first approximation, what causes the interest rate to change?
If you followed the gist of Chapter 4, you learned (we hope!) about the time value of money, includinghow to calculate future value (FV), present value (PV), yield to maturity, current yield (the yield to ma-turity of a perpetuity), rate of return, and real interest rates. You also learned that a change in the in-terest rate has a profound effect on the value of assets, especially bonds and other types of loans, butalso equities and derivatives. (In this chapter, we’ll use the generic term bonds throughout.) That mightnot be a very important insight if interest rates were stable for long periods. The fact is, however, in-terest rates change monthly, weekly, daily, and even, in some markets, by the nanosecond. ConsiderFigure 5.1 and Figure 5.2. The first figure shows yields on one-month U.S. Treasury bills from 2001 to2008, the second shows a zoomed-in view on just March 2008. Clearly, there are long-term seculartrends as well as short-term ups and downs.
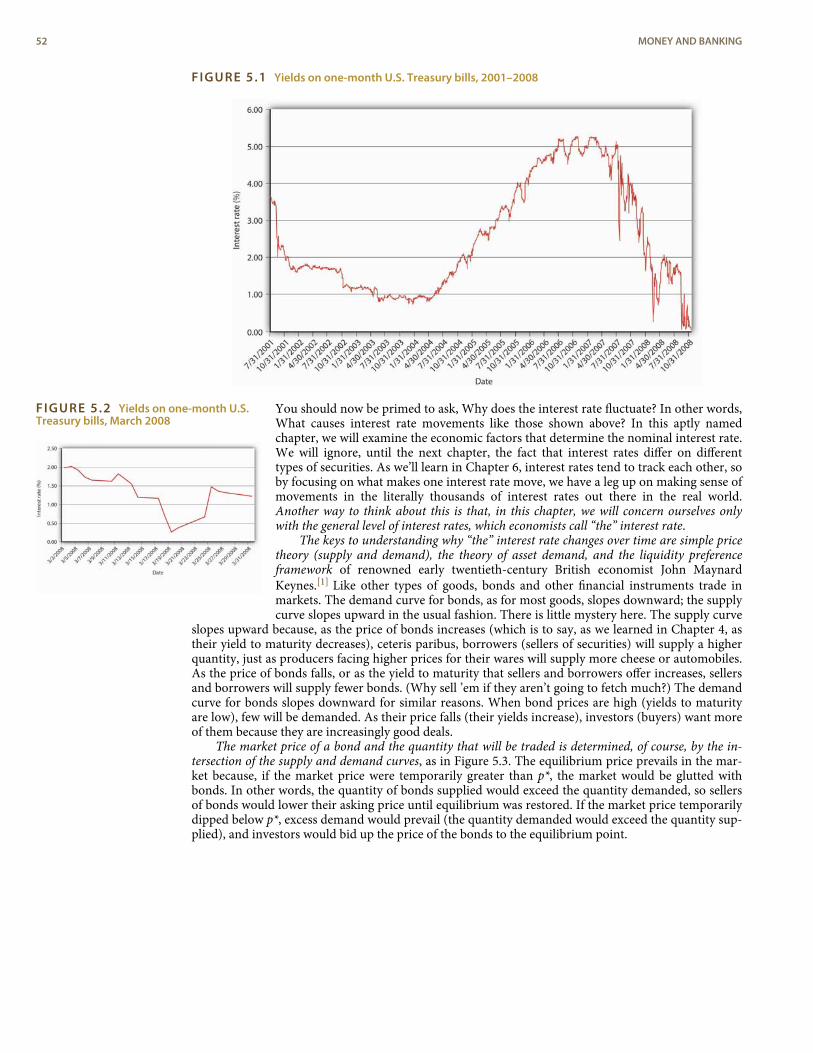
FIGURE 5.2 Yields on one-month U.S.Treasury bills, March 2008
FIGURE 5.1 Yields on one-month U.S. Treasury bills, 2001–2008
You should now be primed to ask, Why does the interest rate fluctuate? In other words,What causes interest rate movements like those shown above? In this aptly namedchapter, we will examine the economic factors that determine the nominal interest rate.We will ignore, until the next chapter, the fact that interest rates differ on differenttypes of securities. As we’ll learn in Chapter 6, interest rates tend to track each other, soby focusing on what makes one interest rate move, we have a leg up on making sense ofmovements in the literally thousands of interest rates out there in the real world.Another way to think about this is that, in this chapter, we will concern ourselves onlywith the general level of interest rates, which economists call “the” interest rate.
The keys to understanding why “the” interest rate changes over time are simple pricetheory (supply and demand), the theory of asset demand, and the liquidity preferenceframework of renowned early twentieth-century British economist John MaynardKeynes.[1] Like other types of goods, bonds and other financial instruments trade inmarkets. The demand curve for bonds, as for most goods, slopes downward; the supplycurve slopes upward in the usual fashion. There is little mystery here. The supply curve
slopes upward because, as the price of bonds increases (which is to say, as we learned in Chapter 4, astheir yield to maturity decreases), ceteris paribus, borrowers (sellers of securities) will supply a higherquantity, just as producers facing higher prices for their wares will supply more cheese or automobiles.As the price of bonds falls, or as the yield to maturity that sellers and borrowers offer increases, sellersand borrowers will supply fewer bonds. (Why sell ’em if they aren’t going to fetch much?) The demandcurve for bonds slopes downward for similar reasons. When bond prices are high (yields to maturityare low), few will be demanded. As their price falls (their yields increase), investors (buyers) want moreof them because they are increasingly good deals.
The market price of a bond and the quantity that will be traded is determined, of course, by the in-tersection of the supply and demand curves, as in Figure 5.3. The equilibrium price prevails in the mar-ket because, if the market price were temporarily greater than p*, the market would be glutted withbonds. In other words, the quantity of bonds supplied would exceed the quantity demanded, so sellersof bonds would lower their asking price until equilibrium was restored. If the market price temporarilydipped below p*, excess demand would prevail (the quantity demanded would exceed the quantity sup-plied), and investors would bid up the price of the bonds to the equilibrium point.
52 MONEY AND BANKING
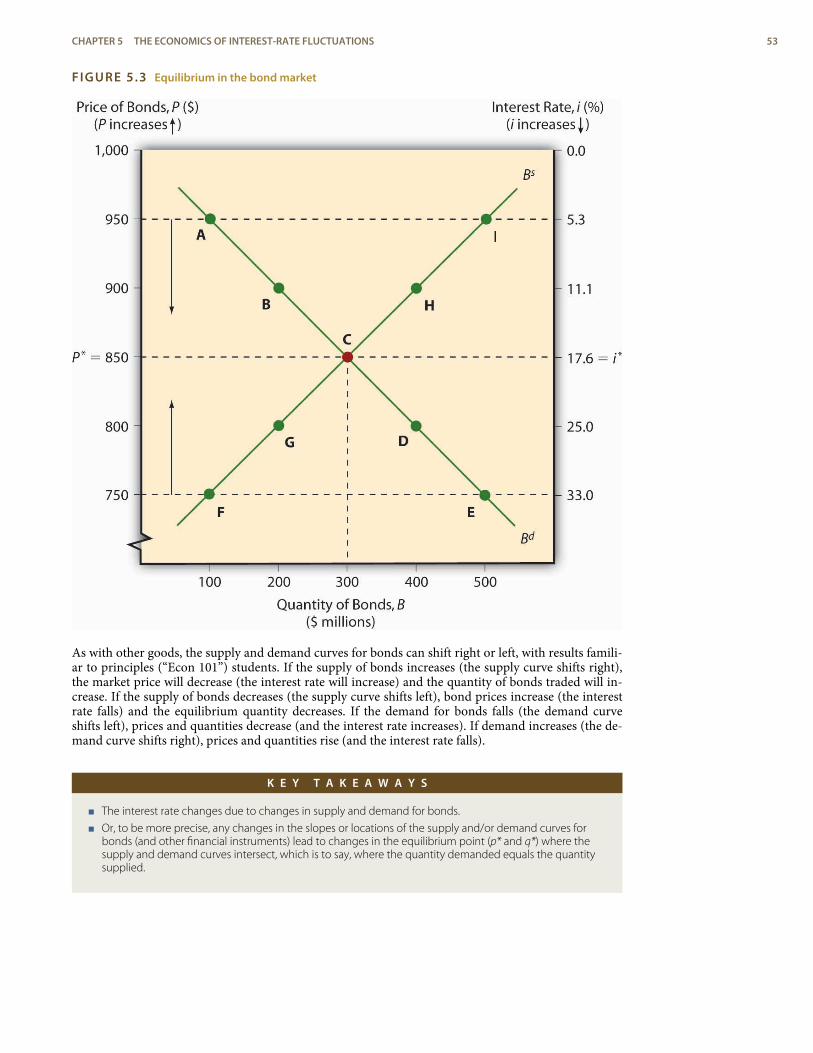
FIGURE 5.3 Equilibrium in the bond market
As with other goods, the supply and demand curves for bonds can shift right or left, with results famili-ar to principles (“Econ 101”) students. If the supply of bonds increases (the supply curve shifts right),the market price will decrease (the interest rate will increase) and the quantity of bonds traded will in-crease. If the supply of bonds decreases (the supply curve shifts left), bond prices increase (the interestrate falls) and the equilibrium quantity decreases. If the demand for bonds falls (the demand curveshifts left), prices and quantities decrease (and the interest rate increases). If demand increases (the de-mand curve shifts right), prices and quantities rise (and the interest rate falls).
K E Y T A K E A W A Y S
< The interest rate changes due to changes in supply and demand for bonds.
< Or, to be more precise, any changes in the slopes or locations of the supply and/or demand curves forbonds (and other financial instruments) lead to changes in the equilibrium point (p* and q*) where thesupply and demand curves intersect, which is to say, where the quantity demanded equals the quantitysupplied.
CHAPTER 5 THE ECONOMICS OF INTEREST-RATE FLUCTUATIONS 53
investment portfolio
The set of financial and otherinvestments or assets held byan economic entity.
2. SHIFTS IN SUPPLY AND DEMAND FOR BONDS
L E A R N I N G O B J E C T I V E
1. What causes the supply and demand for bonds to shift?
Shifting supply and demand curves around can be fun, but figuring out why the curves shift is the inter-esting part. (Determining the shape and slope of the curves is interesting too, but these details will notdetain us here.) Movements along the curve, or why the supply curve slopes upward and the demandcurve downward, were easy enough to grasp. Determining why the whole curve moves, why investorsare willing to buy more (or fewer) bonds, or why borrowers are willing to sell more (or fewer) bonds ata given price is a bit more involved. Let’s tackle demand first, then we will move on to supply.
Wealth determines the overall demand for assets. An asset (something owned) is any store of value,including financial assets like money, loans (for the lender), bonds, equities (stocks), and a potpourri ofderivatives[2] and nonfinancial assets like real estate (land, buildings), precious metals (gold, silver, plat-inum), gems (diamonds, rubies, emeralds), hydrocarbons (oil, natural gas) and (to a greater or lesserextent, depending on their qualities) all other physical goods (as opposed to bads, like pollution, orfreebies, like air). As wealth increases, so too does the quantity demanded of all types of assets, thoughto different degrees. The reasoning here is almost circular: if it is to be maintained, wealth must be in-vested in some asset, in some store of value. In which type of asset to invest new wealth is the difficultdecision. When determining which assets to hold, most economic entities (people, firms, governments)care about many factors, but for most investors most of the time, three variables—expected relative re-turn, risk, and liquidity—are paramount. (We briefly discussed these concepts, you may recall, inChapter 2.)
Expected relative return is the ex ante (before the fact) belief that the return on one asset will behigher than the returns of other comparable (in terms of risk and liquidity) assets. Return is a goodthing, of course, so as expected relative return increases, the quantity demanded of an asset also increases.That can happen because the expected return on the asset itself increases, because the expected returnon comparables decreases, or because of a combination thereof. Clearly, two major factors discussed inChapter 4 will affect return expectations and hence the demand for certain financial assets, like bonds:expected interest rates and, via the Fisher Equation, expected inflation. If the interest rate is expected toincrease for any reason (including, but not limited to, expected increases in inflation), bond prices areexpected to fall, so the quantity demanded will decrease. Conversely, if the interest rate is thought todecrease for any reason (including, but not limited to, the expected taming of inflation), bond pricesare expected to rise, so the quantity demanded will increase.
Overall, though, calculating relative expected returns is sticky business that is best addressed inmore specialized financial books and courses. If you want an introduction, investigate the capital assetpricing model (CAPM)[3] and the arbitrage pricing theory (APT).[4] As we learned in Chapter 4, calcu-lating return is not terribly difficult and neither is comparing returns among a variety of assets. What’stricky is forecasting future returns and making sure that assets are comparable by controlling for risk,among other things. Risk is the uncertainty of an asset’s returns. It comes in a variety of flavors, all ofthem unsavory, so as it increases, the quantity demanded of an asset decreases, ceteris paribus. InChapter 4, we encountered two types of risk: default risk (aka credit risk), the chance that a financialcontract will not be honored, and interest rate risk, the chance that the interest rate will rise and hencedecrease a bond or loan’s price. An offsetting risk is called reinvestment risk, which bites when the in-terest rate decreases because coupon or other interest payments have to be reinvested at a lower yield tomaturity. To be willing to take on more risk, whatever its flavor, rational investors must expect a higherrelative return. Investors who require a much higher return for assuming a little bit of risk are calledrisk-averse. Those who will take on much risk for a little higher return are called risk-loving, risk-seekers, or risk-tolerant. (Investors who take on more risk without compensation are neither risk-averse nor risk-tolerant, but rather irrational in the sense discussed in Chapter 7.) Risks can be idiosyn-cratic; that is, they can be pertinent to a particular company, sectoral (pertinent to an entire industry,like trucking or restaurants), or systemic (economy-wide). Liquidity risk occurs when an asset cannotbe sold as quickly or cheaply as expected, be it for idiosyncratic, sectoral, or systemic reasons. This, too,is a serious risk because liquidity, or (to be more precise) liquidity relative to other assets, is the third ma-jor determinant of asset demand. Because investors often need to change their investment portfolioor dis-save (spend some of their wealth on consumption), liquidity, the ability to sell an asset quicklyand cheaply, is a good thing. The more liquid an asset is, therefore, the higher the quantity demanded,all else being equal.
During the financial crisis that began in 2007, the prices of a certain type of bond collateralized bysubprime mortgages, long-term loans collateralized with homes and made to relatively risky borrowers,
54 MONEY AND BANKING
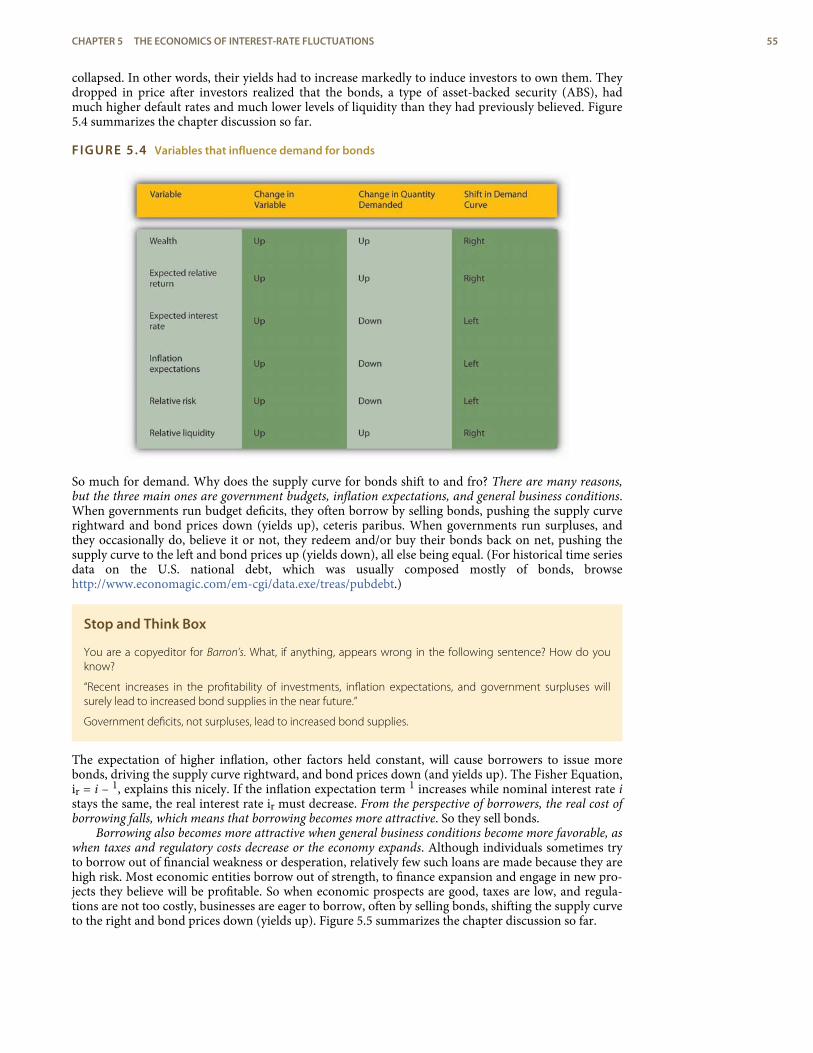
collapsed. In other words, their yields had to increase markedly to induce investors to own them. Theydropped in price after investors realized that the bonds, a type of asset-backed security (ABS), hadmuch higher default rates and much lower levels of liquidity than they had previously believed. Figure5.4 summarizes the chapter discussion so far.
FIGURE 5.4 Variables that influence demand for bonds
So much for demand. Why does the supply curve for bonds shift to and fro? There are many reasons,but the three main ones are government budgets, inflation expectations, and general business conditions.When governments run budget deficits, they often borrow by selling bonds, pushing the supply curverightward and bond prices down (yields up), ceteris paribus. When governments run surpluses, andthey occasionally do, believe it or not, they redeem and/or buy their bonds back on net, pushing thesupply curve to the left and bond prices up (yields down), all else being equal. (For historical time seriesdata on the U.S. national debt, which was usually composed mostly of bonds, browsehttp://www.economagic.com/em-cgi/data.exe/treas/pubdebt.)
Stop and Think Box
You are a copyeditor for Barron’s. What, if anything, appears wrong in the following sentence? How do youknow?
“Recent increases in the profitability of investments, inflation expectations, and government surpluses willsurely lead to increased bond supplies in the near future.”
Government deficits, not surpluses, lead to increased bond supplies.
The expectation of higher inflation, other factors held constant, will cause borrowers to issue morebonds, driving the supply curve rightward, and bond prices down (and yields up). The Fisher Equation,ir = i – 1, explains this nicely. If the inflation expectation term 1 increases while nominal interest rate istays the same, the real interest rate ir must decrease. From the perspective of borrowers, the real cost ofborrowing falls, which means that borrowing becomes more attractive. So they sell bonds.
Borrowing also becomes more attractive when general business conditions become more favorable, aswhen taxes and regulatory costs decrease or the economy expands. Although individuals sometimes tryto borrow out of financial weakness or desperation, relatively few such loans are made because they arehigh risk. Most economic entities borrow out of strength, to finance expansion and engage in new pro-jects they believe will be profitable. So when economic prospects are good, taxes are low, and regula-tions are not too costly, businesses are eager to borrow, often by selling bonds, shifting the supply curveto the right and bond prices down (yields up). Figure 5.5 summarizes the chapter discussion so far.
CHAPTER 5 THE ECONOMICS OF INTEREST-RATE FLUCTUATIONS 55
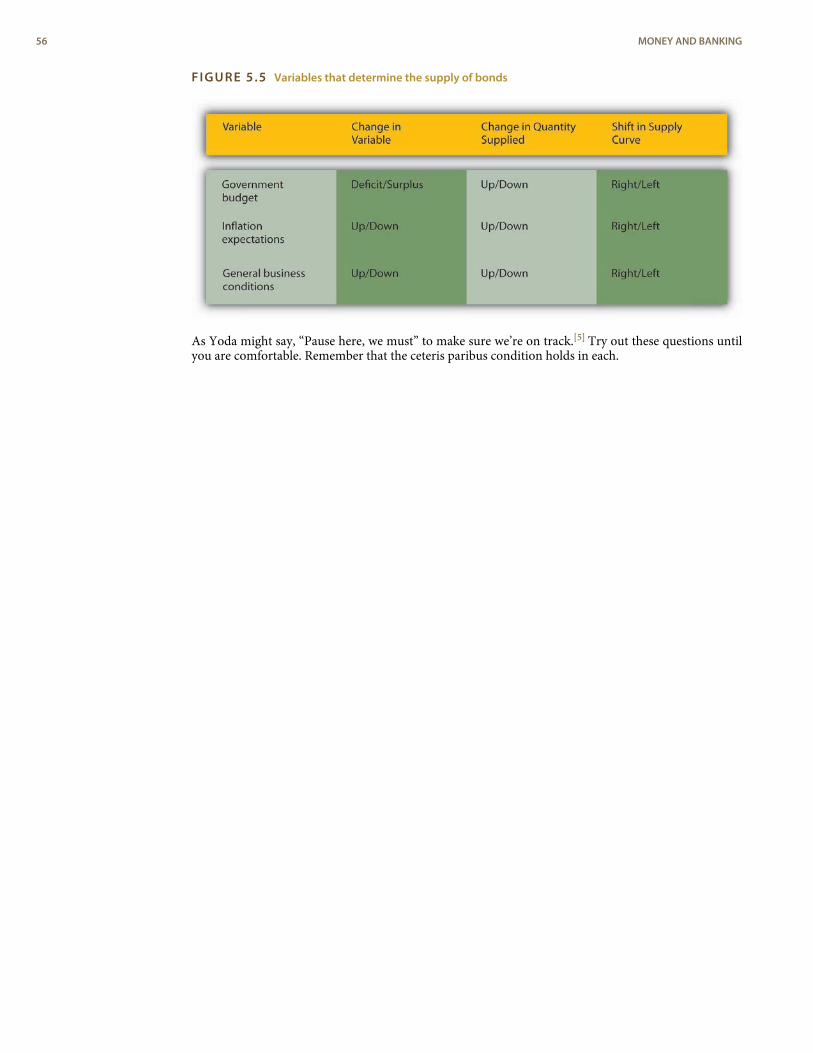
FIGURE 5.5 Variables that determine the supply of bonds
As Yoda might say, “Pause here, we must” to make sure we’re on track.[5] Try out these questions untilyou are comfortable. Remember that the ceteris paribus condition holds in each.
56 MONEY AND BANKING
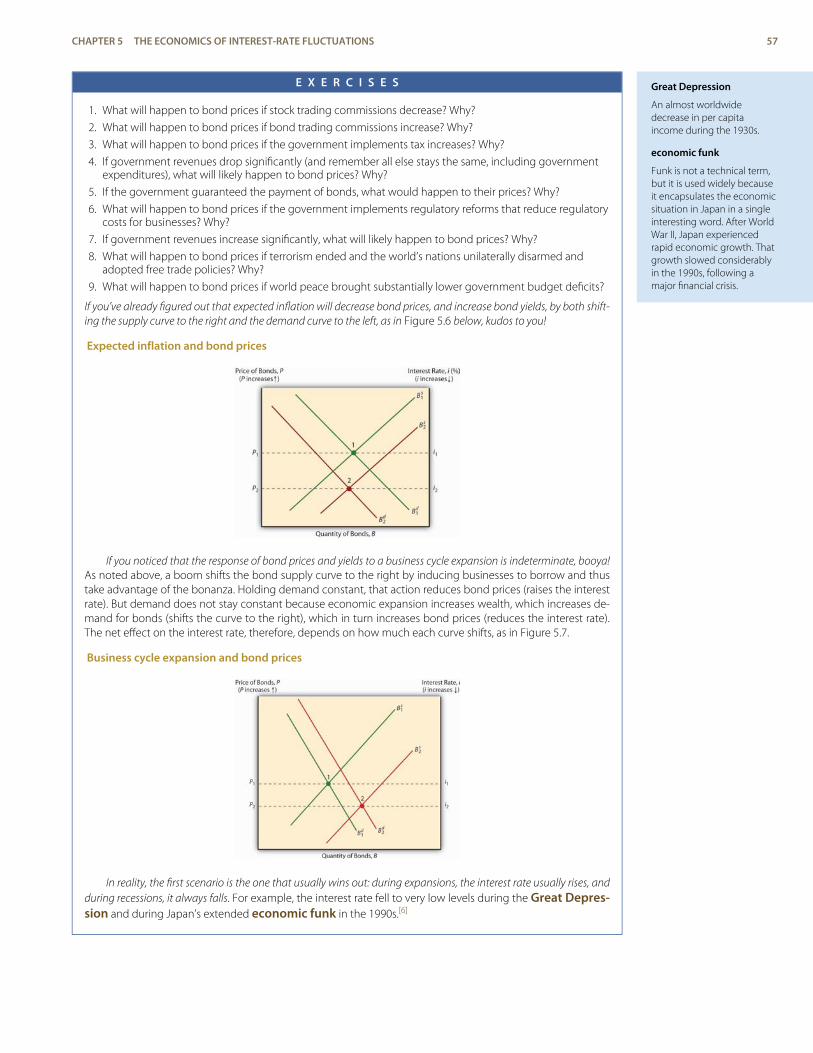
Great Depression
An almost worldwidedecrease in per capitaincome during the 1930s.
economic funk
Funk is not a technical term,but it is used widely becauseit encapsulates the economicsituation in Japan in a singleinteresting word. After WorldWar II, Japan experiencedrapid economic growth. Thatgrowth slowed considerablyin the 1990s, following amajor financial crisis.
E X E R C I S E S
1. What will happen to bond prices if stock trading commissions decrease? Why?
2. What will happen to bond prices if bond trading commissions increase? Why?
3. What will happen to bond prices if the government implements tax increases? Why?
4. If government revenues drop significantly (and remember all else stays the same, including governmentexpenditures), what will likely happen to bond prices? Why?
5. If the government guaranteed the payment of bonds, what would happen to their prices? Why?
6. What will happen to bond prices if the government implements regulatory reforms that reduce regulatorycosts for businesses? Why?
7. If government revenues increase significantly, what will likely happen to bond prices? Why?
8. What will happen to bond prices if terrorism ended and the world’s nations unilaterally disarmed andadopted free trade policies? Why?
9. What will happen to bond prices if world peace brought substantially lower government budget deficits?
If you’ve already figured out that expected inflation will decrease bond prices, and increase bond yields, by both shift-ing the supply curve to the right and the demand curve to the left, as in Figure 5.6 below, kudos to you!
Expected inflation and bond prices
If you noticed that the response of bond prices and yields to a business cycle expansion is indeterminate, booya!As noted above, a boom shifts the bond supply curve to the right by inducing businesses to borrow and thustake advantage of the bonanza. Holding demand constant, that action reduces bond prices (raises the interestrate). But demand does not stay constant because economic expansion increases wealth, which increases de-mand for bonds (shifts the curve to the right), which in turn increases bond prices (reduces the interest rate).The net effect on the interest rate, therefore, depends on how much each curve shifts, as in Figure 5.7.
Business cycle expansion and bond prices
In reality, the first scenario is the one that usually wins out: during expansions, the interest rate usually rises, andduring recessions, it always falls. For example, the interest rate fell to very low levels during the Great Depres-sion and during Japan’s extended economic funk in the 1990s.[6]
CHAPTER 5 THE ECONOMICS OF INTEREST-RATE FLUCTUATIONS 57
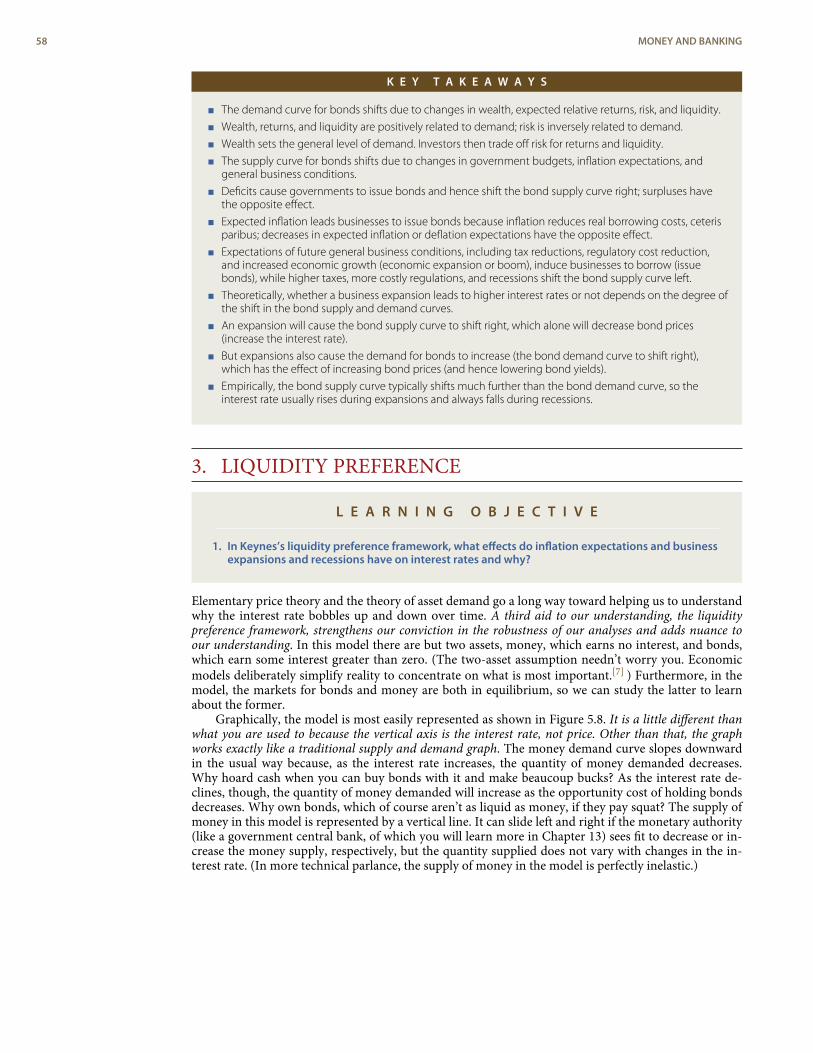
K E Y T A K E A W A Y S
< The demand curve for bonds shifts due to changes in wealth, expected relative returns, risk, and liquidity.
< Wealth, returns, and liquidity are positively related to demand; risk is inversely related to demand.
< Wealth sets the general level of demand. Investors then trade off risk for returns and liquidity.
< The supply curve for bonds shifts due to changes in government budgets, inflation expectations, andgeneral business conditions.
< Deficits cause governments to issue bonds and hence shift the bond supply curve right; surpluses havethe opposite effect.
< Expected inflation leads businesses to issue bonds because inflation reduces real borrowing costs, ceterisparibus; decreases in expected inflation or deflation expectations have the opposite effect.
< Expectations of future general business conditions, including tax reductions, regulatory cost reduction,and increased economic growth (economic expansion or boom), induce businesses to borrow (issuebonds), while higher taxes, more costly regulations, and recessions shift the bond supply curve left.
< Theoretically, whether a business expansion leads to higher interest rates or not depends on the degree ofthe shift in the bond supply and demand curves.
< An expansion will cause the bond supply curve to shift right, which alone will decrease bond prices(increase the interest rate).
< But expansions also cause the demand for bonds to increase (the bond demand curve to shift right),which has the effect of increasing bond prices (and hence lowering bond yields).
< Empirically, the bond supply curve typically shifts much further than the bond demand curve, so theinterest rate usually rises during expansions and always falls during recessions.
3. LIQUIDITY PREFERENCE
L E A R N I N G O B J E C T I V E
1. In Keynes’s liquidity preference framework, what effects do inflation expectations and businessexpansions and recessions have on interest rates and why?
Elementary price theory and the theory of asset demand go a long way toward helping us to understandwhy the interest rate bobbles up and down over time. A third aid to our understanding, the liquiditypreference framework, strengthens our conviction in the robustness of our analyses and adds nuance toour understanding. In this model there are but two assets, money, which earns no interest, and bonds,which earn some interest greater than zero. (The two-asset assumption needn’t worry you. Economicmodels deliberately simplify reality to concentrate on what is most important.[7] ) Furthermore, in themodel, the markets for bonds and money are both in equilibrium, so we can study the latter to learnabout the former.
Graphically, the model is most easily represented as shown in Figure 5.8. It is a little different thanwhat you are used to because the vertical axis is the interest rate, not price. Other than that, the graphworks exactly like a traditional supply and demand graph. The money demand curve slopes downwardin the usual way because, as the interest rate increases, the quantity of money demanded decreases.Why hoard cash when you can buy bonds with it and make beaucoup bucks? As the interest rate de-clines, though, the quantity of money demanded will increase as the opportunity cost of holding bondsdecreases. Why own bonds, which of course aren’t as liquid as money, if they pay squat? The supply ofmoney in this model is represented by a vertical line. It can slide left and right if the monetary authority(like a government central bank, of which you will learn more in Chapter 13) sees fit to decrease or in-crease the money supply, respectively, but the quantity supplied does not vary with changes in the in-terest rate. (In more technical parlance, the supply of money in the model is perfectly inelastic.)
58 MONEY AND BANKING
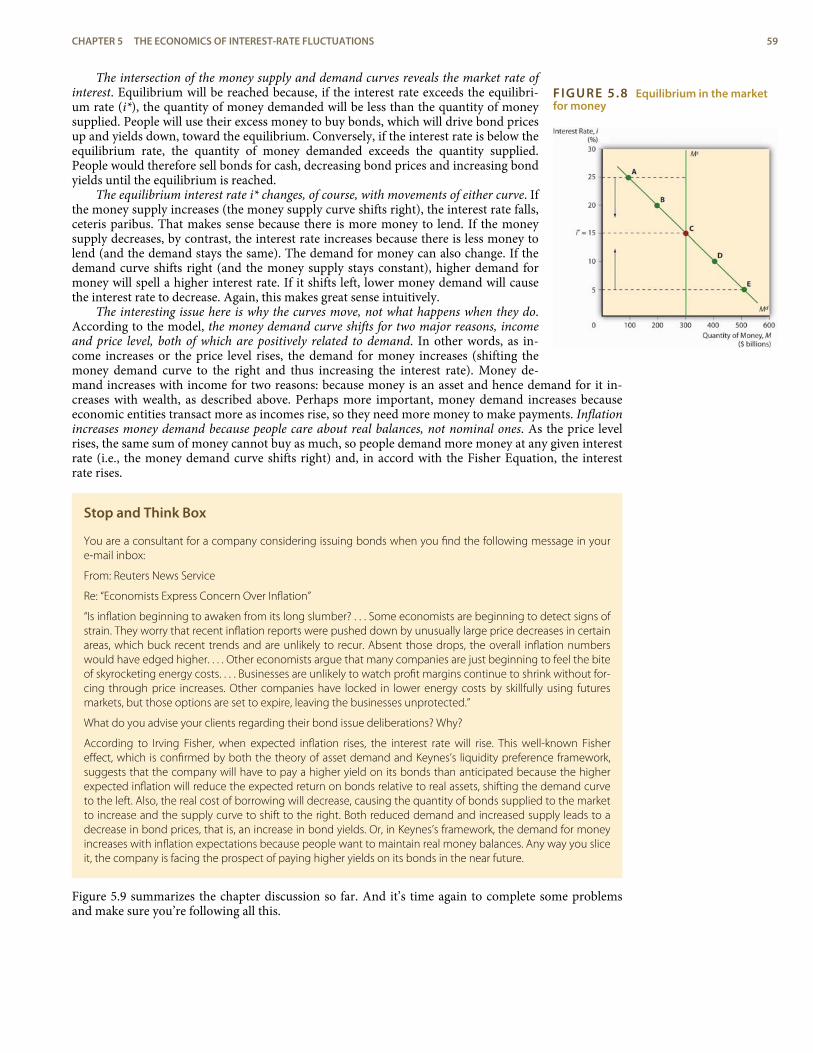
FIGURE 5.8 Equilibrium in the marketfor money
The intersection of the money supply and demand curves reveals the market rate ofinterest. Equilibrium will be reached because, if the interest rate exceeds the equilibri-um rate (i*), the quantity of money demanded will be less than the quantity of moneysupplied. People will use their excess money to buy bonds, which will drive bond pricesup and yields down, toward the equilibrium. Conversely, if the interest rate is below theequilibrium rate, the quantity of money demanded exceeds the quantity supplied.People would therefore sell bonds for cash, decreasing bond prices and increasing bondyields until the equilibrium is reached.
The equilibrium interest rate i* changes, of course, with movements of either curve. Ifthe money supply increases (the money supply curve shifts right), the interest rate falls,ceteris paribus. That makes sense because there is more money to lend. If the moneysupply decreases, by contrast, the interest rate increases because there is less money tolend (and the demand stays the same). The demand for money can also change. If thedemand curve shifts right (and the money supply stays constant), higher demand formoney will spell a higher interest rate. If it shifts left, lower money demand will causethe interest rate to decrease. Again, this makes great sense intuitively.
The interesting issue here is why the curves move, not what happens when they do.According to the model, the money demand curve shifts for two major reasons, incomeand price level, both of which are positively related to demand. In other words, as in-come increases or the price level rises, the demand for money increases (shifting themoney demand curve to the right and thus increasing the interest rate). Money de-mand increases with income for two reasons: because money is an asset and hence demand for it in-creases with wealth, as described above. Perhaps more important, money demand increases becauseeconomic entities transact more as incomes rise, so they need more money to make payments. Inflationincreases money demand because people care about real balances, not nominal ones. As the price levelrises, the same sum of money cannot buy as much, so people demand more money at any given interestrate (i.e., the money demand curve shifts right) and, in accord with the Fisher Equation, the interestrate rises.
Stop and Think Box
You are a consultant for a company considering issuing bonds when you find the following message in youre-mail inbox:
From: Reuters News Service
Re: “Economists Express Concern Over Inflation”
“Is inflation beginning to awaken from its long slumber? . . . Some economists are beginning to detect signs ofstrain. They worry that recent inflation reports were pushed down by unusually large price decreases in certainareas, which buck recent trends and are unlikely to recur. Absent those drops, the overall inflation numberswould have edged higher. . . . Other economists argue that many companies are just beginning to feel the biteof skyrocketing energy costs. . . . Businesses are unlikely to watch profit margins continue to shrink without for-cing through price increases. Other companies have locked in lower energy costs by skillfully using futuresmarkets, but those options are set to expire, leaving the businesses unprotected.”
What do you advise your clients regarding their bond issue deliberations? Why?
According to Irving Fisher, when expected inflation rises, the interest rate will rise. This well-known Fishereffect, which is confirmed by both the theory of asset demand and Keynes’s liquidity preference framework,suggests that the company will have to pay a higher yield on its bonds than anticipated because the higherexpected inflation will reduce the expected return on bonds relative to real assets, shifting the demand curveto the left. Also, the real cost of borrowing will decrease, causing the quantity of bonds supplied to the marketto increase and the supply curve to shift to the right. Both reduced demand and increased supply leads to adecrease in bond prices, that is, an increase in bond yields. Or, in Keynes’s framework, the demand for moneyincreases with inflation expectations because people want to maintain real money balances. Any way you sliceit, the company is facing the prospect of paying higher yields on its bonds in the near future.
Figure 5.9 summarizes the chapter discussion so far. And it’s time again to complete some problemsand make sure you’re following all this.
CHAPTER 5 THE ECONOMICS OF INTEREST-RATE FLUCTUATIONS 59
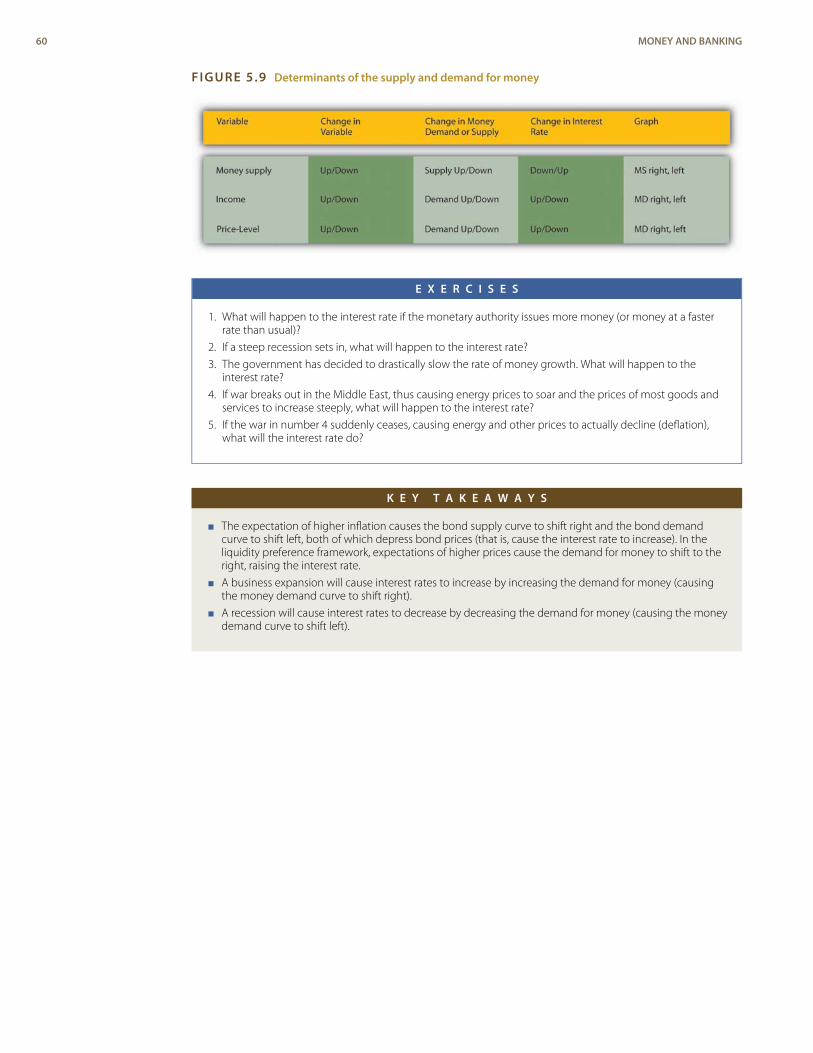
FIGURE 5.9 Determinants of the supply and demand for money
E X E R C I S E S
1. What will happen to the interest rate if the monetary authority issues more money (or money at a fasterrate than usual)?
2. If a steep recession sets in, what will happen to the interest rate?
3. The government has decided to drastically slow the rate of money growth. What will happen to theinterest rate?
4. If war breaks out in the Middle East, thus causing energy prices to soar and the prices of most goods andservices to increase steeply, what will happen to the interest rate?
5. If the war in number 4 suddenly ceases, causing energy and other prices to actually decline (deflation),what will the interest rate do?
K E Y T A K E A W A Y S
< The expectation of higher inflation causes the bond supply curve to shift right and the bond demandcurve to shift left, both of which depress bond prices (that is, cause the interest rate to increase). In theliquidity preference framework, expectations of higher prices cause the demand for money to shift to theright, raising the interest rate.
< A business expansion will cause interest rates to increase by increasing the demand for money (causingthe money demand curve to shift right).
< A recession will cause interest rates to decrease by decreasing the demand for money (causing the moneydemand curve to shift left).
60 MONEY AND BANKING
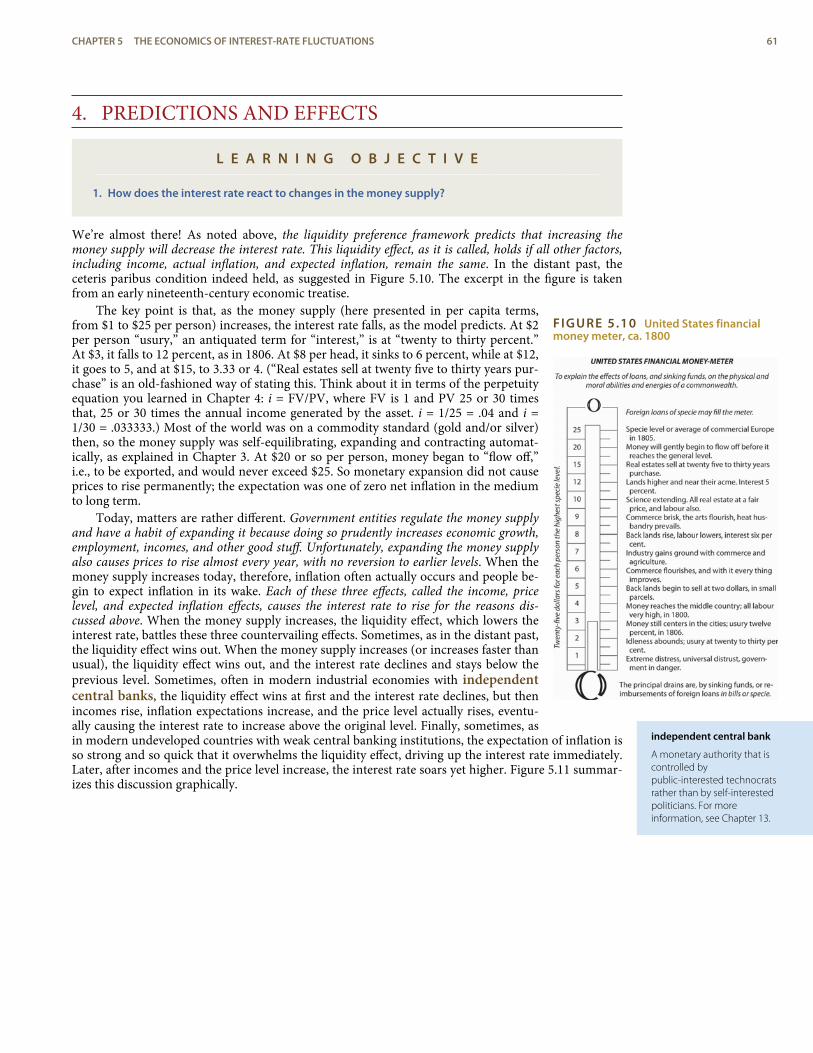
FIGURE 5.10 United States financialmoney meter, ca. 1800
independent central bank
A monetary authority that iscontrolled bypublic-interested technocratsrather than by self-interestedpoliticians. For moreinformation, see Chapter 13.
4. PREDICTIONS AND EFFECTS
L E A R N I N G O B J E C T I V E
1. How does the interest rate react to changes in the money supply?
We’re almost there! As noted above, the liquidity preference framework predicts that increasing themoney supply will decrease the interest rate. This liquidity effect, as it is called, holds if all other factors,including income, actual inflation, and expected inflation, remain the same. In the distant past, theceteris paribus condition indeed held, as suggested in Figure 5.10. The excerpt in the figure is takenfrom an early nineteenth-century economic treatise.
The key point is that, as the money supply (here presented in per capita terms,from $1 to $25 per person) increases, the interest rate falls, as the model predicts. At $2per person “usury,” an antiquated term for “interest,” is at “twenty to thirty percent.”At $3, it falls to 12 percent, as in 1806. At $8 per head, it sinks to 6 percent, while at $12,it goes to 5, and at $15, to 3.33 or 4. (“Real estates sell at twenty five to thirty years pur-chase” is an old-fashioned way of stating this. Think about it in terms of the perpetuityequation you learned in Chapter 4: i = FV/PV, where FV is 1 and PV 25 or 30 timesthat, 25 or 30 times the annual income generated by the asset. i = 1/25 = .04 and i =1/30 = .033333.) Most of the world was on a commodity standard (gold and/or silver)then, so the money supply was self-equilibrating, expanding and contracting automat-ically, as explained in Chapter 3. At $20 or so per person, money began to “flow off,”i.e., to be exported, and would never exceed $25. So monetary expansion did not causeprices to rise permanently; the expectation was one of zero net inflation in the mediumto long term.
Today, matters are rather different. Government entities regulate the money supplyand have a habit of expanding it because doing so prudently increases economic growth,employment, incomes, and other good stuff. Unfortunately, expanding the money supplyalso causes prices to rise almost every year, with no reversion to earlier levels. When themoney supply increases today, therefore, inflation often actually occurs and people be-gin to expect inflation in its wake. Each of these three effects, called the income, pricelevel, and expected inflation effects, causes the interest rate to rise for the reasons dis-cussed above. When the money supply increases, the liquidity effect, which lowers theinterest rate, battles these three countervailing effects. Sometimes, as in the distant past,the liquidity effect wins out. When the money supply increases (or increases faster thanusual), the liquidity effect wins out, and the interest rate declines and stays below theprevious level. Sometimes, often in modern industrial economies with independentcentral banks, the liquidity effect wins at first and the interest rate declines, but thenincomes rise, inflation expectations increase, and the price level actually rises, eventu-ally causing the interest rate to increase above the original level. Finally, sometimes, asin modern undeveloped countries with weak central banking institutions, the expectation of inflation isso strong and so quick that it overwhelms the liquidity effect, driving up the interest rate immediately.Later, after incomes and the price level increase, the interest rate soars yet higher. Figure 5.11 summar-izes this discussion graphically.
CHAPTER 5 THE ECONOMICS OF INTEREST-RATE FLUCTUATIONS 61
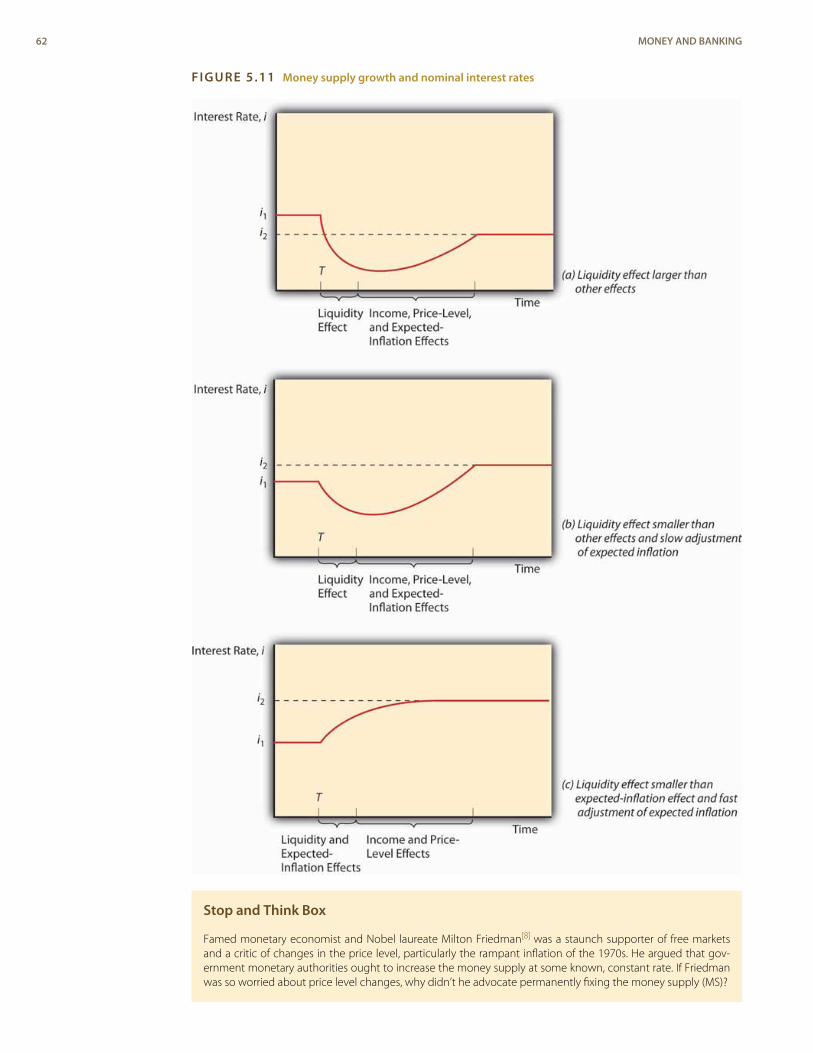
FIGURE 5.11 Money supply growth and nominal interest rates
Stop and Think Box
Famed monetary economist and Nobel laureate Milton Friedman[8] was a staunch supporter of free marketsand a critic of changes in the price level, particularly the rampant inflation of the 1970s. He argued that gov-ernment monetary authorities ought to increase the money supply at some known, constant rate. If Friedmanwas so worried about price level changes, why didn’t he advocate permanently fixing the money supply (MS)?
62 MONEY AND BANKING
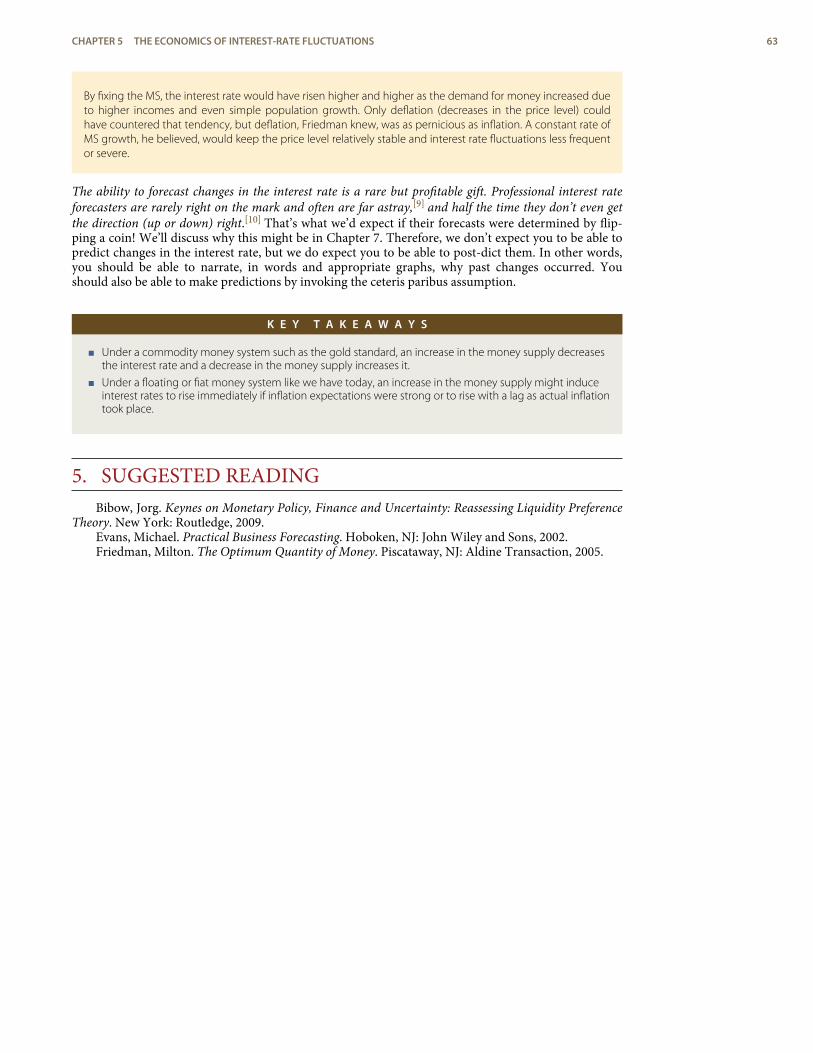
By fixing the MS, the interest rate would have risen higher and higher as the demand for money increased dueto higher incomes and even simple population growth. Only deflation (decreases in the price level) couldhave countered that tendency, but deflation, Friedman knew, was as pernicious as inflation. A constant rate ofMS growth, he believed, would keep the price level relatively stable and interest rate fluctuations less frequentor severe.
The ability to forecast changes in the interest rate is a rare but profitable gift. Professional interest rateforecasters are rarely right on the mark and often are far astray,[9] and half the time they don’t even getthe direction (up or down) right.[10] That’s what we’d expect if their forecasts were determined by flip-ping a coin! We’ll discuss why this might be in Chapter 7. Therefore, we don’t expect you to be able topredict changes in the interest rate, but we do expect you to be able to post-dict them. In other words,you should be able to narrate, in words and appropriate graphs, why past changes occurred. Youshould also be able to make predictions by invoking the ceteris paribus assumption.
K E Y T A K E A W A Y S
< Under a commodity money system such as the gold standard, an increase in the money supply decreasesthe interest rate and a decrease in the money supply increases it.
< Under a floating or fiat money system like we have today, an increase in the money supply might induceinterest rates to rise immediately if inflation expectations were strong or to rise with a lag as actual inflationtook place.
5. SUGGESTED READINGBibow, Jorg. Keynes on Monetary Policy, Finance and Uncertainty: Reassessing Liquidity Preference
Theory. New York: Routledge, 2009.Evans, Michael. Practical Business Forecasting. Hoboken, NJ: John Wiley and Sons, 2002.Friedman, Milton. The Optimum Quantity of Money. Piscataway, NJ: Aldine Transaction, 2005.
CHAPTER 5 THE ECONOMICS OF INTEREST-RATE FLUCTUATIONS 63

1.2.3.
4.
5.6.
7.8.9.
10.
ENDNOTES
http://www-history.mcs.st-andrews.ac.uk/Biographies/Keynes.html
http://www.margrabe.com/Dictionary/DictionaryAC.html#sectA
http://www.valuebasedmanagement.net/methods_capm.html;http://www.moneychimp.com/articles/valuation/capm.htm
http://moneyterms.co.uk/apt/
http://www.yodaspeak.co.uk/index.php
http://www.bloomberg.com/apps/news?pid=10000101&refer=japan&sid=a28sELjm9W04
http://en.wikipedia.org/wiki/Model_(economics)
www.hoover.org/bios/friedman
www.finpipe.com/intratgo.htm
taylorandfrancis.metapress.com/(vqspd445seikpajibz05ch45)/app/home/contribution.asp?referrer=parent&backto=issue,5,9;journal,15,86;linkingpublicationresults,1:100411,1
64 MONEY AND BANKING
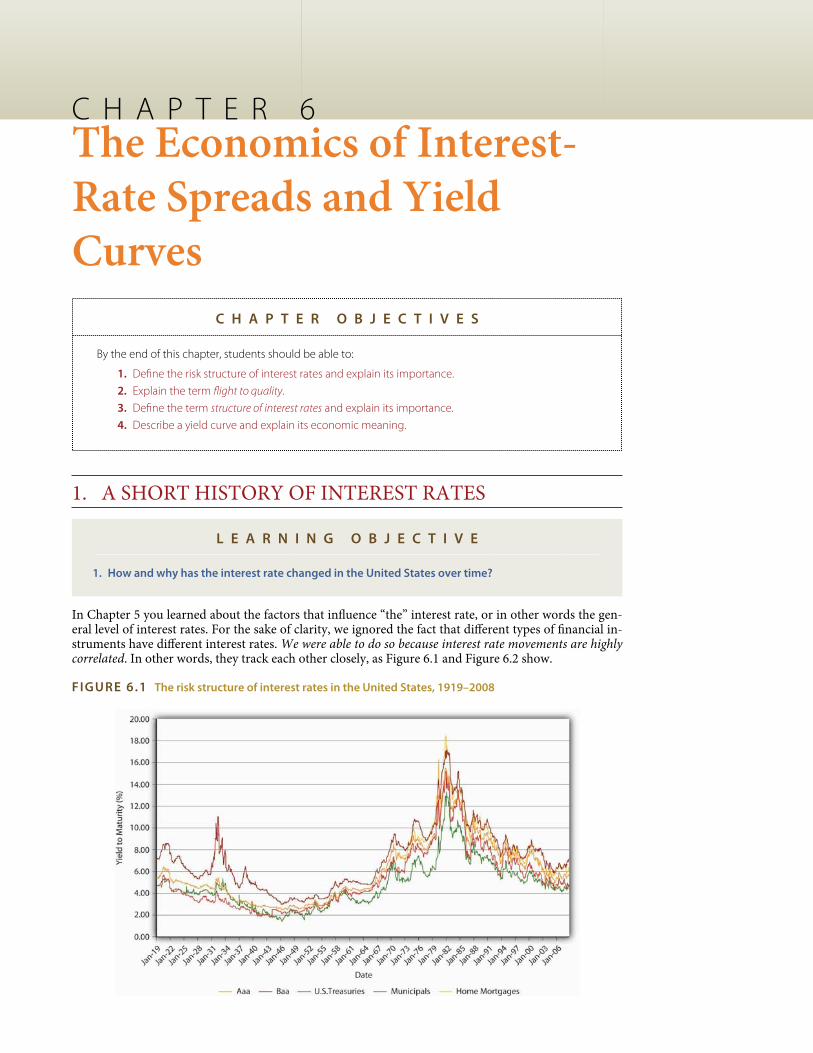
C H A P T E R 6The Economics of Interest-Rate Spreads and YieldCurves
C H A P T E R O B J E C T I V E S
By the end of this chapter, students should be able to:
1. Define the risk structure of interest rates and explain its importance.
2. Explain the term flight to quality.
3. Define the term structure of interest rates and explain its importance.
4. Describe a yield curve and explain its economic meaning.
1. A SHORT HISTORY OF INTEREST RATES
L E A R N I N G O B J E C T I V E
1. How and why has the interest rate changed in the United States over time?
In Chapter 5 you learned about the factors that influence “the” interest rate, or in other words the gen-eral level of interest rates. For the sake of clarity, we ignored the fact that different types of financial in-struments have different interest rates. We were able to do so because interest rate movements are highlycorrelated. In other words, they track each other closely, as Figure 6.1 and Figure 6.2 show.
FIGURE 6.1 The risk structure of interest rates in the United States, 1919–2008
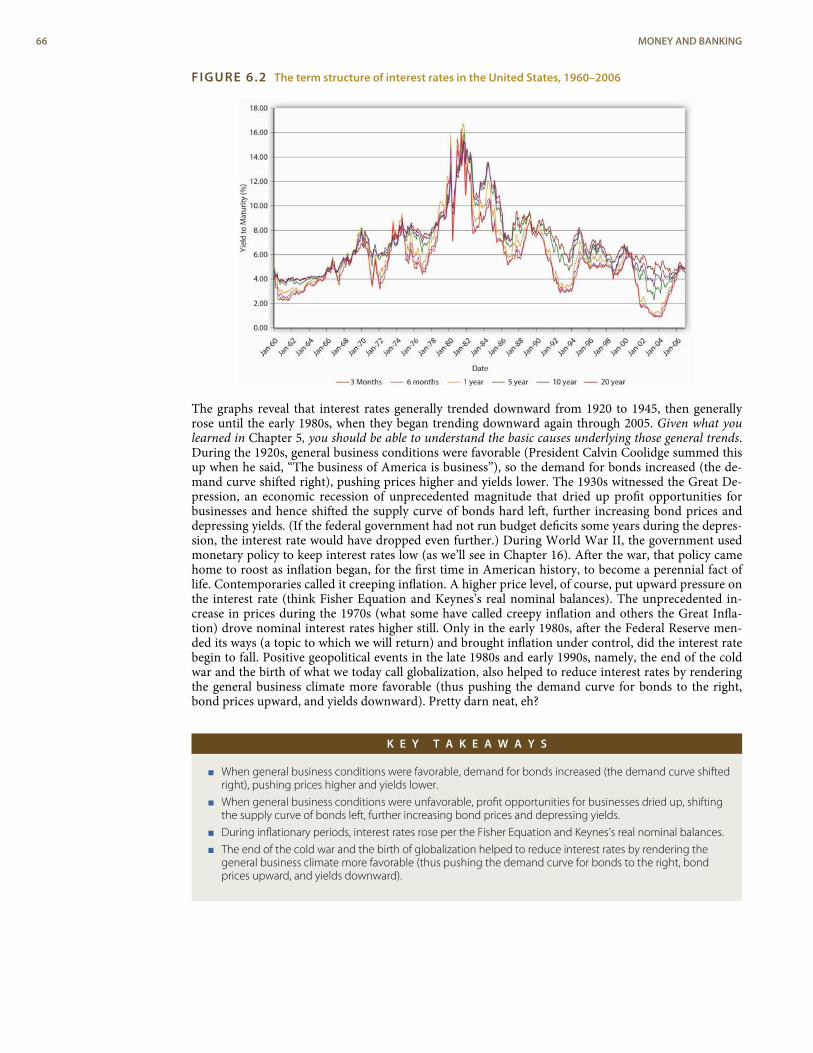
FIGURE 6.2 The term structure of interest rates in the United States, 1960–2006
The graphs reveal that interest rates generally trended downward from 1920 to 1945, then generallyrose until the early 1980s, when they began trending downward again through 2005. Given what youlearned in Chapter 5, you should be able to understand the basic causes underlying those general trends.During the 1920s, general business conditions were favorable (President Calvin Coolidge summed thisup when he said, “The business of America is business”), so the demand for bonds increased (the de-mand curve shifted right), pushing prices higher and yields lower. The 1930s witnessed the Great De-pression, an economic recession of unprecedented magnitude that dried up profit opportunities forbusinesses and hence shifted the supply curve of bonds hard left, further increasing bond prices anddepressing yields. (If the federal government had not run budget deficits some years during the depres-sion, the interest rate would have dropped even further.) During World War II, the government usedmonetary policy to keep interest rates low (as we’ll see in Chapter 16). After the war, that policy camehome to roost as inflation began, for the first time in American history, to become a perennial fact oflife. Contemporaries called it creeping inflation. A higher price level, of course, put upward pressure onthe interest rate (think Fisher Equation and Keynes’s real nominal balances). The unprecedented in-crease in prices during the 1970s (what some have called creepy inflation and others the Great Infla-tion) drove nominal interest rates higher still. Only in the early 1980s, after the Federal Reserve men-ded its ways (a topic to which we will return) and brought inflation under control, did the interest ratebegin to fall. Positive geopolitical events in the late 1980s and early 1990s, namely, the end of the coldwar and the birth of what we today call globalization, also helped to reduce interest rates by renderingthe general business climate more favorable (thus pushing the demand curve for bonds to the right,bond prices upward, and yields downward). Pretty darn neat, eh?
K E Y T A K E A W A Y S
< When general business conditions were favorable, demand for bonds increased (the demand curve shiftedright), pushing prices higher and yields lower.
< When general business conditions were unfavorable, profit opportunities for businesses dried up, shiftingthe supply curve of bonds left, further increasing bond prices and depressing yields.
< During inflationary periods, interest rates rose per the Fisher Equation and Keynes’s real nominal balances.
< The end of the cold war and the birth of globalization helped to reduce interest rates by rendering thegeneral business climate more favorable (thus pushing the demand curve for bonds to the right, bondprices upward, and yields downward).
66 MONEY AND BANKING
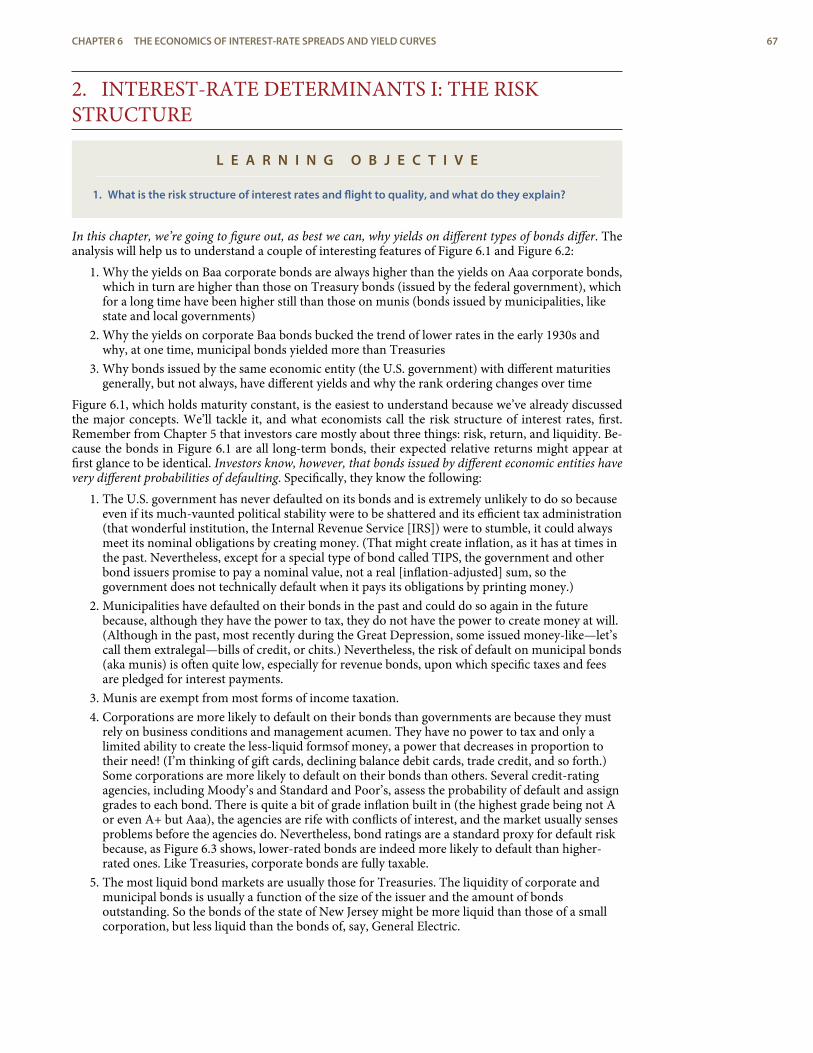
2. INTEREST-RATE DETERMINANTS I: THE RISKSTRUCTURE
L E A R N I N G O B J E C T I V E
1. What is the risk structure of interest rates and flight to quality, and what do they explain?
In this chapter, we’re going to figure out, as best we can, why yields on different types of bonds differ. Theanalysis will help us to understand a couple of interesting features of Figure 6.1 and Figure 6.2:
1. Why the yields on Baa corporate bonds are always higher than the yields on Aaa corporate bonds,which in turn are higher than those on Treasury bonds (issued by the federal government), whichfor a long time have been higher still than those on munis (bonds issued by municipalities, likestate and local governments)
2. Why the yields on corporate Baa bonds bucked the trend of lower rates in the early 1930s andwhy, at one time, municipal bonds yielded more than Treasuries
3. Why bonds issued by the same economic entity (the U.S. government) with different maturitiesgenerally, but not always, have different yields and why the rank ordering changes over time
Figure 6.1, which holds maturity constant, is the easiest to understand because we’ve already discussedthe major concepts. We’ll tackle it, and what economists call the risk structure of interest rates, first.Remember from Chapter 5 that investors care mostly about three things: risk, return, and liquidity. Be-cause the bonds in Figure 6.1 are all long-term bonds, their expected relative returns might appear atfirst glance to be identical. Investors know, however, that bonds issued by different economic entities havevery different probabilities of defaulting. Specifically, they know the following:
1. The U.S. government has never defaulted on its bonds and is extremely unlikely to do so becauseeven if its much-vaunted political stability were to be shattered and its efficient tax administration(that wonderful institution, the Internal Revenue Service [IRS]) were to stumble, it could alwaysmeet its nominal obligations by creating money. (That might create inflation, as it has at times inthe past. Nevertheless, except for a special type of bond called TIPS, the government and otherbond issuers promise to pay a nominal value, not a real [inflation-adjusted] sum, so thegovernment does not technically default when it pays its obligations by printing money.)
2. Municipalities have defaulted on their bonds in the past and could do so again in the futurebecause, although they have the power to tax, they do not have the power to create money at will.(Although in the past, most recently during the Great Depression, some issued money-like—let’scall them extralegal—bills of credit, or chits.) Nevertheless, the risk of default on municipal bonds(aka munis) is often quite low, especially for revenue bonds, upon which specific taxes and feesare pledged for interest payments.
3. Munis are exempt from most forms of income taxation.4. Corporations are more likely to default on their bonds than governments are because they must
rely on business conditions and management acumen. They have no power to tax and only alimited ability to create the less-liquid formsof money, a power that decreases in proportion totheir need! (I’m thinking of gift cards, declining balance debit cards, trade credit, and so forth.)Some corporations are more likely to default on their bonds than others. Several credit-ratingagencies, including Moody’s and Standard and Poor’s, assess the probability of default and assigngrades to each bond. There is quite a bit of grade inflation built in (the highest grade being not Aor even A+ but Aaa), the agencies are rife with conflicts of interest, and the market usually sensesproblems before the agencies do. Nevertheless, bond ratings are a standard proxy for default riskbecause, as Figure 6.3 shows, lower-rated bonds are indeed more likely to default than higher-rated ones. Like Treasuries, corporate bonds are fully taxable.
5. The most liquid bond markets are usually those for Treasuries. The liquidity of corporate andmunicipal bonds is usually a function of the size of the issuer and the amount of bondsoutstanding. So the bonds of the state of New Jersey might be more liquid than those of a smallcorporation, but less liquid than the bonds of, say, General Electric.
CHAPTER 6 THE ECONOMICS OF INTEREST-RATE SPREADS AND YIELD CURVES 67
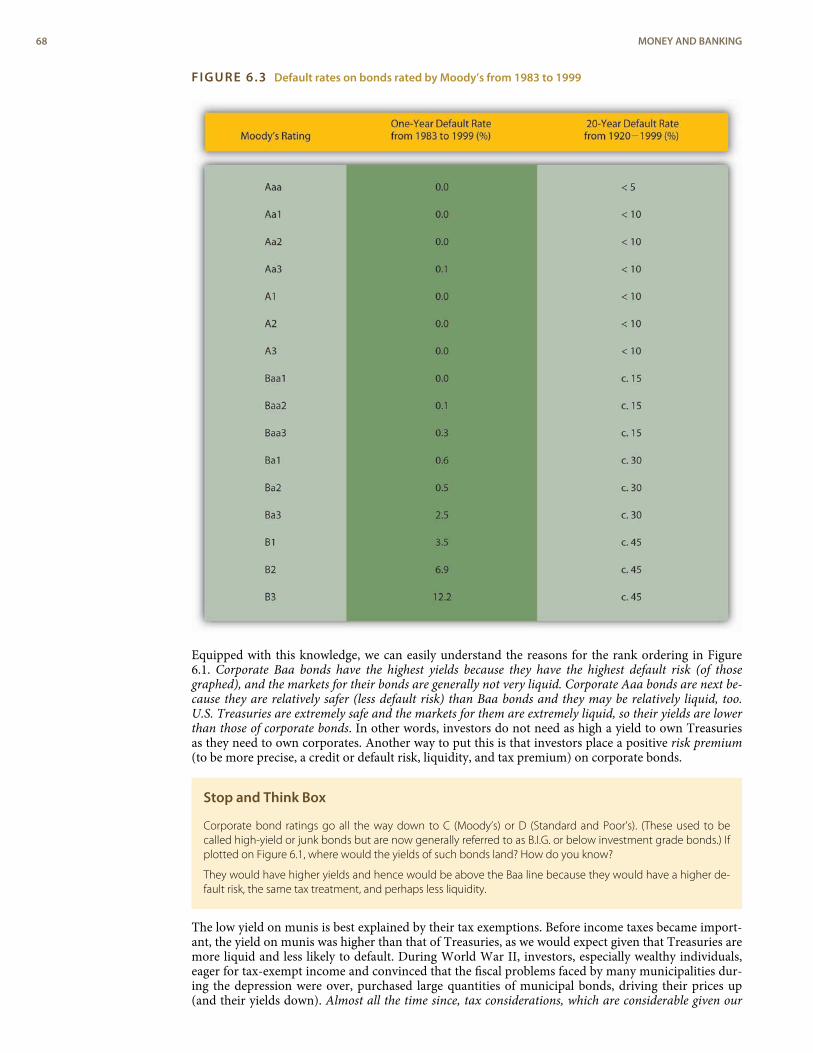
FIGURE 6.3 Default rates on bonds rated by Moody’s from 1983 to 1999
Equipped with this knowledge, we can easily understand the reasons for the rank ordering in Figure6.1. Corporate Baa bonds have the highest yields because they have the highest default risk (of thosegraphed), and the markets for their bonds are generally not very liquid. Corporate Aaa bonds are next be-cause they are relatively safer (less default risk) than Baa bonds and they may be relatively liquid, too.U.S. Treasuries are extremely safe and the markets for them are extremely liquid, so their yields are lowerthan those of corporate bonds. In other words, investors do not need as high a yield to own Treasuriesas they need to own corporates. Another way to put this is that investors place a positive risk premium(to be more precise, a credit or default risk, liquidity, and tax premium) on corporate bonds.
Stop and Think Box
Corporate bond ratings go all the way down to C (Moody’s) or D (Standard and Poor’s). (These used to becalled high-yield or junk bonds but are now generally referred to as B.I.G. or below investment grade bonds.) Ifplotted on Figure 6.1, where would the yields of such bonds land? How do you know?
They would have higher yields and hence would be above the Baa line because they would have a higher de-fault risk, the same tax treatment, and perhaps less liquidity.
The low yield on munis is best explained by their tax exemptions. Before income taxes became import-ant, the yield on munis was higher than that of Treasuries, as we would expect given that Treasuries aremore liquid and less likely to default. During World War II, investors, especially wealthy individuals,eager for tax-exempt income and convinced that the fiscal problems faced by many municipalities dur-ing the depression were over, purchased large quantities of municipal bonds, driving their prices up(and their yields down). Almost all the time since, tax considerations, which are considerable given our
68 MONEY AND BANKING
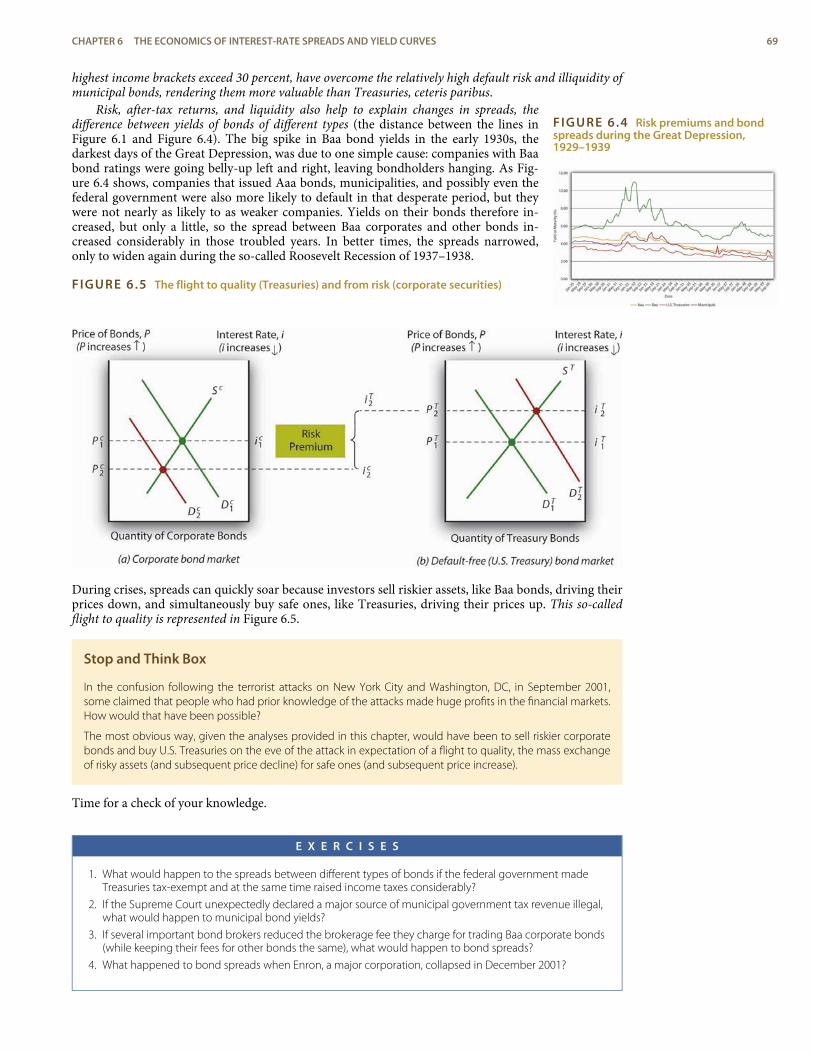
FIGURE 6.4 Risk premiums and bondspreads during the Great Depression,1929–1939
highest income brackets exceed 30 percent, have overcome the relatively high default risk and illiquidity ofmunicipal bonds, rendering them more valuable than Treasuries, ceteris paribus.
Risk, after-tax returns, and liquidity also help to explain changes in spreads, thedifference between yields of bonds of different types (the distance between the lines inFigure 6.1 and Figure 6.4). The big spike in Baa bond yields in the early 1930s, thedarkest days of the Great Depression, was due to one simple cause: companies with Baabond ratings were going belly-up left and right, leaving bondholders hanging. As Fig-ure 6.4 shows, companies that issued Aaa bonds, municipalities, and possibly even thefederal government were also more likely to default in that desperate period, but theywere not nearly as likely to as weaker companies. Yields on their bonds therefore in-creased, but only a little, so the spread between Baa corporates and other bonds in-creased considerably in those troubled years. In better times, the spreads narrowed,only to widen again during the so-called Roosevelt Recession of 1937–1938.
FIGURE 6.5 The flight to quality (Treasuries) and from risk (corporate securities)
During crises, spreads can quickly soar because investors sell riskier assets, like Baa bonds, driving theirprices down, and simultaneously buy safe ones, like Treasuries, driving their prices up. This so-calledflight to quality is represented in Figure 6.5.
Stop and Think Box
In the confusion following the terrorist attacks on New York City and Washington, DC, in September 2001,some claimed that people who had prior knowledge of the attacks made huge profits in the financial markets.How would that have been possible?
The most obvious way, given the analyses provided in this chapter, would have been to sell riskier corporatebonds and buy U.S. Treasuries on the eve of the attack in expectation of a flight to quality, the mass exchangeof risky assets (and subsequent price decline) for safe ones (and subsequent price increase).
Time for a check of your knowledge.
E X E R C I S E S
1. What would happen to the spreads between different types of bonds if the federal government madeTreasuries tax-exempt and at the same time raised income taxes considerably?
2. If the Supreme Court unexpectedly declared a major source of municipal government tax revenue illegal,what would happen to municipal bond yields?
3. If several important bond brokers reduced the brokerage fee they charge for trading Baa corporate bonds(while keeping their fees for other bonds the same), what would happen to bond spreads?
4. What happened to bond spreads when Enron, a major corporation, collapsed in December 2001?
CHAPTER 6 THE ECONOMICS OF INTEREST-RATE SPREADS AND YIELD CURVES 69
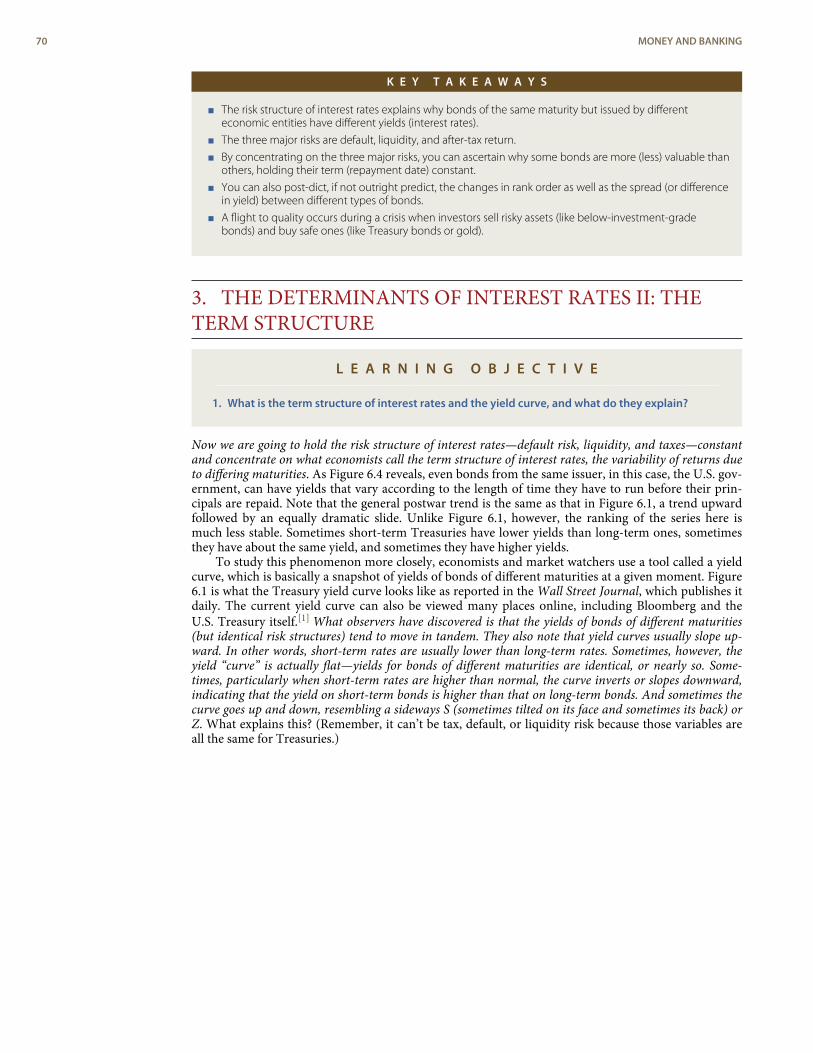
K E Y T A K E A W A Y S
< The risk structure of interest rates explains why bonds of the same maturity but issued by differenteconomic entities have different yields (interest rates).
< The three major risks are default, liquidity, and after-tax return.
< By concentrating on the three major risks, you can ascertain why some bonds are more (less) valuable thanothers, holding their term (repayment date) constant.
< You can also post-dict, if not outright predict, the changes in rank order as well as the spread (or differencein yield) between different types of bonds.
< A flight to quality occurs during a crisis when investors sell risky assets (like below-investment-gradebonds) and buy safe ones (like Treasury bonds or gold).
3. THE DETERMINANTS OF INTEREST RATES II: THETERM STRUCTURE
L E A R N I N G O B J E C T I V E
1. What is the term structure of interest rates and the yield curve, and what do they explain?
Now we are going to hold the risk structure of interest rates—default risk, liquidity, and taxes—constantand concentrate on what economists call the term structure of interest rates, the variability of returns dueto differing maturities. As Figure 6.4 reveals, even bonds from the same issuer, in this case, the U.S. gov-ernment, can have yields that vary according to the length of time they have to run before their prin-cipals are repaid. Note that the general postwar trend is the same as that in Figure 6.1, a trend upwardfollowed by an equally dramatic slide. Unlike Figure 6.1, however, the ranking of the series here ismuch less stable. Sometimes short-term Treasuries have lower yields than long-term ones, sometimesthey have about the same yield, and sometimes they have higher yields.
To study this phenomenon more closely, economists and market watchers use a tool called a yieldcurve, which is basically a snapshot of yields of bonds of different maturities at a given moment. Figure6.1 is what the Treasury yield curve looks like as reported in the Wall Street Journal, which publishes itdaily. The current yield curve can also be viewed many places online, including Bloomberg and theU.S. Treasury itself.[1] What observers have discovered is that the yields of bonds of different maturities(but identical risk structures) tend to move in tandem. They also note that yield curves usually slope up-ward. In other words, short-term rates are usually lower than long-term rates. Sometimes, however, theyield “curve” is actually flat—yields for bonds of different maturities are identical, or nearly so. Some-times, particularly when short-term rates are higher than normal, the curve inverts or slopes downward,indicating that the yield on short-term bonds is higher than that on long-term bonds. And sometimes thecurve goes up and down, resembling a sideways S (sometimes tilted on its face and sometimes its back) orZ. What explains this? (Remember, it can’t be tax, default, or liquidity risk because those variables areall the same for Treasuries.)
70 MONEY AND BANKING
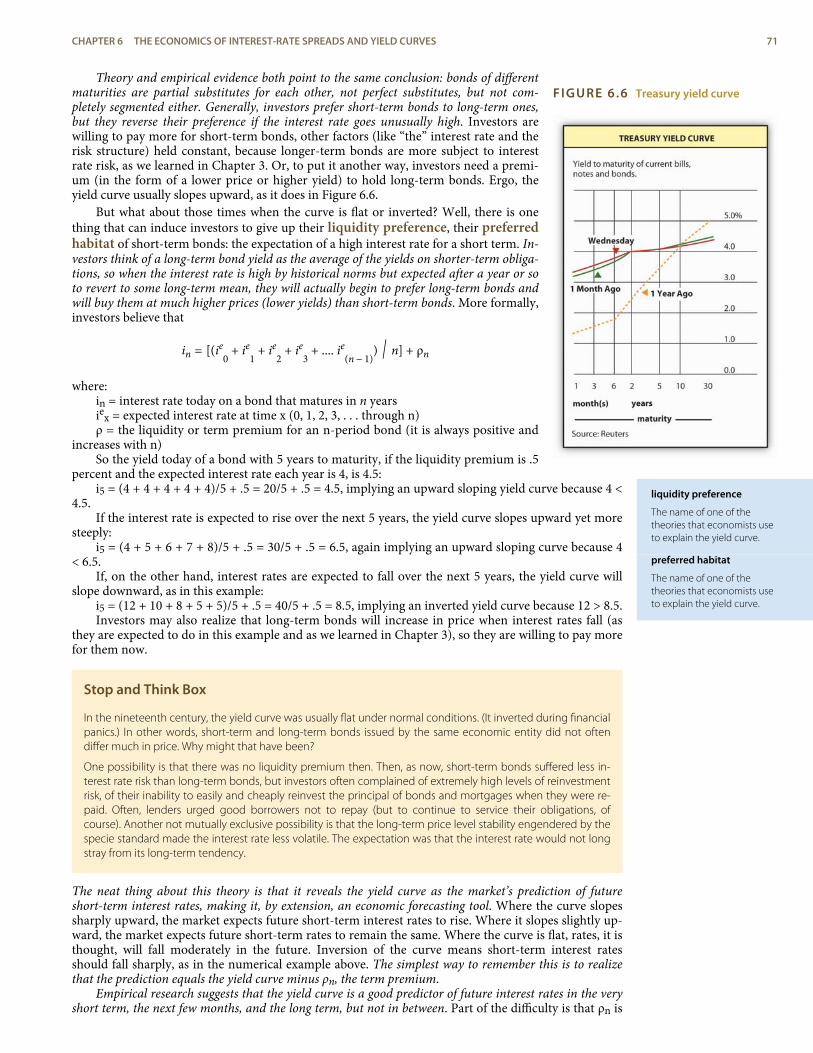
FIGURE 6.6 Treasury yield curve
liquidity preference
The name of one of thetheories that economists useto explain the yield curve.
preferred habitat
The name of one of thetheories that economists useto explain the yield curve.
Theory and empirical evidence both point to the same conclusion: bonds of differentmaturities are partial substitutes for each other, not perfect substitutes, but not com-pletely segmented either. Generally, investors prefer short-term bonds to long-term ones,but they reverse their preference if the interest rate goes unusually high. Investors arewilling to pay more for short-term bonds, other factors (like “the” interest rate and therisk structure) held constant, because longer-term bonds are more subject to interestrate risk, as we learned in Chapter 3. Or, to put it another way, investors need a premi-um (in the form of a lower price or higher yield) to hold long-term bonds. Ergo, theyield curve usually slopes upward, as it does in Figure 6.6.
But what about those times when the curve is flat or inverted? Well, there is onething that can induce investors to give up their liquidity preference, their preferredhabitat of short-term bonds: the expectation of a high interest rate for a short term. In-vestors think of a long-term bond yield as the average of the yields on shorter-term obliga-tions, so when the interest rate is high by historical norms but expected after a year or soto revert to some long-term mean, they will actually begin to prefer long-term bonds andwill buy them at much higher prices (lower yields) than short-term bonds. More formally,investors believe that
in = [(ie0
+ ie1
+ ie2
+ ie3
+ .... ie(n − 1)
) / n] + ρn
where:in = interest rate today on a bond that matures in n yearsiex = expected interest rate at time x (0, 1, 2, 3, . . . through n)ρ = the liquidity or term premium for an n-period bond (it is always positive and
increases with n)So the yield today of a bond with 5 years to maturity, if the liquidity premium is .5
percent and the expected interest rate each year is 4, is 4.5:i5 = (4 + 4 + 4 + 4 + 4)/5 + .5 = 20/5 + .5 = 4.5, implying an upward sloping yield curve because 4 <
4.5.If the interest rate is expected to rise over the next 5 years, the yield curve slopes upward yet more
steeply:i5 = (4 + 5 + 6 + 7 + 8)/5 + .5 = 30/5 + .5 = 6.5, again implying an upward sloping curve because 4
< 6.5.If, on the other hand, interest rates are expected to fall over the next 5 years, the yield curve will
slope downward, as in this example:i5 = (12 + 10 + 8 + 5 + 5)/5 + .5 = 40/5 + .5 = 8.5, implying an inverted yield curve because 12 > 8.5.Investors may also realize that long-term bonds will increase in price when interest rates fall (as
they are expected to do in this example and as we learned in Chapter 3), so they are willing to pay morefor them now.
Stop and Think Box
In the nineteenth century, the yield curve was usually flat under normal conditions. (It inverted during financialpanics.) In other words, short-term and long-term bonds issued by the same economic entity did not oftendiffer much in price. Why might that have been?
One possibility is that there was no liquidity premium then. Then, as now, short-term bonds suffered less in-terest rate risk than long-term bonds, but investors often complained of extremely high levels of reinvestmentrisk, of their inability to easily and cheaply reinvest the principal of bonds and mortgages when they were re-paid. Often, lenders urged good borrowers not to repay (but to continue to service their obligations, ofcourse). Another not mutually exclusive possibility is that the long-term price level stability engendered by thespecie standard made the interest rate less volatile. The expectation was that the interest rate would not longstray from its long-term tendency.
The neat thing about this theory is that it reveals the yield curve as the market’s prediction of futureshort-term interest rates, making it, by extension, an economic forecasting tool. Where the curve slopessharply upward, the market expects future short-term interest rates to rise. Where it slopes slightly up-ward, the market expects future short-term rates to remain the same. Where the curve is flat, rates, it isthought, will fall moderately in the future. Inversion of the curve means short-term interest ratesshould fall sharply, as in the numerical example above. The simplest way to remember this is to realizethat the prediction equals the yield curve minus ρn, the term premium.
Empirical research suggests that the yield curve is a good predictor of future interest rates in the veryshort term, the next few months, and the long term, but not in between. Part of the difficulty is that ρn is
CHAPTER 6 THE ECONOMICS OF INTEREST-RATE SPREADS AND YIELD CURVES 71
not well understood nor is it easily observable. It may change over time and/or not increase much fromone maturity to the next on the short end of the curve. Nevertheless, economic forecasters use the yieldcurve to make predictions about inflation and the business cycle. A flat or inverted curve, for instance,portends lower short-term interest rates in the future, which is consistent with a recession but also withlower inflation rates, as we learned in Chapter 5. A curve sloped steeply upward, by contrast, portendshigher future interest rates, which might be brought about by an increase in inflation rates or an eco-nomic boom.
Time once again to ensure that we’re on the same page, er, Web site.
E X E R C I S E S
1. What does the following yield curve tell us?Treasury yield curve for January 20, 2006.
Maturity Yield (%)
1 month 3.95
3 months 4.35
6 months 4.48
1 year 4.44
2 years 4.37
3 years 4.32
5 years 4.31
7 years 4.32
10 years 4.37
20 years 4.59
2. What does the following yield curve predict?Treasury yield curve for July 31, 2000.
Maturity Yield (%)
1 month
3 months 6.20
6 months 6.35
1 year
2 years 6.30
3 years 6.30
5 years 6.15
7 years
10 years 6.03
30 years 5.78
K E Y T A K E A W A Y S
< The term structure of interest rates explains why bonds issued by the same economic entity but of differentmaturities sometimes have different yields.
< Plotting yield against maturity produces an important analytical tool called the yield curve.
< The yield curve is a snapshot of the term structure of interest rates created by plotting yield againstmaturity for a single class of bonds, like Treasuries or munis, which reveals the market’s prediction of futureshort-term interest rates, and thus, by extension, can be used to make inferences about inflation andbusiness cycle expectations.
72 MONEY AND BANKING
4. SUGGESTED READINGChoudry, Moorad. Analysing and Interpreting the Yield Curve. Hoboken, NJ: John Wiley and Sons,
2004.Fabozzi, Frank. Interest Rate, Term Structure, and Valuation Modeling. Hoboken, NJ: John Wiley
and Sons, 2002.Fabozzi, Frank, Steven Mann, and Moorad Choudry. Measuring and Controlling Interest Rate and
Credit Risk. Hoboken, NJ: John Wiley and Sons, 2003.Homer, Sidney, and Richard E. Sylla. A History of Interest Rates, 4th ed. Hoboken, NJ: John Wiley
and Sons, 2005.
CHAPTER 6 THE ECONOMICS OF INTEREST-RATE SPREADS AND YIELD CURVES 73

1.
ENDNOTES
www.bloomberg.com/markets/rates/index.html;
http://www.ustreas.gov/offices/domestic-finance/debt-management/interest-rate/yield.shtml
74 MONEY AND BANKING
market volatility
In this context, frequentchanges in securities prices.
rational expectations
An economic theory thatposits that marketparticipants, in this caseinvestors, input all availablerelevant information into thebest forecasting modelavailable.
economic fundamentals
Key variables in the pricing ofassets. They include expectedinflation, interest, default, andearnings rates.
investors
Participants in financialmarkets; purchasers offinancial securities.
C H A P T E R 7Rational Expectations,Efficient Markets, and theValuation of CorporateEquities
C H A P T E R O B J E C T I V E S
By the end of this chapter, students should be able to:
1. Explain when expectations are rational and when they are irrational.
2. Explain how corporate equities (stocks, shares of a corporation) are valued.
3. Explain what is meant by the term market efficiency.
4. Describe the ways in which financial markets are efficient.
5. Describe the ways in which financial markets are inefficient.
1. THE THEORY OF RATIONAL EXPECTATIONS
L E A R N I N G O B J E C T I V E
1. When are expectations rational and when are they irrational?
Market volatility, the constantly changing prices of financial instruments,[1] tricks some people intothinking that financial markets, especially stock markets, are flim-flams or gigantic roulette wheels.Stock prices, they suspect, are at best random and at worst rigged. In fact, financial markets are moreefficient, and hence fairer, than other markets. The direction of price movements (up or down) is indeedrandom, but price levels are based on the rational expectations of a large number of market parti-cipants. While financial scams certainly exist, the stock and bond markets are not rigged. Except per-haps for some penny stocks, securities prices are usually based on economic fundamentals and arenot systematically manipulated by insiders or conspirators. Investing in corporate equities certainly en-tails risk, but it is not akin to playing the lottery. Luck can play a role in investing, as in anything in life,but unlike a Powerball drawing, Lady Luck is not the whole of the game by a long shot. Far from beinggamblers, investors are switches in the most advanced computing devices in the history of the world,financial markets. Prices in those markets help to determine what gets made and what doesn’t, howmuch gets produced and how, and where and how those goods are sold.
Financial markets, in the world’s most economically advanced countries anyway, have been ration-al and efficient decision-making machines for many centuries. In 1688, a broker in Amsterdam, Neth-erlands, named Joseph de la Vega, left posterity with vivid descriptions of the Dutch securities mar-ket.[2] The market, he claimed, was just a game of misinformation and spin management that pittedbulls (those who profited from an increase in prices) against bears (those who profited from a decreasein prices):
model
In this context, a theory aboutthe most accurate way toprice securities or to estimatethe value of future variablessuch as interest rates, risk,earnings, and otherfundamentals.
gold
At one time, gold was money,that is, the unit of accountagainst which the value of allgoods was measured. It isnow just a precious metalthat trades on world marketslike other commodities, itsprice rising and falling withshifts in supply and demand.
zero coupon bond
A discount bond that pays nocoupon or interest. Theinterest is earned by thedifference between thebond”s face or par value andthe price at which it is sold.
inside information
Information relevant to thevaluation of stock or othersecurity and known only to asmall group of people.
“The bulls are like the giraffe which is scared by nothing. . . . They love everything, they praiseeverything, they exaggerate everything. . . . The bulls make the public believe that their tricks signifywealth and that crops grow on graves. When attacked by serpents, they . . . regard them as both adelicate and a delicious meal. . . . They are not impressed by a fire nor perturbed by a debacle. . . .The bears, on the contrary, are completely ruled by fear, trepidation, and nervousness. Rabbitsbecome elephants, brawls in a tavern become rebellions, faint shadows appear to them as signs ofchaos. . . . What is there miraculous about the likelihood that every dwarf will become a giant in theeyes of the bears?”[3]
Joseph de la Vega went on to detail a dozen different ways in which cabals of bears and herds ofbulls tried to influence securities prices. The net effect of such machinations, though, was unclear. So-metimes the bulls won, sometimes the bears won, but their activities often canceled each other out.“Numerous brokers are inexhaustible in inventing involved maneuvers,” de la Vega explained, “but forjust this reason do not achieve their purposes.” Systematic manipulation of the market was impossiblebecause the bulls and bears competed against each other, each tugging at the price, but ultimately invain. Also, as rational investors learned the tricks of trading, they came to expect hyperbole, false ru-mors, sham sales, and the like. So, in the final analysis, market fundamentals, not the whims of nefari-ous individuals, determined prices. Exactly the same could be said of most of today’s securities mar-kets. Generally speaking, stock and other securities prices fluctuate due to genuine changes in supply ordemand, not because of the machinations of bulls and bears.
Joseph de la Vega’s 300+-year-old description of what was then the world’s most advanced securit-ies market also made clear that expectations, rather than actualities, moved prices. “The expectation ofan event,” he noted, “creates a much deeper impression upon the exchange than the event itself.” Asnoted in the preceding chapters, expectations are still paramount today. People invest based on whatthey believe the future will bring, not on what the present brings or the past has wrought, though theyoften look to the present and past (sometimes even the distant past) for clues about the future.
Rational expectations theory posits that investor expectations will be the best guess of the futureusing all available information. Expectations do not have to be correct to be rational; they just have tomake logical sense given what is known at any particular moment. An expectation would be irrationalif it did not logically follow from what is known or if it ignored available information. For the formerreason, investors expend considerable sums on schooling, books, lectures, seminars, and the like, tolearn the best ways to reason correctly given certain types of information. (This textbook and courseare a good start, but competition for the best model is keen. Investment models and strategies con-stantly morph, adapting to changes in the real world.) For the latter reason, investors update their ex-pectations, or forecasts, with great frequency, as new information becomes available, which occurs ba-sically 24/7/365.
If everyone’s expectations are rational, then why don’t investors agree on how much assets areworth? One investor may think gold a steal at $900/ounce, while another wouldn’t touch the stuff for apenny over $750. One investor might think $943.40 just right for a zero coupon bond, but anothermight think it a good deal only at $942.51. One may think that XYZ stock is overpriced at $22.57 ashare, while another would buy a small quantity of it at that price, and yet another would buy all shecould at that price. Such differences in valuation are important because they allow trades to occur by in-ducing some investors to sell and others to buy.
As it turns out, investors sometimes have different sets of information available to them. Some in-vestors may have inside information, news that is unknown outside a small circle. Others may lackcertain types of information because they think it is too costly to obtain. Other times, investors think ofthe information they know in common differently because their utility functions (their goals and aspira-tions, if you will) differ. So they have different time horizons, different holding periods, and differentsensitivities to risk.
76 MONEY AND BANKING
valuation models
Theories of securities pricesand their determinants.
asset bubble
In this context, a rapidincrease in asset prices that isnot easily justified byfundamentals like expectedearnings, interest rates, andthe like.
At yet other times, investors use different valuation models, different theories of how to predictfundamentals most accurately and how those fundamentals determine securities prices. For example,some investors foresee long causal chains more clearly than other investors do. Recall from Chapter 5that the demand for asset X is partly a function of its expected return relative to all assets not-X. So in-vestors must consider information directly related to asset X and all other assets. A new piece of in-formation half a world away that alters expectations about a nation’s ability to repay its debts, a sector’sfuture prospects, or a single company’s profits regularly ripples through the entire financial world.Ripple indeed evokes the right metaphor. Like throwing a pebble into a pond, the disruption is greatestat the epicenter, the spot where the rock hits the water, but it dissipates over time and space. The biggerthe pebble (the bigger the news), the bigger the splash and the larger and longer lasting the disruption.Most days, the world’s financial pond is pelted with millions of little pebbles, little pieces of news thatcause prices to jiggle up and down. Every now and again, a big stone, even a boulder, hits the pond,causing significant price changes throughout the pond for quite a long time. (Economists call suchboulders shocks, and they include financial crises like that of 2007–2008. Financial crises almost alwaysfollow asset bubbles, which we will discuss in more detail below.)
Some investors understand the effect of some ripples more quickly and clearly than others. Thisshouldn’t be taken to mean that some investors are smarter than others, only that they understand thetypes of ripples particular pebbles will make better than others do. The roles could reverse with the nextpebble, with the next bit of news. Moreover, investors constantly strive to improve their understandingof the ways that certain types of news affect securities prices. They emulate successful people and devel-op new models and theories of their own, not for the joy of learning but for the clink of cold hard cash.For example, investors who understood that oil prices hitting $50 per barrel would increase the shareprice of home insulation manufacturers merely stayed up with the crowd. It’s pretty obvious that high-er home heating costs would induce people to buy insulation. The investors who quickly figured outthat the share price of a Canadian shingle manufacturer would jump too were the ones that earnedabove-market returns. (High oil prices made it profitable to extract oil from Canada’s oil sand fields,but not enough people lived in the area around Fort McMurray, Alberta, to meet labor demands.People flocking to the region to work needed new homes, the roofs of which needed shingles, lots ofthem.[4] )
For all those reasons, investors often have a wide variety of opinions about the value of differentassets. More mechanically, investors might have different opinions about bond valuations because theymust have different views about the applicable discount or interest rate. To review,
PV = FV / (1 + i)n
If this is a one-year zero coupon bond, FV = $1,000, and i = 6%, then the bond price = ($1,000/1.06) =$943.40. But if one believes i = 6.01, then the bond price = ($1,000/1.0601) = $942.51. To understandhow investors can value the same stock differently, we must investigate how they value corporateequities.
K E Y T A K E A W A Y S
< Expectations are rational when they logically follow from all available relevant information.
< Expectations are irrational if some available pertinent information is ignored or if conclusions do not flowlogically from available information.
2. VALUING CORPORATE EQUITIES
L E A R N I N G O B J E C T I V E
1. How are corporate equities valued?
A corporate equity, or stock, is sometimes called a share because it is just that, a share in the ownershipof a joint-stock corporation. Ownership entitles investors to a say in how the corporation is run. Todaythat usually means one vote per share in corporate elections for the board of directors, a group ofpeople who direct, oversee, and monitor the corporation’s professional managers. Ownership alsomeans that investors are residual claimants, entitling them to a proportionate share of the corporation’snet earnings (profits), its cash flows, and its assets once all other claims against it have been settled.
CHAPTER 7 RATIONAL EXPECTATIONS, EFFICIENT MARKETS, AND THE VALUATION OF CORPORATE EQUITIES 77
stockholders (orshareholders)
Owners of corporate equities.Generally, they are entitled toone vote per share incorporate elections fordirectors and a proportionateshare of the corporation’sprofits.
dividends
In this context, cashdistributions of corporateearnings to shareholders.
Internal Revenue Service(IRS)
The tax collector of the U.S.federal government.
required rate of return (ork)
Serves the same purpose as iin present value calculations.In other words, it measuresthe opportunity cost ofmaking an investment; k isinfluenced by i but also bydefault and other risks.
In exchange for their investment, stockholders may receive a flow of cash payments, usuallymade quarterly, called dividends. Dividends differ from bond coupons in important ways. Unlikecoupons, they are not fixed. They may go up or down over time. Also, if a company fails to pay di-vidends on its stock, it is not considered in default. (We speak here of common stock. Another type offinancial instrument, a preferred share [preference shares in the United Kingdom], promises to pay afixed dividend. Such instruments are a type of equity-debt hybrid and are priced more like couponbonds.) In fact, many corporations today do not pay any dividends, and for good reasons. Small, rap-idly growing companies, it is widely believed, should plow their profits back into their businesses ratherthan return money to shareholders. That is not cheating the stockholders, because profits left with thecompany instead of paid out as dividends raise the share price. The company has more cash than it oth-erwise would, after all, and stockholders own the profits whether they are left with the company or putinto their pockets. Plus, it is generally thought that growing companies put the money to more profit-able use than stockholders could.
There is a tax benefit to retaining earnings, too. Taxes on dividends, which the Internal RevenueService (IRS) considers income, are usually higher than taxes on share appreciation, which the IRSconsiders capital gains.[5] Also, dividends are taxed in the year they are paid, which may be inconveni-ent for stockholders, but capital gains taxes are incurred only when the stockholders sell their shares, sothey have more control over their tax liabilities. Similarly, companies that have stopped growing willsometimes buy their own stock in the market rather than pay dividends. Fewer shares outstandingmeans that each share is worth more (the price per share equals the total value of the company dividedby the number of shares, so as the denominator declines, the price per share increases), so stockholdersare “paid” with a higher stock price. Nevertheless, some corporations continue to pay dividends. Thepoint here is that what really matters when valuing corporate equities is earnings or profits because, asnoted above, they belong to the stockholders whether they are divided, kept as cash, or used to repurchaseshares.
The simplest stock valuation method, the one-period valuation model, simply calculates the discoun-ted present value of earnings and selling price over a one-year holding period:
P = E / (1 + k) + P1 / (1 + k)
where:P = price nowE = yearly earnings or profitk = required rate of returnP₁ = expected price at year’s endSo if a company is expected to earn no profit, its share price is expected to be $75 at the end of the
year, and the required rate of return on investments in its risk class is 10 percent, an investor wouldbuy the stock if its market price was at or below P = 0/1.10 + 75/1.10 = $68.18. Another investor mightalso require a 10 percent return but think the stock will be worth $104 at the end of the year. He’d payP = 0/1.10 + 104/1.1 = $94.55 for the stock today! A third investor might agree with the first, that thestock will be worth $75 in a year, but she might need a 12 percent return. She’d pay only up to P =0/1.12 + 75/1.12 = $66.96 per share. Yet another investor might also require a 12 percent return to holdthe stock and think $75 a reasonable price a year from now, but he might also think earnings of $1 pershare is in the offing. He’d pay P = 1/1.12 + 75/1.12 = .89 + 66.96 = $67.85 per share. For a little prac-tice, complete the following exercises now.
78 MONEY AND BANKING
E X E R C I S E S
1. Use the one-period valuation model P = E/(1 + k) + P1/(1 + k) to price the following stocks (remember todecimalize percentages).
Earnings (E =$)
Required return (k =%)
Expected Price Next Year (P1 =$)
Answer: Price Today (P =$)
1.00 10 20 19.10
1.00 15 20 18.26
1.00 20 20 17.50
0 5 20 19.05
0 5 30 28.57
0 5 40 38.10
1.00 10 50 46.36
1.50 10 50 46.82
2.00 10 50 47.27
0 10 1 0.91
For longer holding periods, one can use the generalized dividend valuation model, which discounts expectedfuture earnings to their present value. That can be done mechanically, as we did for coupon bonds inChapter 4, or with a little fancier math:
P = t = 1∞Et / 1 + kt
That sideways 8 means infinity. So this equation basically says that the price of a share now is the sum (σ)of the discounted present values of the expected earnings between now and infinity. The neat thingabout this equation is that the expected future sales price of the stock drops out of the equation becausethe present value of any sum at any decent required rate of return quickly becomes negligible. (Forexample, the present value of an asset expected to be worth $10 in 20 years at 15 percent interest is onlyPV = 10/(1.15)20 = $0.61 today.) So for all intents and purposes in this model, a corporate equity is worth thediscounted present value of its expected future earnings stream.
P = E(1 + g) / (k − g)
whereP= price todayE = most recent earningsk = required returng = constant growth rateSo the price of a stock today that recently earned $1 per share and has expected earnings growth of 5
percent would be $21.00 if the required return was 10 percent (P = 1.05/.05). If another investor estimateseither k or g differently, perhaps because he knows more (or less) about a country, industry, or company’sfuture prospects, P will of course change, perhaps radically. Exercise 2 demonstrates this and will give yousome practice with the Gordon growth model.
2. Use the Gordon growth model P = E×(1 + g)/(k – g) to value the following stocks (remember to decimalizepercentages).
CHAPTER 7 RATIONAL EXPECTATIONS, EFFICIENT MARKETS, AND THE VALUATION OF CORPORATE EQUITIES 79
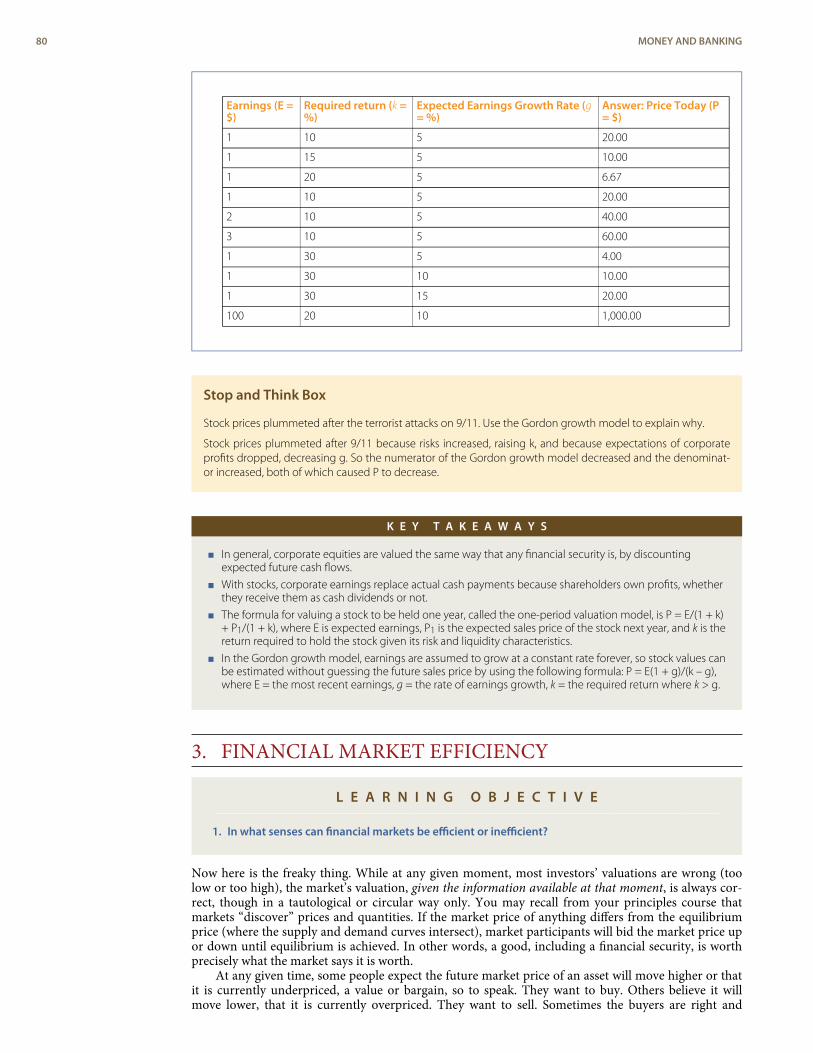
Earnings (E =$)
Required return (k =%)
Expected Earnings Growth Rate (g= %)
Answer: Price Today (P= $)
1 10 5 20.00
1 15 5 10.00
1 20 5 6.67
1 10 5 20.00
2 10 5 40.00
3 10 5 60.00
1 30 5 4.00
1 30 10 10.00
1 30 15 20.00
100 20 10 1,000.00
Stop and Think Box
Stock prices plummeted after the terrorist attacks on 9/11. Use the Gordon growth model to explain why.
Stock prices plummeted after 9/11 because risks increased, raising k, and because expectations of corporateprofits dropped, decreasing g. So the numerator of the Gordon growth model decreased and the denominat-or increased, both of which caused P to decrease.
K E Y T A K E A W A Y S
< In general, corporate equities are valued the same way that any financial security is, by discountingexpected future cash flows.
< With stocks, corporate earnings replace actual cash payments because shareholders own profits, whetherthey receive them as cash dividends or not.
< The formula for valuing a stock to be held one year, called the one-period valuation model, is P = E/(1 + k)+ P1/(1 + k), where E is expected earnings, P1 is the expected sales price of the stock next year, and k is thereturn required to hold the stock given its risk and liquidity characteristics.
< In the Gordon growth model, earnings are assumed to grow at a constant rate forever, so stock values canbe estimated without guessing the future sales price by using the following formula: P = E(1 + g)/(k – g),where E = the most recent earnings, g = the rate of earnings growth, k = the required return where k > g.
3. FINANCIAL MARKET EFFICIENCY
L E A R N I N G O B J E C T I V E
1. In what senses can financial markets be efficient or inefficient?
Now here is the freaky thing. While at any given moment, most investors’ valuations are wrong (toolow or too high), the market’s valuation, given the information available at that moment, is always cor-rect, though in a tautological or circular way only. You may recall from your principles course thatmarkets “discover” prices and quantities. If the market price of anything differs from the equilibriumprice (where the supply and demand curves intersect), market participants will bid the market price upor down until equilibrium is achieved. In other words, a good, including a financial security, is worthprecisely what the market says it is worth.
At any given time, some people expect the future market price of an asset will move higher or thatit is currently underpriced, a value or bargain, so to speak. They want to buy. Others believe it willmove lower, that it is currently overpriced. They want to sell. Sometimes the buyers are right and
80 MONEY AND BANKING
sometimes the sellers are, but that is beside the point, at least from the viewpoint of economic effi-ciency. The key is that the investor who values the asset most highly will come to own it because he’llbe willing to pay the most for it. Financial markets are therefore allocationally efficient. In other words,where free markets reign, assets are put to their most highly valued use, even if most market participantsdon’t know what that use or value is. That’s really remarkable when you think about it and goes a longway to explaining why many economists grow hot under the collar when governments create barriersthat restrict information flows or asset transfers.
Financial markets are also efficient in the sense of being highly integrated. In other words, prices ofsimilar securities track each other closely over time and prices of the same security trading in differentmarkets are identical, or nearly so. Were they not, arbitrage, or the riskless profit opportunity that ariseswhen the same security at the same time has different prices in different markets, would take place. Bybuying in the low market and immediately selling in the high market, an investor could make easymoney. Unsurprisingly, as soon as an arbitrage opportunity appears, it is immediately exploited until itis no longer profitable. (Buying in the low market raises the price there, while selling in the high marketdecreases the price there.) Therefore, only slight price differences that do not exceed transaction costs(brokerage fees, bid-ask spreads, etc.) persist.
The size of those price differences and the speed with which arbitrage opportunities are closed dependon the available technology. Today, institutional investors can complete international financial markettrades in just seconds and for just a few hundredths or even thousandths of a percent. In the early nine-teenth century, U.S.-London arbitrageurs (investors who engage in arbitrage) confronted lags of severalweeks and transaction costs of several percent. Little wonder that price differentials were larger andmore persistent in the early nineteenth century. But the early markets were still rational because theywere as efficient as they could be at the time. (Perhaps in the future, new technology will make secondsand hundredths of a percent look pitifully archaic.)
Arbitrage, or the lack thereof, has been the source of numerous jokes and gags, including a two-part episode of the 1990s comedy sitcom Seinfeld. In the episodes, Cosmo Kramer and his rotundfriend Newman (the postal worker) decide to try to arbitrage the deposit on cans and bottles of soda,which is 5 cents in New York, where Seinfeld and his goofy friends live, and 10 cents in Michigan. Thetwo friends load up Newman’s postal truck with cans and head west, only to discover that the transac-tion costs (fuel, tolls, hotels, and what not) are too high, especially given the fact that Kramer is easilysidetracked.[6] High transaction costs also explain why people don’t arbitrage the international pricedifferentials of Big Macs and many other physical things.[7] Online sites like eBay, however, have re-cently made arbitrage in nonperishables more possible than ever by greatly reducing transaction costs.
In another joke (at least I hope it’s a joke!), two economics professors think they see an arbitrageopportunity in wheat. After carefully studying all the transaction costs—freight, insurance, brokerage,weighing fees, foreign exchange volatility, weight lost in transit, even the interest on money over theexpected shipping time—they conclude that they can make a bundle buying low in Chicago and sellinghigh in London. They go for it, but when the wheat arrives in London, they learn that a British ton(long ton, or 2,240 pounds) and a U.S. ton (short ton, or 2,000 pounds) are not the same thing. Theprice of wheat only appeared to be lower in Chicago because a smaller quantity was being priced.
Some economists believe financial markets are so efficient that unexploited profit opportunitieslike arbitrage are virtually impossible. Such extreme views have also become the butt of jokes, like theone where an assistant professor (young, untenured) of economics bends over to pick up a $20 bill offthe sidewalk, only to be chided by an older, wiser, indubitably tenured colleague who advises him thatif the object on the ground were real money, somebody else would have already have picked it up.[8] Assomebody who once found a real $50 bill on a New York City sidewalk, I (Wright) know that money issometimes lost and that somebody has to be lucky enough to pocket it. But as somebody who oncestuck his hand in a toilet to get what looked like a $20 bill, I also know that things are not always whatthey seem. (Hey, I was young.) Arbitrage and other unexploited profit opportunities are not unicorns.They do exist on occasion. But especially in financial markets, they are so fleeting that they might bestbe compared to kaons or baryons, rare and short-lived subatomic particles.
In an efficient market, all unexploited profit opportunities, not just arbitrage opportunities, will beeliminated as quickly as the current technology set allows. Say, for example, the rate of return on a stockis 10 percent but the optimal forecast or best guess rate of return, due to a change in information or ina valuation model, was 15 percent. Investors would quickly bid up the price of the stock, thereby redu-cing its return. Remember that R = (C + Pt1 – Pt0)/Pt0. As Pt0 , the price now, increases, R must de-crease. Conversely, if the rate of return on a stock is currently 10 percent but the optimal forecast rateof return dropped to 5 percent, investors would sell the stock until its price decreased enough to in-crease the return to 10 percent. In other words, in an efficient market, the optimal forecast return andthe current equilibrium return are one and the same.
CHAPTER 7 RATIONAL EXPECTATIONS, EFFICIENT MARKETS, AND THE VALUATION OF CORPORATE EQUITIES 81
hedge fund
A type of relativelyunregulated mutual fund thatengages in sophisticatedtrading strategies. Onlywealthy individuals andinstitutional investors areallowed to invest directly insuch funds.
Financial market efficiency means that it is difficult or impossible to earn abnormally high returnsat any given level of risk. (Remember, returns increase with risk.) Yes, an investor who invests 100 per-cent in hedge funds will likely garner a higher return than one who buys only short-dated Treasurynotes. Holding risk (and liquidity) constant, though, returns should be the same, especially over longperiods. In fact, creating a stock portfolio by throwing darts at a dartboard covered with ticker symbolsreturns as much, on average, as the choices of experienced stock pickers choosing from the same set ofcompanies. Chimpanzees and orangutans have also done as well as the darts and the experts. Manystudies have shown that actively managed mutual funds do not systematically outperform (provide high-er returns than) the market. In any given period, some funds beat the market handily, but others lag itconsiderably. Over time, some stellar performers turn into dogs, and vice versa. (That is why regulatorsforce financial firms to remind investors that past performance is not a guarantee of future returns.)
Stop and Think Box
Wright once received the following hot tip in his e-mail:
Saturday, March 17, 2007
Dear Friend:
If you give me permission . . . I will show you how to make money in a high-profit sector,starting with just $300–$600. The profits are enormous. You can start with as little as $300.And what's more, there is absolutely no risk because you will “Test Drive” the system beforeyou shell out any money. So what is this “secret” high-profit sector that you can get in on withjust $300–$600 or less??? Dear Friend, it’s called “penny stocks”—stocks that cost less than $5per share. Don’t laugh—at one time Wal-Mart was a “penny stock.” So was Microsoft. Andnot too long age, America Online was selling for just .59 cents a share, and Yahoo was only a$2 stock. These are not rare and isolated examples. Every month people buy penny stocks atbargain prices and make a small fortune within a short time.
Very recently, these three-penny stocks made huge profits. In January ARGON Corp. wasat $2.69. Our indicators picked up the beginning of the upward move of this stock. Withinthree months the stock shot up to $28.94 a share, turning a $300 investment into $3,238 injust three months. In November Immugen (IMGN) was at $2.76 a share. We followed thedecline of this stock from $13 to as little as $1.75 a share. But our technicals were showing anupward move. Stock went up to $34.10 a share. An investment of $500 would have a net gainof $5,677. RF Micro Devices was at $1.75 in August 1999. It exploded to $65.09 a share by April2000. An investment of only $500 in this stock would have a net profit of $18,097. In fact, theprofits are huge in penny stocks. And smart investors who picked these so-called penny stocksmade huge profits. They watched their money double seemingly day after day, week afterweek, month after month. Double, triple, quadruple, and more.
Should Wright buy? Why or why not?
Wright should not invest. If the individual who sent the message really knows that the stock is going to appre-ciate, why should he tell anyone? Shouldn’t he buy the shares himself, borrowing to the hilt if necessary to doso? So why would he try to entice me to buy this stock? He probably owns a few (hundred, thousand, million)shares and wants to drive their price up by finding suckers and fools to buy it so he can sell. This is called“pumping and dumping”[9] and it runs afoul of any number of laws, rules, and regulations, so you shouldn’tthink about sending such e-mails yourself, unless you want to spend some time in Martha Stewart’s prison.[10]
And don’t think you can free-ride on the game, either. One quirky fellow named Joshua Cyr actually tracks theprices of the hot stock tips he has received, pretending to buy 1,000 shares of each. On one day in March 2007,his Web site claimed that his pretend investment of $70,987.00 was then worth a whopping $9,483.10, a netgain of −$61,503.90. (To find out how he is doing now, browse http://www.spamstocktracker.com/.) Even if hehad bought and sold almost immediately, he would have still lost money because most stocks experiencedvery modest and short-lived “pops” followed by quick deflations. A few of us are idiots, but most are not (or weare too poor or too lazy to act on the tips). Learning this, the scammers started to pretend that they were
82 MONEY AND BANKING
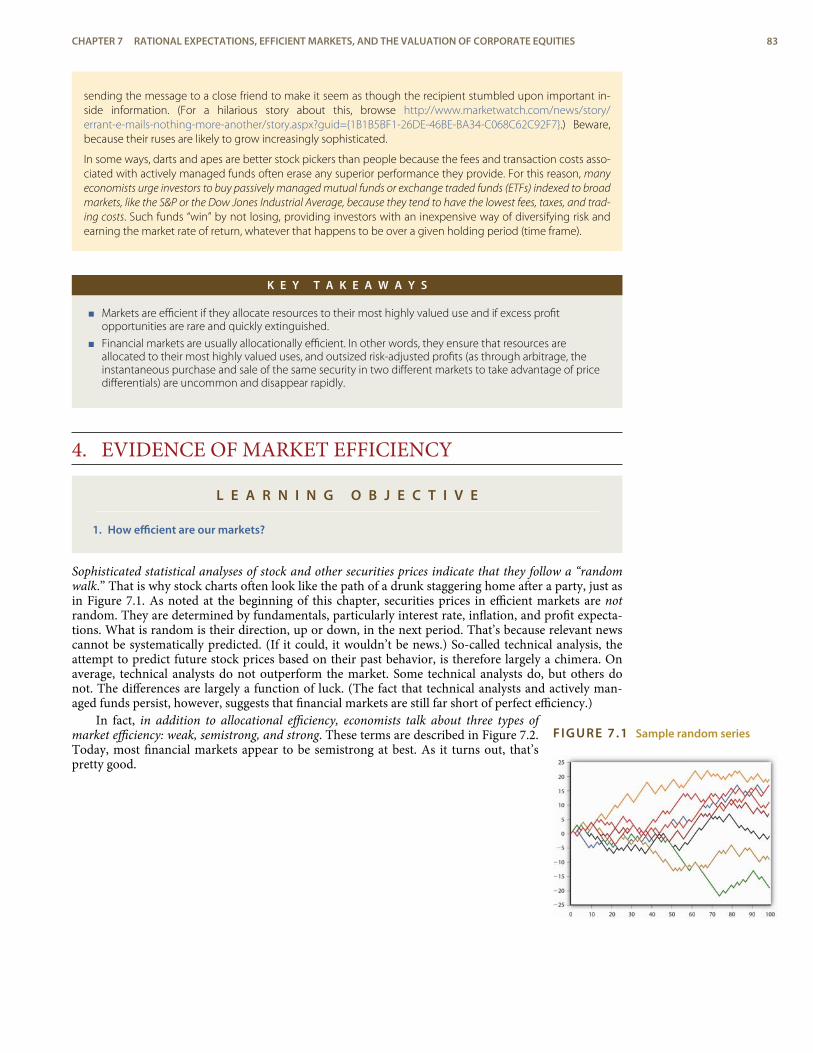
FIGURE 7.1 Sample random series
sending the message to a close friend to make it seem as though the recipient stumbled upon important in-side information. (For a hilarious story about this, browse http://www.marketwatch.com/news/story/errant-e-mails-nothing-more-another/story.aspx?guid=1B1B5BF1-26DE-46BE-BA34-C068C62C92F7.) Beware,because their ruses are likely to grow increasingly sophisticated.
In some ways, darts and apes are better stock pickers than people because the fees and transaction costs asso-ciated with actively managed funds often erase any superior performance they provide. For this reason, manyeconomists urge investors to buy passively managed mutual funds or exchange traded funds (ETFs) indexed to broadmarkets, like the S&P or the Dow Jones Industrial Average, because they tend to have the lowest fees, taxes, and trad-ing costs. Such funds “win” by not losing, providing investors with an inexpensive way of diversifying risk andearning the market rate of return, whatever that happens to be over a given holding period (time frame).
K E Y T A K E A W A Y S
< Markets are efficient if they allocate resources to their most highly valued use and if excess profitopportunities are rare and quickly extinguished.
< Financial markets are usually allocationally efficient. In other words, they ensure that resources areallocated to their most highly valued uses, and outsized risk-adjusted profits (as through arbitrage, theinstantaneous purchase and sale of the same security in two different markets to take advantage of pricedifferentials) are uncommon and disappear rapidly.
4. EVIDENCE OF MARKET EFFICIENCY
L E A R N I N G O B J E C T I V E
1. How efficient are our markets?
Sophisticated statistical analyses of stock and other securities prices indicate that they follow a “randomwalk.” That is why stock charts often look like the path of a drunk staggering home after a party, just asin Figure 7.1. As noted at the beginning of this chapter, securities prices in efficient markets are notrandom. They are determined by fundamentals, particularly interest rate, inflation, and profit expecta-tions. What is random is their direction, up or down, in the next period. That’s because relevant newscannot be systematically predicted. (If it could, it wouldn’t be news.) So-called technical analysis, theattempt to predict future stock prices based on their past behavior, is therefore largely a chimera. Onaverage, technical analysts do not outperform the market. Some technical analysts do, but others donot. The differences are largely a function of luck. (The fact that technical analysts and actively man-aged funds persist, however, suggests that financial markets are still far short of perfect efficiency.)
In fact, in addition to allocational efficiency, economists talk about three types ofmarket efficiency: weak, semistrong, and strong. These terms are described in Figure 7.2.Today, most financial markets appear to be semistrong at best. As it turns out, that’spretty good.
CHAPTER 7 RATIONAL EXPECTATIONS, EFFICIENT MARKETS, AND THE VALUATION OF CORPORATE EQUITIES 83
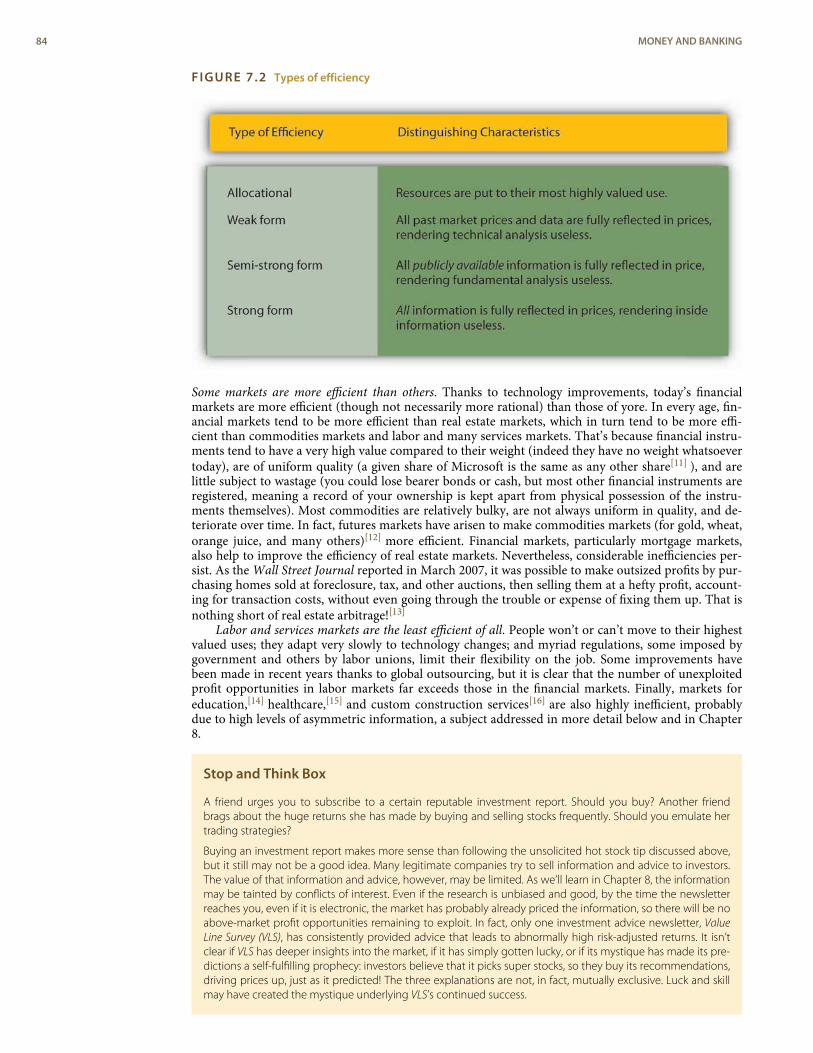
FIGURE 7.2 Types of efficiency
Some markets are more efficient than others. Thanks to technology improvements, today’s financialmarkets are more efficient (though not necessarily more rational) than those of yore. In every age, fin-ancial markets tend to be more efficient than real estate markets, which in turn tend to be more effi-cient than commodities markets and labor and many services markets. That’s because financial instru-ments tend to have a very high value compared to their weight (indeed they have no weight whatsoevertoday), are of uniform quality (a given share of Microsoft is the same as any other share[11] ), and arelittle subject to wastage (you could lose bearer bonds or cash, but most other financial instruments areregistered, meaning a record of your ownership is kept apart from physical possession of the instru-ments themselves). Most commodities are relatively bulky, are not always uniform in quality, and de-teriorate over time. In fact, futures markets have arisen to make commodities markets (for gold, wheat,orange juice, and many others)[12] more efficient. Financial markets, particularly mortgage markets,also help to improve the efficiency of real estate markets. Nevertheless, considerable inefficiencies per-sist. As the Wall Street Journal reported in March 2007, it was possible to make outsized profits by pur-chasing homes sold at foreclosure, tax, and other auctions, then selling them at a hefty profit, account-ing for transaction costs, without even going through the trouble or expense of fixing them up. That isnothing short of real estate arbitrage![13]
Labor and services markets are the least efficient of all. People won’t or can’t move to their highestvalued uses; they adapt very slowly to technology changes; and myriad regulations, some imposed bygovernment and others by labor unions, limit their flexibility on the job. Some improvements havebeen made in recent years thanks to global outsourcing, but it is clear that the number of unexploitedprofit opportunities in labor markets far exceeds those in the financial markets. Finally, markets foreducation,[14] healthcare,[15] and custom construction services[16] are also highly inefficient, probablydue to high levels of asymmetric information, a subject addressed in more detail below and in Chapter8.
Stop and Think Box
A friend urges you to subscribe to a certain reputable investment report. Should you buy? Another friendbrags about the huge returns she has made by buying and selling stocks frequently. Should you emulate hertrading strategies?
Buying an investment report makes more sense than following the unsolicited hot stock tip discussed above,but it still may not be a good idea. Many legitimate companies try to sell information and advice to investors.The value of that information and advice, however, may be limited. As we’ll learn in Chapter 8, the informationmay be tainted by conflicts of interest. Even if the research is unbiased and good, by the time the newsletterreaches you, even if it is electronic, the market has probably already priced the information, so there will be noabove-market profit opportunities remaining to exploit. In fact, only one investment advice newsletter, ValueLine Survey (VLS), has consistently provided advice that leads to abnormally high risk-adjusted returns. It isn’tclear if VLS has deeper insights into the market, if it has simply gotten lucky, or if its mystique has made its pre-dictions a self-fulfilling prophecy: investors believe that it picks super stocks, so they buy its recommendations,driving prices up, just as it predicted! The three explanations are not, in fact, mutually exclusive. Luck and skillmay have created the mystique underlying VLS’s continued success.
84 MONEY AND BANKING
As far as emulating your friend’s trading strategies, you should investigate the matter more thoroughly first.For starters, people tend to brag about their gains and forget about their losses. (My [Wright’s] father, wholiked to bet the ponies, was infamous for this. He’d get us excited by telling us he won $1,000 at the track thatday. When we asked why we were eating squirrels for dinner again, he’d finally give in and admit that he alsolost $1,200.) Even if your friend is genuinely successful at picking stocks, she is likely just getting lucky. Her luckcould turn just as your money gets in the game. To the extent that markets are efficient, investors are betteroff choosing the level of risk they are comfortable with and earning the market return. That usually entails buy-ing and holding a diverse portfolio via an indexed mutual fund, which minimizes taxes and brokerage fees,both of which can add up. Long-term index investors also waste less time tracking stocks and worrying aboutmarket gyrations.
As noted above, none of this should be taken to mean that financial markets are perfectly efficient. Re-searchers have uncovered certain anomalies, situations where it is or was possible to outperform the mar-ket, holding risk and liquidity constant. I say was because exposing an anomaly will often induce in-vestors to exploit it until it is eliminated. One such anomaly was the so-called January Effect, a predict-able rise in stock prices that for many years occurred each January until its existence was recognizedand publicized. Similarly, stock prices in the past tended to display mean reversion. In other words,stocks with low returns in one period tended to have high returns in the next, and vice versa. The phe-nomenon appears to have disappeared, however, with the advent of trading strategies like the Dogs ofthe Dow, where investors buy beaten-down stocks in the knowledge that they can only go up (though afew will go to zero and stay there).[17]
Other anomalies, though, appear to persist. The prices of many financial securities, includingstocks, tend to overshoot when there is unexpected bad news. After a huge initial drop, the price oftenmeanders back upward over a period of several weeks. This suggests that investors should buy soonafter bad news hits, then sell at a higher price a few weeks later. Sometimes, prices seem to adjust onlyslowly to news, even highly specific announcements about corporate profit expectations. That suggeststhat investors could earn above-market returns by buying immediately on good news and selling after afew weeks when the price catches up to the news.
Some anomalies may be due to deficiencies in our understanding of risk and liquidity rather thanmarket inefficiency. One of these is the small-firm effect. Returns on smaller companies, apparentlyholding risk and liquidity constant, are abnormally large. Why then don’t investors flock to such com-panies, driving their stock prices up until the outsized returns disappear? Some suspect that the com-panies are riskier, or at least appear riskier to investors, than researchers believe. Others believe theroot issues are asymmetric information, the fact that the quality and quantity of information aboutsmaller firms is inferior to that of larger ones, and inaccurate measurement of liquidity. Similarly, someresearchers believe that stock prices are more volatile than they should be given changes in underlyingfundamentals. That finding too might stem from the fact that researchers aren’t as prescient as themarket.
The most important example of financial market inefficiencies are so-called asset bubbles or manias.Periodically, market prices soar far beyond what the fundamentals suggest they should. During stockmarket manias, like the dot-com bubble of the late 1990s, investors apparently popped sanguine valuesfor g into models like the Gordon growth model or, given the large run-up in prices, large P1 values in-to the one-period valuation model. In any event, starting in March 2000, the valuations for most of theshares were discovered to be too high, so share prices rapidly dropped. Bubbles are not necessarily irra-tional, but they are certainly inefficient to the extent that they lead to the misallocation of resources whenprices are rising and unexploited profit opportunities when prices head south.
Asset bubbles are very common affairs. Since the tech bubble burst, we’ve already experienced an-other, in housing and home mortgages. Recurrent investor euphoria may be rooted in the deepest re-cesses of the human mind. Whether we evolved from the great apes or were created by some DivineBeing, one thing is clear: our brains are pretty scrambled, especially when it comes to probabilities andpercentages. For example, a recent study[18] published in Review of Finance showed that investors, evensophisticated ones, expect less change in future stock prices when asked to state their forecasts in cur-rency (so many dollars or euros per share) than when asked to state them as returns (a percentage gainor loss).[19]
CHAPTER 7 RATIONAL EXPECTATIONS, EFFICIENT MARKETS, AND THE VALUATION OF CORPORATE EQUITIES 85
behavioral finance
A new interdisciplinarysubject matter that tries tounderstand the limits ofhuman rationality, especiallyas it applies to financialmarkets.
short selling
Selling a stock at a high priceand buying it back later at alower price. It is the logicalequivalent of buying low andselling high, but manyinvestors don’t attempt it.
transparency
In general, the opposite ofopacity. In this context,transparency means arelatively low degree ofasymmetric information.
Behavioral finance uses insights from evolutionary psychology, anthropology, sociology, theneurosciences, and psychology to try to unravel how the human brain functions in areas related to fin-ance.[20] For example, many people are averse to short selling, selling (or borrowing and then selling)a stock that appears overvalued with the expectation of buying it back later at a lower price. (Shortsellers profit by owning more shares of the stock, or the same number of shares and a sum of cash, de-pending on how they go about it.) A dearth of short selling may allow stock prices to spiral too high,leading to asset bubbles. Another human foible is that we tend to be overly confident in our own judg-ments. Many actually believe that they are smarter than the markets in which they trade! (As notedabove, many researchers appear to fall into the same trap.) People also tend to herd. They will, like thecommon misconception about lemmings, run with the crowd, seemingly oblivious to the cliff loomingjust ahead.
Finally, as noted above, another source of inefficiency in financial (and nonfinancial) markets isasymmetric information, when one party to a transaction has better information than the other. Usu-ally, the asymmetry arises due to inside information as when the seller, for instance, knows the com-pany is weak but the buyer does not. Regulators try to reduce information asymmetries by outlawingoutright fraud and by encouraging timely and full disclosure of pertinent information to the public. Inshort, they try to promote what economists call transparency. Some markets, however, remain quiteopaque.[21]
In short, our financial markets appear to be semistrong form efficient. Greater transparency andmore fervent attempts to overcome the natural limitations of human rationality would help to movethe markets closer to strong form efficiency.
K E Y T A K E A W A Y S
< Beyond allocational efficiency, markets may be classed as weak, semistrong, or strong form efficient.
< If the market is weak form efficient, technical analysis is useless because securities prices already reflectpast prices.
< If the market is semistrong form efficient, fundamental analysis is also useless because prices reflect allpublicly available information.
< If the market is strong form efficient, inside information is useless too because prices reflect all information.
< Securities prices tend to track each other closely over time and in fact usually display random walkbehavior, moving up and down unpredictably.
< Neither technical analysis nor fundamental analysis outperforms the market on average, but insideinformation apparently does, so most financial markets today are at best semistrong form efficient.
< Although more efficient than commodities, labor, and services markets, financial markets are notcompletely efficient.
< Various anomalies, like the January and small-firm effects, market overreaction and volatility, meanreversion, and asset bubbles, suggest that securities markets sometimes yield outsized gains to the quickand the smart, people who overcome the mushy, often illogical brains all humans are apparently bornwith. But the quest is a never-ending one; no strategy works for long.
5. SUGGESTED READINGBernstein, Peter. Against the Gods: The Remarkable Story of Risk. Hoboken, NJ: John Wiley and
Sons, 1998.Burnham, Terry. Mean Markets and Lizard Brains: How to Profit from the New Science of Irration-
ality. Hoboken, NJ: John Wiley and Sons, 2008.English, James. Applied Equity Analysis: Stock Valuation Techniques for Wall Street Professionals.
New York: McGraw-Hill, 2001.Mackay, Charles, and Joseph de la Vega. Extraordinary Popular Delusions and the Madness of
Crowds and Confusion de Confusiones. Hoboken, NJ: John Wiley and Sons, 1995.Malkiel, Burton. A Random Walk Down Wall Street: The Time-Tested Strategy for Successful In-
vesting, 9th ed. New York: W. W. Norton, 2007.
86 MONEY AND BANKING
1.2.3.4.
5.6.7.8.
9.10.11.
12.13.
14.
15.16.
17.18.
19.
20.21.
ENDNOTES
www.cboe.com/micro/vix/introduction.aspx
en.wikipedia.org/wiki/Joseph_Penso
Joseph de la Vega, Confusion de Confusiones.
www.npr.org/templates/story/story.php?storyId=6098557;http://www.iht.com/articles/2007/01/10/bloomberg/bxfort.php
www.irs.gov/
http://en.wikipedia.org/wiki/The_Bottle_Deposit,_Part_1
http://www.economist.com/markets/Bigmac/Index.cfm
http://robotics.caltech.edu/~mason/ramblings/efficientSidewalkTheory.html;http://netec.mcc.ac.uk/JokEc.html
http://www.fool.com/foolu/askfoolu/2002/askfoolu020107.htm
http://www.csmonitor.com/2004/1008/p01s01-usju.html
Any share of the same class, that is. As noted above, some corporations issue pre-ferred shares, which differ from the common shares discussed in this chapter. Othercorporations issue shares, usually denominated Class A or Class B, that have differentvoting rights.
http://www2.barchart.com/futures.asp
James R. Hagerty, “Foreclosure Rise Brings Business to One Investor,” Wall StreetJournal, March 14, 2007, A1.
http://www.forbes.com/columnists/2005/12/29/higher-education-partnerships-cx_rw_1230college.html
http://www.nchc.org/facts/cost.shtml
http://www.amazon.com/Broken-Buildings-Busted-Budgets-Trillion-Dollar/dp/0226472671/ref=sr_1_1/002-2618567-2654432?ie=UTF8&s=books&qid=1177704792&sr=1-1
http://www.dogsofthedow.com/
Markus Glaser, Thomas Langer, Jens Reynders, and Martin Weber, “Framing Effects inStock Market Forecasts: The Differences Between Asking for Prices and Asking forReturns,” Review of Finance (2007) 11:325–357.
This is a new example of the well-known framing effect. Predict the future stockprice of a stock that goes from $35 to $37 to $39 to $41 to $43 to $45. Now predictthe future stock price of a stock whose returns are +$2, +$2, +$2, +$2, +$2, and +$2.If you are like most people, your answer to the first will be less than $45 but your an-swer to the second will be +$2 even though both series provide precisely the sameinformation. In other words, the way a problem is set up or framed influences theway people respond to it.
http://www.behaviouralfinance.net/
http://ftp.sec.gov/news/speech/spch010606css.htm
CHAPTER 7 RATIONAL EXPECTATIONS, EFFICIENT MARKETS, AND THE VALUATION OF CORPORATE EQUITIES 87

88 MONEY AND BANKING
trade credit
Credit granted in the courseof trade, as when suppliersship their wares, then bill net15 or 30, or when customers,like libraries for academicjournals, pay for goods orservices before they areprovided.
C H A P T E R 8Financial Structure,Transaction Costs, andAsymmetric Information
C H A P T E R O B J E C T I V E S
By the end of this chapter, students should be able to:
1. Describe how nonfinancial companies meet their external financing needs.
2. Explain why bonds play a relatively large role in the external financing of U.S. companies.
3. Explain why most external finance is channeled through financial intermediaries.
4. Define transaction costs and explain their importance.
5. Define and describe asymmetric information and its importance.
6. Define and explain adverse selection, moral hazard, and agency problems.
7. Explain why the financial system is heavily regulated.
1. THE SOURCES OF EXTERNAL FINANCE
L E A R N I N G O B J E C T I V E
1. How can companies meet their external financing needs?
Thus far, we have spent a lot of time discussing financial markets and learning how to calculate theprices of various types of financial securities, including stocks and bonds. Securities markets are im-portant, especially in the U.S. economy. But you may recall from Chapter 2 that the financial systemconnects savers to spenders or investors to entrepreneurs in two ways, via markets and via financial inter-mediaries. It turns out that the latter channel is larger than the former. That’s right, in dollar terms,banks, insurance companies, and other intermediaries are more important than the stock and bondmarkets. The markets tend to garner more media attention because they are relatively transparent.Most of the real action, however, takes place behind closed doors in banks and other institutionallenders.
Not convinced? Check out Figure 8.1, which shows the sources of external funds for nonfinancialbusinesses in four of the world’s most advanced economies: the United States, Germany, Japan, andCanada. In none of those countries does the stock market (i.e., equities) supply more than 12 percent ofexternal finance. Loans, from banks and nonbank financial companies, supply the vast bulk of externalfinance in three of those countries and a majority in the fourth, the United States. The bond market sup-plies the rest, around 10 percent or so of total external finance (excluding trade credit), except in theUnited States, where bonds supply about a third of the external finance of nonfinancial businesses. (Aswe’ll learn later, U.S. banking has been relatively weak historically, which helps to explain why thebond market and loans from nonbank financial companies are relatively important in the UnitedStates. In short, more companies found it worthwhile to borrow from life insurance companies or tosell bonds than to obtain bank loans.)
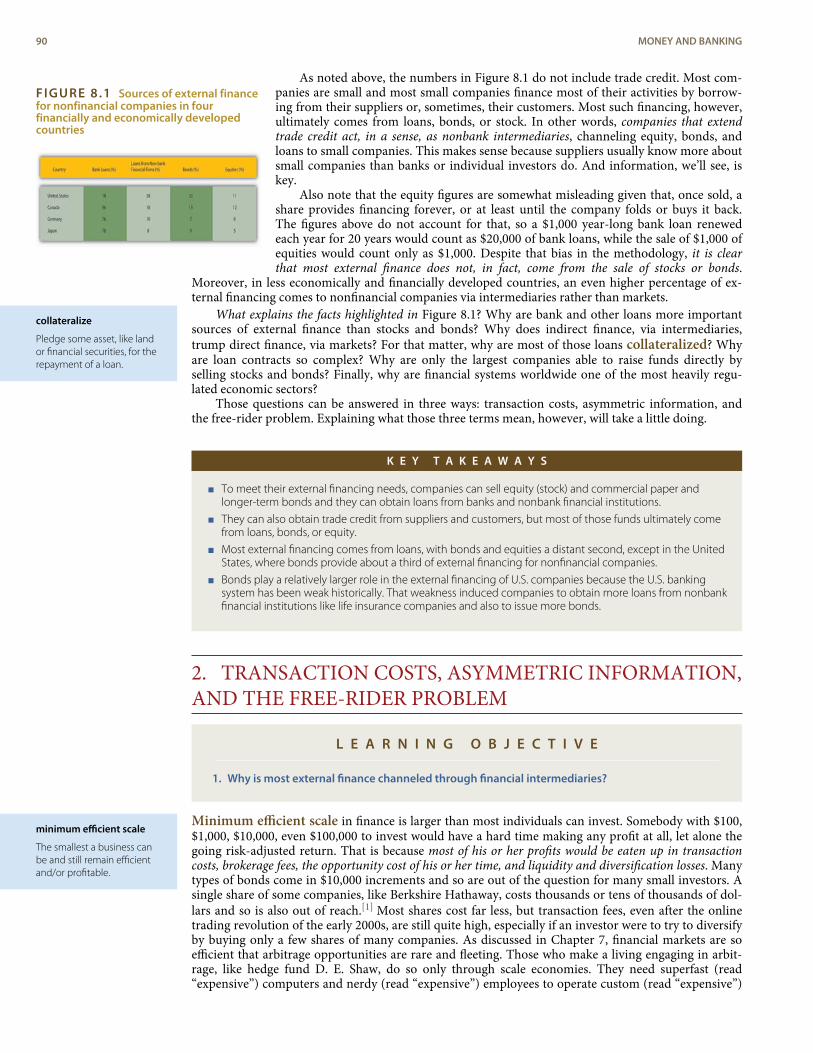
FIGURE 8.1 Sources of external financefor nonfinancial companies in fourfinancially and economically developedcountries
collateralize
Pledge some asset, like landor financial securities, for therepayment of a loan.
minimum efficient scale
The smallest a business canbe and still remain efficientand/or profitable.
As noted above, the numbers in Figure 8.1 do not include trade credit. Most com-panies are small and most small companies finance most of their activities by borrow-ing from their suppliers or, sometimes, their customers. Most such financing, however,ultimately comes from loans, bonds, or stock. In other words, companies that extendtrade credit act, in a sense, as nonbank intermediaries, channeling equity, bonds, andloans to small companies. This makes sense because suppliers usually know more aboutsmall companies than banks or individual investors do. And information, we’ll see, iskey.
Also note that the equity figures are somewhat misleading given that, once sold, ashare provides financing forever, or at least until the company folds or buys it back.The figures above do not account for that, so a $1,000 year-long bank loan renewedeach year for 20 years would count as $20,000 of bank loans, while the sale of $1,000 ofequities would count only as $1,000. Despite that bias in the methodology, it is clearthat most external finance does not, in fact, come from the sale of stocks or bonds.
Moreover, in less economically and financially developed countries, an even higher percentage of ex-ternal financing comes to nonfinancial companies via intermediaries rather than markets.
What explains the facts highlighted in Figure 8.1? Why are bank and other loans more importantsources of external finance than stocks and bonds? Why does indirect finance, via intermediaries,trump direct finance, via markets? For that matter, why are most of those loans collateralized? Whyare loan contracts so complex? Why are only the largest companies able to raise funds directly byselling stocks and bonds? Finally, why are financial systems worldwide one of the most heavily regu-lated economic sectors?
Those questions can be answered in three ways: transaction costs, asymmetric information, andthe free-rider problem. Explaining what those three terms mean, however, will take a little doing.
K E Y T A K E A W A Y S
< To meet their external financing needs, companies can sell equity (stock) and commercial paper andlonger-term bonds and they can obtain loans from banks and nonbank financial institutions.
< They can also obtain trade credit from suppliers and customers, but most of those funds ultimately comefrom loans, bonds, or equity.
< Most external financing comes from loans, with bonds and equities a distant second, except in the UnitedStates, where bonds provide about a third of external financing for nonfinancial companies.
< Bonds play a relatively larger role in the external financing of U.S. companies because the U.S. bankingsystem has been weak historically. That weakness induced companies to obtain more loans from nonbankfinancial institutions like life insurance companies and also to issue more bonds.
2. TRANSACTION COSTS, ASYMMETRIC INFORMATION,AND THE FREE-RIDER PROBLEM
L E A R N I N G O B J E C T I V E
1. Why is most external finance channeled through financial intermediaries?
Minimum efficient scale in finance is larger than most individuals can invest. Somebody with $100,$1,000, $10,000, even $100,000 to invest would have a hard time making any profit at all, let alone thegoing risk-adjusted return. That is because most of his or her profits would be eaten up in transactioncosts, brokerage fees, the opportunity cost of his or her time, and liquidity and diversification losses. Manytypes of bonds come in $10,000 increments and so are out of the question for many small investors. Asingle share of some companies, like Berkshire Hathaway, costs thousands or tens of thousands of dol-lars and so is also out of reach.[1] Most shares cost far less, but transaction fees, even after the onlinetrading revolution of the early 2000s, are still quite high, especially if an investor were to try to diversifyby buying only a few shares of many companies. As discussed in Chapter 7, financial markets are soefficient that arbitrage opportunities are rare and fleeting. Those who make a living engaging in arbit-rage, like hedge fund D. E. Shaw, do so only through scale economies. They need superfast (read“expensive”) computers and nerdy (read “expensive”) employees to operate custom (read “expensive”)
90 MONEY AND BANKING
FIGURE 8.2 Need a loan?
From Early American Newspapers, an Archive of Americana
Collection, published by Readex (Readex.com), a division of
NewsBank, Inc.
peer-to-peer banking
In this new type of banking, afacilitator links lenders toborrowers, acting more like asecurities broker than a bank.
programs on them. They also need to engage in large-scale transactions. You can’t profit making .001percent on a $1,000 trade, but you can on a $1,000,000,000 one.
What about making loans directly to entrepreneurs or other borrowers? Fuggeddaboutit! Thetime, trouble, and cash (e.g., for advertisements like that in Figure 8.2) it would take to find a suitableborrower would likely wipe out any profits from interest. The legal fees alone would swamp you! (Ithelps if you can be your own lawyer, like John C. Knapp.) And, as we’ll learn below, making loans isn’tall that easy. You’ll still occasionally see advertisements like those that used to appear in the eighteenthcentury, but they are rare and might in fact be placed by predators, people who are more interested inrobbing you (or worse) than lending to you. A small investor might be able to find a relative, co-reli-gionist, colleague, or other acquaintance to lend to relatively cheaply. But how could the investor knowif the borrower was the best one, given the interest rate charged? What is the best rate, anyway? To an-swer those questions even haphazardly would cost relatively big bucks. And here is another hint:friends and relatives often think that a “loan” is actually a “gift,” if you catch my “drift.”
A new type of banking, called peer-to-peer banking, might reduce some of thosetransaction costs. In peer-to-peer banking, a financial facilitator, like Zopa.com orProsper.com, reduces transaction costs by electronically matching individual borrowersand lenders. Most peer-to-peer facilitators screen loan applicants in at least a rudiment-ary fashion and also provide diversification services, distributing lenders’ funds to nu-merous borrowers to reduce the negative impact of any defaults.[2] Although the infantindustry is currently growing, the peer-to-peer concept is still unproven and there arepowerful reasons to doubt its success. Even if the concept succeeds (and it might givenits Thomas Friedman–The World Is Flatishness[3] ), it will only reinforce the pointmade here about the inability of most individuals to invest profitably without help.
Financial intermediaries clearly can provide such help. They have been doing sofor at least a millennium (yep, a thousand years, maybe more). One key to their successis their ability to achieve minimum efficient scale. Banks, insurers, and other intermedi-aries pool the resources of many investors. That allows them to diversify cheaply be-cause instead of buying 10 shares of XYZ’s $10 stock and paying $7 for the privilege (7/100 = .07) they can buy 1,000,000 shares for a brokerage fee of maybe $1,000 ($1,000/1,000,000 = .001). In addition, financial intermediaries do not have to sell assets as fre-quently as individuals (ceteris paribus, of course) because they can usually make pay-ments out of inflows like deposits or premium payments. Their cash flow, in otherwords, reduces their liquidity costs. Individual investors, on the other hand, often findit necessary to sell assets (and incur the costs associated therewith) to pay their bills.
As specialists, financial intermediaries are also experts at what they do. That doesnot mean that they are perfect—far from it, as we learned during the financial crisisthat began in 2007—but they are certainly more efficient at accepting deposits, makingloans, or insuring risks than you or I will ever be (unless we work for a financial intermediary, in whichcase we’ll likely become incredibly efficient in one or at most a handful of functions). That expertisecovers many areas, from database management to telecommunications. But it is most important in thereduction of asymmetric information.
You may recall from Chapter 2 that we called asymmetric information the devil incarnate, ascourge of humanity second only to scarcity. That’s no exaggeration. Asymmetric information makesour markets, financial and otherwise, less efficient than they otherwise would be by allowing the partywith superior information to take advantage of the party with inferior information. Where asymmetricinformation is high, resources are not put to their most highly valued uses, and it is possible to makeoutsized profits by cheating others. Asymmetric information, we believe, is what primarily gives mar-kets, including financial markets, the bad rep they have acquired in some circles.
CHAPTER 8 FINANCIAL STRUCTURE, TRANSACTION COSTS, AND ASYMMETRIC INFORMATION 91
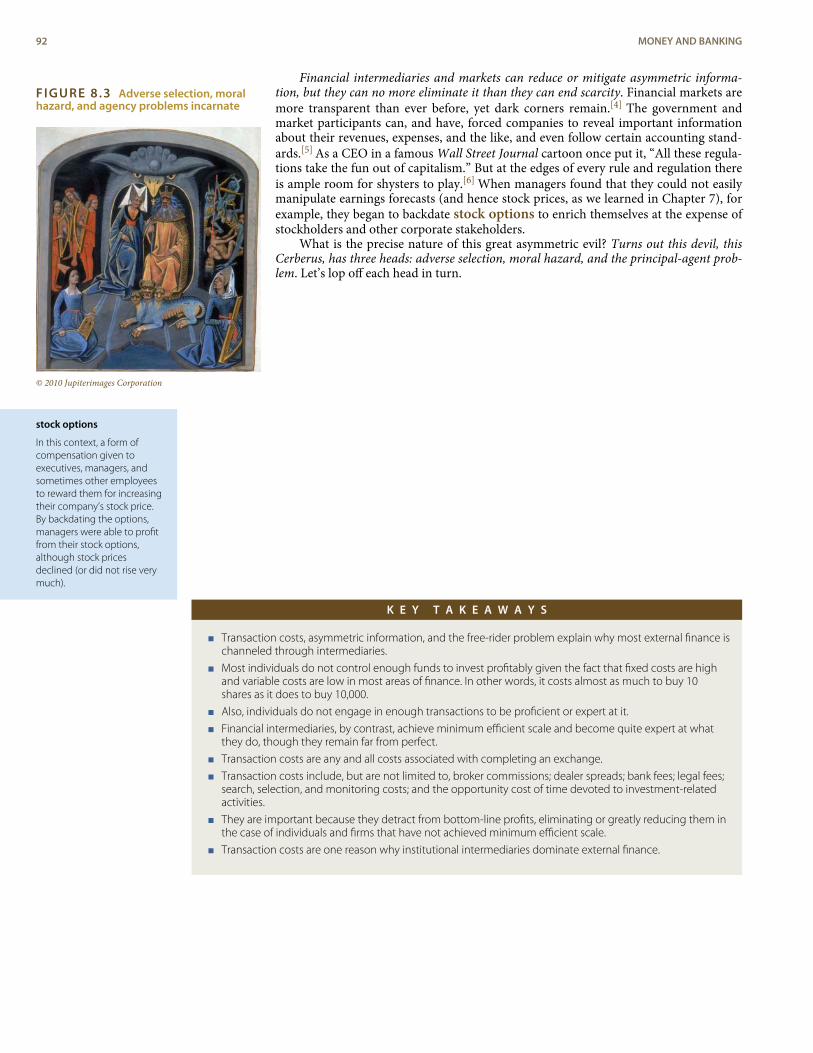
FIGURE 8.3 Adverse selection, moralhazard, and agency problems incarnate
© 2010 Jupiterimages Corporation
stock options
In this context, a form ofcompensation given toexecutives, managers, andsometimes other employeesto reward them for increasingtheir company’s stock price.By backdating the options,managers were able to profitfrom their stock options,although stock pricesdeclined (or did not rise verymuch).
Financial intermediaries and markets can reduce or mitigate asymmetric informa-tion, but they can no more eliminate it than they can end scarcity. Financial markets aremore transparent than ever before, yet dark corners remain.[4] The government andmarket participants can, and have, forced companies to reveal important informationabout their revenues, expenses, and the like, and even follow certain accounting stand-ards.[5] As a CEO in a famous Wall Street Journal cartoon once put it, “All these regula-tions take the fun out of capitalism.” But at the edges of every rule and regulation thereis ample room for shysters to play.[6] When managers found that they could not easilymanipulate earnings forecasts (and hence stock prices, as we learned in Chapter 7), forexample, they began to backdate stock options to enrich themselves at the expense ofstockholders and other corporate stakeholders.
What is the precise nature of this great asymmetric evil? Turns out this devil, thisCerberus, has three heads: adverse selection, moral hazard, and the principal-agent prob-lem. Let’s lop off each head in turn.
K E Y T A K E A W A Y S
< Transaction costs, asymmetric information, and the free-rider problem explain why most external finance ischanneled through intermediaries.
< Most individuals do not control enough funds to invest profitably given the fact that fixed costs are highand variable costs are low in most areas of finance. In other words, it costs almost as much to buy 10shares as it does to buy 10,000.
< Also, individuals do not engage in enough transactions to be proficient or expert at it.
< Financial intermediaries, by contrast, achieve minimum efficient scale and become quite expert at whatthey do, though they remain far from perfect.
< Transaction costs are any and all costs associated with completing an exchange.
< Transaction costs include, but are not limited to, broker commissions; dealer spreads; bank fees; legal fees;search, selection, and monitoring costs; and the opportunity cost of time devoted to investment-relatedactivities.
< They are important because they detract from bottom-line profits, eliminating or greatly reducing them inthe case of individuals and firms that have not achieved minimum efficient scale.
< Transaction costs are one reason why institutional intermediaries dominate external finance.
92 MONEY AND BANKING
3. ADVERSE SELECTION
L E A R N I N G O B J E C T I V E
1. What problems do asymmetric information and, more specifically, adverse selection cause andhow can they be mitigated?
The classic case of adverse selection, the one that brought the phenomenon back[7] to the attention of eco-nomists in 1970, is the market for “lemons,” which is to say, breakdown-prone automobiles. The lemonsstory, with appropriate changes, applies to everything from horses to bonds, to lemons (the fruit), toconstruction services. That is because the lemons story is a simple but powerful one. People who offerlemons for sale know that their cars stink. Most people looking to buy cars, though, can’t tell that a caris prone to breakdown. They might kick the tires, take it for a short spin, look under the hood, etc., allwithout discovering the truth. The seller has superior information and indeed has an incentive to in-crease the asymmetry by putting a Band-Aid over any obvious problems. (He might, for example,warm the car up thoroughly before showing it, put top-quality gasoline in the tank, clean up the oilspots in the driveway, and so forth.) He may even explain that the car was owned by his poor deceasedgrandmother, who used it only to drive to church on Sundays (for services) and Wednesdays (forbingo), and that she took meticulous care of it. The hapless buyer, the story goes, offers the averageprice for used cars of the particular make, model, year, and mileage for sale. The seller happily (andgreedily if you want to be moralistic about it) accepts. A day, week, month, or year later, the buyers learnsthat he has overpaid, that the automobile he purchased is a lemon. He complains to his relatives, friends,and neighbors, many of whom tell similar horror stories. A consensus emerges that all used cars arelemons.
Of course, some used cars are actually “peaches,” very reliable means of personal transportation.The problem is that owners of peaches can’t credibly inform buyers of the car’s quality. Oh, she cansay, truthfully, that the car was owned by her poor deceased grandmother who used it only to drive tochurch on Sundays (for services) and Wednesdays (for bingo) and that she took meticulous care of it.But that sounds a lot like what the owner of the lemon says too. (In fact, we just copied and pasted itfrom above!) So the asymmetric information remains and the hapless buyer offers the average price forused cars of the particular make, model, year, and mileage for sale. (Another copy and paste job!) Butthis time the seller, instead of accepting the offer, gets offended and storms off (or at least declines). So thebuyer’s relatives, friends, and neighbors are half right—not all the used cars for sale are lemons, butthose that are bought are!
Now appears our hero, the used car dealer, who is literally a dealer in the same sense a securitiesdealer is: he buys from sellers at one (bid) price and then sells to buyers at a higher (ask) price. He earnshis profits or spread by facilitating the market process by reducing asymmetric information. Relative tothe common person, he is an expert at assessing the true value of used automobiles. (Or his operationis large enough that he can hire such people and afford to pay them. See the transaction costs sectionabove.) So he pays more for peaches than lemons (ceteris paribus, of course) and the used car marketbegins to function at a much higher level of efficiency. Why is it, then, that the stereotype of the usedcar salesman is not very complimentary? That the guy in Figure 8.4 seems more typical than the guy inFigure 8.5?
CHAPTER 8 FINANCIAL STRUCTURE, TRANSACTION COSTS, AND ASYMMETRIC INFORMATION 93
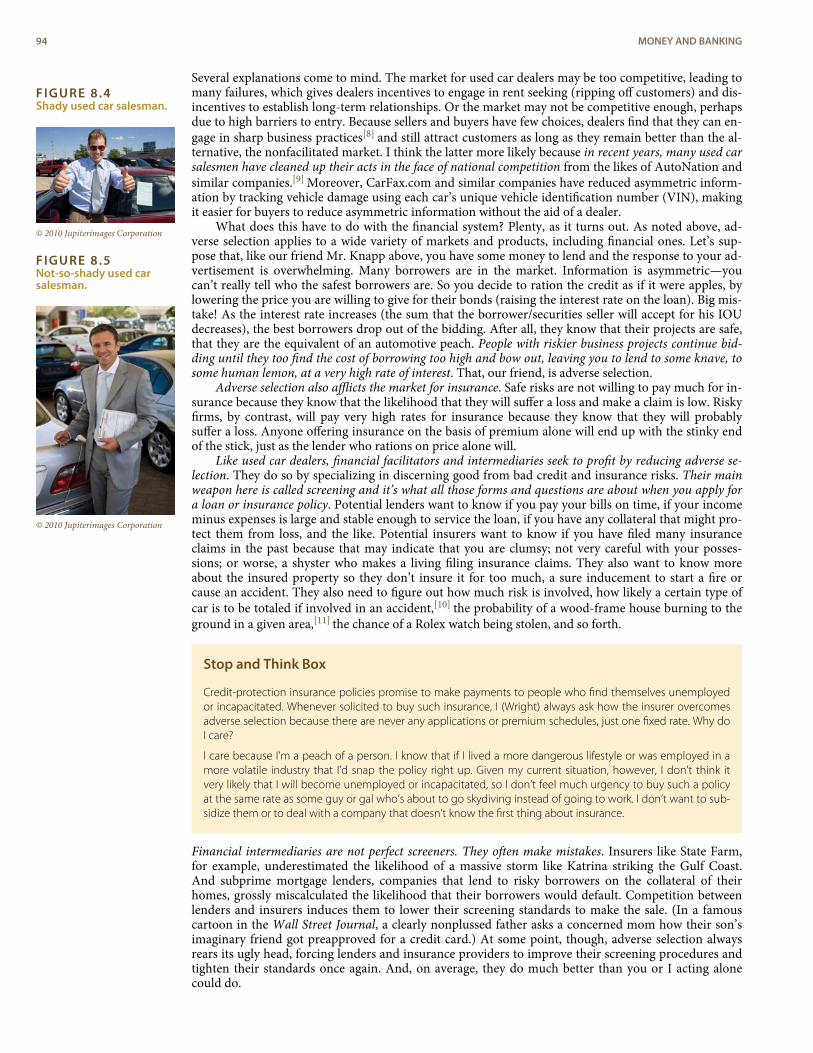
FIGURE 8.4Shady used car salesman.
© 2010 Jupiterimages Corporation
FIGURE 8.5Not-so-shady used carsalesman.
© 2010 Jupiterimages Corporation
Several explanations come to mind. The market for used car dealers may be too competitive, leading tomany failures, which gives dealers incentives to engage in rent seeking (ripping off customers) and dis-incentives to establish long-term relationships. Or the market may not be competitive enough, perhapsdue to high barriers to entry. Because sellers and buyers have few choices, dealers find that they can en-gage in sharp business practices[8] and still attract customers as long as they remain better than the al-ternative, the nonfacilitated market. I think the latter more likely because in recent years, many used carsalesmen have cleaned up their acts in the face of national competition from the likes of AutoNation andsimilar companies.[9] Moreover, CarFax.com and similar companies have reduced asymmetric inform-ation by tracking vehicle damage using each car’s unique vehicle identification number (VIN), makingit easier for buyers to reduce asymmetric information without the aid of a dealer.
What does this have to do with the financial system? Plenty, as it turns out. As noted above, ad-verse selection applies to a wide variety of markets and products, including financial ones. Let’s sup-pose that, like our friend Mr. Knapp above, you have some money to lend and the response to your ad-vertisement is overwhelming. Many borrowers are in the market. Information is asymmetric—youcan’t really tell who the safest borrowers are. So you decide to ration the credit as if it were apples, bylowering the price you are willing to give for their bonds (raising the interest rate on the loan). Big mis-take! As the interest rate increases (the sum that the borrower/securities seller will accept for his IOUdecreases), the best borrowers drop out of the bidding. After all, they know that their projects are safe,that they are the equivalent of an automotive peach. People with riskier business projects continue bid-ding until they too find the cost of borrowing too high and bow out, leaving you to lend to some knave, tosome human lemon, at a very high rate of interest. That, our friend, is adverse selection.
Adverse selection also afflicts the market for insurance. Safe risks are not willing to pay much for in-surance because they know that the likelihood that they will suffer a loss and make a claim is low. Riskyfirms, by contrast, will pay very high rates for insurance because they know that they will probablysuffer a loss. Anyone offering insurance on the basis of premium alone will end up with the stinky endof the stick, just as the lender who rations on price alone will.
Like used car dealers, financial facilitators and intermediaries seek to profit by reducing adverse se-lection. They do so by specializing in discerning good from bad credit and insurance risks. Their mainweapon here is called screening and it’s what all those forms and questions are about when you apply fora loan or insurance policy. Potential lenders want to know if you pay your bills on time, if your incomeminus expenses is large and stable enough to service the loan, if you have any collateral that might pro-tect them from loss, and the like. Potential insurers want to know if you have filed many insuranceclaims in the past because that may indicate that you are clumsy; not very careful with your posses-sions; or worse, a shyster who makes a living filing insurance claims. They also want to know moreabout the insured property so they don’t insure it for too much, a sure inducement to start a fire orcause an accident. They also need to figure out how much risk is involved, how likely a certain type ofcar is to be totaled if involved in an accident,[10] the probability of a wood-frame house burning to theground in a given area,[11] the chance of a Rolex watch being stolen, and so forth.
Stop and Think Box
Credit-protection insurance policies promise to make payments to people who find themselves unemployedor incapacitated. Whenever solicited to buy such insurance, I (Wright) always ask how the insurer overcomesadverse selection because there are never any applications or premium schedules, just one fixed rate. Why doI care?
I care because I’m a peach of a person. I know that if I lived a more dangerous lifestyle or was employed in amore volatile industry that I’d snap the policy right up. Given my current situation, however, I don’t think itvery likely that I will become unemployed or incapacitated, so I don’t feel much urgency to buy such a policyat the same rate as some guy or gal who’s about to go skydiving instead of going to work. I don’t want to sub-sidize them or to deal with a company that doesn’t know the first thing about insurance.
Financial intermediaries are not perfect screeners. They often make mistakes. Insurers like State Farm,for example, underestimated the likelihood of a massive storm like Katrina striking the Gulf Coast.And subprime mortgage lenders, companies that lend to risky borrowers on the collateral of theirhomes, grossly miscalculated the likelihood that their borrowers would default. Competition betweenlenders and insurers induces them to lower their screening standards to make the sale. (In a famouscartoon in the Wall Street Journal, a clearly nonplussed father asks a concerned mom how their son’simaginary friend got preapproved for a credit card.) At some point, though, adverse selection alwaysrears its ugly head, forcing lenders and insurance providers to improve their screening procedures andtighten their standards once again. And, on average, they do much better than you or I acting alonecould do.
94 MONEY AND BANKING
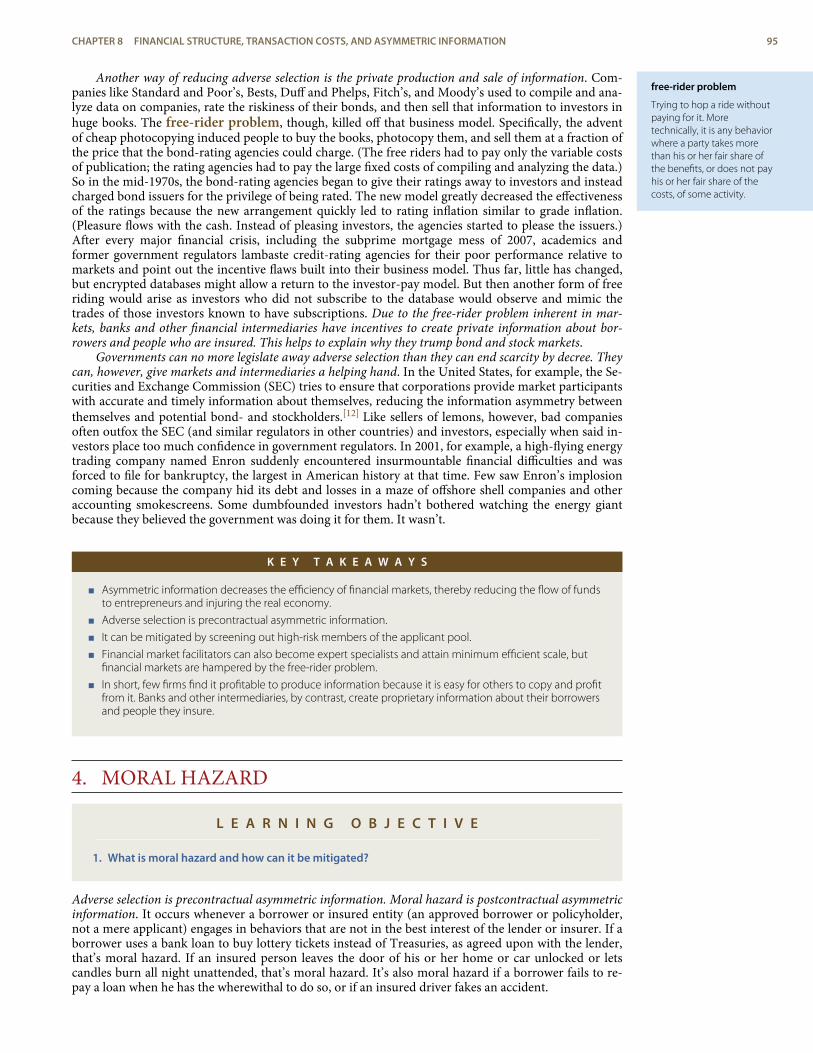
free-rider problem
Trying to hop a ride withoutpaying for it. Moretechnically, it is any behaviorwhere a party takes morethan his or her fair share ofthe benefits, or does not payhis or her fair share of thecosts, of some activity.
Another way of reducing adverse selection is the private production and sale of information. Com-panies like Standard and Poor’s, Bests, Duff and Phelps, Fitch’s, and Moody’s used to compile and ana-lyze data on companies, rate the riskiness of their bonds, and then sell that information to investors inhuge books. The free-rider problem, though, killed off that business model. Specifically, the adventof cheap photocopying induced people to buy the books, photocopy them, and sell them at a fraction ofthe price that the bond-rating agencies could charge. (The free riders had to pay only the variable costsof publication; the rating agencies had to pay the large fixed costs of compiling and analyzing the data.)So in the mid-1970s, the bond-rating agencies began to give their ratings away to investors and insteadcharged bond issuers for the privilege of being rated. The new model greatly decreased the effectivenessof the ratings because the new arrangement quickly led to rating inflation similar to grade inflation.(Pleasure flows with the cash. Instead of pleasing investors, the agencies started to please the issuers.)After every major financial crisis, including the subprime mortgage mess of 2007, academics andformer government regulators lambaste credit-rating agencies for their poor performance relative tomarkets and point out the incentive flaws built into their business model. Thus far, little has changed,but encrypted databases might allow a return to the investor-pay model. But then another form of freeriding would arise as investors who did not subscribe to the database would observe and mimic thetrades of those investors known to have subscriptions. Due to the free-rider problem inherent in mar-kets, banks and other financial intermediaries have incentives to create private information about bor-rowers and people who are insured. This helps to explain why they trump bond and stock markets.
Governments can no more legislate away adverse selection than they can end scarcity by decree. Theycan, however, give markets and intermediaries a helping hand. In the United States, for example, the Se-curities and Exchange Commission (SEC) tries to ensure that corporations provide market participantswith accurate and timely information about themselves, reducing the information asymmetry betweenthemselves and potential bond- and stockholders.[12] Like sellers of lemons, however, bad companiesoften outfox the SEC (and similar regulators in other countries) and investors, especially when said in-vestors place too much confidence in government regulators. In 2001, for example, a high-flying energytrading company named Enron suddenly encountered insurmountable financial difficulties and wasforced to file for bankruptcy, the largest in American history at that time. Few saw Enron’s implosioncoming because the company hid its debt and losses in a maze of offshore shell companies and otheraccounting smokescreens. Some dumbfounded investors hadn’t bothered watching the energy giantbecause they believed the government was doing it for them. It wasn’t.
K E Y T A K E A W A Y S
< Asymmetric information decreases the efficiency of financial markets, thereby reducing the flow of fundsto entrepreneurs and injuring the real economy.
< Adverse selection is precontractual asymmetric information.
< It can be mitigated by screening out high-risk members of the applicant pool.
< Financial market facilitators can also become expert specialists and attain minimum efficient scale, butfinancial markets are hampered by the free-rider problem.
< In short, few firms find it profitable to produce information because it is easy for others to copy and profitfrom it. Banks and other intermediaries, by contrast, create proprietary information about their borrowersand people they insure.
4. MORAL HAZARD
L E A R N I N G O B J E C T I V E
1. What is moral hazard and how can it be mitigated?
Adverse selection is precontractual asymmetric information. Moral hazard is postcontractual asymmetricinformation. It occurs whenever a borrower or insured entity (an approved borrower or policyholder,not a mere applicant) engages in behaviors that are not in the best interest of the lender or insurer. If aborrower uses a bank loan to buy lottery tickets instead of Treasuries, as agreed upon with the lender,that’s moral hazard. If an insured person leaves the door of his or her home or car unlocked or letscandles burn all night unattended, that’s moral hazard. It’s also moral hazard if a borrower fails to re-pay a loan when he has the wherewithal to do so, or if an insured driver fakes an accident.
CHAPTER 8 FINANCIAL STRUCTURE, TRANSACTION COSTS, AND ASYMMETRIC INFORMATION 95
restrictive covenants
Clauses in loan contracts thatrestrict the uses to whichborrowed funds can be putand otherwise directborrower behavior.
We call such behavior moral hazard because it was long thought to indicate a lack of morals or char-acter and in a sense it does. But thinking about the problem in those terms does not help to mitigate it.We all have a price. How high that price is can’t be easily determined and may indeed change, butoffered enough money, every human being (except maybe Gandhi, prophets, and saints) will engage inimmoral activities for personal gain if given the chance. It’s tempting indeed to put other people’smoney at risk. As we’ve learned, the more risk, the more reward. Why not borrow money to put torisk? If the rewards come, the principal and interest are easily repaid. If the rewards don’t come, theborrower defaults and suffers but little. Back in the day, as they say, borrowers who didn’t repay theirloans were thrown into jail until they paid up. Three problems eventually ended that practice. First, it isdifficult to earn money to repay the loan when you’re imprisoned! (The original assumption was thatthe borrower had the money but wouldn’t cough it up.) Second, not everyone defaults on a loan due tomoral hazard. Bad luck, a soft economy, and/or poor execution can turn the best business plan tomush. Third, lenders are almost as culpable as the borrowers for moral hazard if they don’t take stepsto try to mitigate it. A locked door, an old adage goes, keeps an honest man honest. Don’t temptpeople, in other words, and most won’t rob you. There are locks against moral hazard. They are notfoolproof but they get the job done most of the time.
Stop and Think Box
Investment banks engage in many activities, two of which, research and underwriting, have created conflictsof interest. The customers of ibanks’ research activities, investors, want unbiased information. The customers ofibanks’ underwriting activities, bond issuers, want optimistic reports. A few years back, problems arose whenthe interests of bond issuers, who provided ibanks with most of their profits, began to supersede the interestsof investors. Specifically, ibank managers forced their research departments to avoid making negative or con-troversial comments about clients. The situation grew worse during the Internet stock mania of the late 1990s,when ibank research analysts like Jack Grubman (a Dickensian name but true!) of Citigroup (then SalomonSmith Barney) made outrageous claims about the value of high-tech companies. That in itself wasn’t evil be-cause everyone makes mistakes. What raised hackles was that the private e-mails of those same analysts indic-ated that they thought the companies they were hyping were extremely weak. And most were. What sort ofproblem does this particular conflict of interest represent? How does it injure the economy? What can bedone to rectify the problem?
This is an example of asymmetric information and, more specifically, moral hazard. Investors contracted withthe ibanks for unbiased investment research but instead received extremely biased advice that induced themto pay too much for securities, particularly the equities of weak tech companies. As a result, the efficiency ofour financial markets decreased as resources went to firms that did not deserve them and could not put themto their most highly valued use. That, of course, injured economic growth. One way to solve this problemwould be to allow ibanks to engage in securities underwriting or research, but not both. That would makeibanks less profitable, though, as doing both creates economies of scope. (That’s why ibanks got into the busi-ness of selling research in the first place.) Another solution is to create a “Chinese wall” within each ibankbetween their research and underwriting departments. This apparent reference to the Great Wall of China,which despite its grandeur was repeatedly breached by “barbarian” invaders with help from insiders, also be-lies that strategy’s weakness.[13] If the wall is so high that it is impenetrable, then the economies of scope arediminished to the vanishing point. If the wall is low or porous, then the conflict of interest can again arise. Ra-tional expectations and transparency could help here. Investors now know (or at least could/should know)that ibanks can provide biased research reports and hence should remain wary. Government regulationscould help here by mandating that ibanks completely and accurately disclose their interests in the companiesthat they research and evaluate. That extra transparency would then allow investors to discount rosy pro-gnostications that appear to be driven by ibanks’ underwriting interests. The Global Legal Settlement of 2002,which was brokered by Eliot Spitzer (then New York State Attorney General and New York’s governor until heran into a little moral hazard problem himself!), bans spinning, requires investment banks to sever the linksbetween underwriting and research, and slapped a $1.4 billion fine on the ten largest ibanks.
The main weapon against moral hazard is monitoring, which is just a fancy term for paying attention!No matter how well they have screened (reduced adverse selection), lenders and insurers cannot con-tract and forget. They have to make sure that their customers do not use the superior information in-herent in their situation to take advantage. Banks have a particularly easy and powerful way of doingthis: watching checking accounts. Banks rarely provide cash loans because the temptation of runningoff with the money, the moral hazard, would be too high. Instead, they credit the amount of the loan toa checking account upon which the borrower can draw funds. (This procedure has a second positivefeature for banks called compensatory balances. A loan for, say, $1 million does not leave the bank atonce but does so only gradually. That raises the effective interest rate because the borrower pays in-terest on the total sum, not just that drawn out of the bank.) The bank can then watch to ensure thatthe borrower is using the funds appropriately. Most loans contain restrictive covenants, clauses that
96 MONEY AND BANKING
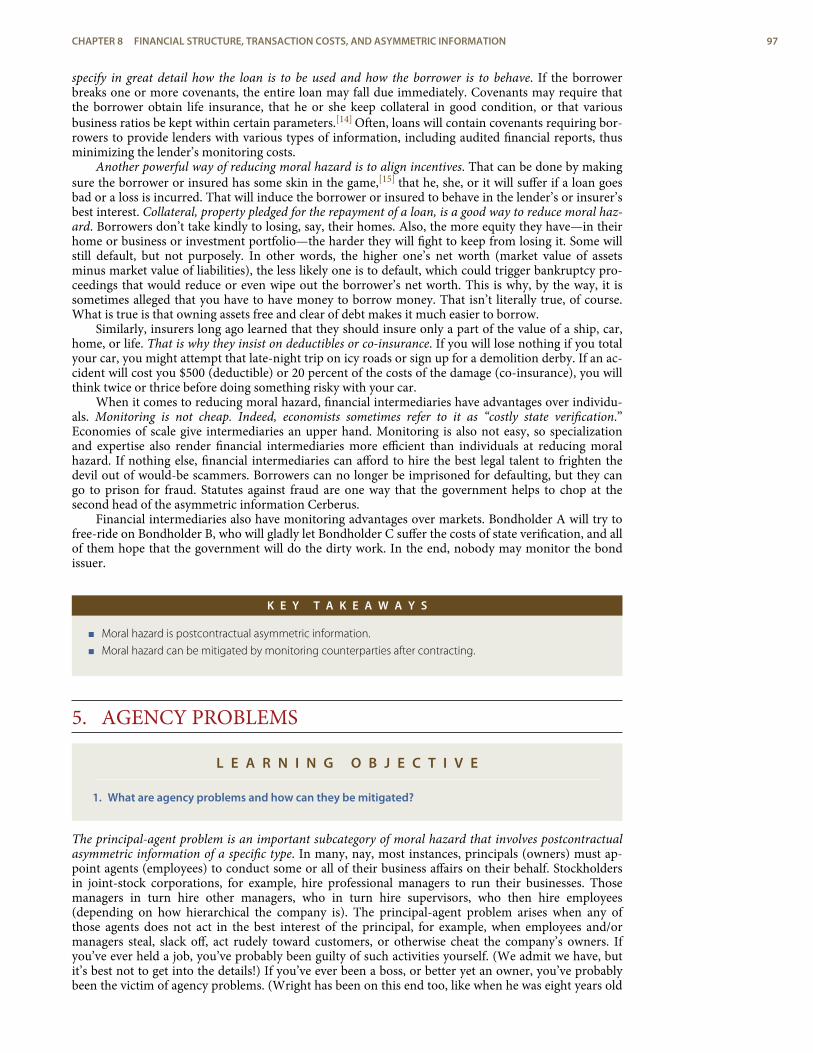
specify in great detail how the loan is to be used and how the borrower is to behave. If the borrowerbreaks one or more covenants, the entire loan may fall due immediately. Covenants may require thatthe borrower obtain life insurance, that he or she keep collateral in good condition, or that variousbusiness ratios be kept within certain parameters.[14] Often, loans will contain covenants requiring bor-rowers to provide lenders with various types of information, including audited financial reports, thusminimizing the lender’s monitoring costs.
Another powerful way of reducing moral hazard is to align incentives. That can be done by makingsure the borrower or insured has some skin in the game,[15] that he, she, or it will suffer if a loan goesbad or a loss is incurred. That will induce the borrower or insured to behave in the lender’s or insurer’sbest interest. Collateral, property pledged for the repayment of a loan, is a good way to reduce moral haz-ard. Borrowers don’t take kindly to losing, say, their homes. Also, the more equity they have—in theirhome or business or investment portfolio—the harder they will fight to keep from losing it. Some willstill default, but not purposely. In other words, the higher one’s net worth (market value of assetsminus market value of liabilities), the less likely one is to default, which could trigger bankruptcy pro-ceedings that would reduce or even wipe out the borrower’s net worth. This is why, by the way, it issometimes alleged that you have to have money to borrow money. That isn’t literally true, of course.What is true is that owning assets free and clear of debt makes it much easier to borrow.
Similarly, insurers long ago learned that they should insure only a part of the value of a ship, car,home, or life. That is why they insist on deductibles or co-insurance. If you will lose nothing if you totalyour car, you might attempt that late-night trip on icy roads or sign up for a demolition derby. If an ac-cident will cost you $500 (deductible) or 20 percent of the costs of the damage (co-insurance), you willthink twice or thrice before doing something risky with your car.
When it comes to reducing moral hazard, financial intermediaries have advantages over individu-als. Monitoring is not cheap. Indeed, economists sometimes refer to it as “costly state verification.”Economies of scale give intermediaries an upper hand. Monitoring is also not easy, so specializationand expertise also render financial intermediaries more efficient than individuals at reducing moralhazard. If nothing else, financial intermediaries can afford to hire the best legal talent to frighten thedevil out of would-be scammers. Borrowers can no longer be imprisoned for defaulting, but they cango to prison for fraud. Statutes against fraud are one way that the government helps to chop at thesecond head of the asymmetric information Cerberus.
Financial intermediaries also have monitoring advantages over markets. Bondholder A will try tofree-ride on Bondholder B, who will gladly let Bondholder C suffer the costs of state verification, and allof them hope that the government will do the dirty work. In the end, nobody may monitor the bondissuer.
K E Y T A K E A W A Y S
< Moral hazard is postcontractual asymmetric information.
< Moral hazard can be mitigated by monitoring counterparties after contracting.
5. AGENCY PROBLEMS
L E A R N I N G O B J E C T I V E
1. What are agency problems and how can they be mitigated?
The principal-agent problem is an important subcategory of moral hazard that involves postcontractualasymmetric information of a specific type. In many, nay, most instances, principals (owners) must ap-point agents (employees) to conduct some or all of their business affairs on their behalf. Stockholdersin joint-stock corporations, for example, hire professional managers to run their businesses. Thosemanagers in turn hire other managers, who in turn hire supervisors, who then hire employees(depending on how hierarchical the company is). The principal-agent problem arises when any ofthose agents does not act in the best interest of the principal, for example, when employees and/ormanagers steal, slack off, act rudely toward customers, or otherwise cheat the company’s owners. Ifyou’ve ever held a job, you’ve probably been guilty of such activities yourself. (We admit we have, butit’s best not to get into the details!) If you’ve ever been a boss, or better yet an owner, you’ve probablybeen the victim of agency problems. (Wright has been on this end too, like when he was eight years old
CHAPTER 8 FINANCIAL STRUCTURE, TRANSACTION COSTS, AND ASYMMETRIC INFORMATION 97
efficiency wages
Wages higher than theequilibrium or marketclearing rate. Employers offerthem to reduce agencyproblems, hoping employeeswill value their jobs so muchthey will try to please ownersby behaving in the owners’interest.
and his brother told him their lemonade stand had revenues of only $1.50 when in fact it brought in$10.75. Hey, that was a lot of money back then!)
Stop and Think Box
As one of the authors of this textbook[16] and many others have pointed out, investment banks often under-price stock initial public offerings (IPOs). In other words, they offer the shares of early-stage companies that de-cide to go public for too little money, as evidenced by the large first day “pops” or “bumps” in the stock pricein the aftermarket (the secondary market). Pricing the shares of a new company is tricky business, but the un-derpricing was too prevalent to have been honest errors, which one would think would be too high about halfof the time and too low the other half. All sorts of reasons were proffered for the systematic underpricing, in-cluding the fact that many shares could not be “flipped” or resold for some weeks or months after the IPO.Upon investigation, however, a major cause of underpricing turned out to be a conflict of interest called spin-ning: ibanks often purposely underpriced IPOs so that there would be excess demand, so that investors woulddemand a larger quantity of shares than were being offered. Whenever that occurs, shares must be rationedby nonprice mechanisms. The ibanks could then dole out the hot shares to friends or family, and, in return forfuture business, the executives of other companies! Who does spinning hurt? Help? Be as specific as possible.
Spinning hurts the owners of the company going public because they do not receive as much from the IPO asthey could have if the shares were priced closer to the market rate. It may also hurt investors in the companieswhose executives received the underpriced shares who, in reciprocation for the hot shares, might not use thebest ibank when their companies later issue bonds or stock or attempt a merger or acquisition. Spinning helpsthe ibank by giving it a tool to acquire more business. It also aids whoever gets the underpriced shares.
Monitoring helps to mitigate the principal-agent problem. That’s what supervisors, cameras, and corpor-ate snitches are for. Another, often more powerful way of reducing agency problems is to try to align theincentives of employees with those of owners by paying efficiency wages, commissions, bonuses, stockoptions, and the like. Caution is the watchword here, though, because people will do precisely what theyhave incentive to do. Failure to recognize that apparently universal human trait has had adverse con-sequences for some organizations, a point made in business schools through easily understood casestories. In one story, a major ice cream retailer decided to help out its employees by allowing them toconsume, free of charge, any mistakes they might make in the course of serving customers. What wasmeant to be an environmentally sensitive (no waste) little perk turned into a major problem as employeewaistlines bulged and profits shrank because hungry employees found it easy to make delicious frozenmistakes. (“Oh, you said chocolate. I thought you said my favorite flavor, mint chocolate chip. Excuseme because I am now on break.”)
In another story, a debt collection agency reduced its efficiency and profitability by agreeing to achange in the way that it compensated its collectors. Initially, collectors received bonuses based on thedollars collected divided by the dollars assigned to be collected. So, for example, a collector whobrought in $250,000 of the $1 million due on his accounts would receive a bigger bonus than a collectorwho collected only $100,000 of the same denominator (250/1,000 = .25 > 100/1,000 = .10). Collectorscomplained, however, that it was not fair to them if one or more of their accounts went bankrupt, ren-dering collection impossible. The managers of the collection agency agreed and began to deduct thevalue of bankrupt accounts from the collectors’ denominators. Under the new incentive scheme, a col-lector who brought in $100,000 would receive a bigger bonus than his colleague if, say, $800,000 of hisaccounts claimed bankruptcy (100/[1,000 – 800 = 200] = .5, which is > 250/1,000 = .25). Soon, the col-lectors transformed themselves into bankruptcy counselors! The new scheme inadvertently created aperverse incentive, that is, one diametrically opposed to the collection agency’s interest, which was tocollect as many dollars as possible, not to help debtors file for bankruptcy.
In a competitive market, pressure from competitors and the incentives of managers would soonrectify such mishaps. But when the incentive structure of management is out of kilter, bigger and deep-er problems often appear. When managers are paid with stock options, for instance, they are given anincentive to increase stock prices, which they almost invariably do, sometimes by making their com-panies’ more efficient but sometimes, as investors in the U.S. stock market in the late 1990s learned,through accounting legerdemain. Therefore, corporate governance looms large and requires constant at-tention from shareholders, business consulting firms, and government regulators.
A free-rider problem, however, makes it difficult to coordinate the monitoring activities that keepagents in line. If Stockholder A watches management, then Stockholder B doesn’t have to but he willstill reap the benefits of the monitoring. Ditto with Stockholder A, who sits around hoping StockholderB will do the dirty and costly work of monitoring executive pay and perks, and the like. Often, nobodyends up monitoring managers, who raise their salaries to obscene levels, slack off work, go empire-building, or all three![17] This governance conundrum helps to explain why the sale of stocks is such arelatively unimportant form of external finance worldwide.
98 MONEY AND BANKING
initial public offering (IPO)
Offering of stock to investorswith the aid of an investmentbank.
direct public offering (DPO)
Offering of stock to investorswithout the aid of aninvestment bank.
Governance becomes less problematic when the equity owner is actively involved in management.That is why investment banker J. P. Morgan used to put “his people” (principals in J.P. Morgan andCompany) on the boards of companies in which Morgan had large stakes. A similar approach has longbeen used by Warren Buffett’s Berkshire Hathaway. Venture capital firms also insist on taking somemanagement control and have the added advantage that the equity of startup firms does not, indeedcannot, trade. (It does only after it holds an IPO or direct public offering [DPO]). So other investorscannot free-ride on its costly state verification. The recent interest in private equity, funds invested inprivately owned (versus publicly traded) companies, stems from this dynamic as well as the desire toavoid costly regulations like Sarbanes-Oxley.[18]
Stop and Think Box
Investment banks are not the only financial services firms that have recently suffered from conflicts of interest.Accounting firms that both audit (confirm the accuracy and appropriateness of) corporate financial state-ments and provide tax, business strategy, and other consulting services found it difficult to reconcile the con-flicts inherent in being both the creator and the inspector of businesses. Auditors were too soft in the hopes ofwinning or keeping consulting business because they could not very well criticize the plans put in place bytheir own consultants. One of the big five accounting firms, Arthur Andersen, actually collapsed after the mar-ket and the SEC discovered that its auditing procedures had been compromised. How could this type of con-flict of interest be reduced?
In this case, simply informing investors of the problem would probably not work. Financial statements have tobe correct; the free-rider problem ensures that no investor would have an incentive to verify them him- or her-self. The traditional solution to this problem was the auditor and no better one has yet been found. But thequestion is, How to ensure that auditors do their jobs? One answer, enacted in the Sarbanes-Oxley Act of 2002(aka SOX and Sarbox), is to establish a new regulator, the Public Company Accounting Oversight Board(PCAOB) to oversee the activities of auditors.[19] The law also increased the SEC’s budget (but it’s still tiny com-pared to the grand scheme of things), made it illegal for accounting firms to offer audit and nonaudit servicessimultaneously, and increased criminal charges for white-collar crimes. The most controversial provision inSOX requires corporate executive officers (CEOs) and corporate financial officers (CFOs) to certify the accuracyof corporate financial statements and requires corporate boards to establish unpaid audit committees com-posed of outside directors, that is, directors who are not members of management. The jury is still out on SOX.The consensus so far appears to be that it is overkill: that it costs too much given the benefits it provides.
Government regulators try to reduce asymmetric information. Sometimes they succeed. Often,however, they do not. Asymmetric information is such a major problem, however, that their efforts willlikely continue, whether all businesses like it or not.
K E Y T A K E A W A Y S
< Agency problems are a special form of moral hazard involving employers and employees or otherprincipal-agent relationships.
< Agency problems can be mitigated by closely aligning the incentives of the agents (employees) withthose of the principal (employer).
< Regulations are essentially attempts by the government to subdue the Cerberus of asymmetricinformation.
< Some government regulations, like laws against fraud, are clearly necessary and highly effective.
< Others, though, like parts of Sarbanes-Oxley, may add to the costs of doing business without muchcorresponding gain.
6. SUGGESTED READINGAllen, Franklin, and Douglas Gale. Comparing Financial Systems. Cambridge, MA: MIT Press,
2001.Demirguc-Kunt, Asli, and Ross Levine. Financial Structure and Economic Growth: A Cross-Coun-
try Comparison of Banks, Markets, and Development. Cambridge, MA: MIT Press, 2004.Laffont, Jean-Jacques, and David Martimort. The Theory of Incentives: The Principal-Agent Model.
Princeton, NJ: Princeton University Press, 2001.
CHAPTER 8 FINANCIAL STRUCTURE, TRANSACTION COSTS, AND ASYMMETRIC INFORMATION 99
1.2.
3.4.5.6.
7.
8.9.
10.11.12.13.14.15.16.17.18.19.
ENDNOTES
http://www.berkshirehathaway.com/
For details, see “Options Grow for Investors to Lend Online,” Wall Street Journal, July18, 2007.
http://en.wikipedia.org/wiki/The_World_is_Flat
http://www.investopedia.com/articles/00/100900.asp
http://www.fasb.org/
http://knowledge.wharton.upenn.edu/article.cfm?articleid=585&CFID=4138806&CFTOKEN=88010645
Classical economists like Adam Smith recognized adverse selection and asymmetricinformation more generally, but they did not label or stress the concepts.
http://www.m-w.com/dictionary/sharp
http://en.wikipedia.org/wiki/AutoNation
http://www.edmunds.com/ownership/safety/articles/43804/article.html
http://www.usfa.dhs.gov/statistics/national/residential.shtm
http://www.sec.gov/
http://en.wikipedia.org/wiki/Great_Wall_of_China
http://www.toolkit.cch.com/text/P06_7100.asp
http://www.answers.com/topic/skin-in-the-game
http://ideas.repec.org/a/taf/acbsfi/v12y2002i3p419-437.html
http://www.investopedia.com/terms/e/empirebuilding.asp
http://www.sec.gov/info/smallbus/pnealis.pdf
http://www.pcaobus.org/
100 MONEY AND BANKING
C H A P T E R 9Bank Management
C H A P T E R O B J E C T I V E S
By the end of this chapter, students should be able to:
1. Explain what a balance sheet and a T-account are.
2. Explain what banks do in five words and also at length.
3. Describe how bankers manage their banks’ balance sheets.
4. Explain why regulators mandate minimum reserve and capital ratios.
5. Describe how bankers manage credit risk.
6. Describe how bankers manage interest rate risk.
7. Describe off-balance sheet activities and explain their importance.
1. THE BALANCE SHEET
L E A R N I N G O B J E C T I V E
1. What is a balance sheet and what are the major types of bank assets and liabilities?
Thus far, we’ve studied financial markets and institutions from 30,000 feet. We’re finally ready to “divedown to the deck” and learn how banks and other financial intermediaries are actually managed. Westart with the balance sheet, a financial statement that takes a snapshot of what a company owns(assets) and owes (liabilities) at a given moment. The key equation here is a simple one:
ASSETS (aka uses of funds) = LIABILITIES (aka sources of funds) + EQUITY (aka net worth orcapital).
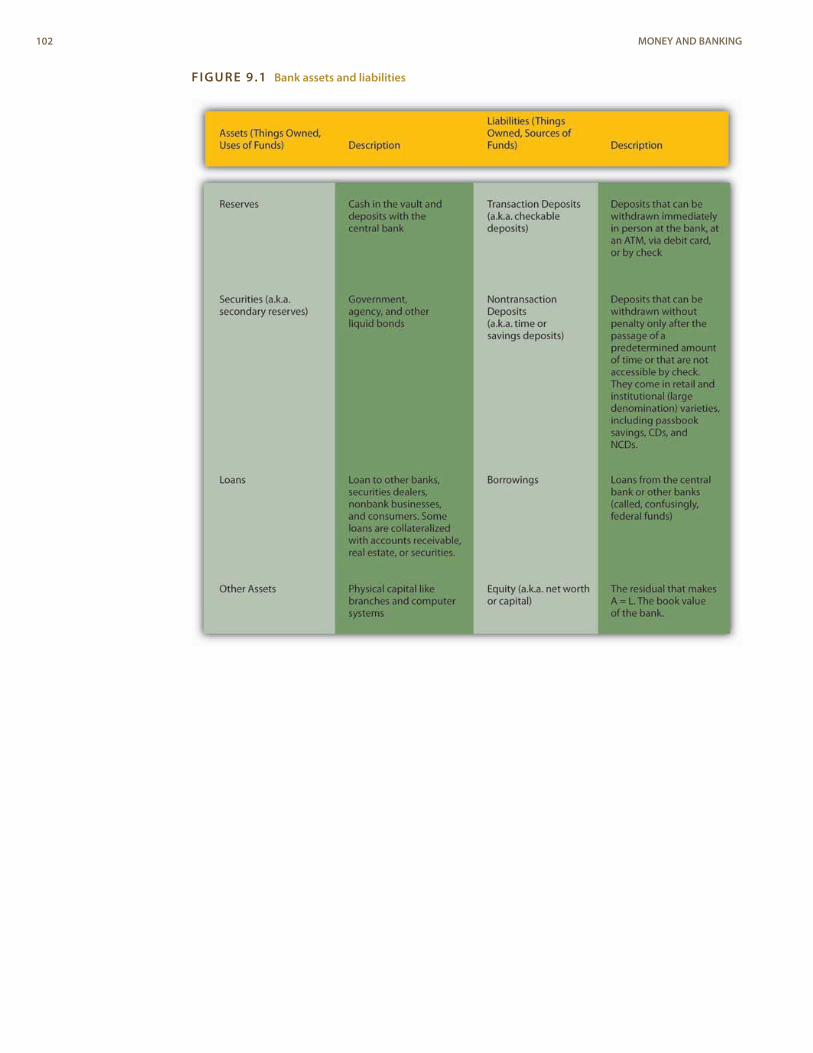
FIGURE 9.1 Bank assets and liabilities
102 MONEY AND BANKING
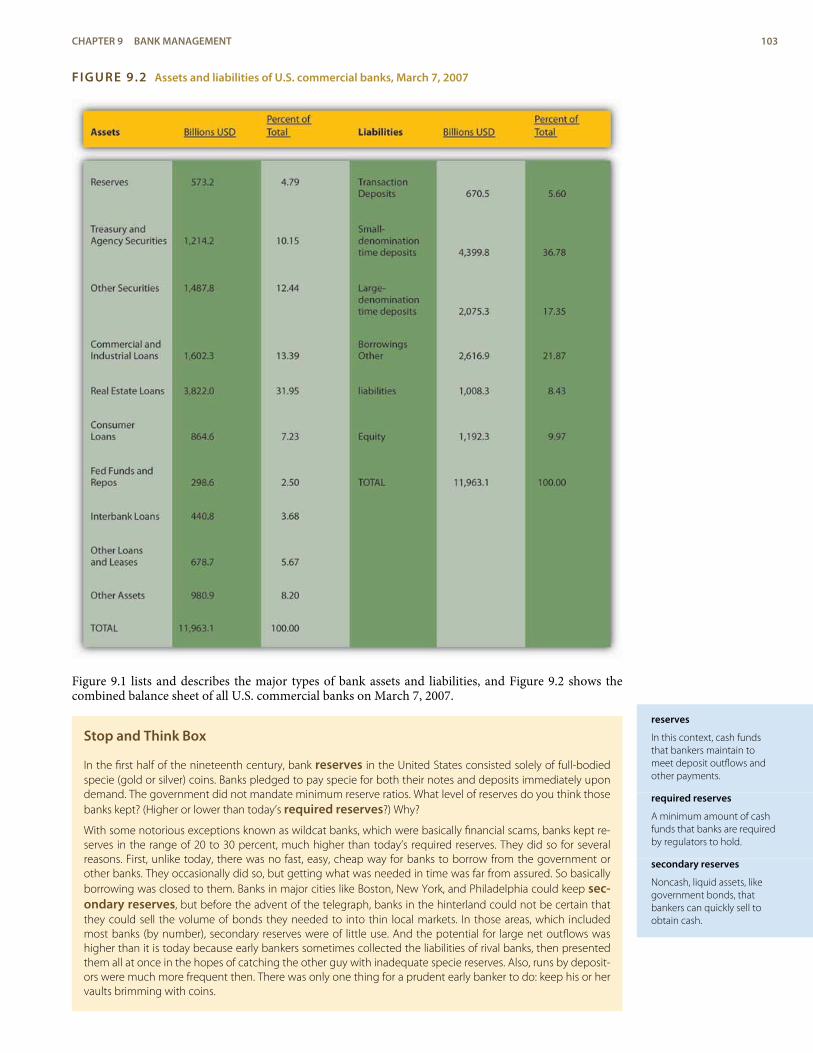
reserves
In this context, cash fundsthat bankers maintain tomeet deposit outflows andother payments.
required reserves
A minimum amount of cashfunds that banks are requiredby regulators to hold.
secondary reserves
Noncash, liquid assets, likegovernment bonds, thatbankers can quickly sell toobtain cash.
FIGURE 9.2 Assets and liabilities of U.S. commercial banks, March 7, 2007
Figure 9.1 lists and describes the major types of bank assets and liabilities, and Figure 9.2 shows thecombined balance sheet of all U.S. commercial banks on March 7, 2007.
Stop and Think Box
In the first half of the nineteenth century, bank reserves in the United States consisted solely of full-bodiedspecie (gold or silver) coins. Banks pledged to pay specie for both their notes and deposits immediately upondemand. The government did not mandate minimum reserve ratios. What level of reserves do you think thosebanks kept? (Higher or lower than today’s required reserves?) Why?
With some notorious exceptions known as wildcat banks, which were basically financial scams, banks kept re-serves in the range of 20 to 30 percent, much higher than today’s required reserves. They did so for severalreasons. First, unlike today, there was no fast, easy, cheap way for banks to borrow from the government orother banks. They occasionally did so, but getting what was needed in time was far from assured. So basicallyborrowing was closed to them. Banks in major cities like Boston, New York, and Philadelphia could keep sec-ondary reserves, but before the advent of the telegraph, banks in the hinterland could not be certain thatthey could sell the volume of bonds they needed to into thin local markets. In those areas, which includedmost banks (by number), secondary reserves were of little use. And the potential for large net outflows washigher than it is today because early bankers sometimes collected the liabilities of rival banks, then presentedthem all at once in the hopes of catching the other guy with inadequate specie reserves. Also, runs by deposit-ors were much more frequent then. There was only one thing for a prudent early banker to do: keep his or hervaults brimming with coins.
CHAPTER 9 BANK MANAGEMENT 103
bank holding company
A corporate entity than ownsone or more banks andbanking-related subsidiaries.
K E Y T A K E A W A Y S
< A balance sheet is a financial statement that lists what a company owns (its assets or uses of funds) andwhat it owes (its liabilities or sources of funds).
< Major bank assets include reserves, secondary reserves, loans, and other assets.
< Major bank liabilities include deposits, borrowings, and shareholder equity.
2. ASSETS, LIABILITIES, AND T-ACCOUNTS
L E A R N I N G O B J E C T I V E S
1. In five words, what do banks do?2. Without a word limitation, how would you describe what functions they fulfill?
As Figure 9.1 and Figure 9.2 show, commercial banks own reserves of cash and deposits with the Fed;secondary reserves of government and other liquid securities; loans to businesses, consumers, and oth-er banks; and other assets, including buildings, computer systems, and other physical stuff. Each ofthose assets plays an important role in the bank’s overall business strategy. A bank’s physical assets areneeded to conduct its business, whether it be a traditional brick-and-mortar bank, a full e-commercebank (there are servers and a headquarters someplace), or a hybrid click-and-mortar institution.Reserves allow banks to pay their transaction deposits and other liabilities. In many countries, regulat-ors mandate a minimum level of reserves, called required reserves. When banks hold more than the re-serve requirement, the extra reserves are called excess reserves. Because reserves pay no interest, Amer-ican bankers generally keep excess reserves to a minimum, preferring instead to hold secondary re-serves like U.S. Treasuries and other safe, liquid, interest-earning securities. Banks’ bread-and-butterasset is, of course, their loans. They derive most of their income from loans, so they must be very care-ful who they lend to and on what terms. Banks lend to other banks via the federal funds market, butalso in the process of clearing checks, which are called “cash items in process of collection.” Most oftheir loans, however, go to nonbanks. Some loans are uncollateralized, but many are backed by real es-tate (in which case the loans are called mortgages), accounts receivable (factorage), or securities (callloans).
Stop and Think Box
Savings banks, a type of bank that issues only savings deposits, and life insurance companies hold significantlyfewer reserves than commercial banks do. Why?
Savings banks and life insurance companies do not suffer large net outflows very often. People do draw downtheir savings by withdrawing money from their savings accounts, cashing in their life insurance, or taking outpolicy loans, but remember that one of the advantages of relatively large intermediaries is that they can oftenmeet outflows from inflows. In other words, savings banks and life insurance companies can usually pay cus-tomer A’s withdrawal (policy loan or surrender) from customer B’s deposit (premium payment). Therefore, theyhave no need to carry large reserves, which are expensive in terms of opportunity costs.
Where do banks get the wherewithal to purchase those assets? The right-hand side of the balance sheetlists a bank’s liabilities or the sources of its funds. Transaction deposits include negotiable order of with-drawal accounts (NOW) and money market deposit accounts (MMDAs), in addition to good oldcheckable deposits. Banks like transaction deposits because they can avoid paying much, if any, intereston them. Some depositors find the liquidity that transaction accounts provide so convenient they evenpay for the privilege of keeping their money in the bank via various fees, of which more anon. Banksjustify the fees by pointing out that it is costly to keep the books, transfer money, and maintain suffi-cient cash reserves to meet withdrawals.
The administrative costs of nontransaction deposits are lower so banks pay interest for thosefunds. Nontransaction deposits range from the traditional passbook savings account to negotiable cer-tificates of deposit (NCDs) with denominations greater than $100,000. Checks cannot be drawn onpassbook savings accounts, but depositors can withdraw from or add to the account at will. Becausethey are more liquid, they pay lower rates of interest than time deposits (aka certificates of deposit),which impose stiff penalties for early withdrawals. Banks also borrow outright from other banks
104 MONEY AND BANKING
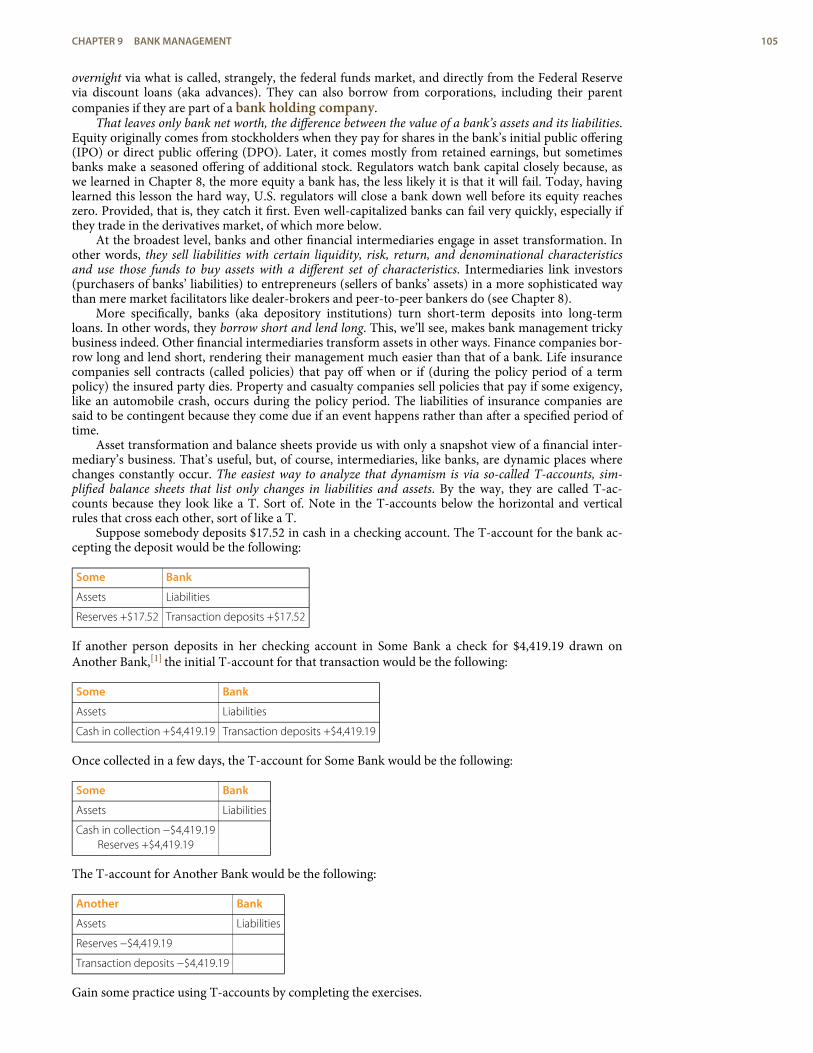
overnight via what is called, strangely, the federal funds market, and directly from the Federal Reservevia discount loans (aka advances). They can also borrow from corporations, including their parentcompanies if they are part of a bank holding company.
That leaves only bank net worth, the difference between the value of a bank’s assets and its liabilities.Equity originally comes from stockholders when they pay for shares in the bank’s initial public offering(IPO) or direct public offering (DPO). Later, it comes mostly from retained earnings, but sometimesbanks make a seasoned offering of additional stock. Regulators watch bank capital closely because, aswe learned in Chapter 8, the more equity a bank has, the less likely it is that it will fail. Today, havinglearned this lesson the hard way, U.S. regulators will close a bank down well before its equity reacheszero. Provided, that is, they catch it first. Even well-capitalized banks can fail very quickly, especially ifthey trade in the derivatives market, of which more below.
At the broadest level, banks and other financial intermediaries engage in asset transformation. Inother words, they sell liabilities with certain liquidity, risk, return, and denominational characteristicsand use those funds to buy assets with a different set of characteristics. Intermediaries link investors(purchasers of banks’ liabilities) to entrepreneurs (sellers of banks’ assets) in a more sophisticated waythan mere market facilitators like dealer-brokers and peer-to-peer bankers do (see Chapter 8).
More specifically, banks (aka depository institutions) turn short-term deposits into long-termloans. In other words, they borrow short and lend long. This, we’ll see, makes bank management trickybusiness indeed. Other financial intermediaries transform assets in other ways. Finance companies bor-row long and lend short, rendering their management much easier than that of a bank. Life insurancecompanies sell contracts (called policies) that pay off when or if (during the policy period of a termpolicy) the insured party dies. Property and casualty companies sell policies that pay if some exigency,like an automobile crash, occurs during the policy period. The liabilities of insurance companies aresaid to be contingent because they come due if an event happens rather than after a specified period oftime.
Asset transformation and balance sheets provide us with only a snapshot view of a financial inter-mediary’s business. That’s useful, but, of course, intermediaries, like banks, are dynamic places wherechanges constantly occur. The easiest way to analyze that dynamism is via so-called T-accounts, sim-plified balance sheets that list only changes in liabilities and assets. By the way, they are called T-ac-counts because they look like a T. Sort of. Note in the T-accounts below the horizontal and verticalrules that cross each other, sort of like a T.
Suppose somebody deposits $17.52 in cash in a checking account. The T-account for the bank ac-cepting the deposit would be the following:
Some Bank
Assets Liabilities
Reserves +$17.52 Transaction deposits +$17.52
If another person deposits in her checking account in Some Bank a check for $4,419.19 drawn onAnother Bank,[1] the initial T-account for that transaction would be the following:
Some Bank
Assets Liabilities
Cash in collection +$4,419.19 Transaction deposits +$4,419.19
Once collected in a few days, the T-account for Some Bank would be the following:
Some Bank
Assets Liabilities
Cash in collection −$4,419.19Reserves +$4,419.19
The T-account for Another Bank would be the following:
Another Bank
Assets Liabilities
Reserves −$4,419.19
Transaction deposits −$4,419.19
Gain some practice using T-accounts by completing the exercises.
CHAPTER 9 BANK MANAGEMENT 105
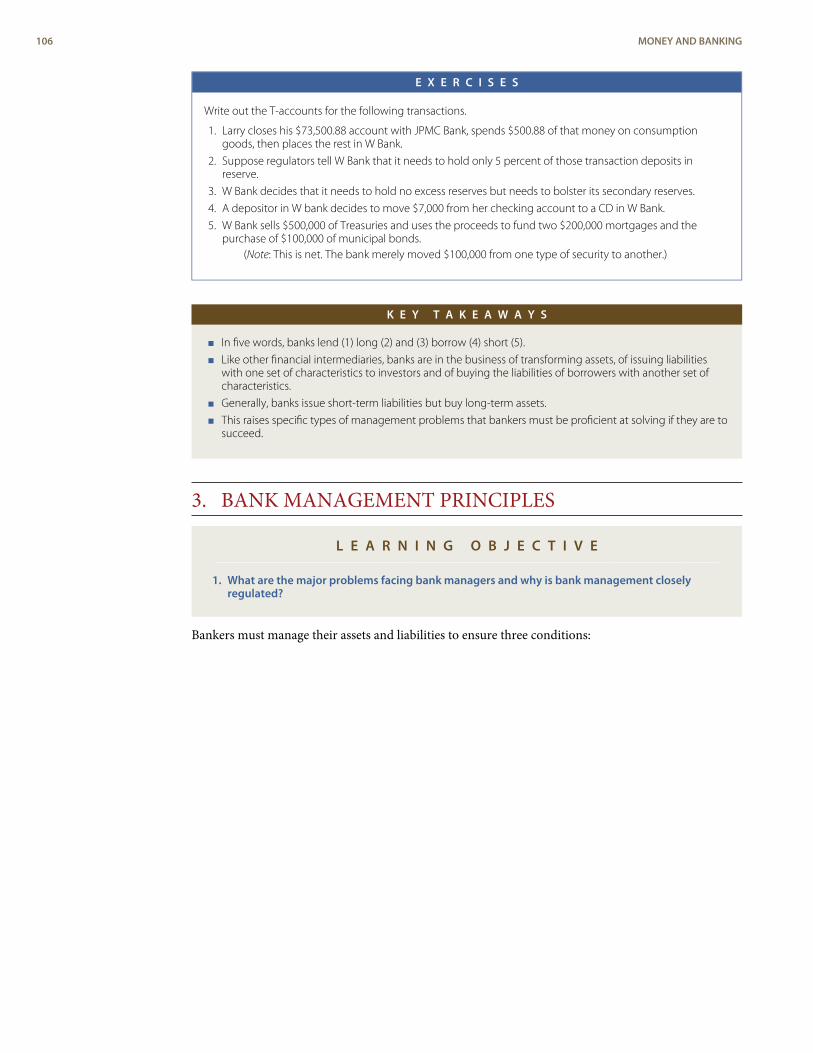
E X E R C I S E S
Write out the T-accounts for the following transactions.
1. Larry closes his $73,500.88 account with JPMC Bank, spends $500.88 of that money on consumptiongoods, then places the rest in W Bank.
2. Suppose regulators tell W Bank that it needs to hold only 5 percent of those transaction deposits inreserve.
3. W Bank decides that it needs to hold no excess reserves but needs to bolster its secondary reserves.
4. A depositor in W bank decides to move $7,000 from her checking account to a CD in W Bank.
5. W Bank sells $500,000 of Treasuries and uses the proceeds to fund two $200,000 mortgages and thepurchase of $100,000 of municipal bonds.
(Note: This is net. The bank merely moved $100,000 from one type of security to another.)
K E Y T A K E A W A Y S
< In five words, banks lend (1) long (2) and (3) borrow (4) short (5).
< Like other financial intermediaries, banks are in the business of transforming assets, of issuing liabilitieswith one set of characteristics to investors and of buying the liabilities of borrowers with another set ofcharacteristics.
< Generally, banks issue short-term liabilities but buy long-term assets.
< This raises specific types of management problems that bankers must be proficient at solving if they are tosucceed.
3. BANK MANAGEMENT PRINCIPLES
L E A R N I N G O B J E C T I V E
1. What are the major problems facing bank managers and why is bank management closelyregulated?
Bankers must manage their assets and liabilities to ensure three conditions:
106 MONEY AND BANKING
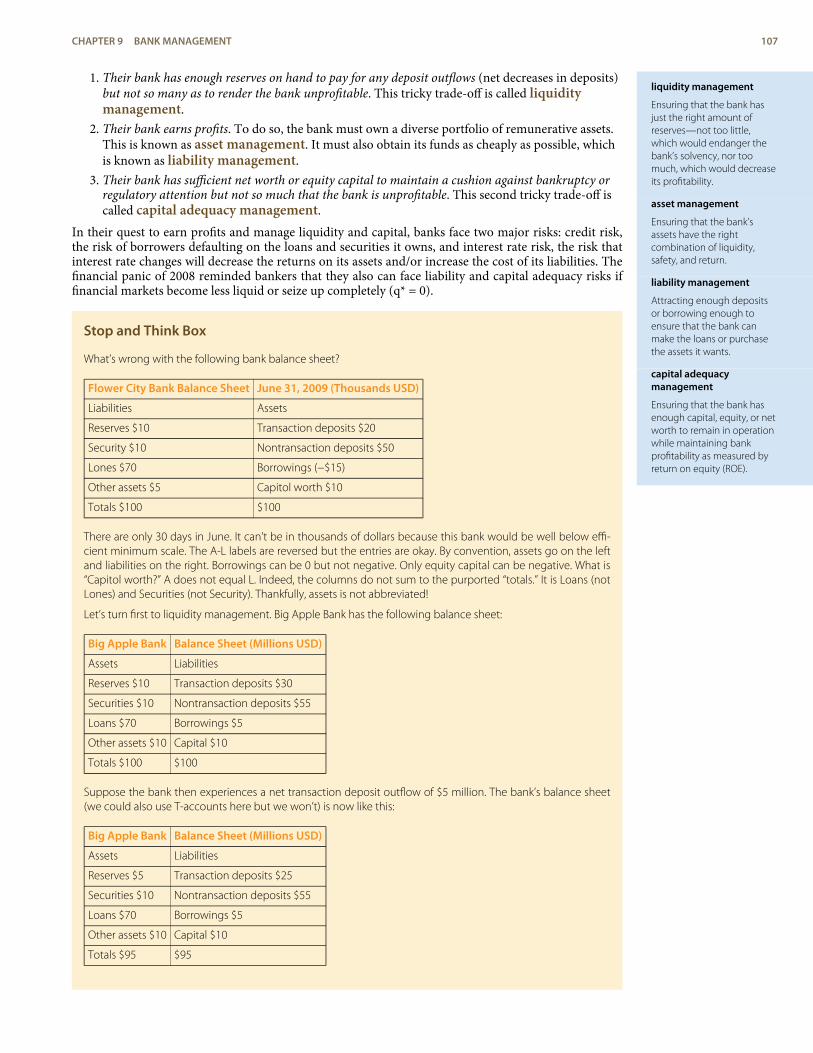
liquidity management
Ensuring that the bank hasjust the right amount ofreserves—not too little,which would endanger thebank’s solvency, nor toomuch, which would decreaseits profitability.
asset management
Ensuring that the bank’sassets have the rightcombination of liquidity,safety, and return.
liability management
Attracting enough depositsor borrowing enough toensure that the bank canmake the loans or purchasethe assets it wants.
capital adequacymanagement
Ensuring that the bank hasenough capital, equity, or networth to remain in operationwhile maintaining bankprofitability as measured byreturn on equity (ROE).
1. Their bank has enough reserves on hand to pay for any deposit outflows (net decreases in deposits)but not so many as to render the bank unprofitable. This tricky trade-off is called liquiditymanagement.
2. Their bank earns profits. To do so, the bank must own a diverse portfolio of remunerative assets.This is known as asset management. It must also obtain its funds as cheaply as possible, whichis known as liability management.
3. Their bank has sufficient net worth or equity capital to maintain a cushion against bankruptcy orregulatory attention but not so much that the bank is unprofitable. This second tricky trade-off iscalled capital adequacy management.
In their quest to earn profits and manage liquidity and capital, banks face two major risks: credit risk,the risk of borrowers defaulting on the loans and securities it owns, and interest rate risk, the risk thatinterest rate changes will decrease the returns on its assets and/or increase the cost of its liabilities. Thefinancial panic of 2008 reminded bankers that they also can face liability and capital adequacy risks iffinancial markets become less liquid or seize up completely (q* = 0).
Stop and Think Box
What’s wrong with the following bank balance sheet?
Flower City Bank Balance Sheet June 31, 2009 (Thousands USD)
Liabilities Assets
Reserves $10 Transaction deposits $20
Security $10 Nontransaction deposits $50
Lones $70 Borrowings (−$15)
Other assets $5 Capitol worth $10
Totals $100 $100
There are only 30 days in June. It can’t be in thousands of dollars because this bank would be well below effi-cient minimum scale. The A-L labels are reversed but the entries are okay. By convention, assets go on the leftand liabilities on the right. Borrowings can be 0 but not negative. Only equity capital can be negative. What is“Capitol worth?” A does not equal L. Indeed, the columns do not sum to the purported “totals.” It is Loans (notLones) and Securities (not Security). Thankfully, assets is not abbreviated!
Let’s turn first to liquidity management. Big Apple Bank has the following balance sheet:
Big Apple Bank Balance Sheet (Millions USD)
Assets Liabilities
Reserves $10 Transaction deposits $30
Securities $10 Nontransaction deposits $55
Loans $70 Borrowings $5
Other assets $10 Capital $10
Totals $100 $100
Suppose the bank then experiences a net transaction deposit outflow of $5 million. The bank’s balance sheet(we could also use T-accounts here but we won’t) is now like this:
Big Apple Bank Balance Sheet (Millions USD)
Assets Liabilities
Reserves $5 Transaction deposits $25
Securities $10 Nontransaction deposits $55
Loans $70 Borrowings $5
Other assets $10 Capital $10
Totals $95 $95
CHAPTER 9 BANK MANAGEMENT 107
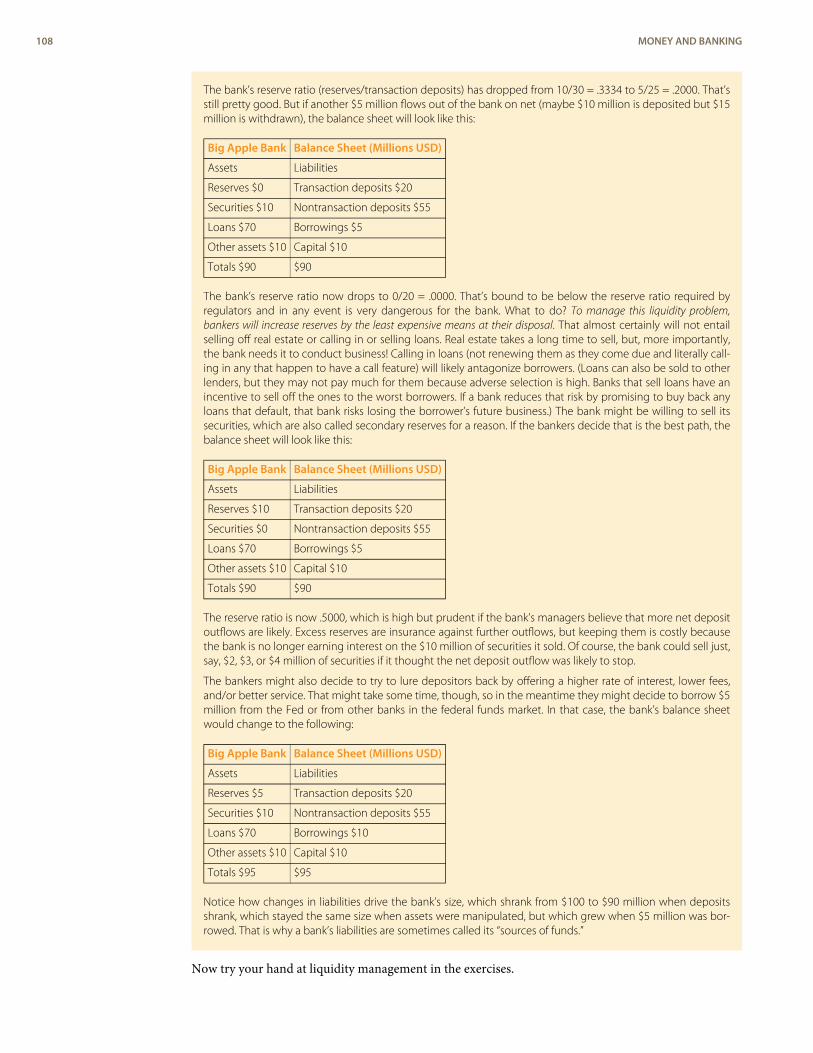
The bank’s reserve ratio (reserves/transaction deposits) has dropped from 10/30 = .3334 to 5/25 = .2000. That’sstill pretty good. But if another $5 million flows out of the bank on net (maybe $10 million is deposited but $15million is withdrawn), the balance sheet will look like this:
Big Apple Bank Balance Sheet (Millions USD)
Assets Liabilities
Reserves $0 Transaction deposits $20
Securities $10 Nontransaction deposits $55
Loans $70 Borrowings $5
Other assets $10 Capital $10
Totals $90 $90
The bank’s reserve ratio now drops to 0/20 = .0000. That’s bound to be below the reserve ratio required byregulators and in any event is very dangerous for the bank. What to do? To manage this liquidity problem,bankers will increase reserves by the least expensive means at their disposal. That almost certainly will not entailselling off real estate or calling in or selling loans. Real estate takes a long time to sell, but, more importantly,the bank needs it to conduct business! Calling in loans (not renewing them as they come due and literally call-ing in any that happen to have a call feature) will likely antagonize borrowers. (Loans can also be sold to otherlenders, but they may not pay much for them because adverse selection is high. Banks that sell loans have anincentive to sell off the ones to the worst borrowers. If a bank reduces that risk by promising to buy back anyloans that default, that bank risks losing the borrower’s future business.) The bank might be willing to sell itssecurities, which are also called secondary reserves for a reason. If the bankers decide that is the best path, thebalance sheet will look like this:
Big Apple Bank Balance Sheet (Millions USD)
Assets Liabilities
Reserves $10 Transaction deposits $20
Securities $0 Nontransaction deposits $55
Loans $70 Borrowings $5
Other assets $10 Capital $10
Totals $90 $90
The reserve ratio is now .5000, which is high but prudent if the bank’s managers believe that more net depositoutflows are likely. Excess reserves are insurance against further outflows, but keeping them is costly becausethe bank is no longer earning interest on the $10 million of securities it sold. Of course, the bank could sell just,say, $2, $3, or $4 million of securities if it thought the net deposit outflow was likely to stop.
The bankers might also decide to try to lure depositors back by offering a higher rate of interest, lower fees,and/or better service. That might take some time, though, so in the meantime they might decide to borrow $5million from the Fed or from other banks in the federal funds market. In that case, the bank’s balance sheetwould change to the following:
Big Apple Bank Balance Sheet (Millions USD)
Assets Liabilities
Reserves $5 Transaction deposits $20
Securities $10 Nontransaction deposits $55
Loans $70 Borrowings $10
Other assets $10 Capital $10
Totals $95 $95
Notice how changes in liabilities drive the bank’s size, which shrank from $100 to $90 million when depositsshrank, which stayed the same size when assets were manipulated, but which grew when $5 million was bor-rowed. That is why a bank’s liabilities are sometimes called its “sources of funds.”
Now try your hand at liquidity management in the exercises.
108 MONEY AND BANKING
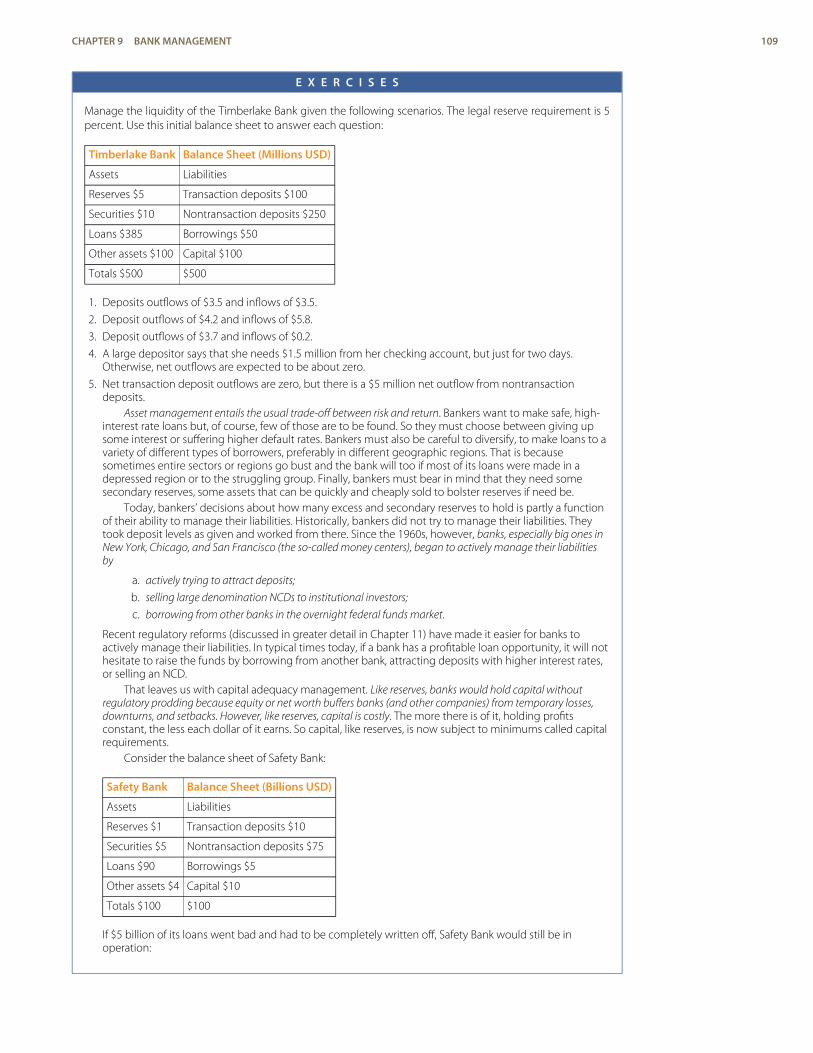
E X E R C I S E S
Manage the liquidity of the Timberlake Bank given the following scenarios. The legal reserve requirement is 5percent. Use this initial balance sheet to answer each question:
Timberlake Bank Balance Sheet (Millions USD)
Assets Liabilities
Reserves $5 Transaction deposits $100
Securities $10 Nontransaction deposits $250
Loans $385 Borrowings $50
Other assets $100 Capital $100
Totals $500 $500
1. Deposits outflows of $3.5 and inflows of $3.5.
2. Deposit outflows of $4.2 and inflows of $5.8.
3. Deposit outflows of $3.7 and inflows of $0.2.
4. A large depositor says that she needs $1.5 million from her checking account, but just for two days.Otherwise, net outflows are expected to be about zero.
5. Net transaction deposit outflows are zero, but there is a $5 million net outflow from nontransactiondeposits.
Asset management entails the usual trade-off between risk and return. Bankers want to make safe, high-interest rate loans but, of course, few of those are to be found. So they must choose between giving upsome interest or suffering higher default rates. Bankers must also be careful to diversify, to make loans to avariety of different types of borrowers, preferably in different geographic regions. That is becausesometimes entire sectors or regions go bust and the bank will too if most of its loans were made in adepressed region or to the struggling group. Finally, bankers must bear in mind that they need somesecondary reserves, some assets that can be quickly and cheaply sold to bolster reserves if need be.
Today, bankers’ decisions about how many excess and secondary reserves to hold is partly a functionof their ability to manage their liabilities. Historically, bankers did not try to manage their liabilities. Theytook deposit levels as given and worked from there. Since the 1960s, however, banks, especially big ones inNew York, Chicago, and San Francisco (the so-called money centers), began to actively manage their liabilitiesby
a. actively trying to attract deposits;b. selling large denomination NCDs to institutional investors;c. borrowing from other banks in the overnight federal funds market.
Recent regulatory reforms (discussed in greater detail in Chapter 11) have made it easier for banks toactively manage their liabilities. In typical times today, if a bank has a profitable loan opportunity, it will nothesitate to raise the funds by borrowing from another bank, attracting deposits with higher interest rates,or selling an NCD.
That leaves us with capital adequacy management. Like reserves, banks would hold capital withoutregulatory prodding because equity or net worth buffers banks (and other companies) from temporary losses,downturns, and setbacks. However, like reserves, capital is costly. The more there is of it, holding profitsconstant, the less each dollar of it earns. So capital, like reserves, is now subject to minimums called capitalrequirements.
Consider the balance sheet of Safety Bank:
Safety Bank Balance Sheet (Billions USD)
Assets Liabilities
Reserves $1 Transaction deposits $10
Securities $5 Nontransaction deposits $75
Loans $90 Borrowings $5
Other assets $4 Capital $10
Totals $100 $100
If $5 billion of its loans went bad and had to be completely written off, Safety Bank would still be inoperation:
CHAPTER 9 BANK MANAGEMENT 109
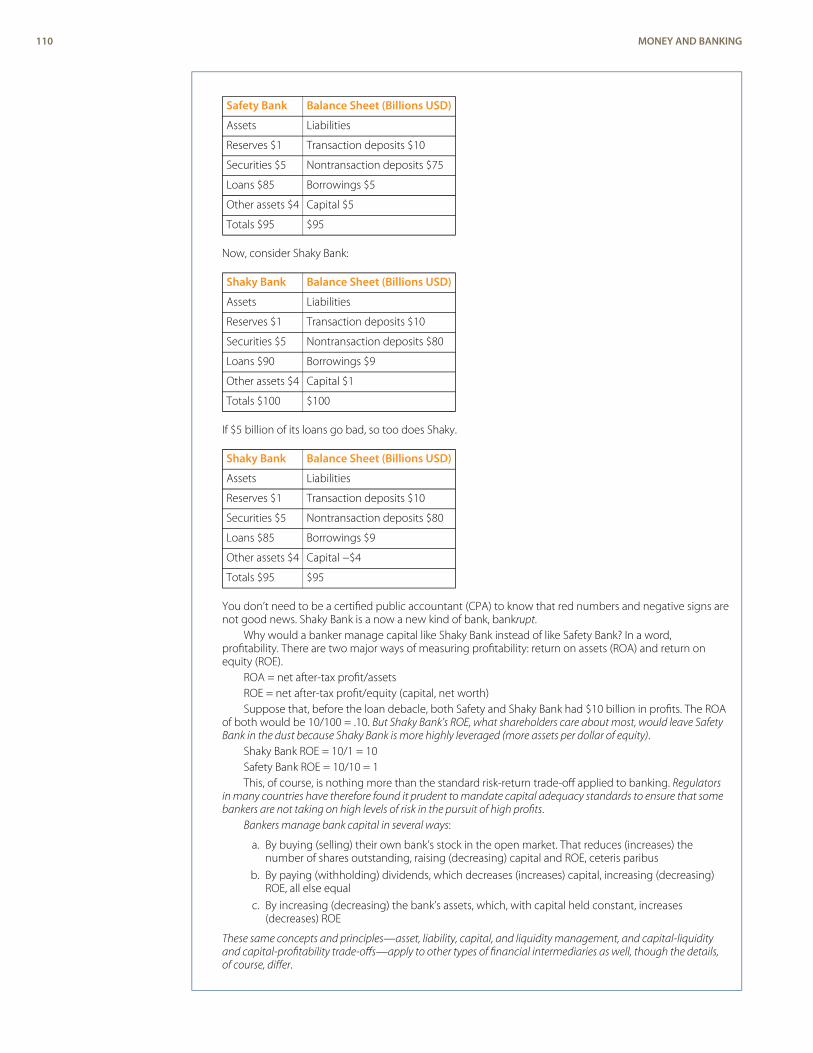
Safety Bank Balance Sheet (Billions USD)
Assets Liabilities
Reserves $1 Transaction deposits $10
Securities $5 Nontransaction deposits $75
Loans $85 Borrowings $5
Other assets $4 Capital $5
Totals $95 $95
Now, consider Shaky Bank:
Shaky Bank Balance Sheet (Billions USD)
Assets Liabilities
Reserves $1 Transaction deposits $10
Securities $5 Nontransaction deposits $80
Loans $90 Borrowings $9
Other assets $4 Capital $1
Totals $100 $100
If $5 billion of its loans go bad, so too does Shaky.
Shaky Bank Balance Sheet (Billions USD)
Assets Liabilities
Reserves $1 Transaction deposits $10
Securities $5 Nontransaction deposits $80
Loans $85 Borrowings $9
Other assets $4 Capital −$4
Totals $95 $95
You don’t need to be a certified public accountant (CPA) to know that red numbers and negative signs arenot good news. Shaky Bank is a now a new kind of bank, bankrupt.
Why would a banker manage capital like Shaky Bank instead of like Safety Bank? In a word,profitability. There are two major ways of measuring profitability: return on assets (ROA) and return onequity (ROE).
ROA = net after-tax profit/assetsROE = net after-tax profit/equity (capital, net worth)Suppose that, before the loan debacle, both Safety and Shaky Bank had $10 billion in profits. The ROA
of both would be 10/100 = .10. But Shaky Bank’s ROE, what shareholders care about most, would leave SafetyBank in the dust because Shaky Bank is more highly leveraged (more assets per dollar of equity).
Shaky Bank ROE = 10/1 = 10Safety Bank ROE = 10/10 = 1This, of course, is nothing more than the standard risk-return trade-off applied to banking. Regulators
in many countries have therefore found it prudent to mandate capital adequacy standards to ensure that somebankers are not taking on high levels of risk in the pursuit of high profits.
Bankers manage bank capital in several ways:
a. By buying (selling) their own bank’s stock in the open market. That reduces (increases) thenumber of shares outstanding, raising (decreasing) capital and ROE, ceteris paribus
b. By paying (withholding) dividends, which decreases (increases) capital, increasing (decreasing)ROE, all else equal
c. By increasing (decreasing) the bank’s assets, which, with capital held constant, increases(decreases) ROE
These same concepts and principles—asset, liability, capital, and liquidity management, and capital-liquidityand capital-profitability trade-offs—apply to other types of financial intermediaries as well, though the details,of course, differ.
110 MONEY AND BANKING
K E Y T A K E A W A Y S
< Bankers must manage their bank’s liquidity (reserves, for regulatory reasons and to conduct businesseffectively), capital (for regulatory reasons and to buffer against negative shocks), assets, and liabilities.
< There is an opportunity cost to holding reserves, which pay no interest, and capital, which must share theprofits of the business.
< Left to their own judgment, bankers would hold reserves > 0 and capital > 0, but they might not holdenough to prevent bank failures at what the government or a country’s citizens deem an acceptably lowrate.
< That induces government regulators to create and monitor minimum requirements.
4. CREDIT RISK
L E A R N I N G O B J E C T I V E
1. What is credit risk and how do bankers manage it?
As noted above, loans are banks’ bread and butter. No matter how good bankers are at asset, liability,and capital adequacy management, they will be failures if they cannot manage credit risk. Keeping de-faults to a minimum requires bankers to be keen students of asymmetric information (adverse selectionand moral hazard) and techniques for reducing them.
Bankers and insurers, like computer folks, know about GIGO—garbage in, garbage out. If theylend to or insure risky people and companies, they are going to suffer. So they carefully screen applic-ants for loans and insurance. In other words, to reduce asymmetric information, financial intermediar-ies create information about them. One way they do so is to ask applicants a wide variety of questions.
Financial intermediaries use the application only as a starting point. Because risky applicants mightstretch the truth or even outright lie on the application, intermediaries typically do two things: (1) makethe application a binding part of the financial contract, and (2) verify the information with disinterestedthird parties. The first allows them to void contracts if applications are fraudulent. If someone appliedfor life insurance but did not disclose that he or she was suffering from a terminal disease, the life in-surance company would not pay, though it might return any premiums. (That may sound cruel to you,but it isn’t. In the process of protecting its profits, the insurance company is also protecting its policy-holders.) In other situations, the intermediary might not catch a falsehood in an application until it istoo late, so it also verifies important information by calling employers (Is John Doe really the SupremeCommander of XYZ Corporation?), conducting medical examinations (Is Jane Smith really in perfecthealth despite being 3' 6'' tall and weighing 567 pounds?), hiring appraisers (Is a one-bedroom, half-bath house on the wrong side of the tracks really worth $1.2 million?), and so forth. Financial interme-diaries can also buy credit reports from third-party report providers like Equifax, Experian, or TransUnion. Similarly, insurance companies regularly share information with each other so that risky ap-plicants can’t take advantage of them easily.
To help improve their screening acumen, many financial intermediaries specialize. By making loansto only one or a few types of borrowers, by insuring automobiles in a handful of states, by insuringfarms but not factories, intermediaries get very good at discerning risky applicants from the rest. Spe-cialization also helps to keep monitoring costs to a minimum. Remember that, to reduce moral hazard(postcontractual asymmetric information), intermediaries have to pay attention to what borrowers andpeople who are insured do. By specializing, intermediaries know what sort of restrictive covenants (akaloan covenants) to build into their contracts. Loan covenants include the frequency of providing finan-cial reports, the types of information to be provided in said reports, working capital requirements, per-mission for onsite inspections, limitations on account withdrawals, and call options if business per-formance deteriorates as measured by specific business ratios. Insurance companies also build coven-ants into their contracts. You can’t turn your home into a brothel, it turns out, and retain your insur-ance coverage. To reduce moral hazard further, insurers also investigate claims that seem fishy. If youwrap your car around a tree the day after insuring it or increasing your coverage, the insurer’s claimsadjuster is probably going to take a very close look at the alleged accident. Like everything else in life,however, specialization has its costs. Some companies overspecialize, hurting their asset managementby making too many loans or issuing too many policies in one place or to one group. While credit risksdecrease due to specialization, systemic risk to assets increases, requiring bankers to make difficult de-cisions regarding how much to specialize.
CHAPTER 9 BANK MANAGEMENT 111
nonperforming loan
A loan that is in default,where the borrower is notmaking stipulated paymentsof interest or principal.
Forging long-term relationships with customers can also help financial intermediaries to managetheir credit risks. Bankers, for instance, can lend with better assurance if they can study the checkingand savings accounts of applicants over a period of years or decades. Repayment records of applicantswho had previously obtained loans can be checked easily and cheaply. Moreover, the expectation(there’s that word again) of a long-term relationship changes the borrower’s calculations. The game, ifyou will, is no longer a one-off prisoner’s dilemma,[2] where it is in both parties’ interest to defect, butrather a repeated game, where the optimal strategy is one of tit for tat—cooperate until the other guydefects.[3]
One way that lenders create long-term relationships with businesses is by providing loan commit-ments, promises to lend $x at y interest (or y plus some market rate) for z years. Such arrangements areso beneficial for both lenders and borrowers that most commercial loans are in fact loan commitments.Such commitments are sometimes called lines of credit, particularly when extended to consumers.
Bankers also often insist on collateral—assets pledged by the borrower for repayment of a loan.When those assets are cash left in the bank, the collateral is called compensating or compensatory bal-ances. Another powerful tool to combat asymmetric information is credit rationing, refusing to make aloan at any interest rate (to reduce adverse selection) or lending less than the sum requested (to reducemoral hazard). Insurers also engage in both types of rationing, and for the same reasons: people willingto pay high rates or premiums must be risky, and the more that is lent or insured (ceteris paribus) thehigher the likelihood that the customer will abscond, cheat, or set aflame, as the case may be.
As the world learned to its chagrin in 2007–2008, banks and other lenders are not perfect screen-ers. Sometimes, under competitive pressure, they lend to borrowers they should not have. Sometimes,individual bankers profit handsomely by lending to very risky borrowers, even though their actions en-danger their banks’ very existence. Other times, external political or societal pressures induce bankersto make loans they normally wouldn’t. Such excesses are always reversed eventually because the lenderssuffer from high levels of nonperforming loans.
Stop and Think Box
In the first quarter of 2007, banks and other intermediaries specializing in originating home mortgages (calledmortgage companies) experienced a major setback in the so-called subprime market, the segment of the mar-ket that caters to high-risk borrowers, because default rates soared much higher than expected. Losses wereso extensive that many people feared, correctly as it turned out, that they could trigger a financial crisis. Tostave off such a potentially dangerous outcome, why didn’t the government immediately intervene by guar-anteeing the subprime mortgages?
The government must be careful to try to support the financial system without giving succor to those whohave screwed up. Directly bailing out the subprime lenders by guaranteeing mortgage payments would causemoral hazard to skyrocket, it realized. Borrowers might be more likely to default by rationalizing that the crimeis a victimless one (though, in fact, all taxpayers would suffer—recall that there is no such thing as a free lunchin economics). Lenders would learn that they can make crazy loans to anyone because good ol’ Uncle Sam willcushion, or even prevent, their fall.
K E Y T A K E A W A Y S
< Credit risk is the chance that a borrower will default on a loan by not fully meeting stipulated payments ontime.
< Bankers manage credit risk by screening applicants (taking applications and verifying the information theycontain), monitoring loan recipients, requiring collateral like real estate and compensatory balances, andincluding a variety of restrictive covenants in loans.
< They also manage credit risk by trading off between the costs and benefits of specialization and portfoliodiversification.
112 MONEY AND BANKING
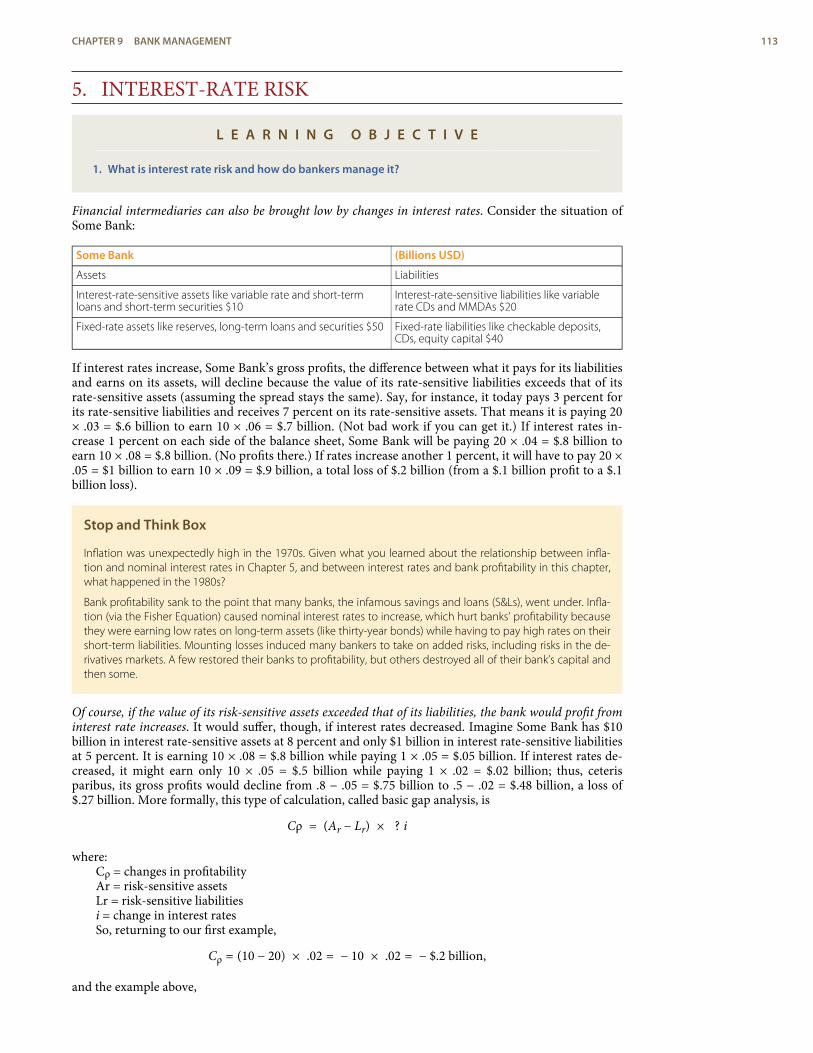
5. INTEREST-RATE RISK
L E A R N I N G O B J E C T I V E
1. What is interest rate risk and how do bankers manage it?
Financial intermediaries can also be brought low by changes in interest rates. Consider the situation ofSome Bank:
Some Bank (Billions USD)
Assets Liabilities
Interest-rate-sensitive assets like variable rate and short-termloans and short-term securities $10
Interest-rate-sensitive liabilities like variablerate CDs and MMDAs $20
Fixed-rate assets like reserves, long-term loans and securities $50 Fixed-rate liabilities like checkable deposits,CDs, equity capital $40
If interest rates increase, Some Bank’s gross profits, the difference between what it pays for its liabilitiesand earns on its assets, will decline because the value of its rate-sensitive liabilities exceeds that of itsrate-sensitive assets (assuming the spread stays the same). Say, for instance, it today pays 3 percent forits rate-sensitive liabilities and receives 7 percent on its rate-sensitive assets. That means it is paying 20× .03 = $.6 billion to earn 10 × .06 = $.7 billion. (Not bad work if you can get it.) If interest rates in-crease 1 percent on each side of the balance sheet, Some Bank will be paying 20 × .04 = $.8 billion toearn 10 × .08 = $.8 billion. (No profits there.) If rates increase another 1 percent, it will have to pay 20 ×.05 = $1 billion to earn 10 × .09 = $.9 billion, a total loss of $.2 billion (from a $.1 billion profit to a $.1billion loss).
Stop and Think Box
Inflation was unexpectedly high in the 1970s. Given what you learned about the relationship between infla-tion and nominal interest rates in Chapter 5, and between interest rates and bank profitability in this chapter,what happened in the 1980s?
Bank profitability sank to the point that many banks, the infamous savings and loans (S&Ls), went under. Infla-tion (via the Fisher Equation) caused nominal interest rates to increase, which hurt banks’ profitability becausethey were earning low rates on long-term assets (like thirty-year bonds) while having to pay high rates on theirshort-term liabilities. Mounting losses induced many bankers to take on added risks, including risks in the de-rivatives markets. A few restored their banks to profitability, but others destroyed all of their bank’s capital andthen some.
Of course, if the value of its risk-sensitive assets exceeded that of its liabilities, the bank would profit frominterest rate increases. It would suffer, though, if interest rates decreased. Imagine Some Bank has $10billion in interest rate-sensitive assets at 8 percent and only $1 billion in interest rate-sensitive liabilitiesat 5 percent. It is earning 10 × .08 = $.8 billion while paying 1 × .05 = $.05 billion. If interest rates de-creased, it might earn only 10 × .05 = $.5 billion while paying 1 × .02 = $.02 billion; thus, ceterisparibus, its gross profits would decline from .8 − .05 = $.75 billion to .5 − .02 = $.48 billion, a loss of$.27 billion. More formally, this type of calculation, called basic gap analysis, is
Cρ = (Ar − Lr) × ? i
where:Cρ = changes in profitabilityAr = risk-sensitive assetsLr = risk-sensitive liabilitiesi = change in interest ratesSo, returning to our first example,
Cρ = (10 − 20) × .02 = − 10 × .02 = − $.2 billion,
and the example above,
CHAPTER 9 BANK MANAGEMENT 113
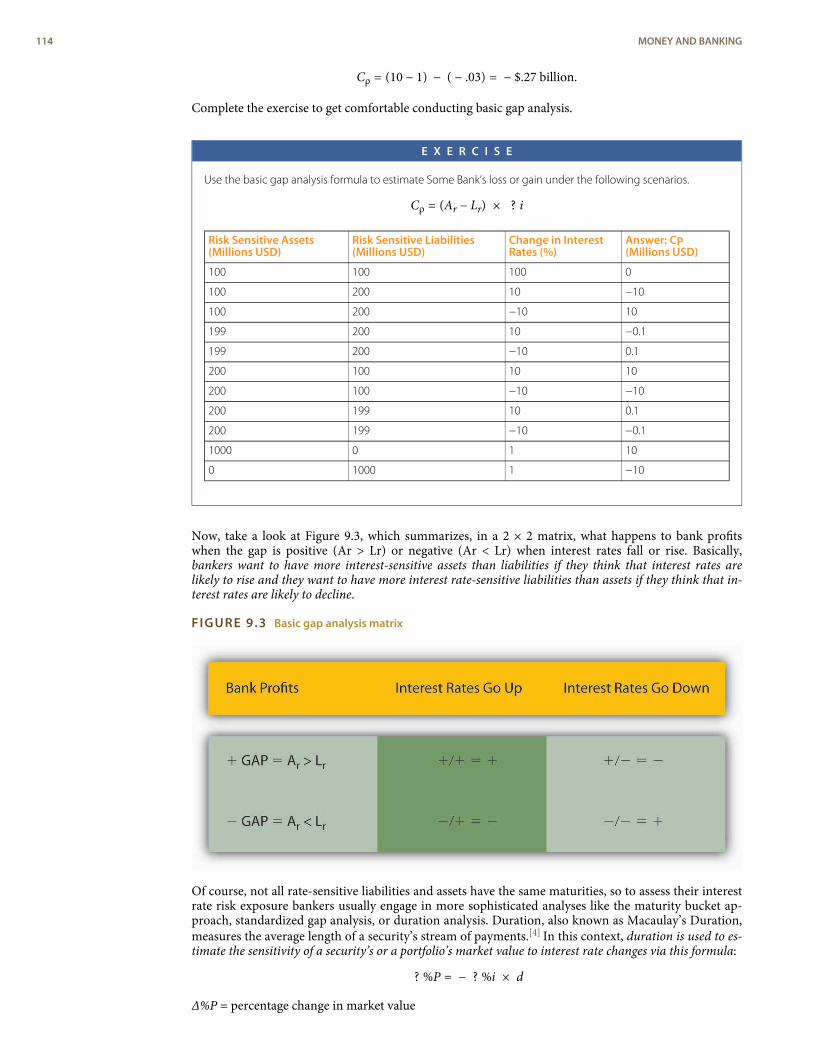
Cρ = (10 − 1) − ( − .03) = − $.27 billion.
Complete the exercise to get comfortable conducting basic gap analysis.
E X E R C I S E
Use the basic gap analysis formula to estimate Some Bank’s loss or gain under the following scenarios.
Cρ = (Ar − Lr) × ? i
Risk Sensitive Assets(Millions USD)
Risk Sensitive Liabilities(Millions USD)
Change in InterestRates (%)
Answer: CP(Millions USD)
100 100 100 0
100 200 10 −10
100 200 −10 10
199 200 10 −0.1
199 200 −10 0.1
200 100 10 10
200 100 −10 −10
200 199 10 0.1
200 199 −10 −0.1
1000 0 1 10
0 1000 1 −10
Now, take a look at Figure 9.3, which summarizes, in a 2 × 2 matrix, what happens to bank profitswhen the gap is positive (Ar > Lr) or negative (Ar < Lr) when interest rates fall or rise. Basically,bankers want to have more interest-sensitive assets than liabilities if they think that interest rates arelikely to rise and they want to have more interest rate-sensitive liabilities than assets if they think that in-terest rates are likely to decline.
FIGURE 9.3 Basic gap analysis matrix
Of course, not all rate-sensitive liabilities and assets have the same maturities, so to assess their interestrate risk exposure bankers usually engage in more sophisticated analyses like the maturity bucket ap-proach, standardized gap analysis, or duration analysis. Duration, also known as Macaulay’s Duration,measures the average length of a security’s stream of payments.[4] In this context, duration is used to es-timate the sensitivity of a security’s or a portfolio’s market value to interest rate changes via this formula:
? %P = − ? %i × d
Δ%P = percentage change in market value
114 MONEY AND BANKING
Δi = change in interest (not decimalized, i.e., represent 5% as 5, not .05. Also note the negativesign. The sign is negative because, as we learned in Chapter 4, interest rates and prices are inverselyrelated.)
d = duration (years)So, if interest rates increase 2 percent and the average duration of a bank’s $100 million of assets is
3 years, the value of those assets will fall approximately −2 × 3 = −6%, or $6 million. If the value of thatbank’s liabilities (excluding equity) is $95 million, and the duration is also 3 years, the value of the liab-ilities will also fall, 95 × .06 = $5.7 million, effectively reducing the bank’s equity (6 − 5.7= ) $.3 million.If the duration of the bank’s liabilities is only 1 year, then its liabilities will fall −2 × 1 = −2% or 95 × .02= $1.9 million, and the bank will suffer an even larger loss (6 − 1.9 =) of $4.1 million. If, on the otherhand, the duration of the bank’s liabilities is 10 years, its liabilities will decrease −2 × 10 = −20% or $19million and the bank will profit from the interest rate rise.
A basic interest rate risk reduction strategy when interest rates are expected to fall is to keep theduration of liabilities short and the duration of assets long. That way, the bank continues to earn theold, higher rate on its assets but benefits from the new lower rates on its deposits, CDs, and other liabil-ities. As noted above, borrowing short and lending long is second nature for banks, which tend to thrivewhen interest rates go down. When interest rates increase, banks would like to keep the duration of as-sets short and the duration of liabilities long. That way, the bank earns the new, higher rate on its assetsand keeps its liabilities locked in at the older, lower rates. But banks can only go so far in this directionbecause it runs against their nature; few people want to borrow if the loans are callable and fewer stillwant long-term checkable deposits!
K E Y T A K E A W A Y S
< Interest rate risk is the chance that interest rates may increase, decreasing the value of bank assets.
< Bankers manage interest rate risk by performing analyses like basic gap analysis, which compares a bank’sinterest rate risk-sensitive assets and liabilities, and duration analysis, which accounts for the fact that bankassets and liabilities have different maturities.
< Such analyses, combined with interest rate predictions, tell bankers when to increase or decrease theirrate-sensitive assets or liabilities, and whether to shorten or lengthen the duration of their assets orliabilities.
< Bankers can also hedge against interest rate risk by trading derivatives, like swaps and futures, andengaging in other off-balance-sheet activities.
6. OFF THE BALANCE SHEET
L E A R N I N G O B J E C T I V E
1. What are off-balance-sheet activities and why do bankers engage in them?
To protect themselves against interest rate increases, banks go off road, engaging in activities that do notappear on their balance sheets.[5] Banks charge customers all sorts of fees, and not just the little ones thatthey sometimes slap on retail checking depositors. They also charge fees for loan guarantees, backuplines of credit, and foreign exchange transactions. Banks also now sell some of their loans to investors.Banks usually make about .15 percent when they sell a loan, which can be thought of as their fee fororiginating the loan, for, in other words, finding and screening the borrower. So, for example, a bankmight discount the $100,000 note of XYZ Corp. for 1 year at 8 percent. We know from the presentvalue formula that on the day it is made, said loan is worth PV = FV/(1 + i) = 100,000/1.08 =$92,592.59. The bank might sell it for 100,000/1.0785 = $92,721.37 and pocket the difference. Suchactivities are not without risks, however. Loan guarantees can become very costly if the guaranteedparty defaults. Similarly, banks often sell loans with a guarantee or stipulation that they will buy themback if the borrower defaults. (If they didn’t do so, as noted above, investors would not pay much forthem because they would fear adverse selection, that is, the bank pawning off their worse loans on un-suspecting third parties.) Although loans and fees can help keep up bank revenues and profits in theface of rising interest rates, they do not absolve the bank of the necessity of carefully managing its cred-it risks.
Banks (and other financial intermediaries) also take off-balance-sheet positions in derivatives mar-kets, including futures and interest rate swaps. They sometimes use derivatives to hedge their risks; that
CHAPTER 9 BANK MANAGEMENT 115
is, they try to earn income should the bank’s main business suffer a decline if, say, interest rates rise. Forexample, bankers sell futures contracts on U.S. Treasuries at the Chicago Board of Trade. If interestrates increase, the price of bonds, we know, will decrease. The bank can then effectively buy bonds inthe open market at less than the contract price, make good on the contract, and pocket the difference,helping to offset the damage the interest rate increase will cause the bank’s balance sheet.
Bankers can also hedge their bank’s interest rate risk by engaging in interest rate swaps. A bankmight agree to pay a finance company a fixed 6 percent on a $100 million notational principle (or $6million) every year for ten years in exchange for the finance company’s promise to pay to the bank amarket rate like the federal funds rate or London Interbank Offering Rate (LIBOR) plus 3 percent. Ifthe market rate increases from 3 percent (which initially would entail a wash because 6 fixed = 3 LIBORplus 3 contractual) to 5 percent, the finance company will pay the net due to the bank, (3 + 5 = 8 − 6 =2% on $100 million =) $2 million, which the bank can use to cover the damage to its balance sheetbrought about by the higher rates. If interest rates later fall to 2 percent, the bank will have to start pay-ing the finance company (6 − [3 + 2] = 1% on $100 million) $1 million per year but will well be able toafford it.
Banks and other financial intermediaries also sometimes speculate in derivatives and the foreign ex-change markets, hoping to make a big killing. Of course, with the potential for high returns comes highlevels of risk. Several hoary banks have gone bankrupt because they assumed too much off-balance-sheet risk. In some cases, the failures were due to the principal-agent problem: rogue traders bet theirjobs, and their banks, and lost. In other cases, traders were mere scapegoats, instructed to behave asthey did by the bank’s managers or owners. In either case, it is difficult to have much sympathy for thebankers, who were either deliberate risk-takers or incompetent. There are some very basic internal con-trols that can prevent traders from risking too much of the capital of the banks they trade for, as well astechniques, called value at risk[6] and stress testing,[7] that allow bankers to assess their bank’s derivativerisk exposure.
K E Y T A K E A W A Y S
< Off-balance-sheet activities like fees, loan sales, and derivatives trading help banks to manage their interestrate risk by providing them with income that is not based on assets (and hence is off the balance sheet).
< Derivatives trading can be used to hedge or reduce interest rate risks but can also be used by risky bankersor rogue traders to increase risk to the point of endangering a bank’s capital cushion and hence itseconomic existence.
7. SUGGESTED READINGChoudhry, Moorad. Bank Asset and Liability Management: Strategy, Trading, Analysis. Hoboken,
NJ: John Wiley and Sons, 2007.Dermine, Jean, and Youssef Bissada. Asset and Liability Management: A Guide to Value Creation
and Risk Control. New York: Prentice Hall, 2002.Ketz, J. Edward. Hidden Financial Risk: Understanding Off Balance Sheet Accounting. Hoboken,
NJ: John Wiley and Sons, 2003.Kolari, James, and Benton Gup. Commercial Banking: The Management of Risk. Hoboken, NJ:
John Wiley and Sons, 2004.
116 MONEY AND BANKING

1.
2.3.
4.5.
6.7.
ENDNOTES
If that check were drawn on Some Bank, there would be no need for a T-account be-cause the bank would merely subtract the amount from the account of the payer, orin other words, the check maker, and add it to the account of the payee or checkrecipient.
http://plato.stanford.edu/entries/prisoner-dilemma/
http://www.gametheory.net/dictionary/TitforTat.html
http://www.riskglossary.com/link/duration_and_convexity.htm
This is not to say that these activities are not accounted for. It isn’t illegal or evenslimy. These activities will appear on revenue statements, cash flow analyses, etc.They do not, however, appear on the balance sheet, on the list of the bank’s assetsand liabilities.
http://www.gloriamundi.org/
http://financial-dictionary.thefreedictionary.com/Stress+Testing
CHAPTER 9 BANK MANAGEMENT 117

118 MONEY AND BANKING
C H A P T E R 1 0Innovation and Structure inBanking and Finance
C H A P T E R O B J E C T I V E S
By the end of this chapter, students should be able to:
1. Explain why bankers and other financiers innovate.
2. Explain how widespread unit banking in the United States affected financial innovation.
3. Explain how the Great Inflation of the 1970s affected banks and banking.
4. Define loophole mining and lobbying and explain their importance.
5. Describe how technology changed the banking industry after World War II.
6. Define traditional banking and describe the causes of its demise.
7. Define industry consolidation and explain how it is measured.
8. Define financial conglomeration and explain its importance.
9. Define industry concentration and explain how it is measured.
1. EARLY FINANCIAL INNOVATIONS
L E A R N I N G O B J E C T I V E
1. Why do bankers and other financiers innovate in the face of branching restrictions and otherregulations?
Banking today is much the same everywhere. And, at the broadest level, today’s banks are not muchdifferent from banks hundreds of years ago. Philadelphian Thomas Willing, America’s first banker andlife insurer, and a marine insurance pioneer, would likely understand the functioning of today’s largest,most complex banks and insurance companies with little trouble.[1] (He’d certainly understandinterest-only mortgages because he used them extensively as early as the 1760s.) Despite broad similar-ities, banking and other aspects of the financial system vary in detail over time and place, thanks inlarge part to innovations: new ideas, products, and markets. Innovation, in turn, is driven by changesin the financial environment, specifically in macroeconomic volatility, technology, competition, andregulation. (We’ll discuss the economics of regulation in detail in Chapter 11. Here, we’ll simply men-tion regulations that have helped to spur innovation.)
The first U.S. commercial bank, the Bank of North America, began operations in early 1782. Forthe next two centuries or so, banking innovation in the United States was rather glacial because regula-tions were relatively light, pertinent technological changes were few, and competition was sparse. Be-fore the Civil War, all but two of America’s incorporated banks were chartered by one of the state gov-ernments rather than the national government. Most states forbade intrastate branching; interstatebranching was all but unheard of, except when conducted by relatively small private (unincorporated)banks. During the Civil War, Congress passed a law authorizing the establishment of national banks,but the term referred only to the fact that the national government chartered and regulated them. Des-pite their name, the banks that came into existence under the national banking acts could not branchacross state lines, and their ability to branch within their state of domicile depended on the branchingrules imposed by that state. As before the war, most states forbade branching. Moreover, state govern-ments continued to charter banks too. The national government tried to dissuade them from doing soby taxing state bank notes heavily, but the banks responded nimbly, issuing deposits instead. Unlike
most countries, which developed a few, large banks with extensive systems of branches, the United Stateswas home to hundreds, then thousands, then tens of thousands of tiny branchless, or unit, banks.
Most of those unit banks were spread evenly throughout the country. Because banking was essen-tially a local retail business, most unit banks enjoyed near-monopolies. If you didn’t like the local bank,you were free to do your banking elsewhere, but that might require putting one’s money in a bank overhill and over dale, a full day’s trek away by horse. Most people were reluctant to do that, so the localbank got their business, even if its terms were not particularly good. Little regulated and lightly pressedby competitors, American banks became stodgy affairs, the stuff of WaMu commercials.[2] Spreadsbetween sources of funds and uses of funds were large and stable, leading to the infamous 3-6-3 rule: bor-row at 3 percent, lend at 6 percent, and golf at 3 p.m.
Near-monopoly in banking, however, led to innovation in the financial markets. Instead of deposit-ing money in the local bank, some investors looked for higher returns by lending directly to entrepren-eurs. Instead of paying high rates at the bank, some entrepreneurs sought cheaper funds by sellingbonds directly into the market. As a result, the United States developed the world’s largest, most effi-cient, and most innovative financial markets. The United States gave birth to large, liquid markets forcommercial paper (short-dated business IOUs) and junk bonds (aka BIG, or below investment grade,bonds), which are high-yielding but risky bonds issued by relatively small or weak companies. As notedin Chapter 8, however, markets suffer from higher levels of asymmetric information and more free-rider problems than financial intermediaries do, so along with innovative securities markets came in-stances of fraud, of people issuing overvalued or fraudulent securities. And that, as we’ll see in Chapter11, led to several layers of securities regulation and, inevitably, yet more innovation.
Stop and Think Box
Unlike banks, U.S. life insurance companies could establish branches or agencies wherever they pleased, in-cluding foreign countries. Life insurers must maintain massive accumulations of assets so that they will cer-tainly be able to pay claims when an insured person dies. From the late nineteenth century until the middle ofthe twentieth, therefore, America’s largest financial institutions were not its banks, but its life insurers, andcompetition among the biggest ones—Massachusetts Mutual, MetLife, Prudential, New York Life, and theEquitable—was fierce. Given that information, what do you think innovation in life insurance was like com-pared to commercial banking?
Innovation in life insurance should have been more rapid because competition was more intense. Data-pro-cessing innovations, like the use of punch-card-tabulating machines,[3] automated mechanical mailing addressmachines,[4] and mainframe computers,[5] occurred in life insurers before they did in most banks.
K E Y T A K E A W A Y S
< Bankers and financiers innovate to continue to earn profits despite a rapidly evolving financialenvironment, including changes in competition, regulation, technology, and the macroeconomy.
< Unit banks enjoyed local monopolies and were lightly regulated, so there was little incentive for them toinnovate but plenty of reason for investors and borrowers to meet directly via the second major conduit ofexternal finance, markets.
< Unit banking dampened banking innovation but spurred financial market innovation.
< Traditionally, bankers earned profits from the spread between the cost of their liabilities and the earningson their assets. It was a staid business characterized by the 3-6-3 rule.
2. INNOVATIONS GALORE
L E A R N I N G O B J E C T I V E
1. Why did the Great Inflation spur financial innovation?
Competition also drives bankers to adopt new technologies and search for ways to reduce the negativeeffects of volatility. It is not surprising, therefore, that as the U.S. financial system grew more competit-ive in the 1970s and 1980s, a time of unprecedented macroeconomic volatility, the pace of financial in-novation increased dramatically. As Figure 10.1 shows, beginning in the late 1960s, inflation rose
120 MONEY AND BANKING
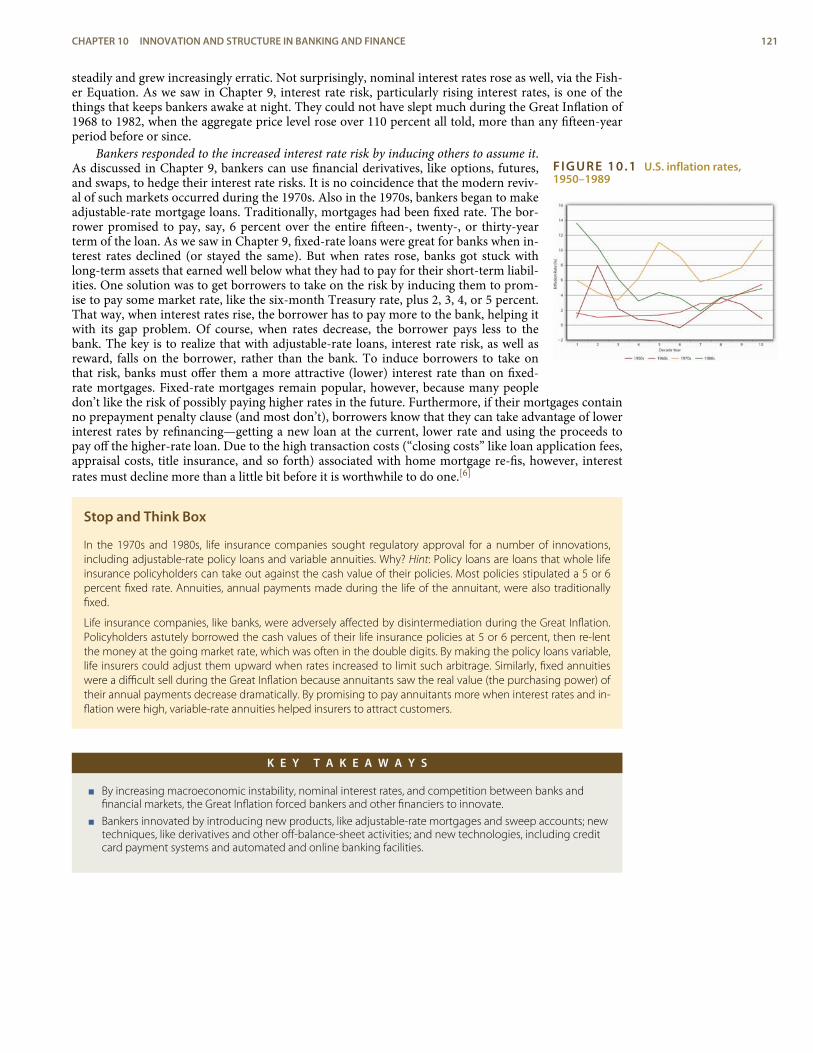
FIGURE 10.1 U.S. inflation rates,1950–1989
steadily and grew increasingly erratic. Not surprisingly, nominal interest rates rose as well, via the Fish-er Equation. As we saw in Chapter 9, interest rate risk, particularly rising interest rates, is one of thethings that keeps bankers awake at night. They could not have slept much during the Great Inflation of1968 to 1982, when the aggregate price level rose over 110 percent all told, more than any fifteen-yearperiod before or since.
Bankers responded to the increased interest rate risk by inducing others to assume it.As discussed in Chapter 9, bankers can use financial derivatives, like options, futures,and swaps, to hedge their interest rate risks. It is no coincidence that the modern reviv-al of such markets occurred during the 1970s. Also in the 1970s, bankers began to makeadjustable-rate mortgage loans. Traditionally, mortgages had been fixed rate. The bor-rower promised to pay, say, 6 percent over the entire fifteen-, twenty-, or thirty-yearterm of the loan. As we saw in Chapter 9, fixed-rate loans were great for banks when in-terest rates declined (or stayed the same). But when rates rose, banks got stuck withlong-term assets that earned well below what they had to pay for their short-term liabil-ities. One solution was to get borrowers to take on the risk by inducing them to prom-ise to pay some market rate, like the six-month Treasury rate, plus 2, 3, 4, or 5 percent.That way, when interest rates rise, the borrower has to pay more to the bank, helping itwith its gap problem. Of course, when rates decrease, the borrower pays less to thebank. The key is to realize that with adjustable-rate loans, interest rate risk, as well asreward, falls on the borrower, rather than the bank. To induce borrowers to take onthat risk, banks must offer them a more attractive (lower) interest rate than on fixed-rate mortgages. Fixed-rate mortgages remain popular, however, because many peopledon’t like the risk of possibly paying higher rates in the future. Furthermore, if their mortgages containno prepayment penalty clause (and most don’t), borrowers know that they can take advantage of lowerinterest rates by refinancing—getting a new loan at the current, lower rate and using the proceeds topay off the higher-rate loan. Due to the high transaction costs (“closing costs” like loan application fees,appraisal costs, title insurance, and so forth) associated with home mortgage re-fis, however, interestrates must decline more than a little bit before it is worthwhile to do one.[6]
Stop and Think Box
In the 1970s and 1980s, life insurance companies sought regulatory approval for a number of innovations,including adjustable-rate policy loans and variable annuities. Why? Hint: Policy loans are loans that whole lifeinsurance policyholders can take out against the cash value of their policies. Most policies stipulated a 5 or 6percent fixed rate. Annuities, annual payments made during the life of the annuitant, were also traditionallyfixed.
Life insurance companies, like banks, were adversely affected by disintermediation during the Great Inflation.Policyholders astutely borrowed the cash values of their life insurance policies at 5 or 6 percent, then re-lentthe money at the going market rate, which was often in the double digits. By making the policy loans variable,life insurers could adjust them upward when rates increased to limit such arbitrage. Similarly, fixed annuitieswere a difficult sell during the Great Inflation because annuitants saw the real value (the purchasing power) oftheir annual payments decrease dramatically. By promising to pay annuitants more when interest rates and in-flation were high, variable-rate annuities helped insurers to attract customers.
K E Y T A K E A W A Y S
< By increasing macroeconomic instability, nominal interest rates, and competition between banks andfinancial markets, the Great Inflation forced bankers and other financiers to innovate.
< Bankers innovated by introducing new products, like adjustable-rate mortgages and sweep accounts; newtechniques, like derivatives and other off-balance-sheet activities; and new technologies, including creditcard payment systems and automated and online banking facilities.
CHAPTER 10 INNOVATION AND STRUCTURE IN BANKING AND FINANCE 121
permissive regulatorysystem
A system that allowsfinanciers to engage in anyactivities they wish that arenot explicitly forbidden. It iseasier for financial innovationthan a restrictive regulatorysystem.
disintermediation
The opposite ofintermediation, wheninvestors pull money out ofbanks and other financialintermediaries.
3. LOOPHOLE MINING AND LOBBYING
L E A R N I N G O B J E C T I V E
1. What are loophole mining and lobbying, and why are they important?
Competition for profits also drives bankers and other financiers to look for regulatory loopholes, a processsometimes called loophole mining. Loophole mining works better in nations, like the United States, witha permissive regulatory system rather than a restrictive one, or, in other words, in places whereanything is allowed unless it is explicitly forbidden.[7] During the Great Inflation, banks could not leg-ally pay any interest on checking deposits or more than about 6 percent on time deposits, both far lessthan going market rates. Banks tried to lure depositors by giving them toasters and other gifts, attempt-ing desperately to skirt the interest rate caps by sweetening the pot. Few depositors bit. Massive disin-termediation ensued because depositors pulled their money out of banks to buy assets that couldprovide a market rate of return. Financiers responded by developing money market mutual funds(MMMFs), which offered checking account–like liquidity while paying interest at market rates, and byinvesting in short-term, high-grade assets like Treasury Bills and AAA-rated corporate commercial pa-per. (The growth of MMMFs in turn aided the growth and development of the commercial papermarkets.)
Stop and Think Box
To work around regulations against interstate banking, some banks, particularly in markets that transcendedstate lines, established so-called nonbank banks. Because the law defined banks as institutions that “accept de-posits and make loans,” banks surmised, correctly, that they could establish de facto branches that did onefunction or the other, but not both. What is this type of behavior called and why is it important?
This is loophole mining leading to financial innovation. Unfortunately, this particular innovation was much lesseconomically efficient than establishing real branches would have been. The banks that created nonbankbanks likely profited, but not as much as they would have if they had not had to resort to such a technicality.Moreover, the nonbank bank’s customers would have been less inconvenienced!
Bankers also used loophole mining by creating so-called sweep accounts, checking accounts that were in-vested each night in overnight loans. The interest earned on those loans was credited to the account thenext morning, allowing banks to pay rates above the official deposit rate ceilings. Sweep accounts alsoallowed banks to do the end around on reserve requirements, legal minimums of cash and FederalReserve deposits. Recall that banks earn no interest on reserves, so they often wish that they could holdfewer reserves than regulators require, particularly when interest rates are high. By using computers tosweep checking accounts at the close of business each day, banks reduced their de jure deposits and thustheir reserve requirements to the point that reserve regulations today are largely moot, a point to whichwe shall return.
Bank holding companies (BHCs), parent companies that own multiple banks and banking-relatedservice companies, offered bankers another way to use loophole mining because regulation of BHCswas, for a long time, more liberal than unit bank regulation. In particular, BHCs could circumvent re-strictive branching regulations and earn extra profits by providing investment advice, data processing,and credit card services. Today, bank holding companies own almost all of the big U.S. banks. J.P.Morgan Chase, Bank of America, and Citigroup are all BHCs.[8]
Not all regulations can be circumvented cost effectively via loophole mining, however, so some-times bankers and other financiers have to push for regulatory reforms. The Great Inflation and the de-cline of traditional banking, we’ll learn below, induced bankers to lobby to change the regulatory re-gime they faced. The bankers largely succeeded, as we’ll see, aided in part by a banking crisis.
122 MONEY AND BANKING
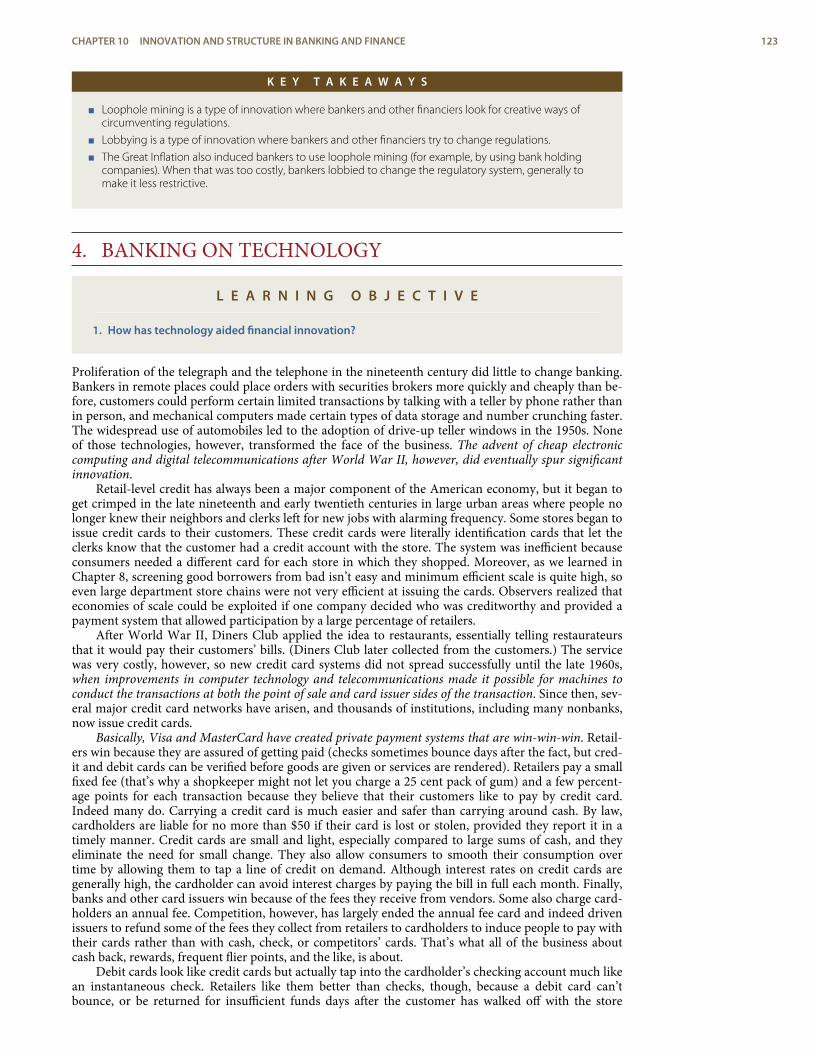
K E Y T A K E A W A Y S
< Loophole mining is a type of innovation where bankers and other financiers look for creative ways ofcircumventing regulations.
< Lobbying is a type of innovation where bankers and other financiers try to change regulations.
< The Great Inflation also induced bankers to use loophole mining (for example, by using bank holdingcompanies). When that was too costly, bankers lobbied to change the regulatory system, generally tomake it less restrictive.
4. BANKING ON TECHNOLOGY
L E A R N I N G O B J E C T I V E
1. How has technology aided financial innovation?
Proliferation of the telegraph and the telephone in the nineteenth century did little to change banking.Bankers in remote places could place orders with securities brokers more quickly and cheaply than be-fore, customers could perform certain limited transactions by talking with a teller by phone rather thanin person, and mechanical computers made certain types of data storage and number crunching faster.The widespread use of automobiles led to the adoption of drive-up teller windows in the 1950s. Noneof those technologies, however, transformed the face of the business. The advent of cheap electroniccomputing and digital telecommunications after World War II, however, did eventually spur significantinnovation.
Retail-level credit has always been a major component of the American economy, but it began toget crimped in the late nineteenth and early twentieth centuries in large urban areas where people nolonger knew their neighbors and clerks left for new jobs with alarming frequency. Some stores began toissue credit cards to their customers. These credit cards were literally identification cards that let theclerks know that the customer had a credit account with the store. The system was inefficient becauseconsumers needed a different card for each store in which they shopped. Moreover, as we learned inChapter 8, screening good borrowers from bad isn’t easy and minimum efficient scale is quite high, soeven large department store chains were not very efficient at issuing the cards. Observers realized thateconomies of scale could be exploited if one company decided who was creditworthy and provided apayment system that allowed participation by a large percentage of retailers.
After World War II, Diners Club applied the idea to restaurants, essentially telling restaurateursthat it would pay their customers’ bills. (Diners Club later collected from the customers.) The servicewas very costly, however, so new credit card systems did not spread successfully until the late 1960s,when improvements in computer technology and telecommunications made it possible for machines toconduct the transactions at both the point of sale and card issuer sides of the transaction. Since then, sev-eral major credit card networks have arisen, and thousands of institutions, including many nonbanks,now issue credit cards.
Basically, Visa and MasterCard have created private payment systems that are win-win-win. Retail-ers win because they are assured of getting paid (checks sometimes bounce days after the fact, but cred-it and debit cards can be verified before goods are given or services are rendered). Retailers pay a smallfixed fee (that’s why a shopkeeper might not let you charge a 25 cent pack of gum) and a few percent-age points for each transaction because they believe that their customers like to pay by credit card.Indeed many do. Carrying a credit card is much easier and safer than carrying around cash. By law,cardholders are liable for no more than $50 if their card is lost or stolen, provided they report it in atimely manner. Credit cards are small and light, especially compared to large sums of cash, and theyeliminate the need for small change. They also allow consumers to smooth their consumption overtime by allowing them to tap a line of credit on demand. Although interest rates on credit cards aregenerally high, the cardholder can avoid interest charges by paying the bill in full each month. Finally,banks and other card issuers win because of the fees they receive from vendors. Some also charge card-holders an annual fee. Competition, however, has largely ended the annual fee card and indeed drivenissuers to refund some of the fees they collect from retailers to cardholders to induce people to pay withtheir cards rather than with cash, check, or competitors’ cards. That’s what all of the business aboutcash back, rewards, frequent flier points, and the like, is about.
Debit cards look like credit cards but actually tap into the cardholder’s checking account much likean instantaneous check. Retailers like them better than checks, though, because a debit card can’tbounce, or be returned for insufficient funds days after the customer has walked off with the store
CHAPTER 10 INNOVATION AND STRUCTURE IN BANKING AND FINANCE 123
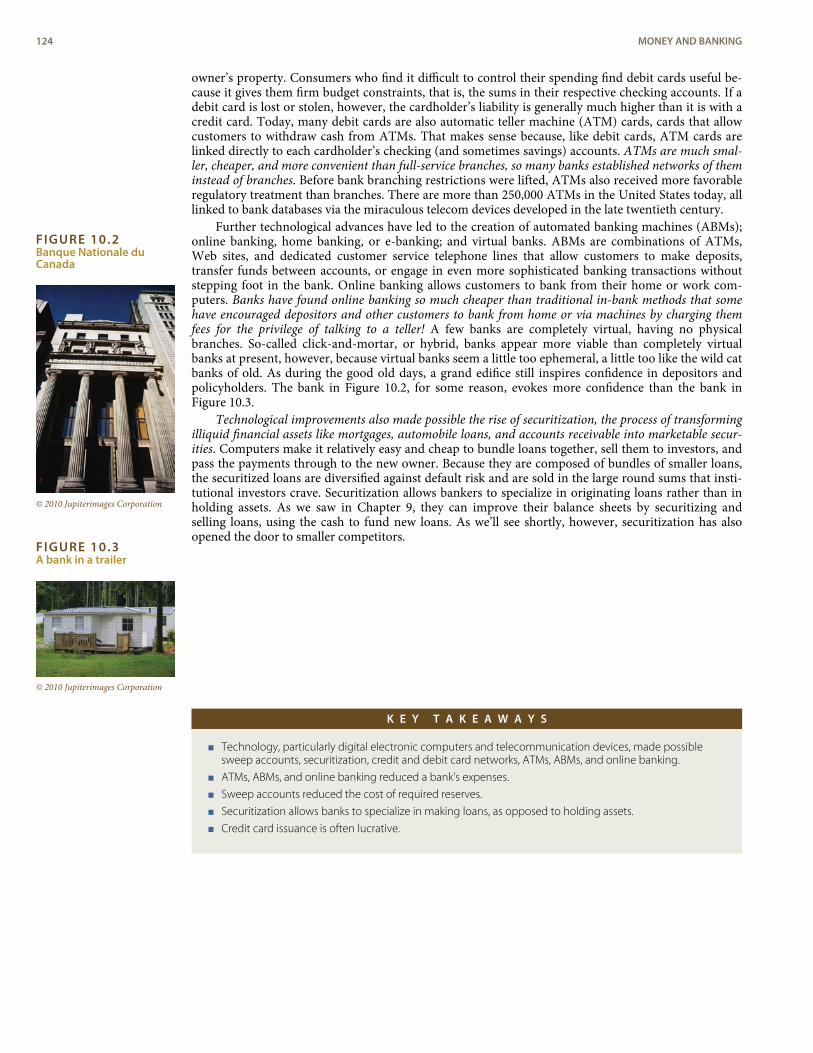
FIGURE 10.2Banque Nationale duCanada
© 2010 Jupiterimages Corporation
FIGURE 10.3A bank in a trailer
© 2010 Jupiterimages Corporation
owner’s property. Consumers who find it difficult to control their spending find debit cards useful be-cause it gives them firm budget constraints, that is, the sums in their respective checking accounts. If adebit card is lost or stolen, however, the cardholder’s liability is generally much higher than it is with acredit card. Today, many debit cards are also automatic teller machine (ATM) cards, cards that allowcustomers to withdraw cash from ATMs. That makes sense because, like debit cards, ATM cards arelinked directly to each cardholder’s checking (and sometimes savings) accounts. ATMs are much smal-ler, cheaper, and more convenient than full-service branches, so many banks established networks of theminstead of branches. Before bank branching restrictions were lifted, ATMs also received more favorableregulatory treatment than branches. There are more than 250,000 ATMs in the United States today, alllinked to bank databases via the miraculous telecom devices developed in the late twentieth century.
Further technological advances have led to the creation of automated banking machines (ABMs);online banking, home banking, or e-banking; and virtual banks. ABMs are combinations of ATMs,Web sites, and dedicated customer service telephone lines that allow customers to make deposits,transfer funds between accounts, or engage in even more sophisticated banking transactions withoutstepping foot in the bank. Online banking allows customers to bank from their home or work com-puters. Banks have found online banking so much cheaper than traditional in-bank methods that somehave encouraged depositors and other customers to bank from home or via machines by charging themfees for the privilege of talking to a teller! A few banks are completely virtual, having no physicalbranches. So-called click-and-mortar, or hybrid, banks appear more viable than completely virtualbanks at present, however, because virtual banks seem a little too ephemeral, a little too like the wild catbanks of old. As during the good old days, a grand edifice still inspires confidence in depositors andpolicyholders. The bank in Figure 10.2, for some reason, evokes more confidence than the bank inFigure 10.3.
Technological improvements also made possible the rise of securitization, the process of transformingilliquid financial assets like mortgages, automobile loans, and accounts receivable into marketable secur-ities. Computers make it relatively easy and cheap to bundle loans together, sell them to investors, andpass the payments through to the new owner. Because they are composed of bundles of smaller loans,the securitized loans are diversified against default risk and are sold in the large round sums that insti-tutional investors crave. Securitization allows bankers to specialize in originating loans rather than inholding assets. As we saw in Chapter 9, they can improve their balance sheets by securitizing andselling loans, using the cash to fund new loans. As we’ll see shortly, however, securitization has alsoopened the door to smaller competitors.
K E Y T A K E A W A Y S
< Technology, particularly digital electronic computers and telecommunication devices, made possiblesweep accounts, securitization, credit and debit card networks, ATMs, ABMs, and online banking.
< ATMs, ABMs, and online banking reduced a bank’s expenses.
< Sweep accounts reduced the cost of required reserves.
< Securitization allows banks to specialize in making loans, as opposed to holding assets.
< Credit card issuance is often lucrative.
124 MONEY AND BANKING
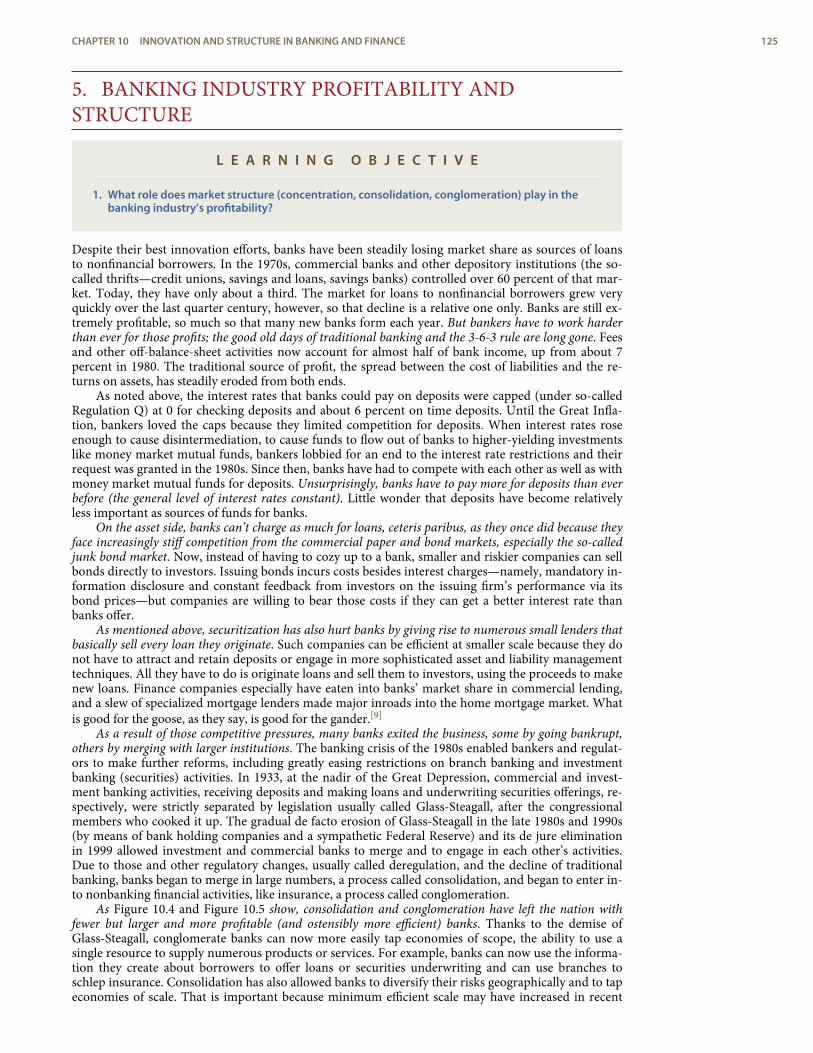
5. BANKING INDUSTRY PROFITABILITY ANDSTRUCTURE
L E A R N I N G O B J E C T I V E
1. What role does market structure (concentration, consolidation, conglomeration) play in thebanking industry’s profitability?
Despite their best innovation efforts, banks have been steadily losing market share as sources of loansto nonfinancial borrowers. In the 1970s, commercial banks and other depository institutions (the so-called thrifts—credit unions, savings and loans, savings banks) controlled over 60 percent of that mar-ket. Today, they have only about a third. The market for loans to nonfinancial borrowers grew veryquickly over the last quarter century, however, so that decline is a relative one only. Banks are still ex-tremely profitable, so much so that many new banks form each year. But bankers have to work harderthan ever for those profits; the good old days of traditional banking and the 3-6-3 rule are long gone. Feesand other off-balance-sheet activities now account for almost half of bank income, up from about 7percent in 1980. The traditional source of profit, the spread between the cost of liabilities and the re-turns on assets, has steadily eroded from both ends.
As noted above, the interest rates that banks could pay on deposits were capped (under so-calledRegulation Q) at 0 for checking deposits and about 6 percent on time deposits. Until the Great Infla-tion, bankers loved the caps because they limited competition for deposits. When interest rates roseenough to cause disintermediation, to cause funds to flow out of banks to higher-yielding investmentslike money market mutual funds, bankers lobbied for an end to the interest rate restrictions and theirrequest was granted in the 1980s. Since then, banks have had to compete with each other as well as withmoney market mutual funds for deposits. Unsurprisingly, banks have to pay more for deposits than everbefore (the general level of interest rates constant). Little wonder that deposits have become relativelyless important as sources of funds for banks.
On the asset side, banks can’t charge as much for loans, ceteris paribus, as they once did because theyface increasingly stiff competition from the commercial paper and bond markets, especially the so-calledjunk bond market. Now, instead of having to cozy up to a bank, smaller and riskier companies can sellbonds directly to investors. Issuing bonds incurs costs besides interest charges—namely, mandatory in-formation disclosure and constant feedback from investors on the issuing firm’s performance via itsbond prices—but companies are willing to bear those costs if they can get a better interest rate thanbanks offer.
As mentioned above, securitization has also hurt banks by giving rise to numerous small lenders thatbasically sell every loan they originate. Such companies can be efficient at smaller scale because they donot have to attract and retain deposits or engage in more sophisticated asset and liability managementtechniques. All they have to do is originate loans and sell them to investors, using the proceeds to makenew loans. Finance companies especially have eaten into banks’ market share in commercial lending,and a slew of specialized mortgage lenders made major inroads into the home mortgage market. Whatis good for the goose, as they say, is good for the gander.[9]
As a result of those competitive pressures, many banks exited the business, some by going bankrupt,others by merging with larger institutions. The banking crisis of the 1980s enabled bankers and regulat-ors to make further reforms, including greatly easing restrictions on branch banking and investmentbanking (securities) activities. In 1933, at the nadir of the Great Depression, commercial and invest-ment banking activities, receiving deposits and making loans and underwriting securities offerings, re-spectively, were strictly separated by legislation usually called Glass-Steagall, after the congressionalmembers who cooked it up. The gradual de facto erosion of Glass-Steagall in the late 1980s and 1990s(by means of bank holding companies and a sympathetic Federal Reserve) and its de jure eliminationin 1999 allowed investment and commercial banks to merge and to engage in each other’s activities.Due to those and other regulatory changes, usually called deregulation, and the decline of traditionalbanking, banks began to merge in large numbers, a process called consolidation, and began to enter in-to nonbanking financial activities, like insurance, a process called conglomeration.
As Figure 10.4 and Figure 10.5 show, consolidation and conglomeration have left the nation withfewer but larger and more profitable (and ostensibly more efficient) banks. Thanks to the demise ofGlass-Steagall, conglomerate banks can now more easily tap economies of scope, the ability to use asingle resource to supply numerous products or services. For example, banks can now use the informa-tion they create about borrowers to offer loans or securities underwriting and can use branches toschlep insurance. Consolidation has also allowed banks to diversify their risks geographically and to tapeconomies of scale. That is important because minimum efficient scale may have increased in recent
CHAPTER 10 INNOVATION AND STRUCTURE IN BANKING AND FINANCE 125
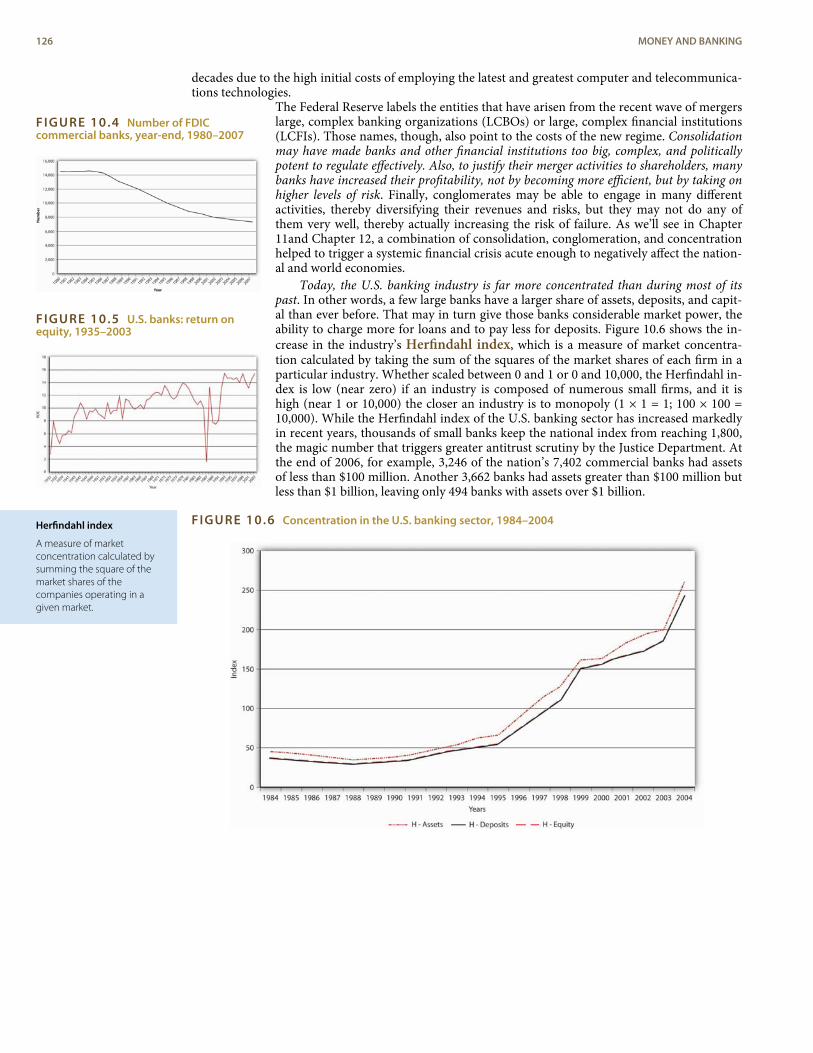
FIGURE 10.4 Number of FDICcommercial banks, year-end, 1980–2007
FIGURE 10.5 U.S. banks: return onequity, 1935–2003
Herfindahl index
A measure of marketconcentration calculated bysumming the square of themarket shares of thecompanies operating in agiven market.
decades due to the high initial costs of employing the latest and greatest computer and telecommunica-tions technologies.
The Federal Reserve labels the entities that have arisen from the recent wave of mergerslarge, complex banking organizations (LCBOs) or large, complex financial institutions(LCFIs). Those names, though, also point to the costs of the new regime. Consolidationmay have made banks and other financial institutions too big, complex, and politicallypotent to regulate effectively. Also, to justify their merger activities to shareholders, manybanks have increased their profitability, not by becoming more efficient, but by taking onhigher levels of risk. Finally, conglomerates may be able to engage in many differentactivities, thereby diversifying their revenues and risks, but they may not do any ofthem very well, thereby actually increasing the risk of failure. As we’ll see in Chapter11and Chapter 12, a combination of consolidation, conglomeration, and concentrationhelped to trigger a systemic financial crisis acute enough to negatively affect the nation-al and world economies.
Today, the U.S. banking industry is far more concentrated than during most of itspast. In other words, a few large banks have a larger share of assets, deposits, and capit-al than ever before. That may in turn give those banks considerable market power, theability to charge more for loans and to pay less for deposits. Figure 10.6 shows the in-crease in the industry’s Herfindahl index, which is a measure of market concentra-tion calculated by taking the sum of the squares of the market shares of each firm in aparticular industry. Whether scaled between 0 and 1 or 0 and 10,000, the Herfindahl in-dex is low (near zero) if an industry is composed of numerous small firms, and it ishigh (near 1 or 10,000) the closer an industry is to monopoly (1 × 1 = 1; 100 × 100 =10,000). While the Herfindahl index of the U.S. banking sector has increased markedlyin recent years, thousands of small banks keep the national index from reaching 1,800,the magic number that triggers greater antitrust scrutiny by the Justice Department. Atthe end of 2006, for example, 3,246 of the nation’s 7,402 commercial banks had assetsof less than $100 million. Another 3,662 banks had assets greater than $100 million butless than $1 billion, leaving only 494 banks with assets over $1 billion.
FIGURE 10.6 Concentration in the U.S. banking sector, 1984–2004
126 MONEY AND BANKING
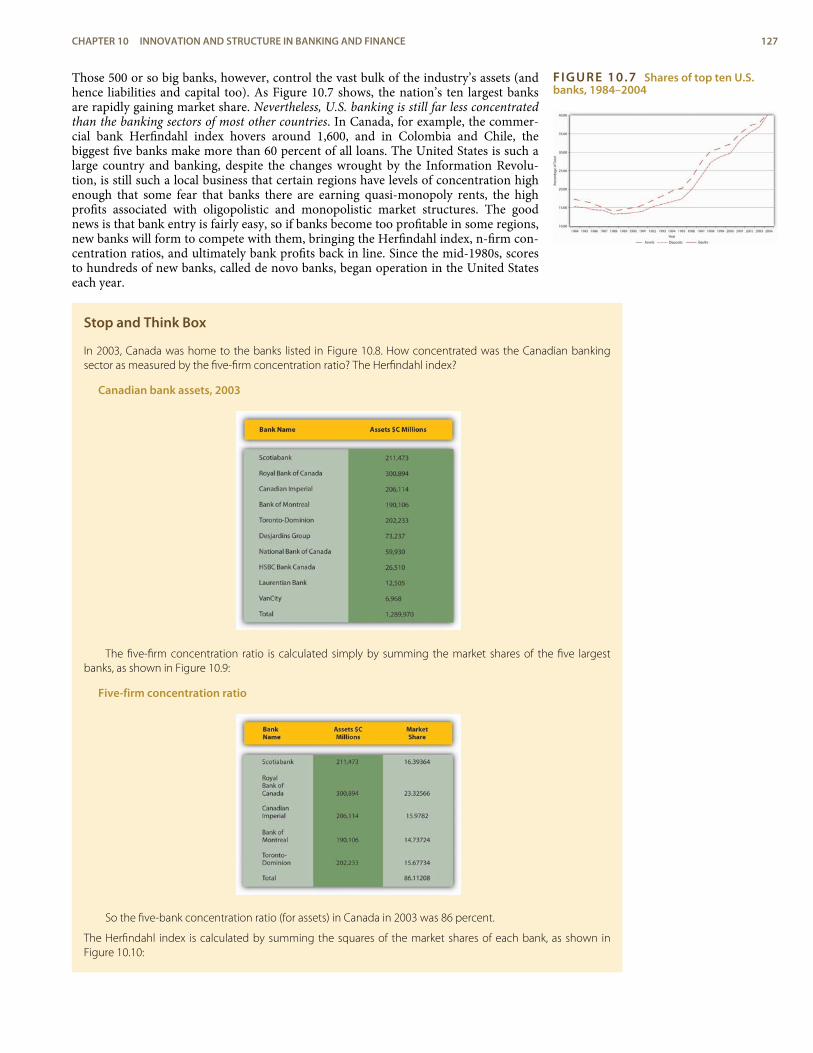
FIGURE 10.7 Shares of top ten U.S.banks, 1984–2004
Those 500 or so big banks, however, control the vast bulk of the industry’s assets (andhence liabilities and capital too). As Figure 10.7 shows, the nation’s ten largest banksare rapidly gaining market share. Nevertheless, U.S. banking is still far less concentratedthan the banking sectors of most other countries. In Canada, for example, the commer-cial bank Herfindahl index hovers around 1,600, and in Colombia and Chile, thebiggest five banks make more than 60 percent of all loans. The United States is such alarge country and banking, despite the changes wrought by the Information Revolu-tion, is still such a local business that certain regions have levels of concentration highenough that some fear that banks there are earning quasi-monopoly rents, the highprofits associated with oligopolistic and monopolistic market structures. The goodnews is that bank entry is fairly easy, so if banks become too profitable in some regions,new banks will form to compete with them, bringing the Herfindahl index, n-firm con-centration ratios, and ultimately bank profits back in line. Since the mid-1980s, scoresto hundreds of new banks, called de novo banks, began operation in the United Stateseach year.
Stop and Think Box
In 2003, Canada was home to the banks listed in Figure 10.8. How concentrated was the Canadian bankingsector as measured by the five-firm concentration ratio? The Herfindahl index?
Canadian bank assets, 2003
The five-firm concentration ratio is calculated simply by summing the market shares of the five largestbanks, as shown in Figure 10.9:
Five-firm concentration ratio
So the five-bank concentration ratio (for assets) in Canada in 2003 was 86 percent.
The Herfindahl index is calculated by summing the squares of the market shares of each bank, as shown inFigure 10.10:
CHAPTER 10 INNOVATION AND STRUCTURE IN BANKING AND FINANCE 127
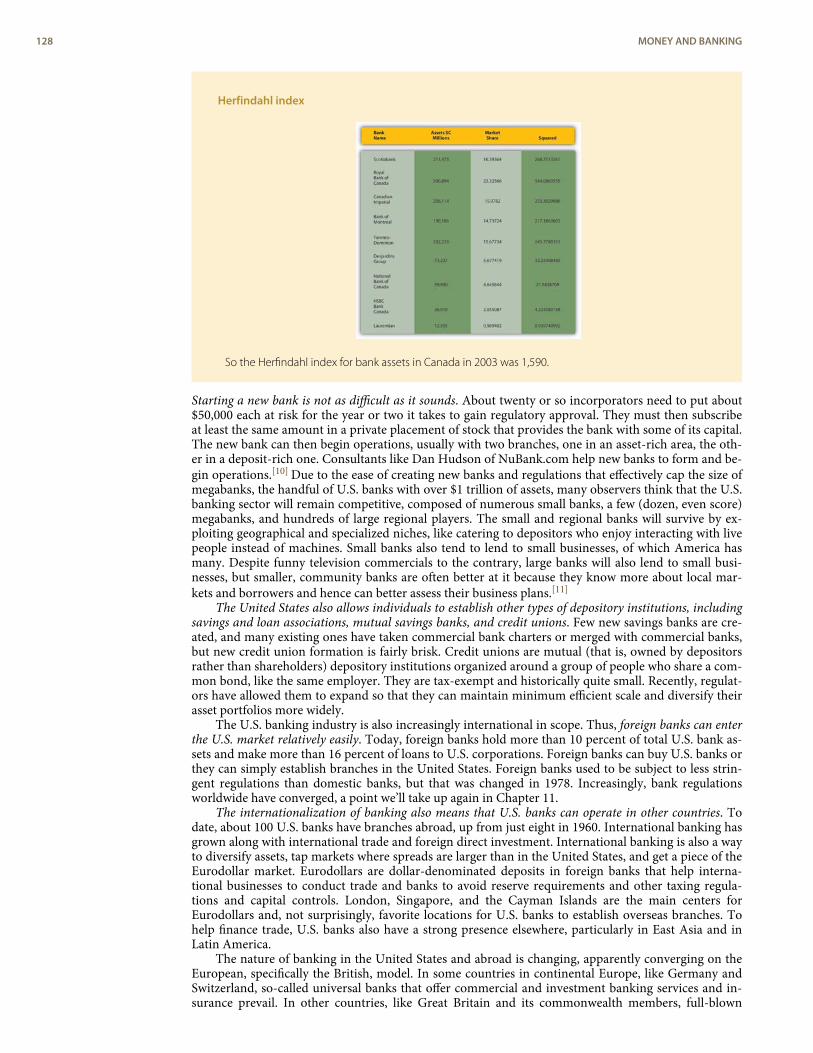
Herfindahl index
So the Herfindahl index for bank assets in Canada in 2003 was 1,590.
Starting a new bank is not as difficult as it sounds. About twenty or so incorporators need to put about$50,000 each at risk for the year or two it takes to gain regulatory approval. They must then subscribeat least the same amount in a private placement of stock that provides the bank with some of its capital.The new bank can then begin operations, usually with two branches, one in an asset-rich area, the oth-er in a deposit-rich one. Consultants like Dan Hudson of NuBank.com help new banks to form and be-gin operations.[10] Due to the ease of creating new banks and regulations that effectively cap the size ofmegabanks, the handful of U.S. banks with over $1 trillion of assets, many observers think that the U.S.banking sector will remain competitive, composed of numerous small banks, a few (dozen, even score)megabanks, and hundreds of large regional players. The small and regional banks will survive by ex-ploiting geographical and specialized niches, like catering to depositors who enjoy interacting with livepeople instead of machines. Small banks also tend to lend to small businesses, of which America hasmany. Despite funny television commercials to the contrary, large banks will also lend to small busi-nesses, but smaller, community banks are often better at it because they know more about local mar-kets and borrowers and hence can better assess their business plans.[11]
The United States also allows individuals to establish other types of depository institutions, includingsavings and loan associations, mutual savings banks, and credit unions. Few new savings banks are cre-ated, and many existing ones have taken commercial bank charters or merged with commercial banks,but new credit union formation is fairly brisk. Credit unions are mutual (that is, owned by depositorsrather than shareholders) depository institutions organized around a group of people who share a com-mon bond, like the same employer. They are tax-exempt and historically quite small. Recently, regulat-ors have allowed them to expand so that they can maintain minimum efficient scale and diversify theirasset portfolios more widely.
The U.S. banking industry is also increasingly international in scope. Thus, foreign banks can enterthe U.S. market relatively easily. Today, foreign banks hold more than 10 percent of total U.S. bank as-sets and make more than 16 percent of loans to U.S. corporations. Foreign banks can buy U.S. banks orthey can simply establish branches in the United States. Foreign banks used to be subject to less strin-gent regulations than domestic banks, but that was changed in 1978. Increasingly, bank regulationsworldwide have converged, a point we’ll take up again in Chapter 11.
The internationalization of banking also means that U.S. banks can operate in other countries. Todate, about 100 U.S. banks have branches abroad, up from just eight in 1960. International banking hasgrown along with international trade and foreign direct investment. International banking is also a wayto diversify assets, tap markets where spreads are larger than in the United States, and get a piece of theEurodollar market. Eurodollars are dollar-denominated deposits in foreign banks that help interna-tional businesses to conduct trade and banks to avoid reserve requirements and other taxing regula-tions and capital controls. London, Singapore, and the Cayman Islands are the main centers forEurodollars and, not surprisingly, favorite locations for U.S. banks to establish overseas branches. Tohelp finance trade, U.S. banks also have a strong presence elsewhere, particularly in East Asia and inLatin America.
The nature of banking in the United States and abroad is changing, apparently converging on theEuropean, specifically the British, model. In some countries in continental Europe, like Germany andSwitzerland, so-called universal banks that offer commercial and investment banking services and in-surance prevail. In other countries, like Great Britain and its commonwealth members, full-blown
128 MONEY AND BANKING
financial conglomerates are less common, but most banks engage in both commercial and investmentbanking activities. Meanwhile, foreign securities markets are modeling themselves after American mar-kets, growing larger and more sophisticated. Increasingly, the world’s financial system is becoming one.That should make it more efficient, but it also raises fears of financial catastrophe, a point to which weshall return.
K E Y T A K E A W A Y S
< Industry consolidation is measured by the number of banks in existence at a given time.
< As the number of banks declines (because mergers and bankruptcies exceed new bank formation), theindustry is said to become more consolidated. It is important because a more consolidated industry maybe safer and more profitable as smaller, weaker institutions are swallowed up by larger, stronger ones.
< However, consolidation can also lead to higher costs for consumers and borrowers and poorer service.
< Bigger banks are likely to be more diversified than smaller ones, but they might also take on higher levelsof risk, thereby threatening the stability of the financial system.
< Conglomeration refers to the scope of activities that a bank or other financial intermediary is allowed toengage in.
< Traditionally, U.S. banks could engage in commercial banking activities or investment banking activities,but not both, and they could not sell or underwrite insurance. Due to recent regulatory changes, however,banks and other financial intermediaries and facilitators like brokerages can now merge into the samecompany or exist under the same holding company umbrella.
< This deregulation may increase competition for financial intermediaries, thereby driving innovation. Itcould also lead, however, to the creation of financial conglomerates that are too large and complex toregulate adequately.
< Industry concentration is a proxy for competition and is measured by the n-firm concentration of assets(revenues, capital, etc., where n is 1, 3, 5, 10, 25, 50, etc.) or by the Herfindahl index, the sum of the squareof the market shares (again for assets, deposits, revenues, capital, etc.) of each company in the industry orin a given city, state, or region.
< Concentration is important because a highly concentrated industry may be less competitive, leading toless innovation, higher costs for borrowers, outsized profits for suppliers (in this case banks), and a morefragile (prone to systemic crisis) banking system.
< On the other hand, as banking has grown more concentrated, individual banks have become moregeographically diversified, which may help them to better weather economic downturns.
6. SUGGESTED READINGAnderloni, Luisa, David Llewellyn, and Reinhard Schmidt. Financial Innovation in Retail and Cor-
porate Banking. Northampton, MA: Edward Elgar, 2009.Banner, Stuart. Anglo-American Securities Regulation: Cultural and Political Roots, 1690–1860.
New York: Cambridge University Press, 2002.Freedman, Roy. Introduction to Financial Technology. New York: Academic Press, 2006.Shiller, Robert. The New Financial Order: Risk in the 21st Century. Princeton, NJ: Princeton
University Press, 2004.Wright, Robert E. The Wealth of Nations Rediscovered: Integration and Expansion in American
Financial Markets, 1780–1850. New York: Cambridge University Press, 2002.Wright, Robert E., and David J. Cowen. Financial Founding Fathers: The Men Who Made America
Rich. Chicago, IL: Chicago University Press, 2006.Wright, Robert E., and George D. Smith. Mutually Beneficial: The Guardian and Life Insurance in
America. New York: New York University Press, 2004.
CHAPTER 10 INNOVATION AND STRUCTURE IN BANKING AND FINANCE 129

1.2.3.
4.
5.6.7.
8.9.
10.11.
ENDNOTES
http://www.archives.upenn.edu/histy/features/1700s/people/willing_thos.html
http://www.youtube.com/watch?v=BJ7EIKbnnkw
http://www.officemuseum.com/IMagesWWW/Tabulating_Machine_Co_card_punch_left_end.JPG
http://www.officemuseum.com/IMagesWWW/1904_1912_Graphotype_Addressograph_Co_Chicago_OM.JPG
http://ccs.mit.edu/papers/CCSWP196.html
http://www.bankrate.com/brm/calc_vml/refi/refi.asp
Doug Arner, Financial Stability, Economic Growth, and the Role of Law (New York: Cam-bridge University Press, 2007), 263.
http://www.chicagofed.org/downloads/bhcname
http://www.bartleby.com/59/3/whatsgoodfor.html
http://www.nubank.com/
http://kevinrants.typepad.com/kevin_rants/business/index.html
130 MONEY AND BANKING
public interest model
A model of governmentdeveloped by politicalscientists that posits thatpoliticians, bureaucrats, andother government workersserve the public in lieu ofthemselves.
public choice model
See private interest model.
private interest model
A model of governmentdeveloped by economiststhat posits that politicians,bureaucrats, and othergovernment workers servethemselves in lieu of thecitizens or public.
C H A P T E R 1 1The Economics of FinancialRegulation
C H A P T E R O B J E C T I V E S
By the end of this chapter, students should be able to:
1. Explain why the government can’t simply legislate bad things out of existence.
2. Describe the public interest and private interest models of government and explain whythey are important.
3. Explain how asymmetric information interferes with regulatory efforts.
4. Describe how government regulators exacerbated the Great Depression.
5. Describe how government regulators made the Savings and Loan Crisis worse.
6. Assess recent regulatory reforms in the United States and both Basel accords.
1. PUBLIC INTEREST VERSUS PRIVATE INTEREST
L E A R N I N G O B J E C T I V E
1. Why can’t the government legislate bad things out of existence and which model of govern-ment, public interest or private interest, is the most accurate depiction of reality?
Whenever anything seemingly bad happens in the world, many people today immediately clamor forthe government to do something about it. That is sometimes an appropriate response, but many timesit is not. For starters, government can’t fix the world by decree. Simply making an activity illegal does notmean that it will stop. Because the government faces a budget constraint and opportunity costs, it can’tafford to monitor everyone all the time. What’s bad for some is often good for others, so many peoplewillingly supply illegal goods or activities. As a result, many illegal activities are commonplace; in noparticular order, sodomy, drug use, reckless use of automobiles, and music piracy come to mind.
The second problem with relying on government to fix bad things is that government officials are notthe angels many people assume they are. It’s not your fault. Especially if you went through the U.S. pub-lic school system, you likely learned an interpretation of government called the public interest model.As its name suggests, the public interest model posits that government officials work in the interests ofthe public, of “the people,” if you will. It’s the sort of thing Abraham Lincoln had in mind in his famousGettysburg Address when he said “that government of the people, by the people, for the people, shallnot perish from the earth.”[1] That’s outstanding political rhetoric, better than anything current spinartists concoct, but is it a fair representation of reality?
Many economists think not. They believe that private interest prevails, even in the government.According to their model, called the public choice or, less confusingly, the private interest model,politicians and bureaucrats often behave in their own interests rather than those of the public. Of course,they don’t go around saying that we need law X or regulation Y to help me to get rich via bribes, tobailout my brother-in-law, or to ensure that I soon receive a cushy job in the private sector. Rather,they say that we need law X or regulation Y to protect widows and orphans, to stymie the efforts of badguys, or to make the rich pay for their success.
In many countries, the ones we will call “predatory” in the context of the Growth Diamond modeldiscussed in Chapter 23, the private interest model clearly holds sway. In rich countries, the public in-terest model becomes more plausible. Nevertheless, many economic regulations, though clothed inpublic interest rhetoric, appear on close inspection to conform to the private interest model. As
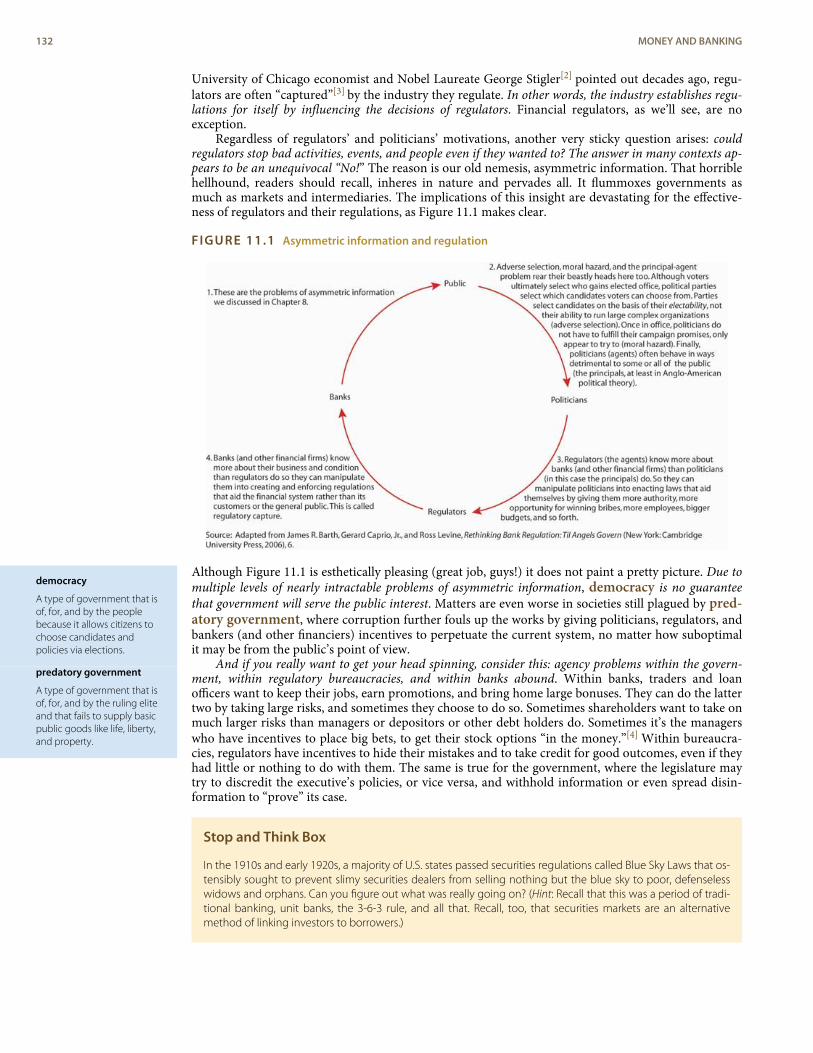
democracy
A type of government that isof, for, and by the peoplebecause it allows citizens tochoose candidates andpolicies via elections.
predatory government
A type of government that isof, for, and by the ruling eliteand that fails to supply basicpublic goods like life, liberty,and property.
University of Chicago economist and Nobel Laureate George Stigler[2] pointed out decades ago, regu-lators are often “captured”[3] by the industry they regulate. In other words, the industry establishes regu-lations for itself by influencing the decisions of regulators. Financial regulators, as we’ll see, are noexception.
Regardless of regulators’ and politicians’ motivations, another very sticky question arises: couldregulators stop bad activities, events, and people even if they wanted to? The answer in many contexts ap-pears to be an unequivocal “No!” The reason is our old nemesis, asymmetric information. That horriblehellhound, readers should recall, inheres in nature and pervades all. It flummoxes governments asmuch as markets and intermediaries. The implications of this insight are devastating for the effective-ness of regulators and their regulations, as Figure 11.1 makes clear.
FIGURE 11.1 Asymmetric information and regulation
Although Figure 11.1 is esthetically pleasing (great job, guys!) it does not paint a pretty picture. Due tomultiple levels of nearly intractable problems of asymmetric information, democracy is no guaranteethat government will serve the public interest. Matters are even worse in societies still plagued by pred-atory government, where corruption further fouls up the works by giving politicians, regulators, andbankers (and other financiers) incentives to perpetuate the current system, no matter how suboptimalit may be from the public’s point of view.
And if you really want to get your head spinning, consider this: agency problems within the govern-ment, within regulatory bureaucracies, and within banks abound. Within banks, traders and loanofficers want to keep their jobs, earn promotions, and bring home large bonuses. They can do the lattertwo by taking large risks, and sometimes they choose to do so. Sometimes shareholders want to take onmuch larger risks than managers or depositors or other debt holders do. Sometimes it’s the managerswho have incentives to place big bets, to get their stock options “in the money.”[4] Within bureaucra-cies, regulators have incentives to hide their mistakes and to take credit for good outcomes, even if theyhad little or nothing to do with them. The same is true for the government, where the legislature maytry to discredit the executive’s policies, or vice versa, and withhold information or even spread disin-formation to “prove” its case.
Stop and Think Box
In the 1910s and early 1920s, a majority of U.S. states passed securities regulations called Blue Sky Laws that os-tensibly sought to prevent slimy securities dealers from selling nothing but the blue sky to poor, defenselesswidows and orphans. Can you figure out what was really going on? (Hint: Recall that this was a period of tradi-tional banking, unit banks, the 3-6-3 rule, and all that. Recall, too, that securities markets are an alternativemethod of linking investors to borrowers.)
132 MONEY AND BANKING
We probably gave it away with that last hint. Blue Sky Laws, scholars now realize, were veiled attempts to pro-tect the monopolies of unit bankers upset about losing business to the securities markets. Unable to garnerpublic sympathy for their plight, the bankers instead spoke in terms of public interest, of defrauded widowsand orphans. There were certainly some scams about, but not enough to warrant the more virulent Blue SkyLaws, which actually gave state officials the power to forbid issuance of securities they didn’t like, and in somestates, that was most of them!
It’s okay if you feel a bit uneasy with these new ideas. We think that as adults you can handle straighttalk. It’ll be better for everyone—you, me, our children and grandchildren—if you learn to look at thegovernment’s actions with a jaundiced eye. Regulators have failed in the past and will do so again unlesswe align the interests of all the major parties depicted in Figure 11.1 more closely, empowering marketforces to do most of the heavy lifting.
K E Y T A K E A W A Y S
< The government can’t legislate bad things away because it can’t be every place at once. Like the rest of us,government faces budget constraints and opportunity costs. Therefore, it cannot stop activities that somepeople enjoy or find profitable.
< According to the public interest model, government tries to enact laws, regulations, and policies thatbenefit the public.
< The private interest (or public choice) model, by contrast, suggests that government officials enact lawsthat are in their own private interest.
< It is important to know which model is a more accurate description of reality because the models havevery different implications for our attitudes toward regulation.
< If one believes the public interest model is usually correct, then one will be more likely to call forgovernment regulation, even if one admits that regulatory goals may in fact be difficult to achieveregardless of the intentions of politicians and bureaucrats.
< If one believes the private interest model is a more accurate depiction of the real world, one will be moreskeptical of government regulation.
< Asymmetric information creates a principal-agent problem between the public and elected officials,another principal-agent problem between those officials and regulators, and yet another principal-agentproblem between regulators and banks (and other financial firms) because in each case, one party(politicians, regulators, banks) knows more than the other (public, politicians, regulators).
< So there are at least three places where the public’s interest can be stymied: in political elections, in theinteraction between Congress and the president and regulatory agencies, and in the interaction betweenregulators and the regulated. And that’s ignoring the often extensive agency problems found withingovernments, regulatory agencies, and financial institutions!
2. THE GREAT DEPRESSION AS REGULATORY FAILURE
L E A R N I N G O B J E C T I V E
1. How did the government exacerbate the Great Depression?
Time again, government regulators have either failed to stop financial crises or have exacerbated them.Examples are too numerous to discuss in detail here, so we will address only two of the more egregiouscases, the Great Depression of the 1930s and the Savings and Loan (S&L) Crisis of the 1980s.
CHAPTER 11 THE ECONOMICS OF FINANCIAL REGULATION 133
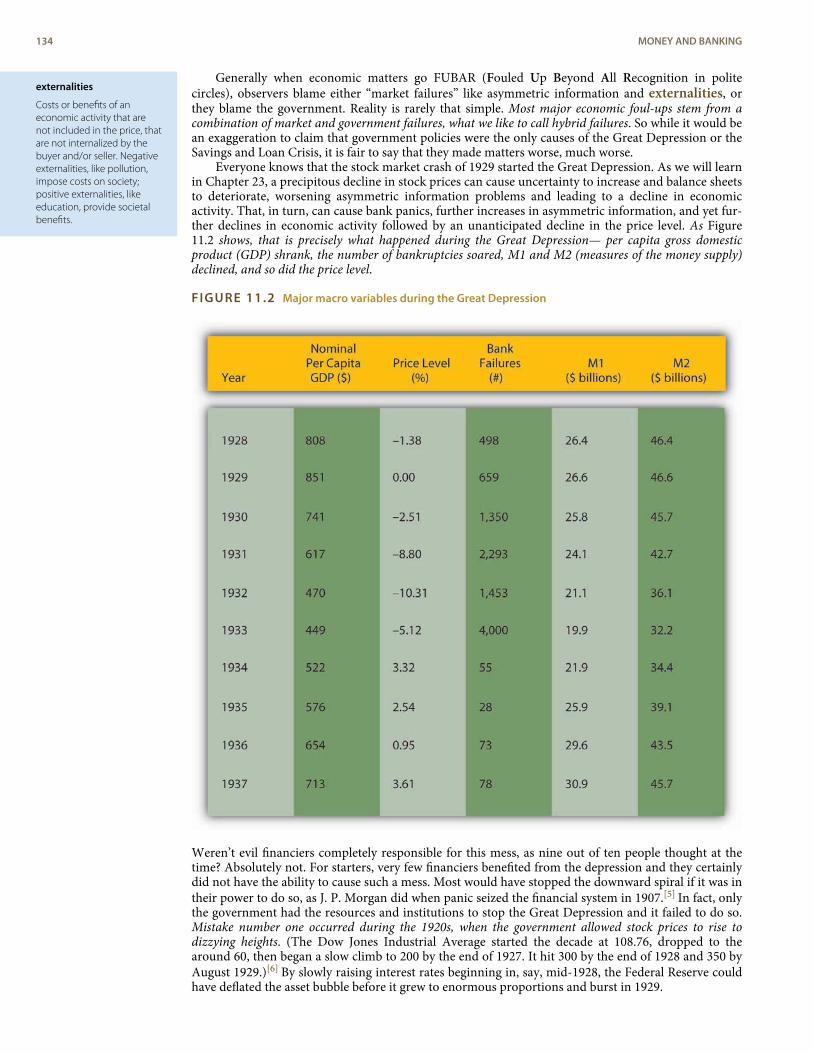
externalities
Costs or benefits of aneconomic activity that arenot included in the price, thatare not internalized by thebuyer and/or seller. Negativeexternalities, like pollution,impose costs on society;positive externalities, likeeducation, provide societalbenefits.
Generally when economic matters go FUBAR (Fouled Up Beyond All Recognition in politecircles), observers blame either “market failures” like asymmetric information and externalities, orthey blame the government. Reality is rarely that simple. Most major economic foul-ups stem from acombination of market and government failures, what we like to call hybrid failures. So while it would bean exaggeration to claim that government policies were the only causes of the Great Depression or theSavings and Loan Crisis, it is fair to say that they made matters worse, much worse.
Everyone knows that the stock market crash of 1929 started the Great Depression. As we will learnin Chapter 23, a precipitous decline in stock prices can cause uncertainty to increase and balance sheetsto deteriorate, worsening asymmetric information problems and leading to a decline in economicactivity. That, in turn, can cause bank panics, further increases in asymmetric information, and yet fur-ther declines in economic activity followed by an unanticipated decline in the price level. As Figure11.2 shows, that is precisely what happened during the Great Depression— per capita gross domesticproduct (GDP) shrank, the number of bankruptcies soared, M1 and M2 (measures of the money supply)declined, and so did the price level.
FIGURE 11.2 Major macro variables during the Great Depression
Weren’t evil financiers completely responsible for this mess, as nine out of ten people thought at thetime? Absolutely not. For starters, very few financiers benefited from the depression and they certainlydid not have the ability to cause such a mess. Most would have stopped the downward spiral if it was intheir power to do so, as J. P. Morgan did when panic seized the financial system in 1907.[5] In fact, onlythe government had the resources and institutions to stop the Great Depression and it failed to do so.Mistake number one occurred during the 1920s, when the government allowed stock prices to rise todizzying heights. (The Dow Jones Industrial Average started the decade at 108.76, dropped to thearound 60, then began a slow climb to 200 by the end of 1927. It hit 300 by the end of 1928 and 350 byAugust 1929.)[6] By slowly raising interest rates beginning in, say, mid-1928, the Federal Reserve couldhave deflated the asset bubble before it grew to enormous proportions and burst in 1929.
134 MONEY AND BANKING
Mistake number two occurred after the crash, in late 1929 and 1930, when the Federal Reserve raisedinterest rates. As we’ll see in Chapter 17, the correct policy response at that point was to lower interestrates. The government’s third mistake was its banking policy. As described in Chapter 10, the UnitedStates was home to tens of thousands of tiny unit banks that simply were not large or diversified enoughto ride out the depression. If a factory or other major employer succumbed, the local bank too wasdoomed. Depositors understood this, so at the first sign of trouble they ran on their banks, pulling outtheir deposits before they went under. Their actions guaranteed that their banks would indeed fail.Meanwhile, across the border in Canada, which was home to a few large and highly diversified banks,few bank disturbances took place. California also weathered the Great Depression relatively well, inpart because its banks, which freely branched throughout the large state, enjoyed relatively well-diver-sified assets and hence avoided the worst of the bank crises.
The government’s fourth failure was to raise tariffs in a misguided attempt to “beggar thy neigh-bor.”[7] Detailed analysis of this failure, which falls outside the bailiwick of finance, we’ll leave to yourinternational economics textbook and a case in Chapter 21. Here, we’ll just paraphrase Mr. Mackeyfrom South Park: “Tariffs are bad, mmmkay?”[8]
But what about Franklin Delano Roosevelt (FDR)[9] and his New Deal?[10] Didn’t the new adminis-tration stop the Great Depression, particularly via deposit insurance, Glass-Steagall, securities marketreforms, and reassuring speeches about having nothing to fear but fear itself?[11] The United States didsuffer its most acute banking crisis in March 1933, just as FDR took office on March 4.[12] (The Twenti-eth Amendment, ratified in 1938, changed the presidential inauguration date to January 20, which it isto this day.) But many suspect that FDR himself brought the crisis on by increasing uncertainty aboutthe new administration’s policy path. Whatever the cause of the crisis, it shattered confidence in thebanking system. FDR’s creation of a deposit insurance scheme under the aegis of a new federal agency, theFederal Deposit Insurance Corporation (FDIC), did restore confidence, inducing people to stop runningon the banks and thereby stopping the economy’s death spiral. Since then, bank runs have been rare oc-currences directed at specific shaky banks and not system-wide disturbances as during the Great De-pression and earlier banking crises.
But as with everything in life, deposit insurance is far from cost-free. In fact, the latest research sug-gests it is a wash. Deposit insurance does prevent bank runs because depositors know the insurancefund will repay them if their bank goes belly up. (Today, it insures $250,000 per depositor per insuredbank. For details, browse http://www.fdic.gov/deposit/deposits/insuringdeposits/index.html.)However, insurance also reduces depositor monitoring, which allows bankers to take on added risk. Inthe nineteenth century, depositors disciplined banks that took on too much risk by withdrawing theirdeposits. As we’ve seen, that decreases the size of the bank and reduces reserves, forcing bankers to de-crease their risk profile. With deposit insurance, depositors (quite rationally) blithely ignore the ad-verse selection problem and shift their funds to wherever they will fetch the most interest. They don’task how Shaky Bank is able to pay 15 percent for six-month certificates of deposit (CDs) when otherbanks pay only 5 percent. Who cares, they reason, my deposits are insured! Indeed, but as we’ll learnbelow, taxpayers insure the insurer.
Another New Deal financial reform, Glass-Steagall, in no way helped the U.S. economy or financialsystem and may have hurt both. As we learned in Chapter 10, for over half a century, Glass-Steagall pre-vented U.S. banks from simultaneously engaging in commercial and investment banking activities.Only two groups clearly gained from the legislation, politicians who could thump their chests on thecampaign stump and claim to have saved the country from greedy financiers and, ironically enough,big investment banks. The latter, it turns out, wrote the act and did so in such a way that it protectedtheir oligopoly from the competition of commercial banks and smaller, more retail-oriented invest-ment banks. The act was clearly unnecessary from an economic standpoint because most countries hadno such legislation and suffered no ill effects because of its absence.
The Security and Exchange Commission’s (SEC) genesis is almost as tawdry and its record almost asbad. The SEC’s stated goal, to increase the transparency of America’s financial markets, was a laudableone. Unfortunately, the SEC simply does not do its job very well. As the late, great, free-market pro-ponent Milton Friedman put it:
“You are not free to raise funds on the capital markets[13] unless you fill out the numerous pages offorms the SEC requires and unless you satisfy the SEC that the prospectus you propose to issuepresents such a bleak picture of your prospects that no investor in his right mind would invest inyour project if he took the prospectus literally.[14] And getting SEC approval may cost upwards of$100,000—which certainly discourages the small firms our government professes to help.”
CHAPTER 11 THE ECONOMICS OF FINANCIAL REGULATION 135
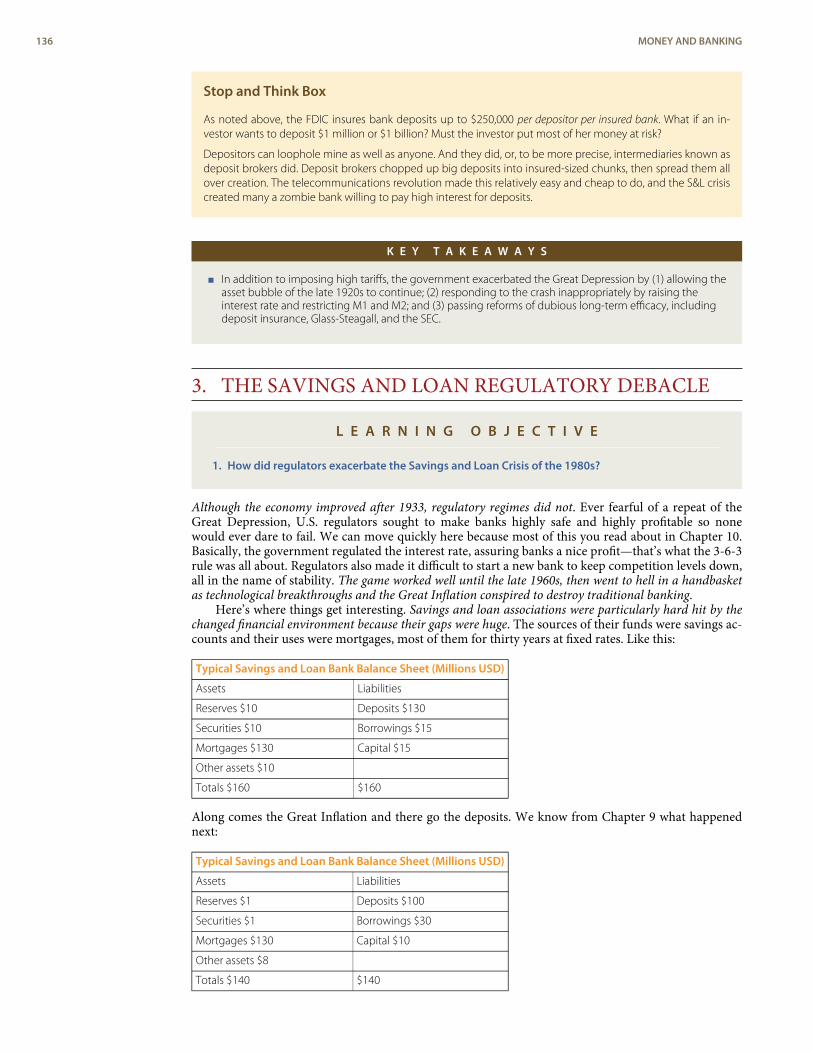
Stop and Think Box
As noted above, the FDIC insures bank deposits up to $250,000 per depositor per insured bank. What if an in-vestor wants to deposit $1 million or $1 billion? Must the investor put most of her money at risk?
Depositors can loophole mine as well as anyone. And they did, or, to be more precise, intermediaries known asdeposit brokers did. Deposit brokers chopped up big deposits into insured-sized chunks, then spread them allover creation. The telecommunications revolution made this relatively easy and cheap to do, and the S&L crisiscreated many a zombie bank willing to pay high interest for deposits.
K E Y T A K E A W A Y S
< In addition to imposing high tariffs, the government exacerbated the Great Depression by (1) allowing theasset bubble of the late 1920s to continue; (2) responding to the crash inappropriately by raising theinterest rate and restricting M1 and M2; and (3) passing reforms of dubious long-term efficacy, includingdeposit insurance, Glass-Steagall, and the SEC.
3. THE SAVINGS AND LOAN REGULATORY DEBACLE
L E A R N I N G O B J E C T I V E
1. How did regulators exacerbate the Savings and Loan Crisis of the 1980s?
Although the economy improved after 1933, regulatory regimes did not. Ever fearful of a repeat of theGreat Depression, U.S. regulators sought to make banks highly safe and highly profitable so nonewould ever dare to fail. We can move quickly here because most of this you read about in Chapter 10.Basically, the government regulated the interest rate, assuring banks a nice profit—that’s what the 3-6-3rule was all about. Regulators also made it difficult to start a new bank to keep competition levels down,all in the name of stability. The game worked well until the late 1960s, then went to hell in a handbasketas technological breakthroughs and the Great Inflation conspired to destroy traditional banking.
Here’s where things get interesting. Savings and loan associations were particularly hard hit by thechanged financial environment because their gaps were huge. The sources of their funds were savings ac-counts and their uses were mortgages, most of them for thirty years at fixed rates. Like this:
Typical Savings and Loan Bank Balance Sheet (Millions USD)
Assets Liabilities
Reserves $10 Deposits $130
Securities $10 Borrowings $15
Mortgages $130 Capital $15
Other assets $10
Totals $160 $160
Along comes the Great Inflation and there go the deposits. We know from Chapter 9 what happenednext:
Typical Savings and Loan Bank Balance Sheet (Millions USD)
Assets Liabilities
Reserves $1 Deposits $100
Securities $1 Borrowings $30
Mortgages $130 Capital $10
Other assets $8
Totals $140 $140
136 MONEY AND BANKING
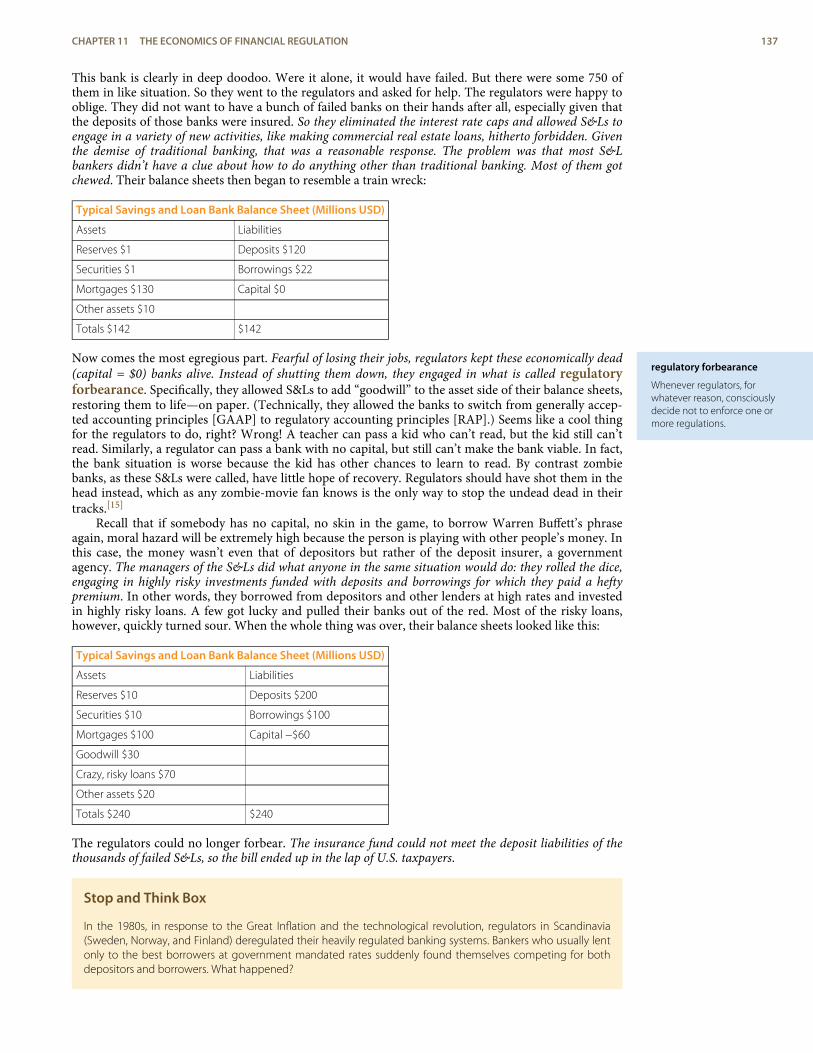
regulatory forbearance
Whenever regulators, forwhatever reason, consciouslydecide not to enforce one ormore regulations.
This bank is clearly in deep doodoo. Were it alone, it would have failed. But there were some 750 ofthem in like situation. So they went to the regulators and asked for help. The regulators were happy tooblige. They did not want to have a bunch of failed banks on their hands after all, especially given thatthe deposits of those banks were insured. So they eliminated the interest rate caps and allowed S&Ls toengage in a variety of new activities, like making commercial real estate loans, hitherto forbidden. Giventhe demise of traditional banking, that was a reasonable response. The problem was that most S&Lbankers didn’t have a clue about how to do anything other than traditional banking. Most of them gotchewed. Their balance sheets then began to resemble a train wreck:
Typical Savings and Loan Bank Balance Sheet (Millions USD)
Assets Liabilities
Reserves $1 Deposits $120
Securities $1 Borrowings $22
Mortgages $130 Capital $0
Other assets $10
Totals $142 $142
Now comes the most egregious part. Fearful of losing their jobs, regulators kept these economically dead(capital = $0) banks alive. Instead of shutting them down, they engaged in what is called regulatoryforbearance. Specifically, they allowed S&Ls to add “goodwill” to the asset side of their balance sheets,restoring them to life—on paper. (Technically, they allowed the banks to switch from generally accep-ted accounting principles [GAAP] to regulatory accounting principles [RAP].) Seems like a cool thingfor the regulators to do, right? Wrong! A teacher can pass a kid who can’t read, but the kid still can’tread. Similarly, a regulator can pass a bank with no capital, but still can’t make the bank viable. In fact,the bank situation is worse because the kid has other chances to learn to read. By contrast zombiebanks, as these S&Ls were called, have little hope of recovery. Regulators should have shot them in thehead instead, which as any zombie-movie fan knows is the only way to stop the undead dead in theirtracks.[15]
Recall that if somebody has no capital, no skin in the game, to borrow Warren Buffett’s phraseagain, moral hazard will be extremely high because the person is playing with other people’s money. Inthis case, the money wasn’t even that of depositors but rather of the deposit insurer, a governmentagency. The managers of the S&Ls did what anyone in the same situation would do: they rolled the dice,engaging in highly risky investments funded with deposits and borrowings for which they paid a heftypremium. In other words, they borrowed from depositors and other lenders at high rates and investedin highly risky loans. A few got lucky and pulled their banks out of the red. Most of the risky loans,however, quickly turned sour. When the whole thing was over, their balance sheets looked like this:
Typical Savings and Loan Bank Balance Sheet (Millions USD)
Assets Liabilities
Reserves $10 Deposits $200
Securities $10 Borrowings $100
Mortgages $100 Capital −$60
Goodwill $30
Crazy, risky loans $70
Other assets $20
Totals $240 $240
The regulators could no longer forbear. The insurance fund could not meet the deposit liabilities of thethousands of failed S&Ls, so the bill ended up in the lap of U.S. taxpayers.
Stop and Think Box
In the 1980s, in response to the Great Inflation and the technological revolution, regulators in Scandinavia(Sweden, Norway, and Finland) deregulated their heavily regulated banking systems. Bankers who usually lentonly to the best borrowers at government mandated rates suddenly found themselves competing for bothdepositors and borrowers. What happened?
CHAPTER 11 THE ECONOMICS OF FINANCIAL REGULATION 137
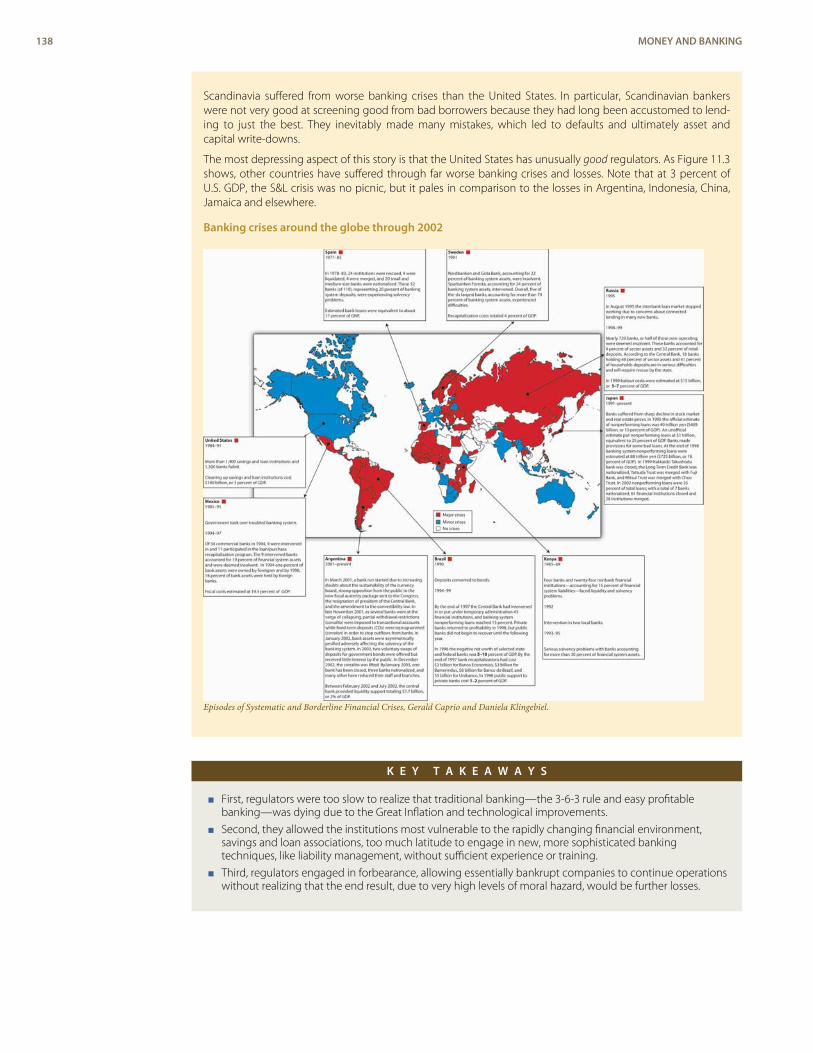
Scandinavia suffered from worse banking crises than the United States. In particular, Scandinavian bankerswere not very good at screening good from bad borrowers because they had long been accustomed to lend-ing to just the best. They inevitably made many mistakes, which led to defaults and ultimately asset andcapital write-downs.
The most depressing aspect of this story is that the United States has unusually good regulators. As Figure 11.3shows, other countries have suffered through far worse banking crises and losses. Note that at 3 percent ofU.S. GDP, the S&L crisis was no picnic, but it pales in comparison to the losses in Argentina, Indonesia, China,Jamaica and elsewhere.
Banking crises around the globe through 2002
Episodes of Systematic and Borderline Financial Crises, Gerald Caprio and Daniela Klingebiel.
K E Y T A K E A W A Y S
< First, regulators were too slow to realize that traditional banking—the 3-6-3 rule and easy profitablebanking—was dying due to the Great Inflation and technological improvements.
< Second, they allowed the institutions most vulnerable to the rapidly changing financial environment,savings and loan associations, too much latitude to engage in new, more sophisticated bankingtechniques, like liability management, without sufficient experience or training.
< Third, regulators engaged in forbearance, allowing essentially bankrupt companies to continue operationswithout realizing that the end result, due to very high levels of moral hazard, would be further losses.
138 MONEY AND BANKING
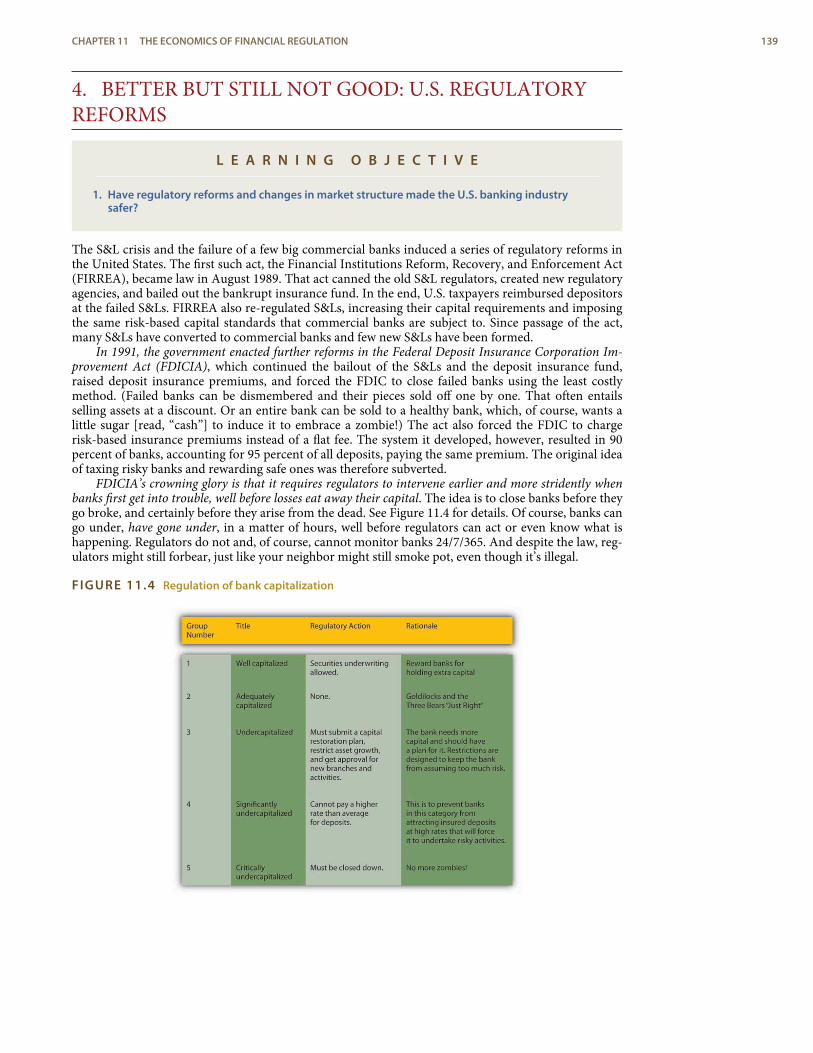
4. BETTER BUT STILL NOT GOOD: U.S. REGULATORYREFORMS
L E A R N I N G O B J E C T I V E
1. Have regulatory reforms and changes in market structure made the U.S. banking industrysafer?
The S&L crisis and the failure of a few big commercial banks induced a series of regulatory reforms inthe United States. The first such act, the Financial Institutions Reform, Recovery, and Enforcement Act(FIRREA), became law in August 1989. That act canned the old S&L regulators, created new regulatoryagencies, and bailed out the bankrupt insurance fund. In the end, U.S. taxpayers reimbursed depositorsat the failed S&Ls. FIRREA also re-regulated S&Ls, increasing their capital requirements and imposingthe same risk-based capital standards that commercial banks are subject to. Since passage of the act,many S&Ls have converted to commercial banks and few new S&Ls have been formed.
In 1991, the government enacted further reforms in the Federal Deposit Insurance Corporation Im-provement Act (FDICIA), which continued the bailout of the S&Ls and the deposit insurance fund,raised deposit insurance premiums, and forced the FDIC to close failed banks using the least costlymethod. (Failed banks can be dismembered and their pieces sold off one by one. That often entailsselling assets at a discount. Or an entire bank can be sold to a healthy bank, which, of course, wants alittle sugar [read, “cash”] to induce it to embrace a zombie!) The act also forced the FDIC to chargerisk-based insurance premiums instead of a flat fee. The system it developed, however, resulted in 90percent of banks, accounting for 95 percent of all deposits, paying the same premium. The original ideaof taxing risky banks and rewarding safe ones was therefore subverted.
FDICIA’s crowning glory is that it requires regulators to intervene earlier and more stridently whenbanks first get into trouble, well before losses eat away their capital. The idea is to close banks before theygo broke, and certainly before they arise from the dead. See Figure 11.4 for details. Of course, banks cango under, have gone under, in a matter of hours, well before regulators can act or even know what ishappening. Regulators do not and, of course, cannot monitor banks 24/7/365. And despite the law, reg-ulators might still forbear, just like your neighbor might still smoke pot, even though it’s illegal.
FIGURE 11.4 Regulation of bank capitalization
CHAPTER 11 THE ECONOMICS OF FINANCIAL REGULATION 139
too-big-to-fail (TBTF) policy
The explicit or implicitpromise of regulators thatthey will not allow a givenfinancial institution to failbecause to do so wouldcause too large of a shock forthe financial system tohandle. While that soundsreassuring and noble, thepolicy increases moral hazard,encouraging large financialinstitutions to take on largerisks.
The other problem with FDICIA is that it weakened but ultimately maintained the too-big-to-fail(TBTF) policy. Regulators cooked up TBTF during the 1980s to justify bailing out a big shaky bankcalled Continental Illinois. Like deposit insurance, TBTF was ostensibly a noble notion. If a really bigbank failed and owed large sums to lots of other banks and nonbank financial institutions, it couldcause a domino effect that could topple numerous companies very quickly. That, in turn, would causeuncertainty to rise, stock prices to fall . . . you get the picture. The problem is that if a bank thinks it istoo big to fail, it has an incentive to take on a lot of risk, confident that the government will have its backif it gets into trouble. (Banks in this respect are little different from drunken frat boys, or so I’ve heard.)Financier Henry Kaufman has termed this problem the Bigness Dilemma[16] and long feared that itcould lead to a catastrophic economic meltdown, a political crisis, or a major economic slump. Hisfears came to fruition during the financial crisis of 2007–2008, of which we will learn more in Chapter12. Similarly some analysts believe that Japan’s TBTF policy was a leading cause of its recent fifteen-year economic funk.
In 1994, the Riegle-Neal Interstate Banking and Branching Efficiency Act finally overturned mostprohibitions on interstate banking. As discussed in Chapter 10, that law led to considerable consolida-tion, the effects of which are still unclear. Nevertheless, the act was long overdue, as was the Gramm-Leach-Bliley Financial Services Modernization Act of 1999, which repealed Glass-Steagall, allowing thesame institutions to engage in both commercial and investment banking activities. The act has led tosome conglomeration, but not as much as many observers expected. Again, it may be some time beforethe overall effects of the reform become clear. So far, both acts appear to have strengthened the finan-cial system by making banks more profitable and diversified. So far, some large complex banking or-ganizations and large complex financial institutions (LCBOs and LCFIs, respectively) have held up wellin the face of the subprime mortgage crisis, but others have failed. The crisis appears rooted in morefundamental issues, like TBTF and a dearth of internal incentive alignment within financial institu-tions, big and small.
K E Y T A K E A W A Y S
< To some extent, it is too early to tell what the effects of financial consolidation, concentration, andconglomeration will be.
< Overall, it appears that recent U.S. financial reforms range from salutary (repeal of branching restrictionsand Glass-Steagall) to destabilizing (retention of the too-big-to-fail policy).
5. BASEL II’S THIRD PILLAR
L E A R N I N G O B J E C T I V E
1. Will Basel II render the banking industry safe? If not, what might?
Due to the prevalence of banking crises worldwide and the financial system’s increasingly global andintegrated nature, international regulators, especially the Bank for International Settlements in Basel,Switzerland, have also been busy. Their recommendations are not binding on sovereign nations, but todate they have obtained significant buy-in worldwide. America’s financial reforms in the 1990s, for ex-ample, were influenced by the so-called Basel I recommendations of 1988. Almost all countries havecomplied, on paper anyway, with Basel I rules on minimum and risk-weighted capitalization. Risk-weighting was indeed an improvement over the older capitalization requirements, which were simply aminimum leverage ratio:
Capitalassets
So the leverage ratio of the following bank would be 6 percent (6/100 = .06, or 6%), which in the pastwas generally considered adequate.
140 MONEY AND BANKING
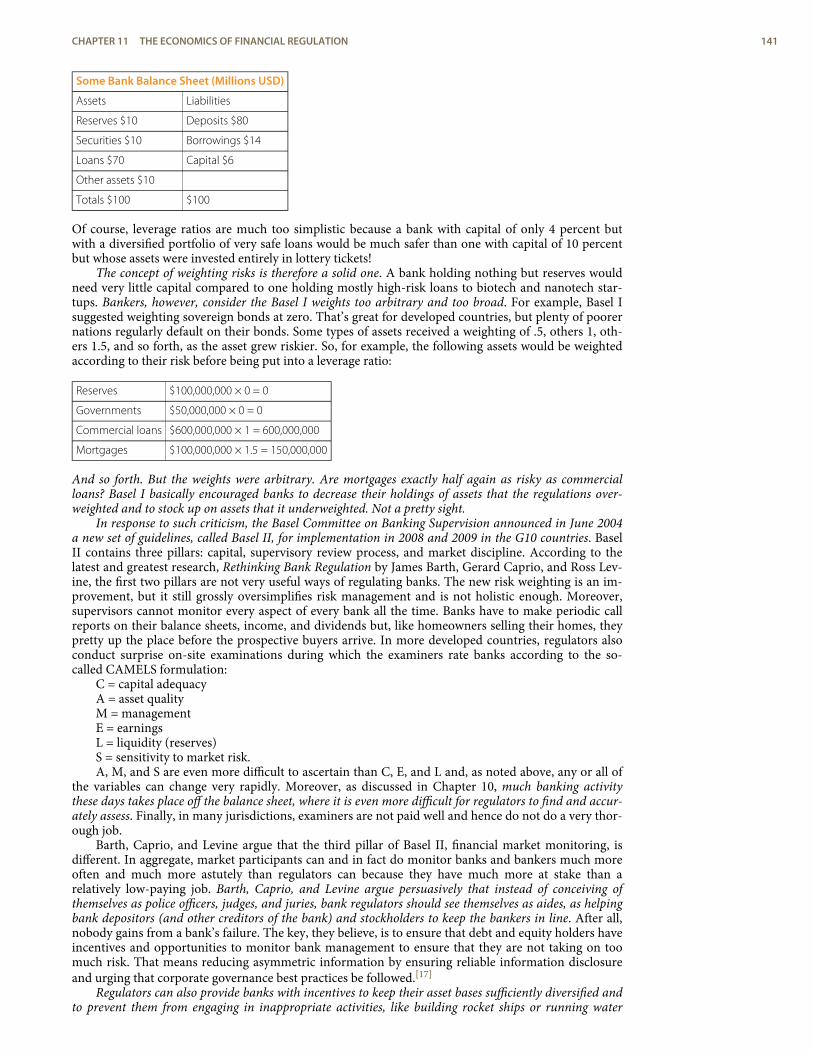
Some Bank Balance Sheet (Millions USD)
Assets Liabilities
Reserves $10 Deposits $80
Securities $10 Borrowings $14
Loans $70 Capital $6
Other assets $10
Totals $100 $100
Of course, leverage ratios are much too simplistic because a bank with capital of only 4 percent butwith a diversified portfolio of very safe loans would be much safer than one with capital of 10 percentbut whose assets were invested entirely in lottery tickets!
The concept of weighting risks is therefore a solid one. A bank holding nothing but reserves wouldneed very little capital compared to one holding mostly high-risk loans to biotech and nanotech star-tups. Bankers, however, consider the Basel I weights too arbitrary and too broad. For example, Basel Isuggested weighting sovereign bonds at zero. That’s great for developed countries, but plenty of poorernations regularly default on their bonds. Some types of assets received a weighting of .5, others 1, oth-ers 1.5, and so forth, as the asset grew riskier. So, for example, the following assets would be weightedaccording to their risk before being put into a leverage ratio:
Reserves $100,000,000 × 0 = 0
Governments $50,000,000 × 0 = 0
Commercial loans $600,000,000 × 1 = 600,000,000
Mortgages $100,000,000 × 1.5 = 150,000,000
And so forth. But the weights were arbitrary. Are mortgages exactly half again as risky as commercialloans? Basel I basically encouraged banks to decrease their holdings of assets that the regulations over-weighted and to stock up on assets that it underweighted. Not a pretty sight.
In response to such criticism, the Basel Committee on Banking Supervision announced in June 2004a new set of guidelines, called Basel II, for implementation in 2008 and 2009 in the G10 countries. BaselII contains three pillars: capital, supervisory review process, and market discipline. According to thelatest and greatest research, Rethinking Bank Regulation by James Barth, Gerard Caprio, and Ross Lev-ine, the first two pillars are not very useful ways of regulating banks. The new risk weighting is an im-provement, but it still grossly oversimplifies risk management and is not holistic enough. Moreover,supervisors cannot monitor every aspect of every bank all the time. Banks have to make periodic callreports on their balance sheets, income, and dividends but, like homeowners selling their homes, theypretty up the place before the prospective buyers arrive. In more developed countries, regulators alsoconduct surprise on-site examinations during which the examiners rate banks according to the so-called CAMELS formulation:
C = capital adequacyA = asset qualityM = managementE = earningsL = liquidity (reserves)S = sensitivity to market risk.A, M, and S are even more difficult to ascertain than C, E, and L and, as noted above, any or all of
the variables can change very rapidly. Moreover, as discussed in Chapter 10, much banking activitythese days takes place off the balance sheet, where it is even more difficult for regulators to find and accur-ately assess. Finally, in many jurisdictions, examiners are not paid well and hence do not do a very thor-ough job.
Barth, Caprio, and Levine argue that the third pillar of Basel II, financial market monitoring, isdifferent. In aggregate, market participants can and in fact do monitor banks and bankers much moreoften and much more astutely than regulators can because they have much more at stake than arelatively low-paying job. Barth, Caprio, and Levine argue persuasively that instead of conceiving ofthemselves as police officers, judges, and juries, bank regulators should see themselves as aides, as helpingbank depositors (and other creditors of the bank) and stockholders to keep the bankers in line. After all,nobody gains from a bank’s failure. The key, they believe, is to ensure that debt and equity holders haveincentives and opportunities to monitor bank management to ensure that they are not taking on toomuch risk. That means reducing asymmetric information by ensuring reliable information disclosureand urging that corporate governance best practices be followed.[17]
Regulators can also provide banks with incentives to keep their asset bases sufficiently diversified andto prevent them from engaging in inappropriate activities, like building rocket ships or running water
CHAPTER 11 THE ECONOMICS OF FINANCIAL REGULATION 141
treatment plants. Screening new banks and bankers, if regulators do it to reduce adverse selection (omitshysters or inexperienced people) rather than to aid existing banks (by blocking all or most newentrants and hence limiting competition) or to line their own pockets (via bribes), is another areawhere regulators can be effective. By focusing on a few key reachable goals, regulators can concentratetheir limited resources and get the job done, the job of letting people look after their own propertythemselves. The market-based approach, scholars note, is most important in less-developed countrieswhere regulators are more likely to be on the take (to enact and enforce regulations simply to augmenttheir incomes via bribes).
K E Y T A K E A W A Y S
< Basel I and II have provided regulators with more sophisticated ways of analyzing the adequacy of bankcapital.
< Nevertheless, it appears that regulators lag behind banks and their bankers, in part because of agencyproblems within regulatory bureaucracies and in part because of the gulf of asymmetric informationseparating banks and regulators, particularly when it comes to the quality of assets and the extent and riskof off-balance-sheet activities.
< If scholars like Barth, Caprio, and Levine are correct, regulators ought to think of ways of helping financialmarkets, particularly bank debt and equity holders, to monitor banks.
< They should also improve their screening of new bank applicants without unduly restricting entry, and setand enforce broad guidelines for portfolio diversification and admissible activities.
6. SUGGESTED READINGArner, Douglas. Financial Stability, Economic Growth, and the Role of Law. New York: Cambridge
University Press, 2007.Barth, James, Gerard Caprio, and Ross Levine. Rethinking Bank Regulation. New York: Cambridge
University Press, 2006.Barth, James, S. Trimbath, and Glenn Yago. The Savings and Loan Crisis: Lessons from a Regulat-
ory Failure. New York: Springer, 2004.Benston, George. Regulating Financial Markets: A Critique and Some Proposals. Washington, DC:
AEI Press, 1999.Bernanke, Ben S. Essays on the Great Depression. Princeton, NJ: Princeton University Press, 2000.Gup, Benton. Too Big to Fail: Policies and Practices in Government Bailouts. Westport, CT: Prae-
ger, 2004.Stern, Gary, and Ron Feldman. Too Big to Fail: The Hazards of Bank Bailouts. Washington, DC:
Brookings Institution Press, 2004.Tullick, Gordon, Arthur Seldon, and Gordon Brady. Government Failure: A Primer in Public
Choice. Washington, DC: Cato Institute, 2002.Winston, Clifford. Government Failure Versus Market Failure: Microeconomics Policy Research and
Government Performance. Washington, DC: AEI-Brookings Joint Center for Regulatory Studies, 2006.
142 MONEY AND BANKING
1.2.3.4.5.6.7.8.9.
10.
11.12.13.
14.
15.
16.
17.
ENDNOTES
http://showcase.netins.net/web/creative/lincoln/speeches/gettysburg.htm
http://www.econlib.org/LIBRARY/Enc/bios/Stigler.html
http://en.wikipedia.org/wiki/Regulatory_capture
http://www.investorwords.com/2580/in_the_money.html
http://www.bos.frb.org/about/pubs/panicof1.pdf
http://www.measuringworth.org/DJA/
http://www.state.gov/r/pa/ho/time/id/17606.htm
http://www-atdp.berkeley.edu/Studentpages/nselby/MrMackey.html
http://www.whitehouse.gov/history/presidents/fr32.html
http://newdeal.feri.org/
http://www.brainyquote.com/quotes/quotes/f/franklind100872.html
http://www.bartleby.com/124/pres49.html
This part is inaccurate. Just as we would expect from the discussion in Chapter 10,financiers went loophole mining and found a real doozy called a private placement.As opposed to a public offering, in a private placement, securities issuers can avoidSEC disclosure requirements by selling directly to institutional investors like life insur-ance companies and other “accredited investors” (legalese for “rich people”).
This part is all too true. Check out the prospectus of Internet giant Google athttp://www.sec.gov/Archives/edgar/data/1288776/000119312504142742/ds1a.htm.If you don’t dig Google, check out any company you like via Edgar, the SEC’s filingdatabase, at http://www.sec.gov/edgar.shtml.
http://www.margrabe.com/Devil/DevilU_Z.html;http://ericlathrop.com/notld/
The dilemma is that big banks in other regards are stabilizing rather than destabiliz-ing because they have clearly achieved efficient scale and maintain a diversifiedportfolio of assets.
http://www.heidrick.com/NR/rdonlyres/1E2D60F0-14B3-47AC-8AC6-227F2850095C/0/TCB_BestPracticesPostEnron.pdf
CHAPTER 11 THE ECONOMICS OF FINANCIAL REGULATION 143

144 MONEY AND BANKING
financial crisis
The functioning of one ormore financial markets orintermediaries becomeserratic or ceases altogether.
nonsystemic crisis
A particular market orintermediary functionserratically or inefficiently.
systemic crisis
The functioning of all, ornearly all, of the financialsystem degrades.
C H A P T E R 1 2The Financial Crisis of2007–2008
C H A P T E R O B J E C T I V E S
By the end of this chapter, students should be able to:
1. Define financial crisis and differentiate between systemic and nonsystemic crises.
2. Describe a generic asset bubble.
3. Define leverage and explain its role in asset bubble formation.
4. Explain why bubbles burst, causing financial panics.
5. Define and explain the importance of lender of last resort.
6. Define and explain the importance of bailouts.
7. Narrate the causes and consequences of the financial crisis that began in 2007.
1. FINANCIAL CRISES
L E A R N I N G O B J E C T I V E
1. What is a financial crisis?
A financial crisis occurs when one or more financial markets or intermediaries cease functioning orfunction only erratically and inefficiently. A nonsystemic crisis involves only one or a few markets orsectors, like the Savings and Loan Crisis described in Chapter 11. A systemic crisis involves all, or al-most all, of the financial system to some extent, as during the Great Depression.
Financial crises are neither new nor unusual. Thousands of crises, including the infamous TulipMania and South Sea Company episodes, have rocked financial systems throughout the world in thepast five hundred years. Two such crises, in 1764–1768 and 1773, helped lead to the American Revolu-tion.[1] After its independence, the United States suffered systemic crises in 1792, 1818–1819,1837–1839, 1857, 1873, 1884, 1893–1895, 1907, 1929–1933, and 2008. Nonsystemic crises have beeneven more numerous and include the credit crunch of 1966, stock market crashes in 1973–1974 (whenthe Dow dropped from a 1,039 close on January 12, 1973, to a 788 close on December 5, 1973, to a 578close on December 6, 1974) and 1987, the failure of Long-Term Capital Management in 1998, the dot-com troubles of 2000, the dramatic events following the terrorist attacks in 2001, and the subprimemortgage debacle of 2007. Sometimes, nonsystemic crises burn out or are brought under control beforethey spread to other parts of the financial system. Other times, as in 1929 and 2007, nonsystemic crisesspread like a wildfire until they threaten to burn the entire system.
Stop and Think Box
“While we ridicule ancient superstition we have an implicit faith in the bubbles of banking, and yet it is difficultto discover a greater absurdity, in ascribing omnipotence to bulls, cats and onions, than for a man to carryabout a thousand acres of land . . . in his pocket book. . . . This gross bubble is practiced every day, even uponthe infidelity of avarice itself. . . . So we see wise and honest Americans, of the nineteenth century, embracingphantoms for realities, and running mad in schemes of refinement, tastes, pleasures, wealth and power, by thesoul [sic] aid of this hocus pocus.”—Cause of, and Cure for, Hard Times.[2] When were these words penned? Howdo you know?
asset bubble
In this context, a rapidincrease in asset prices that isnot easily justified byfundamentals like expectedearnings, interest rates, andthe like.
This was undoubtedly penned during one of the nineteenth century U.S. financial crises mentioned above.Note the negative tone, the allusion to Americans, and the reference to the nineteenth century. In fact, thepamphlet appeared in 1818. For a kick, compare/contrast it to blogs bemoaning the crisis that began in 2007:
http://cartledged.blogspot.com/2007/09/greedy-bastards-club.html
http://www.washingtonmonthly.com/archives/individual/2008_03/013339.php
http://thedefenestrators.blogspot.com/2008/10/death-to-bankers.html
Both systemic and nonsystemic crises damage the real economy by preventing the normal flow of credit from saversto entrepreneurs and other businesses and by making it more difficult or expensive to spread risks. Given the dam-age financial crises can cause, scholars and policymakers are keenly interested in their causes and con-sequences. You should be, too.
K E Y T A K E A W A Y S
< Throughout history, systemic (widespread) and nonsystemic (confined to a few industries) financial criseshave damaged the real economy by disrupting the normal flow of credit and insurance.
< Understanding the causes and consequences of financial crises is therefore important.
2. ASSET BUBBLES
L E A R N I N G O B J E C T I V E
1. What are asset bubbles and what role does leverage play in their creation?
Asset bubbles are rapid increases in the value of some asset, like bonds, commodities (cotton, gold, oil,tulips), equities, or real estate. Some combination of low interest rates, new technology, unprecedentedincreases in demand for the asset, and leverage typically create bubbles.
Low interest rates can cause bubbles by lowering the total cost of asset ownership. Recall fromChapter 4 that interest rates and bond prices are inversely related. Algebraically, the i term is in the de-nominator of the PV formula—PV = FV/(1 + i)n—so as it gets smaller, PV must get larger (holding FVconstant, of course).
Stop and Think Box
In colonial New York in the 1740s and 1750s, interest rates on mortgages were generally 8 percent. In the late1750s and early 1760s, they fell to about 4 percent, and expected revenues from land ownership increased byabout 50 percent. What happened to real estate prices? Why?
They rose significantly because it was cheaper to borrow money, thus lowering the total cost of real estateownership, and because the land was expected to create higher revenues. Thinking of the land as a perpetuityand FV as the expected revenues arising from it:
PV = FV / i
PV = £100 / .08 = £1,250
PV = £100 / .04 = £2,500
And that is just the real estate effect. Increasing FV by £50 leads to the following:
PV = £150 / .04 = £3,750, or a tripling of prices.
In 1762, Benjamin Franklin reported that the “Rent of old Houses, and Value of Lands, . . . are trebledin the last Six Years.”[3]
146 MONEY AND BANKING
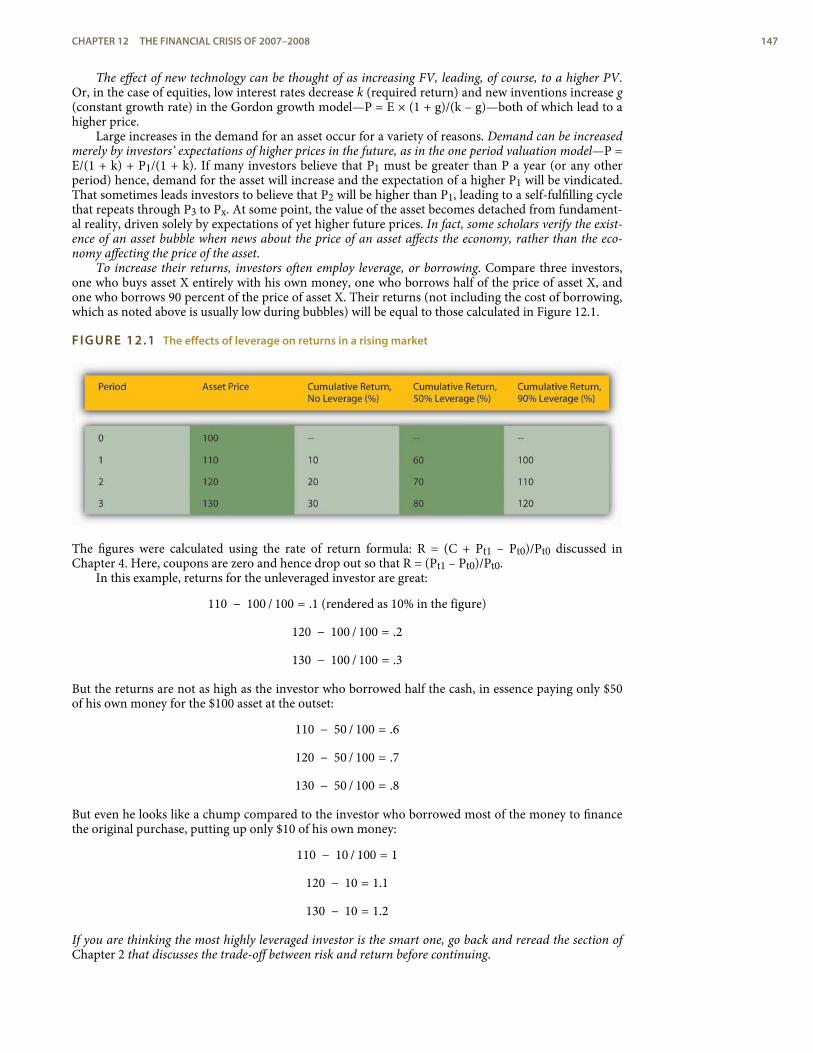
The effect of new technology can be thought of as increasing FV, leading, of course, to a higher PV.Or, in the case of equities, low interest rates decrease k (required return) and new inventions increase g(constant growth rate) in the Gordon growth model—P = E × (1 + g)/(k – g)—both of which lead to ahigher price.
Large increases in the demand for an asset occur for a variety of reasons. Demand can be increasedmerely by investors’ expectations of higher prices in the future, as in the one period valuation model—P =E/(1 + k) + P1/(1 + k). If many investors believe that P1 must be greater than P a year (or any otherperiod) hence, demand for the asset will increase and the expectation of a higher P1 will be vindicated.That sometimes leads investors to believe that P2 will be higher than P1, leading to a self-fulfilling cyclethat repeats through P3 to Px. At some point, the value of the asset becomes detached from fundament-al reality, driven solely by expectations of yet higher future prices. In fact, some scholars verify the exist-ence of an asset bubble when news about the price of an asset affects the economy, rather than the eco-nomy affecting the price of the asset.
To increase their returns, investors often employ leverage, or borrowing. Compare three investors,one who buys asset X entirely with his own money, one who borrows half of the price of asset X, andone who borrows 90 percent of the price of asset X. Their returns (not including the cost of borrowing,which as noted above is usually low during bubbles) will be equal to those calculated in Figure 12.1.
FIGURE 12.1 The effects of leverage on returns in a rising market
The figures were calculated using the rate of return formula: R = (C + Pt1 – Pt0)/Pt0 discussed inChapter 4. Here, coupons are zero and hence drop out so that R = (Pt1 – Pt0)/Pt0.
In this example, returns for the unleveraged investor are great:
110 − 100 / 100 = .1 (rendered as 10% in the figure)
120 − 100 / 100 = .2
130 − 100 / 100 = .3
But the returns are not as high as the investor who borrowed half the cash, in essence paying only $50of his own money for the $100 asset at the outset:
110 − 50 / 100 = .6
120 − 50 / 100 = .7
130 − 50 / 100 = .8
But even he looks like a chump compared to the investor who borrowed most of the money to financethe original purchase, putting up only $10 of his own money:
110 − 10 / 100 = 1
120 − 10 = 1.1
130 − 10 = 1.2
If you are thinking the most highly leveraged investor is the smart one, go back and reread the section ofChapter 2 that discusses the trade-off between risk and return before continuing.
CHAPTER 12 THE FINANCIAL CRISIS OF 2007–2008 147
financial panic
Panicked selling occursduring the rapidde-leveraging of the financialsystem following the burstingof an asset bubble.
call
A lender asks a borrower torepay, usually becauseinterest rates have increasedand/or the value of collateralhas declined.
burst
When an asset bubble rapidlydeflates, i.e., the price of theasset rapidly decreases.
de-leveraging
Lenders force borrowers toinvest more of their ownequity in assets.
credit crunch
The volume of loansdecreases dramatically,usually in response to thebursting of an asset bubbleduring a financial crisis.
negative bubble
A bubble characterized byprices that are far below theirrational value.
K E Y T A K E A W A Y S
< Asset bubbles occur when the prices of some asset, like stocks or real estate, increase rapidly due to somecombination of low interest rates, high leverage, new technology, and large, often self-fulfilling shifts indemand.
< The expectation of higher prices in the future, combined with high levels of borrowing, allow asset pricesto detach from their underlying economic fundamentals.
3. FINANCIAL PANICS
L E A R N I N G O B J E C T I V E
1. What are financial panics and what causes them?
A financial panic occurs when leveraged financial intermediaries and other investors must sell assetsquickly in order to meet lenders’ calls. Lenders call loans, or ask for repayment, when interest rates in-crease and/or when the value of collateral pledged to repay the loan sinks below the amount the bor-rower owes. Calls are a normal part of everyday business, but during a panic, they all come en massedue to some shock, often the bursting of an asset bubble. Bubbles, like people, are bound to die butnobody knows in advance when they will do so. A burst is sometimes triggered by an obvious shock,like a natural catastrophe or the failure of an important company, but sometimes something as seem-ingly innocuous as a large sell order can touch them off.
During a panic, almost everybody must sell and few can or want to buy, so prices plummet, trig-gering additional calls, and yet more selling. Invariably, some investors, usually the most highly lever-aged ones, cannot sell assets quickly enough, or for a high enough price, to “meet the call” and repaytheir loans. Banks and other lenders begin to suffer defaults. Their lenders (other banks, depositors,holders of commercial paper), in turn, begin to wonder if they are still credit-worthy. Asymmetric in-formation and uncertainty, as described in Chapter 11, reign supreme, inducing lenders to restrictcredit. At some point, investors’ emotions take over, and they literally go into a panic, one that makesTony Soprano’s panic attacks seem like a stroll in the park.[4]
Panics often cause the rapid de-leveraging of the financial system, a period when interest rates forriskier types of loans and securities increase and/or when a credit crunch, or a large decrease in thevolume of lending, takes place. Such conditions often usher in a negative bubble, a period when highinterest rates, tight credit, and expectations of lower asset prices in the future cause asset values to trenddownward, sometimes well below the values indicated by underlying economic fundamentals. Duringde-leveraging, the forces that drove asset prices up now conspire to drag them lower.
Stop and Think Box
In New York in 1764, interest rates spiked from 6 to 12 percent and expected revenues from land plummetedby about 25 percent. What happened to real estate prices and why?
They dropped significantly because it was more expensive to borrow money, thus increasing the total cost ofreal estate ownership, and because the land was expected to yield lower revenues. Thinking of the land as aperpetuity and FV as the expected revenues arising from it:
PV = FV / i
PV = £100 / .06 = £1,666.66
PV = £100 / .12 = £833.33
And that is just the real estate effect. Decreasing FV by £25 leads to the following:
PV = £75 / .12 = £625, or a decrease of about two-thirds.
148 MONEY AND BANKING
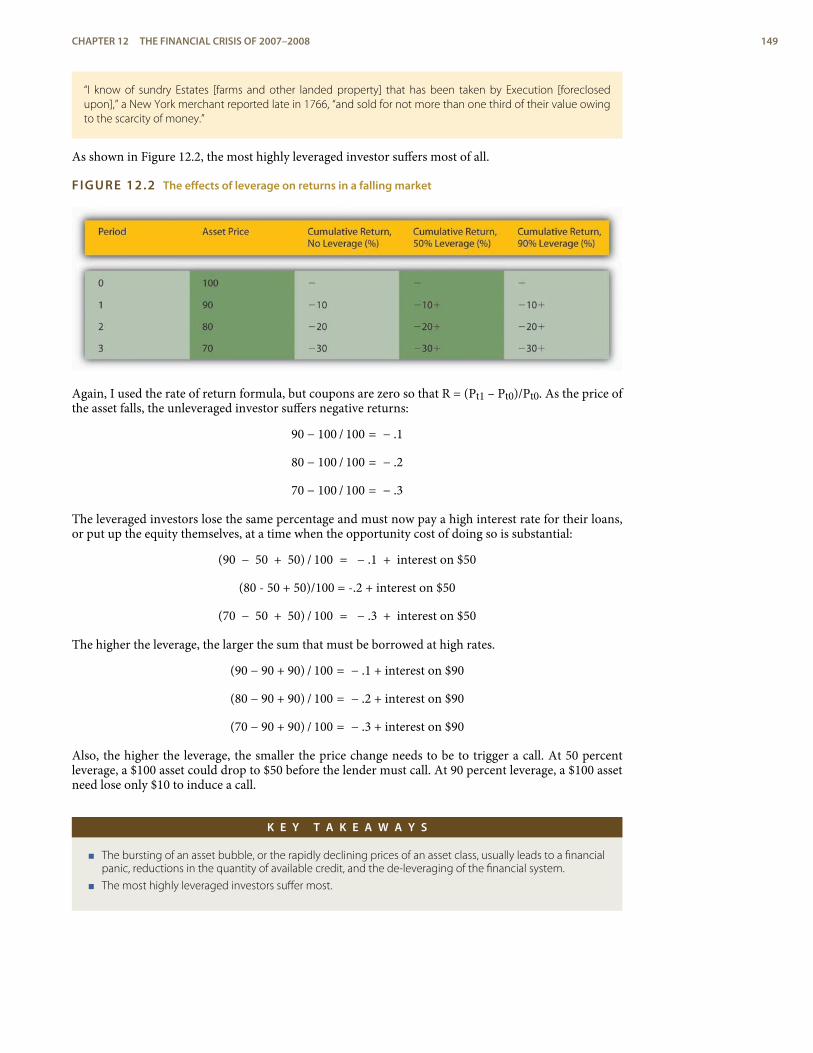
“I know of sundry Estates [farms and other landed property] that has been taken by Execution [foreclosedupon],” a New York merchant reported late in 1766, “and sold for not more than one third of their value owingto the scarcity of money.”
As shown in Figure 12.2, the most highly leveraged investor suffers most of all.
FIGURE 12.2 The effects of leverage on returns in a falling market
Again, I used the rate of return formula, but coupons are zero so that R = (Pt1 – Pt0)/Pt0. As the price ofthe asset falls, the unleveraged investor suffers negative returns:
90 − 100 / 100 = − .1
80 − 100 / 100 = − .2
70 − 100 / 100 = − .3
The leveraged investors lose the same percentage and must now pay a high interest rate for their loans,or put up the equity themselves, at a time when the opportunity cost of doing so is substantial:
(90 − 50 + 50) / 100 = − .1 + interest on $50
(80 - 50 + 50)/100 = -.2 + interest on $50
(70 − 50 + 50) / 100 = − .3 + interest on $50
The higher the leverage, the larger the sum that must be borrowed at high rates.
(90 − 90 + 90) / 100 = − .1 + interest on $90
(80 − 90 + 90) / 100 = − .2 + interest on $90
(70 − 90 + 90) / 100 = − .3 + interest on $90
Also, the higher the leverage, the smaller the price change needs to be to trigger a call. At 50 percentleverage, a $100 asset could drop to $50 before the lender must call. At 90 percent leverage, a $100 assetneed lose only $10 to induce a call.
K E Y T A K E A W A Y S
< The bursting of an asset bubble, or the rapidly declining prices of an asset class, usually leads to a financialpanic, reductions in the quantity of available credit, and the de-leveraging of the financial system.
< The most highly leveraged investors suffer most.
CHAPTER 12 THE FINANCIAL CRISIS OF 2007–2008 149
4. LENDER OF LAST RESORT
L E A R N I N G O B J E C T I V E
1. What is a lender of last resort and what does it do?
As noted above, financial panics and the de-leveraging that often occur after them can wreak havoc onthe real economy by decreasing the volume of loans, insurance contracts, and other beneficial financialproducts. That, in turn, can cause firms to reduce output and employment. Lenders of last resort try tostop panics and de-leveraging by adding liquidity to the financial system and/or attempting to restore in-vestor confidence. They add liquidity by increasing the money supply, reducing interest rates, and mak-ing loans to worthy borrowers who find themselves shut off from their normal sources of external fin-ance. They try to restore investor confidence by making upbeat statements about the overall health ofthe economy and/or financial system and by implementing policies that investors are likely to find be-neficial. During the darkest days of 1933, for example, the U.S. federal government restored confidencein the banking system through strong executive leadership and by creating the Federal Deposit Insur-ance Corporation.
Stop and Think Box
In a single day, October 19, 1987, the S&P fell by 20 percent. What caused such a rapid decline? Why did thepanic not result in de-leveraging or recession?
According to a short history of the event by Mark Carlson (“A Brief History of the 1987 Stock Market Crash witha Discussion of the Federal Reserve Response”),[5] “During the years prior to the crash, equity markets had beenposting strong gains. . . . There had been an influx of new investors. . . . Equities were also boosted by some fa-vorable tax treatments given to the financing of corporate buyouts. . . . The macroeconomic outlook duringthe months leading up to the crash had become somewhat less certain. . . . Interest rates were rising globally. .. . A growing U.S. trade deficit and decline in the value of the dollar were leading to concerns about inflationand the need for higher interest rates in the U.S. as well.” On the day of the crash, investors learned that deficitswere higher than expected and that the favorable tax rules might change. As prices dropped, “record margincalls” were made, fueling further selling. The panic did not proceed further because Federal Reserve ChairmanAlan Greenspan restored confidence in the stock market by promising to make large loans to banks exposedto brokers hurt by the steep decline in stock prices. Specifically, the Fed made it known that “The FederalReserve, consistent with its responsibilities as the Nation’s central bank, affirmed today its readiness to serve asa source of liquidity to support the economic and financial system.”
The most common form of lender of last resort today is the government central bank, like the EuropeanCentral Bank (ECB) or the Federal Reserve. The International Monetary Fund (IMF) sometimes tries toact as a sort of international lender of last resort, but it has been largely unsuccessful in that role. In thepast, wealthy individuals like J. P. Morgan and private entities like bank clearinghouses tried to act aslenders of last resort, with mixed success. Most individuals did not have enough wealth or influence tothwart a panic, and bank clearinghouses were at most regional in nature.
K E Y T A K E A W A Y
< A lender of last resort is an individual, a private institution, or, more commonly, a government central bankthat attempts to stop a financial panic and/or postpanic de-leveraging by increasing the money supply,decreasing interest rates, making loans, and/or restoring investor confidence.
150 MONEY AND BANKING
bailout
When taxpayer money isused to restore lossessuffered by economic agents.
negative equity
The market price of an assetis less than the sumborrowed to acquire it. Alsoknown as being “in thebucket” or “under water.”
5. BAILOUTS
L E A R N I N G O B J E C T I V E
1. What is a bailout and how does it differ from the actions of a lender of last resort?
As noted above, lenders of last resort provide liquidity, loans, and confidence. They make loans tosolvent institutions facing temporary solvency problems due to the crisis, not inevitable bankruptcy.[6]
Bailouts, by contrast, restore the losses suffered by one or more economic agents, usually with taxpayermoney. The restoration can come in the form of outright grants or the purchase of equity but oftentakes the form of subsidized or government-guaranteed loans. Unsurprisingly, bailouts are often polit-ically controversial because they can appear to be unfair and because they increase moral hazard, orrisk-taking on the part of entities that expect to be bailed out if they encounter difficulties. Nevertheless,if the lender of last resort cannot stop the formation of a negative bubble or massive de-leveraging, bail-outs can be an effective way of mitigating further declines in economic activity.
During the Great Depression, for example, the federal government used $500 million of taxpayermoney to capitalize the Reconstruction Finance Corporation (RFC). In its initial phase, the RFC madesome $2 billion in low-interest loans to troubled banks, railroads, and other businesses. Though at firstdeprecated as welfare for the rich, the RFC, most observers now concede, helped the economy to recoverby keeping important companies afloat. Also during the depression, the Home Owners Loan Corpora-tion (HOLC), seeded with $200 million of taxpayer dollars, bailed out homeowners, many of whomhad negative equity in their homes, by refinancing mortgages on terms favorable to the borrowers.Similarly, in the aftermath of the Savings and Loan Crisis, the Resolution Trust Corporation (RTC)closed 747 thrifts with total assets of almost $400 billion. Both HOLC and RTC made the best of badsituations. HOLC made a small accounting profit, and the RTC cost taxpayers a mere $125 billionwhile staving off a more severe systemic crisis.
Stop and Think Box
The 1979 bailout of automaker Chrysler, which entailed a government guarantee of its debt, saved thetroubled corporation from bankruptcy. It quickly paid off its debt, and the U.S. Treasury, and hence taxpayers,were actually the richer for it. Was this bailout successful?
At the time, many observers thought so. Chrysler creditors, who received 30 cents for every dollar the troubledautomaker owed them, did not think so, however, arguing that they had been fleeced to protect Chryslerstockholders. Workers who lost their jobs or were forced to accept reductions in pay and benefits were alsoskeptical. Now that Chrysler and the other U.S. carmakers are again in serious financial trouble, some scholarsare suggesting that the bailout was a disaster in the long term because it fooled Detroit execs into thinkingthey could continue business as usual. In retrospect, it may have been better to allow Chrysler to fail and anew, leaner, meaner company to emerge like a Phoenix from its ashes.
K E Y T A K E A W A Y S
< Bailouts usually occur after the actions of a lender of last resort, such as a central bank, have proveninadequate to stop negative effects on the real economy.
< They usually entail restoring losses to one or more economic agents.
< Although politically controversial, bailouts can stop negative bubbles from leading to excessive de-leveraging, debt deflation, and economic depression.
CHAPTER 12 THE FINANCIAL CRISIS OF 2007–2008 151
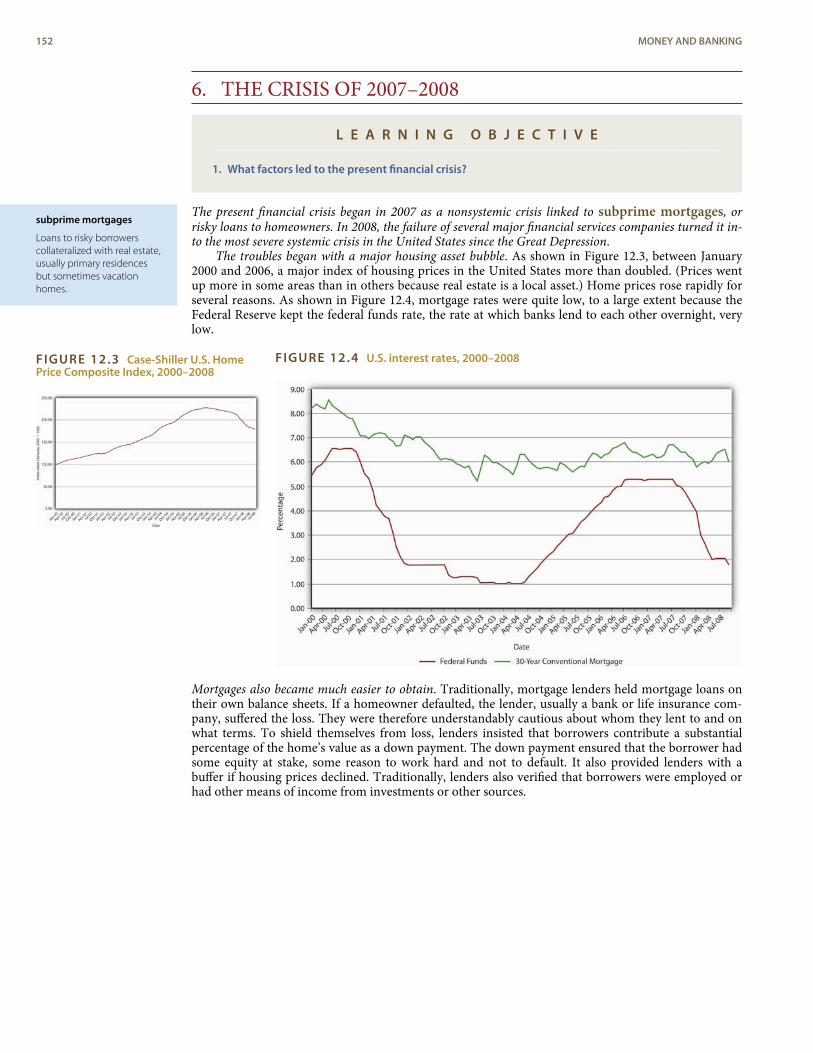
subprime mortgages
Loans to risky borrowerscollateralized with real estate,usually primary residencesbut sometimes vacationhomes.
FIGURE 12.3 Case-Shiller U.S. HomePrice Composite Index, 2000–2008
6. THE CRISIS OF 2007–2008
L E A R N I N G O B J E C T I V E
1. What factors led to the present financial crisis?
The present financial crisis began in 2007 as a nonsystemic crisis linked to subprime mortgages, orrisky loans to homeowners. In 2008, the failure of several major financial services companies turned it in-to the most severe systemic crisis in the United States since the Great Depression.
The troubles began with a major housing asset bubble. As shown in Figure 12.3, between January2000 and 2006, a major index of housing prices in the United States more than doubled. (Prices wentup more in some areas than in others because real estate is a local asset.) Home prices rose rapidly forseveral reasons. As shown in Figure 12.4, mortgage rates were quite low, to a large extent because theFederal Reserve kept the federal funds rate, the rate at which banks lend to each other overnight, verylow.
FIGURE 12.4 U.S. interest rates, 2000–2008
Mortgages also became much easier to obtain. Traditionally, mortgage lenders held mortgage loans ontheir own balance sheets. If a homeowner defaulted, the lender, usually a bank or life insurance com-pany, suffered the loss. They were therefore understandably cautious about whom they lent to and onwhat terms. To shield themselves from loss, lenders insisted that borrowers contribute a substantialpercentage of the home’s value as a down payment. The down payment ensured that the borrower hadsome equity at stake, some reason to work hard and not to default. It also provided lenders with abuffer if housing prices declined. Traditionally, lenders also verified that borrowers were employed orhad other means of income from investments or other sources.
152 MONEY AND BANKING
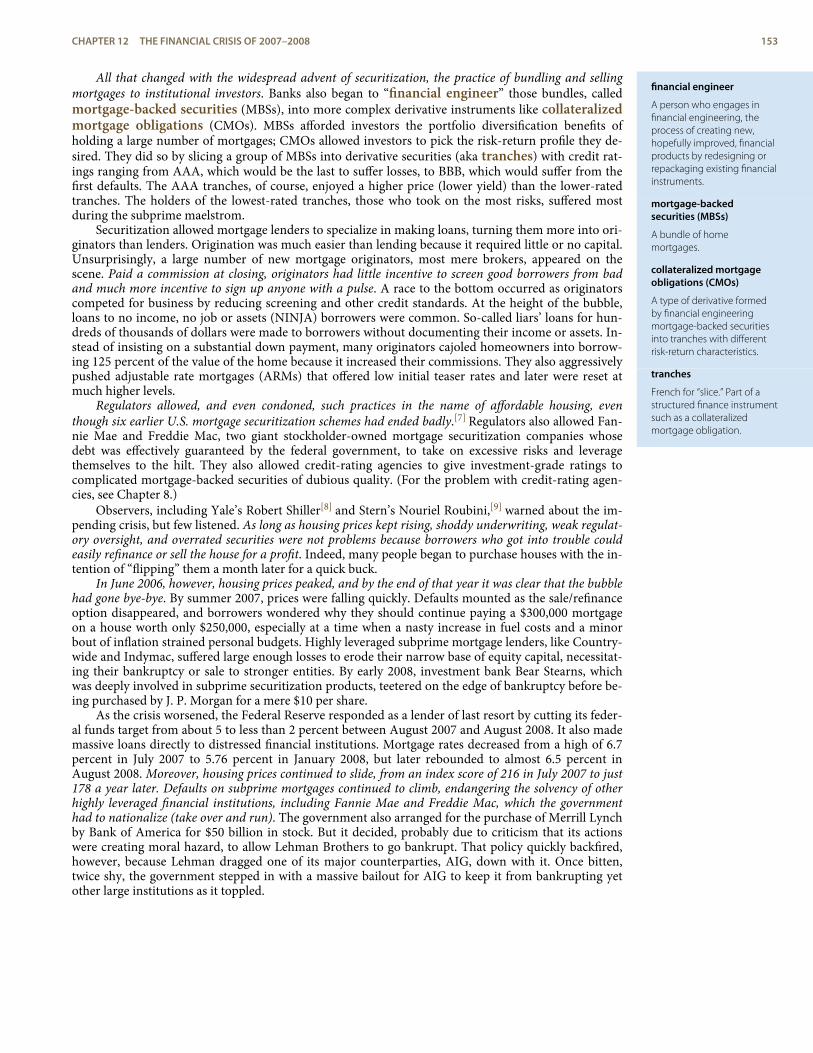
financial engineer
A person who engages infinancial engineering, theprocess of creating new,hopefully improved, financialproducts by redesigning orrepackaging existing financialinstruments.
mortgage-backedsecurities (MBSs)
A bundle of homemortgages.
collateralized mortgageobligations (CMOs)
A type of derivative formedby financial engineeringmortgage-backed securitiesinto tranches with differentrisk-return characteristics.
tranches
French for “slice.” Part of astructured finance instrumentsuch as a collateralizedmortgage obligation.
All that changed with the widespread advent of securitization, the practice of bundling and sellingmortgages to institutional investors. Banks also began to “financial engineer” those bundles, calledmortgage-backed securities (MBSs), into more complex derivative instruments like collateralizedmortgage obligations (CMOs). MBSs afforded investors the portfolio diversification benefits ofholding a large number of mortgages; CMOs allowed investors to pick the risk-return profile they de-sired. They did so by slicing a group of MBSs into derivative securities (aka tranches) with credit rat-ings ranging from AAA, which would be the last to suffer losses, to BBB, which would suffer from thefirst defaults. The AAA tranches, of course, enjoyed a higher price (lower yield) than the lower-ratedtranches. The holders of the lowest-rated tranches, those who took on the most risks, suffered mostduring the subprime maelstrom.
Securitization allowed mortgage lenders to specialize in making loans, turning them more into ori-ginators than lenders. Origination was much easier than lending because it required little or no capital.Unsurprisingly, a large number of new mortgage originators, most mere brokers, appeared on thescene. Paid a commission at closing, originators had little incentive to screen good borrowers from badand much more incentive to sign up anyone with a pulse. A race to the bottom occurred as originatorscompeted for business by reducing screening and other credit standards. At the height of the bubble,loans to no income, no job or assets (NINJA) borrowers were common. So-called liars’ loans for hun-dreds of thousands of dollars were made to borrowers without documenting their income or assets. In-stead of insisting on a substantial down payment, many originators cajoled homeowners into borrow-ing 125 percent of the value of the home because it increased their commissions. They also aggressivelypushed adjustable rate mortgages (ARMs) that offered low initial teaser rates and later were reset atmuch higher levels.
Regulators allowed, and even condoned, such practices in the name of affordable housing, eventhough six earlier U.S. mortgage securitization schemes had ended badly.[7] Regulators also allowed Fan-nie Mae and Freddie Mac, two giant stockholder-owned mortgage securitization companies whosedebt was effectively guaranteed by the federal government, to take on excessive risks and leveragethemselves to the hilt. They also allowed credit-rating agencies to give investment-grade ratings tocomplicated mortgage-backed securities of dubious quality. (For the problem with credit-rating agen-cies, see Chapter 8.)
Observers, including Yale’s Robert Shiller[8] and Stern’s Nouriel Roubini,[9] warned about the im-pending crisis, but few listened. As long as housing prices kept rising, shoddy underwriting, weak regulat-ory oversight, and overrated securities were not problems because borrowers who got into trouble couldeasily refinance or sell the house for a profit. Indeed, many people began to purchase houses with the in-tention of “flipping” them a month later for a quick buck.
In June 2006, however, housing prices peaked, and by the end of that year it was clear that the bubblehad gone bye-bye. By summer 2007, prices were falling quickly. Defaults mounted as the sale/refinanceoption disappeared, and borrowers wondered why they should continue paying a $300,000 mortgageon a house worth only $250,000, especially at a time when a nasty increase in fuel costs and a minorbout of inflation strained personal budgets. Highly leveraged subprime mortgage lenders, like Country-wide and Indymac, suffered large enough losses to erode their narrow base of equity capital, necessitat-ing their bankruptcy or sale to stronger entities. By early 2008, investment bank Bear Stearns, whichwas deeply involved in subprime securitization products, teetered on the edge of bankruptcy before be-ing purchased by J. P. Morgan for a mere $10 per share.
As the crisis worsened, the Federal Reserve responded as a lender of last resort by cutting its feder-al funds target from about 5 to less than 2 percent between August 2007 and August 2008. It also mademassive loans directly to distressed financial institutions. Mortgage rates decreased from a high of 6.7percent in July 2007 to 5.76 percent in January 2008, but later rebounded to almost 6.5 percent inAugust 2008. Moreover, housing prices continued to slide, from an index score of 216 in July 2007 to just178 a year later. Defaults on subprime mortgages continued to climb, endangering the solvency of otherhighly leveraged financial institutions, including Fannie Mae and Freddie Mac, which the governmenthad to nationalize (take over and run). The government also arranged for the purchase of Merrill Lynchby Bank of America for $50 billion in stock. But it decided, probably due to criticism that its actionswere creating moral hazard, to allow Lehman Brothers to go bankrupt. That policy quickly backfired,however, because Lehman dragged one of its major counterparties, AIG, down with it. Once bitten,twice shy, the government stepped in with a massive bailout for AIG to keep it from bankrupting yetother large institutions as it toppled.
CHAPTER 12 THE FINANCIAL CRISIS OF 2007–2008 153
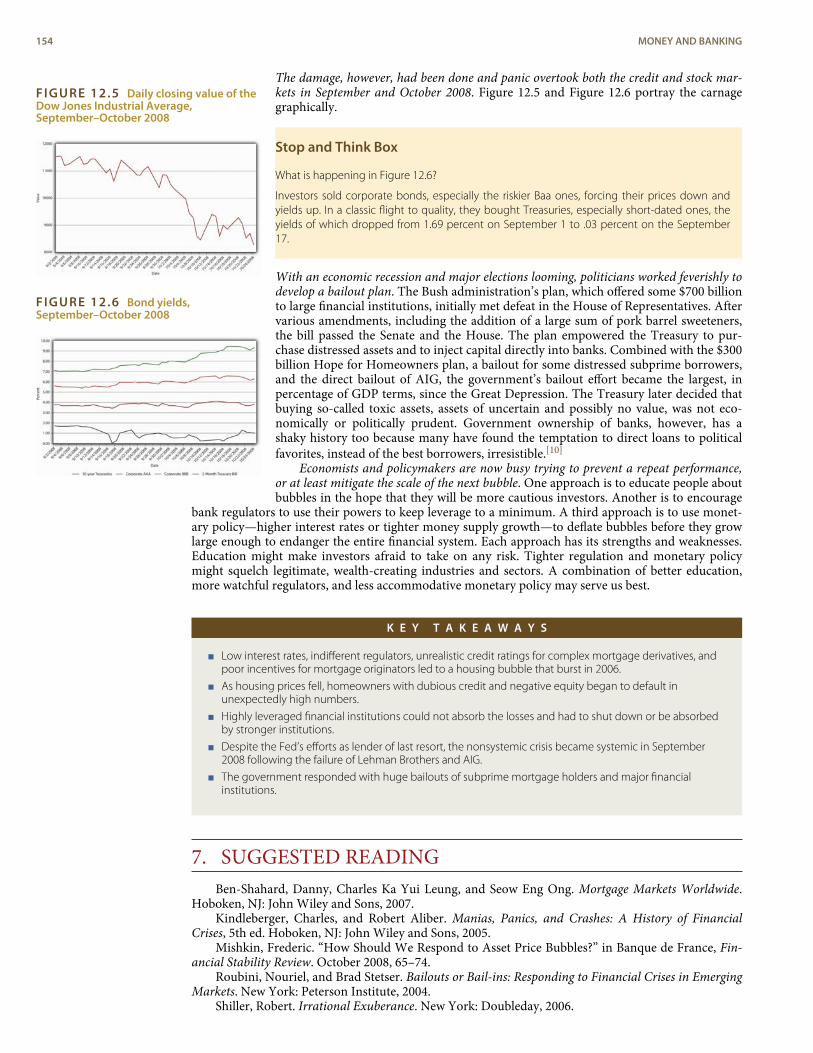
FIGURE 12.5 Daily closing value of theDow Jones Industrial Average,September–October 2008
FIGURE 12.6 Bond yields,September–October 2008
The damage, however, had been done and panic overtook both the credit and stock mar-kets in September and October 2008. Figure 12.5 and Figure 12.6 portray the carnagegraphically.
Stop and Think Box
What is happening in Figure 12.6?
Investors sold corporate bonds, especially the riskier Baa ones, forcing their prices down andyields up. In a classic flight to quality, they bought Treasuries, especially short-dated ones, theyields of which dropped from 1.69 percent on September 1 to .03 percent on the September17.
With an economic recession and major elections looming, politicians worked feverishly todevelop a bailout plan. The Bush administration’s plan, which offered some $700 billionto large financial institutions, initially met defeat in the House of Representatives. Aftervarious amendments, including the addition of a large sum of pork barrel sweeteners,the bill passed the Senate and the House. The plan empowered the Treasury to pur-chase distressed assets and to inject capital directly into banks. Combined with the $300billion Hope for Homeowners plan, a bailout for some distressed subprime borrowers,and the direct bailout of AIG, the government’s bailout effort became the largest, inpercentage of GDP terms, since the Great Depression. The Treasury later decided thatbuying so-called toxic assets, assets of uncertain and possibly no value, was not eco-nomically or politically prudent. Government ownership of banks, however, has ashaky history too because many have found the temptation to direct loans to politicalfavorites, instead of the best borrowers, irresistible.[10]
Economists and policymakers are now busy trying to prevent a repeat performance,or at least mitigate the scale of the next bubble. One approach is to educate people aboutbubbles in the hope that they will be more cautious investors. Another is to encourage
bank regulators to use their powers to keep leverage to a minimum. A third approach is to use monet-ary policy—higher interest rates or tighter money supply growth—to deflate bubbles before they growlarge enough to endanger the entire financial system. Each approach has its strengths and weaknesses.Education might make investors afraid to take on any risk. Tighter regulation and monetary policymight squelch legitimate, wealth-creating industries and sectors. A combination of better education,more watchful regulators, and less accommodative monetary policy may serve us best.
K E Y T A K E A W A Y S
< Low interest rates, indifferent regulators, unrealistic credit ratings for complex mortgage derivatives, andpoor incentives for mortgage originators led to a housing bubble that burst in 2006.
< As housing prices fell, homeowners with dubious credit and negative equity began to default inunexpectedly high numbers.
< Highly leveraged financial institutions could not absorb the losses and had to shut down or be absorbedby stronger institutions.
< Despite the Fed’s efforts as lender of last resort, the nonsystemic crisis became systemic in September2008 following the failure of Lehman Brothers and AIG.
< The government responded with huge bailouts of subprime mortgage holders and major financialinstitutions.
7. SUGGESTED READINGBen-Shahard, Danny, Charles Ka Yui Leung, and Seow Eng Ong. Mortgage Markets Worldwide.
Hoboken, NJ: John Wiley and Sons, 2007.Kindleberger, Charles, and Robert Aliber. Manias, Panics, and Crashes: A History of Financial
Crises, 5th ed. Hoboken, NJ: John Wiley and Sons, 2005.Mishkin, Frederic. “How Should We Respond to Asset Price Bubbles?” in Banque de France, Fin-
ancial Stability Review. October 2008, 65–74.Roubini, Nouriel, and Brad Stetser. Bailouts or Bail-ins: Responding to Financial Crises in Emerging
Markets. New York: Peterson Institute, 2004.Shiller, Robert. Irrational Exuberance. New York: Doubleday, 2006.
154 MONEY AND BANKING
The Subprime Solution: How Today’s Global Financial Crisis Happened, and What to Do About It.Princeton, NJ: Princeton University Press, 2008.
Sprague, Irvine. Bailout: An Insider’s Account of Bank Failures and Rescues. New York: BeardBooks, 2000.
CHAPTER 12 THE FINANCIAL CRISIS OF 2007–2008 155
1.
2.3.
4.
5.6.
7.
8.9.
10.
ENDNOTES
Tim Arango, “The Housing-Bubble and the American Revolution,” New York Times (29November 2008), WK5. http://www.nytimes.com/2008/11/30/weekinreview/30arango.html?_r=2&pagewanted=1&ref=weekinreview
http://books.google.com/books
For more on the crisis, see Tim Arango, “The Housing-Bubble Revolution,” New YorkTimes (30 November 2008), WK 5. http://www.nytimes.com/2008/11/30/weekinreview/30arango.html?_r=2&pagewanted=1&ref=weekinreview
http://www.menshealth.com/cda/article.do?site=MensHealth&channel=health&category=stress.management&conitem=04f999edbbbd201099edbbbd2010cfe793cd____
http://www.federalreserve.gov/Pubs/feds/2007/200713/200713pap.pdf
Doug Arner, Financial Stability, Economic Growth, and the Role of Law (New York: Cam-bridge University Press, 2007), 139–140.
Kenneth Snowden, “Mortgage Securitization in the United States: Twentieth CenturyDevelopments in Historical Perspective,” in Michael Bordo and Richard Sylla, eds.,Anglo-American Financial Systems: Institutions and Markets in the Twentieth Century(Burr Ridge, IL: Irwin Professional Publishing, 1995), 261–298.
http://www.econ.yale.edu/~shiller/
http://pages.stern.nyu.edu/~nroubini/
“Leaving Las Vegas: No Dire Mistakes so Far, but Governments Will Find Exiting BanksFar Harder Than Entering Them,” The Economist (22 November 2008), 22.
156 MONEY AND BANKING
central bank
A bank that regulates themoney supply, interest rates,and/or other financialinstitutions on behalf of thegovernment.
C H A P T E R 1 3Central Bank Form andFunction
C H A P T E R O B J E C T I V E S
By the end of this chapter, students should be able to:
brad felix says:this is total bullshit
1. Define central bank and explain the importance of central banking.
2. Briefly sketch the history of U.S. central banking.
3. Explain when and how a country can do without a central bank.
4. Briefly sketch the structure of the Federal Reserve System.
5. Explain how other central banks compare to the Fed.
6. Define central bank independence and explain its importance.
7. Explain why independent central bankers prefer lower inflation rates than government offi-cials do.
1. AMERICA’S CENTRAL BANKS
L E A R N I N G O B J E C T I V E S
1. What is a central bank?2. Why is central banking important?3. How can a country manage without a central bank?4. What is the history of central banking in the United States?
A central bank is a bank under some degree of government control that is generally charged with
< controlling the money supply (to a greater or lesser degree);< providing price stability (influencing the price level);< attaining economic output and employment goals;< regulating commercial banks (and perhaps other depository and nondepository financial
institutions);< stabilizing the macroeconomy (proactively and/or by acting as a lender of last resort during
financial crises);< providing a payments system (check clearing and long-distance payments).
Central banks also often act as the national government’s banker by holding its deposits and makingpayments on its behalf. During its 200-plus-year existence, the United States has had three different cent-ral banks and two periods, one short and one extremely long, with no central bank.
base money
The most elementary form ofmoney in a given society at agiven time. The only type ofmoney that can compose abank’s primary reserve.
dollarization
The process of using aforeign country’s money as adomestic currency. Often thisentails a country adoptingthe U.S. dollar as a medium ofexchange and unit ofaccount.
Chartered by the federal government in 1791, the Bank of the United States (BUS) worked in con-junction with the U.S. Treasury secretary to act as a lender of last resort and a regulator of commercialbanks. Specifically, it helped Alexander Hamilton, America’s first Secretary of the Treasury,[1] to stymiethe Panic of 1792. It also returned the notes of commercial banks for redemption into gold and silver (theera’s base money), thereby regulating commercial banks’ reserve ratios and hence the money supply.Owned by private shareholders, the BUS was quite independent, a good trait for a central bank to have,as we’ll see. Its very independence and power to regulate commercial banks, however, made it unpopu-lar in some influential political circles. Its charter was not renewed when it expired in 1811. The gov-ernment’s difficulties financing the War of 1812 (aka the Second War for Independence) convincedmany that the country needed a new central bank. As a result, the government chartered the Bank ofthe United States (informally called the Second Bank or SBUS) in 1816. Insufficiently independent ofthe government at first, the SBUS, which (like the BUS) was headquartered in Philadelphia but hadmore numerous branches, stumbled by allowing commercial banks to increase their lending too much.It also suffered from internal agency problems, particularly at its branch in Baltimore. When a financialpanic struck in late 1818 and early 1819, it failed to prevent a recession and debt deflation. (Sound fa-miliar? See the discussion of the Great Depression in Chapter 11.) Private stockholders reasserted con-trol over the bank, placing it under the able direction of Nicholas Biddle, who successfully preventedthe British economic meltdown of 1825 from spreading to America. Under Biddle, the SBUS also be-came an effective regulator of the nation’s commercial banks, which by the 1820s numbered in thehundreds. Like the BUS before it, the SBUS paid for its diligence with its life. Aided by many commer-cial bankers, particularly those in Philadelphia’s financial rival Manhattan, and America’s traditionaldistaste for powerful institutions, Andrew Jackson vetoed the act rechartering it. (The SBUS continuedits corporate life under a Pennsylvania charter, but it no longer had nationwide branches and was nolonger the nation’s central bank. It went bankrupt a few years later.)
From 1837 until late 1914, the United States had no central bank. Private institutions cropped up toclear checks and transfer funds over long distances. The Treasury kept its funds in commercial banksand in the hands of its tax collectors and left bank regulation to the market (deposit and note holdersand stockholders) and state governments. The monetary base (gold and silver) it left largely to thewhims of international trade. It could do so because the United States and most of the world’s othermajor economies were on a gold and/or silver standard, meaning that their respective units of accountwere fixed in terms of so many grains of the precious stuff and hence fixed against each other.[2] Aswe’ll learn in Chapter 18, the system was self-equilibrating. In other words, discretionary monetarypolicy was unnecessary because gold and silver flowed into or out of economies automatically, asneeded. Nations today that maintain fixed exchange rates also find no need for a central bank, but in-stead use a simpler institution called a currency board. Countries that use a foreign currency as theirown, a process called dollarization, need nothing at all because they essentially outsource their mon-etary policy to the central bank of the nation whose currency they use. (That is often the United States,hence the term dollarization.) Other central banking functions, like clearing checks and regulating fin-ancial institutions, can be performed by other entities, public and private. The function of lender of lastresort typically cannot be fulfilled, however, by anything other than a central bank.
Indeed, the biggest problem with the U.S. arrangement was that there was no official systemwidelender of last resort, nobody to increase the money supply or lower interest rates in the face of a shock. Asa result, the United States suffered from banking crises and financial panics of increasing ferocity be-ginning soon after the Second Bank’s demise: 1837, 1839, 1857, 1873, 1884, 1893, and 1907. Most ofthose panics were followed by recessions and debt deflation because there was no institution wealthyenough to stop the death spiral described in Chapter 12 and in Chapter 23 (a shock, increased asym-metric information, decline in economic activity, bank panic, increased asymmetric information, de-cline in economic activity, unanticipated decline in the price level). In 1907, J. P. Morgan (the man,with help from his bank and web of business associates) mitigated, but did not prevent, a serious reces-sion by acting as a lender of last resort. The episode convinced many Americans that the time hadcome to create a new central bank lest private financiers come to wield too much power. Anyone withthe power to stop a panic, they reasoned, had the power to start one. Americans still feared powerfulgovernment institutions too, however, so it took another six years (1913) to agree on the new bank’sstructure, which was highly decentralized geographically and chock full of checks and balances. It tookanother year (1914) to get the bank, often called simply the Fed or the Federal Reserve, into operation.We’ll discuss the checkered history of the Fed’s monetary policy in Chapter 17.
158 MONEY AND BANKING
district bank
One of the twelve bankscomprising the FederalReserve system.
K E Y T A K E A W A Y S
< A central bank is a bank under some degree of government control that is responsible for influencing themoney supply, interest rates, inflation, and other macroeconomic outcomes like output and employment.A central bank is usually the lender of last resort, the institution that can (and should) add liquidity andconfidence to the financial system at the outbreak of panics and crises. On a quotidian basis, central banksalso may clear checks, regulate banks and/or other financial institutions, and serve as the nationalgovernment’s bank.
< Early in its history, the United States was home to two privately owned central banks, the Bank of theUnited States and the Second Bank, that acted as a lender of last resort and regulated commercial banksby returning their notes to them for redemption in base money (then gold and silver). Althougheconomically effective, both were politically unpopular so when their twenty-year charters expired, theywere not renewed. From 1837 until the end of 1914, the United States had no central bank, but theTreasury Department fulfilled some of its functions.
< A country can do without a central bank if it is on fixed exchange rates, such as the gold standard, orotherwise gives up discretionary monetary policy, as when countries dollarize or adopt a foreign currencyas their own. In such cases, other institutions fulfill central banking functions: government departmentsregulate financial institutions, commercial banks safeguard the government’s deposits, a currency boardadministers the fixed exchange rate mechanism, clearinghouses established by banks clear checks, and soforth.
< The Treasury Department did not act as a lender of last resort, however, so recurrent banking crises andfinancial panics plagued the economy. When J. P. Morgan acted as a lender of last resort during the Panicof 1907, political sentiments shifted and the Federal Reserve system emerged out of a series of politicalcompromises six years later.
2. THE FEDERAL RESERVE SYSTEM’S STRUCTURE
L E A R N I N G O B J E C T I V E
1. What is the structure of the Federal Reserve system?
The Federal Reserve is composed of twelve numbered districts, each with its own Federal Reserve Bank:Boston (1), New York (2), Philadelphia (3), Cleveland (4), Richmond (5), Atlanta (6), Chicago (7), St.Louis (8), Minneapolis (9), Kansas City (10), Dallas (11), and San Francisco (12). Except for regions 1and 3, each of those district banks also operates one or more branches. For example, the FederalReserve Bank of New York (FRBNY) maintains a branch in Buffalo; the Atlanta Fed has branches inNashville, Birmingham, New Orleans, Jacksonville, and Miami. The Fed’s headquarters is located inWashington, DC[3]
Missouri is the only state with two federal reserve district banks. This was thought necessary to se-cure the votes of Missouri congressional representatives for the bill. (So much for public interest!) Thedistricts don’t seem to be evenly balanced economically. They were, more or less, when the legislationwas passed before World War I, but since then, the West Coast, Southwest, and Southeast (Sunbelt)have grown in economic importance relative to the Northeast and old Midwest (Rustbelt). (District 3encompasses only southern New Jersey and eastern Pennsylvania, an area that is no longer the eco-nomic powerhouse it once was.) Rather than redistrict, the Fed has simply shifted resources over theyears toward the larger and economically more potent districts.
Each Federal Reserve bank is owned by the commercial banks in its district, and they are members ofthe system. Those banks, which include all nationally chartered banks and any state banks that chooseto join, own restricted[4] shares in the Fed, which they use to elect six directors, three of whom have tobe professional bankers and three of whom have to be nonbank business leaders. The Board ofGovernors in Washington selects another three directors, who are supposed to represent the public in-terest and are not allowed to work for or own stock in any bank. The nine directors, with the consent ofthe board, then appoint a president.
The twelve district banks do mostly grunt work:< Issue new Federal Reserve notes (FRNs) in place of worn currency< Clear checks< Lend to banks within their districts< Act as a liaison between the Fed and the business community
CHAPTER 13 CENTRAL BANK FORM AND FUNCTION 159
< Collect data on regional business and economic conditions< Conduct monetary policy research< Evaluate bank merger and new activities applications< Examine bank holding companies and state-chartered member banks.[5]
The FRBNY is the most important of the district banks because, in addition to the tasks listed above, italso conducts so-called open market operations, buying and selling government bonds (and occasionallyother assets) on behalf of the Federal Reserve system and at the behest of headquarters in Washington.Moreover, the FRBNY is a member of the Bank for International Settlements (BIS)[6] and safeguardsover $100 billion in gold owned by the world’s major central banks. Finally, the FRBNY’s president isthe only permanent member of the Federal Open Market Committee (FOMC).
The FOMC is composed of the seven members of the Board of Governors, the president of theFRBNY, and the presidents of the other district banks, though only four of the last-mentioned group canvote (on a rotating basis). The FOMC meets every six weeks or so to decide on monetary policy, spe-cifically on the rate of growth of the money supply or the federal funds target rate, an important in-terest rate, both of which are controlled via so-called open market operations. Until recently, the Fedhad only two other tools for implementing monetary policy, the discount rate at which district bankslend directly to member banks and reserve requirements. Prior to the crisis of 2007–2008, neither wasan effective tool for a long time, so the market and the media naturally concentrated on the FOMC andhave even taken to calling it “the Fed,” although technically it is only one part of the giant beast. Thehead of the Fed is the Board of Governors, which is composed of a chairperson, currently Ben Bernanke,and six governors.[7] All seven are appointed by the president of the United States and confirmed by theU.S. Senate. The governors must come from different Federal Reserve districts and serve a singlefourteen-year term. The chairperson is selected from among the governors and serves a four-year, re-newable term. The chairperson is the most powerful member of the Fed because he or she controls theboard, which controls the FOMC, which controls the FRBNY’s open market operations, which in-fluences the money supply or a key interest rate. The chairperson also effectively controls reserve re-quirements and the discount rate. He (so far no women) is also the Fed’s public face and its major liais-on to the national government. Although de jure power within the Fed is diffused by the checks andbalances discussed above, today de facto power is concentrated in the chairperson. That allows the Fedto be effective but ensures that a rogue chairperson cannot abuse his power.
Historically, some chairpersons have made nebbishes look effective, while others, including mostrecently Alan Greenspan, have been considered, if not infallible demigods, then at least erudite gurus.Neither extreme view is accurate because all chairpersons have relied heavily on the advice and consent ofthe other governors, the district banks’ presidents, and the Fed’s research staff of economists, which is theworld’s largest. The researchers provide the chairperson and the entire FOMC with new data, qualitat-ive assessments of economic trends, and quantitative output from the latest and greatest macroeco-nomic models. They also examine the global economy and analyze the foreign exchange market, on thelookout for possible shocks from abroad. Fed economists also help the district banks to do their jobs byinvestigating market and competition conditions and engaging in educational and other public out-reach programs.
K E Y T A K E A W A Y S
< The Fed is composed of a Washington-based headquarters and twelve district banks and their branches.
< The district banks, which are owned by the member banks, fulfill the Fed’s quotidian duties like clearingchecks and conducting economic research.
< The most important of the district banks is the Federal Reserve Bank of New York (FRBNY), which conductsopen market operations, the buying and selling of bonds that influences the money supply and interestrates.
< It also safeguards much of the world’s gold and has a permanent seat on the Federal Open MarketCommittee (FOMC), the Fed’s most important policymaking body.
< Composed of the Board of Governors and the presidents of the district banks, the FOMC meets every sixweeks or so to decide whether monetary policy should be tightened (interest rates increased), loosened(interest rates decreased), or maintained.
< The Fed is full of checks and balances, but is clearly led by the chairperson of the Board of Governors.
< The chairperson often personifies the Fed as he (to date it’s been a male) is the bank’s public face.
< Nevertheless, a large number of people, from common businesspeople to the Fed’s research economists,influence his decisions through the data, opinions, and analysis they present.
160 MONEY AND BANKING
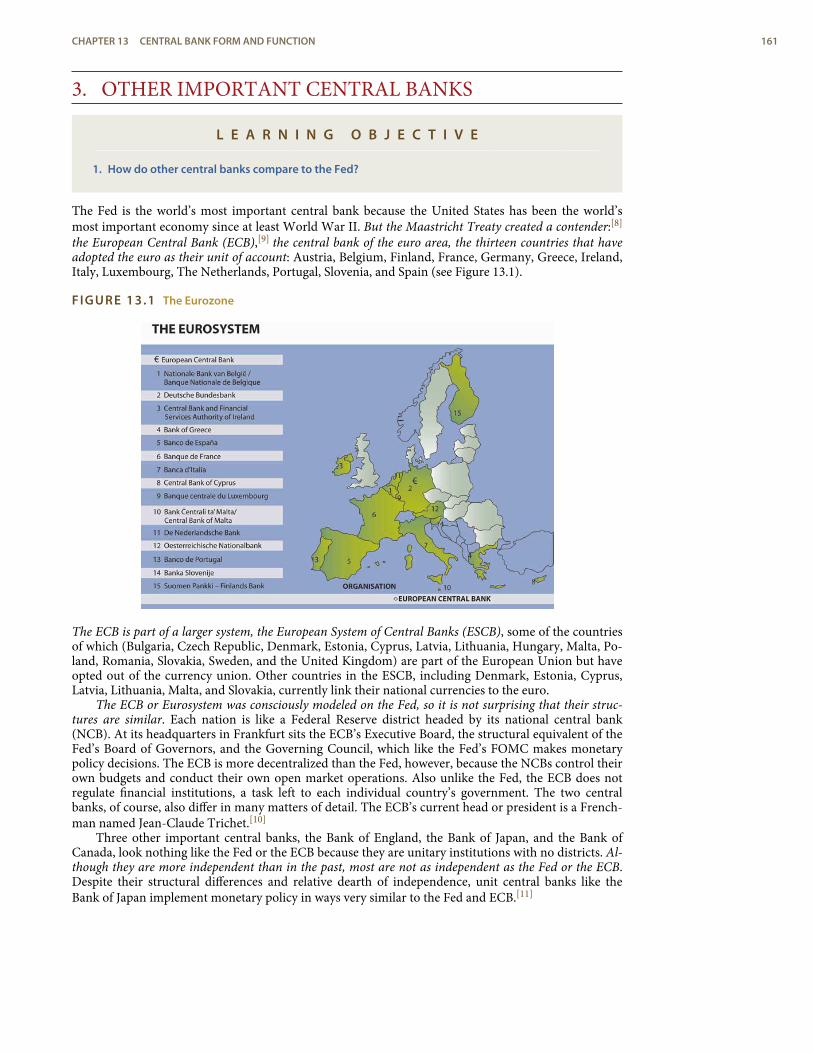
3. OTHER IMPORTANT CENTRAL BANKS
L E A R N I N G O B J E C T I V E
1. How do other central banks compare to the Fed?
The Fed is the world’s most important central bank because the United States has been the world’smost important economy since at least World War II. But the Maastricht Treaty created a contender:[8]
the European Central Bank (ECB),[9] the central bank of the euro area, the thirteen countries that haveadopted the euro as their unit of account: Austria, Belgium, Finland, France, Germany, Greece, Ireland,Italy, Luxembourg, The Netherlands, Portugal, Slovenia, and Spain (see Figure 13.1).
FIGURE 13.1 The Eurozone
The ECB is part of a larger system, the European System of Central Banks (ESCB), some of the countriesof which (Bulgaria, Czech Republic, Denmark, Estonia, Cyprus, Latvia, Lithuania, Hungary, Malta, Po-land, Romania, Slovakia, Sweden, and the United Kingdom) are part of the European Union but haveopted out of the currency union. Other countries in the ESCB, including Denmark, Estonia, Cyprus,Latvia, Lithuania, Malta, and Slovakia, currently link their national currencies to the euro.
The ECB or Eurosystem was consciously modeled on the Fed, so it is not surprising that their struc-tures are similar. Each nation is like a Federal Reserve district headed by its national central bank(NCB). At its headquarters in Frankfurt sits the ECB’s Executive Board, the structural equivalent of theFed’s Board of Governors, and the Governing Council, which like the Fed’s FOMC makes monetarypolicy decisions. The ECB is more decentralized than the Fed, however, because the NCBs control theirown budgets and conduct their own open market operations. Also unlike the Fed, the ECB does notregulate financial institutions, a task left to each individual country’s government. The two centralbanks, of course, also differ in many matters of detail. The ECB’s current head or president is a French-man named Jean-Claude Trichet.[10]
Three other important central banks, the Bank of England, the Bank of Japan, and the Bank ofCanada, look nothing like the Fed or the ECB because they are unitary institutions with no districts. Al-though they are more independent than in the past, most are not as independent as the Fed or the ECB.Despite their structural differences and relative dearth of independence, unit central banks like theBank of Japan implement monetary policy in ways very similar to the Fed and ECB.[11]
CHAPTER 13 CENTRAL BANK FORM AND FUNCTION 161
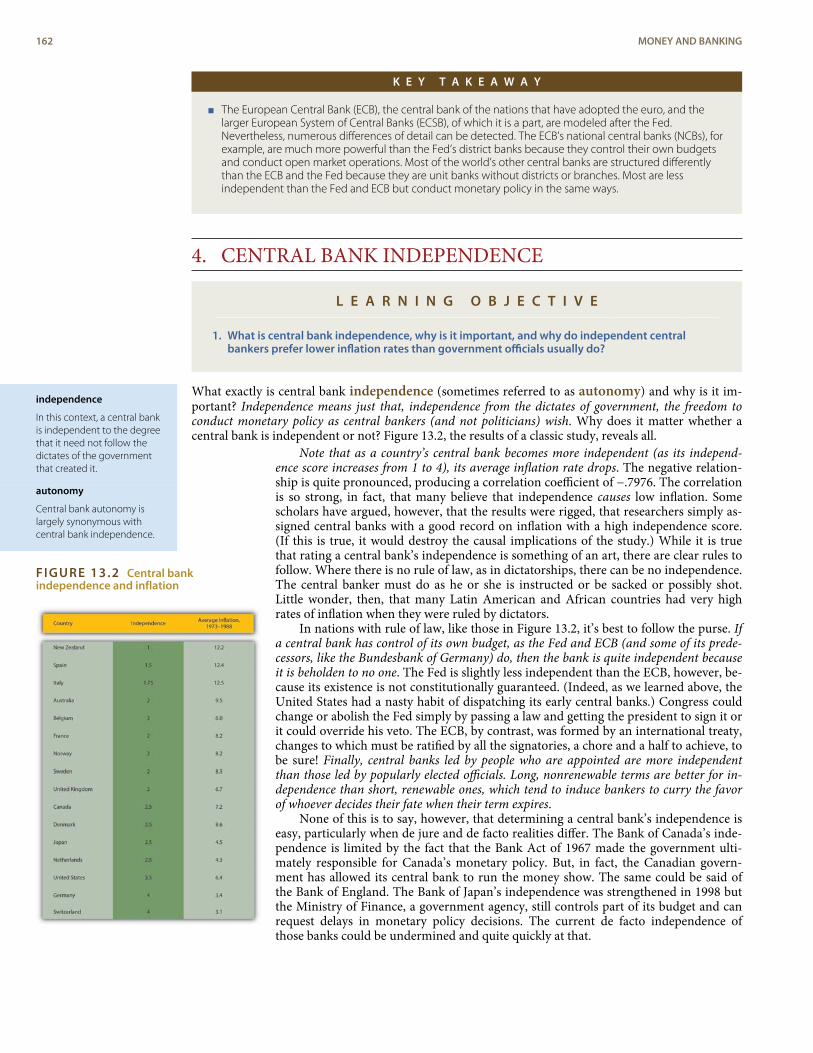
independence
In this context, a central bankis independent to the degreethat it need not follow thedictates of the governmentthat created it.
autonomy
Central bank autonomy islargely synonymous withcentral bank independence.
FIGURE 13.2 Central bankindependence and inflation
K E Y T A K E A W A Y
< The European Central Bank (ECB), the central bank of the nations that have adopted the euro, and thelarger European System of Central Banks (ECSB), of which it is a part, are modeled after the Fed.Nevertheless, numerous differences of detail can be detected. The ECB’s national central banks (NCBs), forexample, are much more powerful than the Fed’s district banks because they control their own budgetsand conduct open market operations. Most of the world’s other central banks are structured differentlythan the ECB and the Fed because they are unit banks without districts or branches. Most are lessindependent than the Fed and ECB but conduct monetary policy in the same ways.
4. CENTRAL BANK INDEPENDENCE
L E A R N I N G O B J E C T I V E
1. What is central bank independence, why is it important, and why do independent centralbankers prefer lower inflation rates than government officials usually do?
What exactly is central bank independence (sometimes referred to as autonomy) and why is it im-portant? Independence means just that, independence from the dictates of government, the freedom toconduct monetary policy as central bankers (and not politicians) wish. Why does it matter whether acentral bank is independent or not? Figure 13.2, the results of a classic study, reveals all.
Note that as a country’s central bank becomes more independent (as its independ-ence score increases from 1 to 4), its average inflation rate drops. The negative relation-ship is quite pronounced, producing a correlation coefficient of −.7976. The correlationis so strong, in fact, that many believe that independence causes low inflation. Somescholars have argued, however, that the results were rigged, that researchers simply as-signed central banks with a good record on inflation with a high independence score.(If this is true, it would destroy the causal implications of the study.) While it is truethat rating a central bank’s independence is something of an art, there are clear rules tofollow. Where there is no rule of law, as in dictatorships, there can be no independence.The central banker must do as he or she is instructed or be sacked or possibly shot.Little wonder, then, that many Latin American and African countries had very highrates of inflation when they were ruled by dictators.
In nations with rule of law, like those in Figure 13.2, it’s best to follow the purse. Ifa central bank has control of its own budget, as the Fed and ECB (and some of its prede-cessors, like the Bundesbank of Germany) do, then the bank is quite independent becauseit is beholden to no one. The Fed is slightly less independent than the ECB, however, be-cause its existence is not constitutionally guaranteed. (Indeed, as we learned above, theUnited States had a nasty habit of dispatching its early central banks.) Congress couldchange or abolish the Fed simply by passing a law and getting the president to sign it orit could override his veto. The ECB, by contrast, was formed by an international treaty,changes to which must be ratified by all the signatories, a chore and a half to achieve, tobe sure! Finally, central banks led by people who are appointed are more independentthan those led by popularly elected officials. Long, nonrenewable terms are better for in-dependence than short, renewable ones, which tend to induce bankers to curry the favorof whoever decides their fate when their term expires.
None of this is to say, however, that determining a central bank’s independence iseasy, particularly when de jure and de facto realities differ. The Bank of Canada’s inde-pendence is limited by the fact that the Bank Act of 1967 made the government ulti-mately responsible for Canada’s monetary policy. But, in fact, the Canadian govern-ment has allowed its central bank to run the money show. The same could be said ofthe Bank of England. The Bank of Japan’s independence was strengthened in 1998 butthe Ministry of Finance, a government agency, still controls part of its budget and canrequest delays in monetary policy decisions. The current de facto independence ofthose banks could be undermined and quite quickly at that.
162 MONEY AND BANKING
Stop and Think Box
“Bank of Japan Faces Test of Independence,” Wall Street Journal, August 10, 2000.“The political storm over apossible interest rate increase by the Bank of Japan is shaping up to be the biggest challenge to the centralbank’s independence since it gained autonomy two years ago. Members of the ruling Liberal Democratic Partystepped up pressure on the bank to leave the country’s interest rates where they are now.” Why does the Lib-eral Democratic Party (LDP) want to influence the Bank of Japan’s (BoJ’s) interest rate policy? Why was the is-sue important enough to warrant a major article in a major business newspaper?
The LDP wanted to influence the BoJ’s interest rate policy for political reasons, namely, to keep the economyfrom slowing, a potential threat to its rule. This was an important story because the de facto “independence”of the BoJ was at stake and hence the market’s perception of the Japanese central bank’s ability to raise in-terest rates to stop inflation in the face of political pressure.
Why, when left to their own devices, are central bankers tougher on inflation than governments, politi-cians, or the general populace? Partly because they represent bank, business, and creditor interests, all ofwhich are hurt if prices rise quickly and unexpectedly. We learned in Chapter 9 that banks are naturallyuncomfortable in rising interest rate environments, and in Chapter 4, we saw that inflation invariablybrings with it higher rates. Net creditors—economic entities that are owed more than they owe—alsodislike inflation because it erodes the real value of the money owed them. Finally, businesses tend todislike inflation because it increases uncertainty and makes long-term planning difficult. Centralbankers also know the damage that inflation can do to an economy, so a public interest motivationdrives them as well.
People and the politicians they elect to office, on the other hand, often desire inflation. Many house-holds are net debtors, meaning that they owe more money than is owed to them. Inflation, they know,will decrease the real burden of their debts. Politicians know this, too, so they tend to err on the side ofhigher rather than lower inflation. Politicians also know that monetary stimulus—increasing themoney supply at a faster rate than usual or lowering the interest rate—can stimulate a short burst ofeconomic growth that will make people happy with the status quo and ready to return incumbents tooffice. If inflation ensues and the economy turns sour for awhile after the election, that is okay becausematters will likely sort out before the next election, when politicians will be again inclined to pump outmoney. This is called the political business cycle. Politicians might also want to print money simply toavoid raising direct taxes. The resultant inflation acts like a tax on cash balances (which lose value eachday) and blame can be cast on the central bankers.
All in all, then, it is a good idea to have a central bank with a good deal of independence, thoughsome liberals complain that independent central banks aren’t sufficiently “democratic.” But who sayseverything should be democratic? Would you want the armed forces run by majority vote? Your com-pany? Your household? Have you heard about the tyranny of the majority?[12] That’s when two wolvesand a sheep vote on what’s for dinner. Central bank independence is not just about inflation but abouthow well the overall economy performs. There is no indication that the inflation fighting done by inde-pendent central banks in any way harms economic growth or employment in the long run. Keeping thelid on inflation, which can seriously injure national economies, is therefore a very good policy indeed.
Another knock against independent central banks is that they are not very transparent. The Fed,for example, has long been infamous for its secrecy. When forced by law to disclose more informationabout its actions sooner, it turned to obfuscation. To this day, decoding the FOMC’s press releases is aninteresting game of semantics. For all its unclear language, the Fed is more open than the ECB, whichwill not make the minutes of its policy meetings public until twenty years after they take place. It is lesstransparent, however, than many central banks that publish their economic forecasts and inflation ratetargets. As we will see in Chapter 26, theory suggests that central banks should be transparent whentrying to stop inflation but opaque when trying to stimulate the economy.
CHAPTER 13 CENTRAL BANK FORM AND FUNCTION 163
K E Y T A K E A W A Y S
< Central bank independence is a measure of how free from government influence central bankers are.Independence increases as a central bank controls its own budget; it cannot be destroyed or modified bymere legislation (or, worse, executive fiat), and it is enhanced when central banks are composed of peopleserving long, nonrenewable terms. Independence is important because researchers have found that themore independent a central bank is, the lower the inflation it allows without injuring growth andemployment goals.
< When unanticipated, inflation redistributes resources from net creditors to net debtors, createsuncertainty, and raises nominal interest rates, hurting economic growth.
< Independent central bankers represent bank, business, and net creditor interests that are hurt by highlevels of inflation. Elected officials represent voters, many of whom are net debtors, and hencebeneficiaries of debt-eroding inflationary measures.
< They also know that well-timed monetary stimulus can help them obtain re-election by inducingeconomic growth in the months leading up to the election. The inflation that follows will bring some pain,but there will be time for correction before the next election. Governments where officials are not elected,as in dictatorships, often have difficulty collecting taxes, so they use the central bank as a source ofrevenue, simply printing money (creating bank deposits) to make payments. High levels of inflation act asa sort of currency tax, a tax on cash balances that lose some of their purchasing power each day.
164 MONEY AND BANKING
5. SUGGESTED READINGBremner, Robert. Chairman of the Fed: William McChesney Martin Jr. and the Creation of the
American Financial System. New Haven, CT: Yale University Press, 2004.Bruner, Robert, and Sean Carr. The Panic of 1907: Lessons Learned from the Market’s Perfect
Storm. Hoboken, NJ: John Wiley and Sons, 2007.Clark, William Roberts. Capitalism, Not Globalismml: Capital Mobility, Central Bank Independ-
ence, and the Political Control of the Economy. Ann Arbor, MI: University of Michigan Press, 2005.Meltzer, Allan. A History of the Federal Reserve, Volume 1: 1913–1951. Chicago, IL: University of
Chicago Press, 2003.Timberlake, Richard. Monetary Policy in the United States: An Intellectual and Institutional His-
tory. Chicago, IL: University of Chicago Press, 1993.
CHAPTER 13 CENTRAL BANK FORM AND FUNCTION 165
1.2.
3.
4.
5.
6.7.8.9.
10.11.
12.
ENDNOTES
http://www.treas.gov/education/history/secretaries/ahamilton.shtml
This does not mean that the exchange rate didn’t change, merely that it stayed with-in a narrow band of transaction costs.
For an interactive map of the system, browse http://www.federalreserve.gov/otherfrb.htm.
The Fed’s stock is not traded in public markets and pays an annual dividend no high-er than 6 percent.
The Comptroller of the Currency is the primary regulator of federally charteredbanks. State regulators and the FDIC regulate state banks that are not members ofthe Federal Reserve system.
http://www.bis.org/
http://www.federalreserve.gov/aboutthefed/bios/board/bernanke.htm
http://www.eurotreaties.com/maastrichtext.html
http://www.ecb.int/home/html/index.en.html
http://www.ecb.int/ecb/orga/decisions/html/cvtrichet.en.html
Dieter Gerdesmeier, Francesco Mongelli, and Barbara Roffia, “The Eurosystem, the USFederal Reserve and the Bank of Japan: Similarities and Differences,” ECB WorkingPaper Series No. 742 (March 2007).
http://xroads.virginia.edu/~hyper/detoc/1_ch15.htm
166 MONEY AND BANKING
monetary base (MB)
The most basic, powerfultypes of money in a givenmonetary system, that is, goldand silver under the goldstandard, FRN, and reserves(Federal Reserve deposits)today.
C H A P T E R 1 4The Money Supply Process
C H A P T E R O B J E C T I V E S
By the end of this chapter, students should be able to:
1. Describe who determines the money supply.
2. Explain how the central bank’s balance sheet differs from the balance sheets of commercialbanks and other depository institutions.
3. Define the monetary base and explain its importance.
4. Define open market operations and explain how they affect the monetary base.
5. Describe the multiple deposit creation process.
6. Define the simple deposit multiplier and explain its information content.
7. List and explain the two major limitations or assumptions of the simple deposit multiplier.
1. THE CENTRAL BANK’S BALANCE SHEET
L E A R N I N G O B J E C T I V E S
1. Who determines the money supply?2. How does the central bank’s balance sheet differ from the balance sheets of other banks?3. What is the monetary base?
Ultimately the money supply is determined by the interaction of four groups: commercial banks and otherdepositories, depositors, borrowers, and the central bank. Like any bank, the central bank’s balance sheetis composed of assets and liabilities. Its assets are similar to those of common banks and include gov-ernment securities[1] and discount loans. The former provide the central bank with income and a liquidasset that it can easily and cheaply buy and sell to alter its balance sheet. The latter are generally loansmade to commercial banks. So far, so good. The central bank’s liabilities, however, differ fundamentallyfrom those of common banks. Its most important liabilities are currency in circulation and reserves.
Yes, currency and reserves. You may recall from Chapter 9 that those are the assets of commercialbanks. In fact, for everyone but the central bank, the central bank’s notes, Federal Reserve notes (FRN) inthe United States, are assets, things owned. But for the central bank, its notes are things owed (liabilities),just like your promissory note (IOU) would be your liability, but it would be an asset for the note’sholder or owner. Similarly, commercial banks own their deposits in the Fed (reserves), which the Fed,of course, owes to the commercial banks. So reserves are commercial bank assets but central bankliabilities.
Currency in circulation (C) and reserves (R) compose the monetary base (MB, aka high-poweredmoney), the most basic building blocks of the money supply. Basically, MB = C + R, an equation you’llwant to internalize. In the United States, C includes FRN and coins issued by the U.S. Treasury. Wecan ignore the latter because it is a relatively small percentage of the MB, and the Treasury cannot leg-ally manage the volume of coinage in circulation in an active fashion, but rather only meets the de-mand for each denomination: .01, .05, .10, .25, .50, and 1.00 coins. (The Fed also supplies the $1.00unit, and for some reason Americans prefer $1 notes to coins. In most countries, coins fill demand forthe single currency unit denomination.) C includes only FRN and coins in the hands of nonbanks. AnyFRN in banks is called vault cash and is included in R, which also includes bank deposits with the Fed.Reserves are of two types: those required or mandated by the central bank (RR), and any additional orexcess reserves (ER) that banks wish to hold. The latter are usually small, but they can grow substan-tially during panics like that of September–October 2008.
Central banks, of course, are highly profitable institutions because their assets earn interest buttheir liabilities are costless, or nearly so. Therefore, they have no gap problems, and liquidity
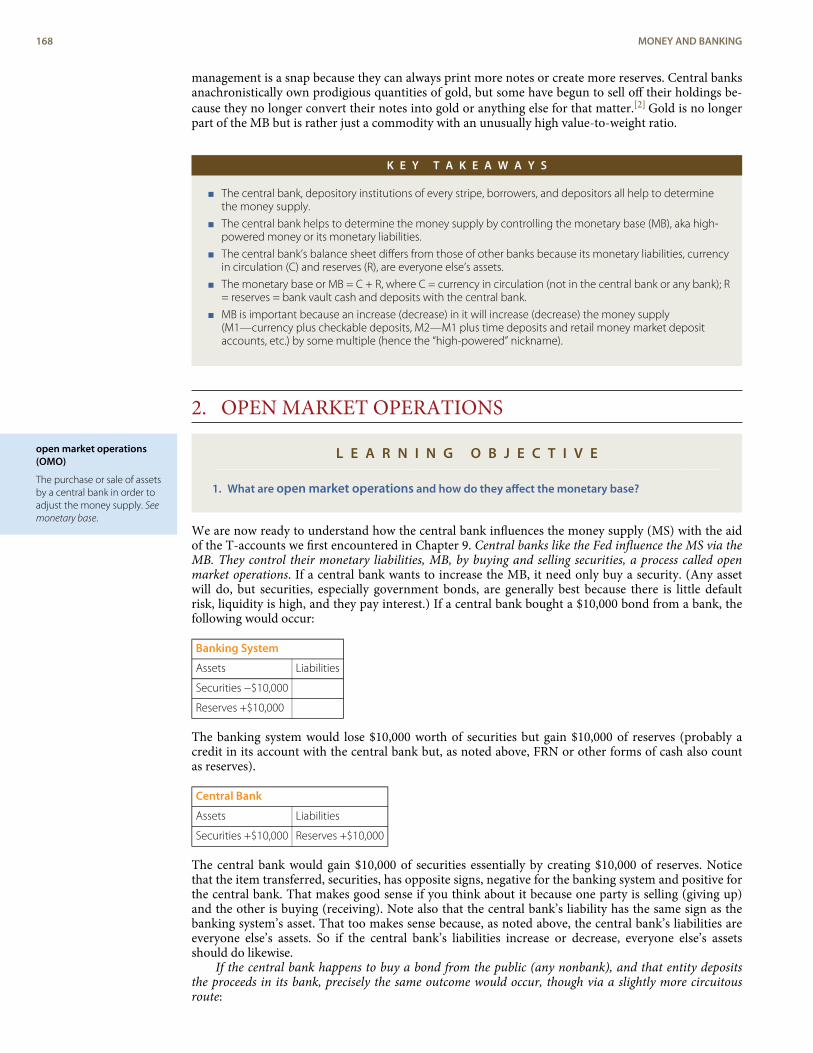
open market operations(OMO)
The purchase or sale of assetsby a central bank in order toadjust the money supply. Seemonetary base.
management is a snap because they can always print more notes or create more reserves. Central banksanachronistically own prodigious quantities of gold, but some have begun to sell off their holdings be-cause they no longer convert their notes into gold or anything else for that matter.[2] Gold is no longerpart of the MB but is rather just a commodity with an unusually high value-to-weight ratio.
K E Y T A K E A W A Y S
< The central bank, depository institutions of every stripe, borrowers, and depositors all help to determinethe money supply.
< The central bank helps to determine the money supply by controlling the monetary base (MB), aka high-powered money or its monetary liabilities.
< The central bank’s balance sheet differs from those of other banks because its monetary liabilities, currencyin circulation (C) and reserves (R), are everyone else’s assets.
< The monetary base or MB = C + R, where C = currency in circulation (not in the central bank or any bank); R= reserves = bank vault cash and deposits with the central bank.
< MB is important because an increase (decrease) in it will increase (decrease) the money supply(M1—currency plus checkable deposits, M2—M1 plus time deposits and retail money market depositaccounts, etc.) by some multiple (hence the “high-powered” nickname).
2. OPEN MARKET OPERATIONS
L E A R N I N G O B J E C T I V E
1. What are open market operations and how do they affect the monetary base?
We are now ready to understand how the central bank influences the money supply (MS) with the aidof the T-accounts we first encountered in Chapter 9. Central banks like the Fed influence the MS via theMB. They control their monetary liabilities, MB, by buying and selling securities, a process called openmarket operations. If a central bank wants to increase the MB, it need only buy a security. (Any assetwill do, but securities, especially government bonds, are generally best because there is little defaultrisk, liquidity is high, and they pay interest.) If a central bank bought a $10,000 bond from a bank, thefollowing would occur:
Banking System
Assets Liabilities
Securities −$10,000
Reserves +$10,000
The banking system would lose $10,000 worth of securities but gain $10,000 of reserves (probably acredit in its account with the central bank but, as noted above, FRN or other forms of cash also countas reserves).
Central Bank
Assets Liabilities
Securities +$10,000 Reserves +$10,000
The central bank would gain $10,000 of securities essentially by creating $10,000 of reserves. Noticethat the item transferred, securities, has opposite signs, negative for the banking system and positive forthe central bank. That makes good sense if you think about it because one party is selling (giving up)and the other is buying (receiving). Note also that the central bank’s liability has the same sign as thebanking system’s asset. That too makes sense because, as noted above, the central bank’s liabilities areeveryone else’s assets. So if the central bank’s liabilities increase or decrease, everyone else’s assetsshould do likewise.
If the central bank happens to buy a bond from the public (any nonbank), and that entity depositsthe proceeds in its bank, precisely the same outcome would occur, though via a slightly more circuitousroute:
168 MONEY AND BANKING
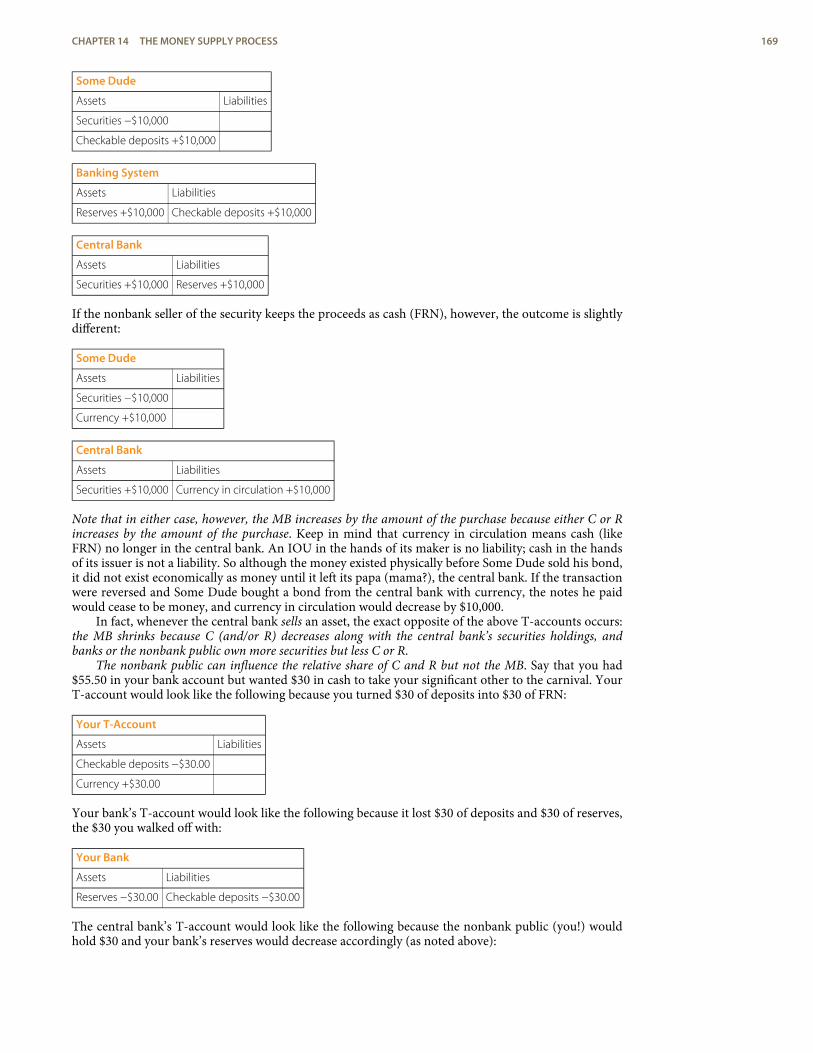
Some Dude
Assets Liabilities
Securities −$10,000
Checkable deposits +$10,000
Banking System
Assets Liabilities
Reserves +$10,000 Checkable deposits +$10,000
Central Bank
Assets Liabilities
Securities +$10,000 Reserves +$10,000
If the nonbank seller of the security keeps the proceeds as cash (FRN), however, the outcome is slightlydifferent:
Some Dude
Assets Liabilities
Securities −$10,000
Currency +$10,000
Central Bank
Assets Liabilities
Securities +$10,000 Currency in circulation +$10,000
Note that in either case, however, the MB increases by the amount of the purchase because either C or Rincreases by the amount of the purchase. Keep in mind that currency in circulation means cash (likeFRN) no longer in the central bank. An IOU in the hands of its maker is no liability; cash in the handsof its issuer is not a liability. So although the money existed physically before Some Dude sold his bond,it did not exist economically as money until it left its papa (mama?), the central bank. If the transactionwere reversed and Some Dude bought a bond from the central bank with currency, the notes he paidwould cease to be money, and currency in circulation would decrease by $10,000.
In fact, whenever the central bank sells an asset, the exact opposite of the above T-accounts occurs:the MB shrinks because C (and/or R) decreases along with the central bank’s securities holdings, andbanks or the nonbank public own more securities but less C or R.
The nonbank public can influence the relative share of C and R but not the MB. Say that you had$55.50 in your bank account but wanted $30 in cash to take your significant other to the carnival. YourT-account would look like the following because you turned $30 of deposits into $30 of FRN:
Your T-Account
Assets Liabilities
Checkable deposits −$30.00
Currency +$30.00
Your bank’s T-account would look like the following because it lost $30 of deposits and $30 of reserves,the $30 you walked off with:
Your Bank
Assets Liabilities
Reserves −$30.00 Checkable deposits −$30.00
The central bank’s T-account would look like the following because the nonbank public (you!) wouldhold $30 and your bank’s reserves would decrease accordingly (as noted above):
CHAPTER 14 THE MONEY SUPPLY PROCESS 169
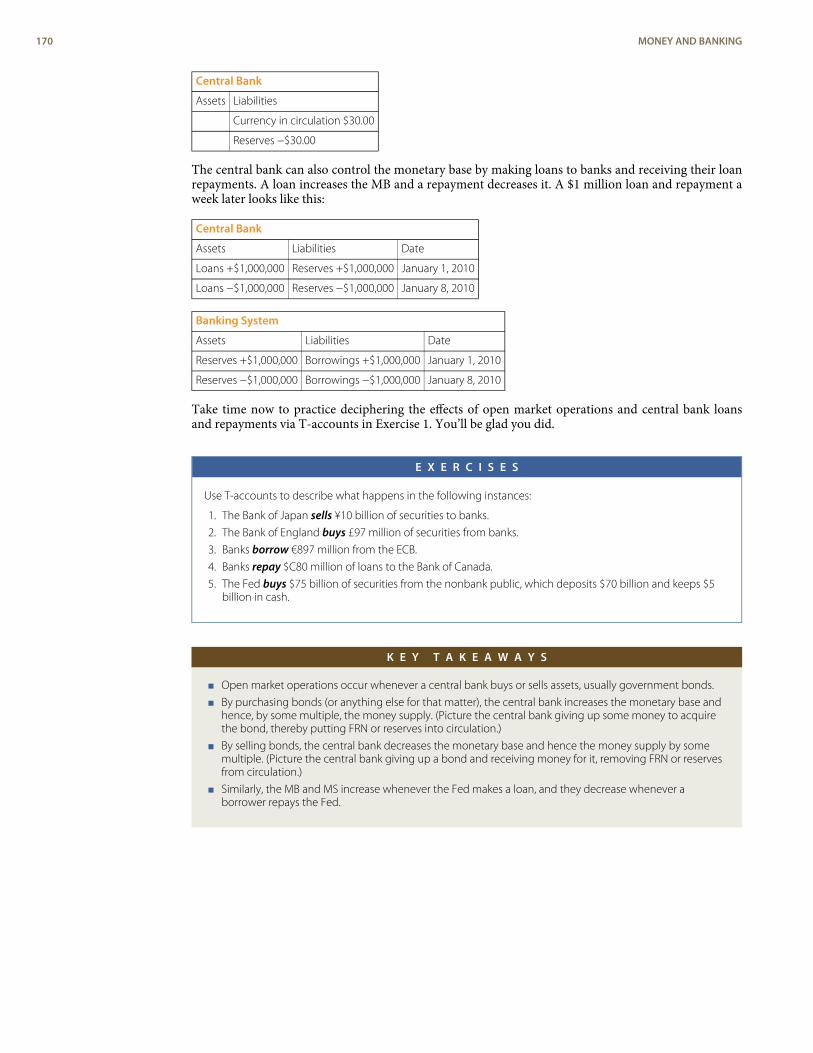
Central Bank
Assets Liabilities
Currency in circulation $30.00
Reserves −$30.00
The central bank can also control the monetary base by making loans to banks and receiving their loanrepayments. A loan increases the MB and a repayment decreases it. A $1 million loan and repayment aweek later looks like this:
Central Bank
Assets Liabilities Date
Loans +$1,000,000 Reserves +$1,000,000 January 1, 2010
Loans −$1,000,000 Reserves −$1,000,000 January 8, 2010
Banking System
Assets Liabilities Date
Reserves +$1,000,000 Borrowings +$1,000,000 January 1, 2010
Reserves −$1,000,000 Borrowings −$1,000,000 January 8, 2010
Take time now to practice deciphering the effects of open market operations and central bank loansand repayments via T-accounts in Exercise 1. You’ll be glad you did.
E X E R C I S E S
Use T-accounts to describe what happens in the following instances:
1. The Bank of Japan sells ¥10 billion of securities to banks.
2. The Bank of England buys £97 million of securities from banks.
3. Banks borrow €897 million from the ECB.
4. Banks repay $C80 million of loans to the Bank of Canada.
5. The Fed buys $75 billion of securities from the nonbank public, which deposits $70 billion and keeps $5billion in cash.
K E Y T A K E A W A Y S
< Open market operations occur whenever a central bank buys or sells assets, usually government bonds.
< By purchasing bonds (or anything else for that matter), the central bank increases the monetary base andhence, by some multiple, the money supply. (Picture the central bank giving up some money to acquirethe bond, thereby putting FRN or reserves into circulation.)
< By selling bonds, the central bank decreases the monetary base and hence the money supply by somemultiple. (Picture the central bank giving up a bond and receiving money for it, removing FRN or reservesfrom circulation.)
< Similarly, the MB and MS increase whenever the Fed makes a loan, and they decrease whenever aborrower repays the Fed.
170 MONEY AND BANKING
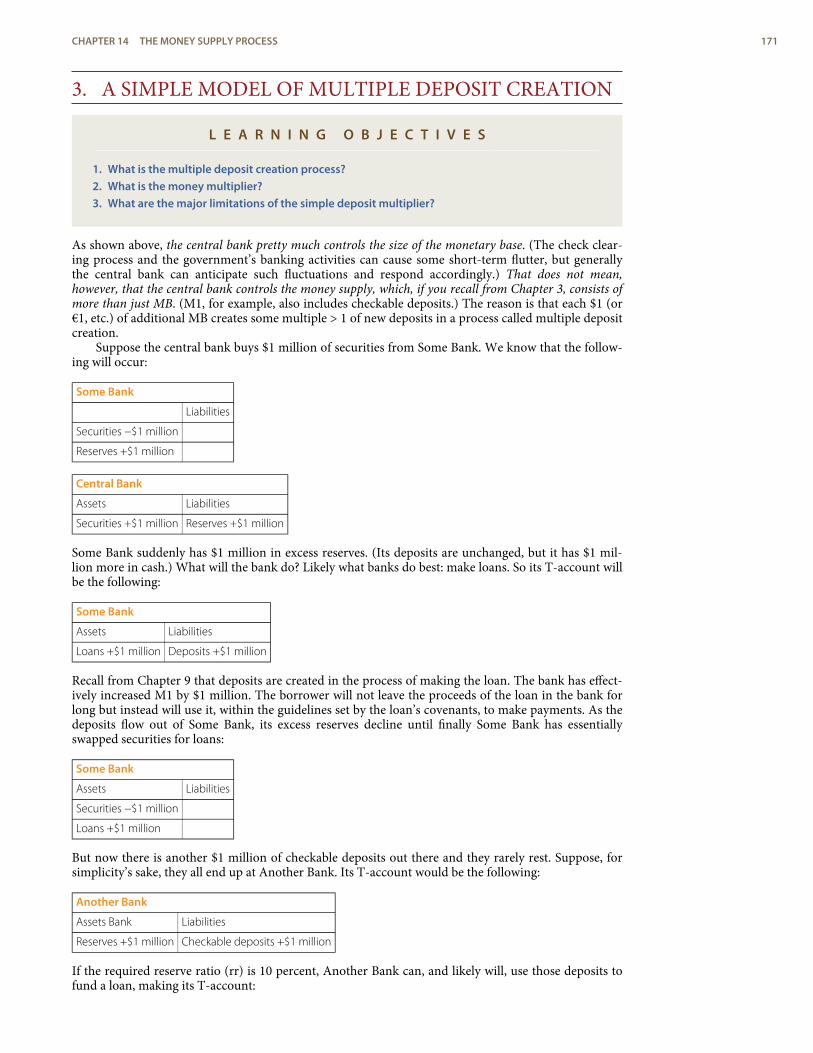
3. A SIMPLE MODEL OF MULTIPLE DEPOSIT CREATION
L E A R N I N G O B J E C T I V E S
1. What is the multiple deposit creation process?2. What is the money multiplier?3. What are the major limitations of the simple deposit multiplier?
As shown above, the central bank pretty much controls the size of the monetary base. (The check clear-ing process and the government’s banking activities can cause some short-term flutter, but generallythe central bank can anticipate such fluctuations and respond accordingly.) That does not mean,however, that the central bank controls the money supply, which, if you recall from Chapter 3, consists ofmore than just MB. (M1, for example, also includes checkable deposits.) The reason is that each $1 (or€1, etc.) of additional MB creates some multiple > 1 of new deposits in a process called multiple depositcreation.
Suppose the central bank buys $1 million of securities from Some Bank. We know that the follow-ing will occur:
Some Bank
Liabilities
Securities −$1 million
Reserves +$1 million
Central Bank
Assets Liabilities
Securities +$1 million Reserves +$1 million
Some Bank suddenly has $1 million in excess reserves. (Its deposits are unchanged, but it has $1 mil-lion more in cash.) What will the bank do? Likely what banks do best: make loans. So its T-account willbe the following:
Some Bank
Assets Liabilities
Loans +$1 million Deposits +$1 million
Recall from Chapter 9 that deposits are created in the process of making the loan. The bank has effect-ively increased M1 by $1 million. The borrower will not leave the proceeds of the loan in the bank forlong but instead will use it, within the guidelines set by the loan’s covenants, to make payments. As thedeposits flow out of Some Bank, its excess reserves decline until finally Some Bank has essentiallyswapped securities for loans:
Some Bank
Assets Liabilities
Securities −$1 million
Loans +$1 million
But now there is another $1 million of checkable deposits out there and they rarely rest. Suppose, forsimplicity’s sake, they all end up at Another Bank. Its T-account would be the following:
Another Bank
Assets Bank Liabilities
Reserves +$1 million Checkable deposits +$1 million
If the required reserve ratio (rr) is 10 percent, Another Bank can, and likely will, use those deposits tofund a loan, making its T-account:
CHAPTER 14 THE MONEY SUPPLY PROCESS 171
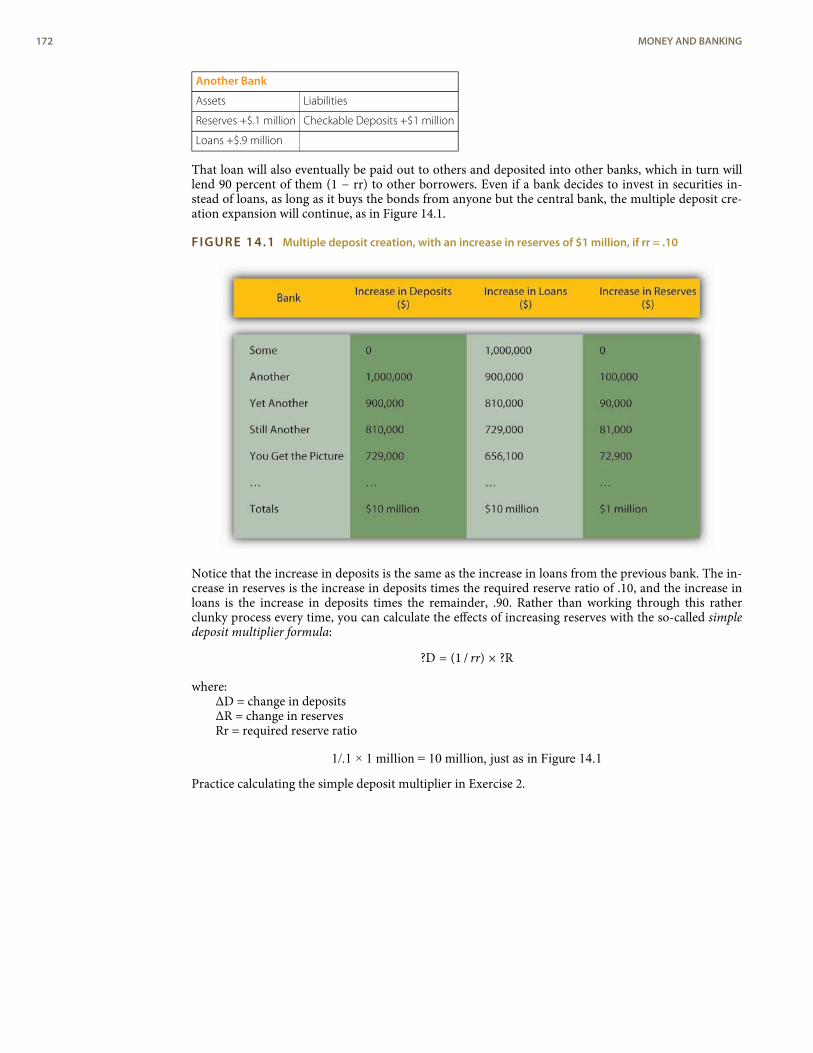
Another Bank
Assets Liabilities
Reserves +$.1 million Checkable Deposits +$1 million
Loans +$.9 million
That loan will also eventually be paid out to others and deposited into other banks, which in turn willlend 90 percent of them (1 − rr) to other borrowers. Even if a bank decides to invest in securities in-stead of loans, as long as it buys the bonds from anyone but the central bank, the multiple deposit cre-ation expansion will continue, as in Figure 14.1.
FIGURE 14.1 Multiple deposit creation, with an increase in reserves of $1 million, if rr = .10
Notice that the increase in deposits is the same as the increase in loans from the previous bank. The in-crease in reserves is the increase in deposits times the required reserve ratio of .10, and the increase inloans is the increase in deposits times the remainder, .90. Rather than working through this ratherclunky process every time, you can calculate the effects of increasing reserves with the so-called simpledeposit multiplier formula:
?D = (1 / rr) × ?R
where:∆D = change in deposits∆R = change in reservesRr = required reserve ratio
1/.1 × 1 million = 10 million, just as in Figure 14.1
Practice calculating the simple deposit multiplier in Exercise 2.
172 MONEY AND BANKING
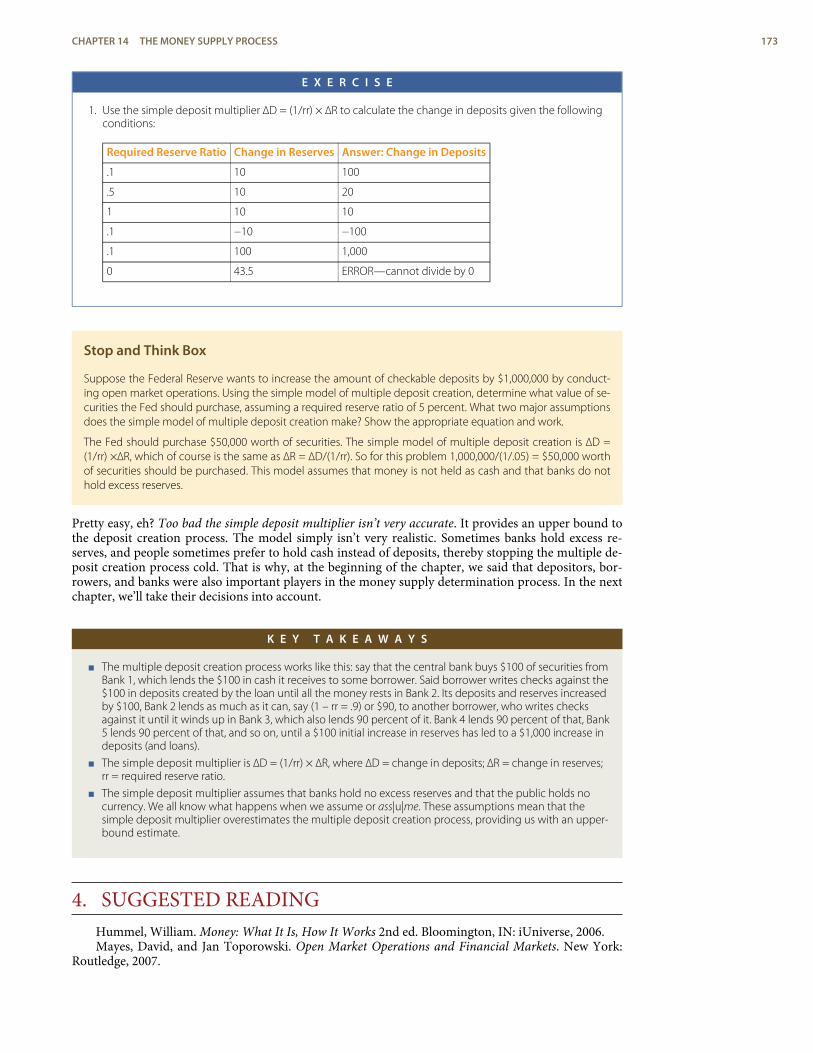
E X E R C I S E
1. Use the simple deposit multiplier ∆D = (1/rr) × ∆R to calculate the change in deposits given the followingconditions:
Required Reserve Ratio Change in Reserves Answer: Change in Deposits
.1 10 100
.5 10 20
1 10 10
.1 −10 −100
.1 100 1,000
0 43.5 ERROR—cannot divide by 0
Stop and Think Box
Suppose the Federal Reserve wants to increase the amount of checkable deposits by $1,000,000 by conduct-ing open market operations. Using the simple model of multiple deposit creation, determine what value of se-curities the Fed should purchase, assuming a required reserve ratio of 5 percent. What two major assumptionsdoes the simple model of multiple deposit creation make? Show the appropriate equation and work.
The Fed should purchase $50,000 worth of securities. The simple model of multiple deposit creation is ∆D =(1/rr) ×∆R, which of course is the same as ∆R = ∆D/(1/rr). So for this problem 1,000,000/(1/.05) = $50,000 worthof securities should be purchased. This model assumes that money is not held as cash and that banks do nothold excess reserves.
Pretty easy, eh? Too bad the simple deposit multiplier isn’t very accurate. It provides an upper bound tothe deposit creation process. The model simply isn’t very realistic. Sometimes banks hold excess re-serves, and people sometimes prefer to hold cash instead of deposits, thereby stopping the multiple de-posit creation process cold. That is why, at the beginning of the chapter, we said that depositors, bor-rowers, and banks were also important players in the money supply determination process. In the nextchapter, we’ll take their decisions into account.
K E Y T A K E A W A Y S
< The multiple deposit creation process works like this: say that the central bank buys $100 of securities fromBank 1, which lends the $100 in cash it receives to some borrower. Said borrower writes checks against the$100 in deposits created by the loan until all the money rests in Bank 2. Its deposits and reserves increasedby $100, Bank 2 lends as much as it can, say (1 – rr = .9) or $90, to another borrower, who writes checksagainst it until it winds up in Bank 3, which also lends 90 percent of it. Bank 4 lends 90 percent of that, Bank5 lends 90 percent of that, and so on, until a $100 initial increase in reserves has led to a $1,000 increase indeposits (and loans).
< The simple deposit multiplier is ∆D = (1/rr) × ∆R, where ∆D = change in deposits; ∆R = change in reserves;rr = required reserve ratio.
< The simple deposit multiplier assumes that banks hold no excess reserves and that the public holds nocurrency. We all know what happens when we assume or ass|u|me. These assumptions mean that thesimple deposit multiplier overestimates the multiple deposit creation process, providing us with an upper-bound estimate.
4. SUGGESTED READINGHummel, William. Money: What It Is, How It Works 2nd ed. Bloomington, IN: iUniverse, 2006.Mayes, David, and Jan Toporowski. Open Market Operations and Financial Markets. New York:
Routledge, 2007.
CHAPTER 14 THE MONEY SUPPLY PROCESS 173

1.
2.ENDNOTES
Students sometimes become confused about this because they think the centralbank is the government. At most, it is part of the government, and not the part that
issues the bonds. Sometimes, as in the case of the BUS and SBUS, it is not part of thegovernment at all.
http://news.goldseek.com/GoldSeek/1177619058.php
174 MONEY AND BANKING
M1
M1 is a measure of themoney supply that includescurrency in circulation pluscheckable deposits.
M2
M2 is a measure of themoney supply that includesM1 plus time deposits andnoninstitutional (retail)money market funds.
C H A P T E R 1 5The Money Supply and theMoney Multiplier
C H A P T E R O B J E C T I V E S
By the end of this chapter, students should be able to:
1. Compare and contrast the simple money multiplier developed in Chapter 14 and the m1and m2 multipliers developed in this chapter.
2. Write the equation that helps us to understand how changes in the monetary base affectthe money supply.
3. Explain why the M2 multiplier is almost always larger than the m1 multiplier.
4. Explain why the required reserve ratio, the excess reserve ratio, and the currency ratio are inthe denominator of the m1 and m2 money multipliers.
5. Explain why the currency, time deposit, and money market mutual fund ratios are in the nu-merator of the M2 money multiplier.
6. Describe how central banks influence the money supply.
7. Describe how banks, borrowers, and depositors influence the money supply.
1. A MORE SOPHISTICATED MONEY MULTIPLIER FORM1
L E A R N I N G O B J E C T I V E S
1. How do the simple money multiplier and the more sophisticated one developed here contrastand compare?
2. What equation helps us to understand how changes in the monetary base affect the moneysupply?
In Chapter 14, you learned that an increase (decrease) in the monetary base (MB, which = C + R) leadsto an even greater increase (decrease) in the money supply (MS, such as M1 or M2) due to the mul-tiple deposit creation process. You also learned a simple but unrealistic upper-bound formula for es-timating the change that assumed that banks hold no excess reserves and that the public holds nocurrency.
Stop and Think Box
You are a research associate for Moody’s subsidiary, High Frequency Economics, in West Chester, Pennsylvania.A client wants you to project changes in M1 given likely increases in the monetary base. Because of a glitch inthe Federal Reserve’s computer systems, currency, deposit, and excess reserve figures will not be available forat least one week. A private firm, however, can provide you with good estimates of changes in banking systemreserves, and of course the required reserve ratio is well known. What equation can you use to help your cli-ent? What are the equation’s assumptions and limitations?
You cannot use the more complex M1 money multiplier this week because of the Fed’s computer glitch, soyou should use the simple deposit multiplier from Chapter 14: ΔD = (1/rr) × ΔR. The equation provides anupper-bound estimate for changes in deposits. It assumes that the public will hold no more currency and thatbanks will hold no increased excess reserves.
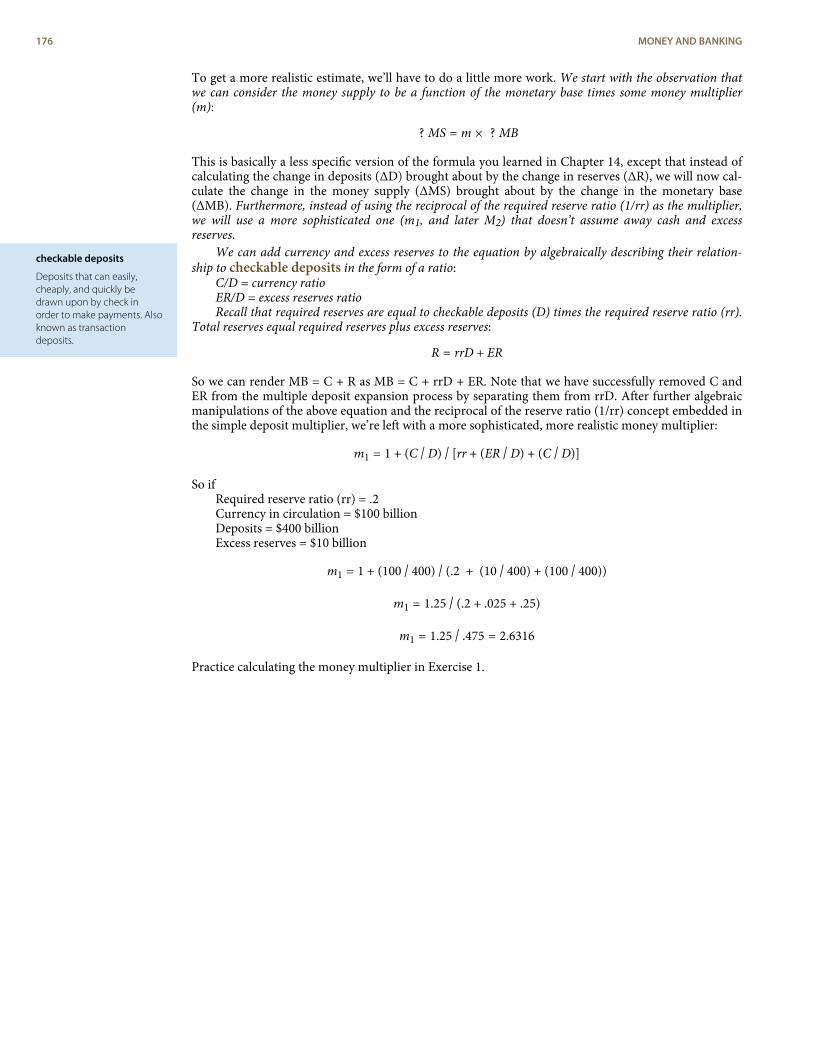
checkable deposits
Deposits that can easily,cheaply, and quickly bedrawn upon by check inorder to make payments. Alsoknown as transactiondeposits.
To get a more realistic estimate, we’ll have to do a little more work. We start with the observation thatwe can consider the money supply to be a function of the monetary base times some money multiplier(m):
? MS = m × ? MB
This is basically a less specific version of the formula you learned in Chapter 14, except that instead ofcalculating the change in deposits (ΔD) brought about by the change in reserves (ΔR), we will now cal-culate the change in the money supply (ΔMS) brought about by the change in the monetary base(ΔMB). Furthermore, instead of using the reciprocal of the required reserve ratio (1/rr) as the multiplier,we will use a more sophisticated one (m1, and later M2) that doesn’t assume away cash and excessreserves.
We can add currency and excess reserves to the equation by algebraically describing their relation-ship to checkable deposits in the form of a ratio:
C/D = currency ratioER/D = excess reserves ratioRecall that required reserves are equal to checkable deposits (D) times the required reserve ratio (rr).
Total reserves equal required reserves plus excess reserves:
R = rrD + ER
So we can render MB = C + R as MB = C + rrD + ER. Note that we have successfully removed C andER from the multiple deposit expansion process by separating them from rrD. After further algebraicmanipulations of the above equation and the reciprocal of the reserve ratio (1/rr) concept embedded inthe simple deposit multiplier, we’re left with a more sophisticated, more realistic money multiplier:
m1 = 1 + (C / D) / [rr + (ER / D) + (C / D)]
So ifRequired reserve ratio (rr) = .2Currency in circulation = $100 billionDeposits = $400 billionExcess reserves = $10 billion
m1 = 1 + (100 / 400) / (.2 + (10 / 400) + (100 / 400))
m1 = 1.25 / (.2 + .025 + .25)
m1 = 1.25 / .475 = 2.6316
Practice calculating the money multiplier in Exercise 1.
176 MONEY AND BANKING
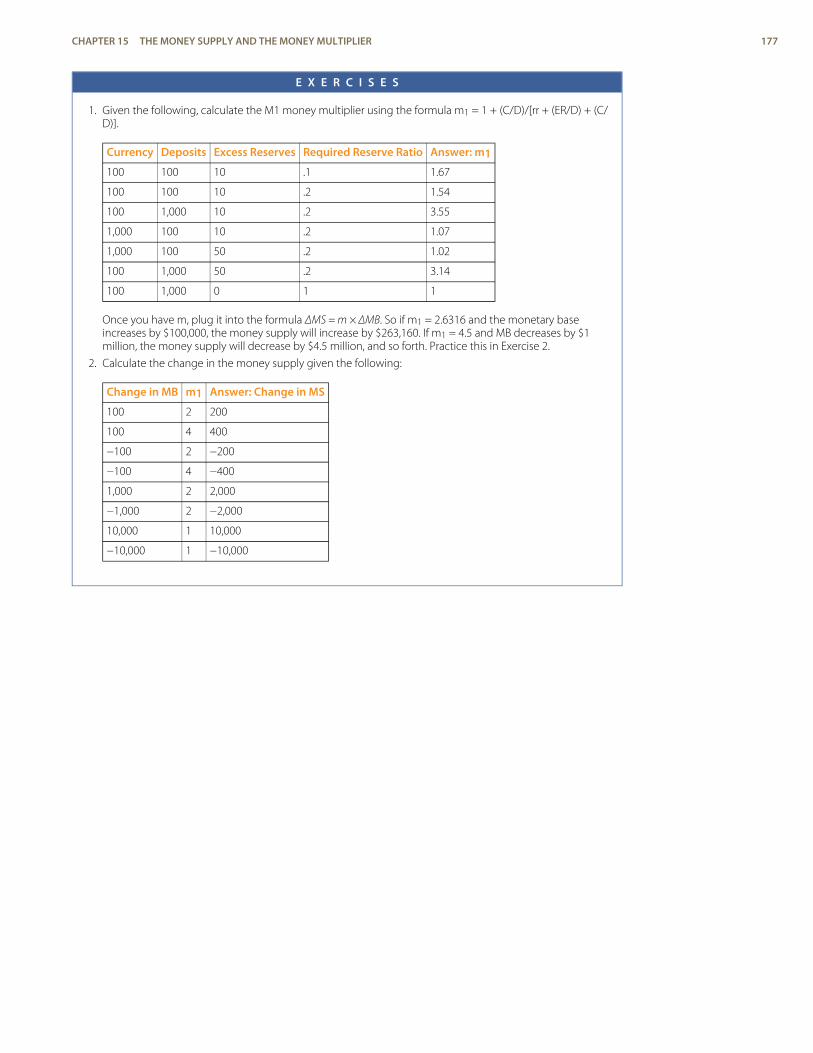
E X E R C I S E S
1. Given the following, calculate the M1 money multiplier using the formula m1 = 1 + (C/D)/[rr + (ER/D) + (C/D)].
Currency Deposits Excess Reserves Required Reserve Ratio Answer: m1
100 100 10 .1 1.67
100 100 10 .2 1.54
100 1,000 10 .2 3.55
1,000 100 10 .2 1.07
1,000 100 50 .2 1.02
100 1,000 50 .2 3.14
100 1,000 0 1 1
Once you have m, plug it into the formula ΔMS = m × ΔMB. So if m1 = 2.6316 and the monetary baseincreases by $100,000, the money supply will increase by $263,160. If m1 = 4.5 and MB decreases by $1million, the money supply will decrease by $4.5 million, and so forth. Practice this in Exercise 2.
2. Calculate the change in the money supply given the following:
Change in MB m1 Answer: Change in MS
100 2 200
100 4 400
−100 2 −200
−100 4 −400
1,000 2 2,000
−1,000 2 −2,000
10,000 1 10,000
−10,000 1 −10,000
CHAPTER 15 THE MONEY SUPPLY AND THE MONEY MULTIPLIER 177
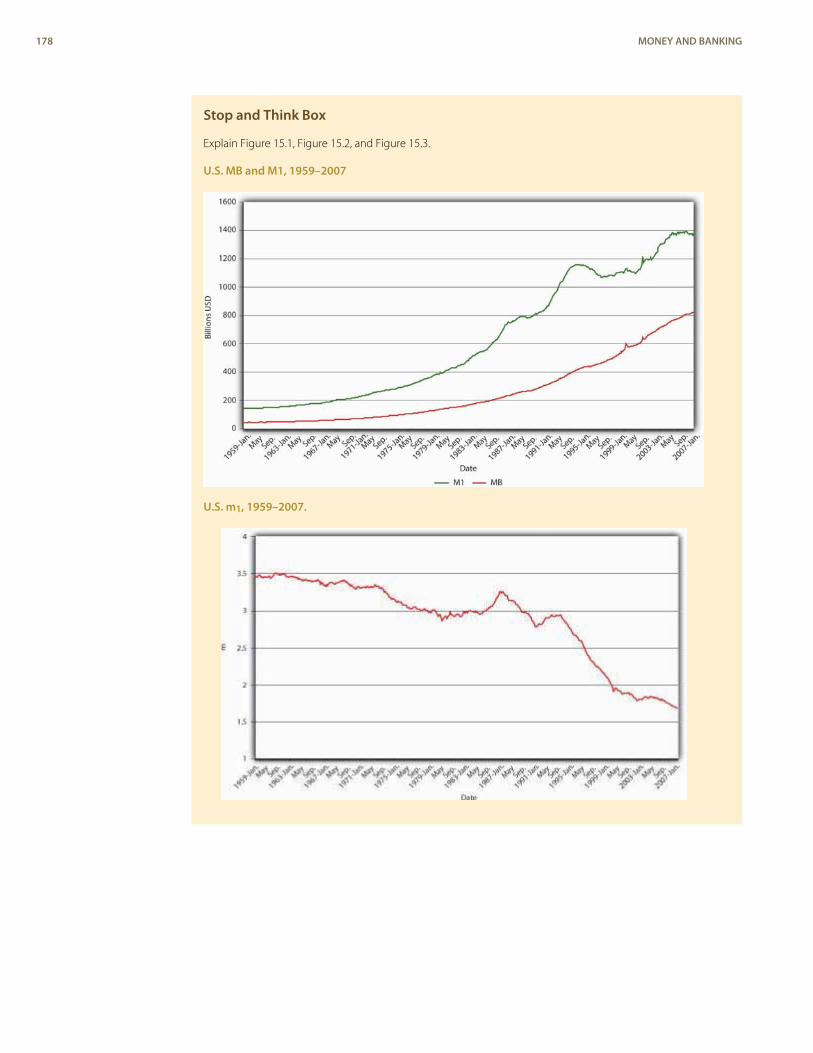
Stop and Think Box
Explain Figure 15.1, Figure 15.2, and Figure 15.3.
U.S. MB and M1, 1959–2007
U.S. m1, 1959–2007.
178 MONEY AND BANKING
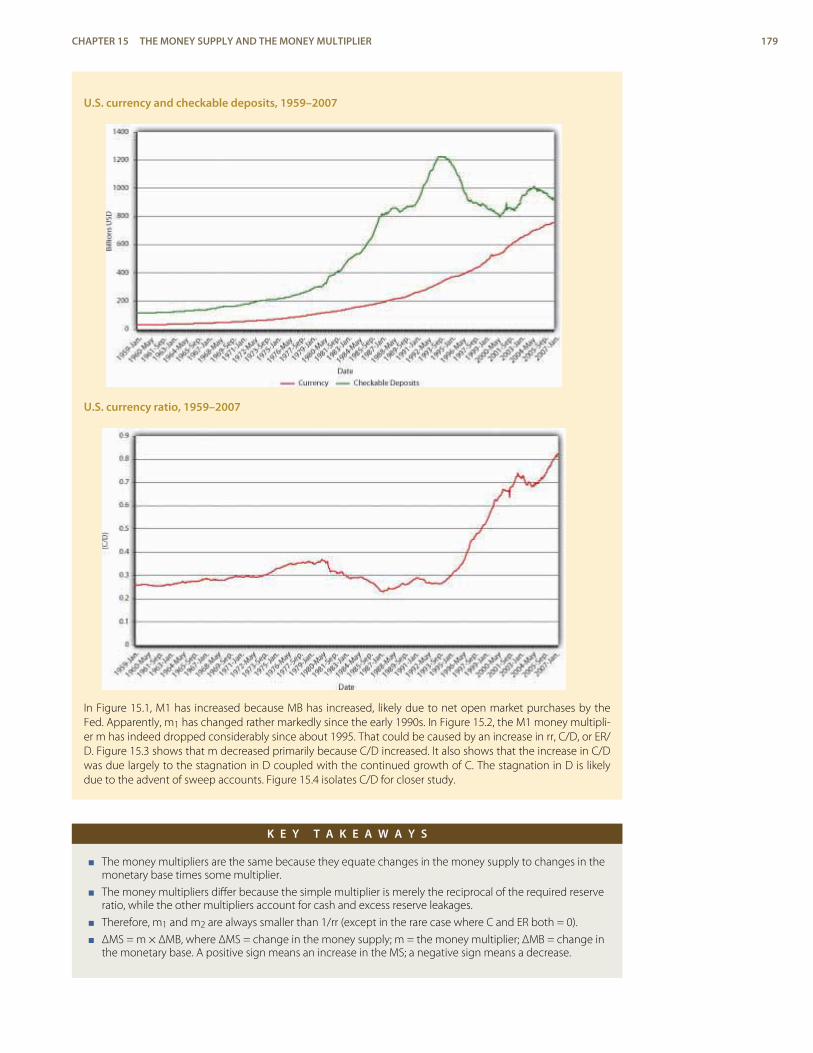
U.S. currency and checkable deposits, 1959–2007
U.S. currency ratio, 1959–2007
In Figure 15.1, M1 has increased because MB has increased, likely due to net open market purchases by theFed. Apparently, m1 has changed rather markedly since the early 1990s. In Figure 15.2, the M1 money multipli-er m has indeed dropped considerably since about 1995. That could be caused by an increase in rr, C/D, or ER/D. Figure 15.3 shows that m decreased primarily because C/D increased. It also shows that the increase in C/Dwas due largely to the stagnation in D coupled with the continued growth of C. The stagnation in D is likelydue to the advent of sweep accounts. Figure 15.4 isolates C/D for closer study.
K E Y T A K E A W A Y S
< The money multipliers are the same because they equate changes in the money supply to changes in themonetary base times some multiplier.
< The money multipliers differ because the simple multiplier is merely the reciprocal of the required reserveratio, while the other multipliers account for cash and excess reserve leakages.
< Therefore, m1 and m2 are always smaller than 1/rr (except in the rare case where C and ER both = 0).
< ΔMS = m × ΔMB, where ΔMS = change in the money supply; m = the money multiplier; ΔMB = change inthe monetary base. A positive sign means an increase in the MS; a negative sign means a decrease.
CHAPTER 15 THE MONEY SUPPLY AND THE MONEY MULTIPLIER 179
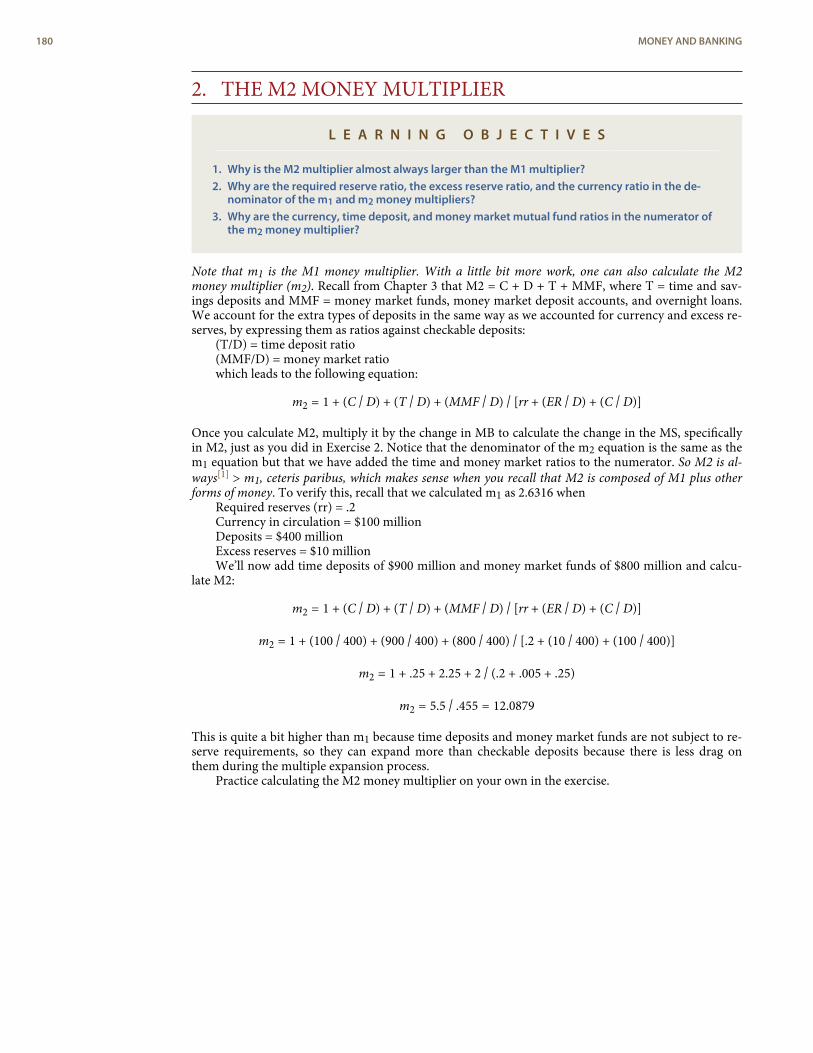
2. THE M2 MONEY MULTIPLIER
L E A R N I N G O B J E C T I V E S
1. Why is the M2 multiplier almost always larger than the M1 multiplier?2. Why are the required reserve ratio, the excess reserve ratio, and the currency ratio in the de-
nominator of the m1 and m2 money multipliers?3. Why are the currency, time deposit, and money market mutual fund ratios in the numerator of
the m2 money multiplier?
Note that m1 is the M1 money multiplier. With a little bit more work, one can also calculate the M2money multiplier (m2). Recall from Chapter 3 that M2 = C + D + T + MMF, where T = time and sav-ings deposits and MMF = money market funds, money market deposit accounts, and overnight loans.We account for the extra types of deposits in the same way as we accounted for currency and excess re-serves, by expressing them as ratios against checkable deposits:
(T/D) = time deposit ratio(MMF/D) = money market ratiowhich leads to the following equation:
m2 = 1 + (C / D) + (T / D) + (MMF / D) / [rr + (ER / D) + (C / D)]
Once you calculate M2, multiply it by the change in MB to calculate the change in the MS, specificallyin M2, just as you did in Exercise 2. Notice that the denominator of the m2 equation is the same as them1 equation but that we have added the time and money market ratios to the numerator. So M2 is al-ways[1] > m1, ceteris paribus, which makes sense when you recall that M2 is composed of M1 plus otherforms of money. To verify this, recall that we calculated m1 as 2.6316 when
Required reserves (rr) = .2Currency in circulation = $100 millionDeposits = $400 millionExcess reserves = $10 millionWe’ll now add time deposits of $900 million and money market funds of $800 million and calcu-
late M2:
m2 = 1 + (C / D) + (T / D) + (MMF / D) / [rr + (ER / D) + (C / D)]
m2 = 1 + (100 / 400) + (900 / 400) + (800 / 400) / [.2 + (10 / 400) + (100 / 400)]
m2 = 1 + .25 + 2.25 + 2 / (.2 + .005 + .25)
m2 = 5.5 / .455 = 12.0879
This is quite a bit higher than m1 because time deposits and money market funds are not subject to re-serve requirements, so they can expand more than checkable deposits because there is less drag onthem during the multiple expansion process.
Practice calculating the M2 money multiplier on your own in the exercise.
180 MONEY AND BANKING
E X E R C I S E
1. Calculate the M2 money multiplier using the following formula: M2 = 1 + (C/D) + (T/D) + (MMF/D)/[rr +(ER/D) + (C/D)].
Currency Deposits ExcessReserves
Required ReserveRatio
TimeDeposits
Money MarketFunds
Answer:M2
100 100 10 0.1 1,000 1,000 18.33
100 100 10 0.2 1,000 100 10
100 100 10 0.2 100 1,000 10
1,000 100 10 0.2 1,000 1,000 3.01
1,000 100 50 0.2 1,000 1,000 2.90
100 1,000 50 0.2 1,000 1,000 8.86
100 1,000 0 1 1,000 1,000 2.82
100 1 10 0.1 1,000 1,000 19.08
K E Y T A K E A W A Y S
< Because M1 is part of M2, M2 is always > M1 (except in the rare case where time deposits and moneymarket funds = 0, in which case M1 = M2).
< That fact is reflected in the inclusion of the time deposit and money market fund ratios in the numerator ofthe M2 multiplier equation.
< Moreover, no reserves are required for time and money market funds, so they will have more multipleexpansion than checkable deposits will.
< The required reserve ratio, the excess reserve ratio, and the currency ratio appear in the denominator ofthe m1 and M2 money multipliers because all three slow the multiple deposit creation process. The higherthe reserve ratios (required and excess), the smaller the sum available to make loans from a given deposit.The more cash, the smaller the deposit.
< The currency, time deposit, and money market mutual fund ratios are in the numerator of the M2 moneymultiplier because M2 is composed of currency, checkable deposits, time deposits, and money marketmutual funds.
3. SUMMARY AND EXPLANATION
L E A R N I N G O B J E C T I V E
1. How do central banks, banks, depositors, and borrowers influence the money supply?
By way of summary, Figure 15.5 explains why each of the major variables influences m1 and m2 in theways implied by the equations presented above.
CHAPTER 15 THE MONEY SUPPLY AND THE MONEY MULTIPLIER 181
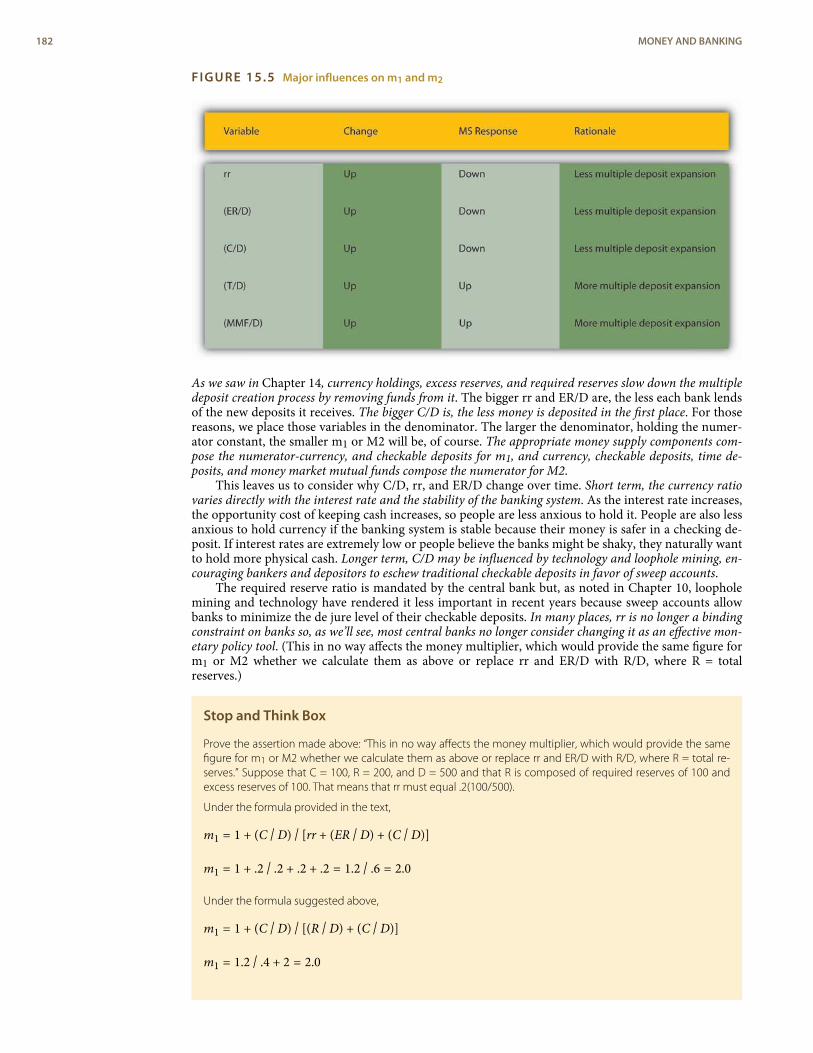
FIGURE 15.5 Major influences on m1 and m2
As we saw in Chapter 14, currency holdings, excess reserves, and required reserves slow down the multipledeposit creation process by removing funds from it. The bigger rr and ER/D are, the less each bank lendsof the new deposits it receives. The bigger C/D is, the less money is deposited in the first place. For thosereasons, we place those variables in the denominator. The larger the denominator, holding the numer-ator constant, the smaller m1 or M2 will be, of course. The appropriate money supply components com-pose the numerator-currency, and checkable deposits for m1, and currency, checkable deposits, time de-posits, and money market mutual funds compose the numerator for M2.
This leaves us to consider why C/D, rr, and ER/D change over time. Short term, the currency ratiovaries directly with the interest rate and the stability of the banking system. As the interest rate increases,the opportunity cost of keeping cash increases, so people are less anxious to hold it. People are also lessanxious to hold currency if the banking system is stable because their money is safer in a checking de-posit. If interest rates are extremely low or people believe the banks might be shaky, they naturally wantto hold more physical cash. Longer term, C/D may be influenced by technology and loophole mining, en-couraging bankers and depositors to eschew traditional checkable deposits in favor of sweep accounts.
The required reserve ratio is mandated by the central bank but, as noted in Chapter 10, loopholemining and technology have rendered it less important in recent years because sweep accounts allowbanks to minimize the de jure level of their checkable deposits. In many places, rr is no longer a bindingconstraint on banks so, as we’ll see, most central banks no longer consider changing it as an effective mon-etary policy tool. (This in no way affects the money multiplier, which would provide the same figure form1 or M2 whether we calculate them as above or replace rr and ER/D with R/D, where R = totalreserves.)
Stop and Think Box
Prove the assertion made above: “This in no way affects the money multiplier, which would provide the samefigure for m1 or M2 whether we calculate them as above or replace rr and ER/D with R/D, where R = total re-serves.” Suppose that C = 100, R = 200, and D = 500 and that R is composed of required reserves of 100 andexcess reserves of 100. That means that rr must equal .2(100/500).
Under the formula provided in the text,
m1 = 1 + (C / D) / [rr + (ER / D) + (C / D)]
m1 = 1 + .2 / .2 + .2 + .2 = 1.2 / .6 = 2.0
Under the formula suggested above,
m1 = 1 + (C / D) / [(R / D) + (C / D)]
m1 = 1.2 / .4 + 2 = 2.0
182 MONEY AND BANKING
Excess reserves (or just reserves in a system without required reserves) are inversely related to the interestrate. In the early 1960s and early 2000s, when the interest rate was well less than 5 percent, ER/D washigh, at .003 to .004. In the 1970s and 1980s, when interest rates were 10 percent and higher, ER/Ddropped to .001 to .002. As we learned in Chapter 9, expected deposit outflows directly affect excess re-serve levels as banks stock up on reserves to meet the outflows. When uncertainty is high or a bankingcrisis is in progress or appears imminent, bankers will increase ER to protect their banks.
In summary, the central bank influences the money supply by controlling the monetary base and,to a far lesser extent, the required reserve ratio. Depositors, banks, and borrowers influence the moneysupply by influencing m1 and M2, specifically by determining the money multiplier, with depositorslargely in control of C/D; depositors and banks interacting via deposit outflow expectations to determ-ine E/R; and borrowers, depositors, banks, and the central bank interacting to determine interest ratesand hence to some extent both C/D and E/R.
K E Y T A K E A W A Y S
< Central banks control MB and rr, and affect interest rates, which in turn affect C/D and ER/D.
< Depositors determine C/D by deciding how much cash versus deposits to hold. They also influenceinterest rates.
< Banks influence interest rates and determine ER/D by deciding how many excess reserves to hold in theface of expected deposit outflows and interest rates.
< Borrowers influence the interest rate and hence to some extent C/D and ER/D.
4. SUGGESTED READINGMacesich, George. The Money Supply Process: A Comparative Analysis. New York: Praeger, 1999.
CHAPTER 15 THE MONEY SUPPLY AND THE MONEY MULTIPLIER 183

1.
ENDNOTES
M2 would equal m1 iff T = 0 and MMF = 0, which is highly unlikely. Note: iff means ifand only if.
184 MONEY AND BANKING
C H A P T E R 1 6Monetary Policy Tools
C H A P T E R O B J E C T I V E S
By the end of this chapter, students should be able to:
1. List and assess the strengths and weaknesses of the three primary monetary policy tools thatcentral banks have at their disposal.
2. Describe the federal funds market and explain its importance.
3. Explain how the Fed influences the equilibrium fed funds rate to move toward its target rate.
4. Explain the purpose of the Fed’s discount window and other lending facilities.
5. Compare and contrast the monetary policy tools of central banks worldwide to those of theFed.
1. THE FEDERAL FUNDS MARKET AND RESERVES
L E A R N I N G O B J E C T I V E S
1. What three monetary policy tools do central banks have at their disposal?2. What are the strengths and weaknesses of each? What is the federal funds market and why is it
important?
Central banks have three primary tools for influencing the money supply: the reserve requirement, dis-count loans, and open market operations. The first, as we saw in Chapter 14 and Chapter 15, worksthrough the money multiplier, constraining multiple deposit expansion the larger it becomes. Centralbanks today rarely use it because most banks work around reserve requirements. The second and thirdtools influence the monetary base (MB = C + R). Discount loans depend on banks (or nonbank bor-rowers, where applicable) first borrowing from, then repaying loans to, the central bank, which there-fore does not have precise control over MB. Open market operations (OMO) are generally preferred asa policy tool because the central bank can easily expand or contract MB to a precise level. Using OMO,central banks can also reverse mistakes quickly.
In the United States, under typical conditions, the Fed conducts monetary policy primarily throughthe federal funds (fed funds) market, an overnight market where banks that need reserves can borrowthem from banks that hold reserves they don’t need. Banks can also borrow their reserves directly fromthe Fed, but, except during crises, most prefer not to because the Fed’s discount rate is generally higherthan the federal funds rate. Also, borrowing too much, too often from the Fed can induce increasedregulatory scrutiny. So usually banks get their overnight funds from the fed funds market, which, asFigure 16.1 shows, pretty much works like any other market.
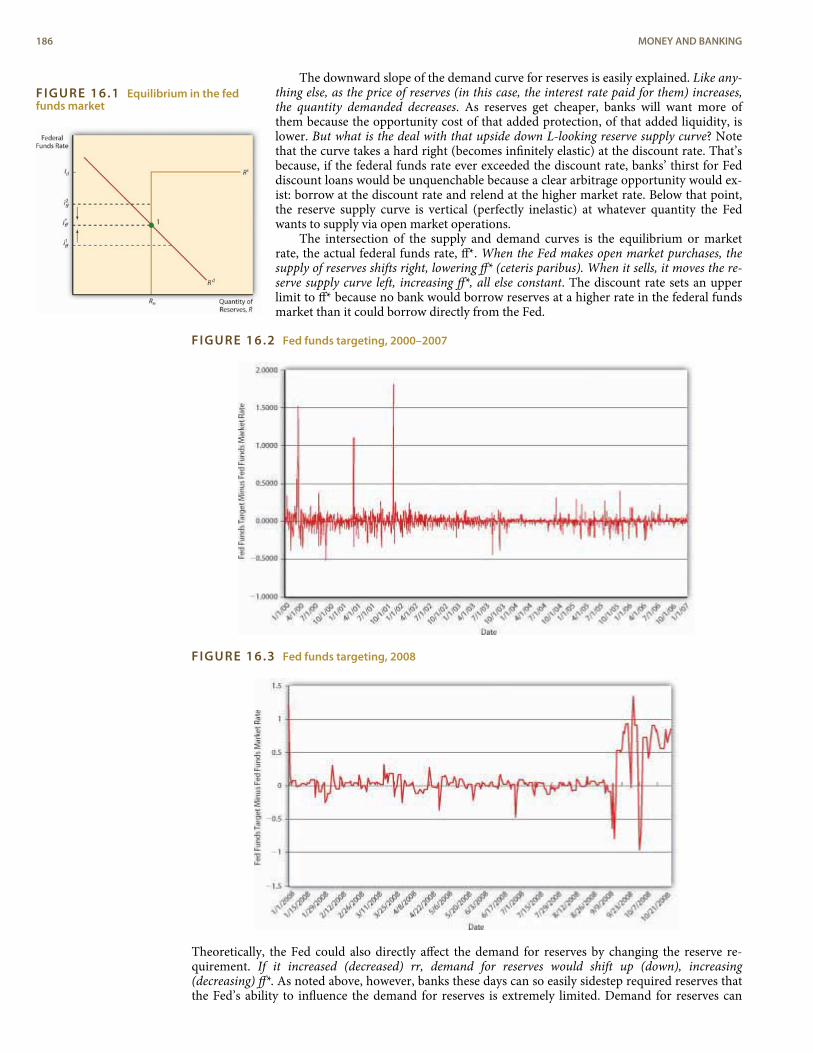
FIGURE 16.1 Equilibrium in the fedfunds market
The downward slope of the demand curve for reserves is easily explained. Like any-thing else, as the price of reserves (in this case, the interest rate paid for them) increases,the quantity demanded decreases. As reserves get cheaper, banks will want more ofthem because the opportunity cost of that added protection, of that added liquidity, islower. But what is the deal with that upside down L-looking reserve supply curve? Notethat the curve takes a hard right (becomes infinitely elastic) at the discount rate. That’sbecause, if the federal funds rate ever exceeded the discount rate, banks’ thirst for Feddiscount loans would be unquenchable because a clear arbitrage opportunity would ex-ist: borrow at the discount rate and relend at the higher market rate. Below that point,the reserve supply curve is vertical (perfectly inelastic) at whatever quantity the Fedwants to supply via open market operations.
The intersection of the supply and demand curves is the equilibrium or marketrate, the actual federal funds rate, ff*. When the Fed makes open market purchases, thesupply of reserves shifts right, lowering ff* (ceteris paribus). When it sells, it moves the re-serve supply curve left, increasing ff*, all else constant. The discount rate sets an upperlimit to ff* because no bank would borrow reserves at a higher rate in the federal fundsmarket than it could borrow directly from the Fed.
FIGURE 16.2 Fed funds targeting, 2000–2007
FIGURE 16.3 Fed funds targeting, 2008
Theoretically, the Fed could also directly affect the demand for reserves by changing the reserve re-quirement. If it increased (decreased) rr, demand for reserves would shift up (down), increasing(decreasing) ff*. As noted above, however, banks these days can so easily sidestep required reserves thatthe Fed’s ability to influence the demand for reserves is extremely limited. Demand for reserves can
186 MONEY AND BANKING
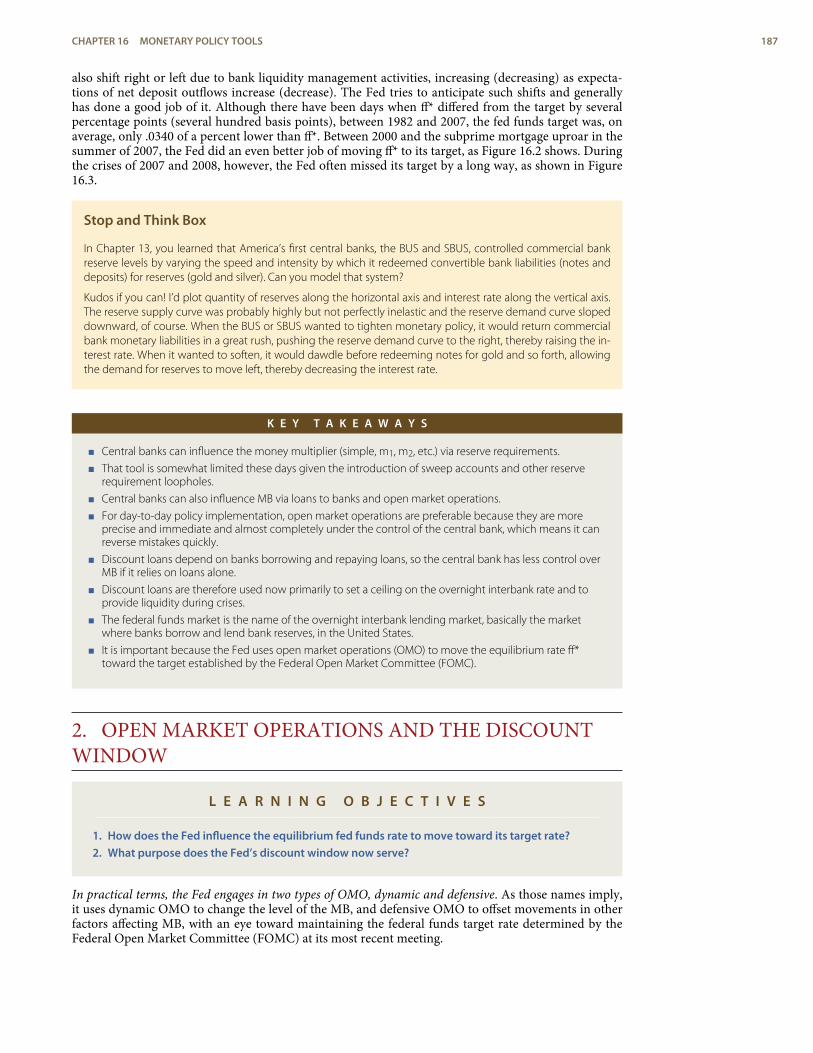
also shift right or left due to bank liquidity management activities, increasing (decreasing) as expecta-tions of net deposit outflows increase (decrease). The Fed tries to anticipate such shifts and generallyhas done a good job of it. Although there have been days when ff* differed from the target by severalpercentage points (several hundred basis points), between 1982 and 2007, the fed funds target was, onaverage, only .0340 of a percent lower than ff*. Between 2000 and the subprime mortgage uproar in thesummer of 2007, the Fed did an even better job of moving ff* to its target, as Figure 16.2 shows. Duringthe crises of 2007 and 2008, however, the Fed often missed its target by a long way, as shown in Figure16.3.
Stop and Think Box
In Chapter 13, you learned that America’s first central banks, the BUS and SBUS, controlled commercial bankreserve levels by varying the speed and intensity by which it redeemed convertible bank liabilities (notes anddeposits) for reserves (gold and silver). Can you model that system?
Kudos if you can! I’d plot quantity of reserves along the horizontal axis and interest rate along the vertical axis.The reserve supply curve was probably highly but not perfectly inelastic and the reserve demand curve slopeddownward, of course. When the BUS or SBUS wanted to tighten monetary policy, it would return commercialbank monetary liabilities in a great rush, pushing the reserve demand curve to the right, thereby raising the in-terest rate. When it wanted to soften, it would dawdle before redeeming notes for gold and so forth, allowingthe demand for reserves to move left, thereby decreasing the interest rate.
K E Y T A K E A W A Y S
< Central banks can influence the money multiplier (simple, m1, m2, etc.) via reserve requirements.
< That tool is somewhat limited these days given the introduction of sweep accounts and other reserverequirement loopholes.
< Central banks can also influence MB via loans to banks and open market operations.
< For day-to-day policy implementation, open market operations are preferable because they are moreprecise and immediate and almost completely under the control of the central bank, which means it canreverse mistakes quickly.
< Discount loans depend on banks borrowing and repaying loans, so the central bank has less control overMB if it relies on loans alone.
< Discount loans are therefore used now primarily to set a ceiling on the overnight interbank rate and toprovide liquidity during crises.
< The federal funds market is the name of the overnight interbank lending market, basically the marketwhere banks borrow and lend bank reserves, in the United States.
< It is important because the Fed uses open market operations (OMO) to move the equilibrium rate ff*toward the target established by the Federal Open Market Committee (FOMC).
2. OPEN MARKET OPERATIONS AND THE DISCOUNTWINDOW
L E A R N I N G O B J E C T I V E S
1. How does the Fed influence the equilibrium fed funds rate to move toward its target rate?2. What purpose does the Fed’s discount window now serve?
In practical terms, the Fed engages in two types of OMO, dynamic and defensive. As those names imply,it uses dynamic OMO to change the level of the MB, and defensive OMO to offset movements in otherfactors affecting MB, with an eye toward maintaining the federal funds target rate determined by theFederal Open Market Committee (FOMC) at its most recent meeting.
CHAPTER 16 MONETARY POLICY TOOLS 187
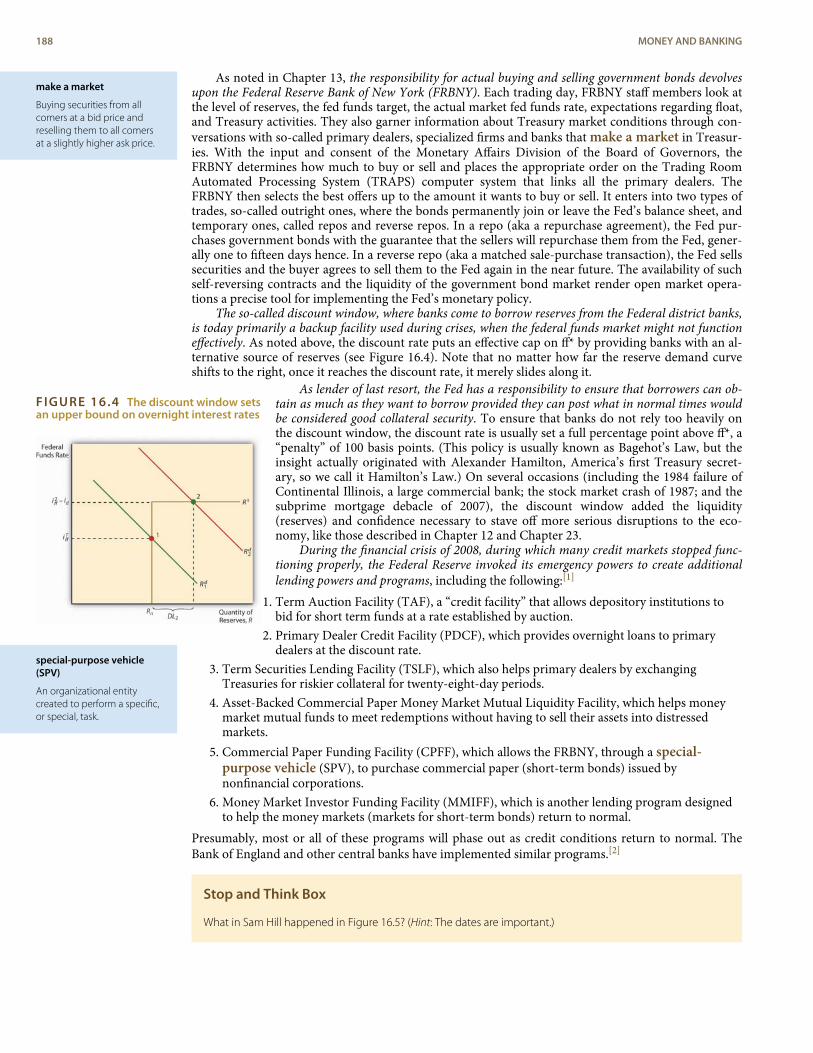
make a market
Buying securities from allcomers at a bid price andreselling them to all comersat a slightly higher ask price.
FIGURE 16.4 The discount window setsan upper bound on overnight interest rates
special-purpose vehicle(SPV)
An organizational entitycreated to perform a specific,or special, task.
As noted in Chapter 13, the responsibility for actual buying and selling government bonds devolvesupon the Federal Reserve Bank of New York (FRBNY). Each trading day, FRBNY staff members look atthe level of reserves, the fed funds target, the actual market fed funds rate, expectations regarding float,and Treasury activities. They also garner information about Treasury market conditions through con-versations with so-called primary dealers, specialized firms and banks that make a market in Treasur-ies. With the input and consent of the Monetary Affairs Division of the Board of Governors, theFRBNY determines how much to buy or sell and places the appropriate order on the Trading RoomAutomated Processing System (TRAPS) computer system that links all the primary dealers. TheFRBNY then selects the best offers up to the amount it wants to buy or sell. It enters into two types oftrades, so-called outright ones, where the bonds permanently join or leave the Fed’s balance sheet, andtemporary ones, called repos and reverse repos. In a repo (aka a repurchase agreement), the Fed pur-chases government bonds with the guarantee that the sellers will repurchase them from the Fed, gener-ally one to fifteen days hence. In a reverse repo (aka a matched sale-purchase transaction), the Fed sellssecurities and the buyer agrees to sell them to the Fed again in the near future. The availability of suchself-reversing contracts and the liquidity of the government bond market render open market opera-tions a precise tool for implementing the Fed’s monetary policy.
The so-called discount window, where banks come to borrow reserves from the Federal district banks,is today primarily a backup facility used during crises, when the federal funds market might not functioneffectively. As noted above, the discount rate puts an effective cap on ff* by providing banks with an al-ternative source of reserves (see Figure 16.4). Note that no matter how far the reserve demand curveshifts to the right, once it reaches the discount rate, it merely slides along it.
As lender of last resort, the Fed has a responsibility to ensure that borrowers can ob-tain as much as they want to borrow provided they can post what in normal times wouldbe considered good collateral security. To ensure that banks do not rely too heavily onthe discount window, the discount rate is usually set a full percentage point above ff*, a“penalty” of 100 basis points. (This policy is usually known as Bagehot’s Law, but theinsight actually originated with Alexander Hamilton, America’s first Treasury secret-ary, so we call it Hamilton’s Law.) On several occasions (including the 1984 failure ofContinental Illinois, a large commercial bank; the stock market crash of 1987; and thesubprime mortgage debacle of 2007), the discount window added the liquidity(reserves) and confidence necessary to stave off more serious disruptions to the eco-nomy, like those described in Chapter 12 and Chapter 23.
During the financial crisis of 2008, during which many credit markets stopped func-tioning properly, the Federal Reserve invoked its emergency powers to create additionallending powers and programs, including the following:[1]
1. Term Auction Facility (TAF), a “credit facility” that allows depository institutions tobid for short term funds at a rate established by auction.
2. Primary Dealer Credit Facility (PDCF), which provides overnight loans to primarydealers at the discount rate.
3. Term Securities Lending Facility (TSLF), which also helps primary dealers by exchangingTreasuries for riskier collateral for twenty-eight-day periods.
4. Asset-Backed Commercial Paper Money Market Mutual Liquidity Facility, which helps moneymarket mutual funds to meet redemptions without having to sell their assets into distressedmarkets.
5. Commercial Paper Funding Facility (CPFF), which allows the FRBNY, through a special-purpose vehicle (SPV), to purchase commercial paper (short-term bonds) issued bynonfinancial corporations.
6. Money Market Investor Funding Facility (MMIFF), which is another lending program designedto help the money markets (markets for short-term bonds) return to normal.
Presumably, most or all of these programs will phase out as credit conditions return to normal. TheBank of England and other central banks have implemented similar programs.[2]
Stop and Think Box
What in Sam Hill happened in Figure 16.5? (Hint: The dates are important.)
188 MONEY AND BANKING
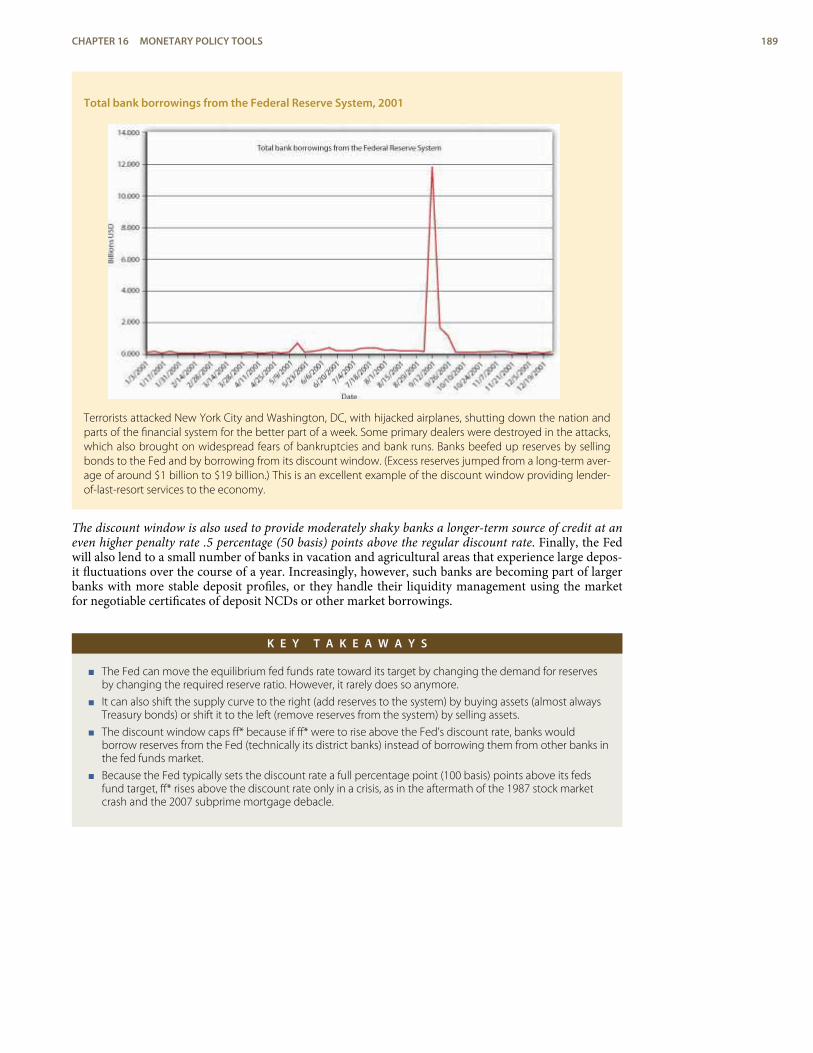
Total bank borrowings from the Federal Reserve System, 2001
Terrorists attacked New York City and Washington, DC, with hijacked airplanes, shutting down the nation andparts of the financial system for the better part of a week. Some primary dealers were destroyed in the attacks,which also brought on widespread fears of bankruptcies and bank runs. Banks beefed up reserves by sellingbonds to the Fed and by borrowing from its discount window. (Excess reserves jumped from a long-term aver-age of around $1 billion to $19 billion.) This is an excellent example of the discount window providing lender-of-last-resort services to the economy.
The discount window is also used to provide moderately shaky banks a longer-term source of credit at aneven higher penalty rate .5 percentage (50 basis) points above the regular discount rate. Finally, the Fedwill also lend to a small number of banks in vacation and agricultural areas that experience large depos-it fluctuations over the course of a year. Increasingly, however, such banks are becoming part of largerbanks with more stable deposit profiles, or they handle their liquidity management using the marketfor negotiable certificates of deposit NCDs or other market borrowings.
K E Y T A K E A W A Y S
< The Fed can move the equilibrium fed funds rate toward its target by changing the demand for reservesby changing the required reserve ratio. However, it rarely does so anymore.
< It can also shift the supply curve to the right (add reserves to the system) by buying assets (almost alwaysTreasury bonds) or shift it to the left (remove reserves from the system) by selling assets.
< The discount window caps ff* because if ff* were to rise above the Fed’s discount rate, banks wouldborrow reserves from the Fed (technically its district banks) instead of borrowing them from other banks inthe fed funds market.
< Because the Fed typically sets the discount rate a full percentage point (100 basis) points above its fedsfund target, ff* rises above the discount rate only in a crisis, as in the aftermath of the 1987 stock marketcrash and the 2007 subprime mortgage debacle.
CHAPTER 16 MONETARY POLICY TOOLS 189
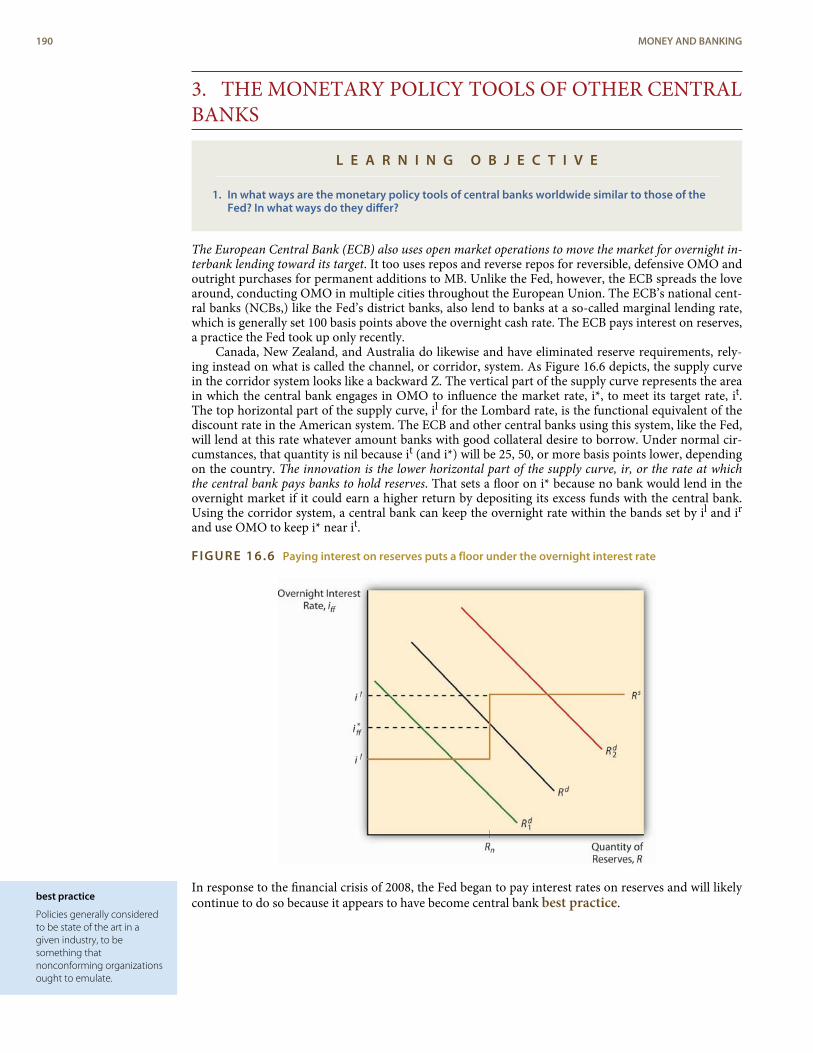
best practice
Policies generally consideredto be state of the art in agiven industry, to besomething thatnonconforming organizationsought to emulate.
3. THE MONETARY POLICY TOOLS OF OTHER CENTRALBANKS
L E A R N I N G O B J E C T I V E
1. In what ways are the monetary policy tools of central banks worldwide similar to those of theFed? In what ways do they differ?
The European Central Bank (ECB) also uses open market operations to move the market for overnight in-terbank lending toward its target. It too uses repos and reverse repos for reversible, defensive OMO andoutright purchases for permanent additions to MB. Unlike the Fed, however, the ECB spreads the lovearound, conducting OMO in multiple cities throughout the European Union. The ECB’s national cent-ral banks (NCBs,) like the Fed’s district banks, also lend to banks at a so-called marginal lending rate,which is generally set 100 basis points above the overnight cash rate. The ECB pays interest on reserves,a practice the Fed took up only recently.
Canada, New Zealand, and Australia do likewise and have eliminated reserve requirements, rely-ing instead on what is called the channel, or corridor, system. As Figure 16.6 depicts, the supply curvein the corridor system looks like a backward Z. The vertical part of the supply curve represents the areain which the central bank engages in OMO to influence the market rate, i*, to meet its target rate, it.The top horizontal part of the supply curve, il for the Lombard rate, is the functional equivalent of thediscount rate in the American system. The ECB and other central banks using this system, like the Fed,will lend at this rate whatever amount banks with good collateral desire to borrow. Under normal cir-cumstances, that quantity is nil because it (and i*) will be 25, 50, or more basis points lower, dependingon the country. The innovation is the lower horizontal part of the supply curve, ir, or the rate at whichthe central bank pays banks to hold reserves. That sets a floor on i* because no bank would lend in theovernight market if it could earn a higher return by depositing its excess funds with the central bank.Using the corridor system, a central bank can keep the overnight rate within the bands set by il and irand use OMO to keep i* near it.
FIGURE 16.6 Paying interest on reserves puts a floor under the overnight interest rate
In response to the financial crisis of 2008, the Fed began to pay interest rates on reserves and will likelycontinue to do so because it appears to have become central bank best practice.
190 MONEY AND BANKING
K E Y T A K E A W A Y S
< Most central banks now use OMO instead of discount loans or reserve requirement adjustments forconducting day-to-day monetary policy.
< Some central banks, including those of the euro zone and the British Commonwealth (Canada, Australia,and New Zealand) have developed an ingenious new method called the channel or corridor system.
< Under that system, the central bank conducts OMO to get the overnight interbank lending rate near thecentral bank’s target, as the Fed does in the United States.
< That market rate is capped at both ends, however: on the upper end by the discount (aka Lombard) rate,and at the lower end by the reserve rate, the interest rate the central bank pays to banks for holdingreserves.
< The market overnight rate can never dip below that rate because banks would simply invest their extrafunds in the central bank rather than lend them to other banks at a lower rate.
< During the financial crisis of 2008, the Fed adopted the corridor system by paying interest on reserves.
4. SUGGESTED READINGHetzel, Robert L. The Monetary Policy of the Federal Reserve: A History. New York: Cambridge
University Press, 2008.Mishkin, Frederic S. Monetary Policy Strategy. Cambridge, MA: MIT Press, 2007.
CHAPTER 16 MONETARY POLICY TOOLS 191

1.
2.ENDNOTES
http://www.federalreserve.gov/monetarypolicy/
“Credit Markets: A Lifeline for Banks. The Bank of England’s Bold Initiative ShouldCalm Frayed Financial Nerves,” The Economist, April 26, 2008, 74–75.
192 MONEY AND BANKING
C H A P T E R 1 7Monetary Policy Targets andGoals
C H A P T E R O B J E C T I V E S
By the end of this chapter, students should be able to:
1. Explain why the Fed was generally so ineffective before the late 1980s.
2. Explain why macroeconomic volatility declined from the late 1980s until 2008.
3. List the trade-offs that central banks face and describe how they confront them.
4. Define monetary targeting and explain why it succeeded in some countries and failed inothers.
5. Define inflation targeting and explain its importance.
6. Provide and use the Taylor Rule and explain its importance.
1. A SHORT HISTORY OF FED BLUNDERS
L E A R N I N G O B J E C T I V E S
1. Why was the Fed generally so ineffective before the late 1980s?2. Why has macroeconomic volatility declined since the late 1980s?
The long and salutary reign of Greenspan the Great (1987–2006)[1] and the auspicious beginning of therule of Bernanke the Bald (2006–present)[2] temporarily provided the Fed with something it has rarelyenjoyed in its nearly century-long existence, the halo of success and widespread approbation. While itwould be an exaggeration to call Federal Reserve Board members the Keystone Kops of monetarypolicy, the Fed’s history, a taste of which we’ve already indulged ourselves with in Chapter 11, is moresour than sweet. Central banks are, after all, the last bastions of central planning in otherwise free marketeconomies. And central planning, as the Communists and the Austrian economists who critiqued themdiscovered, is darn difficult.[3]
This is not a history textbook, but the past can often shed light on the present. History warns us tobeware of claims of infallibility. In this case, however, it also provides us with a clear reason to be op-timistic. Between 1985 or so and 2007, the U.S. macroeconomy, particularly output, was much less volat-ile than previously. That was a happy development for the Fed because, as noted in Chapter 13, centralbanks are generally charged with stabilizing the macroeconomy, among other things. The Fed in par-ticular owes its genesis to the desire of Americans to be shielded from financial panics and economiccrises.
The Fed itself took credit for almost 60 percent of the reduction in volatility. (Is anyone surprised bythis? Don’t we all embrace responsibility for good outcomes, but eschew it when things turn ugly?)Skeptics point to other causes for the Great Calm, including dumb luck; less volatile oil prices (the1970s were a difficult time in this regard);[4] less volatile total factor productivity growth;[5] and im-provements in management, especially just-in-time inventory techniques, which has helped to reducethe inventory gluts of yore.[6] Those factors all played roles, but it also appears that the Fed’s monetarypolicies actually improved. Before Paul Volcker (1979–1987), the Fed engaged in pro-cyclical monetarypolicies. Since then, it has tried to engage in anti-cyclical policies. And that, as poet Robert Frost wrotein “The Road Not Taken,” has made all the difference.[7]
For reasons that are still not clearly understood, economies have a tendency to cycle through peri-ods of boom and bust, of expansion and contraction. The Fed used to exacerbate this cycle by making
the highs of the business cycle higher and the lows lower than they would otherwise have been. Yes, thatran directly counter to one of its major missions. Debates rage whether it was simply ineffective or if itpurposely made mistakes. It was probably a mixture of both that changed over time. In any event, weneedn’t “go there” because a simple narrative will suffice.
The Fed was conceived in peace but born in war. As William Silber[8] points out in his book WhenWashington Shut Down Wall Street, the Federal Reserve was rushed into operation to help the U.S. fin-ancial system, which had been terribly shocked, economically as well as politically, by the outbreak ofthe Great War (1914–1918) in Europe.[9] At first, the Fed influenced the monetary base (MB) throughits rediscounts—it literally discounted again business commercial paper already discounted by com-mercial banks. A wholesaler would take a bill owed by one of its customers, say, a department store likeWanamaker’s, to its bank. The bank might give $9,950 for a $10,000 bill due in sixty days. If, say, thirtydays later the bank needed to boost its reserves, it would take the bill to the Fed, which would redis-count it by giving the bank, say, $9,975 in cash for it. The Fed would then collect the $10,000 when itfell due. In the context of World War I, this policy was inflationary, leading to double-digit price in-creases in 1919 and 1920. The Fed responded by raising the discount rate from 4.75 to 7 percent, settingoff a sharp recession.
The postwar recession hurt the Fed’s revenues because the volume of rediscounts shrank precipit-ously. It responded by investing in securities and, in so doing, accidentally stumbled upon open marketoperations. The Fed fed the speculative asset bubble of the late 1920s, then sat on its hands while theeconomy crashed and burned in the early 1930s. Here’s another tidbit: it also exacerbated the so-calledRoosevelt Recession of 1937–1938 by playing with fire, by raising the reserve requirement, a new policyplaced in its hands by FDR and his New Dealers in the Banking Act of 1935.
During World War II, the Fed became the Treasury’s lapdog. Okay, that is an exaggeration, butnot much of one. The Treasury said thou shalt purchase our bonds to keep the prices up (and yieldsdown) and the Fed did, basically monetizing the national debt. In short, the Fed wasn’t very independentin this period. Increases in demand, coupled with quantity rationing, kept the lid on inflation duringthe titanic conflict against Fascism, but after the war the floodgates of inflation opened. Over the courseof just three years, 1946, 1947, and 1948, the price level jumped some 30 percent. There was no netchange in prices in 1949 and 1950, but the start of the Korean War sent prices up another almost 8 per-cent in 1951, and the Fed finally got some backbone and stopped pegging interest rates. As our analysisof central bank independence in Chapter 13 suggests, inflation dropped big time, to 2.19 percent in1952, and to less than 1 percent in 1953 and 1954. In 1955, prices actually dropped slightly, on average.
This is not to say, however, that the Fed was a fully competent central bank because it continued toexacerbate the business cycle instead of ameliorating it. Basically, wealth would increase (decrease),driving interest rates (as we learned in Chapter 5) up (down), inducing the Fed to buy (sell) bonds,thereby increasing (decreasing) MB and thus the money supply (MS). So when the economy was natur-ally expanding, the Fed stoked its fires and when it was contracting, the Fed put its foot on its head.Worse, if interest rates rose (bond prices declined) due to an increase in inflation (think Fisher Equa-tion), the Fed would also buy bonds to support their prices, thereby increasing the MS and causing yetfurther inflation. This, as much as oil price hikes, caused the Great Inflation of the 1970s. Throughoutthe crises of the 1970s and 1980s, the Fed toyed around with various targets (M1, M2, fed funds rate), butnone of it mattered much because its pro-cyclical bias remained.
Stop and Think Box
Another blunder made by the Fed was Reg Q, which capped the interest rates that banks could pay on depos-its. When the Great Inflation began in the late 1960s, nominal interest rates rose (think Fisher Equation) abovethose set by the Fed. What horror directly resulted? What Fed goal was thereby impeded?
Shortages known as credit crunches resulted. Whenever p* > preg, shortages result because the quantity de-manded exceeds the quantity supplied by the market. Banks couldn’t make loans because they couldn’t at-tract the deposits they needed to fund them. That created much the same effect as high interestrates—entrepreneurs couldn’t obtain financing for good business ideas, so they wallowed, decreasing eco-nomic activity. In response, banks engaged in the loophole mining discussed in Chapter 8.
By the late 1980s, the Fed, under Alan Greenspan, finally began to engage in anti-cyclical policies, to“lean into the wind” by raising the federal funds rate before inflation became a problem and by loweringthe federal funds rate at the first sign of recession. Since the implementation of this crucial insight, thenatural swings of the macroeconomy have been much more docile than hitherto, until the crisis of2007–2008, that is. The United States experienced two recessions (July 1990–March 1991 and March2001–November 2001)[10] but they were so-called soft landings, that is, short and shallow. Expansionshave been longer than usual and not so intense. Again, some of this might be due to dumb luck (no
194 MONEY AND BANKING
time inconsistencyproblem
Whenever somebody’spreferences change overtime to such an extent thatwhat is preferred at one timebecomes inconsistent withwhat is preferred at anothertime.
major wars, low real oil prices [until summer 2008 that is]) and better technology, but there is littledoubt the Fed played an important role in the stabilization.
Of course, past performance is no guarantee of future performance. (Just look at the New YorkKnicks.) As the crisis of 2007–2008 approached, the Fed resembled a fawn trapped in the headlights ofan oncoming eighteen-wheeler, too afraid to continue on its path of raising interest rates and equallyfrightened of reversing course. The result was an economy that looked like road kill. Being a centralbanker is a bit like being Goldilocks. It’s important to get monetary policy just right, lest we wake upstaring down the gullets of three hungry bears. (I don’t mean Stephen Colbert’s bears[11] here, butrather bear markets.)
K E Y T A K E A W A Y S
< The Fed was generally ineffective before the late 1980s because it engaged in pro-cyclical monetarypolicies, expanding the MS and lowering interest rates during expansions and constricting the MS andraising interest rates during recessions, the exact opposite of what it should have done.
< The Fed was also ineffective because it did not know about open market operations (OMO) at first,because it did not realize the damage its toying with rr could cause after New Dealers gave it control ofreserve requirements, and because it gave up its independence to the Treasury during World War II.
< Also, in the 1970s, it targeted monetary aggregates, although its main policy tool was an interest rate.
< The Fed’s switch from pro-cyclical to anti-cyclical monetary policy, where it leans into the wind rather thanrunning with it, played an important role in decreased macroeconomic volatility, although it perhapscannot take all of the credit because changes in technology, particularly inventory control, and other luckyevents conspired to help improve macro stability over the same period.
< Future events will reveal if central banking has truly and permanently improved.
2. CENTRAL BANK GOAL TRADE-OFFS
L E A R N I N G O B J E C T I V E
1. What trade-offs do central banks face and how do they confront them?
Central banks worldwide often find themselves between a rock and a hard place. The rock is price sta-bility (inflation control) and the hard place is economic growth and employment. Although in the longrun the two goals are perfectly compatible, in the short run, they sometimes are not. In those instances,the central bank has a difficult decision to make. Should it raise interest rates or slow or even stop MSgrowth to stave off inflation, or should it decrease interest rates or speed up MS growth to induce compan-ies and consumers to borrow, thereby stoking employment and growth? In some places, like theEuropean Union, the central bank is instructed by its charter to stop inflation. “The primary objectiveof the European System of Central Banks,” the Maastricht Treaty clearly states, “shall be to maintainprice stability. Without prejudice to the objective of price stability, the ESCB shall support the generaleconomic policies in the Community” including high employment and economic growth. The Fed’scharter, by contrast, gives the Fed a dual mandate to ensure price stability and maximum employment.Little wonder that the Fed has not held the line on inflation as well as the European Central Bank(ECB), but unemployment rates in the United States are generally well below those of most Europeannations. (There are additional reasons for that difference that are not germane to the discussion here.)
Stop and Think Box
When central banks act as a lender of last resort (LLR) to restore stability to the financial system, they create atime inconsistency problem. Can you identify what it is? (Hint: It involves moral hazard.)
It is believed that if a central bank or other lender of last resort, like the International Monetary Fund, steps intoo often, it creates a moral hazard problem because businesses, including banks, take on extra risks safe in theknowledge that if the system gets in trouble, prompt and effective aid will be forthcoming. This is time incon-sistent because, by stopping one panic or crisis, the central bank plants the seeds for the next.
Do note that almost nobody wants 100 percent employment, when everyone who wants a job has one.A little unemployment, called frictional unemployment, is a good thing because it allows the labor
CHAPTER 17 MONETARY POLICY TARGETS AND GOALS 195
market to function more smoothly. So-called structural unemployment, when workers’ skills do notmatch job requirements, is not such a good thing, but is probably inevitable in a dynamic economysaddled with a weak educational system. (As structural unemployment increased in the United States,education improved somewhat, but not enough to ensure that all new jobs the economy created couldbe filled with domestic laborers.) So the Fed shoots for what is called the natural rate of unemployment.Nobody is quite sure what that rate is, but it is thought to be around 5 percent, give or take.
K E Y T A K E A W A Y S
< The main trade-off that central banks face is a short-term one between inflation, which calls for tighterpolicy (higher interest rates, slower money growth), and employment and output, which call for looserpolicy (lower interest rates, faster money growth).
< Some central banks confront trade-offs by explicitly stating that one goal, usually price stability (controllinginflation), is of paramount concern.
< Others, including the Fed, confront the trade-off on an ad hoc, case-by-case basis.
3. CENTRAL BANK TARGETS
L E A R N I N G O B J E C T I V E S
1. What is monetary targeting and why did it succeed in some countries and fail in others?2. What is inflation targeting and why is it important?
Once a central bank has decided whether it wants to hold the line (no change [Δ]), tighten (increase i, de-crease or slow the growth of MS), or ease (lower i, increase MS), it has to figure out how best to do so.Quite a gulf exists between the central bank’s goals (low inflation, high employment) and its tools orinstruments (OMO, discount loans, changing rr). So it sometimes creates a target between the two,some intermediate goal that it shoots for with its tools, with the expectation that hitting the target’sbull’s-eye would lead to goal satisfaction:
TOOLS→TARGET→GOAL
In the past, many central banks targeted monetary aggregates like M1 or M2. Some, like Germany’sBundesbank and Switzerland’s central bank, did so successfully. Others, like the Fed, the Bank of Japan,and the Bank of England, failed miserably. Their failure is partly explained by what economists call thetime inconsistency problem, the inability over time to follow a good plan consistently. (Weight-loss di-ets suffer from the time inconsistency problem, too, and every form of procrastination is essentiallytime inconsistent.) Basically, like a wayward dieter or a lazy student (rare animals to be sure), theyovershot their targets time and time again, preferring pleasure now at the cost of pain later.
Another major problem was that monetary targets did not always equate to the central banks’ goalsin any clear way. Long lags between policy implementation and real-world effects made it difficult toknow to what degree a policy was working—or not. Worse, the importance of specific aggregates as a de-terminant of interest rates and the price level waxed and waned over time in ways that proved difficult topredict. Finally, many central banks experienced a disjoint between their tools or operating instru-ments, which were often interest rates like the federal funds, and their monetary targets. It turns outthat one can’t control both an interest rate and a monetary aggregate at the same time. To see why, studyFigure 17.1. Note that if the central bank leaves the supply of money fixed, changes in the demand formoney will make the interest rate jiggle up and down. It can only keep i fixed by changing the moneysupply. Because open market operations are the easiest way to conduct monetary policy, most centralbanks, as we’ve seen, eventually changed reserves to maintain an interest rate target. With the monet-ary supply moving round and round, up and down, it became difficult to hit monetary targets.
196 MONEY AND BANKING
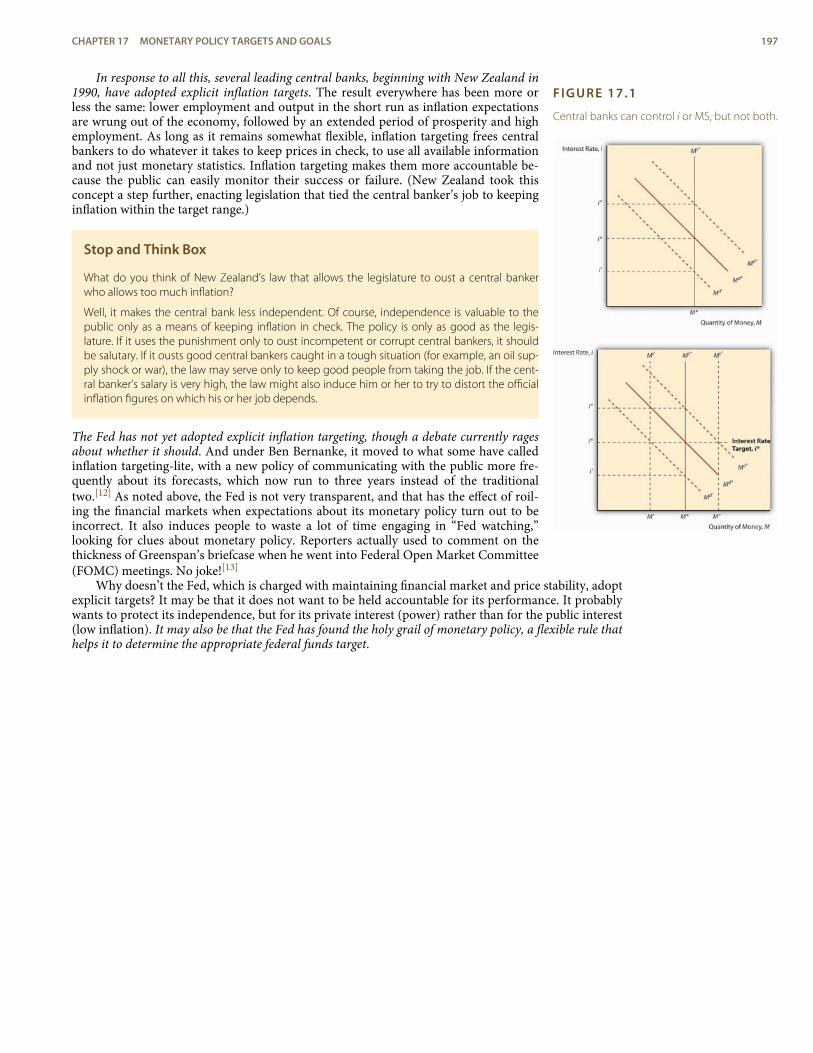
FIGURE 17.1
Central banks can control i or MS, but not both.
In response to all this, several leading central banks, beginning with New Zealand in1990, have adopted explicit inflation targets. The result everywhere has been more orless the same: lower employment and output in the short run as inflation expectationsare wrung out of the economy, followed by an extended period of prosperity and highemployment. As long as it remains somewhat flexible, inflation targeting frees centralbankers to do whatever it takes to keep prices in check, to use all available informationand not just monetary statistics. Inflation targeting makes them more accountable be-cause the public can easily monitor their success or failure. (New Zealand took thisconcept a step further, enacting legislation that tied the central banker’s job to keepinginflation within the target range.)
Stop and Think Box
What do you think of New Zealand’s law that allows the legislature to oust a central bankerwho allows too much inflation?
Well, it makes the central bank less independent. Of course, independence is valuable to thepublic only as a means of keeping inflation in check. The policy is only as good as the legis-lature. If it uses the punishment only to oust incompetent or corrupt central bankers, it shouldbe salutary. If it ousts good central bankers caught in a tough situation (for example, an oil sup-ply shock or war), the law may serve only to keep good people from taking the job. If the cent-ral banker’s salary is very high, the law might also induce him or her to try to distort the officialinflation figures on which his or her job depends.
The Fed has not yet adopted explicit inflation targeting, though a debate currently ragesabout whether it should. And under Ben Bernanke, it moved to what some have calledinflation targeting-lite, with a new policy of communicating with the public more fre-quently about its forecasts, which now run to three years instead of the traditionaltwo.[12] As noted above, the Fed is not very transparent, and that has the effect of roil-ing the financial markets when expectations about its monetary policy turn out to beincorrect. It also induces people to waste a lot of time engaging in “Fed watching,”looking for clues about monetary policy. Reporters actually used to comment on thethickness of Greenspan’s briefcase when he went into Federal Open Market Committee(FOMC) meetings. No joke![13]
Why doesn’t the Fed, which is charged with maintaining financial market and price stability, adoptexplicit targets? It may be that it does not want to be held accountable for its performance. It probablywants to protect its independence, but for its private interest (power) rather than for the public interest(low inflation). It may also be that the Fed has found the holy grail of monetary policy, a flexible rule thathelps it to determine the appropriate federal funds target.
CHAPTER 17 MONETARY POLICY TARGETS AND GOALS 197
rule
In this context, a monetarypolicy rule, an equation thattells central bankers whatinterest rate policies theyshould put in place givenemployment, output,inflation, and perhaps othermacroeconomic variables.
K E Y T A K E A W A Y S
< Monetary targeting entails setting and attempting to meet growth rates of monetary aggregates such asM1 or M2.
< It succeeded in countries like Germany and Switzerland, where the central bank was committed tokeeping inflation in check.
< In other countries, like the United States and the United Kingdom, where price stability was not theparamount goal of the central bank, the time inconsistency problem eroded the effectiveness of thetargets.
< In short, like a dieter who can’t resist that extra helping at dinner and two desserts, the central banks couldnot stick to a good long-term plan day to day.
< Also, the connection between increases in particular aggregates and the price level broke down, but ittook a long time for central bankers to realize it because the lag between policy implementation and real-world outcome was often many months and sometimes years.
< Inflation targeting entails keeping increases in the price level within a predetermined range, e.g., 1 and 2percent per year.
< Countries whose central banks embraced inflation targeting often suffered a recession and highunemployment at first, but in the long run were able to achieve both price level stability and economicexpansion and high employment.
< Inflation targeting makes use of all available information, not just monetary aggregates, and increases theaccountability of central banks and bankers. That reduces their independence but not at the expense ofhigher inflation because inflation targeting, in a sense, is a substitute for independence.
4. THE TAYLOR RULE
L E A R N I N G O B J E C T I V E
1. What is the Taylor Rule and why is it important?
Many observers suspect that the Fed under Greenspan and Bernanke has followed the so-called TaylorRule, named after the Stanford University economist, John Taylor, who developed it. The rule statesthat
?t = π + ?*r + ½(π gap) + ½(Y gap)
wherefft = federal funds targetπ = inflationff*r = the real equilibrium fed funds rateπ gap = inflation gap (π – π target)Y gap = output gap (actual output [e.g. GDP] − output potential)So if the inflation target was 2 percent, actual inflation was 3 percent, output was at its potential,
and the real federal funds rate was 2 percent, the Taylor Rule suggests that the fed funds target shouldbe
?t = π + ?*r + ½(π gap) + ½(Y gap)
?t = 3 + 2 + ½(1) + ½(0)
?t = 5.5
If the economy began running a percentage point below its potential, the Taylor Rule would suggesteasing monetary policy by lowering the fed funds target to 5 percent:
?t = 3 + 2 + ½(1) + ½(−1)
?t = 3 + 2 + .5 + −.5 = 5
If inflation started to heat up to 4 percent, the Fed should respond by raising the fed funds target to 6.5:
?t = 4 + 2 + ½(2) + ½(−1) = 6.5
198 MONEY AND BANKING
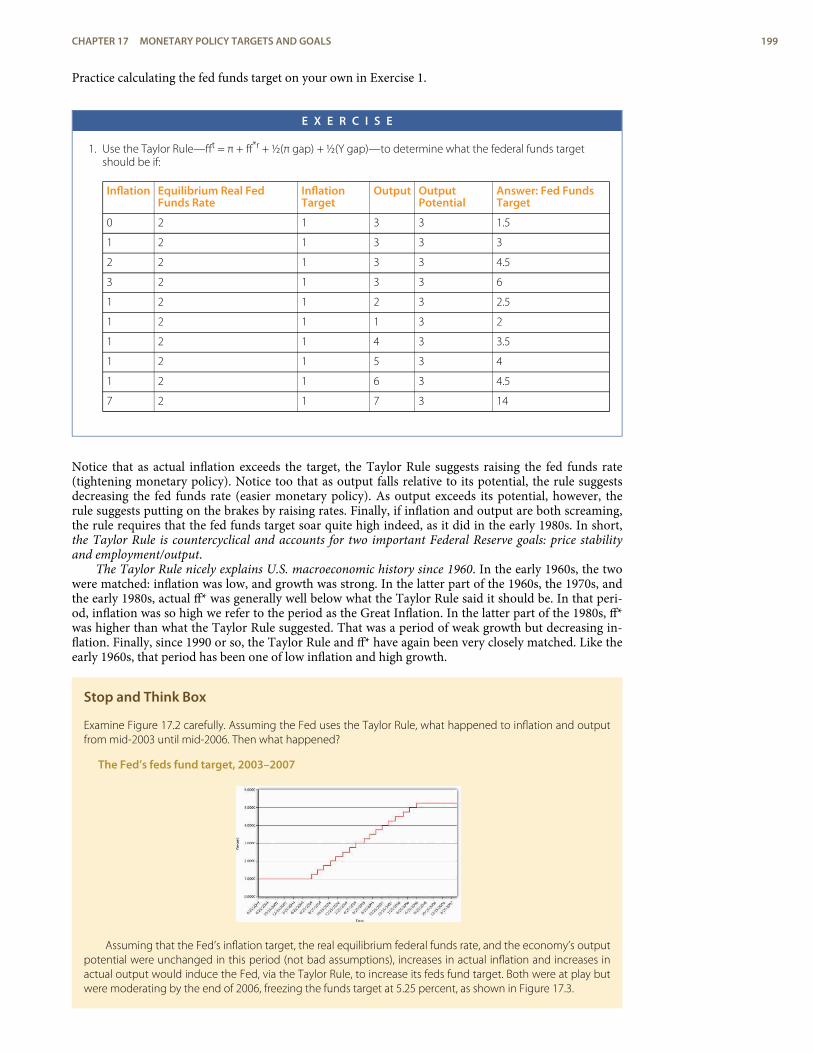
Practice calculating the fed funds target on your own in Exercise 1.
E X E R C I S E
1. Use the Taylor Rule—fft = π + ff*r + ½(π gap) + ½(Y gap)—to determine what the federal funds targetshould be if:
Inflation Equilibrium Real FedFunds Rate
InflationTarget
Output OutputPotential
Answer: Fed FundsTarget
0 2 1 3 3 1.5
1 2 1 3 3 3
2 2 1 3 3 4.5
3 2 1 3 3 6
1 2 1 2 3 2.5
1 2 1 1 3 2
1 2 1 4 3 3.5
1 2 1 5 3 4
1 2 1 6 3 4.5
7 2 1 7 3 14
Notice that as actual inflation exceeds the target, the Taylor Rule suggests raising the fed funds rate(tightening monetary policy). Notice too that as output falls relative to its potential, the rule suggestsdecreasing the fed funds rate (easier monetary policy). As output exceeds its potential, however, therule suggests putting on the brakes by raising rates. Finally, if inflation and output are both screaming,the rule requires that the fed funds target soar quite high indeed, as it did in the early 1980s. In short,the Taylor Rule is countercyclical and accounts for two important Federal Reserve goals: price stabilityand employment/output.
The Taylor Rule nicely explains U.S. macroeconomic history since 1960. In the early 1960s, the twowere matched: inflation was low, and growth was strong. In the latter part of the 1960s, the 1970s, andthe early 1980s, actual ff* was generally well below what the Taylor Rule said it should be. In that peri-od, inflation was so high we refer to the period as the Great Inflation. In the latter part of the 1980s, ff*was higher than what the Taylor Rule suggested. That was a period of weak growth but decreasing in-flation. Finally, since 1990 or so, the Taylor Rule and ff* have again been very closely matched. Like theearly 1960s, that period has been one of low inflation and high growth.
Stop and Think Box
Examine Figure 17.2 carefully. Assuming the Fed uses the Taylor Rule, what happened to inflation and outputfrom mid-2003 until mid-2006. Then what happened?
The Fed’s feds fund target, 2003–2007
Assuming that the Fed’s inflation target, the real equilibrium federal funds rate, and the economy’s outputpotential were unchanged in this period (not bad assumptions), increases in actual inflation and increases inactual output would induce the Fed, via the Taylor Rule, to increase its feds fund target. Both were at play butwere moderating by the end of 2006, freezing the funds target at 5.25 percent, as shown in Figure 17.3.
CHAPTER 17 MONETARY POLICY TARGETS AND GOALS 199
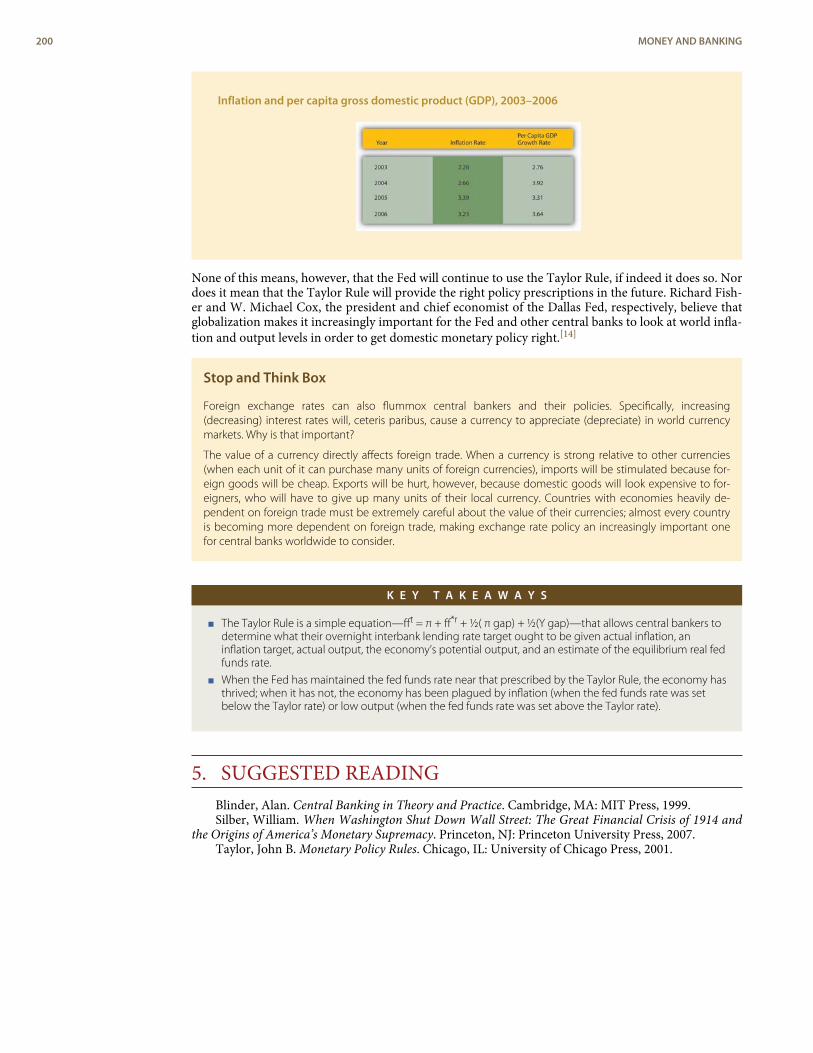
Inflation and per capita gross domestic product (GDP), 2003–2006
None of this means, however, that the Fed will continue to use the Taylor Rule, if indeed it does so. Nordoes it mean that the Taylor Rule will provide the right policy prescriptions in the future. Richard Fish-er and W. Michael Cox, the president and chief economist of the Dallas Fed, respectively, believe thatglobalization makes it increasingly important for the Fed and other central banks to look at world infla-tion and output levels in order to get domestic monetary policy right.[14]
Stop and Think Box
Foreign exchange rates can also flummox central bankers and their policies. Specifically, increasing(decreasing) interest rates will, ceteris paribus, cause a currency to appreciate (depreciate) in world currencymarkets. Why is that important?
The value of a currency directly affects foreign trade. When a currency is strong relative to other currencies(when each unit of it can purchase many units of foreign currencies), imports will be stimulated because for-eign goods will be cheap. Exports will be hurt, however, because domestic goods will look expensive to for-eigners, who will have to give up many units of their local currency. Countries with economies heavily de-pendent on foreign trade must be extremely careful about the value of their currencies; almost every countryis becoming more dependent on foreign trade, making exchange rate policy an increasingly important onefor central banks worldwide to consider.
K E Y T A K E A W A Y S
< The Taylor Rule is a simple equation—fft = π + ff*r + ½( π gap) + ½(Y gap)—that allows central bankers todetermine what their overnight interbank lending rate target ought to be given actual inflation, aninflation target, actual output, the economy’s potential output, and an estimate of the equilibrium real fedfunds rate.
< When the Fed has maintained the fed funds rate near that prescribed by the Taylor Rule, the economy hasthrived; when it has not, the economy has been plagued by inflation (when the fed funds rate was setbelow the Taylor rate) or low output (when the fed funds rate was set above the Taylor rate).
5. SUGGESTED READINGBlinder, Alan. Central Banking in Theory and Practice. Cambridge, MA: MIT Press, 1999.Silber, William. When Washington Shut Down Wall Street: The Great Financial Crisis of 1914 and
the Origins of America’s Monetary Supremacy. Princeton, NJ: Princeton University Press, 2007.Taylor, John B. Monetary Policy Rules. Chicago, IL: University of Chicago Press, 2001.
200 MONEY AND BANKING
1.
2.3.4.5.6.7.
8.
9.10.11.12.13.
14.
ENDNOTES
http://wohlstetter.typepad.com/letterfromthecapitol/2006/02/greenspan_the_g.html
http://www.princeton.edu/pr/pictures/a-f/bernanke/bernanke-03-high.jpg
http://www.mises.org/etexts/austrian.asp
http://www.imf.org/external/pubs/ft/fandd/2001/12/davis.htm
http://en.wikipedia.org/wiki/Total_factor_productivity
http://www.thestreet.com/p/pf/rmoney/codywillardblog/10324983.html
http://www.bartleby.com/119/1.html
In the interest of full disclosure, Silber is a colleague, but also the co-author of a com-peting, and storied, money and banking textbooks.
http://www.pbs.org/greatwar/
http://www.nber.org/cycles.html
http://www.wikiality.com/Bears
“The Federal Reserve: Letting Light In,” The Economist (17 November 2007), 88–89.
http://www.argmax.com/mt_blog/archive/000257.php;http://www.amazon.com/Inside-Greenspans-Briefcase-Investment-Strategies/
dp/007138913X;http://www.argmax.com/mt_blog/archive/000257.php;http://www.amazon.com/Inside-Greenspans-Briefcase-Investment-Strategies/
dp/007138913X
See Richard W. Fisher and W. Michael Cox, “The New Inflation Equation,” Wall StreetJournal, April 6, 2007, A11.
CHAPTER 17 MONETARY POLICY TARGETS AND GOALS 201

202 MONEY AND BANKING
C H A P T E R 1 8Foreign Exchange
C H A P T E R O B J E C T I V E S
By the end of this chapter, students should be able to:
1. Define foreign exchange and explain its importance.
2. Describe the market for foreign exchange.
3. Explain why countries shouldn’t be proud that it takes many units of foreign currencies topurchase a single unit of their currency.
4. Define purchasing power parity and explain its importance.
5. List and explain the long-run determinants of exchange rates.
6. List and explain the short-run determinants of exchange rates.
7. Define the interest parity condition and explain when and why it holds.
1. THE ECONOMIC IMPORTANCE OF CURRENCYMARKETS
L E A R N I N G O B J E C T I V E
1. What is foreign exchange and why is it important?
Before we turn to monetary theory (gulp!) in Chapter 20, there is one more real-world financial marketwe need to investigate in this and the next chapter, the market for foreign currencies or foreign ex-change, where the relative prices of national units of account or exchange rates are determined. Whyshould you care how many U.S. dollars (USD) it takes to buy a euro or a yen, a pound (sterling) or adollar (of Canada or Australia, respectively)? If you plan to travel to any of those places, you’ll want toknow so you can evaluate prices. Is €1,000 a good price for a hotel room? How about ¥1,000?[1] Buteven if you remain your entire life in a small village in Alaska, one of Hawaii’s outer islands, Michigan’sUpper Peninsula, or the northern reaches of Maine, the value of USD will affect your life deeply, whetheryou know it or not. Come again? How could that possibly be?
Every nation in the world trades with other nations. Some trade more than others (little islandslike Iceland, Mauritius, and Ireland lead the way, in percentage of gross domestic product [GDP] termsanyway) but all do it, even illicitly, when the United Nations says that they can’t because they’ve beenbad.[2] We know from Chapter 3 that conducting trade via barter isn’t practical in most circumstances.So we use money. But what happens when people who want to trade use different types of money, whentheir units of account are not the same? There are several solutions to that problem. The most frequentsolution today is for one party, usually the buyer, to exchange the money of his or her country for themoney of the seller’s country, then to consummate the transaction.
How does this affect you? Well, when the unit of account of your country, say, U.S. dollars (USDor plain $), is strong, when it can buy many units of a foreign currency, say, Canadian dollars (C$), Ca-nadian goods look cheap to you. And we all know what happens when goods are cheap. So you stopdrinking Bud and start drinking Moosehead. Instead of going to Manhattan to shop, you go toToronto, and check out some Maple Leafs, Raptors, and Blue Jays games while you’re at it. (You go inApril, that magical month for sports fans.) When the Blue Jays game gets snowed out, you go instead tothe Canadian ballet. (Do you have any sense of humor at all?) You might even consider buying a Cana-dian computer or automobile. (Okay, let’s not get crazy.) The point is you and your fellow Americansimport more from Canada.
The Canadians are very happy about this, but they are not so thrilled with American goods, whichlook dreadfully expensive to them because they have to give up many of their dear loonies to buy USD.So they too eschew Manhattan for Toronto and drink Moosehead rather than Bud. In other words, U.S.
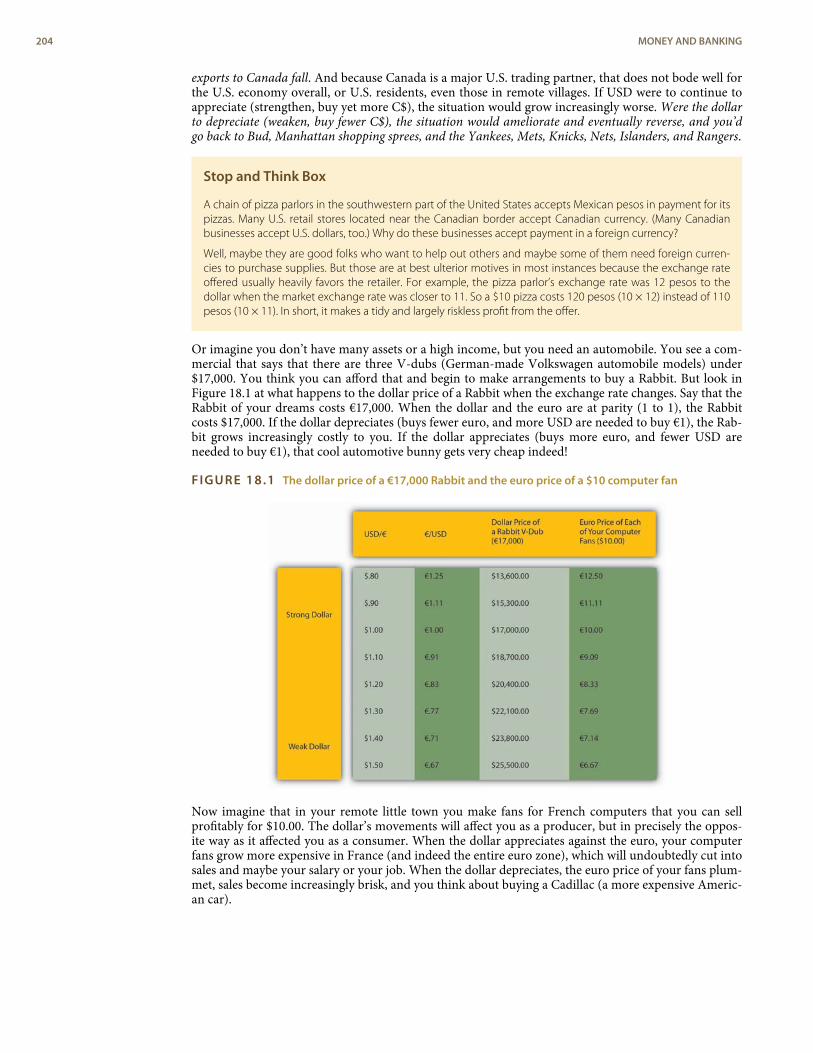
exports to Canada fall. And because Canada is a major U.S. trading partner, that does not bode well forthe U.S. economy overall, or U.S. residents, even those in remote villages. If USD were to continue toappreciate (strengthen, buy yet more C$), the situation would grow increasingly worse. Were the dollarto depreciate (weaken, buy fewer C$), the situation would ameliorate and eventually reverse, and you’dgo back to Bud, Manhattan shopping sprees, and the Yankees, Mets, Knicks, Nets, Islanders, and Rangers.
Stop and Think Box
A chain of pizza parlors in the southwestern part of the United States accepts Mexican pesos in payment for itspizzas. Many U.S. retail stores located near the Canadian border accept Canadian currency. (Many Canadianbusinesses accept U.S. dollars, too.) Why do these businesses accept payment in a foreign currency?
Well, maybe they are good folks who want to help out others and maybe some of them need foreign curren-cies to purchase supplies. But those are at best ulterior motives in most instances because the exchange rateoffered usually heavily favors the retailer. For example, the pizza parlor’s exchange rate was 12 pesos to thedollar when the market exchange rate was closer to 11. So a $10 pizza costs 120 pesos (10 × 12) instead of 110pesos (10 × 11). In short, it makes a tidy and largely riskless profit from the offer.
Or imagine you don’t have many assets or a high income, but you need an automobile. You see a com-mercial that says that there are three V-dubs (German-made Volkswagen automobile models) under$17,000. You think you can afford that and begin to make arrangements to buy a Rabbit. But look inFigure 18.1 at what happens to the dollar price of a Rabbit when the exchange rate changes. Say that theRabbit of your dreams costs €17,000. When the dollar and the euro are at parity (1 to 1), the Rabbitcosts $17,000. If the dollar depreciates (buys fewer euro, and more USD are needed to buy €1), the Rab-bit grows increasingly costly to you. If the dollar appreciates (buys more euro, and fewer USD areneeded to buy €1), that cool automotive bunny gets very cheap indeed!
FIGURE 18.1 The dollar price of a €17,000 Rabbit and the euro price of a $10 computer fan
Now imagine that in your remote little town you make fans for French computers that you can sellprofitably for $10.00. The dollar’s movements will affect you as a producer, but in precisely the oppos-ite way as it affected you as a consumer. When the dollar appreciates against the euro, your computerfans grow more expensive in France (and indeed the entire euro zone), which will undoubtedly cut intosales and maybe your salary or your job. When the dollar depreciates, the euro price of your fans plum-met, sales become increasingly brisk, and you think about buying a Cadillac (a more expensive Americ-an car).
204 MONEY AND BANKING
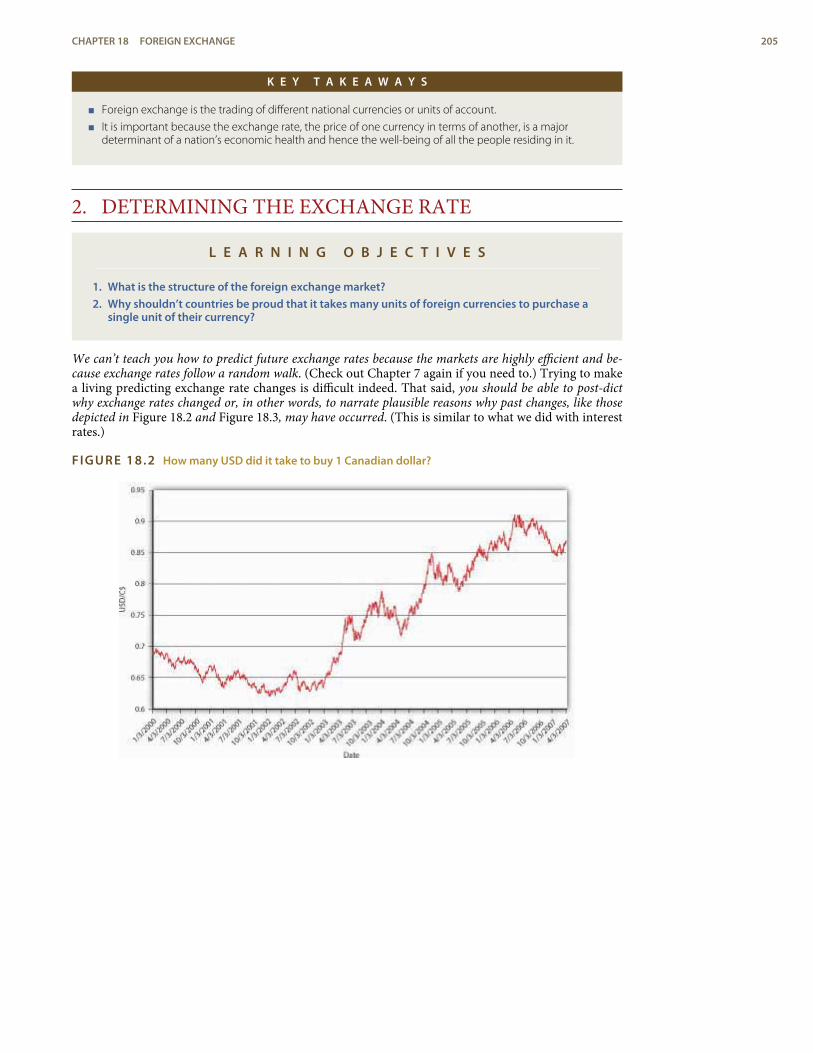
K E Y T A K E A W A Y S
< Foreign exchange is the trading of different national currencies or units of account.
< It is important because the exchange rate, the price of one currency in terms of another, is a majordeterminant of a nation’s economic health and hence the well-being of all the people residing in it.
2. DETERMINING THE EXCHANGE RATE
L E A R N I N G O B J E C T I V E S
1. What is the structure of the foreign exchange market?2. Why shouldn’t countries be proud that it takes many units of foreign currencies to purchase a
single unit of their currency?
We can’t teach you how to predict future exchange rates because the markets are highly efficient and be-cause exchange rates follow a random walk. (Check out Chapter 7 again if you need to.) Trying to makea living predicting exchange rate changes is difficult indeed. That said, you should be able to post-dictwhy exchange rates changed or, in other words, to narrate plausible reasons why past changes, like thosedepicted in Figure 18.2 and Figure 18.3, may have occurred. (This is similar to what we did with interestrates.)
FIGURE 18.2 How many USD did it take to buy 1 Canadian dollar?
CHAPTER 18 FOREIGN EXCHANGE 205
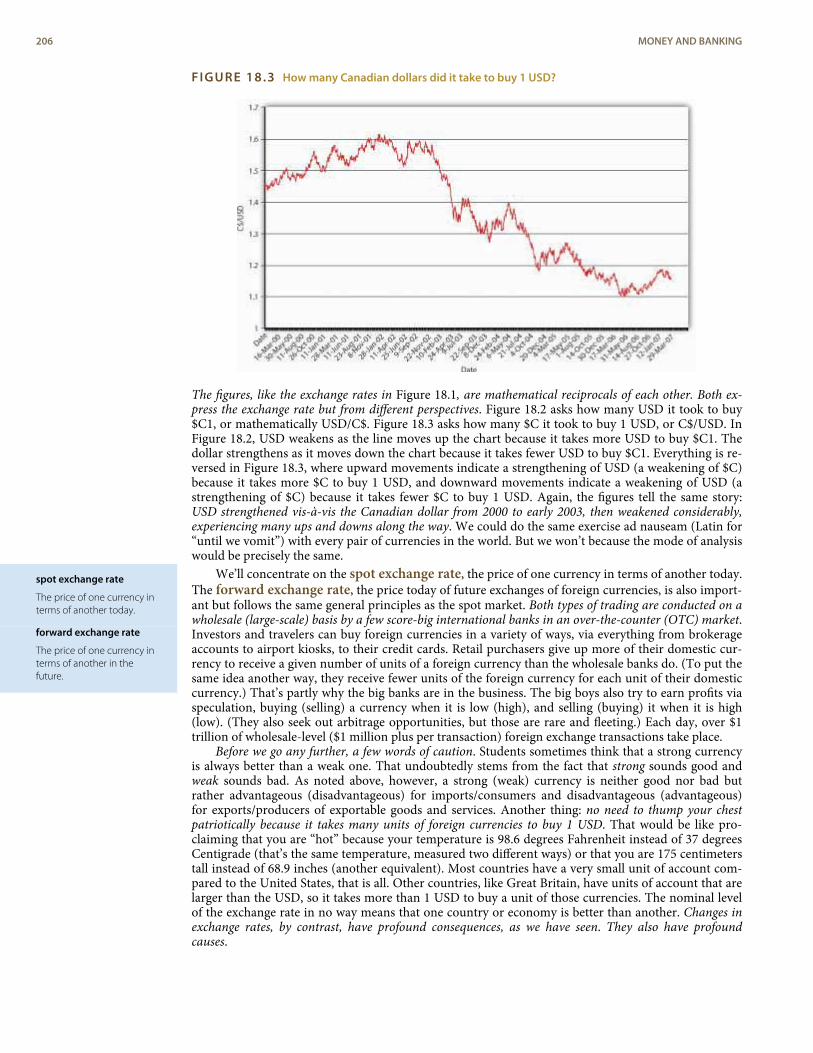
spot exchange rate
The price of one currency interms of another today.
forward exchange rate
The price of one currency interms of another in thefuture.
FIGURE 18.3 How many Canadian dollars did it take to buy 1 USD?
The figures, like the exchange rates in Figure 18.1, are mathematical reciprocals of each other. Both ex-press the exchange rate but from different perspectives. Figure 18.2 asks how many USD it took to buy$C1, or mathematically USD/C$. Figure 18.3 asks how many $C it took to buy 1 USD, or C$/USD. InFigure 18.2, USD weakens as the line moves up the chart because it takes more USD to buy $C1. Thedollar strengthens as it moves down the chart because it takes fewer USD to buy $C1. Everything is re-versed in Figure 18.3, where upward movements indicate a strengthening of USD (a weakening of $C)because it takes more $C to buy 1 USD, and downward movements indicate a weakening of USD (astrengthening of $C) because it takes fewer $C to buy 1 USD. Again, the figures tell the same story:USD strengthened vis-à-vis the Canadian dollar from 2000 to early 2003, then weakened considerably,experiencing many ups and downs along the way. We could do the same exercise ad nauseam (Latin for“until we vomit”) with every pair of currencies in the world. But we won’t because the mode of analysiswould be precisely the same.
We’ll concentrate on the spot exchange rate, the price of one currency in terms of another today.The forward exchange rate, the price today of future exchanges of foreign currencies, is also import-ant but follows the same general principles as the spot market. Both types of trading are conducted on awholesale (large-scale) basis by a few score-big international banks in an over-the-counter (OTC) market.Investors and travelers can buy foreign currencies in a variety of ways, via everything from brokerageaccounts to airport kiosks, to their credit cards. Retail purchasers give up more of their domestic cur-rency to receive a given number of units of a foreign currency than the wholesale banks do. (To put thesame idea another way, they receive fewer units of the foreign currency for each unit of their domesticcurrency.) That’s partly why the big banks are in the business. The big boys also try to earn profits viaspeculation, buying (selling) a currency when it is low (high), and selling (buying) it when it is high(low). (They also seek out arbitrage opportunities, but those are rare and fleeting.) Each day, over $1trillion of wholesale-level ($1 million plus per transaction) foreign exchange transactions take place.
Before we go any further, a few words of caution. Students sometimes think that a strong currencyis always better than a weak one. That undoubtedly stems from the fact that strong sounds good andweak sounds bad. As noted above, however, a strong (weak) currency is neither good nor bad butrather advantageous (disadvantageous) for imports/consumers and disadvantageous (advantageous)for exports/producers of exportable goods and services. Another thing: no need to thump your chestpatriotically because it takes many units of foreign currencies to buy 1 USD. That would be like pro-claiming that you are “hot” because your temperature is 98.6 degrees Fahrenheit instead of 37 degreesCentigrade (that’s the same temperature, measured two different ways) or that you are 175 centimeterstall instead of 68.9 inches (another equivalent). Most countries have a very small unit of account com-pared to the United States, that is all. Other countries, like Great Britain, have units of account that arelarger than the USD, so it takes more than 1 USD to buy a unit of those currencies. The nominal levelof the exchange rate in no way means that one country or economy is better than another. Changes inexchange rates, by contrast, have profound consequences, as we have seen. They also have profoundcauses.
206 MONEY AND BANKING
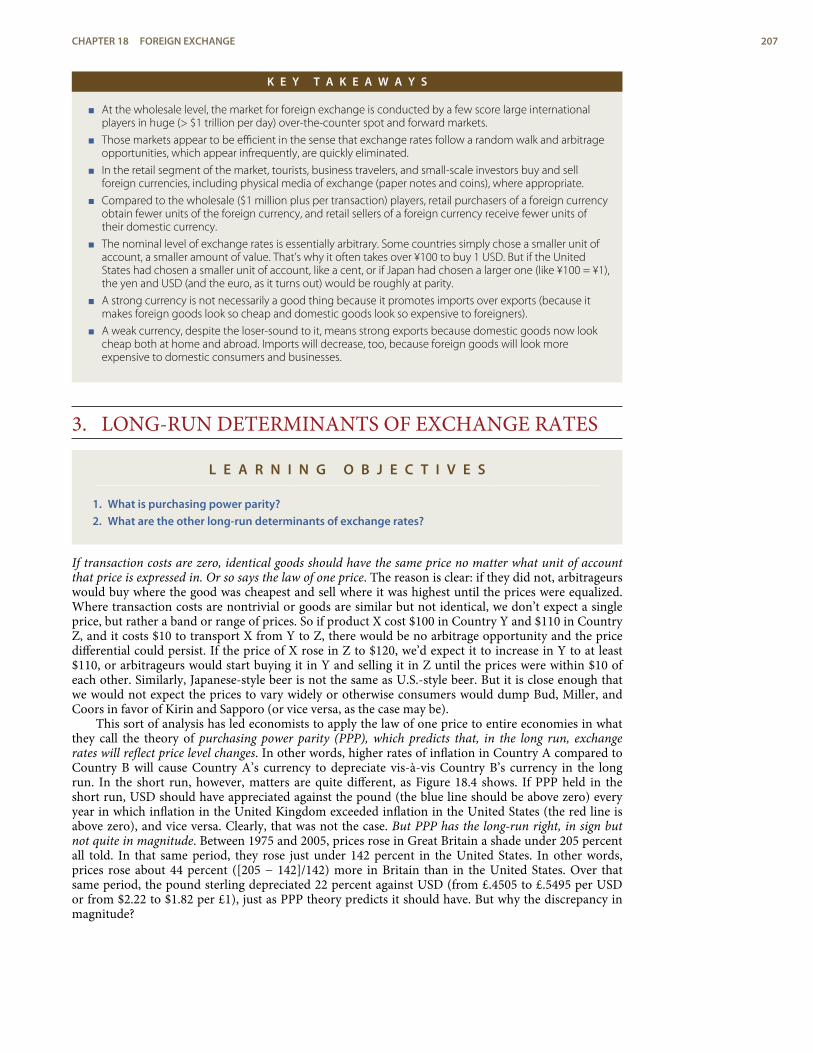
K E Y T A K E A W A Y S
< At the wholesale level, the market for foreign exchange is conducted by a few score large internationalplayers in huge (> $1 trillion per day) over-the-counter spot and forward markets.
< Those markets appear to be efficient in the sense that exchange rates follow a random walk and arbitrageopportunities, which appear infrequently, are quickly eliminated.
< In the retail segment of the market, tourists, business travelers, and small-scale investors buy and sellforeign currencies, including physical media of exchange (paper notes and coins), where appropriate.
< Compared to the wholesale ($1 million plus per transaction) players, retail purchasers of a foreign currencyobtain fewer units of the foreign currency, and retail sellers of a foreign currency receive fewer units oftheir domestic currency.
< The nominal level of exchange rates is essentially arbitrary. Some countries simply chose a smaller unit ofaccount, a smaller amount of value. That’s why it often takes over ¥100 to buy 1 USD. But if the UnitedStates had chosen a smaller unit of account, like a cent, or if Japan had chosen a larger one (like ¥100 = ¥1),the yen and USD (and the euro, as it turns out) would be roughly at parity.
< A strong currency is not necessarily a good thing because it promotes imports over exports (because itmakes foreign goods look so cheap and domestic goods look so expensive to foreigners).
< A weak currency, despite the loser-sound to it, means strong exports because domestic goods now lookcheap both at home and abroad. Imports will decrease, too, because foreign goods will look moreexpensive to domestic consumers and businesses.
3. LONG-RUN DETERMINANTS OF EXCHANGE RATES
L E A R N I N G O B J E C T I V E S
1. What is purchasing power parity?2. What are the other long-run determinants of exchange rates?
If transaction costs are zero, identical goods should have the same price no matter what unit of accountthat price is expressed in. Or so says the law of one price. The reason is clear: if they did not, arbitrageurswould buy where the good was cheapest and sell where it was highest until the prices were equalized.Where transaction costs are nontrivial or goods are similar but not identical, we don’t expect a singleprice, but rather a band or range of prices. So if product X cost $100 in Country Y and $110 in CountryZ, and it costs $10 to transport X from Y to Z, there would be no arbitrage opportunity and the pricedifferential could persist. If the price of X rose in Z to $120, we’d expect it to increase in Y to at least$110, or arbitrageurs would start buying it in Y and selling it in Z until the prices were within $10 ofeach other. Similarly, Japanese-style beer is not the same as U.S.-style beer. But it is close enough thatwe would not expect the prices to vary widely or otherwise consumers would dump Bud, Miller, andCoors in favor of Kirin and Sapporo (or vice versa, as the case may be).
This sort of analysis has led economists to apply the law of one price to entire economies in whatthey call the theory of purchasing power parity (PPP), which predicts that, in the long run, exchangerates will reflect price level changes. In other words, higher rates of inflation in Country A compared toCountry B will cause Country A’s currency to depreciate vis-à-vis Country B’s currency in the longrun. In the short run, however, matters are quite different, as Figure 18.4 shows. If PPP held in theshort run, USD should have appreciated against the pound (the blue line should be above zero) everyyear in which inflation in the United Kingdom exceeded inflation in the United States (the red line isabove zero), and vice versa. Clearly, that was not the case. But PPP has the long-run right, in sign butnot quite in magnitude. Between 1975 and 2005, prices rose in Great Britain a shade under 205 percentall told. In that same period, they rose just under 142 percent in the United States. In other words,prices rose about 44 percent ([205 − 142]/142) more in Britain than in the United States. Over thatsame period, the pound sterling depreciated 22 percent against USD (from £.4505 to £.5495 per USDor from $2.22 to $1.82 per £1), just as PPP theory predicts it should have. But why the discrepancy inmagnitude?
CHAPTER 18 FOREIGN EXCHANGE 207
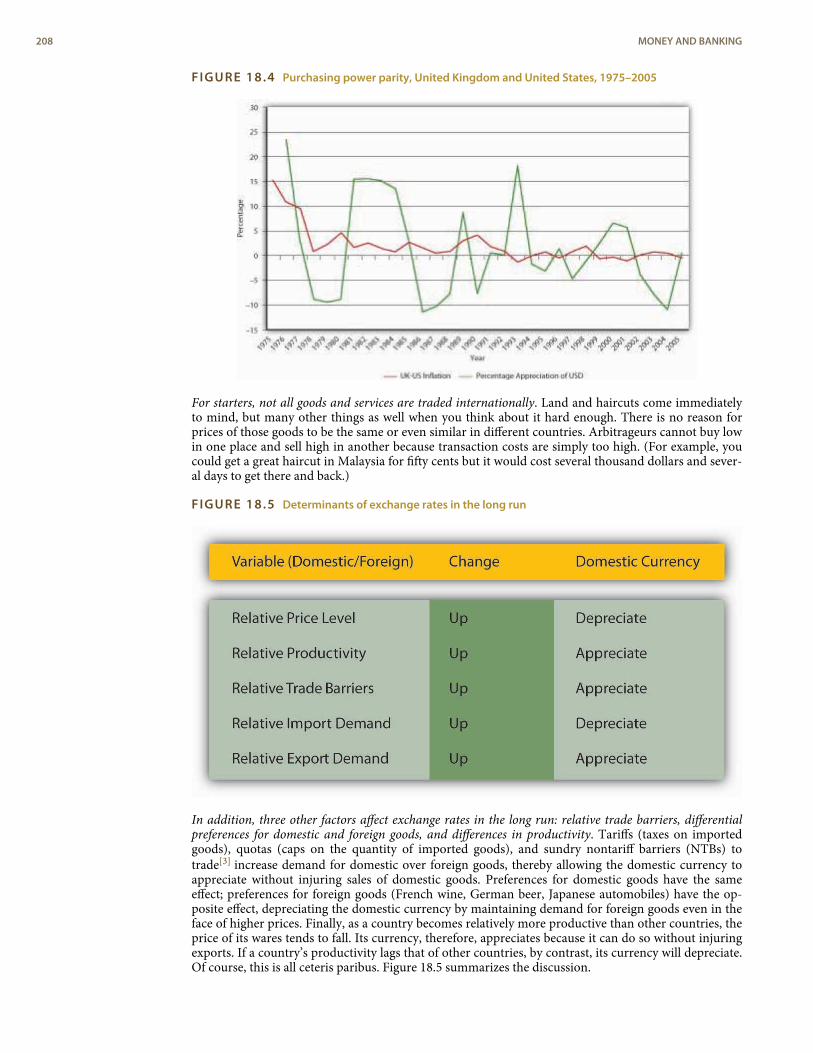
FIGURE 18.4 Purchasing power parity, United Kingdom and United States, 1975–2005
For starters, not all goods and services are traded internationally. Land and haircuts come immediatelyto mind, but many other things as well when you think about it hard enough. There is no reason forprices of those goods to be the same or even similar in different countries. Arbitrageurs cannot buy lowin one place and sell high in another because transaction costs are simply too high. (For example, youcould get a great haircut in Malaysia for fifty cents but it would cost several thousand dollars and sever-al days to get there and back.)
FIGURE 18.5 Determinants of exchange rates in the long run
In addition, three other factors affect exchange rates in the long run: relative trade barriers, differentialpreferences for domestic and foreign goods, and differences in productivity. Tariffs (taxes on importedgoods), quotas (caps on the quantity of imported goods), and sundry nontariff barriers (NTBs) totrade[3] increase demand for domestic over foreign goods, thereby allowing the domestic currency toappreciate without injuring sales of domestic goods. Preferences for domestic goods have the sameeffect; preferences for foreign goods (French wine, German beer, Japanese automobiles) have the op-posite effect, depreciating the domestic currency by maintaining demand for foreign goods even in theface of higher prices. Finally, as a country becomes relatively more productive than other countries, theprice of its wares tends to fall. Its currency, therefore, appreciates because it can do so without injuringexports. If a country’s productivity lags that of other countries, by contrast, its currency will depreciate.Of course, this is all ceteris paribus. Figure 18.5 summarizes the discussion.
208 MONEY AND BANKING
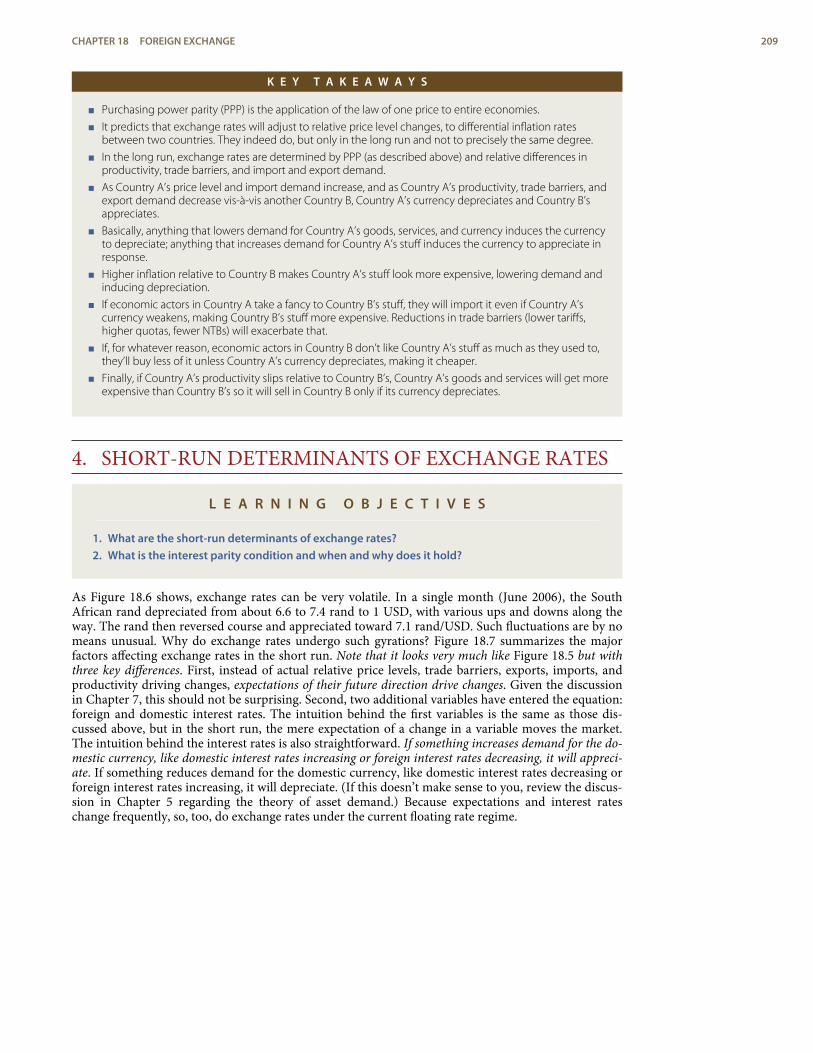
K E Y T A K E A W A Y S
< Purchasing power parity (PPP) is the application of the law of one price to entire economies.
< It predicts that exchange rates will adjust to relative price level changes, to differential inflation ratesbetween two countries. They indeed do, but only in the long run and not to precisely the same degree.
< In the long run, exchange rates are determined by PPP (as described above) and relative differences inproductivity, trade barriers, and import and export demand.
< As Country A’s price level and import demand increase, and as Country A’s productivity, trade barriers, andexport demand decrease vis-à-vis another Country B, Country A’s currency depreciates and Country B’sappreciates.
< Basically, anything that lowers demand for Country A’s goods, services, and currency induces the currencyto depreciate; anything that increases demand for Country A’s stuff induces the currency to appreciate inresponse.
< Higher inflation relative to Country B makes Country A’s stuff look more expensive, lowering demand andinducing depreciation.
< If economic actors in Country A take a fancy to Country B’s stuff, they will import it even if Country A’scurrency weakens, making Country B’s stuff more expensive. Reductions in trade barriers (lower tariffs,higher quotas, fewer NTBs) will exacerbate that.
< If, for whatever reason, economic actors in Country B don’t like Country A’s stuff as much as they used to,they’ll buy less of it unless Country A’s currency depreciates, making it cheaper.
< Finally, if Country A’s productivity slips relative to Country B’s, Country A’s goods and services will get moreexpensive than Country B’s so it will sell in Country B only if its currency depreciates.
4. SHORT-RUN DETERMINANTS OF EXCHANGE RATES
L E A R N I N G O B J E C T I V E S
1. What are the short-run determinants of exchange rates?2. What is the interest parity condition and when and why does it hold?
As Figure 18.6 shows, exchange rates can be very volatile. In a single month (June 2006), the SouthAfrican rand depreciated from about 6.6 to 7.4 rand to 1 USD, with various ups and downs along theway. The rand then reversed course and appreciated toward 7.1 rand/USD. Such fluctuations are by nomeans unusual. Why do exchange rates undergo such gyrations? Figure 18.7 summarizes the majorfactors affecting exchange rates in the short run. Note that it looks very much like Figure 18.5 but withthree key differences. First, instead of actual relative price levels, trade barriers, exports, imports, andproductivity driving changes, expectations of their future direction drive changes. Given the discussionin Chapter 7, this should not be surprising. Second, two additional variables have entered the equation:foreign and domestic interest rates. The intuition behind the first variables is the same as those dis-cussed above, but in the short run, the mere expectation of a change in a variable moves the market.The intuition behind the interest rates is also straightforward. If something increases demand for the do-mestic currency, like domestic interest rates increasing or foreign interest rates decreasing, it will appreci-ate. If something reduces demand for the domestic currency, like domestic interest rates decreasing orforeign interest rates increasing, it will depreciate. (If this doesn’t make sense to you, review the discus-sion in Chapter 5 regarding the theory of asset demand.) Because expectations and interest rateschange frequently, so, too, do exchange rates under the current floating rate regime.
CHAPTER 18 FOREIGN EXCHANGE 209
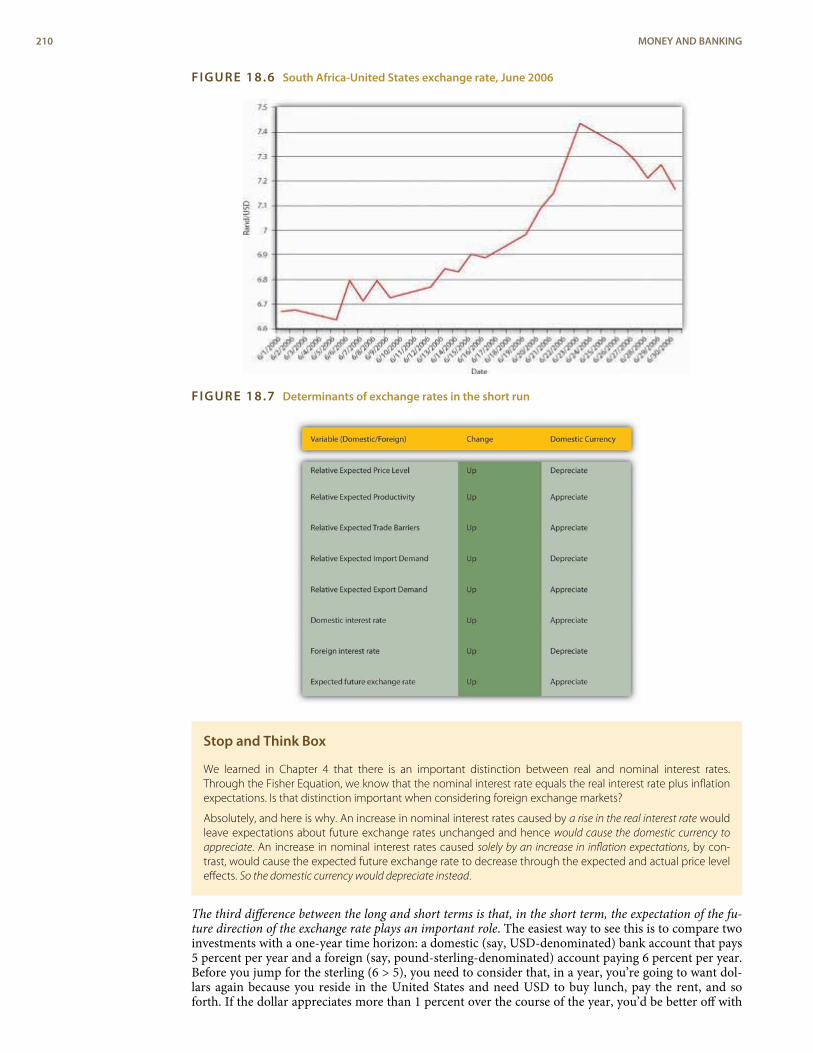
FIGURE 18.6 South Africa-United States exchange rate, June 2006
FIGURE 18.7 Determinants of exchange rates in the short run
Stop and Think Box
We learned in Chapter 4 that there is an important distinction between real and nominal interest rates.Through the Fisher Equation, we know that the nominal interest rate equals the real interest rate plus inflationexpectations. Is that distinction important when considering foreign exchange markets?
Absolutely, and here is why. An increase in nominal interest rates caused by a rise in the real interest rate wouldleave expectations about future exchange rates unchanged and hence would cause the domestic currency toappreciate. An increase in nominal interest rates caused solely by an increase in inflation expectations, by con-trast, would cause the expected future exchange rate to decrease through the expected and actual price leveleffects. So the domestic currency would depreciate instead.
The third difference between the long and short terms is that, in the short term, the expectation of the fu-ture direction of the exchange rate plays an important role. The easiest way to see this is to compare twoinvestments with a one-year time horizon: a domestic (say, USD-denominated) bank account that pays5 percent per year and a foreign (say, pound-sterling-denominated) account paying 6 percent per year.Before you jump for the sterling (6 > 5), you need to consider that, in a year, you’re going to want dol-lars again because you reside in the United States and need USD to buy lunch, pay the rent, and soforth. If the dollar appreciates more than 1 percent over the course of the year, you’d be better off with
210 MONEY AND BANKING
the dollar deposit. Say that you invest $10,000 in sterling when the exchange rate is $1.50/£1 or, in oth-er words, £.6667/$1. Your investment today would buy 10,000 × .6667 = £6,667. Multiply that by theinterest on the sterling deposit (1.06) and you get £7,067.02 in a year. If the exchange rate is unchanged,you’re cool because you’ll have 7,067.02 × 1.50 = $10,600.53, which is greater than $10,000 invested at 5percent, which equals 10,000 × 1.05 = $10,500.00. But what if, over the course of that year, the dollarappreciated strongly, to $1.25 per pound? Then your £7,067.02 would buy you only 7,067.02 × 1.25 =$8,833.78. You just took a bath, and not the good kind, because you should have invested in the dollardeposit! Of course, if the dollar depreciated to, say, $1.75, you’ll be pheeling phat at 7,067.02 × 1.75 =$12,367.29.
Stop and Think Box
We learned in Chapter 5 that increases in the growth rate of the money supply will eventually cause the pricelevel to increase, but its effect on nominal interest rates in the short term can vary: rates can dip strongly, thenrebound but remain permanently lower than the previous level, decrease temporarily before increasing per-manently, or increase immediately. What does this mean for the market for foreign exchange?
The fact that a major short-run determinant of the exchange rate, foreign and domestic interest rates, movesaround a lot helps to explain why the foreign exchange market is volatile. That market is also volatile becauseexpectations of many things, including future differential price levels, productivity, and trading levels, willaffect it via the Eef variable.
As noted above, the markets for foreign exchange and bonds/deposits are highly competitive and effi-cient, so we wouldn’t expect discrepancies in returns to last long. The law of one price, of course, appliesmost stringently to financial markets in which international capital mobility is allowed because hugesums of money (deposits) can be sent hither and thither almost immediately and cost-free, ideal condi-tions for the law of one price to prevail. So what economists call the interest parity condition often holds(is true). More formally,
iD = iF − (Eef − Et) / Et
where:iD = domestic interest rateiF = foreign interest rateEef = expected future exchange rateEt = exchange rate todayIn plain English, if the so-called interest parity condition holds, the domestic interest rate should
equal the foreign interest rate minus the expected appreciation of the domestic currency. If iF is > iD, thedomestic currency must be expected to appreciate; otherwise, everyone would sell their domestic de-posits to buy the foreign ones. If iF is < iD, the domestic currency must be expected to depreciate (havea negative sign, two of which make a positive, augmenting iF); otherwise, everyone would sell the for-eign deposits and buy the domestic ones. If you find this confusing, there is another, more intuitiveway of stating it: the domestic interest rate must equal the foreign interest rate plus the expected appre-ciation of the foreign currency. If iF is < iD, the expected appreciation of the foreign currency com-pensates for the lower interest rate, allowing equilibrium. You can practice calculating interest parity inExercise 1.
CHAPTER 18 FOREIGN EXCHANGE 211
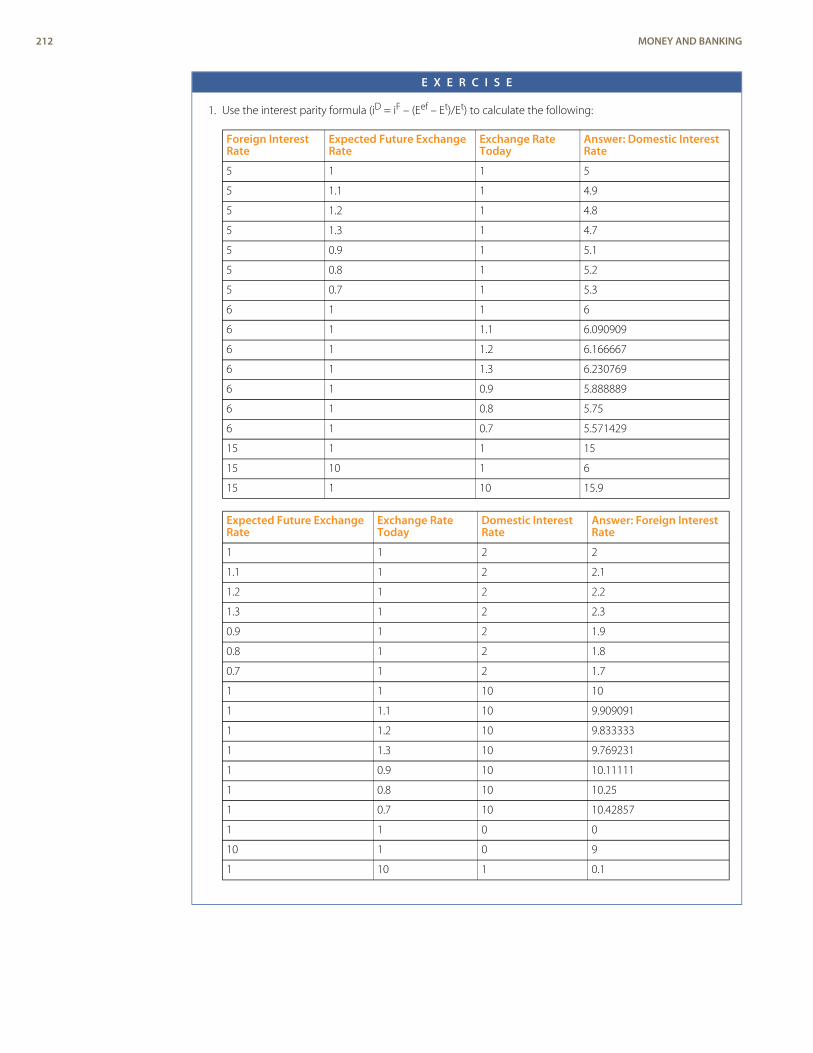
E X E R C I S E
1. Use the interest parity formula (iD = iF – (Eef – Et)/Et) to calculate the following:
Foreign InterestRate
Expected Future ExchangeRate
Exchange RateToday
Answer: Domestic InterestRate
5 1 1 5
5 1.1 1 4.9
5 1.2 1 4.8
5 1.3 1 4.7
5 0.9 1 5.1
5 0.8 1 5.2
5 0.7 1 5.3
6 1 1 6
6 1 1.1 6.090909
6 1 1.2 6.166667
6 1 1.3 6.230769
6 1 0.9 5.888889
6 1 0.8 5.75
6 1 0.7 5.571429
15 1 1 15
15 10 1 6
15 1 10 15.9
Expected Future ExchangeRate
Exchange RateToday
Domestic InterestRate
Answer: Foreign InterestRate
1 1 2 2
1.1 1 2 2.1
1.2 1 2 2.2
1.3 1 2 2.3
0.9 1 2 1.9
0.8 1 2 1.8
0.7 1 2 1.7
1 1 10 10
1 1.1 10 9.909091
1 1.2 10 9.833333
1 1.3 10 9.769231
1 0.9 10 10.11111
1 0.8 10 10.25
1 0.7 10 10.42857
1 1 0 0
10 1 0 9
1 10 1 0.1
212 MONEY AND BANKING
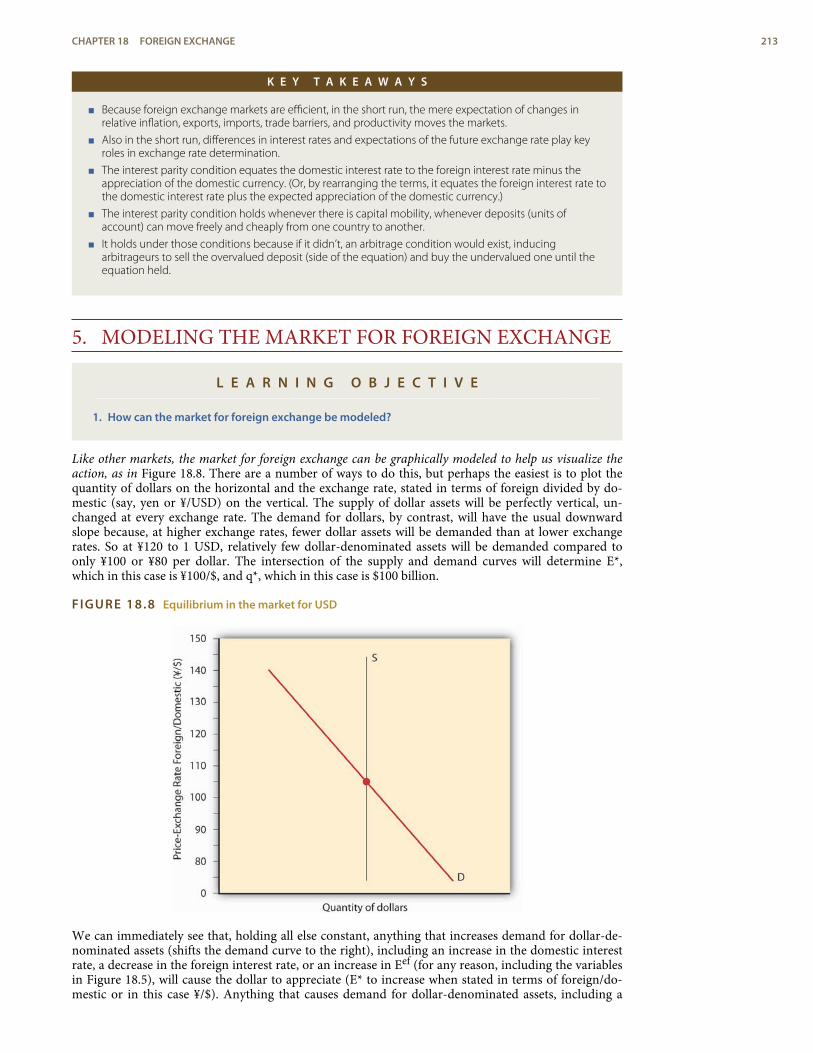
K E Y T A K E A W A Y S
< Because foreign exchange markets are efficient, in the short run, the mere expectation of changes inrelative inflation, exports, imports, trade barriers, and productivity moves the markets.
< Also in the short run, differences in interest rates and expectations of the future exchange rate play keyroles in exchange rate determination.
< The interest parity condition equates the domestic interest rate to the foreign interest rate minus theappreciation of the domestic currency. (Or, by rearranging the terms, it equates the foreign interest rate tothe domestic interest rate plus the expected appreciation of the domestic currency.)
< The interest parity condition holds whenever there is capital mobility, whenever deposits (units ofaccount) can move freely and cheaply from one country to another.
< It holds under those conditions because if it didn’t, an arbitrage condition would exist, inducingarbitrageurs to sell the overvalued deposit (side of the equation) and buy the undervalued one until theequation held.
5. MODELING THE MARKET FOR FOREIGN EXCHANGE
L E A R N I N G O B J E C T I V E
1. How can the market for foreign exchange be modeled?
Like other markets, the market for foreign exchange can be graphically modeled to help us visualize theaction, as in Figure 18.8. There are a number of ways to do this, but perhaps the easiest is to plot thequantity of dollars on the horizontal and the exchange rate, stated in terms of foreign divided by do-mestic (say, yen or ¥/USD) on the vertical. The supply of dollar assets will be perfectly vertical, un-changed at every exchange rate. The demand for dollars, by contrast, will have the usual downwardslope because, at higher exchange rates, fewer dollar assets will be demanded than at lower exchangerates. So at ¥120 to 1 USD, relatively few dollar-denominated assets will be demanded compared toonly ¥100 or ¥80 per dollar. The intersection of the supply and demand curves will determine E*,which in this case is ¥100/$, and q*, which in this case is $100 billion.
FIGURE 18.8 Equilibrium in the market for USD
We can immediately see that, holding all else constant, anything that increases demand for dollar-de-nominated assets (shifts the demand curve to the right), including an increase in the domestic interestrate, a decrease in the foreign interest rate, or an increase in Eef (for any reason, including the variablesin Figure 18.5), will cause the dollar to appreciate (E* to increase when stated in terms of foreign/do-mestic or in this case ¥/$). Anything that causes demand for dollar-denominated assets, including a
CHAPTER 18 FOREIGN EXCHANGE 213
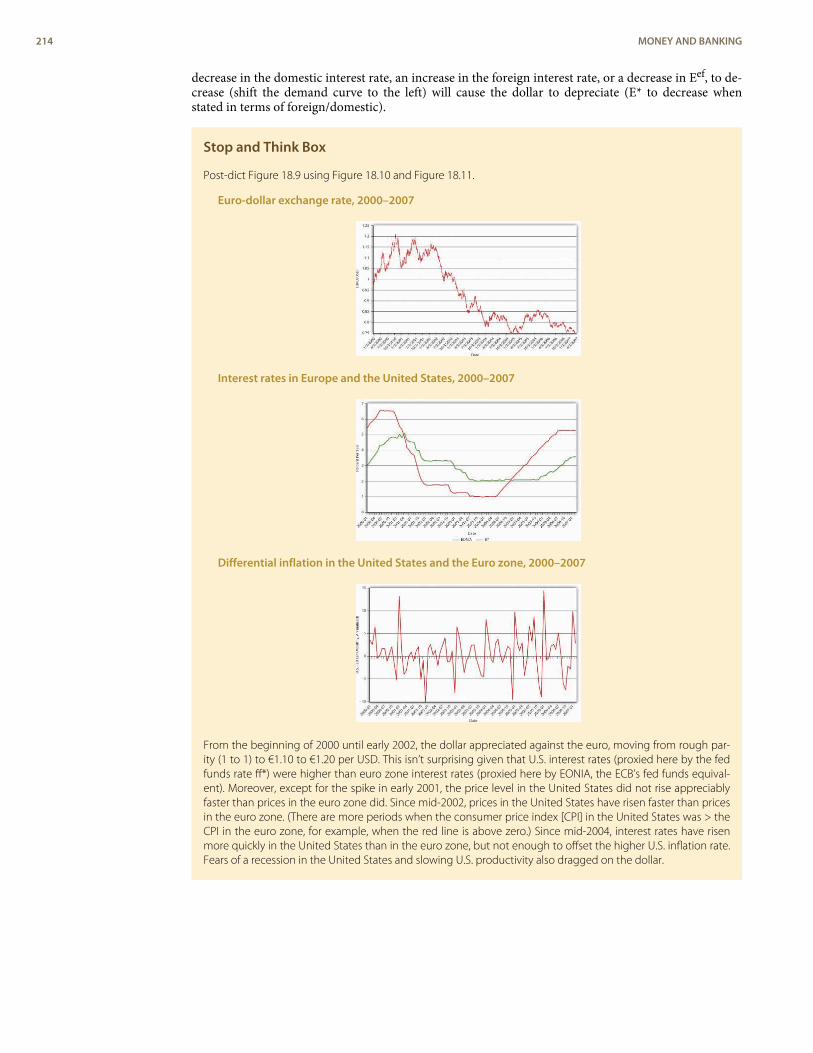
decrease in the domestic interest rate, an increase in the foreign interest rate, or a decrease in Eef, to de-crease (shift the demand curve to the left) will cause the dollar to depreciate (E* to decrease whenstated in terms of foreign/domestic).
Stop and Think Box
Post-dict Figure 18.9 using Figure 18.10 and Figure 18.11.
Euro-dollar exchange rate, 2000–2007
Interest rates in Europe and the United States, 2000–2007
Differential inflation in the United States and the Euro zone, 2000–2007
From the beginning of 2000 until early 2002, the dollar appreciated against the euro, moving from rough par-ity (1 to 1) to €1.10 to €1.20 per USD. This isn’t surprising given that U.S. interest rates (proxied here by the fedfunds rate ff*) were higher than euro zone interest rates (proxied here by EONIA, the ECB’s fed funds equival-ent). Moreover, except for the spike in early 2001, the price level in the United States did not rise appreciablyfaster than prices in the euro zone did. Since mid-2002, prices in the United States have risen faster than pricesin the euro zone. (There are more periods when the consumer price index [CPI] in the United States was > theCPI in the euro zone, for example, when the red line is above zero.) Since mid-2004, interest rates have risenmore quickly in the United States than in the euro zone, but not enough to offset the higher U.S. inflation rate.Fears of a recession in the United States and slowing U.S. productivity also dragged on the dollar.
214 MONEY AND BANKING
K E Y T A K E A W A Y S
< The market for foreign exchange can be modeled in many different ways.
< The easiest way, perhaps, is to think of the price of a domestic currency, say, USD.
< There is a given quantity of USD that is insensitive to the exchange rate.
< Demand for the domestic currency slopes downward for the usual reasons that economic actors demandmore of an asset when it is cheaper.
< The intersection of the two lines determines the exchange rate.
6. SUGGESTED READINGGalant, Mark, and Brian Dolan. Currency Trading for Dummies. Hoboken, NJ: John Wiley and
Sons, 2007.Shamah, Shani. A Foreign Exchange Primer. Hoboken, NJ: John Wiley and Sons, 2009.
CHAPTER 18 FOREIGN EXCHANGE 215

1.
2.3.
ENDNOTES
The symbol for the euro, the currency of the European Union, is €. The symbol forthe Japanese yen is ¥.
http://www.entemp.ie/trade/export/sanctions.htm#overview
http://www.wto.org/english/thewto_e/whatis_e/tif_e/agrm9_e.htm
216 MONEY AND BANKING
foreign exchange rate (FXor forex)
The price of one currency interms of another.
Bretton Woods System(BWS)
A system of fixed exchangerates based on gold and theUSD used by most of theworld’s free (noncommunist)countries in the quartercentury after World War II.
gold standard (GS)
A fixed exchange rate regimebased on gold.
C H A P T E R 1 9International MonetaryRegimes
C H A P T E R O B J E C T I V E S
By the end of this chapter, students should be able to:
1. Define the impossible trinity, or trilemma, and explain its importance.
2. Identify the four major types of international monetary regimes and describe how theydiffer.
3. Explain how central banks manage the foreign exchange (FX) rate.
4. Explain the benefits of fixing the FX rate, or keeping it within a narrow band.
5. Explain the costs of fixing the FX rate, or keeping it in a narrow band.
1. THE TRILEMMA, OR IMPOSSIBLE TRINITY
L E A R N I N G O B J E C T I V E S
1. What is the impossible trinity, or trilemma, and why is it important?2. What are the four major types of international monetary regimes and how do they differ?
The foreign exchange (forex, or FX) market described in Chapter 18 is called the free floating regimebecause monetary authorities allow world markets (via interest rates, and expectations about relativeprice, productivity, and trade levels) to determine the prices of different currencies in terms of one an-other. The free float, as we learned, was characterized by tremendous exchange rate volatility and un-fettered international capital mobility. As we learned in Chapter 13 through Chapter 17, it is also char-acterized by national central banks with tremendous discretion over domestic monetary policy. Thefree float is not, however, the only possible international monetary regime. In fact, it has pervaded theworld economy only since the early 1970s, and many nations even today do not embrace it. BetweenWorld War II and the early 1970s, much of the world (the so-called first, or free, world) was on amanaged, fixed-FX regime called the Bretton Woods System (BWS). Before that, many nations wereon the gold standard (GS), as summarized in Figure 19.1.
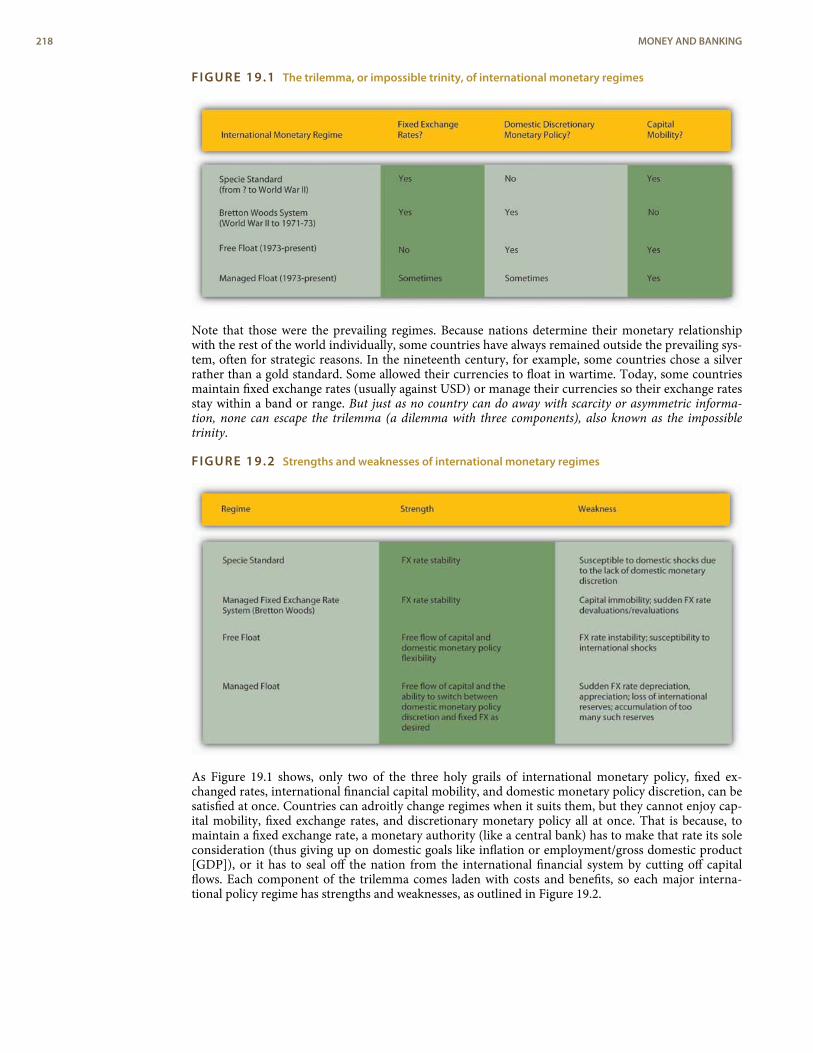
FIGURE 19.1 The trilemma, or impossible trinity, of international monetary regimes
Note that those were the prevailing regimes. Because nations determine their monetary relationshipwith the rest of the world individually, some countries have always remained outside the prevailing sys-tem, often for strategic reasons. In the nineteenth century, for example, some countries chose a silverrather than a gold standard. Some allowed their currencies to float in wartime. Today, some countriesmaintain fixed exchange rates (usually against USD) or manage their currencies so their exchange ratesstay within a band or range. But just as no country can do away with scarcity or asymmetric informa-tion, none can escape the trilemma (a dilemma with three components), also known as the impossibletrinity.
FIGURE 19.2 Strengths and weaknesses of international monetary regimes
As Figure 19.1 shows, only two of the three holy grails of international monetary policy, fixed ex-changed rates, international financial capital mobility, and domestic monetary policy discretion, can besatisfied at once. Countries can adroitly change regimes when it suits them, but they cannot enjoy cap-ital mobility, fixed exchange rates, and discretionary monetary policy all at once. That is because, tomaintain a fixed exchange rate, a monetary authority (like a central bank) has to make that rate its soleconsideration (thus giving up on domestic goals like inflation or employment/gross domestic product[GDP]), or it has to seal off the nation from the international financial system by cutting off capitalflows. Each component of the trilemma comes laden with costs and benefits, so each major interna-tional policy regime has strengths and weaknesses, as outlined in Figure 19.2.
218 MONEY AND BANKING
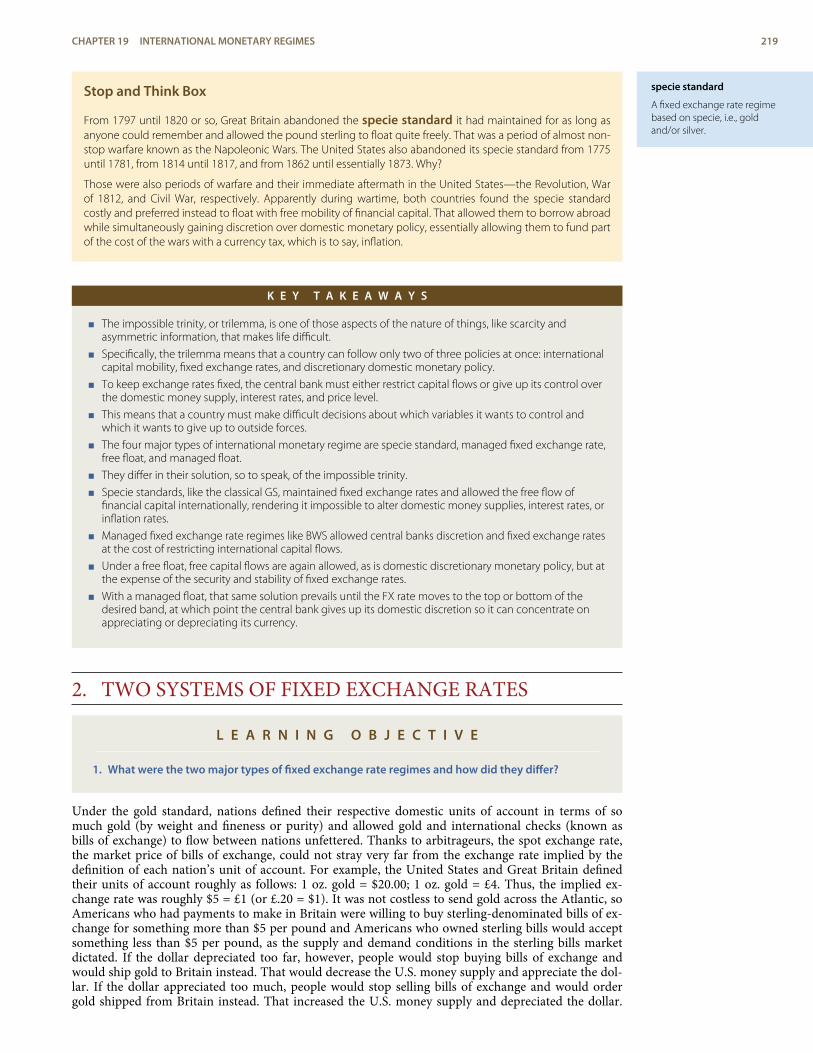
specie standard
A fixed exchange rate regimebased on specie, i.e., goldand/or silver.
Stop and Think Box
From 1797 until 1820 or so, Great Britain abandoned the specie standard it had maintained for as long asanyone could remember and allowed the pound sterling to float quite freely. That was a period of almost non-stop warfare known as the Napoleonic Wars. The United States also abandoned its specie standard from 1775until 1781, from 1814 until 1817, and from 1862 until essentially 1873. Why?
Those were also periods of warfare and their immediate aftermath in the United States—the Revolution, Warof 1812, and Civil War, respectively. Apparently during wartime, both countries found the specie standardcostly and preferred instead to float with free mobility of financial capital. That allowed them to borrow abroadwhile simultaneously gaining discretion over domestic monetary policy, essentially allowing them to fund partof the cost of the wars with a currency tax, which is to say, inflation.
K E Y T A K E A W A Y S
< The impossible trinity, or trilemma, is one of those aspects of the nature of things, like scarcity andasymmetric information, that makes life difficult.
< Specifically, the trilemma means that a country can follow only two of three policies at once: internationalcapital mobility, fixed exchange rates, and discretionary domestic monetary policy.
< To keep exchange rates fixed, the central bank must either restrict capital flows or give up its control overthe domestic money supply, interest rates, and price level.
< This means that a country must make difficult decisions about which variables it wants to control andwhich it wants to give up to outside forces.
< The four major types of international monetary regime are specie standard, managed fixed exchange rate,free float, and managed float.
< They differ in their solution, so to speak, of the impossible trinity.
< Specie standards, like the classical GS, maintained fixed exchange rates and allowed the free flow offinancial capital internationally, rendering it impossible to alter domestic money supplies, interest rates, orinflation rates.
< Managed fixed exchange rate regimes like BWS allowed central banks discretion and fixed exchange ratesat the cost of restricting international capital flows.
< Under a free float, free capital flows are again allowed, as is domestic discretionary monetary policy, but atthe expense of the security and stability of fixed exchange rates.
< With a managed float, that same solution prevails until the FX rate moves to the top or bottom of thedesired band, at which point the central bank gives up its domestic discretion so it can concentrate onappreciating or depreciating its currency.
2. TWO SYSTEMS OF FIXED EXCHANGE RATES
L E A R N I N G O B J E C T I V E
1. What were the two major types of fixed exchange rate regimes and how did they differ?
Under the gold standard, nations defined their respective domestic units of account in terms of somuch gold (by weight and fineness or purity) and allowed gold and international checks (known asbills of exchange) to flow between nations unfettered. Thanks to arbitrageurs, the spot exchange rate,the market price of bills of exchange, could not stray very far from the exchange rate implied by thedefinition of each nation’s unit of account. For example, the United States and Great Britain definedtheir units of account roughly as follows: 1 oz. gold = $20.00; 1 oz. gold = £4. Thus, the implied ex-change rate was roughly $5 = £1 (or £.20 = $1). It was not costless to send gold across the Atlantic, soAmericans who had payments to make in Britain were willing to buy sterling-denominated bills of ex-change for something more than $5 per pound and Americans who owned sterling bills would acceptsomething less than $5 per pound, as the supply and demand conditions in the sterling bills marketdictated. If the dollar depreciated too far, however, people would stop buying bills of exchange andwould ship gold to Britain instead. That would decrease the U.S. money supply and appreciate the dol-lar. If the dollar appreciated too much, people would stop selling bills of exchange and would ordergold shipped from Britain instead. That increased the U.S. money supply and depreciated the dollar.
CHAPTER 19 INTERNATIONAL MONETARY REGIMES 219
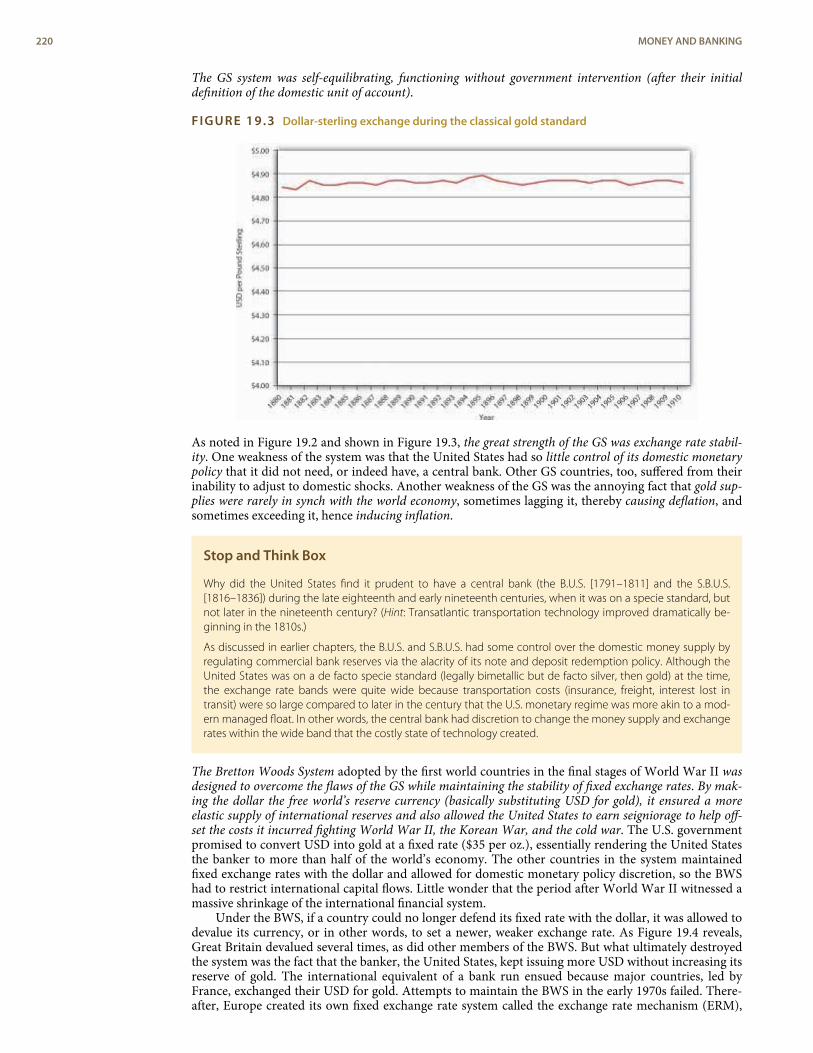
The GS system was self-equilibrating, functioning without government intervention (after their initialdefinition of the domestic unit of account).
FIGURE 19.3 Dollar-sterling exchange during the classical gold standard
As noted in Figure 19.2 and shown in Figure 19.3, the great strength of the GS was exchange rate stabil-ity. One weakness of the system was that the United States had so little control of its domestic monetarypolicy that it did not need, or indeed have, a central bank. Other GS countries, too, suffered from theirinability to adjust to domestic shocks. Another weakness of the GS was the annoying fact that gold sup-plies were rarely in synch with the world economy, sometimes lagging it, thereby causing deflation, andsometimes exceeding it, hence inducing inflation.
Stop and Think Box
Why did the United States find it prudent to have a central bank (the B.U.S. [1791–1811] and the S.B.U.S.[1816–1836]) during the late eighteenth and early nineteenth centuries, when it was on a specie standard, butnot later in the nineteenth century? (Hint: Transatlantic transportation technology improved dramatically be-ginning in the 1810s.)
As discussed in earlier chapters, the B.U.S. and S.B.U.S. had some control over the domestic money supply byregulating commercial bank reserves via the alacrity of its note and deposit redemption policy. Although theUnited States was on a de facto specie standard (legally bimetallic but de facto silver, then gold) at the time,the exchange rate bands were quite wide because transportation costs (insurance, freight, interest lost intransit) were so large compared to later in the century that the U.S. monetary regime was more akin to a mod-ern managed float. In other words, the central bank had discretion to change the money supply and exchangerates within the wide band that the costly state of technology created.
The Bretton Woods System adopted by the first world countries in the final stages of World War II wasdesigned to overcome the flaws of the GS while maintaining the stability of fixed exchange rates. By mak-ing the dollar the free world’s reserve currency (basically substituting USD for gold), it ensured a moreelastic supply of international reserves and also allowed the United States to earn seigniorage to help off-set the costs it incurred fighting World War II, the Korean War, and the cold war. The U.S. governmentpromised to convert USD into gold at a fixed rate ($35 per oz.), essentially rendering the United Statesthe banker to more than half of the world’s economy. The other countries in the system maintainedfixed exchange rates with the dollar and allowed for domestic monetary policy discretion, so the BWShad to restrict international capital flows. Little wonder that the period after World War II witnessed amassive shrinkage of the international financial system.
Under the BWS, if a country could no longer defend its fixed rate with the dollar, it was allowed todevalue its currency, or in other words, to set a newer, weaker exchange rate. As Figure 19.4 reveals,Great Britain devalued several times, as did other members of the BWS. But what ultimately destroyedthe system was the fact that the banker, the United States, kept issuing more USD without increasing itsreserve of gold. The international equivalent of a bank run ensued because major countries, led byFrance, exchanged their USD for gold. Attempts to maintain the BWS in the early 1970s failed. There-after, Europe created its own fixed exchange rate system called the exchange rate mechanism (ERM),
220 MONEY AND BANKING
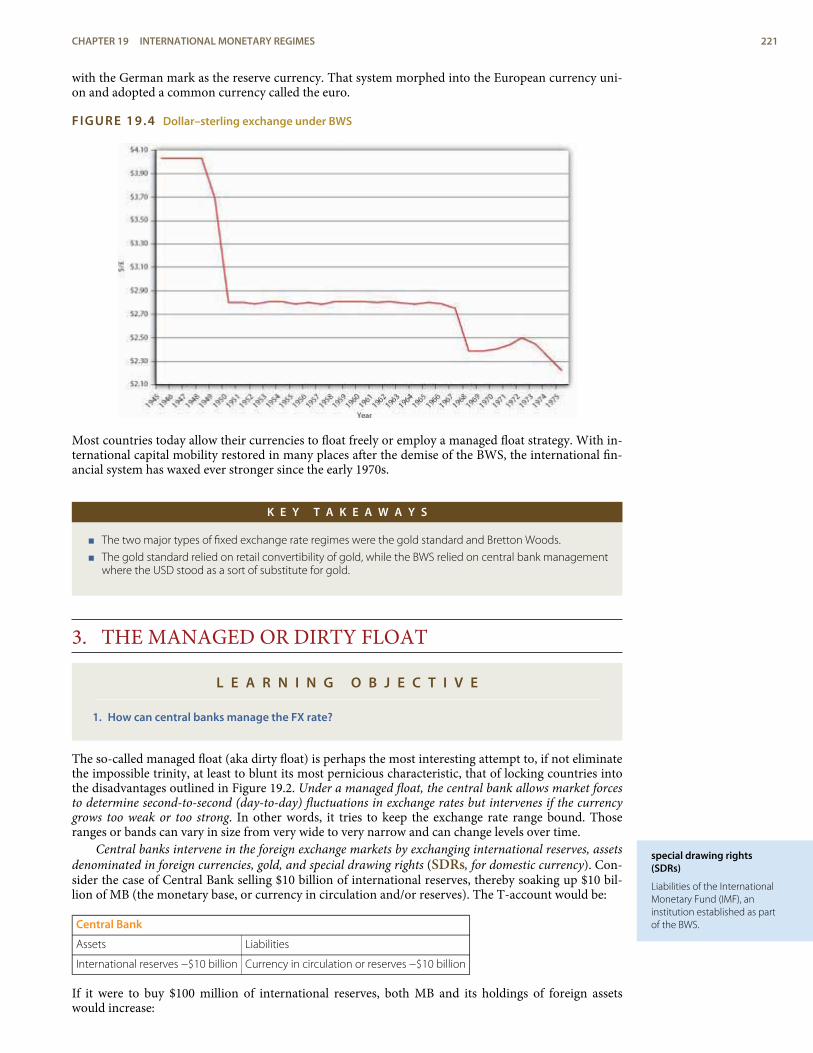
special drawing rights(SDRs)
Liabilities of the InternationalMonetary Fund (IMF), aninstitution established as partof the BWS.
with the German mark as the reserve currency. That system morphed into the European currency uni-on and adopted a common currency called the euro.
FIGURE 19.4 Dollar–sterling exchange under BWS
Most countries today allow their currencies to float freely or employ a managed float strategy. With in-ternational capital mobility restored in many places after the demise of the BWS, the international fin-ancial system has waxed ever stronger since the early 1970s.
K E Y T A K E A W A Y S
< The two major types of fixed exchange rate regimes were the gold standard and Bretton Woods.
< The gold standard relied on retail convertibility of gold, while the BWS relied on central bank managementwhere the USD stood as a sort of substitute for gold.
3. THE MANAGED OR DIRTY FLOAT
L E A R N I N G O B J E C T I V E
1. How can central banks manage the FX rate?
The so-called managed float (aka dirty float) is perhaps the most interesting attempt to, if not eliminatethe impossible trinity, at least to blunt its most pernicious characteristic, that of locking countries intothe disadvantages outlined in Figure 19.2. Under a managed float, the central bank allows market forcesto determine second-to-second (day-to-day) fluctuations in exchange rates but intervenes if the currencygrows too weak or too strong. In other words, it tries to keep the exchange rate range bound. Thoseranges or bands can vary in size from very wide to very narrow and can change levels over time.
Central banks intervene in the foreign exchange markets by exchanging international reserves, assetsdenominated in foreign currencies, gold, and special drawing rights (SDRs, for domestic currency). Con-sider the case of Central Bank selling $10 billion of international reserves, thereby soaking up $10 bil-lion of MB (the monetary base, or currency in circulation and/or reserves). The T-account would be:
Central Bank
Assets Liabilities
International reserves −$10 billion Currency in circulation or reserves −$10 billion
If it were to buy $100 million of international reserves, both MB and its holdings of foreign assetswould increase:
CHAPTER 19 INTERNATIONAL MONETARY REGIMES 221
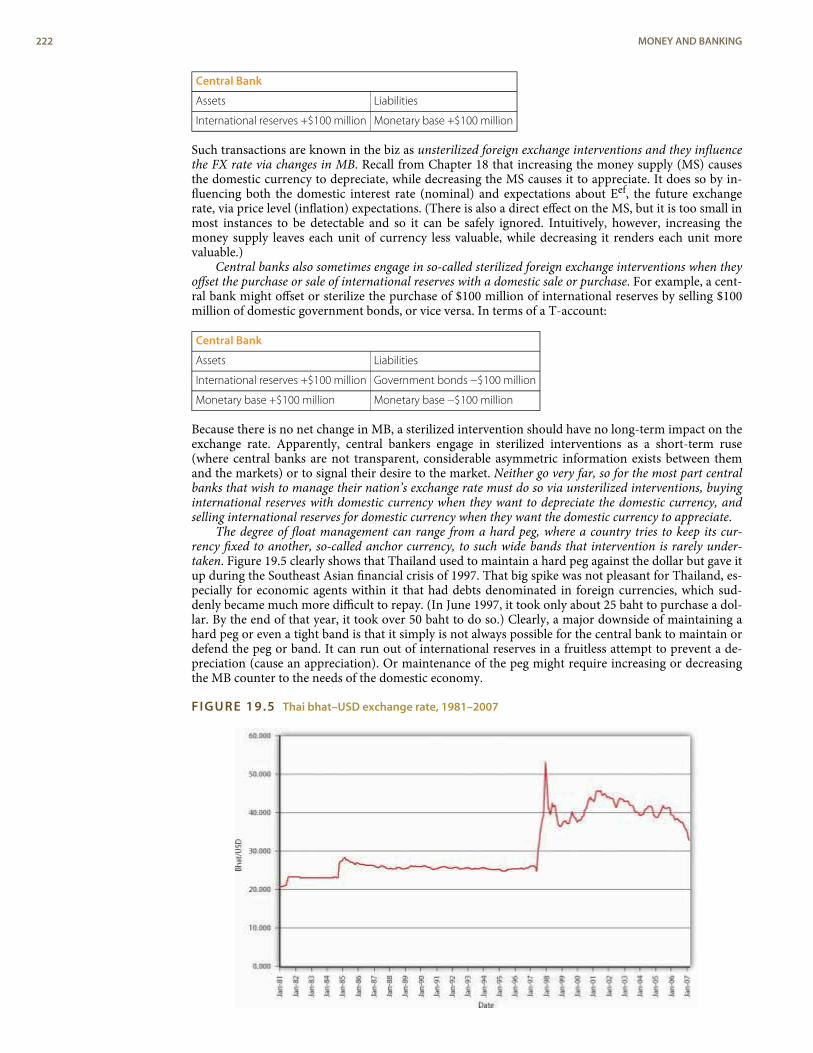
Central Bank
Assets Liabilities
International reserves +$100 million Monetary base +$100 million
Such transactions are known in the biz as unsterilized foreign exchange interventions and they influencethe FX rate via changes in MB. Recall from Chapter 18 that increasing the money supply (MS) causesthe domestic currency to depreciate, while decreasing the MS causes it to appreciate. It does so by in-fluencing both the domestic interest rate (nominal) and expectations about Eef, the future exchangerate, via price level (inflation) expectations. (There is also a direct effect on the MS, but it is too small inmost instances to be detectable and so it can be safely ignored. Intuitively, however, increasing themoney supply leaves each unit of currency less valuable, while decreasing it renders each unit morevaluable.)
Central banks also sometimes engage in so-called sterilized foreign exchange interventions when theyoffset the purchase or sale of international reserves with a domestic sale or purchase. For example, a cent-ral bank might offset or sterilize the purchase of $100 million of international reserves by selling $100million of domestic government bonds, or vice versa. In terms of a T-account:
Central Bank
Assets Liabilities
International reserves +$100 million Government bonds −$100 million
Monetary base +$100 million Monetary base −$100 million
Because there is no net change in MB, a sterilized intervention should have no long-term impact on theexchange rate. Apparently, central bankers engage in sterilized interventions as a short-term ruse(where central banks are not transparent, considerable asymmetric information exists between themand the markets) or to signal their desire to the market. Neither go very far, so for the most part centralbanks that wish to manage their nation’s exchange rate must do so via unsterilized interventions, buyinginternational reserves with domestic currency when they want to depreciate the domestic currency, andselling international reserves for domestic currency when they want the domestic currency to appreciate.
The degree of float management can range from a hard peg, where a country tries to keep its cur-rency fixed to another, so-called anchor currency, to such wide bands that intervention is rarely under-taken. Figure 19.5 clearly shows that Thailand used to maintain a hard peg against the dollar but gave itup during the Southeast Asian financial crisis of 1997. That big spike was not pleasant for Thailand, es-pecially for economic agents within it that had debts denominated in foreign currencies, which sud-denly became much more difficult to repay. (In June 1997, it took only about 25 baht to purchase a dol-lar. By the end of that year, it took over 50 baht to do so.) Clearly, a major downside of maintaining ahard peg or even a tight band is that it simply is not always possible for the central bank to maintain ordefend the peg or band. It can run out of international reserves in a fruitless attempt to prevent a de-preciation (cause an appreciation). Or maintenance of the peg might require increasing or decreasingthe MB counter to the needs of the domestic economy.
FIGURE 19.5 Thai bhat–USD exchange rate, 1981–2007
222 MONEY AND BANKING
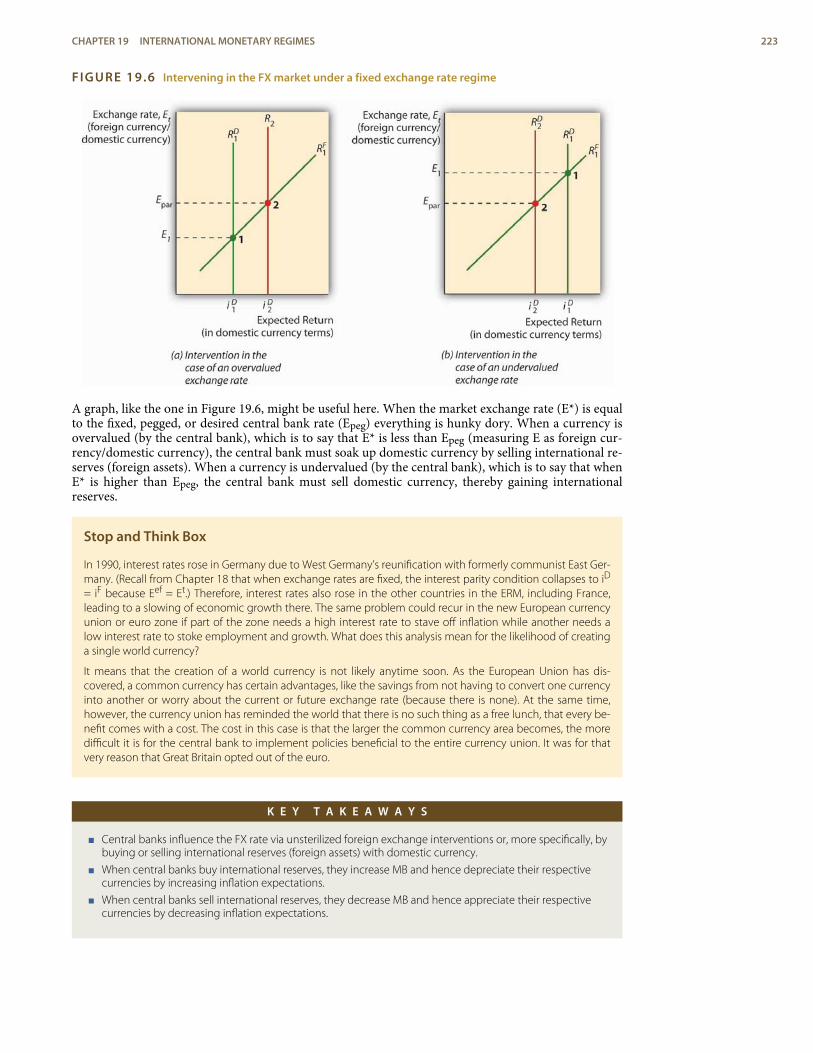
FIGURE 19.6 Intervening in the FX market under a fixed exchange rate regime
A graph, like the one in Figure 19.6, might be useful here. When the market exchange rate (E*) is equalto the fixed, pegged, or desired central bank rate (Epeg) everything is hunky dory. When a currency isovervalued (by the central bank), which is to say that E* is less than Epeg (measuring E as foreign cur-rency/domestic currency), the central bank must soak up domestic currency by selling international re-serves (foreign assets). When a currency is undervalued (by the central bank), which is to say that whenE* is higher than Epeg, the central bank must sell domestic currency, thereby gaining internationalreserves.
Stop and Think Box
In 1990, interest rates rose in Germany due to West Germany’s reunification with formerly communist East Ger-many. (Recall from Chapter 18 that when exchange rates are fixed, the interest parity condition collapses to iD
= iF because Eef = Et.) Therefore, interest rates also rose in the other countries in the ERM, including France,leading to a slowing of economic growth there. The same problem could recur in the new European currencyunion or euro zone if part of the zone needs a high interest rate to stave off inflation while another needs alow interest rate to stoke employment and growth. What does this analysis mean for the likelihood of creatinga single world currency?
It means that the creation of a world currency is not likely anytime soon. As the European Union has dis-covered, a common currency has certain advantages, like the savings from not having to convert one currencyinto another or worry about the current or future exchange rate (because there is none). At the same time,however, the currency union has reminded the world that there is no such thing as a free lunch, that every be-nefit comes with a cost. The cost in this case is that the larger the common currency area becomes, the moredifficult it is for the central bank to implement policies beneficial to the entire currency union. It was for thatvery reason that Great Britain opted out of the euro.
K E Y T A K E A W A Y S
< Central banks influence the FX rate via unsterilized foreign exchange interventions or, more specifically, bybuying or selling international reserves (foreign assets) with domestic currency.
< When central banks buy international reserves, they increase MB and hence depreciate their respectivecurrencies by increasing inflation expectations.
< When central banks sell international reserves, they decrease MB and hence appreciate their respectivecurrencies by decreasing inflation expectations.
CHAPTER 19 INTERNATIONAL MONETARY REGIMES 223
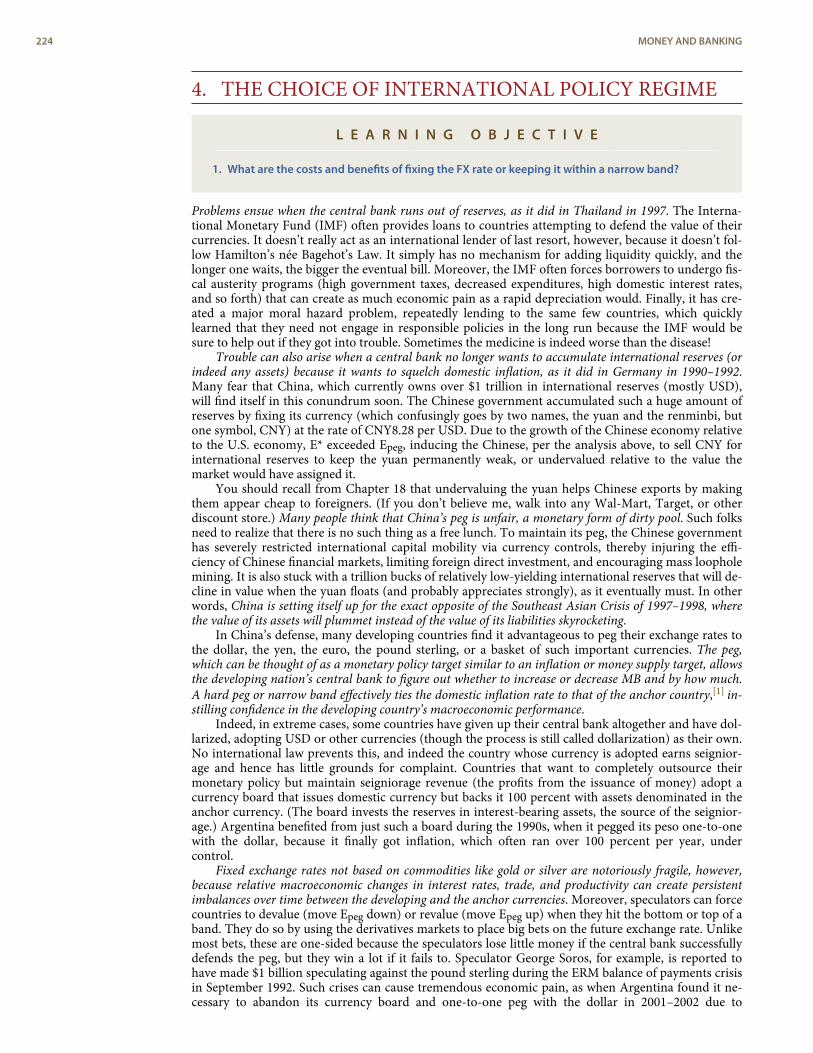
4. THE CHOICE OF INTERNATIONAL POLICY REGIME
L E A R N I N G O B J E C T I V E
1. What are the costs and benefits of fixing the FX rate or keeping it within a narrow band?
Problems ensue when the central bank runs out of reserves, as it did in Thailand in 1997. The Interna-tional Monetary Fund (IMF) often provides loans to countries attempting to defend the value of theircurrencies. It doesn’t really act as an international lender of last resort, however, because it doesn’t fol-low Hamilton’s née Bagehot’s Law. It simply has no mechanism for adding liquidity quickly, and thelonger one waits, the bigger the eventual bill. Moreover, the IMF often forces borrowers to undergo fis-cal austerity programs (high government taxes, decreased expenditures, high domestic interest rates,and so forth) that can create as much economic pain as a rapid depreciation would. Finally, it has cre-ated a major moral hazard problem, repeatedly lending to the same few countries, which quicklylearned that they need not engage in responsible policies in the long run because the IMF would besure to help out if they got into trouble. Sometimes the medicine is indeed worse than the disease!
Trouble can also arise when a central bank no longer wants to accumulate international reserves (orindeed any assets) because it wants to squelch domestic inflation, as it did in Germany in 1990–1992.Many fear that China, which currently owns over $1 trillion in international reserves (mostly USD),will find itself in this conundrum soon. The Chinese government accumulated such a huge amount ofreserves by fixing its currency (which confusingly goes by two names, the yuan and the renminbi, butone symbol, CNY) at the rate of CNY8.28 per USD. Due to the growth of the Chinese economy relativeto the U.S. economy, E* exceeded Epeg, inducing the Chinese, per the analysis above, to sell CNY forinternational reserves to keep the yuan permanently weak, or undervalued relative to the value themarket would have assigned it.
You should recall from Chapter 18 that undervaluing the yuan helps Chinese exports by makingthem appear cheap to foreigners. (If you don’t believe me, walk into any Wal-Mart, Target, or otherdiscount store.) Many people think that China’s peg is unfair, a monetary form of dirty pool. Such folksneed to realize that there is no such thing as a free lunch. To maintain its peg, the Chinese governmenthas severely restricted international capital mobility via currency controls, thereby injuring the effi-ciency of Chinese financial markets, limiting foreign direct investment, and encouraging mass loopholemining. It is also stuck with a trillion bucks of relatively low-yielding international reserves that will de-cline in value when the yuan floats (and probably appreciates strongly), as it eventually must. In otherwords, China is setting itself up for the exact opposite of the Southeast Asian Crisis of 1997–1998, wherethe value of its assets will plummet instead of the value of its liabilities skyrocketing.
In China’s defense, many developing countries find it advantageous to peg their exchange rates tothe dollar, the yen, the euro, the pound sterling, or a basket of such important currencies. The peg,which can be thought of as a monetary policy target similar to an inflation or money supply target, allowsthe developing nation’s central bank to figure out whether to increase or decrease MB and by how much.A hard peg or narrow band effectively ties the domestic inflation rate to that of the anchor country,[1] in-stilling confidence in the developing country’s macroeconomic performance.
Indeed, in extreme cases, some countries have given up their central bank altogether and have dol-larized, adopting USD or other currencies (though the process is still called dollarization) as their own.No international law prevents this, and indeed the country whose currency is adopted earns seignior-age and hence has little grounds for complaint. Countries that want to completely outsource theirmonetary policy but maintain seigniorage revenue (the profits from the issuance of money) adopt acurrency board that issues domestic currency but backs it 100 percent with assets denominated in theanchor currency. (The board invests the reserves in interest-bearing assets, the source of the seignior-age.) Argentina benefited from just such a board during the 1990s, when it pegged its peso one-to-onewith the dollar, because it finally got inflation, which often ran over 100 percent per year, undercontrol.
Fixed exchange rates not based on commodities like gold or silver are notoriously fragile, however,because relative macroeconomic changes in interest rates, trade, and productivity can create persistentimbalances over time between the developing and the anchor currencies. Moreover, speculators can forcecountries to devalue (move Epeg down) or revalue (move Epeg up) when they hit the bottom or top of aband. They do so by using the derivatives markets to place big bets on the future exchange rate. Unlikemost bets, these are one-sided because the speculators lose little money if the central bank successfullydefends the peg, but they win a lot if it fails to. Speculator George Soros, for example, is reported tohave made $1 billion speculating against the pound sterling during the ERM balance of payments crisisin September 1992. Such crises can cause tremendous economic pain, as when Argentina found it ne-cessary to abandon its currency board and one-to-one peg with the dollar in 2001–2002 due to
224 MONEY AND BANKING
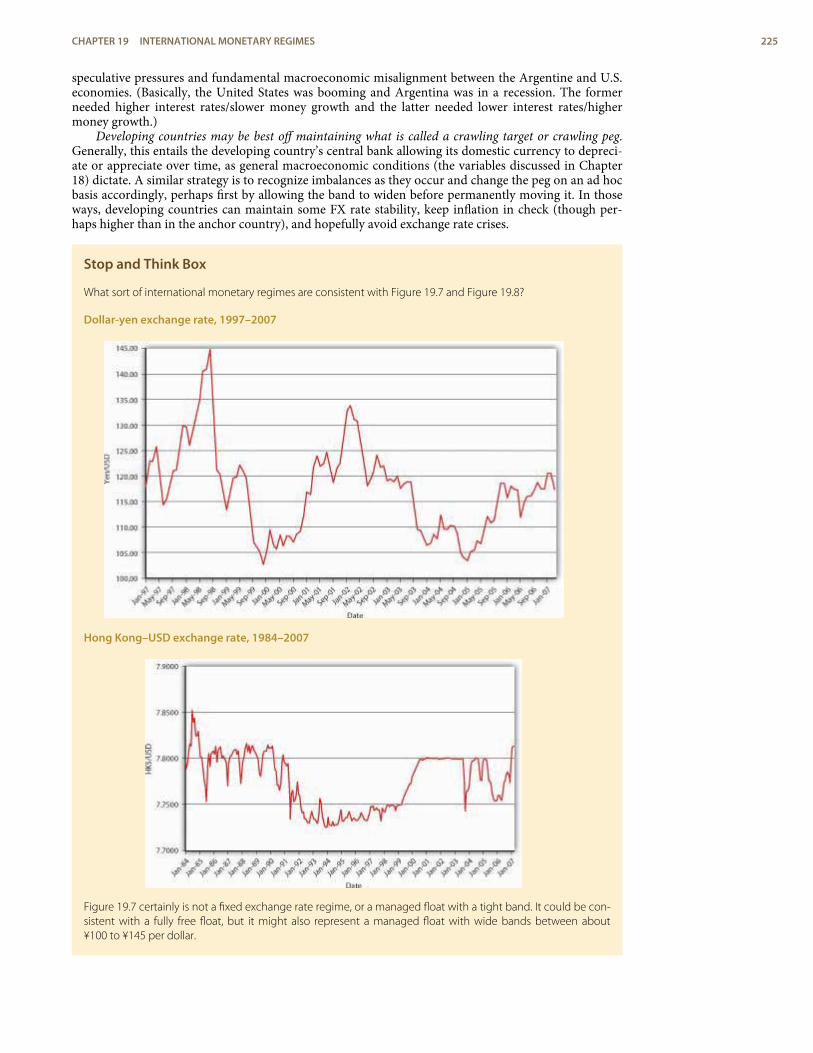
speculative pressures and fundamental macroeconomic misalignment between the Argentine and U.S.economies. (Basically, the United States was booming and Argentina was in a recession. The formerneeded higher interest rates/slower money growth and the latter needed lower interest rates/highermoney growth.)
Developing countries may be best off maintaining what is called a crawling target or crawling peg.Generally, this entails the developing country’s central bank allowing its domestic currency to depreci-ate or appreciate over time, as general macroeconomic conditions (the variables discussed in Chapter18) dictate. A similar strategy is to recognize imbalances as they occur and change the peg on an ad hocbasis accordingly, perhaps first by allowing the band to widen before permanently moving it. In thoseways, developing countries can maintain some FX rate stability, keep inflation in check (though per-haps higher than in the anchor country), and hopefully avoid exchange rate crises.
Stop and Think Box
What sort of international monetary regimes are consistent with Figure 19.7 and Figure 19.8?
Dollar-yen exchange rate, 1997–2007
Hong Kong–USD exchange rate, 1984–2007
Figure 19.7 certainly is not a fixed exchange rate regime, or a managed float with a tight band. It could be con-sistent with a fully free float, but it might also represent a managed float with wide bands between about¥100 to ¥145 per dollar.
CHAPTER 19 INTERNATIONAL MONETARY REGIMES 225
It appears highly likely from Figure 19.8 that Hong Kong’s monetary authority for most of the period from 1984to 2007 engaged in a managed float within fairly tight bands bounded by about HK7.725 and HK7.80 to thedollar. Also, for three years early in the new millennium, it pegged the dollar at HK7.80 before returning to alooser but still tight band in 2004.
K E Y T A K E A W A Y S
< A country with weak institutions (e.g., a dependent central bank that allows rampant inflation) canessentially free-ride on the monetary policy of a developed country by fixing or pegging its currency to thedollar, euro, yen, pound sterling, or other anchoring currency to a greater or lesser degree.
< In fact, in the limit, a country can simply adopt another country’s currency as its own in a process calleddollarization.
< If it wants to continue earning seigniorage (profits from the issuance of money), it can create a currencyboard, the function of which is to maintain 100 percent reserves and full convertibility between thedomestic currency and the anchor currency.
< At the other extreme, it can create a crawling peg with wide bands, allowing its currency to appreciate ordepreciate day to day according to the interaction of supply and demand, slowly adjusting the band andpeg in the long term as macroeconomic conditions dictate.
< When a currency is overvalued, which is to say, when the central bank sets Epeg higher than E* (when E isexpressed as foreign currency/domestic currency), the central bank must appreciate the currency byselling international reserves for its domestic currency.
< It may run out of reserves before doing so, however, sparking a rapid depreciation that could trigger afinancial crisis by rapidly increasing the real value of debts owed by domestic residents but denominatedin foreign currencies.
< When a currency is undervalued, which is to say, when the central bank sets Epeg below E*, the centralbank must depreciate its domestic currency by exchanging it for international reserves. It may accumulatetoo many such reserves, which often have low yields and which could quickly lose value if the domesticcurrency suddenly appreciates, perhaps with the aid of a good push by currency speculators making bigone-sided bets.
5. SUGGESTED READINGBordon, Michael, and Barry Eichengreen. A Retrospective on the Bretton Woods Systemml: Lessons
for International Monetary Reform. Chicago, IL: University of Chicago Press, 1993.Eichengreen, Barry. Globalizing Capital: A History of the International Monetary System. Prin-
ceton, NJ: Princeton University Press, 2008.Gallorotti, Giulio. The Anatomy of an International Monetary Regime: The Classical Gold Stand-
ard, 1880–1914. New York: Oxford University Press, 1995.Moosa, Imad. Exchange Rate Regimes: Fixed, Flexible or Something in Between. New York: Palgrave
Macmillan, 2005.Rosenberg, Michael. Exchange Rate Determination: Models and Strategies for Exchange Rate Fore-
casting. New York: McGraw-Hill, 2003.
226 MONEY AND BANKING

1.
ENDNOTES
As noted in Chapter 18, however, not all goods and services are traded internation-ally, so the rates will not be exactly equal.
CHAPTER 19 INTERNATIONAL MONETARY REGIMES 227

228 MONEY AND BANKING
C H A P T E R 2 0Money Demand
C H A P T E R O B J E C T I V E S
By the end of this chapter, students should be able to:
1. Describe Friedman’s modern quantity theory of money.
2. Describe the classical quantity theory.
3. Describe Keynes’s liquidity preference theory and its improvements.
4. Contrast the modern quantity theory with the liquidity preference theory.
1. THE QUANTITY THEORY
L E A R N I N G O B J E C T I V E
1. What is the quantity theory of money and how was it improved by Milton Friedman?
The rest of this book is about monetary theory, a daunting-sounding term. It’s not the easiest aspect ofmoney and banking, but it isn’t terribly taxing either so there is no need to freak out. We’re going totake it nice and slow. And here’s a big hint: you already know most of the outcomes because we’ve dis-cussed them already in more intuitive terms. In the chapters that follow, we’re simply going to provideyou with more formal ways of thinking about how the money supply determines output (Y*) and the pricelevel (P*).
We’ve already discussed the money supply at some length in the chapters above, so we’ll start ourtheorizing with the demand for money, specifically John Maynard Keynes’s liquidity preference theoryand Milton Friedman’s modern quantity theory of money. Building on the work of earlier scholars, in-cluding Irving Fisher of Fisher Equation fame, the late, great Friedman treats money like any other as-set, concluding that economic agents (individuals, firms, governments) want to hold a certain quantityof real, as opposed to nominal, money balances. If inflation erodes the purchasing power of the unit ofaccount, economic agents will want to hold higher nominal balances to compensate, to keep their realmoney balances constant. The level of those real balances, Friedman argued, was a function of perman-ent income (the present discounted value of all expected future income), the relative expected returnon bonds and stocks versus money, and expected inflation.
More formally,
Md / P : f(Yp <+> , rb – rm <−> , rs – rm <−> , πe – rm <−> )
where:Md/P = demand for real money balances (Md = money demand; P = price level)f means “function of” (not equal to)Yp = permanent incomerb – rm = the expected return on bonds minus the expected return on moneyrs – rm = the expected return on stocks (equities) minus the expected return on moneyπe – rm = expected inflation minus the expected return on money<+> = varies directly with<−> = varies indirectly withSo the demand for real money balances, according to Friedman, increases when permanent income
increases and declines when the expected returns on bonds, stocks, or goods increases versus the expectedreturns on money, which includes both the interest paid on deposits and the services banks provide todepositors.
Stop and Think Box
As noted in the text, money demand is where the action is these days because, as we learned in previouschapters, the central bank determines what the money supply will be, so we can model it as a vertical line.Earlier monetary theorists, however, had no such luxury because, under a specie standard, money was sup-plied exogenously. What did the supply curve look like before the rise of modern central banking in the twen-tieth century?
The supply curve sloped upward, as most do. You can think of this in two ways, first, by thinking of interest onthe vertical axis. Interest is literally the price of money. When interest is high, more people want to supplymoney to the system because seigniorage is higher. So more people want to form banks or find other ways ofissuing money, extant bankers want to issue more money (notes and/or deposits), and so forth. You can alsothink of this in terms of the price of gold. When its price is low, there is not much incentive to go out and findmore of it because you can earn just as much making cheesecake or whatever. When the price of gold is high,however, everybody wants to go out and prospect for new veins or for new ways of extracting gold atomsfrom what looks like plain old dirt. The point is that early monetary theorists did not have the luxury of concen-trating on the nature of money demand; they also had to worry about the nature of money supply.
This all makes perfectly good sense when you think about it. If people suspect they are permanentlymore wealthy, they are going to want to hold more money, in real terms, so they can buy caviar andfancy golf clubs and what not. If the return on financial investments decreases vis-à-vis money, theywill want to hold more money because its opportunity cost is lower. If inflation expectations increase,but the return on money doesn’t, people will want to hold less money, ceteris paribus, because the rel-ative return on goods (land, gold, turnips) will increase. (In other words, expected inflation here prox-ies the expected return on nonfinancial goods.)
K E Y T A K E A W A Y S
< According to Milton Friedman, demand for real money balances (Md/P) is directly related to permanentincome (Yp)—the discounted present value of expected future income—and indirectly related to theexpected differential returns from bonds, stocks (equities), and goods vis-à-vis money (rb – rm, rs – rm, πe –rm ), where inflation (π) proxies the return on goods.
< Because he believed that the return on money would increase (decrease) as returns on bonds, stocks, andgoods increased (decreased), Friedman did not think that interest rate changes mattered much.
2. LIQUIDITY PREFERENCE THEORY
L E A R N I N G O B J E C T I V E
1. What is the liquidity preference theory and how has it been improved?
The very late and very great John Maynard Keynes (to distinguish him from his father, economist JohnNeville Keynes) developed the liquidity preference theory in response to the rather primitive pre-Fried-man quantity theory of money, which was simply an assumption-laden identity called the equation ofexchange:
MV = PY
where:M = money supplyV = velocityP = price levelY = outputNobody doubted the equation itself, which, as an identity (like x = x), is undeniable. But many
doubted the way that classical quantity theorists used the equation of exchange as the causal statement:increases in the money supply lead to proportional increases in the price level. The classical quantity the-ory also suffered by assuming that money velocity, the number of times per year a unit of currency wasspent, was constant. Although a good first approximation of reality, the classical quantity theory, which
230 MONEY AND BANKING
critics derided as the “naïve quantity theory of money,” was hardly the entire story. In particular, itcould not explain why velocity was pro-cyclical, i.e., why it increased during business expansions anddecreased during recessions.
To find a better theory, Keynes took a different point of departure, asking in effect, “Why do eco-nomic agents hold money?” He came up with three reasons:
1. Transactions: Economic agents need money to make payments. As their incomes rise, so, too, dothe number and value of those payments, so this part of money demand is proportional to income.
2. Precautions: S—t happens was a catch phrase of the 1980s, recalled perhaps most famously in thehit movie Forrest Gump. Way back in the 1930s, Keynes already knew that bad stuffhappens—and that one defense against it was to keep some spare cash lying around as aprecaution. It, too, is directly proportional to income, Keynes believed.
3. Speculations: People will hold more bonds than money when interest rates are high for tworeasons. The opportunity cost of holding money (which Keynes assumed has zero return) ishigher and the expectation is that interest rates will fall, raising the price of bonds. When interestrates are low, the opportunity cost of holding money is low, and the expectation is that rates willrise, decreasing the price of bonds. So people hold larger money balances when rates are low.Overall, then, money demand and interest rates are inversely related.
More formally, Keynes’s ideas can be stated as
Md / P = f(i <−> , Y <+> )
where:Md/P = demand for real money balancesf means “function of” (this simplifies the mathematics)i = interest rateY = output (income)<+> = varies directly with<−> = varies indirectly withAn increase in interest rates induces people to decrease real money balances for a given income
level, implying that velocity must be higher. So Keynes’s view was superior to the classical quantity the-ory of money because he showed that velocity is not constant but rather is positively related to interestrates, thereby explaining its pro-cyclical nature. (Recall from Chapter 5 that interest rates rise during ex-pansions and fall during recessions.) Keynes’s theory was also fruitful because it induced other scholarsto elaborate on it further.
In the early 1950s, for example, a young Will Baumol[1] and James Tobin[2] independently showedthat money balances, held for transaction purposes (not just speculative ones), were sensitive to interestrates, even if the return on money was zero. That is because people can hold bonds or other interest-bearing securities until they need to make a payment. When interest rates are high, people will hold aslittle money for transaction purposes as possible because it will be worth the time and trouble of invest-ing in bonds and then liquidating them when needed. When rates are low, by contrast, people will holdmore money for transaction purposes because it isn’t worth the hassle and brokerage fees to play withbonds very often. So transaction demand for money is negatively related to interest rates. A similartrade-off applies also to precautionary balances. The lure of high interest rates offsets the fear of badevents occurring. When rates are low, better to play it safe and hold more dough. So the precautionarydemand for money is also negatively related to interest rates.
CHAPTER 20 MONEY DEMAND 231
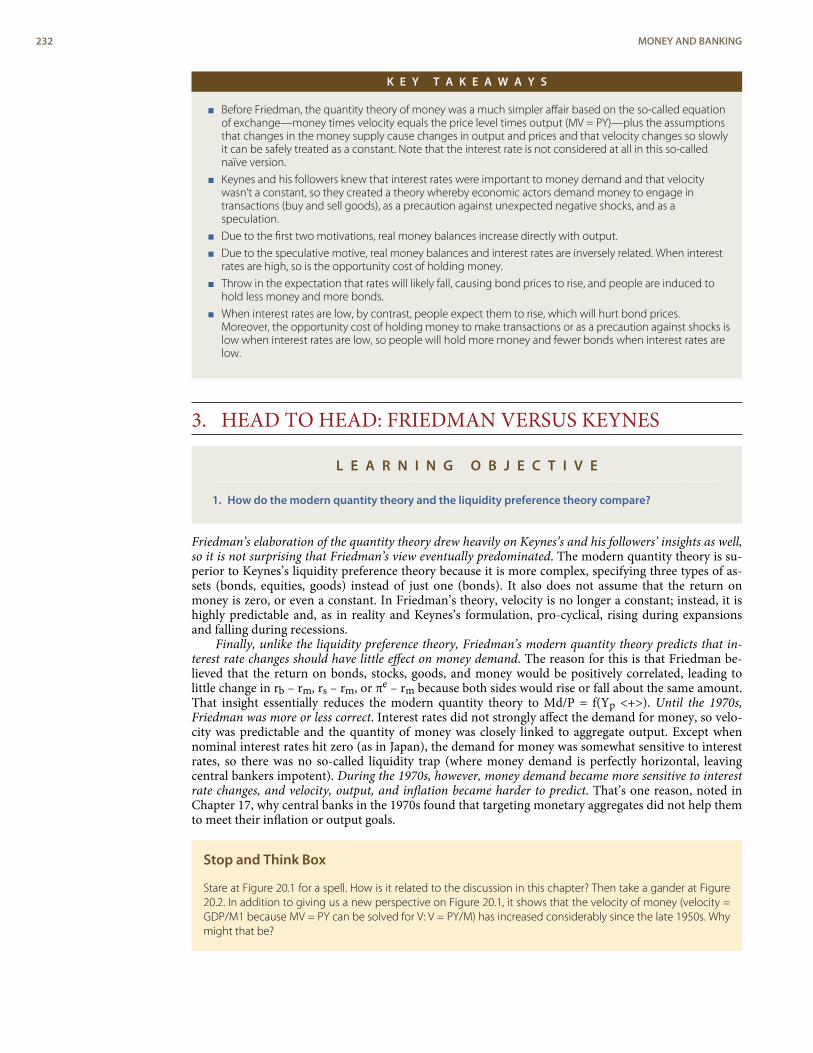
K E Y T A K E A W A Y S
< Before Friedman, the quantity theory of money was a much simpler affair based on the so-called equationof exchange—money times velocity equals the price level times output (MV = PY)—plus the assumptionsthat changes in the money supply cause changes in output and prices and that velocity changes so slowlyit can be safely treated as a constant. Note that the interest rate is not considered at all in this so-callednaïve version.
< Keynes and his followers knew that interest rates were important to money demand and that velocitywasn’t a constant, so they created a theory whereby economic actors demand money to engage intransactions (buy and sell goods), as a precaution against unexpected negative shocks, and as aspeculation.
< Due to the first two motivations, real money balances increase directly with output.
< Due to the speculative motive, real money balances and interest rates are inversely related. When interestrates are high, so is the opportunity cost of holding money.
< Throw in the expectation that rates will likely fall, causing bond prices to rise, and people are induced tohold less money and more bonds.
< When interest rates are low, by contrast, people expect them to rise, which will hurt bond prices.Moreover, the opportunity cost of holding money to make transactions or as a precaution against shocks islow when interest rates are low, so people will hold more money and fewer bonds when interest rates arelow.
3. HEAD TO HEAD: FRIEDMAN VERSUS KEYNES
L E A R N I N G O B J E C T I V E
1. How do the modern quantity theory and the liquidity preference theory compare?
Friedman’s elaboration of the quantity theory drew heavily on Keynes’s and his followers’ insights as well,so it is not surprising that Friedman’s view eventually predominated. The modern quantity theory is su-perior to Keynes’s liquidity preference theory because it is more complex, specifying three types of as-sets (bonds, equities, goods) instead of just one (bonds). It also does not assume that the return onmoney is zero, or even a constant. In Friedman’s theory, velocity is no longer a constant; instead, it ishighly predictable and, as in reality and Keynes’s formulation, pro-cyclical, rising during expansionsand falling during recessions.
Finally, unlike the liquidity preference theory, Friedman’s modern quantity theory predicts that in-terest rate changes should have little effect on money demand. The reason for this is that Friedman be-lieved that the return on bonds, stocks, goods, and money would be positively correlated, leading tolittle change in rb – rm, rs – rm, or πe – rm because both sides would rise or fall about the same amount.That insight essentially reduces the modern quantity theory to Md/P = f(Yp <+>). Until the 1970s,Friedman was more or less correct. Interest rates did not strongly affect the demand for money, so velo-city was predictable and the quantity of money was closely linked to aggregate output. Except whennominal interest rates hit zero (as in Japan), the demand for money was somewhat sensitive to interestrates, so there was no so-called liquidity trap (where money demand is perfectly horizontal, leavingcentral bankers impotent). During the 1970s, however, money demand became more sensitive to interestrate changes, and velocity, output, and inflation became harder to predict. That’s one reason, noted inChapter 17, why central banks in the 1970s found that targeting monetary aggregates did not help themto meet their inflation or output goals.
Stop and Think Box
Stare at Figure 20.1 for a spell. How is it related to the discussion in this chapter? Then take a gander at Figure20.2. In addition to giving us a new perspective on Figure 20.1, it shows that the velocity of money (velocity =GDP/M1 because MV = PY can be solved for V: V = PY/M) has increased considerably since the late 1950s. Whymight that be?
232 MONEY AND BANKING
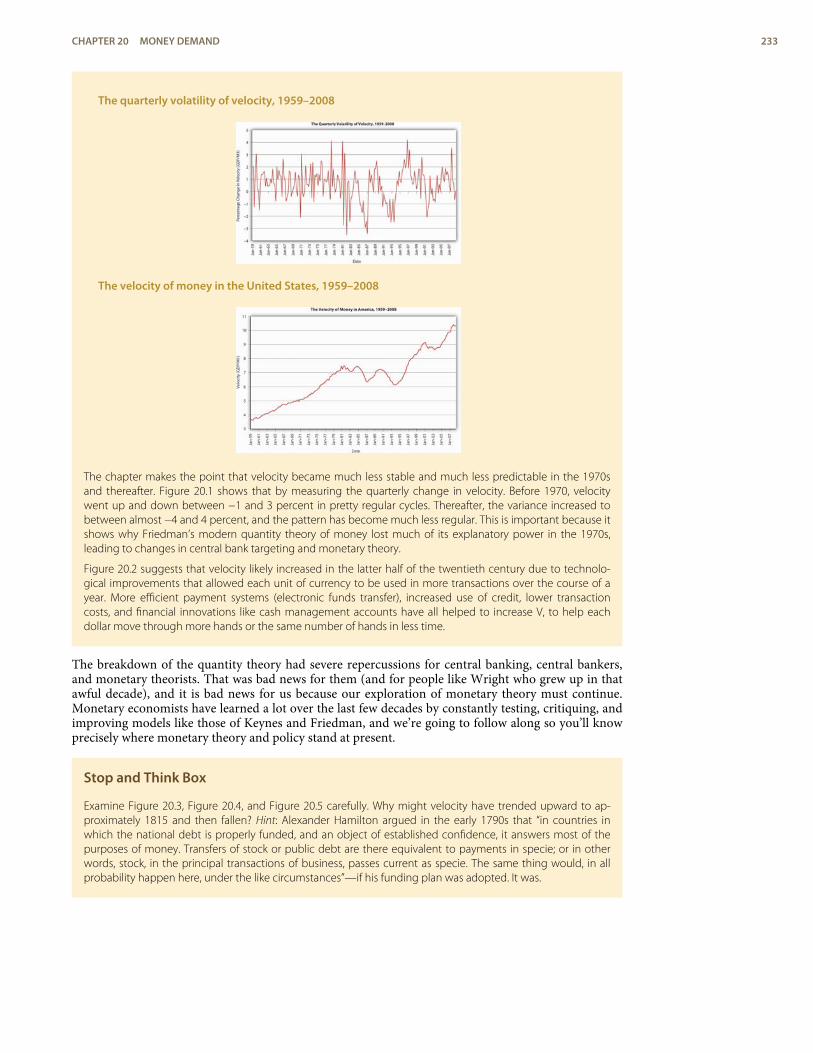
The quarterly volatility of velocity, 1959–2008
The velocity of money in the United States, 1959–2008
The chapter makes the point that velocity became much less stable and much less predictable in the 1970sand thereafter. Figure 20.1 shows that by measuring the quarterly change in velocity. Before 1970, velocitywent up and down between −1 and 3 percent in pretty regular cycles. Thereafter, the variance increased tobetween almost −4 and 4 percent, and the pattern has become much less regular. This is important because itshows why Friedman’s modern quantity theory of money lost much of its explanatory power in the 1970s,leading to changes in central bank targeting and monetary theory.
Figure 20.2 suggests that velocity likely increased in the latter half of the twentieth century due to technolo-gical improvements that allowed each unit of currency to be used in more transactions over the course of ayear. More efficient payment systems (electronic funds transfer), increased use of credit, lower transactioncosts, and financial innovations like cash management accounts have all helped to increase V, to help eachdollar move through more hands or the same number of hands in less time.
The breakdown of the quantity theory had severe repercussions for central banking, central bankers,and monetary theorists. That was bad news for them (and for people like Wright who grew up in thatawful decade), and it is bad news for us because our exploration of monetary theory must continue.Monetary economists have learned a lot over the last few decades by constantly testing, critiquing, andimproving models like those of Keynes and Friedman, and we’re going to follow along so you’ll knowprecisely where monetary theory and policy stand at present.
Stop and Think Box
Examine Figure 20.3, Figure 20.4, and Figure 20.5 carefully. Why might velocity have trended upward to ap-proximately 1815 and then fallen? Hint: Alexander Hamilton argued in the early 1790s that “in countries inwhich the national debt is properly funded, and an object of established confidence, it answers most of thepurposes of money. Transfers of stock or public debt are there equivalent to payments in specie; or in otherwords, stock, in the principal transactions of business, passes current as specie. The same thing would, in allprobability happen here, under the like circumstances”—if his funding plan was adopted. It was.
CHAPTER 20 MONEY DEMAND 233
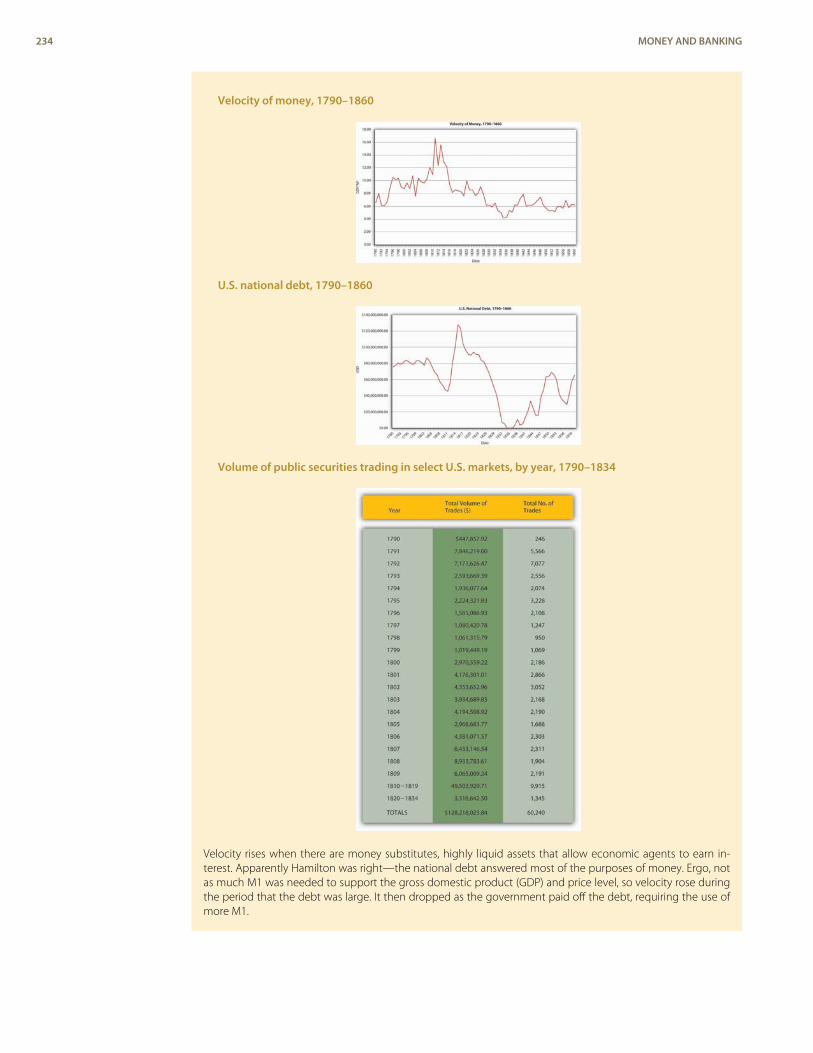
Velocity of money, 1790–1860
U.S. national debt, 1790–1860
Volume of public securities trading in select U.S. markets, by year, 1790–1834
Velocity rises when there are money substitutes, highly liquid assets that allow economic agents to earn in-terest. Apparently Hamilton was right—the national debt answered most of the purposes of money. Ergo, notas much M1 was needed to support the gross domestic product (GDP) and price level, so velocity rose duringthe period that the debt was large. It then dropped as the government paid off the debt, requiring the use ofmore M1.
234 MONEY AND BANKING
K E Y T A K E A W A Y S
< Friedman’s modern quantity theory proved itself superior to Keynes’s liquidity preference theory because itwas more complex, accounting for equities and goods as well as bonds.
< Friedman allowed the return on money to vary and to increase above zero, making it more realistic thanKeynes’s assumption of zero return.
< Money demand was indeed somewhat sensitive to interest rates but velocity, while not constant, waspredictable, making the link between money and prices that Friedman predicted a close one.
< Friedman’s reformulation of the quantity theory held up well only until the 1970s, when it cracked asunderbecause money demand became more sensitive to interest rate changes, thus causing velocity to vacillateunpredictably and breaking the close link between the quantity of money and output and inflation.
4. SUGGESTED READINGFriedman, Milton. Money Mischief: Episodes in Monetary History. New York: Harvest, 1994.Friedman, Milton, and Anna Jacobson. A Monetary History of the United States, 1867–1960
(Princeton, NJ: Princeton University Press, 1971).Kindleberger, Charles. Keynesianism vs. Monetarism and Other Essays in Financial History. Lon-
don: George Allen & Unwin, 1985.Minsky, Hyman. John Maynard Keynes. New York: McGraw-Hill, 2008)Serletis, Apostolos. The Demand for Money: Theoretical and Empirical Approaches. New York:
Springer, 2007.
CHAPTER 20 MONEY DEMAND 235

1.
2.ENDNOTES
http://pages.stern.nyu.edu/~wbaumol/
http://nobelprize.org/nobel_prizes/economics/laureates/1981/tobin-autobio.html
236 MONEY AND BANKING
C H A P T E R 2 1IS-LM
C H A P T E R O B J E C T I V E S
By the end of this chapter, students should be able to:
1. Explain this equation: Y = Yad = C + I + G + NX.
2. Provide the equation for C and explain its importance.
3. Describe the Keynesian cross diagram and explain its use.
4. Describe the investment-savings (IS) curve and its characteristics.
5. Describe the liquidity preference–money (LM) curve and its characteristics.
6. Explain why equilibrium is achieved in the markets for goods and money.
7. Explain the IS-LM model’s biggest drawback.
1. AGGREGATE OUTPUT AND KEYNESIAN CROSSDIAGRAMS
L E A R N I N G O B J E C T I V E S
1. What does this equation mean: Y = Yad = C + I + G + NX?2. Why is this equation important?3. What is the equation for C and why is it important?4. What is the Keynesian cross diagram and what does it help us to do?
Developed in 1937 by economist and Keynes disciple John Hicks, the IS-LM model is still used today tomodel aggregate output (gross domestic product [GDP], gross national product [GNP], etc.) and interestrates in the short run.[1] It begins with John Maynard Keynes’s recognition that
Y = Yad = C + I + G + NX
where:Y = aggregate output (supplied)Yad = aggregate demandC = consumer expenditureI = investment (on new physical capital like computers and factories, and planned inventory)G = government spendingNX = net exports (exports minus imports)Keynes further explained that C = a + (mpc × Yd)where:Yd = disposable income, all that income above aa = autonomous consumer expenditure (food, clothing, shelter, and other necessaries)mpc = marginal propensity to consume (change in consumer expenditure from an extra dollar of
income or “disposable income;” it is a constant bounded by 0 and 1)Practice calculating C in Exercise 1.
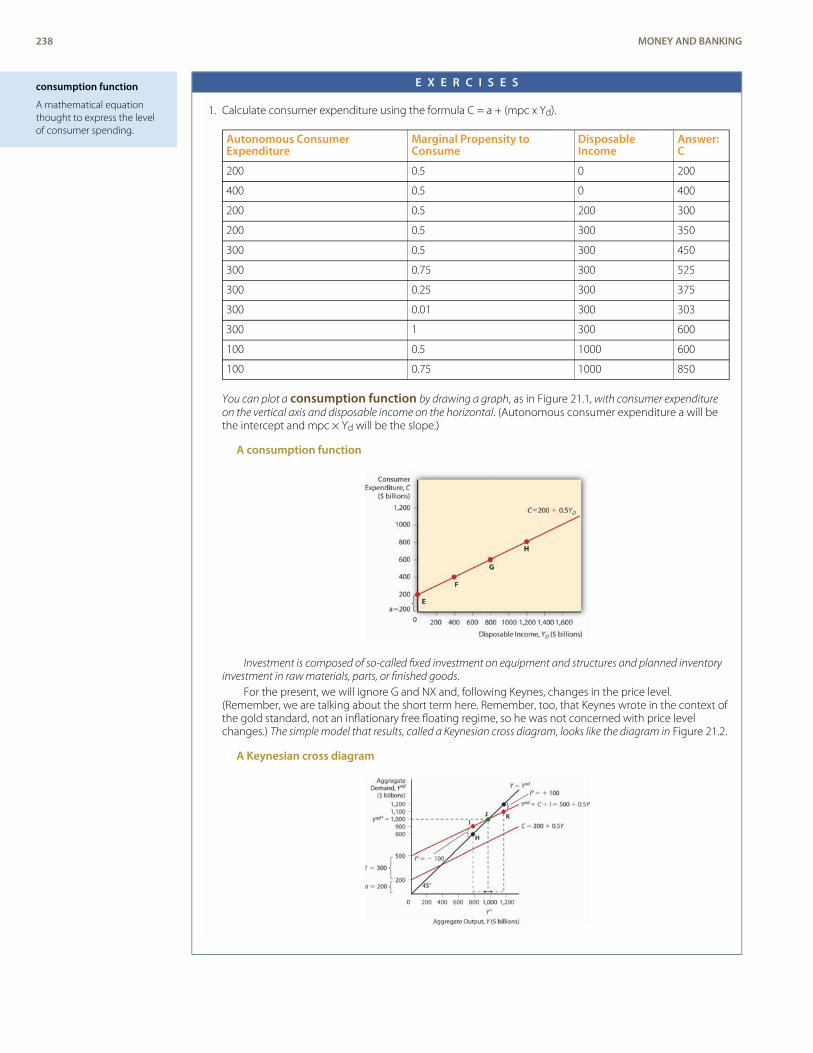
consumption function
A mathematical equationthought to express the levelof consumer spending.
E X E R C I S E S
1. Calculate consumer expenditure using the formula C = a + (mpc x Yd).
Autonomous ConsumerExpenditure
Marginal Propensity toConsume
DisposableIncome
Answer:C
200 0.5 0 200
400 0.5 0 400
200 0.5 200 300
200 0.5 300 350
300 0.5 300 450
300 0.75 300 525
300 0.25 300 375
300 0.01 300 303
300 1 300 600
100 0.5 1000 600
100 0.75 1000 850
You can plot a consumption function by drawing a graph, as in Figure 21.1, with consumer expenditureon the vertical axis and disposable income on the horizontal. (Autonomous consumer expenditure a will bethe intercept and mpc × Yd will be the slope.)
A consumption function
Investment is composed of so-called fixed investment on equipment and structures and planned inventoryinvestment in raw materials, parts, or finished goods.
For the present, we will ignore G and NX and, following Keynes, changes in the price level.(Remember, we are talking about the short term here. Remember, too, that Keynes wrote in the context ofthe gold standard, not an inflationary free floating regime, so he was not concerned with price levelchanges.) The simple model that results, called a Keynesian cross diagram, looks like the diagram in Figure 21.2.
A Keynesian cross diagram
238 MONEY AND BANKING
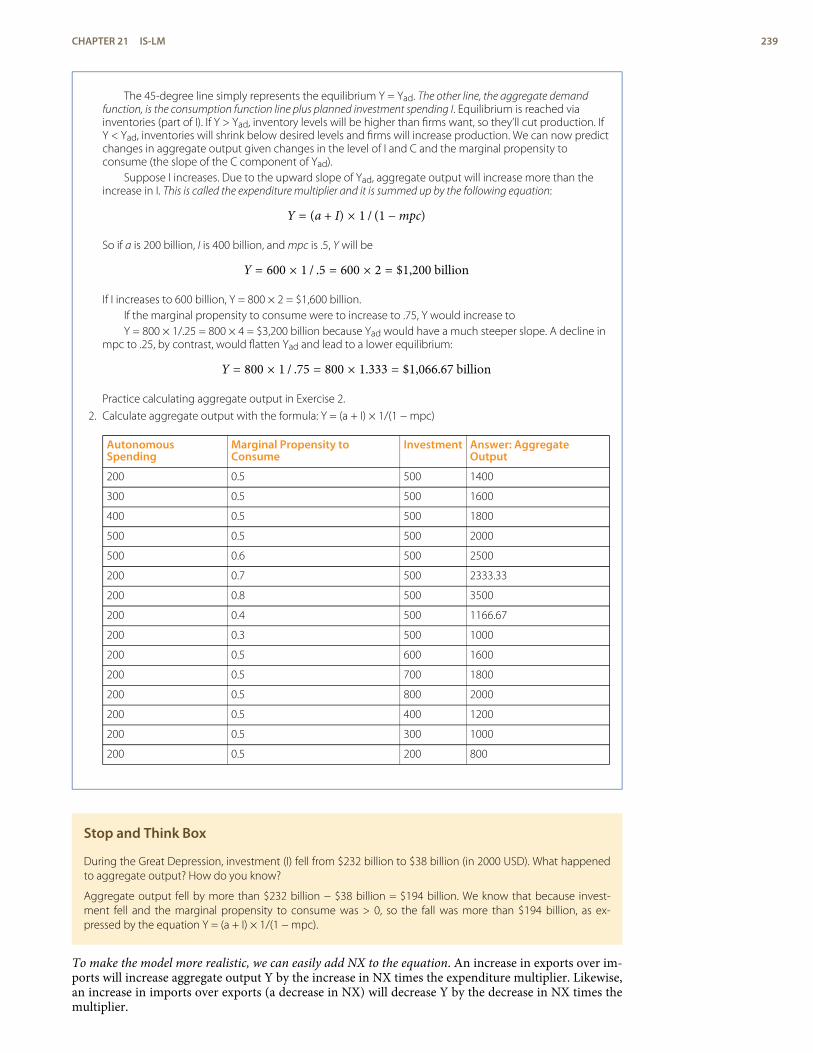
The 45-degree line simply represents the equilibrium Y = Yad. The other line, the aggregate demandfunction, is the consumption function line plus planned investment spending I. Equilibrium is reached viainventories (part of I). If Y > Yad, inventory levels will be higher than firms want, so they’ll cut production. IfY < Yad, inventories will shrink below desired levels and firms will increase production. We can now predictchanges in aggregate output given changes in the level of I and C and the marginal propensity toconsume (the slope of the C component of Yad).
Suppose I increases. Due to the upward slope of Yad, aggregate output will increase more than theincrease in I. This is called the expenditure multiplier and it is summed up by the following equation:
Y = (a + I) × 1 / (1 − mpc)
So if a is 200 billion, I is 400 billion, and mpc is .5, Y will be
Y = 600 × 1 / .5 = 600 × 2 = $1,200 billion
If I increases to 600 billion, Y = 800 × 2 = $1,600 billion.If the marginal propensity to consume were to increase to .75, Y would increase toY = 800 × 1/.25 = 800 × 4 = $3,200 billion because Yad would have a much steeper slope. A decline in
mpc to .25, by contrast, would flatten Yad and lead to a lower equilibrium:
Y = 800 × 1 / .75 = 800 × 1.333 = $1,066.67 billion
Practice calculating aggregate output in Exercise 2.
2. Calculate aggregate output with the formula: Y = (a + I) × 1/(1 − mpc)
AutonomousSpending
Marginal Propensity toConsume
Investment Answer: AggregateOutput
200 0.5 500 1400
300 0.5 500 1600
400 0.5 500 1800
500 0.5 500 2000
500 0.6 500 2500
200 0.7 500 2333.33
200 0.8 500 3500
200 0.4 500 1166.67
200 0.3 500 1000
200 0.5 600 1600
200 0.5 700 1800
200 0.5 800 2000
200 0.5 400 1200
200 0.5 300 1000
200 0.5 200 800
Stop and Think Box
During the Great Depression, investment (I) fell from $232 billion to $38 billion (in 2000 USD). What happenedto aggregate output? How do you know?
Aggregate output fell by more than $232 billion − $38 billion = $194 billion. We know that because invest-ment fell and the marginal propensity to consume was > 0, so the fall was more than $194 billion, as ex-pressed by the equation Y = (a + I) × 1/(1 − mpc).
To make the model more realistic, we can easily add NX to the equation. An increase in exports over im-ports will increase aggregate output Y by the increase in NX times the expenditure multiplier. Likewise,an increase in imports over exports (a decrease in NX) will decrease Y by the decrease in NX times themultiplier.
CHAPTER 21 IS-LM 239
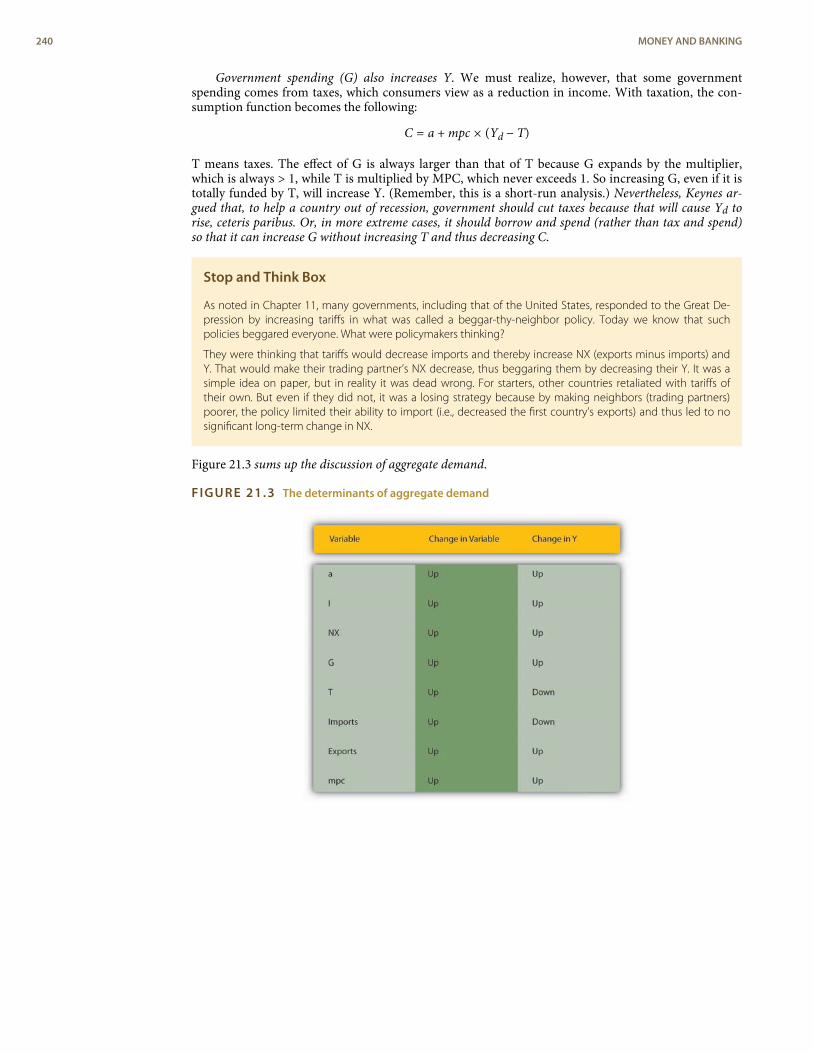
Government spending (G) also increases Y. We must realize, however, that some governmentspending comes from taxes, which consumers view as a reduction in income. With taxation, the con-sumption function becomes the following:
C = a + mpc × (Yd − T)
T means taxes. The effect of G is always larger than that of T because G expands by the multiplier,which is always > 1, while T is multiplied by MPC, which never exceeds 1. So increasing G, even if it istotally funded by T, will increase Y. (Remember, this is a short-run analysis.) Nevertheless, Keynes ar-gued that, to help a country out of recession, government should cut taxes because that will cause Yd torise, ceteris paribus. Or, in more extreme cases, it should borrow and spend (rather than tax and spend)so that it can increase G without increasing T and thus decreasing C.
Stop and Think Box
As noted in Chapter 11, many governments, including that of the United States, responded to the Great De-pression by increasing tariffs in what was called a beggar-thy-neighbor policy. Today we know that suchpolicies beggared everyone. What were policymakers thinking?
They were thinking that tariffs would decrease imports and thereby increase NX (exports minus imports) andY. That would make their trading partner’s NX decrease, thus beggaring them by decreasing their Y. It was asimple idea on paper, but in reality it was dead wrong. For starters, other countries retaliated with tariffs oftheir own. But even if they did not, it was a losing strategy because by making neighbors (trading partners)poorer, the policy limited their ability to import (i.e., decreased the first country’s exports) and thus led to nosignificant long-term change in NX.
Figure 21.3 sums up the discussion of aggregate demand.
FIGURE 21.3 The determinants of aggregate demand
240 MONEY AND BANKING
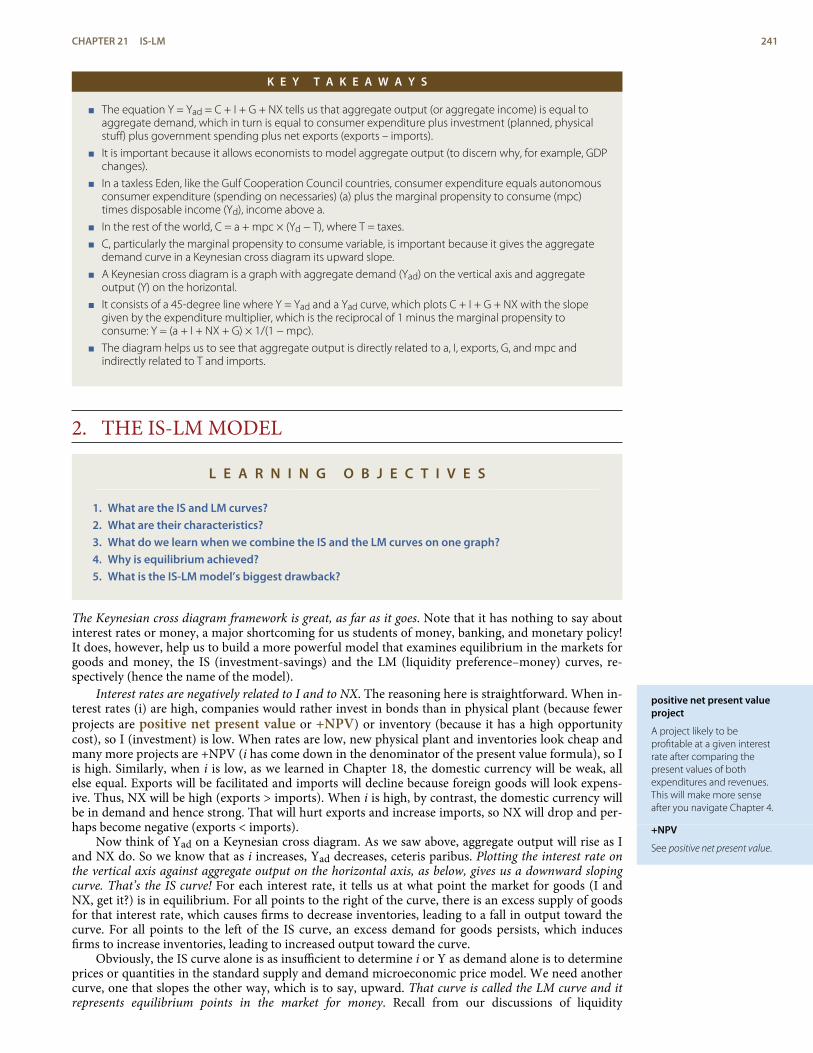
positive net present valueproject
A project likely to beprofitable at a given interestrate after comparing thepresent values of bothexpenditures and revenues.This will make more senseafter you navigate Chapter 4.
+NPV
See positive net present value.
K E Y T A K E A W A Y S
< The equation Y = Yad = C + I + G + NX tells us that aggregate output (or aggregate income) is equal toaggregate demand, which in turn is equal to consumer expenditure plus investment (planned, physicalstuff) plus government spending plus net exports (exports – imports).
< It is important because it allows economists to model aggregate output (to discern why, for example, GDPchanges).
< In a taxless Eden, like the Gulf Cooperation Council countries, consumer expenditure equals autonomousconsumer expenditure (spending on necessaries) (a) plus the marginal propensity to consume (mpc)times disposable income (Yd), income above a.
< In the rest of the world, C = a + mpc × (Yd − T), where T = taxes.
< C, particularly the marginal propensity to consume variable, is important because it gives the aggregatedemand curve in a Keynesian cross diagram its upward slope.
< A Keynesian cross diagram is a graph with aggregate demand (Yad) on the vertical axis and aggregateoutput (Y) on the horizontal.
< It consists of a 45-degree line where Y = Yad and a Yad curve, which plots C + I + G + NX with the slopegiven by the expenditure multiplier, which is the reciprocal of 1 minus the marginal propensity toconsume: Y = (a + I + NX + G) × 1/(1 − mpc).
< The diagram helps us to see that aggregate output is directly related to a, I, exports, G, and mpc andindirectly related to T and imports.
2. THE IS-LM MODEL
L E A R N I N G O B J E C T I V E S
1. What are the IS and LM curves?2. What are their characteristics?3. What do we learn when we combine the IS and the LM curves on one graph?4. Why is equilibrium achieved?5. What is the IS-LM model’s biggest drawback?
The Keynesian cross diagram framework is great, as far as it goes. Note that it has nothing to say aboutinterest rates or money, a major shortcoming for us students of money, banking, and monetary policy!It does, however, help us to build a more powerful model that examines equilibrium in the markets forgoods and money, the IS (investment-savings) and the LM (liquidity preference–money) curves, re-spectively (hence the name of the model).
Interest rates are negatively related to I and to NX. The reasoning here is straightforward. When in-terest rates (i) are high, companies would rather invest in bonds than in physical plant (because fewerprojects are positive net present value or +NPV) or inventory (because it has a high opportunitycost), so I (investment) is low. When rates are low, new physical plant and inventories look cheap andmany more projects are +NPV (i has come down in the denominator of the present value formula), so Iis high. Similarly, when i is low, as we learned in Chapter 18, the domestic currency will be weak, allelse equal. Exports will be facilitated and imports will decline because foreign goods will look expens-ive. Thus, NX will be high (exports > imports). When i is high, by contrast, the domestic currency willbe in demand and hence strong. That will hurt exports and increase imports, so NX will drop and per-haps become negative (exports < imports).
Now think of Yad on a Keynesian cross diagram. As we saw above, aggregate output will rise as Iand NX do. So we know that as i increases, Yad decreases, ceteris paribus. Plotting the interest rate onthe vertical axis against aggregate output on the horizontal axis, as below, gives us a downward slopingcurve. That’s the IS curve! For each interest rate, it tells us at what point the market for goods (I andNX, get it?) is in equilibrium. For all points to the right of the curve, there is an excess supply of goodsfor that interest rate, which causes firms to decrease inventories, leading to a fall in output toward thecurve. For all points to the left of the IS curve, an excess demand for goods persists, which inducesfirms to increase inventories, leading to increased output toward the curve.
Obviously, the IS curve alone is as insufficient to determine i or Y as demand alone is to determineprices or quantities in the standard supply and demand microeconomic price model. We need anothercurve, one that slopes the other way, which is to say, upward. That curve is called the LM curve and itrepresents equilibrium points in the market for money. Recall from our discussions of liquidity
CHAPTER 21 IS-LM 241
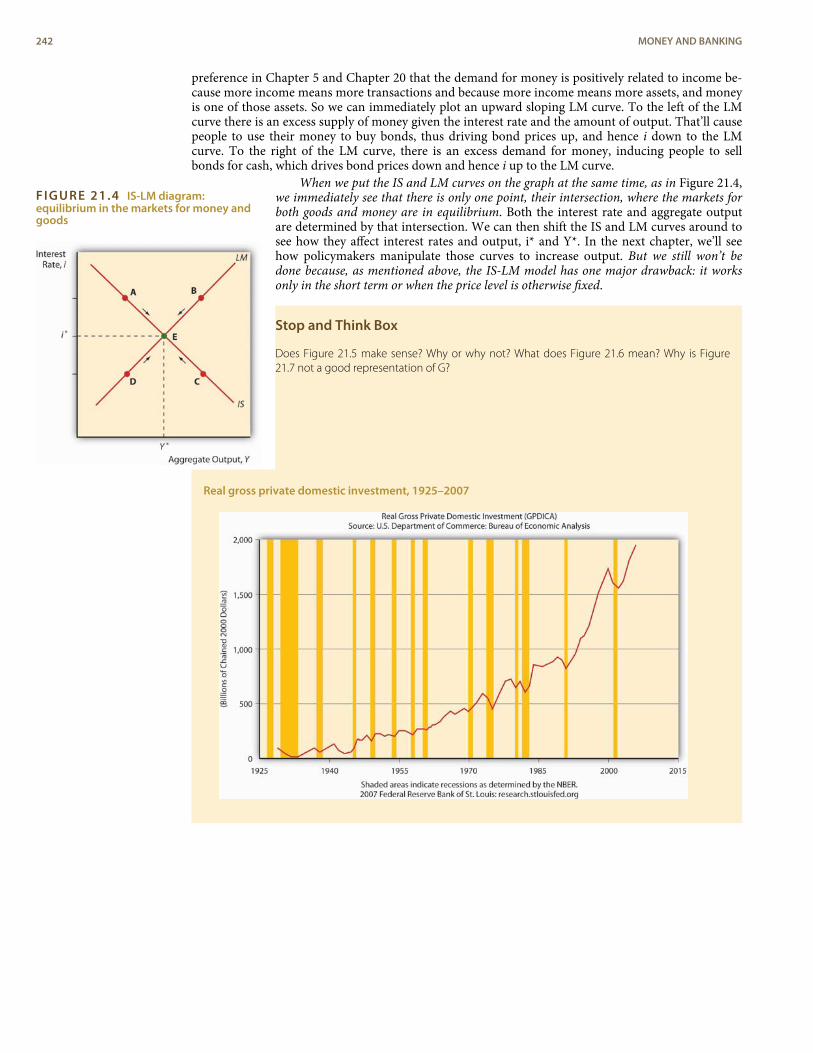
FIGURE 21.4 IS-LM diagram:equilibrium in the markets for money andgoods
preference in Chapter 5 and Chapter 20 that the demand for money is positively related to income be-cause more income means more transactions and because more income means more assets, and moneyis one of those assets. So we can immediately plot an upward sloping LM curve. To the left of the LMcurve there is an excess supply of money given the interest rate and the amount of output. That’ll causepeople to use their money to buy bonds, thus driving bond prices up, and hence i down to the LMcurve. To the right of the LM curve, there is an excess demand for money, inducing people to sellbonds for cash, which drives bond prices down and hence i up to the LM curve.
When we put the IS and LM curves on the graph at the same time, as in Figure 21.4,we immediately see that there is only one point, their intersection, where the markets forboth goods and money are in equilibrium. Both the interest rate and aggregate outputare determined by that intersection. We can then shift the IS and LM curves around tosee how they affect interest rates and output, i* and Y*. In the next chapter, we’ll seehow policymakers manipulate those curves to increase output. But we still won’t bedone because, as mentioned above, the IS-LM model has one major drawback: it worksonly in the short term or when the price level is otherwise fixed.
Stop and Think Box
Does Figure 21.5 make sense? Why or why not? What does Figure 21.6 mean? Why is Figure21.7 not a good representation of G?
Real gross private domestic investment, 1925–2007
242 MONEY AND BANKING
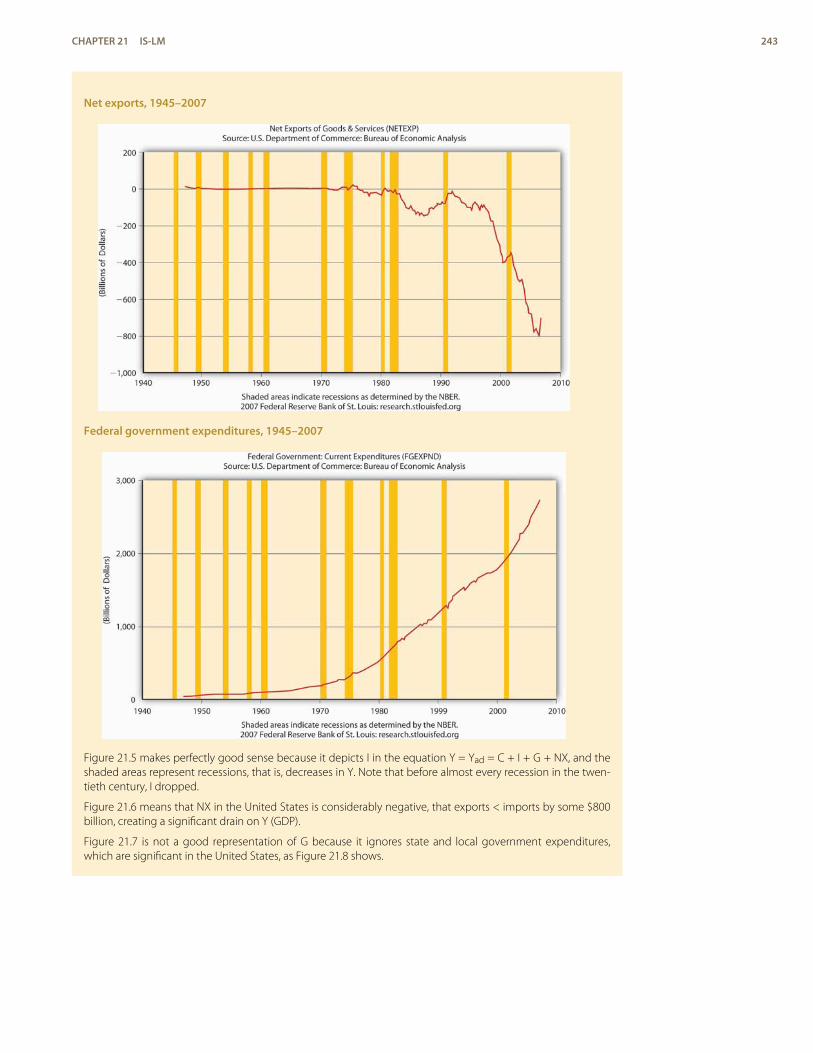
Net exports, 1945–2007
Federal government expenditures, 1945–2007
Figure 21.5 makes perfectly good sense because it depicts I in the equation Y = Yad = C + I + G + NX, and theshaded areas represent recessions, that is, decreases in Y. Note that before almost every recession in the twen-tieth century, I dropped.
Figure 21.6 means that NX in the United States is considerably negative, that exports < imports by some $800billion, creating a significant drain on Y (GDP).
Figure 21.7 is not a good representation of G because it ignores state and local government expenditures,which are significant in the United States, as Figure 21.8 shows.
CHAPTER 21 IS-LM 243
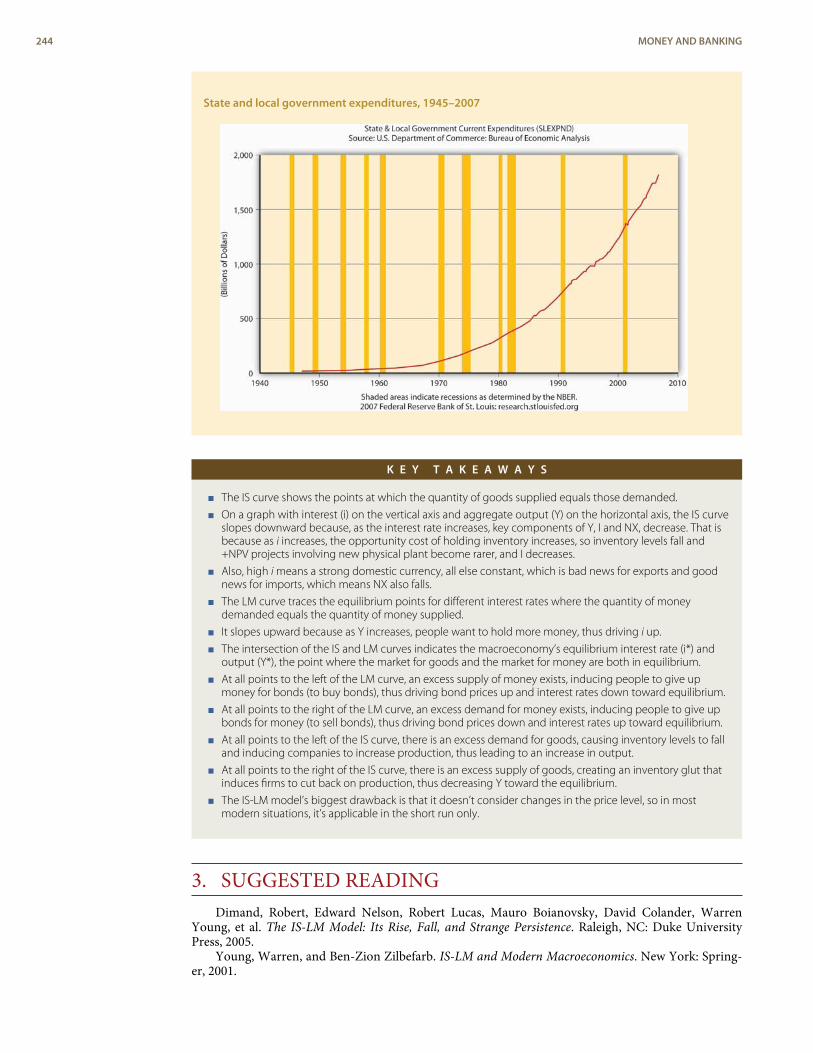
State and local government expenditures, 1945–2007
K E Y T A K E A W A Y S
< The IS curve shows the points at which the quantity of goods supplied equals those demanded.
< On a graph with interest (i) on the vertical axis and aggregate output (Y) on the horizontal axis, the IS curveslopes downward because, as the interest rate increases, key components of Y, I and NX, decrease. That isbecause as i increases, the opportunity cost of holding inventory increases, so inventory levels fall and+NPV projects involving new physical plant become rarer, and I decreases.
< Also, high i means a strong domestic currency, all else constant, which is bad news for exports and goodnews for imports, which means NX also falls.
< The LM curve traces the equilibrium points for different interest rates where the quantity of moneydemanded equals the quantity of money supplied.
< It slopes upward because as Y increases, people want to hold more money, thus driving i up.
< The intersection of the IS and LM curves indicates the macroeconomy’s equilibrium interest rate (i*) andoutput (Y*), the point where the market for goods and the market for money are both in equilibrium.
< At all points to the left of the LM curve, an excess supply of money exists, inducing people to give upmoney for bonds (to buy bonds), thus driving bond prices up and interest rates down toward equilibrium.
< At all points to the right of the LM curve, an excess demand for money exists, inducing people to give upbonds for money (to sell bonds), thus driving bond prices down and interest rates up toward equilibrium.
< At all points to the left of the IS curve, there is an excess demand for goods, causing inventory levels to falland inducing companies to increase production, thus leading to an increase in output.
< At all points to the right of the IS curve, there is an excess supply of goods, creating an inventory glut thatinduces firms to cut back on production, thus decreasing Y toward the equilibrium.
< The IS-LM model’s biggest drawback is that it doesn’t consider changes in the price level, so in mostmodern situations, it’s applicable in the short run only.
3. SUGGESTED READINGDimand, Robert, Edward Nelson, Robert Lucas, Mauro Boianovsky, David Colander, Warren
Young, et al. The IS-LM Model: Its Rise, Fall, and Strange Persistence. Raleigh, NC: Duke UniversityPress, 2005.
Young, Warren, and Ben-Zion Zilbefarb. IS-LM and Modern Macroeconomics. New York: Spring-er, 2001.
244 MONEY AND BANKING

1.
ENDNOTES
http://en.wikipedia.org/wiki/John_Hicks
CHAPTER 21 IS-LM 245

246 MONEY AND BANKING
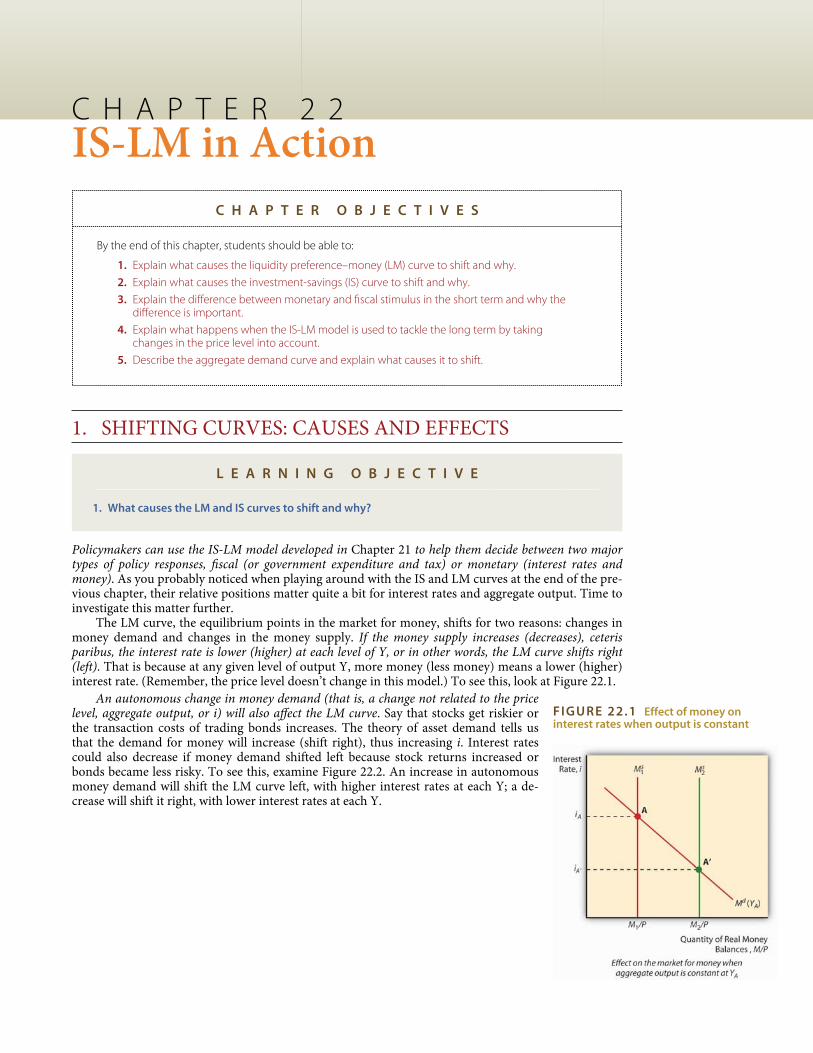
FIGURE 22.1 Effect of money oninterest rates when output is constant
C H A P T E R 2 2IS-LM in Action
C H A P T E R O B J E C T I V E S
By the end of this chapter, students should be able to:
1. Explain what causes the liquidity preference–money (LM) curve to shift and why.
2. Explain what causes the investment-savings (IS) curve to shift and why.
3. Explain the difference between monetary and fiscal stimulus in the short term and why thedifference is important.
4. Explain what happens when the IS-LM model is used to tackle the long term by takingchanges in the price level into account.
5. Describe the aggregate demand curve and explain what causes it to shift.
1. SHIFTING CURVES: CAUSES AND EFFECTS
L E A R N I N G O B J E C T I V E
1. What causes the LM and IS curves to shift and why?
Policymakers can use the IS-LM model developed in Chapter 21 to help them decide between two majortypes of policy responses, fiscal (or government expenditure and tax) or monetary (interest rates andmoney). As you probably noticed when playing around with the IS and LM curves at the end of the pre-vious chapter, their relative positions matter quite a bit for interest rates and aggregate output. Time toinvestigate this matter further.
The LM curve, the equilibrium points in the market for money, shifts for two reasons: changes inmoney demand and changes in the money supply. If the money supply increases (decreases), ceterisparibus, the interest rate is lower (higher) at each level of Y, or in other words, the LM curve shifts right(left). That is because at any given level of output Y, more money (less money) means a lower (higher)interest rate. (Remember, the price level doesn’t change in this model.) To see this, look at Figure 22.1.
An autonomous change in money demand (that is, a change not related to the pricelevel, aggregate output, or i) will also affect the LM curve. Say that stocks get riskier orthe transaction costs of trading bonds increases. The theory of asset demand tells usthat the demand for money will increase (shift right), thus increasing i. Interest ratescould also decrease if money demand shifted left because stock returns increased orbonds became less risky. To see this, examine Figure 22.2. An increase in autonomousmoney demand will shift the LM curve left, with higher interest rates at each Y; a de-crease will shift it right, with lower interest rates at each Y.
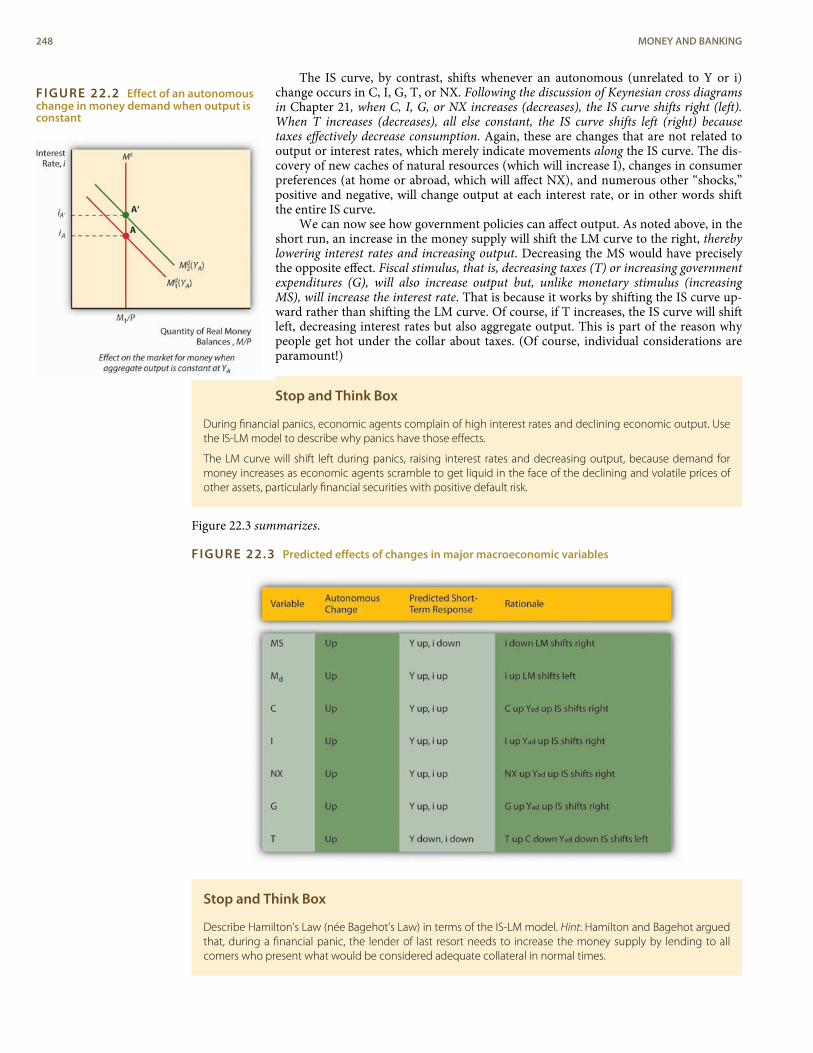
FIGURE 22.2 Effect of an autonomouschange in money demand when output isconstant
The IS curve, by contrast, shifts whenever an autonomous (unrelated to Y or i)change occurs in C, I, G, T, or NX. Following the discussion of Keynesian cross diagramsin Chapter 21, when C, I, G, or NX increases (decreases), the IS curve shifts right (left).When T increases (decreases), all else constant, the IS curve shifts left (right) becausetaxes effectively decrease consumption. Again, these are changes that are not related tooutput or interest rates, which merely indicate movements along the IS curve. The dis-covery of new caches of natural resources (which will increase I), changes in consumerpreferences (at home or abroad, which will affect NX), and numerous other “shocks,”positive and negative, will change output at each interest rate, or in other words shiftthe entire IS curve.
We can now see how government policies can affect output. As noted above, in theshort run, an increase in the money supply will shift the LM curve to the right, therebylowering interest rates and increasing output. Decreasing the MS would have preciselythe opposite effect. Fiscal stimulus, that is, decreasing taxes (T) or increasing governmentexpenditures (G), will also increase output but, unlike monetary stimulus (increasingMS), will increase the interest rate. That is because it works by shifting the IS curve up-ward rather than shifting the LM curve. Of course, if T increases, the IS curve will shiftleft, decreasing interest rates but also aggregate output. This is part of the reason whypeople get hot under the collar about taxes. (Of course, individual considerations areparamount!)
Stop and Think Box
During financial panics, economic agents complain of high interest rates and declining economic output. Usethe IS-LM model to describe why panics have those effects.
The LM curve will shift left during panics, raising interest rates and decreasing output, because demand formoney increases as economic agents scramble to get liquid in the face of the declining and volatile prices ofother assets, particularly financial securities with positive default risk.
Figure 22.3 summarizes.
FIGURE 22.3 Predicted effects of changes in major macroeconomic variables
Stop and Think Box
Describe Hamilton’s Law (née Bagehot’s Law) in terms of the IS-LM model. Hint: Hamilton and Bagehot arguedthat, during a financial panic, the lender of last resort needs to increase the money supply by lending to allcomers who present what would be considered adequate collateral in normal times.
248 MONEY AND BANKING
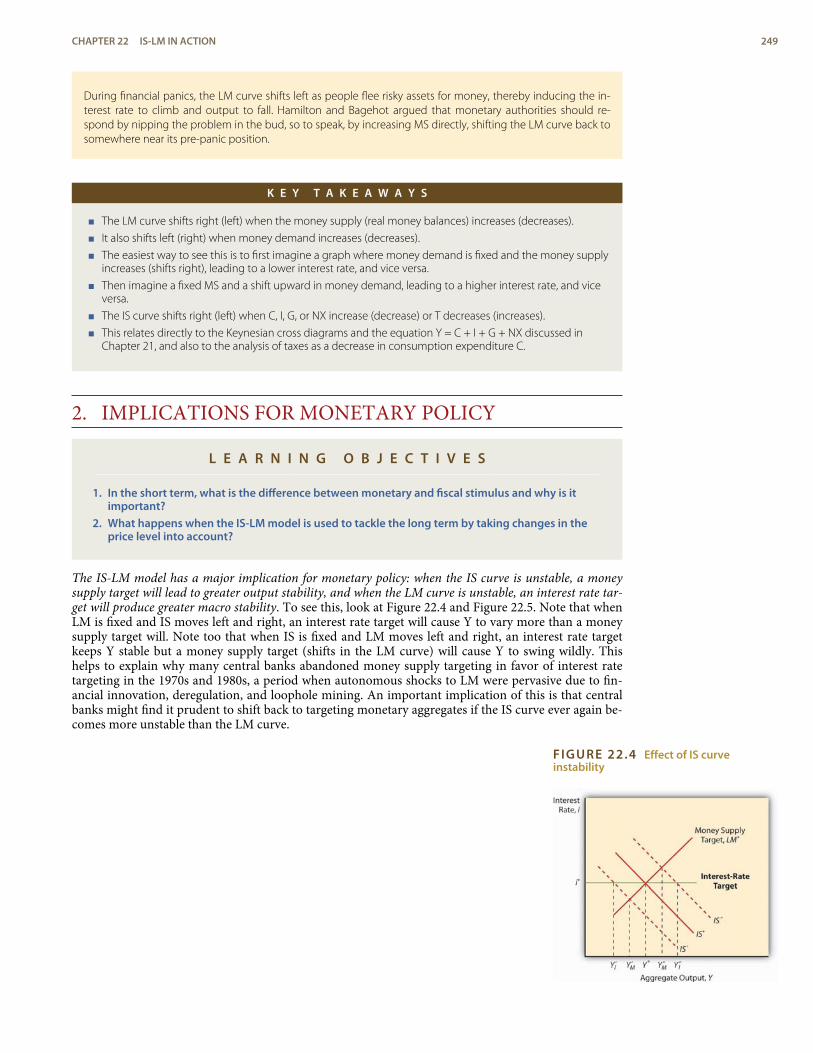
FIGURE 22.4 Effect of IS curveinstability
During financial panics, the LM curve shifts left as people flee risky assets for money, thereby inducing the in-terest rate to climb and output to fall. Hamilton and Bagehot argued that monetary authorities should re-spond by nipping the problem in the bud, so to speak, by increasing MS directly, shifting the LM curve back tosomewhere near its pre-panic position.
K E Y T A K E A W A Y S
< The LM curve shifts right (left) when the money supply (real money balances) increases (decreases).
< It also shifts left (right) when money demand increases (decreases).
< The easiest way to see this is to first imagine a graph where money demand is fixed and the money supplyincreases (shifts right), leading to a lower interest rate, and vice versa.
< Then imagine a fixed MS and a shift upward in money demand, leading to a higher interest rate, and viceversa.
< The IS curve shifts right (left) when C, I, G, or NX increase (decrease) or T decreases (increases).
< This relates directly to the Keynesian cross diagrams and the equation Y = C + I + G + NX discussed inChapter 21, and also to the analysis of taxes as a decrease in consumption expenditure C.
2. IMPLICATIONS FOR MONETARY POLICY
L E A R N I N G O B J E C T I V E S
1. In the short term, what is the difference between monetary and fiscal stimulus and why is itimportant?
2. What happens when the IS-LM model is used to tackle the long term by taking changes in theprice level into account?
The IS-LM model has a major implication for monetary policy: when the IS curve is unstable, a moneysupply target will lead to greater output stability, and when the LM curve is unstable, an interest rate tar-get will produce greater macro stability. To see this, look at Figure 22.4 and Figure 22.5. Note that whenLM is fixed and IS moves left and right, an interest rate target will cause Y to vary more than a moneysupply target will. Note too that when IS is fixed and LM moves left and right, an interest rate targetkeeps Y stable but a money supply target (shifts in the LM curve) will cause Y to swing wildly. Thishelps to explain why many central banks abandoned money supply targeting in favor of interest ratetargeting in the 1970s and 1980s, a period when autonomous shocks to LM were pervasive due to fin-ancial innovation, deregulation, and loophole mining. An important implication of this is that centralbanks might find it prudent to shift back to targeting monetary aggregates if the IS curve ever again be-comes more unstable than the LM curve.
CHAPTER 22 IS-LM IN ACTION 249
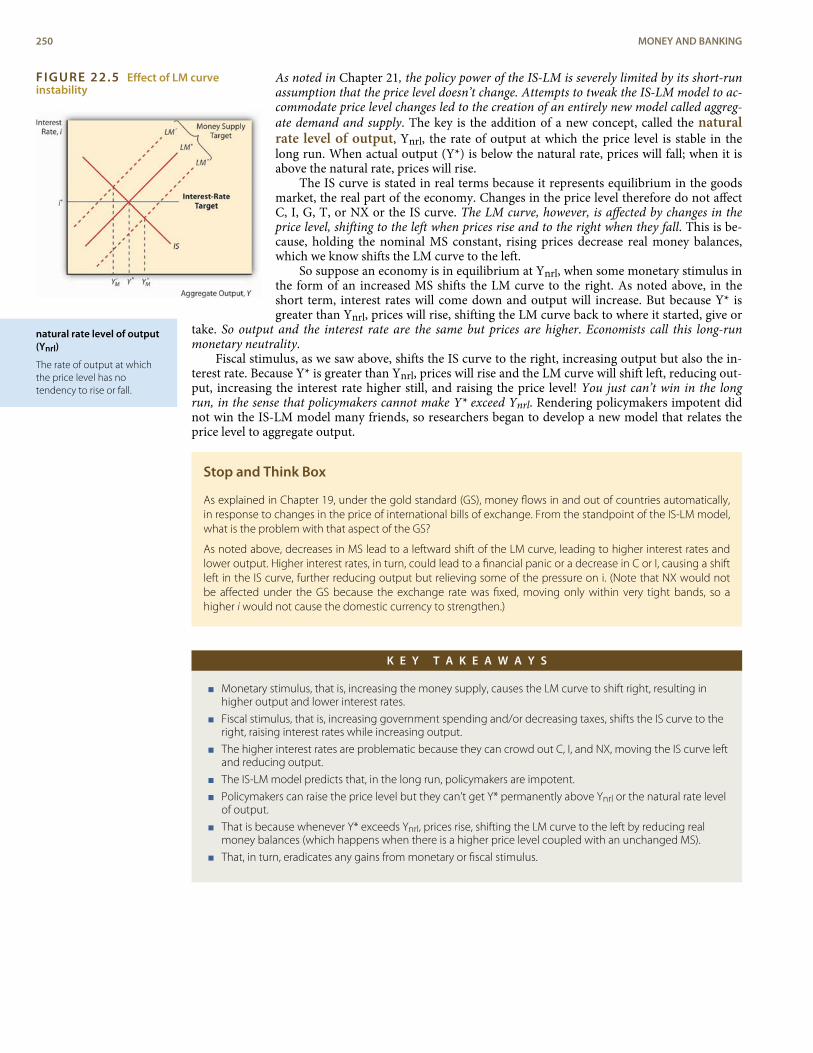
FIGURE 22.5 Effect of LM curveinstability
natural rate level of output(Ynrl)
The rate of output at whichthe price level has notendency to rise or fall.
As noted in Chapter 21, the policy power of the IS-LM is severely limited by its short-runassumption that the price level doesn’t change. Attempts to tweak the IS-LM model to ac-commodate price level changes led to the creation of an entirely new model called aggreg-ate demand and supply. The key is the addition of a new concept, called the naturalrate level of output, Ynrl, the rate of output at which the price level is stable in thelong run. When actual output (Y*) is below the natural rate, prices will fall; when it isabove the natural rate, prices will rise.
The IS curve is stated in real terms because it represents equilibrium in the goodsmarket, the real part of the economy. Changes in the price level therefore do not affectC, I, G, T, or NX or the IS curve. The LM curve, however, is affected by changes in theprice level, shifting to the left when prices rise and to the right when they fall. This is be-cause, holding the nominal MS constant, rising prices decrease real money balances,which we know shifts the LM curve to the left.
So suppose an economy is in equilibrium at Ynrl, when some monetary stimulus inthe form of an increased MS shifts the LM curve to the right. As noted above, in theshort term, interest rates will come down and output will increase. But because Y* isgreater than Ynrl, prices will rise, shifting the LM curve back to where it started, give or
take. So output and the interest rate are the same but prices are higher. Economists call this long-runmonetary neutrality.
Fiscal stimulus, as we saw above, shifts the IS curve to the right, increasing output but also the in-terest rate. Because Y* is greater than Ynrl, prices will rise and the LM curve will shift left, reducing out-put, increasing the interest rate higher still, and raising the price level! You just can’t win in the longrun, in the sense that policymakers cannot make Y* exceed Ynrl. Rendering policymakers impotent didnot win the IS-LM model many friends, so researchers began to develop a new model that relates theprice level to aggregate output.
Stop and Think Box
As explained in Chapter 19, under the gold standard (GS), money flows in and out of countries automatically,in response to changes in the price of international bills of exchange. From the standpoint of the IS-LM model,what is the problem with that aspect of the GS?
As noted above, decreases in MS lead to a leftward shift of the LM curve, leading to higher interest rates andlower output. Higher interest rates, in turn, could lead to a financial panic or a decrease in C or I, causing a shiftleft in the IS curve, further reducing output but relieving some of the pressure on i. (Note that NX would notbe affected under the GS because the exchange rate was fixed, moving only within very tight bands, so ahigher i would not cause the domestic currency to strengthen.)
K E Y T A K E A W A Y S
< Monetary stimulus, that is, increasing the money supply, causes the LM curve to shift right, resulting inhigher output and lower interest rates.
< Fiscal stimulus, that is, increasing government spending and/or decreasing taxes, shifts the IS curve to theright, raising interest rates while increasing output.
< The higher interest rates are problematic because they can crowd out C, I, and NX, moving the IS curve leftand reducing output.
< The IS-LM model predicts that, in the long run, policymakers are impotent.
< Policymakers can raise the price level but they can’t get Y* permanently above Ynrl or the natural rate levelof output.
< That is because whenever Y* exceeds Ynrl, prices rise, shifting the LM curve to the left by reducing realmoney balances (which happens when there is a higher price level coupled with an unchanged MS).
< That, in turn, eradicates any gains from monetary or fiscal stimulus.
250 MONEY AND BANKING
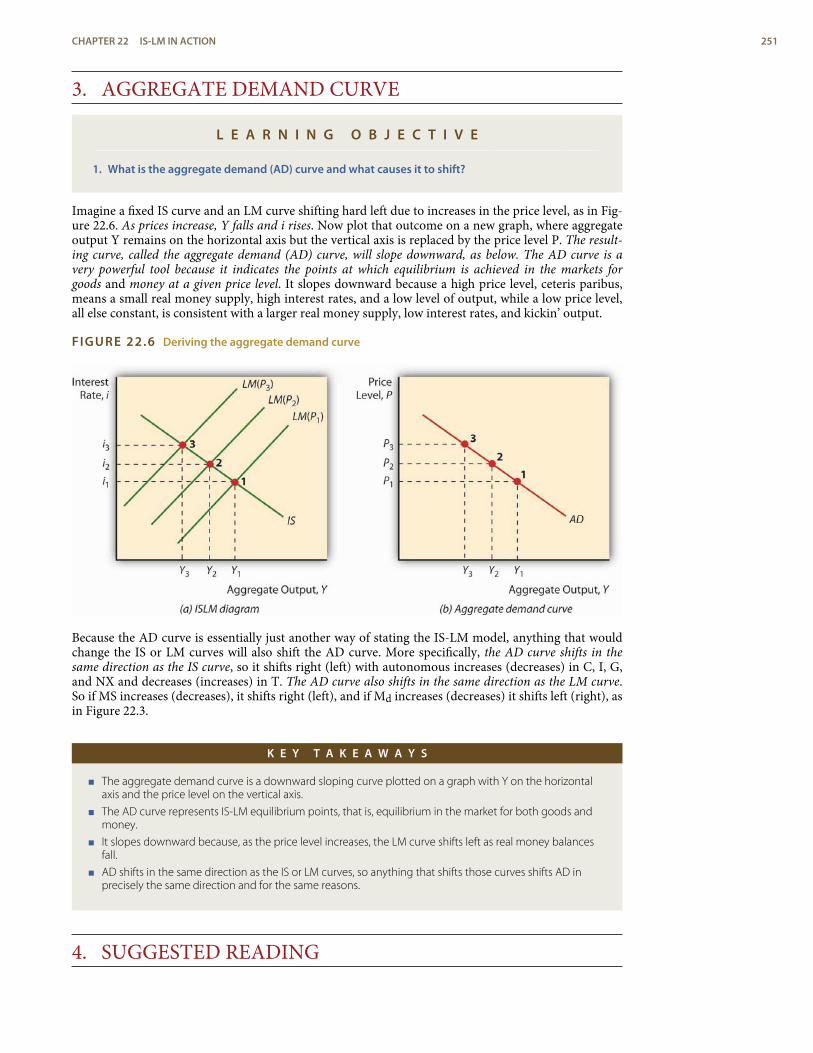
3. AGGREGATE DEMAND CURVE
L E A R N I N G O B J E C T I V E
1. What is the aggregate demand (AD) curve and what causes it to shift?
Imagine a fixed IS curve and an LM curve shifting hard left due to increases in the price level, as in Fig-ure 22.6. As prices increase, Y falls and i rises. Now plot that outcome on a new graph, where aggregateoutput Y remains on the horizontal axis but the vertical axis is replaced by the price level P. The result-ing curve, called the aggregate demand (AD) curve, will slope downward, as below. The AD curve is avery powerful tool because it indicates the points at which equilibrium is achieved in the markets forgoods and money at a given price level. It slopes downward because a high price level, ceteris paribus,means a small real money supply, high interest rates, and a low level of output, while a low price level,all else constant, is consistent with a larger real money supply, low interest rates, and kickin’ output.
FIGURE 22.6 Deriving the aggregate demand curve
Because the AD curve is essentially just another way of stating the IS-LM model, anything that wouldchange the IS or LM curves will also shift the AD curve. More specifically, the AD curve shifts in thesame direction as the IS curve, so it shifts right (left) with autonomous increases (decreases) in C, I, G,and NX and decreases (increases) in T. The AD curve also shifts in the same direction as the LM curve.So if MS increases (decreases), it shifts right (left), and if Md increases (decreases) it shifts left (right), asin Figure 22.3.
K E Y T A K E A W A Y S
< The aggregate demand curve is a downward sloping curve plotted on a graph with Y on the horizontalaxis and the price level on the vertical axis.
< The AD curve represents IS-LM equilibrium points, that is, equilibrium in the market for both goods andmoney.
< It slopes downward because, as the price level increases, the LM curve shifts left as real money balancesfall.
< AD shifts in the same direction as the IS or LM curves, so anything that shifts those curves shifts AD inprecisely the same direction and for the same reasons.
4. SUGGESTED READING
CHAPTER 22 IS-LM IN ACTION 251
Dimand, Robert, Edward Nelson, Robert Lucas, Mauro Boianovsky, David Colander, WarrenYoung, et al. The IS-LM Model: Its Rise, Fall, and Strange Persistence. Raleigh, NC: Duke UniversityPress, 2005.
Young, Warren, and Ben-Zion Zilbefarb. IS-LM and Modern Macroeconomics. New York: Spring-er, 2001.
252 MONEY AND BANKING
C H A P T E R 2 3Aggregate Supply andDemand, the GrowthDiamond, and FinancialShocks
C H A P T E R O B J E C T I V E S
By the end of this chapter, students should be able to:
1. Describe the aggregate demand (AD) curve and explain why it slopes downward.
2. Describe what shifts the AD curve and explain why.
3. Describe the short-run aggregate supply (AS) curve and explain why it slopes upward.
4. Describe what shifts the short-run AS curve and explain why.
5. Describe the long-run aggregate supply (ASL) curve, and explain why it is vertical and whatshifts it.
6. Explain the term long term and its importance for policymakers.
7. Describe the growth diamond model of economic growth and its importance.
8. Explain how financial shocks affect the real economy.
1. AGGREGATE DEMAND
L E A R N I N G O B J E C T I V E S
1. What is the AD curve and why does it slope downward?2. What shifts the AD curve and why?
We learned in Chapter 22 that the IS-LM model isn’t entirely agreeable to policymakers because it ex-amines only the short term, and when pressed into service for the long-term, or changes in the pricelevel, it suggests that policy initiatives are more likely to mess matters up than to improve them. In re-sponse, economists developed a new theory, aggregate demand and supply, that relates the price levelto the total final goods and services demanded (aggregate demand [AD]) and the total supplied(aggregate supply [AS]). This new framework is attractive for several reasons: (1) it can be used to exam-ine both the short and the long run; (2) it takes a form similar to the microeconomic price theory model ofsupply and demand, so it is familiar; and (3) it gives policymakers some grounds for implementing activ-ist economic policies. To understand aggregate demand and supply theory, we need to understand howeach of the curves is derived.
The aggregate demand curve can be derived three ways, through the IS-LM model as described at theend of Chapter 22, with help from the quantity theory of money, or directly from its components. Re-member that Y = C + I + G + NX. As the price level falls, ceteris paribus, real money balances are high-er. That spells a lower interest rate, as we learned in Chapter 5. A lower interest rate, in turn, means anincrease in I (and hence Y). A lower interest rate also means a lower exchange rate and, as explained inChapter 18, more exports and fewer imports. So NX also increases. (C might be positively affected bylower i as well.) As the price level increases, the opposite occurs. So the AD curve slopes downward.
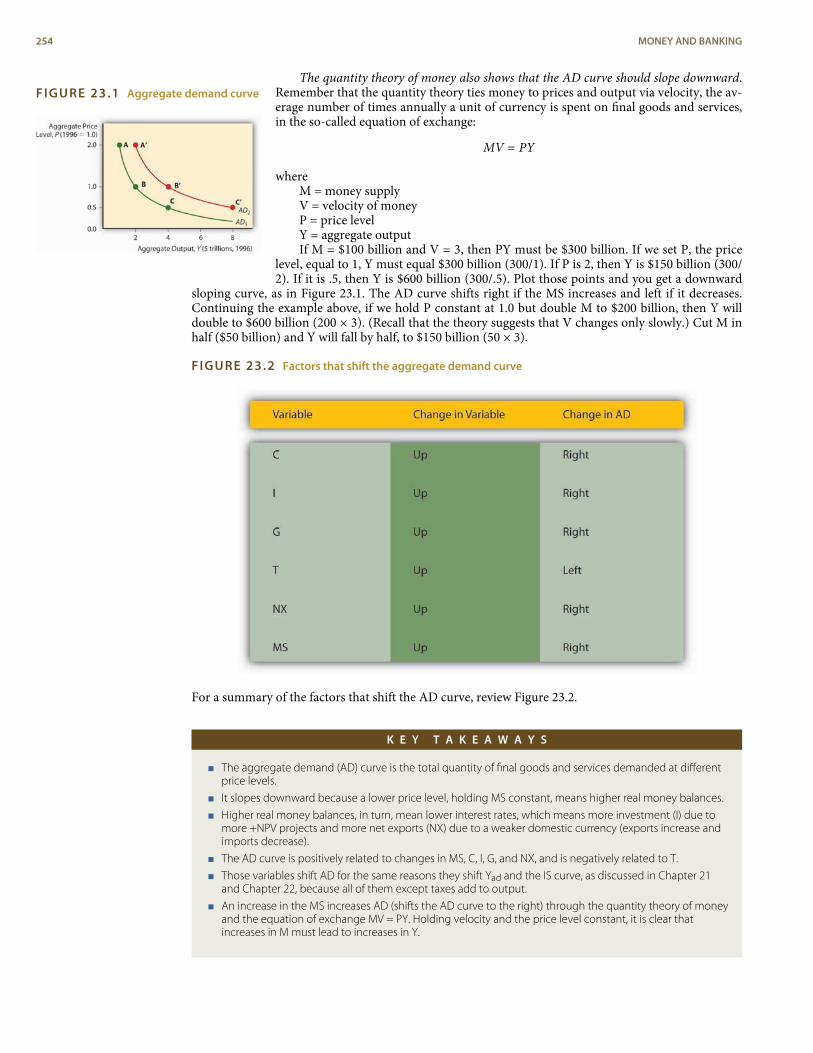
FIGURE 23.1 Aggregate demand curveThe quantity theory of money also shows that the AD curve should slope downward.
Remember that the quantity theory ties money to prices and output via velocity, the av-erage number of times annually a unit of currency is spent on final goods and services,in the so-called equation of exchange:
MV = PY
whereM = money supplyV = velocity of moneyP = price levelY = aggregate outputIf M = $100 billion and V = 3, then PY must be $300 billion. If we set P, the price
level, equal to 1, Y must equal $300 billion (300/1). If P is 2, then Y is $150 billion (300/2). If it is .5, then Y is $600 billion (300/.5). Plot those points and you get a downward
sloping curve, as in Figure 23.1. The AD curve shifts right if the MS increases and left if it decreases.Continuing the example above, if we hold P constant at 1.0 but double M to $200 billion, then Y willdouble to $600 billion (200 × 3). (Recall that the theory suggests that V changes only slowly.) Cut M inhalf ($50 billion) and Y will fall by half, to $150 billion (50 × 3).
FIGURE 23.2 Factors that shift the aggregate demand curve
For a summary of the factors that shift the AD curve, review Figure 23.2.
K E Y T A K E A W A Y S
< The aggregate demand (AD) curve is the total quantity of final goods and services demanded at differentprice levels.
< It slopes downward because a lower price level, holding MS constant, means higher real money balances.
< Higher real money balances, in turn, mean lower interest rates, which means more investment (I) due tomore +NPV projects and more net exports (NX) due to a weaker domestic currency (exports increase andimports decrease).
< The AD curve is positively related to changes in MS, C, I, G, and NX, and is negatively related to T.
< Those variables shift AD for the same reasons they shift Yad and the IS curve, as discussed in Chapter 21and Chapter 22, because all of them except taxes add to output.
< An increase in the MS increases AD (shifts the AD curve to the right) through the quantity theory of moneyand the equation of exchange MV = PY. Holding velocity and the price level constant, it is clear thatincreases in M must lead to increases in Y.
254 MONEY AND BANKING
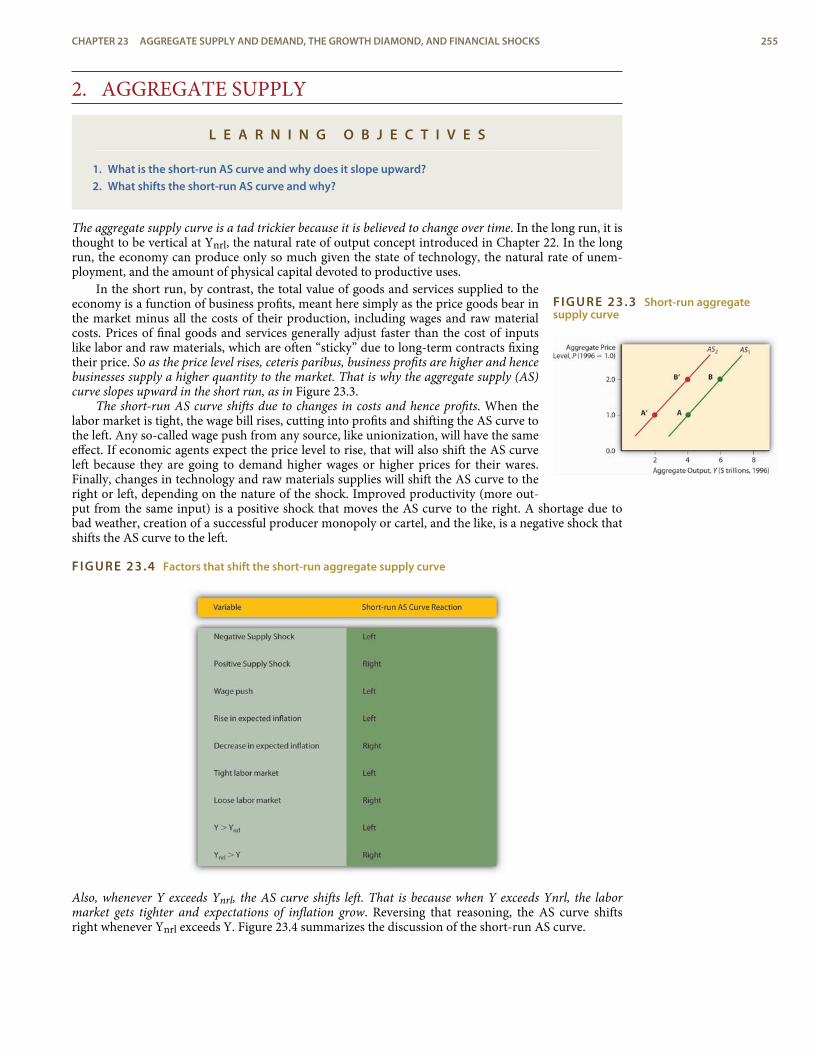
FIGURE 23.3 Short-run aggregatesupply curve
2. AGGREGATE SUPPLY
L E A R N I N G O B J E C T I V E S
1. What is the short-run AS curve and why does it slope upward?2. What shifts the short-run AS curve and why?
The aggregate supply curve is a tad trickier because it is believed to change over time. In the long run, it isthought to be vertical at Ynrl, the natural rate of output concept introduced in Chapter 22. In the longrun, the economy can produce only so much given the state of technology, the natural rate of unem-ployment, and the amount of physical capital devoted to productive uses.
In the short run, by contrast, the total value of goods and services supplied to theeconomy is a function of business profits, meant here simply as the price goods bear inthe market minus all the costs of their production, including wages and raw materialcosts. Prices of final goods and services generally adjust faster than the cost of inputslike labor and raw materials, which are often “sticky” due to long-term contracts fixingtheir price. So as the price level rises, ceteris paribus, business profits are higher and hencebusinesses supply a higher quantity to the market. That is why the aggregate supply (AS)curve slopes upward in the short run, as in Figure 23.3.
The short-run AS curve shifts due to changes in costs and hence profits. When thelabor market is tight, the wage bill rises, cutting into profits and shifting the AS curve tothe left. Any so-called wage push from any source, like unionization, will have the sameeffect. If economic agents expect the price level to rise, that will also shift the AS curveleft because they are going to demand higher wages or higher prices for their wares.Finally, changes in technology and raw materials supplies will shift the AS curve to theright or left, depending on the nature of the shock. Improved productivity (more out-put from the same input) is a positive shock that moves the AS curve to the right. A shortage due tobad weather, creation of a successful producer monopoly or cartel, and the like, is a negative shock thatshifts the AS curve to the left.
FIGURE 23.4 Factors that shift the short-run aggregate supply curve
Also, whenever Y exceeds Ynrl, the AS curve shifts left. That is because when Y exceeds Ynrl, the labormarket gets tighter and expectations of inflation grow. Reversing that reasoning, the AS curve shiftsright whenever Ynrl exceeds Y. Figure 23.4 summarizes the discussion of the short-run AS curve.
CHAPTER 23 AGGREGATE SUPPLY AND DEMAND, THE GROWTH DIAMOND, AND FINANCIAL SHOCKS 255
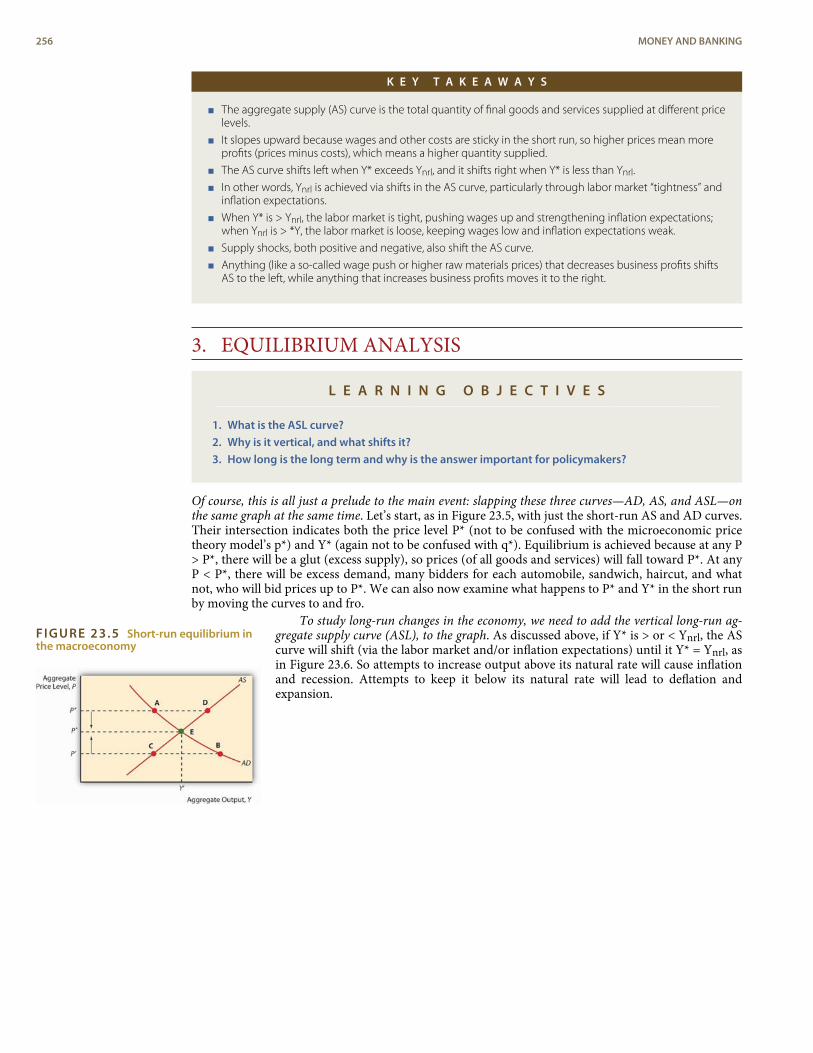
FIGURE 23.5 Short-run equilibrium inthe macroeconomy
K E Y T A K E A W A Y S
< The aggregate supply (AS) curve is the total quantity of final goods and services supplied at different pricelevels.
< It slopes upward because wages and other costs are sticky in the short run, so higher prices mean moreprofits (prices minus costs), which means a higher quantity supplied.
< The AS curve shifts left when Y* exceeds Ynrl, and it shifts right when Y* is less than Ynrl.
< In other words, Ynrl is achieved via shifts in the AS curve, particularly through labor market “tightness” andinflation expectations.
< When Y* is > Ynrl, the labor market is tight, pushing wages up and strengthening inflation expectations;when Ynrl is > *Y, the labor market is loose, keeping wages low and inflation expectations weak.
< Supply shocks, both positive and negative, also shift the AS curve.
< Anything (like a so-called wage push or higher raw materials prices) that decreases business profits shiftsAS to the left, while anything that increases business profits moves it to the right.
3. EQUILIBRIUM ANALYSIS
L E A R N I N G O B J E C T I V E S
1. What is the ASL curve?2. Why is it vertical, and what shifts it?3. How long is the long term and why is the answer important for policymakers?
Of course, this is all just a prelude to the main event: slapping these three curves—AD, AS, and ASL—onthe same graph at the same time. Let’s start, as in Figure 23.5, with just the short-run AS and AD curves.Their intersection indicates both the price level P* (not to be confused with the microeconomic pricetheory model’s p*) and Y* (again not to be confused with q*). Equilibrium is achieved because at any P> P*, there will be a glut (excess supply), so prices (of all goods and services) will fall toward P*. At anyP < P*, there will be excess demand, many bidders for each automobile, sandwich, haircut, and whatnot, who will bid prices up to P*. We can also now examine what happens to P* and Y* in the short runby moving the curves to and fro.
To study long-run changes in the economy, we need to add the vertical long-run ag-gregate supply curve (ASL), to the graph. As discussed above, if Y* is > or < Ynrl, the AScurve will shift (via the labor market and/or inflation expectations) until it Y* = Ynrl, asin Figure 23.6. So attempts to increase output above its natural rate will cause inflationand recession. Attempts to keep it below its natural rate will lead to deflation andexpansion.
256 MONEY AND BANKING
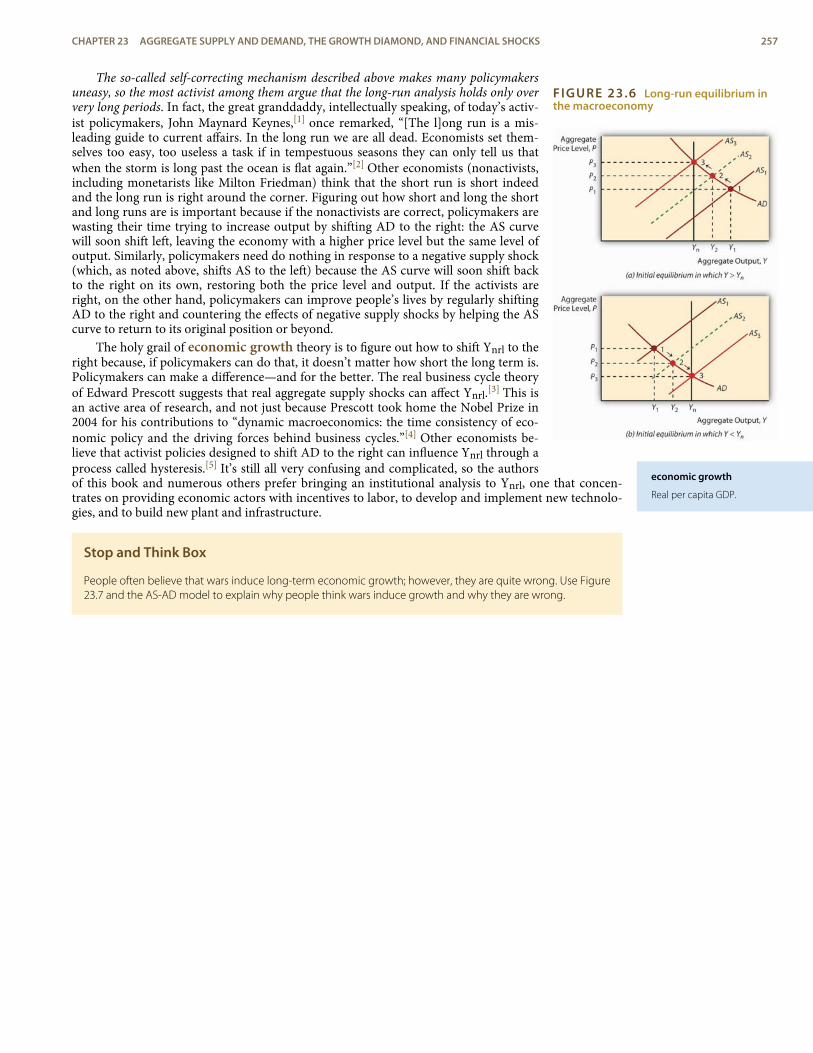
FIGURE 23.6 Long-run equilibrium inthe macroeconomy
economic growth
Real per capita GDP.
The so-called self-correcting mechanism described above makes many policymakersuneasy, so the most activist among them argue that the long-run analysis holds only oververy long periods. In fact, the great granddaddy, intellectually speaking, of today’s activ-ist policymakers, John Maynard Keynes,[1] once remarked, “[The l]ong run is a mis-leading guide to current affairs. In the long run we are all dead. Economists set them-selves too easy, too useless a task if in tempestuous seasons they can only tell us thatwhen the storm is long past the ocean is flat again.”[2] Other economists (nonactivists,including monetarists like Milton Friedman) think that the short run is short indeedand the long run is right around the corner. Figuring out how short and long the shortand long runs are is important because if the nonactivists are correct, policymakers arewasting their time trying to increase output by shifting AD to the right: the AS curvewill soon shift left, leaving the economy with a higher price level but the same level ofoutput. Similarly, policymakers need do nothing in response to a negative supply shock(which, as noted above, shifts AS to the left) because the AS curve will soon shift backto the right on its own, restoring both the price level and output. If the activists areright, on the other hand, policymakers can improve people’s lives by regularly shiftingAD to the right and countering the effects of negative supply shocks by helping the AScurve to return to its original position or beyond.
The holy grail of economic growth theory is to figure out how to shift Ynrl to theright because, if policymakers can do that, it doesn’t matter how short the long term is.Policymakers can make a difference—and for the better. The real business cycle theoryof Edward Prescott suggests that real aggregate supply shocks can affect Ynrl.[3] This isan active area of research, and not just because Prescott took home the Nobel Prize in2004 for his contributions to “dynamic macroeconomics: the time consistency of eco-nomic policy and the driving forces behind business cycles.”[4] Other economists be-lieve that activist policies designed to shift AD to the right can influence Ynrl through aprocess called hysteresis.[5] It’s still all very confusing and complicated, so the authorsof this book and numerous others prefer bringing an institutional analysis to Ynrl, one that concen-trates on providing economic actors with incentives to labor, to develop and implement new technolo-gies, and to build new plant and infrastructure.
Stop and Think Box
People often believe that wars induce long-term economic growth; however, they are quite wrong. Use Figure23.7 and the AS-AD model to explain why people think wars induce growth and why they are wrong.
CHAPTER 23 AGGREGATE SUPPLY AND DEMAND, THE GROWTH DIAMOND, AND FINANCIAL SHOCKS 257
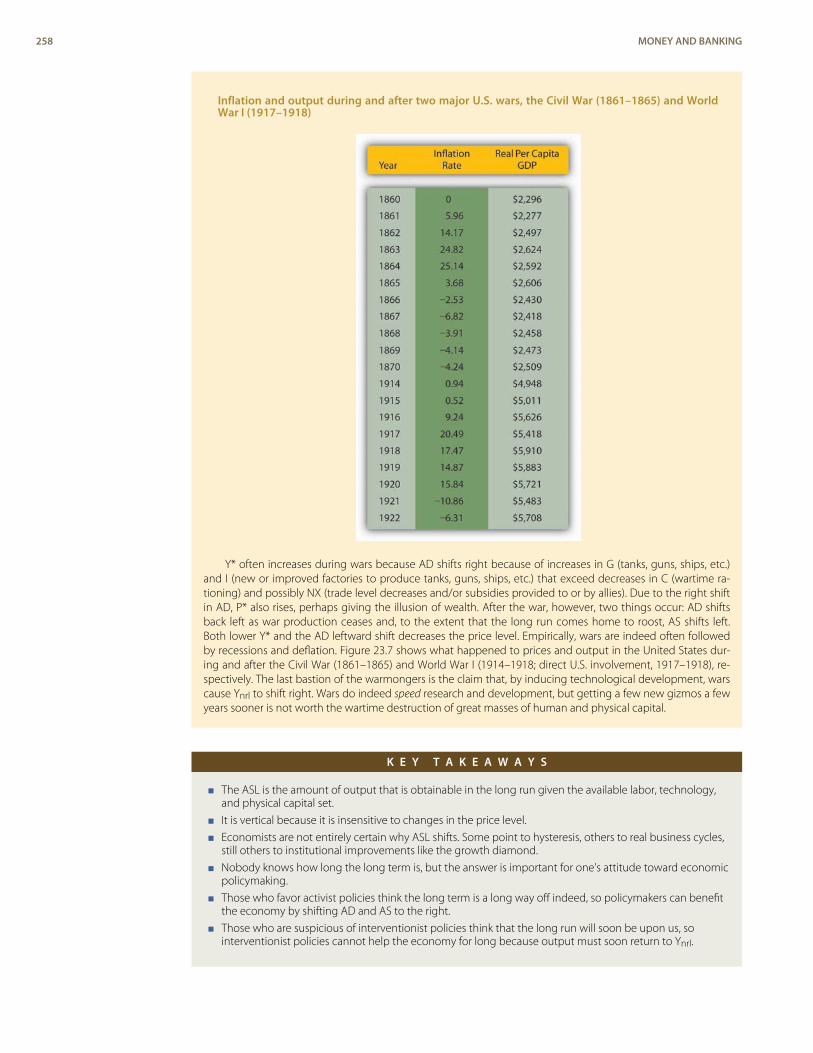
Inflation and output during and after two major U.S. wars, the Civil War (1861–1865) and WorldWar I (1917–1918)
Y* often increases during wars because AD shifts right because of increases in G (tanks, guns, ships, etc.)and I (new or improved factories to produce tanks, guns, ships, etc.) that exceed decreases in C (wartime ra-tioning) and possibly NX (trade level decreases and/or subsidies provided to or by allies). Due to the right shiftin AD, P* also rises, perhaps giving the illusion of wealth. After the war, however, two things occur: AD shiftsback left as war production ceases and, to the extent that the long run comes home to roost, AS shifts left.Both lower Y* and the AD leftward shift decreases the price level. Empirically, wars are indeed often followedby recessions and deflation. Figure 23.7 shows what happened to prices and output in the United States dur-ing and after the Civil War (1861–1865) and World War I (1914–1918; direct U.S. involvement, 1917–1918), re-spectively. The last bastion of the warmongers is the claim that, by inducing technological development, warscause Ynrl to shift right. Wars do indeed speed research and development, but getting a few new gizmos a fewyears sooner is not worth the wartime destruction of great masses of human and physical capital.
K E Y T A K E A W A Y S
< The ASL is the amount of output that is obtainable in the long run given the available labor, technology,and physical capital set.
< It is vertical because it is insensitive to changes in the price level.
< Economists are not entirely certain why ASL shifts. Some point to hysteresis, others to real business cycles,still others to institutional improvements like the growth diamond.
< Nobody knows how long the long term is, but the answer is important for one’s attitude toward economicpolicymaking.
< Those who favor activist policies think the long term is a long way off indeed, so policymakers can benefitthe economy by shifting AD and AS to the right.
< Those who are suspicious of interventionist policies think that the long run will soon be upon us, sointerventionist policies cannot help the economy for long because output must soon return to Ynrl.
258 MONEY AND BANKING
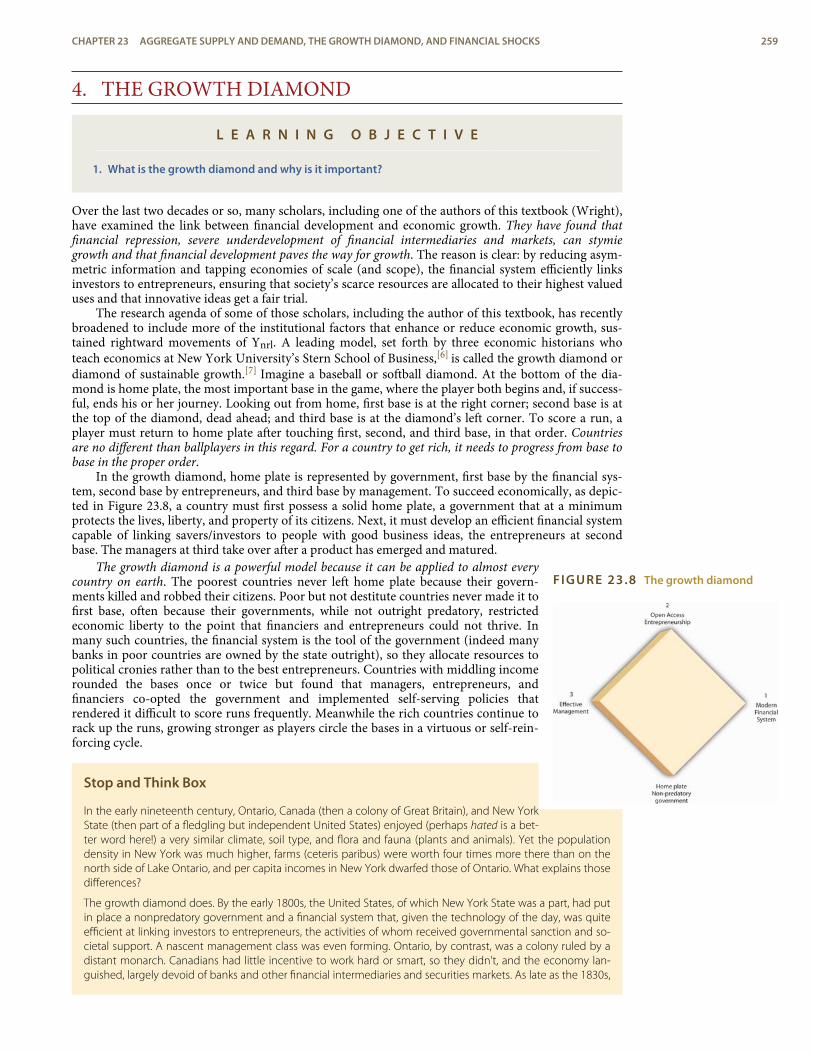
FIGURE 23.8 The growth diamond
4. THE GROWTH DIAMOND
L E A R N I N G O B J E C T I V E
1. What is the growth diamond and why is it important?
Over the last two decades or so, many scholars, including one of the authors of this textbook (Wright),have examined the link between financial development and economic growth. They have found thatfinancial repression, severe underdevelopment of financial intermediaries and markets, can stymiegrowth and that financial development paves the way for growth. The reason is clear: by reducing asym-metric information and tapping economies of scale (and scope), the financial system efficiently linksinvestors to entrepreneurs, ensuring that society’s scarce resources are allocated to their highest valueduses and that innovative ideas get a fair trial.
The research agenda of some of those scholars, including the author of this textbook, has recentlybroadened to include more of the institutional factors that enhance or reduce economic growth, sus-tained rightward movements of Ynrl. A leading model, set forth by three economic historians whoteach economics at New York University’s Stern School of Business,[6] is called the growth diamond ordiamond of sustainable growth.[7] Imagine a baseball or softball diamond. At the bottom of the dia-mond is home plate, the most important base in the game, where the player both begins and, if success-ful, ends his or her journey. Looking out from home, first base is at the right corner; second base is atthe top of the diamond, dead ahead; and third base is at the diamond’s left corner. To score a run, aplayer must return to home plate after touching first, second, and third base, in that order. Countriesare no different than ballplayers in this regard. For a country to get rich, it needs to progress from base tobase in the proper order.
In the growth diamond, home plate is represented by government, first base by the financial sys-tem, second base by entrepreneurs, and third base by management. To succeed economically, as depic-ted in Figure 23.8, a country must first possess a solid home plate, a government that at a minimumprotects the lives, liberty, and property of its citizens. Next, it must develop an efficient financial systemcapable of linking savers/investors to people with good business ideas, the entrepreneurs at secondbase. The managers at third take over after a product has emerged and matured.
The growth diamond is a powerful model because it can be applied to almost everycountry on earth. The poorest countries never left home plate because their govern-ments killed and robbed their citizens. Poor but not destitute countries never made it tofirst base, often because their governments, while not outright predatory, restrictedeconomic liberty to the point that financiers and entrepreneurs could not thrive. Inmany such countries, the financial system is the tool of the government (indeed manybanks in poor countries are owned by the state outright), so they allocate resources topolitical cronies rather than to the best entrepreneurs. Countries with middling incomerounded the bases once or twice but found that managers, entrepreneurs, andfinanciers co-opted the government and implemented self-serving policies thatrendered it difficult to score runs frequently. Meanwhile the rich countries continue torack up the runs, growing stronger as players circle the bases in a virtuous or self-rein-forcing cycle.
Stop and Think Box
In the early nineteenth century, Ontario, Canada (then a colony of Great Britain), and New YorkState (then part of a fledgling but independent United States) enjoyed (perhaps hated is a bet-ter word here!) a very similar climate, soil type, and flora and fauna (plants and animals). Yet the populationdensity in New York was much higher, farms (ceteris paribus) were worth four times more there than on thenorth side of Lake Ontario, and per capita incomes in New York dwarfed those of Ontario. What explains thosedifferences?
The growth diamond does. By the early 1800s, the United States, of which New York State was a part, had putin place a nonpredatory government and a financial system that, given the technology of the day, was quiteefficient at linking investors to entrepreneurs, the activities of whom received governmental sanction and so-cietal support. A nascent management class was even forming. Ontario, by contrast, was a colony ruled by adistant monarch. Canadians had little incentive to work hard or smart, so they didn’t, and the economy lan-guished, largely devoid of banks and other financial intermediaries and securities markets. As late as the 1830s,
CHAPTER 23 AGGREGATE SUPPLY AND DEMAND, THE GROWTH DIAMOND, AND FINANCIAL SHOCKS 259
New York was sometimes “a better market for the sale of Canada exchange on London than Canada itself.”[8]
Only after they shed their imperial overlords and reformed their domestic governments did Canadians devel-op an effective financial system and rid themselves of anti-entrepreneurial laws and sentiments. The Canadianeconomy then grew with rapidity, making Canada one of the world’s richest countries.
A narrower and more technical explanation of the higher value of New York farms comparable to Canadianfarms in size, soil quality, rainfall, and so forth is that interest rates were much lower in New York. Valuing afarm is like valuing any income-producing asset. All it takes is to discount the farm’s expected future incomestream. Holding expected income constant, the key to the equation becomes the interest rate, which wasabout four times lower in New York (say, 6 percent per year versus 24 percent). Recall that PV = FV/(1 + i). If FV(next year’s income) in both instances is 100, but i = .24 in Canada and .06 in New York, an investor would bewilling to lease the New York farm for a year for 100/1.06 = $94.34, but the Canadian farm for only 100/1.24 =$80.65. The longer the time frame, the more the higher Canadian interest rate will bite. In the limit, we couldprice the farms as perpetuities using the equation PV = FV/i from Chapter 4. That means the New York farmwould be worth PV = 100/.06 = $1,666.67, while the Canadian farm would be worth a mere PV = 100/.24 =$416.67 (which, of course, times 4 equals the New York farm price). Canadian land values increased when Ca-nadian interest rates decreased after about 1850.
One important implication of the growth diamond is that emerging (from eons of poverty) or transition-ing (from communism) economies that are currently hot, like those of China and India, may begin to fal-ter if they do not strengthen their governance, financial, entrepreneurial, and management systems. Someof today’s basket-case economies, including that of Argentina, were once high fliers that ran into aneconomic brick wall because they inadequately protected property rights, impeded financial develop-ment, and squelched entrepreneurship.
Although currently less analytically rigorous than the AS-AD model, the growth diamond is morehistorically grounded than the AS-AD model or any other macro model and that is important. As stor-ied economist Will Baumol once put it,
We cannot understand current phenomena . . . without systematic examination of earlier eventswhich affect the present and will continue to exercise profound effects tomorrow . . . [T]he long runis important because it is not sensible for economists and policymakers to attempt to discern long-run trends and their outcomes from the flow of short-run developments, which may be dominatedby transient conditions.[9]
K E Y T A K E A W A Y S
< The growth diamond is a model of economic growth (increases in real per capita aggregate output) beingdeveloped by economic historians at the Stern School of Business.
< It posits that sustained, long-term economic growth is predicated on the existence of a nonpredatorygovernment (home plate), an efficient financial system (first base), entrepreneurs (second base), andmodern management (third base).
< It is important because it explains why some countries are very rich and others are desperately poor.
< It also explains why some countries, like Argentina, grew rich, only to fall back into poverty.
< Finally, it warns investors that the growth trends of current high fliers like China could reverse if they donot continue to strengthen their governance, financial, entrepreneurial, and management systems.
260 MONEY AND BANKING
shocks
In economics, sudden,unexpected changes. Theyusually have adverseconsequences, but someshocks can be salutary. Theones discussed here are allbad for the financial systemand hence the economy.
5. FINANCIAL SHOCKS
L E A R N I N G O B J E C T I V E
1. How do financial shocks and crises affect the real economy?
Another important implication of the growth diamond is that financial crises can have extremely neg-ative consequences for economic growth. Five shocks, alone or in combination, have a strongpropensity to initiate financial crises:
Increases in uncertainty. When companies cannot plan for the future and when investors feel theycannot estimate future corporate earnings or interest, inflation, or default rates, they tend to play itsafe. They hold cash instead of investing in a new factory or equipment. That, of course, reduces ag-gregate economic activity.
Increases in interest rates. Higher interest rates make business projects less profitable and henceless likely to be completed, a direct blow to gross domestic product (GDP). Also, higher interest ratestend to exacerbate adverse selection by discouraging better borrowers but having little or no effect onthe borrowing decisions of riskier companies and individuals. As a result, lenders are saddled withhigher default rates in high interest-rate environments. So, contrary to what one would think, highrates reduce their desire to lend. To the extent that businesses own government or other bonds, higherinterest rates decrease their net worth, leading to balance sheet deterioration, of which we will learnmore below. Finally, higher interest rates hurt cash flow (receipts minus expenditures), rendering firmsmore likely to default.
Government fiscal problems. Governments that expend more than they take in via taxes and otherrevenues have to borrow. The more they borrow, the harder it is for them to service their loans, raisingfears of a default, which decreases the market price of their bonds. That hurts the balance sheets offirms that invest in government bonds and may lead to an exchange rate crisis as investors sell assetsdenominated in the local currency in a flight to safety. Precipitous declines in the value of local cur-rency causes enormous difficulties for firms that have borrowed in foreign currencies, like dollars, ster-ling, euro, or yen, because they have to pay more units of local currency than expected for each unit offoreign currency. Many are unable to do so and they default, increasing uncertainty and asymmetricinformation.
Balance sheet deterioration. Whenever a firm’s balance sheet deteriorates, which is to say, whenev-er its net worth falls because the value of its assets decreases and/or the value of its liabilities increases,or because stock market participants value the firm less highly, the Cerberus of asymmetric informa-tion rears its trio of ugly, fang-infested faces. The company now has less at stake, so it might engage inriskier activities, exacerbating adverse selection. As its net worth declines, moral hazard increases be-cause it grows more likely to default on existing obligations, in turn because it has less at stake. Finally,agency problems become more prevalent as employee bonuses shrink and stock options become value-less. As employees begin to shirk, steal, and look for other work on company time, productivity plum-mets, and further declines in profitability cannot be far behind. The same negative cycle can also bejump-started by an unanticipated deflation, a decrease in the aggregate price level, because that willmake the firm’s liabilities (debts) more onerous in real terms (i.e., adjusted for lower prices).
Banking problems and panics. If anything hurts banks’ balance sheets (like higher than expecteddefault rates on loans they have made), banks will reduce their lending to avoid going bankrupt and/orincurring the wrath of regulators. As we have seen, banks are the most important source of external fin-ance in most countries, so their decision to curtail will negatively affect the economy by reducing theflow of funds between investors and entrepreneurs. If bank balance sheets are hurt badly enough, somemay fail. That may trigger the failure of yet more banks for two reasons. First, banks often owe eachother considerable sums. If a big one that owes much to many smaller banks were to fail, it could en-danger the solvency of the creditor banks. Second, the failure of a few banks may induce the holders ofbanks’ monetary liabilities (today mostly deposits, but in the past, as we’ve seen, also bank notes) to runon the bank, to pull their funds out en masse because they can’t tell if their bank is a good one or not.The tragic thing about this is that, because all banks engage in fractional reserve banking (which is tosay, that no bank keeps enough cash on hand to meet all of its monetary liabilities), runs often becomeself-fulfilling prophecies, destroying even solvent institutions in a matter of days or even hours. Bank-ing panics and the dead banks they leave in their wake causes uncertainty, higher interest rates, andbalance sheet deterioration, all of which, as we’ve seen, hurt aggregate economic activity.
A downward spiral often ensues. Interest rate increases, stock market declines, uncertainty, bal-ance sheet deterioration, and fiscal imbalances, as detailed above, all tend to increase asymmetric in-formation. That, in turn, causes economic activity to decline, triggering more crises, including bank pan-ics and/or foreign exchange crises, which increase asymmetric information yet further. Economic activity
CHAPTER 23 AGGREGATE SUPPLY AND DEMAND, THE GROWTH DIAMOND, AND FINANCIAL SHOCKS 261
again declines, perhaps triggering more crises or an unanticipated decline in the price level. That is thepoint, traditionally, where recessions turn into depressions, unusually long and steep economicdownturns.
Stop and Think Box
In early 1792, U.S. banks curtailed their lending. That caused a securities speculator and shyster by the name ofWilliam Duer to go bankrupt owing large sums of money to hundreds of investors. The uncertainty caused byDuer’s sudden failure caused people to panic, inducing them to sell securities, even government bonds, forcash. By mid-summer, though, the economy was again humming along nicely. In 1819, banks again curtailedlending, leading to a rash of mercantile failures. People again panicked, this time running on banks (butclutching their government bonds for dear life). Many banks failed and unemployment soared. Economicactivity shrank, and it took years to recover. Why did the economy right itself quickly in 1792 but only slowly in1819?
In 1792, America’s central bank (then the Secretary of the Treasury, Alexander Hamilton, working in conjunc-tion with the Bank of the United States) acted as a lender of last resort. By adding liquidity to the economy, thecentral bank calmed fears, reduced uncertainty and asymmetric information, and kept interest rates from spik-ing and balance sheets from deteriorating further. In 1819, the central bank (with a new Treasury secretary anda new bank, the Second Bank of the United States) crawled under a rock, allowing the initial crisis to increaseasymmetric information, reduce aggregate output, and ultimately cause an unexpected debt deflation. Since1819, America has suffered from financial crises on numerous occasions. Sometimes they have ended quicklyand quietly, as when Alan Greenspan stymied the stock market crash of 1987. Other times, like after the stockmarket crash of 1929, the economy did not fare well at all.[10]
Assuming the growth diamond has not been destroyed by the depression, economies will eventually re-verse themselves after many companies have gone bankrupt; the balance sheets of surviving firms im-prove; and uncertainty, asymmetric information, and interest rates decrease (see Chapter 5). It is betterfor everyone, however, if financial crises can be nipped in the bud before they turn ugly. This, as welearned in Chapter 17, is one of the major functions of central banks like the European Central Bank(ECB) and the Fed. Generally, all that the central bank needs to do at the outset of a crisis is to restoreconfidence, reduce uncertainty, and keep interest rates in line by adding liquidity (cash) to the eco-nomy by acting as a lender of last resort, helping out banks and other financial intermediaries withloans and buying government bonds in the open market. As we learned in Chapter 12, however, some-times a bailout becomes necessary. Figure 23.9 summarizes this discussion of the ill consequences offinancial shocks.
262 MONEY AND BANKING
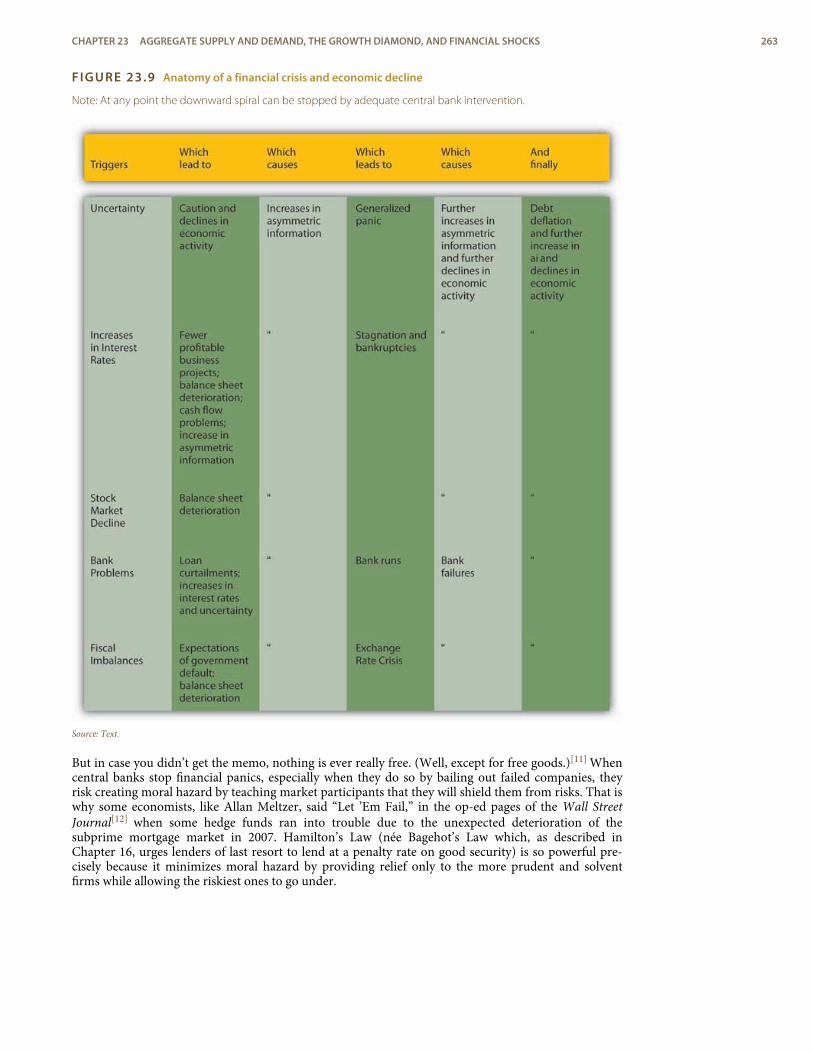
FIGURE 23.9 Anatomy of a financial crisis and economic decline
Note: At any point the downward spiral can be stopped by adequate central bank intervention.
Source: Text.
But in case you didn’t get the memo, nothing is ever really free. (Well, except for free goods.)[11] Whencentral banks stop financial panics, especially when they do so by bailing out failed companies, theyrisk creating moral hazard by teaching market participants that they will shield them from risks. That iswhy some economists, like Allan Meltzer, said “Let ’Em Fail,” in the op-ed pages of the Wall StreetJournal[12] when some hedge funds ran into trouble due to the unexpected deterioration of thesubprime mortgage market in 2007. Hamilton’s Law (née Bagehot’s Law which, as described inChapter 16, urges lenders of last resort to lend at a penalty rate on good security) is so powerful pre-cisely because it minimizes moral hazard by providing relief only to the more prudent and solventfirms while allowing the riskiest ones to go under.
CHAPTER 23 AGGREGATE SUPPLY AND DEMAND, THE GROWTH DIAMOND, AND FINANCIAL SHOCKS 263
K E Y T A K E A W A Y S
< Financial shocks and crises affect the real economy by increasing asymmetric information.
< That, in turn, reduces the amount of funds channeled from investors to entrepreneurs.
< Starved of external finance, businesses cut back production, decreasing aggregate economic activity.
< The conduits include rapidly rising interest rates, foreign exchange crises, and bank panics.
6. SUGGESTED READINGBaumol, William, Robert Litan, and Carl Schramm. Good Capitalism, Bad Capitalism, and the Eco-
nomics of Growth and Prosperity. New Haven, CT: Yale University Press, 2007.Haber, Stephen, Douglass North, and Barry Weingast. Political Institutions and Financial Develop-
ment. Stanford, CA: Stanford University Press, 2008.Powell, Benjamin. Making Poor Nations Rich: Entrepreneurship and the Process of Economic Devel-
opment. Stanford, CA: Stanford University Press, 2008.Wright, Robert E. One Nation Under Debt: Hamilton, Jefferson, and the History of What We Owe.
New York: McGraw-Hill, 2008.
264 MONEY AND BANKING

1.2.3.4.
5.6.
7.8.
9.
10.11.12.
ENDNOTES
http://econ161.berkeley.edu/Economists/keynes.html
http://www.bartleby.com/66/8/32508.html
http://www.minneapolisfed.org/research/prescott/
http://nobelprize.org/nobel_prizes/economics/laureates/2004/prescott-autobio.html
http://economics.about.com/library/glossary/bldef-hysteresis.htm
http://w4.stern.nyu.edu/economics/facultystaff.cfm?doc_id=1019
http://w4.stern.nyu.edu/sternbusiness/spring_2007/sustainableGrowth.html
(T. R. Preston, Three Years’ Residence in Canada, from 1837 to 1839, 2 vols., (London:Richard Bentley 1840), 185).
Will Baumol, “Productivity Growth, Convergence, and Welfare: What the Long-RunData Show,” American Economic Review 76 (December 1986): 1072–1086, as quotedin Peter L. Bernstein, Against the Gods: The Remarkable Story of Risk (New York: JohnWiley & Sons, 1996), 181.
http://www.amatecon.com/gd/gdcandc.html
http://en.wikipedia.org/wiki/Free_good
July 21, 2007. http://online.wsj.com/article/SB118498744630073854.html
CHAPTER 23 AGGREGATE SUPPLY AND DEMAND, THE GROWTH DIAMOND, AND FINANCIAL SHOCKS 265

266 MONEY AND BANKING
transmission mechanisms
How A leads to B in a causalchain; how A is transmitted,so to speak, to B.
C H A P T E R 2 4Monetary PolicyTransmission Mechanisms
C H A P T E R O B J E C T I V E S
By the end of this chapter, students should be able to:
1. Explain why structural models are generally superior to reduced-form models.
2. Describe the types of evidence that can strengthen researchers’ conviction that a reduced-form model has the direction of causation right, say, from money (M) to output (Y).
3. Describe the evidence that money matters.
4. List and explain several important monetary policy transmission mechanisms.
1. MODELING REALITY
L E A R N I N G O B J E C T I V E
1. Why are structural models generally superior to reduced-form models?
We’ve learned in the last few chapters that monetary policy is not the end-all and be-all of the economyor even of policymakers’ attempts to manipulate it. But we knew that before. The question before us is,Given what we know of IS-LM and AS-AD, just how important is monetary policy? And how do weknow? We’ve got theories galore—notions about how changes in sundry variables, like interest rates, cre-ate certain outcomes, like changes in prices and aggregate output. But how well do those theories describereality? To answer those questions, we need empirical evidence, good hard numbers. We also need toknow how scientists and social scientists evaluate such evidence.
Structural models explicitly link variables from initial cause all the way to final effect via every inter-mediate step along the causal chain. Reduced-form evidence makes assertions only about initial causesand ultimate effects, treating the links in between as an impenetrable black box. The quantity theorymakes just such a reduced-form claim when it asserts that, as the money supply increases, so too doesoutput. In other words, the quantity theory is not explicit about the transmission mechanisms ofmonetary policy. On the other hand, the assertion that increasing the money supply decreases interestrates, which spurs investment, which leads to higher output, ceteris paribus, is a structural model. Sucha model can be assessed at every link in the chain: MS up, i down, I up, Y up. If the relationshipbetween MS and Y begins to break down, economists with a structural model can try to figure out spe-cifically why. Those touting only a reduced-form model will be flummoxed. Structural models alsostrengthen our confidence that changes in MS cause changes in Y.
Because they leave so much out, reduced-form models may point only to variables that are correl-ated, that rise and fall in tandem over time. Correlation, alas, is not causation; the link between variablesthat are only correlated can be easily broken. All sorts of superstitions are based on mere correlation, astheir practitioners eventually discover to their chagrin and loss,[1] like those who wear goofy-lookingrally caps to win baseball games.[2] Reverse causation is also rampant. People who see a high correlationbetween X and Y often think that X causes Y when in fact Y causes X. For example, there is a high cor-relation between fan attendance levels and home team victories. Some superfans[3] take this to “prove”that high attendance causes the home team to win by acting as a sixth, tenth, or twelfth player, depend-ing on the sport. Fans have swayed the outcome of a few games, usually by touching baseballs still inplay,[4] but the causation mostly runs in the other direction—teams that win many games tend to at-tract more fans.
Omitted variables can also cloud the connections made by reduced-form models. “Caffeine drinkershave higher rates of coronary heart disease (CHD) than people who don’t consume caffeine” is areduced-form model that probably suffers from omitted variables in the form of selection biases. Inother words, caffeine drinkers drink caffeine because they don’t get enough sleep; have hectic, stressfullives; and so forth. It may be that those other factors give them heart attacks, not the caffeine per se. Orthe caffeine interacts with those other variables in complex ways that are difficult to unravel withoutgrowing human beings in test tubes (even more alarming!).
Stop and Think Box
A recent reduced-form study shows a high degree of correlation between smoking marijuana and bad lifeoutcomes: long stints of unemployment, criminal arrests, higher chance of disability, lower lifetime income,and early death. Does that study effectively condemn pot smoking?
Not nearly as much as it would if it presented a structural model that carefully laid out and tested the precisechain by which marijuana smoking causes those bad outcomes. Omitted variables and even reverse causationcan be at play in the reduced-form version. For example, some people smoke pot because they have cancer.Some cancer treatments require nasty doses of chemotherapy, the effect of which is to cause pain and reduceappetite. Taking a toke reduces the pain and restores appetite. Needless to say, such people have lower life ex-pectancies than people without cancer. Therefore, they have lower lifetime income and a higher chance ofdisability and unemployment. Because not all states have medical marijuana exceptions, they are also more li-able to criminal arrest. Similarly, unemployed people might be more likely to take a little Mary Jane after lunchor perhaps down a couple of cannabis brownies for dessert, again reversing the direction of causation. A pos-sible omitted variable is selection bias: people who smoke pot might be less educated than those who abstainfrom the weed, and it is the dearth of education that leads to high unemployment, more arrests, and so forth.Unfortunately, bad science like this study pervades public discourse. Of course, this does not mean that youshould go get yourself a blunt. Study instead. Correlation studies show that studying . . . .
K E Y T A K E A W A Y S
< Structural models trace the entire causal chain, step by step, allowing researchers to be pretty confidentabout the direction of causation and to trace any breakdowns in the model to specific relationships.
< Reduced-form models link initial variables to supposed outcomes via an impenetrable black box.
< The problem is that correlation does not always indicate causation. X may increase and decrease with Y,although X does not cause Y because Y may cause X (reverse causation), or Z (an omitted variable) maycause X and Y.
< Reduced-form models can and have led to all sorts of goofy conclusions, like doctors kill people (theyseem to be ubiquitous during plagues, accidents, and the like) and police officers cause crime (the numberon the streets goes up during crime waves, and they are always at crime scenes—very suspicious). In caseyou can’t tell, I’m being sarcastic.
< On the other hand, reduced-form models are inexpensive compared to structural ones.
2. HOW IMPORTANT IS MONETARY POLICY?
L E A R N I N G O B J E C T I V E S
1. What types of evidence can strengthen researchers’ conviction that a reduced-form model hasthe direction of causation right, say, from M to Y? How?
2. What evidence is there that money matters?
Early Keynesians believed that monetary policy did not matter at all because they could not find anyevidence that interest rates affected planned business investment. Milton Friedman and Anna Schwartz,another monetarist, countered with a huge tome called A Monetary History of the United States,1867–1960 which purported to show that the Keynesians had it all wrong, especially their kooky claimthat monetary policy during the Great Depression had been easy (low real interest rates and MSgrowth). Nominal rates on risky securities had in fact soared in 1930–1933, the depths of the depres-sion. Because the price level was falling, real interest rates, via the Fisher Equation, were much higherthan nominal rates. If you borrowed $100, you’d have to repay only $102 in a year, but those 102
268 MONEY AND BANKING
smackers could buy a heck of a lot more goods and services a year hence. So real rates were more onthe order of 8 to 10 percent, which is pretty darn high. The link between interest rates and investment,the monetarists showed, was between investment and real interest rates, not nominal interest rates.
As noted above, the early monetarists relied on MV = PY, a reduced-form model. To strengthentheir conviction that causation indeed ran from M to Y instead of Y to M or some unknown variablesA…Z to M and Y, the monetarists relied on three types of empirical evidence: timing, statistical, and his-torical. Timing evidence tries to show that increases in M happen before increases in Y, and not viceversa, relying on the commonplace assumption that causes occur before their effects. Friedman andSchwartz showed that money growth slowed before recessions, but the timing was highly variable. So-metimes slowing money growth occurred sixteen months before output turned south; other times, onlya few months passed. That is great stuff, but it is hardly foolproof because, as Steve Miller points out,time keeps on slipping, slipping, slipping, into the future.[5] Maybe a decline in output caused the de-cline in the money supply. Changes in M and Y, in other words, could be causing each other in a sort ofvirtuous or pernicious cycle or chicken-egg problem. Or again maybe there is a mysterious variable Zrunning the whole show behind the scenes.
Statistical evidence is subject to the same criticisms plus the old adage that there are three types ofuntruths (besides Stephen Colbert’s truthiness,[6] of course): lies, damn lies, and statistics. By changingstarting and ending dates, conflating the difference between statistical significance and economic sig-nificance,[7] manipulating the dates of structural breaks, and introducing who knows how many othersubtle little fibs, researchers can make mountains out of molehills, and vice versa. It’s kinda funny thatwhen monetarists used statistical tests, the quantity theory won and money mattered, but when the earlyKeynesians conducted the tests, the quantity theory looked, if not insane, at least inane.
But Friedman and Schwartz had an empirical ace up their sleeves: historical evidence from periodsin which declines in the money supply appear to be exogenous, by which economists mean “caused bysomething outside the model,” thus eliminating doubts about omitted variables and reverse causation.White-lab-coat scientists (you know, physicists, chemists, and so forth—“real” scientists) know thatvariables change exogenously because they are the ones making the changes. They can do this system-atically in dozens, hundreds, even thousands of test tubes, Petri dishes, atomic acceleration experi-ments, and what not, carefully controlling for each variable (making sure that everything is ceterisparibus), then measuring and comparing the results. As social scientists, economists cannot run suchexperiments. They can and do turn to history, however, for so-called natural experiments. That’s whatthe monetarists did, and what they found was that exogenous declines in MS led to recessions (lowerY*) every time. Economic and financial history wins! (Disclaimer: One of the authors of this textbook[Wright] is a financial historian.) While they did not abandon the view that C, G, I, NX, and T alsoaffect output, Keynesians now accept money’s role in helping to determine Y. (A new group, the real-business-cycle theorists associated with the Minneapolis Fed, has recently challenged the notion thatmoney matters, but those folks haven’t made it into the land of undergraduate textbooks quite yet.)
K E Y T A K E A W A Y S
< Timing, statistical, and historical evidence strengthen researchers’ belief in causation.
< Timing evidence attempts to show that changes in M occur before changes in Y.
< Statistical evidence attempts to show that one model’s predictions are closer to reality than another’s.
< The problem with stats, though, is that those running the tests appear to rig them (consciously or not), sothe stats often tell us more about the researcher than they do about reality.
< Historical evidence, particularly so-called natural experiments in which variables change exogenously andhence are analogous to controlled scientific experiments, provide the best sort of evidence on thedirection of causation.
< The monetarists showed that there is a strong correlation between changes in the MS and changes in Yand also proffered timing, statistical, and historical evidence of a causal link.
< Historical evidence is the most convincing because it shows that the MS sometimes changedexogenously, that is, for reasons clearly unrelated to Y or other plausible causal variables, and that when itdid, Y changed with the expected sign (+ if MS increased, − if it decreased).
CHAPTER 24 MONETARY POLICY TRANSMISSION MECHANISMS 269
3. TRANSMISSION MECHANISMS
L E A R N I N G O B J E C T I V E
1. What are monetary policy transmission mechanisms and why are they important?
Most economists accept the proposition that money matters and have been searching for structuralmodels that delineate the specific transmission mechanisms between MS and Y. The most basic modelsays the following:
Expansionary monetary policy (EMP), real interest rates down, investment up, aggregate output upThe importance of interest rates for consumer expenditures (especially on durables like autos, re-
frigerators, and homes) and net exports has also been recognized, leading to the following:EMP, ir ↓, I + C + NX ↑, Y ↑Tobin’s q, the market value of companies divided by the replacement cost of physical capital, is
clearly analogous to i and related to I. When q is high, firms sell their highly valued stock to raise cashand buy new physical plant and build inventories. When q is low, by contrast, firms don’t get much fortheir stock compared to the cost of physical capital, so they don’t sell stock to fund increases in I. By in-creasing stock prices, the MS may be positively related to q. Thus, another monetary policy transmis-sion mechanism may be the following:
EMP, Ps↑, q ↑, I ↑, Y↑The wealth effect is a transmission mechanism whereby expansionary monetary policy leads to in-
creases in the prices of stocks, homes, collectibles, and other assets, in other words, an increase in indi-vidual wealth. That increase, in turn, induces people to consume more:
EMP, Pa ↑, wealth ↑, C ↑, Y↑The credit view posits several straightforward transmission mechanisms, including bank loans,
asymmetric information, and balance sheets:EMP, bank deposits ↑, bank loans ↑, I ↑, Y↑EMP, net worth ↓, asymmetric information ↓, lending ↑, I + C ↑, Y↑EMP, i ↓, cash flow ↑, asymmetric information ↓, lending ↑, I + C ↑, Y↑EMP, unanticipated P* ↑, real net worth ↑, asymmetric information ↓, lending ↑, I ↑, Y↑Asymmetric information (that horrible three-headed hound from Hades) is a powerful and im-
portant theory, so scholars’ confidence in these transmission mechanisms is high.
Stop and Think Box
The Fed thought that it would quickly squelch the recession that began in March 2001, yet the downturn las-ted until November of that year. The terrorist attacks that September worsened matters, but the Fed hadhoped to reverse the drop in Y* well before then. Why was the Fed’s forecast overly optimistic? (Hint: Corpor-ate accounting scandals at Enron, Arthur Andersen, and other firms were part of the mix.)
The Fed might not have counted on some major monetary policy transmission mechanisms, including reduc-tions in asymmetric information, being muted by the accounting scandals. In other words,
EMP, net worth ↑, asymmetric information ↓, lending ↑, I + C ↑, Y↑
EMP, i ↓, cash flow ↑, asymmetric information ↓, lending ↑, I + C ↑, Y↑
EMP, unanticipated P ↑, real net worth ↑, asymmetric information ↓, lending ↑, I ↑, Y↑
became something more akin to the following:
EMP, net worth ↑, asymmetric information — (flat or no change), lending —, I + C —, Y —
EMP, i ↑, cash flow ↑, asymmetric information —, lending —, I + C —, Y —
EMP, unanticipated P ↑, real net worth ↑, asymmetric information—, lending —, I —, Y — because asymmetricinformation remained high due to the fact that economic agents felt as though they could no longer counton the truthfulness of corporate financial statements.
The takeaway of all this for monetary policymakers, and those interested in their policies (includingyou, as you know from Chapter 1), is that monetary policy needs to take more into account than justshort-term interest rates. Policymakers need to worry about real interest rates, including long-termrates; unexpected changes in the price level; the interest rates on risky bonds; the prices of other assets,
270 MONEY AND BANKING
including corporate equities, homes, and the like; the quantity of bank loans; and the bite of adverse se-lection, moral hazard, and the principal-agent problem.
Stop and Think Box
Japan’s economy was going gangbusters until about 1990 or so, when it entered a fifteen-year economic funk.To try to get the Japanese economy moving again, the Bank of Japan lowered short-term interest rates all theway to zero for many years on end, to no avail. Why didn’t the Japanese economy revive due to the monetarystimulus? What should the Japanese have done instead?
As it turns out, ir stayed quite high because the Japanese expected, and received, price deflation. Through theFisher Equation, we know that ir = i − πe, or real interest rates equal nominal interest rates minus inflation ex-pectations. If πe is negative, which it is when prices are expected to fall, ir will be > i. So i can be 0 but ir can be1, 2, 3 . . . 10 percent per year if prices are expected to decline by that much. So instead of EMP, ir −, I + C + NX−, Y− the Japanese experienced ir −, I + C + NX −, Y−. Not good. They should have pumped up the MS muchfaster, driving πe from negative whatever to zero or even positive, and thus making real interest rates low ornegative, and hence a stimulant. The Japanese made other mistakes as well, allowing land and equities pricesto plummet, thereby nixing the Tobin’s q and wealth effect transmission mechanisms. They also kept somebig shaky banks from failing, which kept levels of asymmetric information high and bank loan levels low,squelching the credit channels.
K E Y T A K E A W A Y S
< Monetary policy transmission mechanisms are essentially structural models that predict the precise chainsof causation between expansionary monetary policy (EMP) or tight monetary policy (TMP) and Y.
< They are important because they provide central bankers and other monetary policymakers with adetailed view of how changes in the MS affect Y, allowing them to see why some policies don’t work asmuch or as quickly as anticipated.
< That, in turn, allows them to become better policymakers, to the extent that is possible in a world ofrational expectations. (See Chapter 26.)
< Transmission mechanisms include:
< EMP, ir↓, I + C + NX ↑, Y↑, EMP, q ↑, I ↑, Y↑< EMP, Pa ↑, wealth ↑, C ↑, Y↑< EMP, bank deposits ↑, bank loans ↑, I ↑, Y↑< EMP, net worth ↑, asymmetric information ↓, lending ↑, I + C ↑, Y↑< EMP, i ↓, cash flow ↑, asymmetric information ↓, lending ↑, I + C ↑, Y↑< EMP, unanticipated P* ↑, real net worth ↑, asymmetric information ↓, lending ↑, I ↑, Y↑
4. SUGGESTED READINGAngeloni, Ignazio, Anil Kashyap, and Benoit Mojon. Monetary Policy Transmission in the Euro
Area. New York: Cambridge University Press, 2004.Friedman, Milton, and Anna Schwartz. A Monetary History of the United States, 1867–1960. Prin-
ceton, NJ: Princeton University Press, 1971.Mahadeva, Lavan, and Peter Sinclair. Monetary Transmission in Diverse Economies. New York:
Cambridge University Press, 2002.
CHAPTER 24 MONETARY POLICY TRANSMISSION MECHANISMS 271

1.2.
3.4.5.6.7.
ENDNOTES
http://www.dallasobserver.com/2005-09-08/dining/tryst-of-fate/
http://www.dushkin.com/olc/genarticle.mhtml?article=27128
http://en.wikipedia.org/wiki/Bill_Swerski's_Superfans
http://www.usatoday.com/sports/columnist/lopresti/2003-10-15-lopresti_x.htm
http://www.lyricsfreak.com/s/steve+miller/fly+like+an+eagle_20130994.html
http://en.wikipedia.org/wiki/Truthiness
http://www.deirdremccloskey.com/pubs/books/preface_ziliak.php
272 MONEY AND BANKING
C H A P T E R 2 5Inflation and Money
C H A P T E R O B J E C T I V E S
By the end of this chapter, students should be able to:
1. Describe the strongest evidence for the reduced-form model that links money supplygrowth to inflation.
2. Explain what the aggregate supply-aggregate demand (AS-AD) model, a structural model,says about money supply growth and the price level.
3. Explain why central bankers allow inflation to occur year after year.
4. Define lags and explain their importance.
1. EMPIRICAL EVIDENCE OF A MONEY-INFLATIONLINK
L E A R N I N G O B J E C T I V E S
1. What is the strongest evidence for the reduced-form model that links money supply growth toinflation?
2. What does the AS-AD model, a structural model, say about money supply growth and the pricelevel?
Milton Friedman claimed that “inflation is always and everywhere a monetary phenomenon.”[1] Weknow this isn’t entirely true because, as we saw in Chapter 23, negative aggregate supply shocks and in-creases in aggregate demand due to fiscal stimulus can also cause the price level to increase. Large, sus-tained increases in the price level, however, are indeed caused by increases in the money supply andonly by increases in the money supply. The evidence for this is overwhelming: all periods of hyperinfla-tion from the American and French Revolutions to the German hyperinflation following World War I, tomore recent episodes in Latin America and Zimbabwe, have been accompanied by high rates of moneysupply (MS) growth. Moreover, the MS increases in some circumstances were exogenous, so those epis-odes were natural experiments that give us confidence that the reduced-form model correctly considersmoney supply as the causal agent and that reverse causation or omitted variables are unlikely.
Stop and Think Box
During the American Civil War, the Confederate States of America (CSA, or the South) issued more than $1 bil-lion of fiat paper currency similar to today’s Federal Reserve notes, far more than the economy could supportat the prewar price level. Confederate dollars fell in value from 82.7 cents in specie in 1862 to 29.0 cents in1863, to 1.7 cents in 1865, a level of currency depreciation (inflation) that some economists think was simplytoo high to be accounted for by Confederate money supply growth alone. What other factors may have beenat play? (Hint: Over the course of the war, the Union [the North] imposed a blockade of southern trade that in-creased in efficiency during the course of the war, especially as major Confederate seaports like New Orleansand Norfolk fell under northern control.)
A negative supply shock, the almost complete cutoff of foreign trade, could well have hit poor Johnny Reb(the South) as well. That would have decreased output and driven prices higher, prices already raised to loftyheights by continual emissions of too much money.
Economists also have a structural model showing a causal link between money supply growth and in-flation at their disposal, the AS-AD model. Recall that an increase in MS causes the AD curve to shift
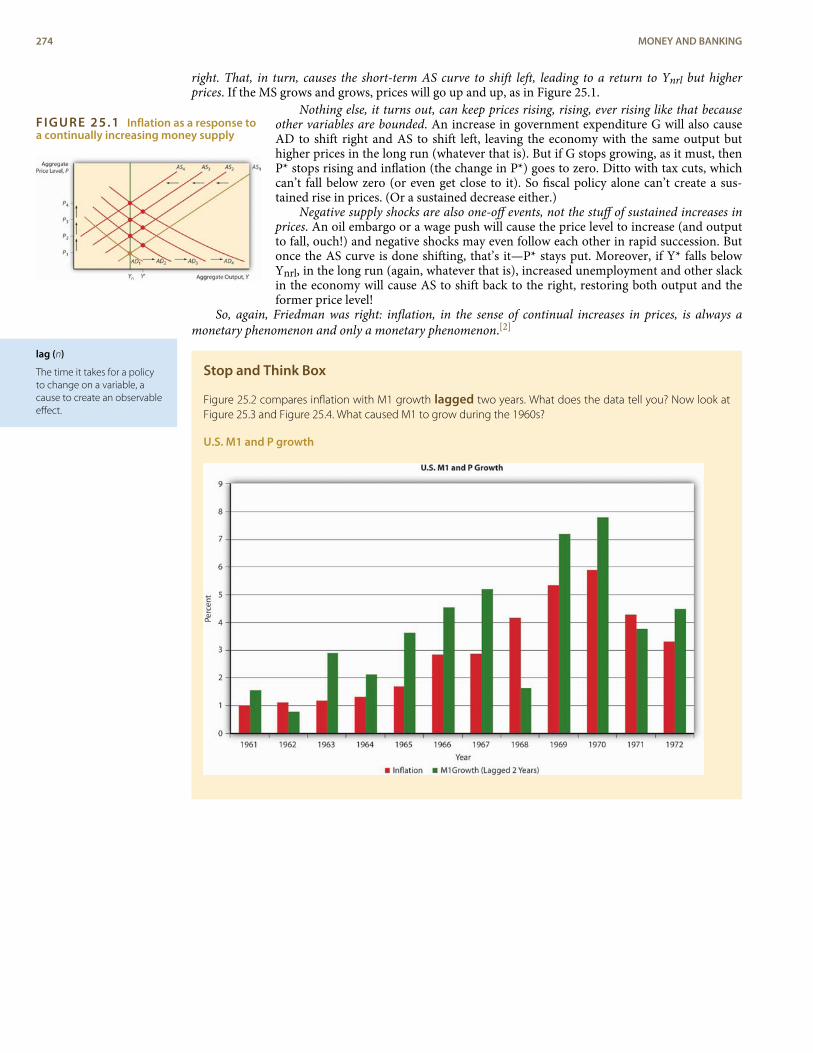
FIGURE 25.1 Inflation as a response toa continually increasing money supply
lag (n)
The time it takes for a policyto change on a variable, acause to create an observableeffect.
right. That, in turn, causes the short-term AS curve to shift left, leading to a return to Ynrl but higherprices. If the MS grows and grows, prices will go up and up, as in Figure 25.1.
Nothing else, it turns out, can keep prices rising, rising, ever rising like that becauseother variables are bounded. An increase in government expenditure G will also causeAD to shift right and AS to shift left, leaving the economy with the same output buthigher prices in the long run (whatever that is). But if G stops growing, as it must, thenP* stops rising and inflation (the change in P*) goes to zero. Ditto with tax cuts, whichcan’t fall below zero (or even get close to it). So fiscal policy alone can’t create a sus-tained rise in prices. (Or a sustained decrease either.)
Negative supply shocks are also one-off events, not the stuff of sustained increases inprices. An oil embargo or a wage push will cause the price level to increase (and outputto fall, ouch!) and negative shocks may even follow each other in rapid succession. Butonce the AS curve is done shifting, that’s it—P* stays put. Moreover, if Y* falls belowYnrl, in the long run (again, whatever that is), increased unemployment and other slackin the economy will cause AS to shift back to the right, restoring both output and theformer price level!
So, again, Friedman was right: inflation, in the sense of continual increases in prices, is always amonetary phenomenon and only a monetary phenomenon.[2]
Stop and Think Box
Figure 25.2 compares inflation with M1 growth lagged two years. What does the data tell you? Now look atFigure 25.3 and Figure 25.4. What caused M1 to grow during the 1960s?
U.S. M1 and P growth
274 MONEY AND BANKING
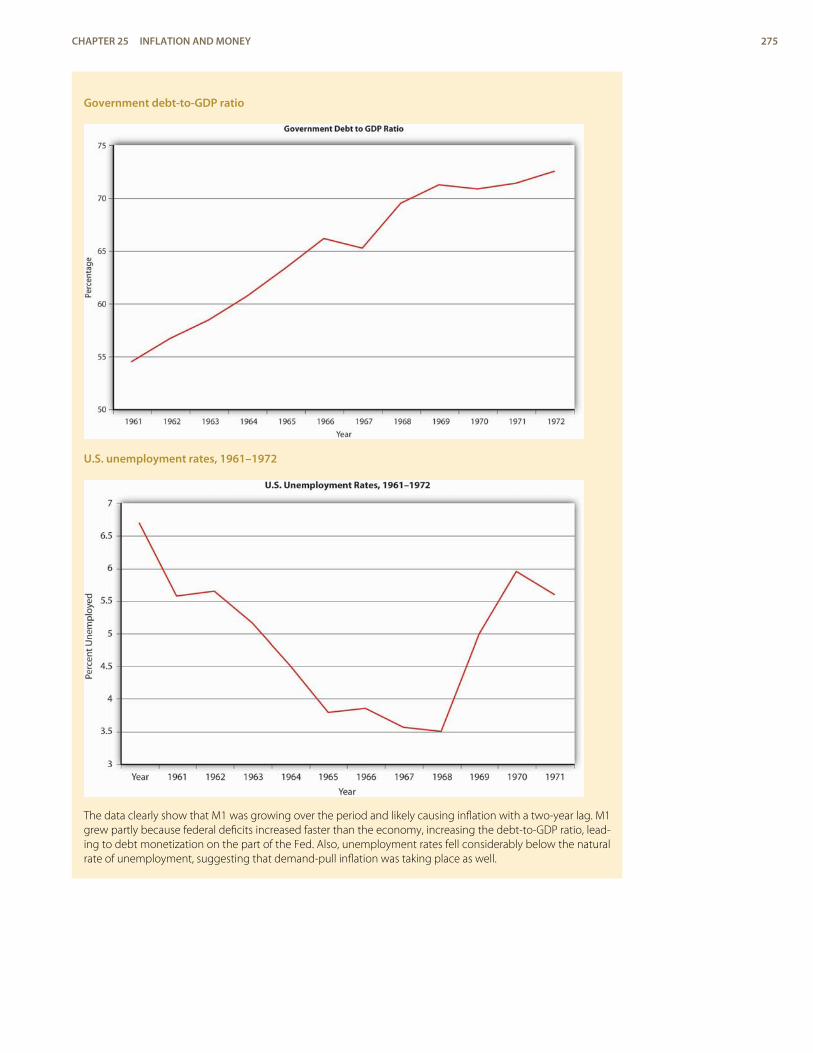
Government debt-to-GDP ratio
U.S. unemployment rates, 1961–1972
The data clearly show that M1 was growing over the period and likely causing inflation with a two-year lag. M1grew partly because federal deficits increased faster than the economy, increasing the debt-to-GDP ratio, lead-ing to debt monetization on the part of the Fed. Also, unemployment rates fell considerably below the naturalrate of unemployment, suggesting that demand-pull inflation was taking place as well.
CHAPTER 25 INFLATION AND MONEY 275
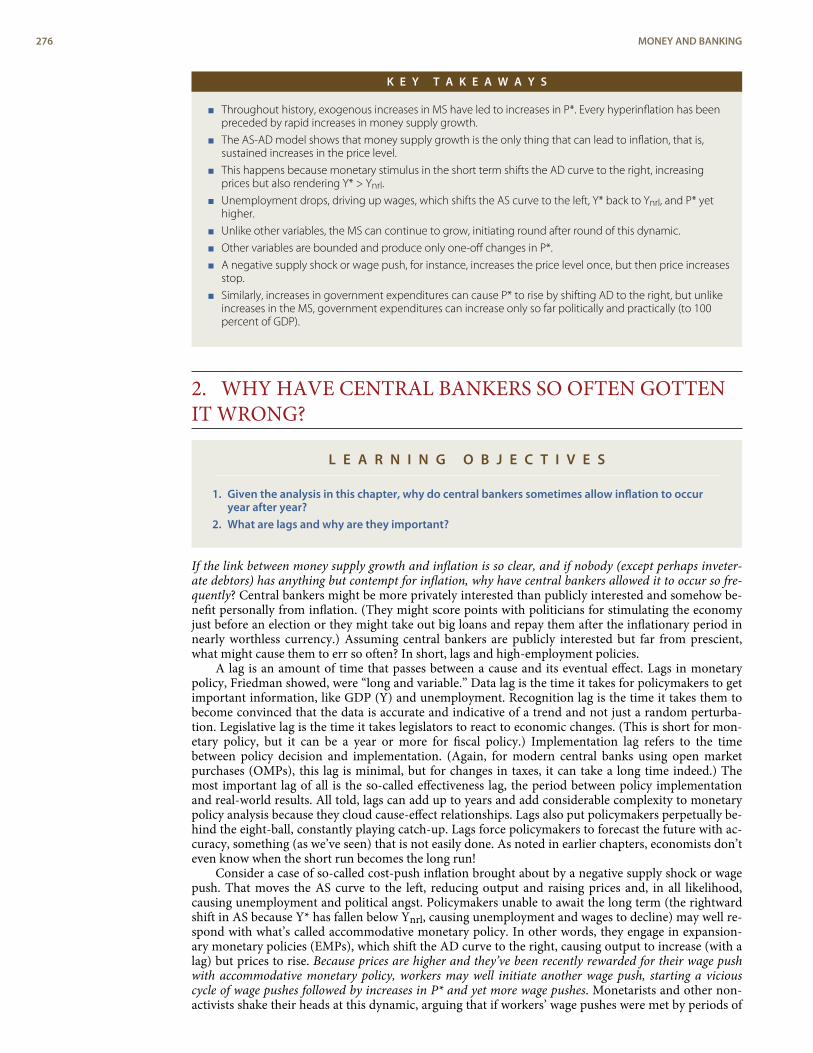
K E Y T A K E A W A Y S
< Throughout history, exogenous increases in MS have led to increases in P*. Every hyperinflation has beenpreceded by rapid increases in money supply growth.
< The AS-AD model shows that money supply growth is the only thing that can lead to inflation, that is,sustained increases in the price level.
< This happens because monetary stimulus in the short term shifts the AD curve to the right, increasingprices but also rendering Y* > Ynrl.
< Unemployment drops, driving up wages, which shifts the AS curve to the left, Y* back to Ynrl, and P* yethigher.
< Unlike other variables, the MS can continue to grow, initiating round after round of this dynamic.
< Other variables are bounded and produce only one-off changes in P*.
< A negative supply shock or wage push, for instance, increases the price level once, but then price increasesstop.
< Similarly, increases in government expenditures can cause P* to rise by shifting AD to the right, but unlikeincreases in the MS, government expenditures can increase only so far politically and practically (to 100percent of GDP).
2. WHY HAVE CENTRAL BANKERS SO OFTEN GOTTENIT WRONG?
L E A R N I N G O B J E C T I V E S
1. Given the analysis in this chapter, why do central bankers sometimes allow inflation to occuryear after year?
2. What are lags and why are they important?
If the link between money supply growth and inflation is so clear, and if nobody (except perhaps inveter-ate debtors) has anything but contempt for inflation, why have central bankers allowed it to occur so fre-quently? Central bankers might be more privately interested than publicly interested and somehow be-nefit personally from inflation. (They might score points with politicians for stimulating the economyjust before an election or they might take out big loans and repay them after the inflationary period innearly worthless currency.) Assuming central bankers are publicly interested but far from prescient,what might cause them to err so often? In short, lags and high-employment policies.
A lag is an amount of time that passes between a cause and its eventual effect. Lags in monetarypolicy, Friedman showed, were “long and variable.” Data lag is the time it takes for policymakers to getimportant information, like GDP (Y) and unemployment. Recognition lag is the time it takes them tobecome convinced that the data is accurate and indicative of a trend and not just a random perturba-tion. Legislative lag is the time it takes legislators to react to economic changes. (This is short for mon-etary policy, but it can be a year or more for fiscal policy.) Implementation lag refers to the timebetween policy decision and implementation. (Again, for modern central banks using open marketpurchases (OMPs), this lag is minimal, but for changes in taxes, it can take a long time indeed.) Themost important lag of all is the so-called effectiveness lag, the period between policy implementationand real-world results. All told, lags can add up to years and add considerable complexity to monetarypolicy analysis because they cloud cause-effect relationships. Lags also put policymakers perpetually be-hind the eight-ball, constantly playing catch-up. Lags force policymakers to forecast the future with ac-curacy, something (as we’ve seen) that is not easily done. As noted in earlier chapters, economists don’teven know when the short run becomes the long run!
Consider a case of so-called cost-push inflation brought about by a negative supply shock or wagepush. That moves the AS curve to the left, reducing output and raising prices and, in all likelihood,causing unemployment and political angst. Policymakers unable to await the long term (the rightwardshift in AS because Y* has fallen below Ynrl, causing unemployment and wages to decline) may well re-spond with what’s called accommodative monetary policy. In other words, they engage in expansion-ary monetary policies (EMPs), which shift the AD curve to the right, causing output to increase (with alag) but prices to rise. Because prices are higher and they’ve been recently rewarded for their wage pushwith accommodative monetary policy, workers may well initiate another wage push, starting a viciouscycle of wage pushes followed by increases in P* and yet more wage pushes. Monetarists and other non-activists shake their heads at this dynamic, arguing that if workers’ wage pushes were met by periods of
276 MONEY AND BANKING
higher unemployment, they would soon learn to stop. (After all, even 2-year-olds and rats eventuallylearn to stop pushing buttons if they are not rewarded for doing so. They learn even faster to stoppushing if they get a little shock.)
An episode of demand-pull inflation can also touch off accommodative monetary policy and a boutof inflation. If the government sets its full employment target too high, above the natural rate, it will al-ways look like there is too much unemployment. That will eventually tempt policymakers into thinkingthat Y* is < Ynrl, inducing them to implement an EMP. Output will rise, temporarily, but so too willprices. Prices will go up again when the AS curve shifts left, back to Ynrl, as it will do in a hurry giventhe low level of unemployment. The shift, however, will again increase unemployment over the govern-ment’s unreasonably low target, inducing another round of EMP and price increases.
Another source of inflation is government budget deficits. To cover their expenditures, governmentscan tax, borrow at interest, or borrow for free by issuing money. (Which would you choose?) Taxationis politically costly. Borrowing at interest can be costly too, especially if the government is a defaultrisk. Therefore, many governments pay their bills by printing money or by issuing bonds that their re-spective central banks then buy with money. Either way, the monetary base increases, leading to somemultiple increases in the MS, which leads to inflation. Effectively a tax on money balances called a cur-rency tax, inflation is easier to disguise and much easier to collect than other forms of taxes. Govern-ments get as addicted to the currency tax as individuals get addicted to crack or meth. This is especiallytrue in developing countries with weak (not independent) central banks.
Stop and Think Box
Why is central bank independence important in keeping inflation at bay?
Independent central banks are better able to withstand political pressures to monetize the debt, to follow ac-commodative policies, or to respond to (seemingly) “high” levels of unemployment with an EMP. They canalso make a more believable or credible commitment to stop inflation, which (as we’ll see in Chapter 26) is animportant consideration as well.
K E Y T A K E A W A Y S
< Private-interest scenarios aside, publicly interested central bankers might pursue high employment toovigorously, leading to inflation via cost-push and demand-pull mechanisms.
< If workers make a successful wage push, for example, the AS curve will shift left, increasing P*, decreasingY*, and increasing unemployment.
< If policymakers are anxious to get out of recession, they might respond with an expansionary monetarypolicy (EMP).
< That will increase Y* but also P* yet again. Such an accommodative policy might induce workers to tryanother wage push. The price level is higher after all, and they were rewarded for their last wage push.
< The longer this dynamic occurs, the higher prices will go.
< Policymakers might fall into this trap themselves if they underestimate full employment at, say, 97 percent(3 percent unemployment) when in fact it is 95 percent (5 percent unemployment).
< Therefore, unemployment of 4 percent looks too high and output appears to be < Ynrl, suggesting that anEMP is in order.
< The rightward shift of the AD curve causes prices and output to rise, but the latter rises only temporarily asthe already tight labor market gets tighter, leading to higher wages and a leftward shift of the AS curve,with its concomitant increase in P* and decrease in Y*.
< If policymakers’ original and flawed estimate of full employment is maintained, another round of AD is sureto come, as is higher prices.
< Budget deficits can also lead to sustained inflation if the government monetizes its debt directly byprinting money (and deposits) or indirectly via central bank open market purchases (OMPs) of governmentbonds.
< Lags are the amount of time it takes between a change in the economy to take place and policymakers toeffectively do something about it.
< That includes lags for gathering data, making sure the data show a trend and are not mere noise, making alegislative decision (if applicable), implementing policy (if applicable), and waiting for the policy to affectthe economy.
< Lags are important because they are long and variable, thus complicating monetary policy by makingcentral bankers play constant catch-up and also by clouding cause-effect relationships.
CHAPTER 25 INFLATION AND MONEY 277
3. SUGGESTED READINGBall, R. J. Inflation and the Theory of Money. Piscataway, NJ: Aldine Transaction, 2007.Bresciani-Turroni, Costantino. Economics of Inflation. Auburn, AL: Ludwig von Mises Institute,
2007.Samuelson, Robert. The Great Inflation and Its Aftermath: The Past and Future of American
Affluence. New York: Random House, 2008.
278 MONEY AND BANKING

1.
2.ENDNOTES
A Monetary History of the United States, 1867–1960.
This is not to say, however, that negative demand shocks might not contribute to ageneral monetary inflation.
CHAPTER 25 INFLATION AND MONEY 279

280 MONEY AND BANKING
C H A P T E R 2 6Rational Expectations Redux:Monetary PolicyImplications
C H A P T E R O B J E C T I V E S
By the end of this chapter, students should be able to:
1. Describe how the new classical macroeconomic model differs from the standard, pre-LucasAS-AD model.
2. Explain what the new classical macroeconomic model suggests regarding the efficacy ofactivist monetary policy.
3. Explain how the new Keynesian model differs from the new classical macroeconomicmodel.
4. Assess the extent to which policymakers can improve short-run macroeconomicperformance.
1. RATIONAL EXPECTATIONS
L E A R N I N G O B J E C T I V E S
1. How does the new classical macroeconomic model differ from the standard, pre-Lucas AS-ADmodel?
2. What does the new classical macroeconomic model suggest regarding the efficacy of activistmonetary policy? Why?
It turns out that the theory of rational expectations we learned about in Chapter 7 has important im-plications for monetary policy. In a quest to understand why policymakers had such a poor record, es-pecially during the 1970s, Len Mirman (University of Virginia),[1] Robert Lucas (University of Chica-go),[2] Thomas Sargent (New York University),[3] Bennett McCallum (Carnegie-Mellon),[4] EdwardPrescott (Arizona State),[5] and other economists of the so-called expectations revolution discovered thatexpansionary monetary policies cannot be effective if economic agents expect them to be implemented.Conversely, to thwart inflation as quickly and painlessly as possible, the central bank must be able tomake a credible commitment to stop it. In other words, it must convince people that it can and willstop prices from rising.
Stop and Think Box
During the American Revolution, the Continental Congress announced that it would stop printing bills ofcredit, the major form of money in the economy since 1775–1776, when rebel governments (the ContinentalCongress and state governments) began financing their little revolution by printing money. The ContinentalCongress implemented no other policy changes, so everyone knew that its large budget deficits would con-tinue. Prices continued upward. Why?
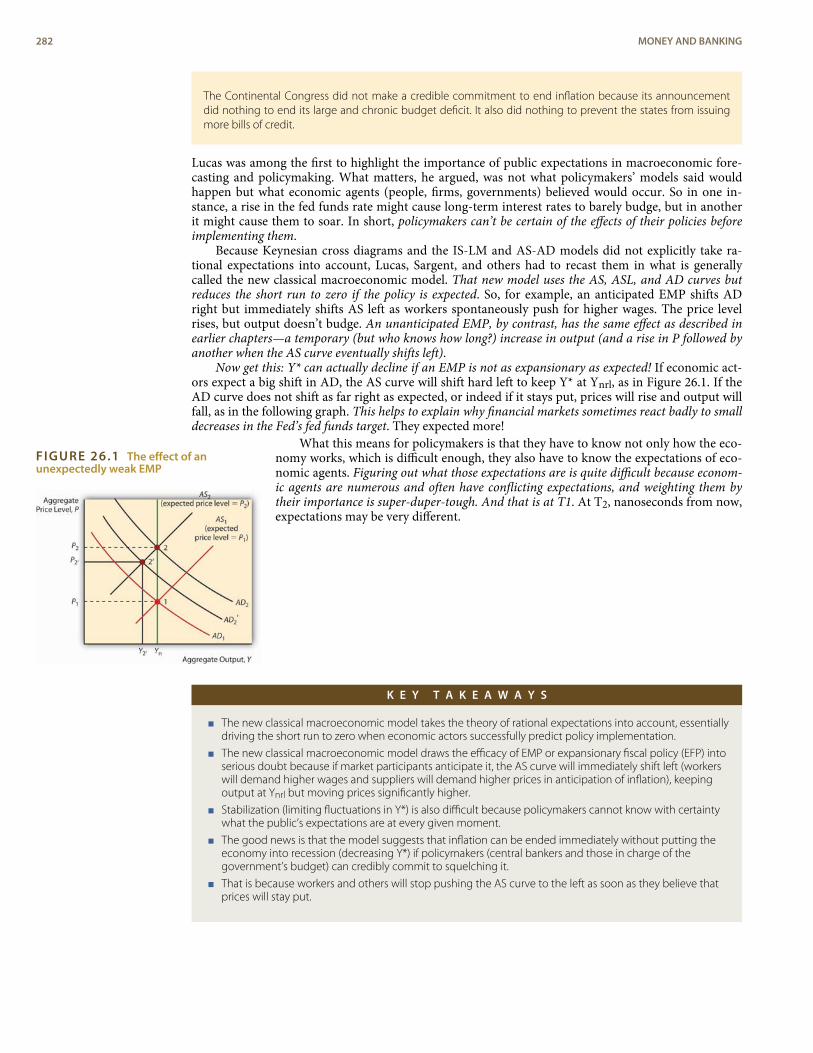
FIGURE 26.1 The effect of anunexpectedly weak EMP
The Continental Congress did not make a credible commitment to end inflation because its announcementdid nothing to end its large and chronic budget deficit. It also did nothing to prevent the states from issuingmore bills of credit.
Lucas was among the first to highlight the importance of public expectations in macroeconomic fore-casting and policymaking. What matters, he argued, was not what policymakers’ models said wouldhappen but what economic agents (people, firms, governments) believed would occur. So in one in-stance, a rise in the fed funds rate might cause long-term interest rates to barely budge, but in anotherit might cause them to soar. In short, policymakers can’t be certain of the effects of their policies beforeimplementing them.
Because Keynesian cross diagrams and the IS-LM and AS-AD models did not explicitly take ra-tional expectations into account, Lucas, Sargent, and others had to recast them in what is generallycalled the new classical macroeconomic model. That new model uses the AS, ASL, and AD curves butreduces the short run to zero if the policy is expected. So, for example, an anticipated EMP shifts ADright but immediately shifts AS left as workers spontaneously push for higher wages. The price levelrises, but output doesn’t budge. An unanticipated EMP, by contrast, has the same effect as described inearlier chapters—a temporary (but who knows how long?) increase in output (and a rise in P followed byanother when the AS curve eventually shifts left).
Now get this: Y* can actually decline if an EMP is not as expansionary as expected! If economic act-ors expect a big shift in AD, the AS curve will shift hard left to keep Y* at Ynrl, as in Figure 26.1. If theAD curve does not shift as far right as expected, or indeed if it stays put, prices will rise and output willfall, as in the following graph. This helps to explain why financial markets sometimes react badly to smalldecreases in the Fed’s fed funds target. They expected more!
What this means for policymakers is that they have to know not only how the eco-nomy works, which is difficult enough, they also have to know the expectations of eco-nomic agents. Figuring out what those expectations are is quite difficult because econom-ic agents are numerous and often have conflicting expectations, and weighting them bytheir importance is super-duper-tough. And that is at T1. At T2, nanoseconds from now,expectations may be very different.
K E Y T A K E A W A Y S
< The new classical macroeconomic model takes the theory of rational expectations into account, essentiallydriving the short run to zero when economic actors successfully predict policy implementation.
< The new classical macroeconomic model draws the efficacy of EMP or expansionary fiscal policy (EFP) intoserious doubt because if market participants anticipate it, the AS curve will immediately shift left (workerswill demand higher wages and suppliers will demand higher prices in anticipation of inflation), keepingoutput at Ynrl but moving prices significantly higher.
< Stabilization (limiting fluctuations in Y*) is also difficult because policymakers cannot know with certaintywhat the public’s expectations are at every given moment.
< The good news is that the model suggests that inflation can be ended immediately without putting theeconomy into recession (decreasing Y*) if policymakers (central bankers and those in charge of thegovernment’s budget) can credibly commit to squelching it.
< That is because workers and others will stop pushing the AS curve to the left as soon as they believe thatprices will stay put.
282 MONEY AND BANKING
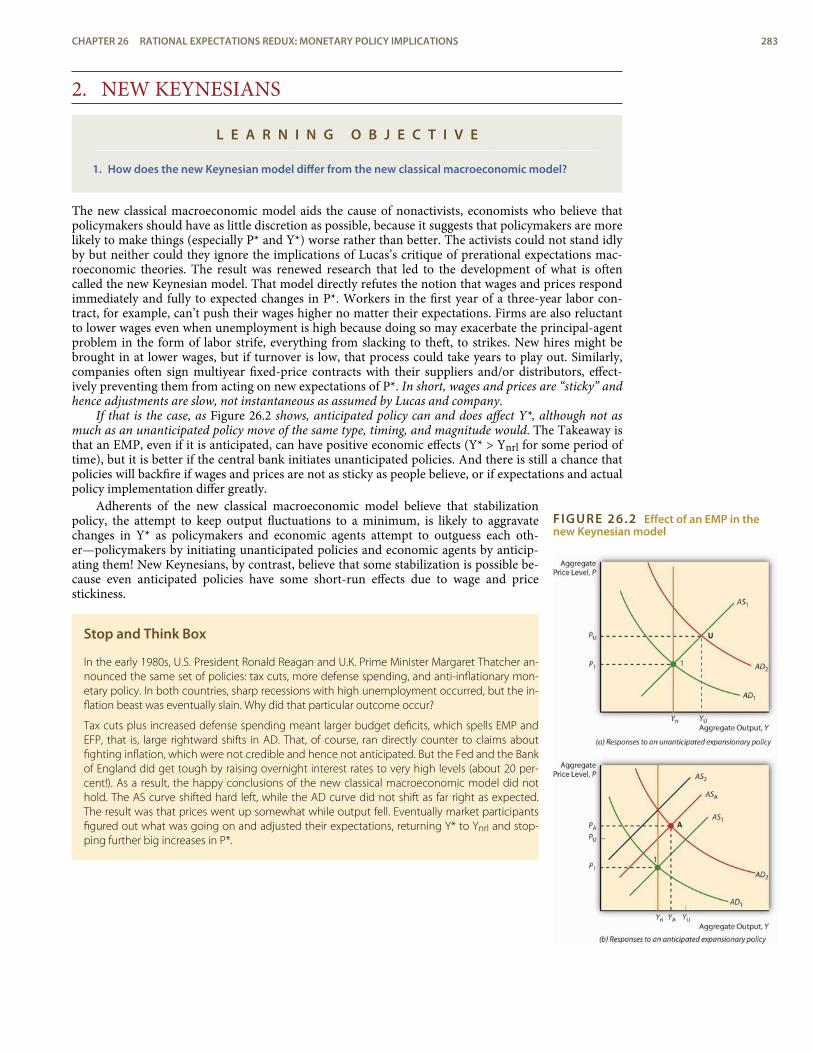
FIGURE 26.2 Effect of an EMP in thenew Keynesian model
2. NEW KEYNESIANS
L E A R N I N G O B J E C T I V E
1. How does the new Keynesian model differ from the new classical macroeconomic model?
The new classical macroeconomic model aids the cause of nonactivists, economists who believe thatpolicymakers should have as little discretion as possible, because it suggests that policymakers are morelikely to make things (especially P* and Y*) worse rather than better. The activists could not stand idlyby but neither could they ignore the implications of Lucas’s critique of prerational expectations mac-roeconomic theories. The result was renewed research that led to the development of what is oftencalled the new Keynesian model. That model directly refutes the notion that wages and prices respondimmediately and fully to expected changes in P*. Workers in the first year of a three-year labor con-tract, for example, can’t push their wages higher no matter their expectations. Firms are also reluctantto lower wages even when unemployment is high because doing so may exacerbate the principal-agentproblem in the form of labor strife, everything from slacking to theft, to strikes. New hires might bebrought in at lower wages, but if turnover is low, that process could take years to play out. Similarly,companies often sign multiyear fixed-price contracts with their suppliers and/or distributors, effect-ively preventing them from acting on new expectations of P*. In short, wages and prices are “sticky” andhence adjustments are slow, not instantaneous as assumed by Lucas and company.
If that is the case, as Figure 26.2 shows, anticipated policy can and does affect Y*, although not asmuch as an unanticipated policy move of the same type, timing, and magnitude would. The Takeaway isthat an EMP, even if it is anticipated, can have positive economic effects (Y* > Ynrl for some period oftime), but it is better if the central bank initiates unanticipated policies. And there is still a chance thatpolicies will backfire if wages and prices are not as sticky as people believe, or if expectations and actualpolicy implementation differ greatly.
Adherents of the new classical macroeconomic model believe that stabilizationpolicy, the attempt to keep output fluctuations to a minimum, is likely to aggravatechanges in Y* as policymakers and economic agents attempt to outguess each oth-er—policymakers by initiating unanticipated policies and economic agents by anticip-ating them! New Keynesians, by contrast, believe that some stabilization is possible be-cause even anticipated policies have some short-run effects due to wage and pricestickiness.
Stop and Think Box
In the early 1980s, U.S. President Ronald Reagan and U.K. Prime Minister Margaret Thatcher an-nounced the same set of policies: tax cuts, more defense spending, and anti-inflationary mon-etary policy. In both countries, sharp recessions with high unemployment occurred, but the in-flation beast was eventually slain. Why did that particular outcome occur?
Tax cuts plus increased defense spending meant larger budget deficits, which spells EMP andEFP, that is, large rightward shifts in AD. That, of course, ran directly counter to claims aboutfighting inflation, which were not credible and hence not anticipated. But the Fed and the Bankof England did get tough by raising overnight interest rates to very high levels (about 20 per-cent!). As a result, the happy conclusions of the new classical macroeconomic model did nothold. The AS curve shifted hard left, while the AD curve did not shift as far right as expected.The result was that prices went up somewhat while output fell. Eventually market participantsfigured out what was going on and adjusted their expectations, returning Y* to Ynrl and stop-ping further big increases in P*.
CHAPTER 26 RATIONAL EXPECTATIONS REDUX: MONETARY POLICY IMPLICATIONS 283
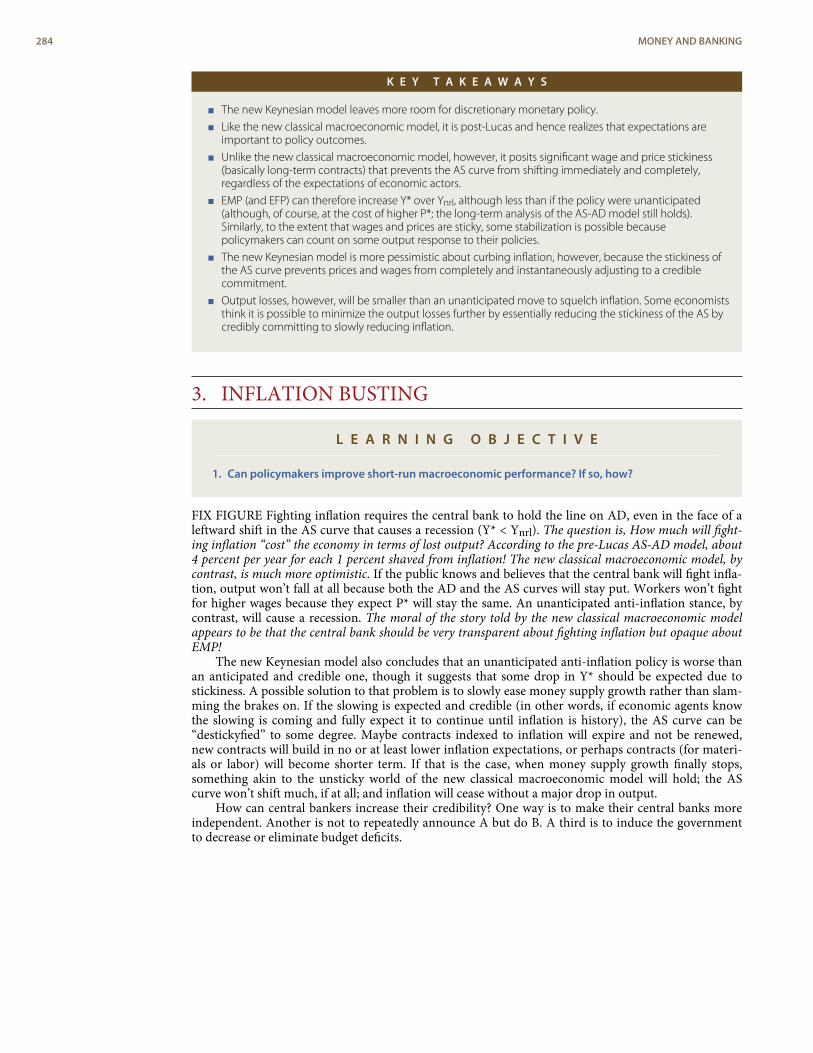
K E Y T A K E A W A Y S
< The new Keynesian model leaves more room for discretionary monetary policy.
< Like the new classical macroeconomic model, it is post-Lucas and hence realizes that expectations areimportant to policy outcomes.
< Unlike the new classical macroeconomic model, however, it posits significant wage and price stickiness(basically long-term contracts) that prevents the AS curve from shifting immediately and completely,regardless of the expectations of economic actors.
< EMP (and EFP) can therefore increase Y* over Ynrl, although less than if the policy were unanticipated(although, of course, at the cost of higher P*; the long-term analysis of the AS-AD model still holds).Similarly, to the extent that wages and prices are sticky, some stabilization is possible becausepolicymakers can count on some output response to their policies.
< The new Keynesian model is more pessimistic about curbing inflation, however, because the stickiness ofthe AS curve prevents prices and wages from completely and instantaneously adjusting to a crediblecommitment.
< Output losses, however, will be smaller than an unanticipated move to squelch inflation. Some economiststhink it is possible to minimize the output losses further by essentially reducing the stickiness of the AS bycredibly committing to slowly reducing inflation.
3. INFLATION BUSTING
L E A R N I N G O B J E C T I V E
1. Can policymakers improve short-run macroeconomic performance? If so, how?
FIX FIGURE Fighting inflation requires the central bank to hold the line on AD, even in the face of aleftward shift in the AS curve that causes a recession (Y* < Ynrl). The question is, How much will fight-ing inflation “cost” the economy in terms of lost output? According to the pre-Lucas AS-AD model, about4 percent per year for each 1 percent shaved from inflation! The new classical macroeconomic model, bycontrast, is much more optimistic. If the public knows and believes that the central bank will fight infla-tion, output won’t fall at all because both the AD and the AS curves will stay put. Workers won’t fightfor higher wages because they expect P* will stay the same. An unanticipated anti-inflation stance, bycontrast, will cause a recession. The moral of the story told by the new classical macroeconomic modelappears to be that the central bank should be very transparent about fighting inflation but opaque aboutEMP!
The new Keynesian model also concludes that an unanticipated anti-inflation policy is worse thanan anticipated and credible one, though it suggests that some drop in Y* should be expected due tostickiness. A possible solution to that problem is to slowly ease money supply growth rather than slam-ming the brakes on. If the slowing is expected and credible (in other words, if economic agents knowthe slowing is coming and fully expect it to continue until inflation is history), the AS curve can be“destickyfied” to some degree. Maybe contracts indexed to inflation will expire and not be renewed,new contracts will build in no or at least lower inflation expectations, or perhaps contracts (for materi-als or labor) will become shorter term. If that is the case, when money supply growth finally stops,something akin to the unsticky world of the new classical macroeconomic model will hold; the AScurve won’t shift much, if at all; and inflation will cease without a major drop in output.
How can central bankers increase their credibility? One way is to make their central banks moreindependent. Another is not to repeatedly announce A but do B. A third is to induce the governmentto decrease or eliminate budget deficits.
284 MONEY AND BANKING
FIGURE 26.3 The three major macro models compared
Figure 26.3 summarizes the differences between the pre-Lucas AS-AD model, the new classical mac-roeconomic model, and the New Keynesian model.
Stop and Think Box
In Bolivia in the first half of 1985, prices rose by 20,000 percent. Within one month, inflation was almost elimin-ated at the loss of only 5 percent of gross domestic product (GDP). How did the Bolivians manage that? Whichtheory does the Bolivian case support?
A new Bolivian government came in and announced that it would end inflation. It made the announcementcredible by reducing the government’s deficit, the main driver of money expansion, in a very credible way, bybalancing its budget every single day! This instance, which is not atypical of countries that end hyperinflation,supports the two rational expectation-based models over the pre-Lucas AS-AD model, which predicts 4 per-cent losses in GDP for every 1 percent decrease in the inflation rate. The fact that output did decline some-what may mean that the policy was not credible at first or it may mean that the new Keynesian model has itright and the AS curve was a little bit sticky.
K E Y T A K E A W A Y S
< Whether policymakers can improve short-term macroeconomic performance depends on the degree ofwage and price stickiness, that is, how much more realistic the new Keynesian model is than the newclassical macroeconomic model.
< If the latter is correct, any attempts at EMP and EFP that are anticipated by economic actors will fail to raiseY* and, in fact, can reduce Y* if the stimulus is less than the public expected. The only hope is toimplement unanticipated policies, but that is difficult to do because central bankers can never beabsolutely sure what expectations are at the time of policy implementation.
< On the other hand, inflation can be squelched relatively easily by simply announcing the policy and takingsteps to ensure its credibility.
< If the new Keynesian model is correct, Y* can be increased over Ynrl (in the short term only, of course)because, regardless of expectations, wages and prices cannot rise due to multiyear contractualcommitments like labor union contracts and other sources of stickiness.
< Inflation can also be successfully fought by announcing a credible policy, but due to wage and pricestickiness, it will take a little time to take hold and output will dip below Ynrl, though by much less than thepre-Lucas AS-AD model predicts.
4. SUGGESTED READING
CHAPTER 26 RATIONAL EXPECTATIONS REDUX: MONETARY POLICY IMPLICATIONS 285

Gali, Jordi. Monetary Policy, Inflation, and the Business Cycle: An Introduction to the New Keyne-sian Framework. Princeton, NJ: Princeton University Press, 2008.
Lucas, Robert, and Thomas Sargent. Rational Expectations and Econometric Practice. Minneapolis:University of Minnesota Press, 1981.
Scheffrin, Steven. Rational Expectations. New York: Cambridge University Press, 1996.
286 MONEY AND BANKING

1.
2.3.4.5.
ENDNOTES
http://www.virginia.edu/economics/mirman.htm
http://home.uchicago.edu/~sogrodow/
http://homepages.nyu.edu/~ts43/
http://public.tepper.cmu.edu/facultydirectory/FacultyDirectoryProfile.aspx?ID=96
http://www.minneapolisfed.org/research/prescott/
CHAPTER 26 RATIONAL EXPECTATIONS REDUX: MONETARY POLICY IMPLICATIONS 287
Index+NPV
241-244, 254
acquisition
30
adverse selection
14, 93-95, 100, 108, 142, 261
asset bubble
85, 134-136, 145-148, 194
asset management
109
assets
6, 15-20, 31-34, 54, 69-70, 76-77, 81, 91, 97, 101-116,120-128, 135-142, 148-154, 167-172, 188-189, 204, 213,
221-224, 234, 249, 261
autonomy
162
bailout
139, 151-154, 262
balance sheet
101-110, 116, 136-137, 141, 167-168, 261
base money
159
behavioral finance
86
Bretton Woods System (BWS)
217
burst
134, 148-149, 154, 163
call
15-16, 25, 46, 52, 66-70, 77, 86, 96, 108-111, 131-134, 148,188, 193-196, 207, 211, 250
capital
15-20, 31, 54, 78, 99-101, 105-116, 127-128, 135-141, 145,154, 165, 211-213, 217-224, 237, 255
central bank
6, 150, 157-173, 182-198, 219-226, 230-233, 262-263, 277,281
ceteris paribus
35, 56, 63
checkable deposits
169-176, 180
collateral
15, 21, 94-97, 112, 148, 188-190, 248
collateralize
54, 153
commodity money
25, 29-33, 63
compounding
36
compounding period
38
Consol
45, 49
consumer surplus
25
consumption function
238
coupon
35, 40-49, 54, 76
coupon bond
40-46, 76
credit crunch
145
credit risk
32, 111
current yield
44, 49-51, 70
de-leveraging
148
dealers
16, 94, 132, 188-189, 194
debt instrument
40
default
28, 43-45, 54-55, 67-69, 109-112, 124, 141, 154, 248, 261
default risk
54, 68-69, 124
democracy
132
deposit insurance
21, 135, 139
deregulation
17, 129
derivatives
7, 15, 21, 105, 115-116, 121, 224
direct placement
16
discount bond
40, 44, 76
disintermediation
22, 121
district bank
159
dividends
43, 78-80, 141
economic fundamentals
75
economic funk
57
economic growth
58, 163-164, 195, 223, 253, 257
ex ante
47, 54
ex post
48
exchange rate
7, 158-159, 166, 200-213, 217-226, 250-253, 261
external finance
89-92, 98
facilitators
91-95, 105, 129
Federal Reserve notes
27, 159, 167
financial crisis
3, 11, 16, 22, 42, 54, 91, 126, 140, 145-155, 188-191, 200,222, 226, 263
financial panic
148-150, 250
financial system
1-23, 89, 112, 119-120, 129, 134, 140, 145, 150, 159, 189,218, 259
fixed-payment loan
40
foreign exchange
7, 15, 21, 81, 115, 160, 200-217, 221-223, 261
free-rider problem
92-95, 99
future value (FV)
35-40, 51
GDP
154, 276, 285
gold
16, 29-34, 42, 63, 76, 158-160, 168, 187, 217-226, 230, 238,250
gold standard (GS)
217, 221, 250
Great Depression
133-136, 158, 268
Great Inflation
1, 22, 119-123, 136-138, 194, 278
hedge fund
82, 90, 263
Herfindahl index
126
independence
157-158, 162-164, 194-198, 277
independent central bank
163, 277
This book is fully searchable online at www.flatworldknowledge.com
inflation
1, 6, 22, 26-27, 36, 46-48, 55-67, 72, 95, 113, 119-123,136-138, 153, 157, 162-164, 193-201, 207-210, 214,
218-219, 223-225, 229-232, 255-258, 271
initial public offering (IPO)
98
inside information
86
interest
1-7, 15-16, 21-22, 27, 32-83, 91-116, 121-125, 131-137,146-167, 182-203, 209-225, 229-235, 241-254, 260-271,
277, 282
interest rate
6-7, 15, 21-22, 36-73, 91-96, 101, 107-116, 121-125,134-137, 146-150, 154, 158, 163, 182-196, 200, 209-214,
222-223, 230-235, 241-253, 260-262, 268-271, 282
interest rate risk
46, 113-116, 121
intermediaries
11-13, 17-22, 89-97, 101-105, 110-116, 120, 129, 136,145-148, 259
internal finance
13
investors
13-22, 52-58, 67-71, 75-77, 81-85, 89-90, 95-100, 106, 115,120, 124-125, 132, 143, 147-154, 206-207, 259
lag (n)
274
lender of last resort
22, 150-153, 157-159, 195, 248
liabilities
17-20, 31-34, 101-108, 113-115, 120, 125-127, 137,167-170, 187, 221-224, 261
life insurance
1, 17-18, 89-90, 104, 111, 120-121, 129, 152
liquidity
14-21, 52-63, 67-71, 80, 85, 90-91, 104-111, 122, 141, 150,159, 168, 187-189, 224, 229-237, 247, 262
liquidity management
108, 187
liquidity preference
58-61, 229
M1
33, 134-136, 171, 175-184, 196-198, 234, 274
M2
33, 134, 175, 179
make a market
188
markets
1, 11-22, 28, 41, 58, 67-68, 75-76, 80-96, 101, 107,120-122, 128-132, 145, 150, 154-156, 166, 188, 197,
205-207, 211-213, 217, 221-224, 237, 241-242, 251, 282
merger
16, 98, 126-129, 160
minimum efficient scale
13, 90-92, 123
model
54, 58-61, 76-80, 85, 95, 131-133, 171-173, 187, 230,237-242, 247-253, 257-260, 267-268, 273-276, 281
monetary base (MB)
158, 167-170, 175-179, 183-185, 194, 222, 277
money market mutual fund (MMMF)
182
moral hazard
13-14, 95-99, 111-112, 137, 195, 224, 261
mortgage-backed securities (MBSs)
153
negative amortization mortgage
6
negative bubble
151
negative equity
151
nominal interest rates
46, 66, 113, 121, 194, 210-211, 232, 271
nonnegotiable
17
nonsystemic crisis
145, 152
open market operations (OMO)
167-173, 185-190, 195
permissive regulatory system
122
positive net present value project
241
premium
17, 69-71, 91-94, 112, 139
present value (PV)
12, 35-43, 51, 78-79, 230, 241
private interest model
131
public choice model
131
public interest model
131
rate of return
35, 45-46, 78-81, 147
rational expectations
75-76, 281
real interest rate
47, 55, 210, 268
redeemable
17
representative money
25, 29
required rate of return (or k)
78
required reserves
176, 180-182, 186
reserves
15, 33, 103-111, 122, 136, 141, 167-190, 196, 220
restrictive covenants
111
return
21, 34-36, 45-47, 54, 59, 77-82, 95-98, 107-111, 126,147-149, 163, 187-190, 229-235, 257-259, 274
risk
17, 21, 32, 44-47, 54, 58, 65-71, 78-85, 94, 107-116,121-129, 135, 141, 147, 265
rule
6, 92, 125, 136-138, 162, 193, 197
scarcity
95, 149, 218
secondary reserves
103-104, 108
shocks
1, 160, 232, 249, 253-265, 273-274, 279
short selling
86
simple loan
40
specie standard
71, 219
stock options
92, 132, 261
stockholders (or shareholders)
17, 78, 92, 105, 141, 158
subprime mortgages
153
sweep account
122-124, 182, 187
systemic crisis
145, 152
time inconsistency problem
198
trade credit
90
tranches
153
transmission mechanisms
267
transparency
22, 86, 96, 135
yield to maturity (YTM)
35, 43
This book is fully searchable online at www.flatworldknowledge.com

zero
21, 40-46, 61, 76-77, 85, 147-149, 231-235, 271-274, 282
zero coupon bond
43
This book is fully searchable online at www.flatworldknowledge.com