Embed Size (px)
Citation preview
74 BIS Papers No 31
Monetary policy approaches in India
Kaushik Bhattacharya1
1. Introduction
Among country-specific studies on monetary policy frameworks, a study on India would be important. This is not only because of the large size of its population or economy, but because a few specific features make India a unique case study among countries. Although India consistently maintained a democratic form of governance, prior to the 1990s its economic framework was largely similar to that of a command and control economy. During the past 20 years or so, the Indian economy has oriented itself towards market forces, with a healthy rate of GDP growth and a modest rate of inflation. This change had been gradual and except for the balance of payments crisis during 1990-91, has come with minor hiccups. Given that this period is characterised by frequent financial crises in large parts of the world, the Indian experience and the role played by the monetary framework in it can be a valuable lesson in preventing financial crises, and also in pacing and sequencing economic reforms.
The story of economic reforms in India has been discussed in detail by several researchers from different perspectives (Joshi and Little (1996); Ahluwalia (2002); Pangariya (2004); Rodrik and Subramanian (2004)). Specific aspects like reforms in monetary and financial sectors in India and the role played by the Reserve Bank of India (RBI) in this endeavour have also been reviewed in some of these studies. Some reviews, like Reddy (1999), were specifically devoted to the financial sector reforms and listed the changes in detail. A few studies have also documented the evolution of monetary policy frameworks and taken a view on the applicability of specific frameworks in the Indian context (Mohanty and Mitra (1999); Kannan (1999); McKibbin and Singh (2000); Jadhav (2003)). Of late, some studies - mostly by current and ex central bankers - have begun to take a futuristic look, critically assessing the changes and raising issues of concern (Rangarajan (2001); Mohan (2005a,c)). Aspects of the past and future of monetary policy in India and the framework under which it operates can also be gleaned from the speeches of the RBI management, sometimes on a general note (Reddy (2001a, 2005)) and sometimes on more specialised areas like central bank independence (Reddy (2001b)) or communication strategies (Mohan (2005b)). Reports of different advisory groups appointed by the RBI also summarise the changes in specialised areas like transparency in monetary and financial policies (RBI (2000a)), or data dissemination (RBI (2001a)). These reports often review country experiences and are valuable sources to analyse India’s relative strengths and weaknesses among countries.
With such a plethora of information, the purpose of this paper is neither to repeat the story of Indian financial sector reforms, nor to tell the story of the evolution of its monetary policy framework. Although aspects of these will inevitably crop up in what follows, they are discussed from the perspective of identifying new lessons on the grey areas of economic theory.
1 An earlier draft of the paper was prepared when the author was a post-doctoral fellow at the University of
Bonn, Germany. Detailed comments and suggestions by Hans Genberg, Eli Remolona, Dominique Dwor-Frécaut, R B Barman and Dipankor Coondoo substantially improved the exposition. The author is also grateful to conference participants in Hong Kong for raising a few relevant issues not discussed in sufficient detail in an earlier draft. Views expressed in this paper are strictly personal and may not be those of the institution to which the author belongs.

BIS Papers No 31 75
The paper argues that the Indian experience could be of help in expanding our knowledge on two problems. The first relates to the choice of monetary policy strategy by a central bank. In the theoretical literature, the choice of monetary policy strategy is often seen as part of an optimal control problem (Poole (1970)). The optimal strategy in this problem depends on issues like the stability of demand for money and the relative variances of shocks to the real and the financial sector. Empirical observations, however, do not match this theory. Central banks that swear to different monetary policy strategies have been found to use similar instruments and to react to shocks in a similar manner. The puzzle could be resolved either by admitting the possibility that central banks do not practice what they preach, or by incorporating “closed-loop” strategies in place of “open-loop” ones.2 These explanations, however, do not provide the answer to the question why central banks do make efforts to identify their monetary policy strategy in the first place. Citing the example of Germany, Hagen (1999) suggested the possibility that monetary strategies are helpful in solving internal and external coordination problems for the central bank. A major purpose of this paper is to examine whether the Indian experience is consistent with this theory.
What makes India an especially attractive case to examine the generality of the theory is the fact that the monetary policy framework in India has changed twice since the 1980s. The paper attempts to show that, from both a theoretical and a cross-country perspective, the changes occurred at interesting points. In both cases, the change in monetary policy framework in India took place without substantial changes in the RBI Act, so that apparently the stated objectives of monetary policy in India remained the same. However, the operating environments at those two points in time were sharply different. The first change occurred during the heyday of command and control era, while the second took place when the so-called first-generation reform in India was near completion. Interestingly, in each case, the change occurred at points where it is possible to argue that there was no immediate urgency to act. The RBI’s motivation for the change in both cases, therefore, could throw up some interesting insights on the central bank’s strategic preferences in diverse conditions.
The second grey area in literature where the Indian experience could be of additional help is in understanding to what extent the monetary policy framework helps in improving economic performance. Both country-specific and cross-country experiences do not provide clear answers to this problem (Mishkin 1999)). Country-specific studies indicate that switching to inflation targeting (IT) has sometimes been followed by a dramatic reduction in inflation. However, due to post hoc fallacy, to what extent the change in monetary framework is responsible for this reduction is not easy to answer.3 The general conclusion appears to be that both transparency and accountability are crucial to constraining discretionary monetary policy so that it produces the desired long-run outcome (Mishkin (1999)). As the details of transparency and accountability are difficult to quantify, this is a serious impediment in obtaining definitive results.
The Indian experience might throw up some interesting insights on the role of the monetary framework because rather than a dramatic cutoff, the fall in inflation in India had been gradual. Among emerging market countries, its performance in containing inflation - especially after the adoption of MIA (the multiple indicator approach, see below for details),
2 An open-loop monetary policy strategy is one that fixes an intermediate target during a given period with no
regard to incoming information during that period. A closed-loop strategy, in contrast, continuously revises the intermediate target (which may be explicit or implicit) based on incoming information to achieve better control over the ultimate targets of monetary policy. Admitting closed-loop strategies implies that central bank behaviour is similar under different strategies and that the performance of monetary strategies in terms of the target variables of monetary policy becomes very similar, provided the ultimate goals of monetary policy are the same.
3 For example, in the case of New Zealand, there is evidence that inflation was already falling sharply before the final change to IT occurred (Brash 1999)).

76 BIS Papers No 31
appears to be good. As India is not a formally declared inflation targeting economy, this observation assumes additional importance. A juxtaposition of the Indian versions of transparency and accountability to other economies with diverse monetary policy frameworks may perhaps extract what aspects of them are essential for better economic performance.
The paper is organised as follows: Section 2 provides a brief review of the evolution of the monetary policy framework in India. Our special emphasis in this review is on the possible motivations that have led Indian policymakers to change the framework twice since the 1980s, culminating in the MIA. Section 3 examines to what extent the Indian experience can extend our knowledge about the role of the monetary policy framework in economic performance. Finally, Section 4 concludes the paper.
2. Evolution of the monetary policy framework in India
The first and most important part of the monetary policy framework in a country is the task mandated to the monetary authorities. In a democracy, this task is typically specified in the central bank act. It is interesting to note that despite overwhelming changes in the financial sector in India, the mandate to the monetary authorities in India mentioned in the Reserve Bank of India Act 1934 has remained unchanged.
Subsection 2.1 discusses specific aspects of this act. In particular, it examines the different interpretations of the mandated tasks and their implications for central bank independence and transparency of monetary policy in India. Subsection 2.2 briefly reviews the evolution of the framework around this act. Subsection 2.3 then compares different aspects of the current framework to those of a few benchmark central banks like the Federal Reserve (Fed) or the European Central Bank (ECB).
2.1. The RBI Act 1934: different interpretations and implications for central bank independence and transparency
The preliminaries of the Reserve Bank of India Act 1934 set the mandated tasks as
“...to regulate the issue of Bank Notes and keeping of reserves with a view to securing monetary stability in India and generally to operate the currency and credit system of the country to its advantage.”
The tasks mandated to the RBI can, however, be interpreted in several ways. In particular, the words “monetary stability” may mean both internal and external stability. If it is interpreted in the narrow sense of internal stability, then price stability becomes a major objective. If, in contrast, the interpretation also includes external stability, financial stability as a whole (including price stability) becomes the mandated task. The RBI website interprets the objective of the RBI as monetary authority as: “maintaining price stability and ensuring adequate flow of credit to productive sectors” (http://www.rbi.org.in/scripts/ AboutusDisplay.aspx#EP1) Alternatively, Rangarajan, one of the main architects of economic reforms in India, interprets the objectives as:
“(1) to maintain a reasonable degree of price stability and (2) to help accelerate the rate of economic growth.” (Rangarajan (2001))
It may be noted that though the interpretations of the RBI and Rangarajan (2001) are largely similar, they are not same. Credit growth in an economy is likely to be positively associated with GDP growth, but the strength of association between them may vary over time. In Section 3, this aspect will be discussed further.
BIS Papers No 31 77
The additional emphasis on credit growth by the RBI gives Indian monetary policy objectives a distinct feature that is not typically discussed in standard textbooks.4 In most cases, however, the objective is stated with an additional “for sustaining overall economic growth” (Reddy 2005)) or simply “to support growth” (Mohan (2005a), p 1119) in the end. Therefore, in a broad sense, the additional monetary policy objective (besides price stability) in India is to support or to facilitate GDP growth.
The relative emphasis on price stability versus growth is, once again, subject to interpretation. It is interpreted that the objective would depend on underlying macroeconomic conditions. Monetary policy in India, therefore, strives for a “judicious balance between price stability and growth” (Reddy 2005)). Reddy (2005), however, observes that due to the democratic process of governance in India, the “judicious balance” is heavily tilted towards price stability, which, in some ways, amounts to an “informal mandate” to the central bank for maintaining an “acceptable” level of inflation.
An interesting question here is: who sets these objectives? In a democratic framework, the power to set the target typically rests with the elected representatives. In monetary policy frameworks like IT, this target is revealed to the public in the form of a transparent contract between the government and the central bank. In the Indian case, there is no such explicit contract. Rather, Section 7 of the RBI Act 1934 stipulates that the central government may from time to time give such directions to the Bank as it may, after consultation with the governor of the Bank, consider necessary in the public interest. The RBI Act does not stipulate that such directions should be in the public domain or should need the approval of Parliament (or at least, be put before Parliament).
Subject to any such directions, clause (2) of Section 7 of the same Act stipulates that all other powers on the general superintendence and direction of the affairs and business of the Bank shall be entrusted to a central board of directors. The central government, however, enjoys wide power to nominate these directors. Further, the duration of office of governors and deputy governors is for such terms not exceeding five years as the central government may fix while appointing them.5 They are, however, eligible for reappointment. Further, Section 30 of the RBI Act stipulates that if the Bank fails to carry out any of the obligations imposed on it or under the RBI Act, the central government may, by notification in the Gazette of India, declare the central board to be superseded and may entrust the general superintendence and direction of affairs at the Bank to any agency of its choice. When action is taken under this section of the act, the central government must, however, submit a full report to Parliament within three months from the issue of the notification.
So far as the autonomy of the central bank is concerned, the RBI had been ranked marginally below the median level among a list of 70 countries (Cukierman (1992)). It may be noted that this performance was based on the policy framework during the 1980s and Cukierman’s list included 21 industrial countries as well. The institutional arrangement, therefore, represented a reasonable degree of statutory autonomy in the case of India - at least within the group of developing countries whose overall policy framework yielded little operational independence to their respective central banks at that time.
Interestingly, the Advisory Group on Transparency in Monetary and Financial Policies (2000) appointed by the RBI sharply criticised the institutional arrangements on the process of monetary policy formulation in the RBI Act. It went so far as to term the act “anachronistic” (Para 3.7) and urged the government to make an early move to amend the necessary
4 For example, Mishkin (2001, Sixth Edition, pp 454-57) lists six goals of monetary policy (eg high employment,
economic growth, price stability, interest rate stability, stability of financial markets and stability in foreign exchange markets), among which “provision of adequate credit” is conspicuous by its absence.
5 It may be noted that the parliamentary elections in India are held every five years.

78 BIS Papers No 31
sections that do not provide for a systematic and transparent setting of the objectives of monetary policy. The Group, however, observed that the act provided adequate powers to the RBI to use various instruments of monetary policy.
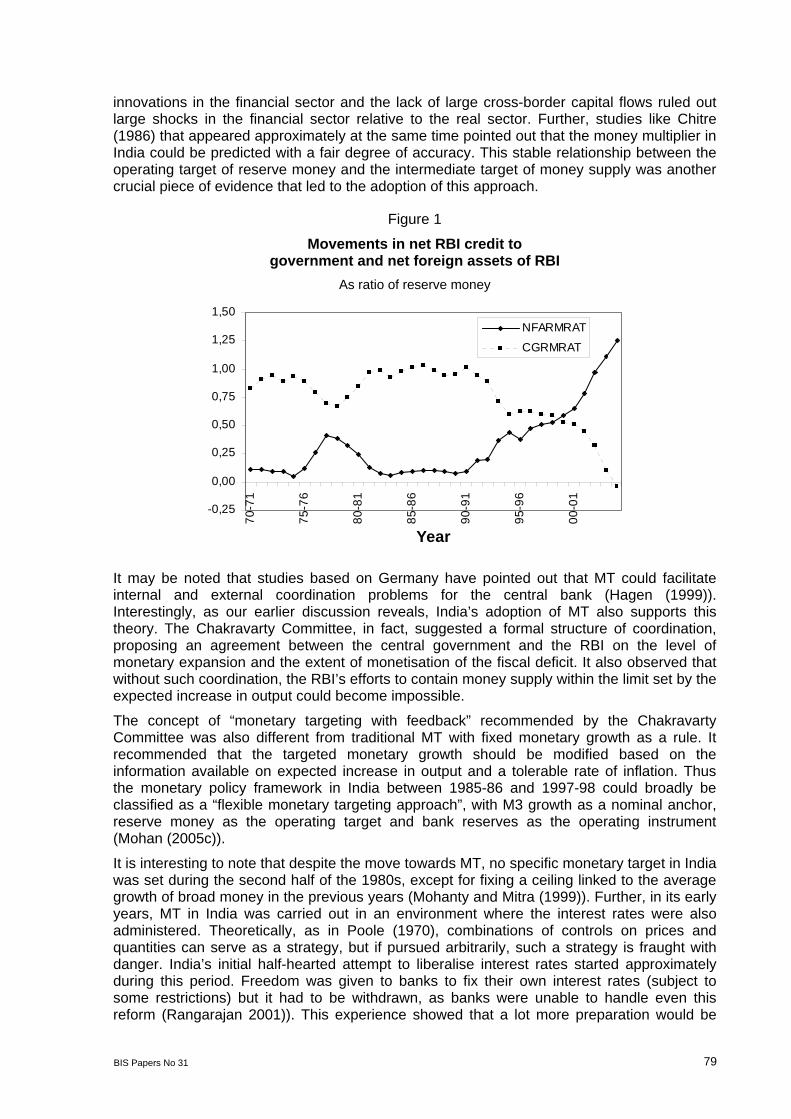
2.2. Evolution of the framework Until the early 1980s, the Indian economy was virtually a closed one. Prices of a significant number of commodities were administered in India at that time. To sustain these prices at a steady level, government subsidies were often necessary and this was one of the factors that led to a chronic budget deficit. These deficits were either financed through ad hoc treasury bills6 or through indirect borrowings, mostly from nationalised banks. The first led to more or less automatic monetisation. Net RBI credit to the government was the dominant factor behind reserve money expansion and the consequent expansion in money supply. To control the money supply, the RBI had to increase the cash reserve ratio (CRR) from time to time. So far as the market borrowing is concerned, to facilitate the process, interest rates were administered and were kept at an artifically low level. The entire structure of interest rates was complicated and had multiple layers. Thus, the financial markets were highly segmented and lacked depth. The administered interest rate regime was an impediment to the use of indirect tools like open market operations (OMO). The only way to finance the borrowing programme of the government was to increase the statutory liquidity ratio (SLR) from time to time. The exchange rate was not market-determined and movements of foreign exchange in and out of India were tightly regulated. In short, monetary policy in India during this period was completely subservient to the fiscal stance of the central government. Figure 1 illustrates this point. In Figure 1, the variable CGRMRAT reflects the ratio of net RBI credit to government and reserve money, and NFARMRAT reflects that of net foreign assets of RBI and reserve money.7 In Figure 1, the variable CGRMRAT displays an increasing trend between the years 1978-79 and 1982-83. In 1984-85, CGRMRAT was nearly unity, at 0.98.
India’s formal change to “monetary targeting with feedback” in 1985 should be understood against this background. The recommendation for the change was made in the Report of the Committee to Review the Working of the Monetary System (RBI (1985), popularly known as the Chakravarty Committee Report) in 1985. The economic performance of India immediately preceding the report is interesting. After the second oil shock in 1979-80, the economy was on the path of recovery. In fact, between 1980-81 and 1984-85, the average annual GDP growth rate and the rate of inflation in India were 5.6% and 9.2% respectively.8 It may be noted that given India’s earlier achievements (especially with respect to its low GDP growth rate, often castigated as “the Hindu growth rate”), these figures should be considered as good. A crucial question then remains: why was it necessary to change the policy stance to monetary targeting (MT) at that point, when evidence of its failure in the industrial economies was already known?
The traditional way of examination as in Poole (1970) would be to look at the stability of demand for money and also the relative magnitudes of shocks to the financial and the real sector in a country. India’s shift to MT appears to be consistent with this theory. The early literature on demand for money in India generally indicated its stability (Vasudevan (1977)). At the same time, the administered interest rate structure, the absence of significant
6 Rangarajan (2001) snidely observed that “Those bills were ‘ad hoc’ only in name. These treasury bills had to
be rolled over indefinitely”. 7 Both CGRMRAT and NFARMRAT are ratios of levels of the respective variables. 8 These figures quoted are not “real-time” figures, but are based on final data prepared later. In the reported
figures, for GDP, the base year is 1993-94. For inflation rates, the figures up to 1981-82 are with respect to 1970-71 as base and the same from 1982-83 onwards are with respect to the year 1981-82 as base.
BIS Papers No 31 79
innovations in the financial sector and the lack of large cross-border capital flows ruled out large shocks in the financial sector relative to the real sector. Further, studies like Chitre (1986) that appeared approximately at the same time pointed out that the money multiplier in India could be predicted with a fair degree of accuracy. This stable relationship between the operating target of reserve money and the intermediate target of money supply was another crucial piece of evidence that led to the adoption of this approach.
Figure 1
Movements in net RBI credit to government and net foreign assets of RBI
As ratio of reserve money
-0,25
0,00
0,25
0,50
0,75
1,00
1,25
1,50
70-7
1
75-7
6
80-8
1
85-8
6
90-9
1
95-9
6
00-0
1
Year
NFARMRAT
CGRMRAT
It may be noted that studies based on Germany have pointed out that MT could facilitate internal and external coordination problems for the central bank (Hagen (1999)). Interestingly, as our earlier discussion reveals, India’s adoption of MT also supports this theory. The Chakravarty Committee, in fact, suggested a formal structure of coordination, proposing an agreement between the central government and the RBI on the level of monetary expansion and the extent of monetisation of the fiscal deficit. It also observed that without such coordination, the RBI’s efforts to contain money supply within the limit set by the expected increase in output could become impossible.
The concept of “monetary targeting with feedback” recommended by the Chakravarty Committee was also different from traditional MT with fixed monetary growth as a rule. It recommended that the targeted monetary growth should be modified based on the information available on expected increase in output and a tolerable rate of inflation. Thus the monetary policy framework in India between 1985-86 and 1997-98 could broadly be classified as a “flexible monetary targeting approach”, with M3 growth as a nominal anchor, reserve money as the operating target and bank reserves as the operating instrument (Mohan (2005c)).
It is interesting to note that despite the move towards MT, no specific monetary target in India was set during the second half of the 1980s, except for fixing a ceiling linked to the average growth of broad money in the previous years (Mohanty and Mitra (1999)). Further, in its early years, MT in India was carried out in an environment where the interest rates were also administered. Theoretically, as in Poole (1970), combinations of controls on prices and quantities can serve as a strategy, but if pursued arbitrarily, such a strategy is fraught with danger. India’s initial half-hearted attempt to liberalise interest rates started approximately during this period. Freedom was given to banks to fix their own interest rates (subject to some restrictions) but it had to be withdrawn, as banks were unable to handle even this reform (Rangarajan 2001)). This experience showed that a lot more preparation would be

80 BIS Papers No 31
needed for gradual deregulation of interest rates. The early attempts at reforms in this area failed because necessary reforms in other sectors were not carried out simultaneously (Malhotra (1997)).
Following this, reforms during the late 1980s were devoted to creating an active money market. To activate the shorter end of the money market, treasury bills of 182 days’ duration were introduced. This period also saw the introduction of financial instruments such as certificates of deposit and commercial paper. In addition, the Discount and Finance House of India (DFHI) was set up to provide liquidity to these instruments by creating a secondary market.
While these structural changes were going on, the deficit situation in India did not improve. In Figure 2, GFD_CEN presents the gross fiscal deficit of the central government, while GFD_COM presents the combined figure for the central and the state governments. The broken vertical lines indicate the time points of parliamentary elections in India. The chronically high fiscal deficit was one of the major causes that led to the balance of payments crisis of the Indian economy in 1990-91. To help the government’s borrowing programme, the RBI had to increase SLR while to mitigate the deleterious effect on prices, the only effective tool it had in its possession was CRR. By the end of the year 1990-91, the CRR and the SLR were 15.0% respectively.9
Figure 2
Movements in gross fiscal deficit as a percentage of GDP
The balance of payments crisis in 1990-91 shook the Indian economy. Besides the mandated objectives, the major challenges were to restore stability as quickly as possible and, once that was achieved, to develop and integrate different financial markets and increase the competitiveness and efficiency of the financial system. For stabilisation, coordination of monetary and fiscal policy was absolutely necessary. Figure 2 reveals a sharp fall in gross fiscal deficit (as a percentage of GDP) immediately after the crisis.
One of the first important financial reforms that India introduced after the balance of payments crisis in 1990-91 was to change to a market-determined exchange rate system and to introduce current account convertibility in a phased manner. This change was one of the striking successes of the early years of economic reforms. The balance of payments
9 The figure corresponding to CRR excludes additional reserve requirements or release/exemption on
incremental net demand and time liabilities (NDTL).
0
4
8
12
70-7
1
75-7
6
80-8
1
85-8
6
90-9
1
95-9
6
00-0
1
Financial year
Valu
e
GFD_CEN GFD_COM

BIS Papers No 31 81
crisis was also largely mitigated by the end of 1992-93. The phase from 1993-94 to 1997-98 (Phase 2), therefore, is the phase where MT was attempted in a comparatively stable environment.
After stabilisation of the balance of payments crisis, the liberalisation of interest rates in India gathered momentum. Drawing lessons from the previous experience, the liberalisation measures were adopted slowly but steadily, with the idea that the changes in the short-term official interest rates would translate towards the longer end through the yield curve, facilitating their emergence as effective policy instruments. A significant development in this area with far-reaching implications was the reactivation of the Bank Rate, which was linked to all other interest rates, including the Reserve Bank’s refinance rate.
Three other related changes should also be highlighted in this context. First, significant changes took place in the Indian capital market during this period, leading to a substantial improvement in market capitalisation, liquidity and efficiency of the Indian capital market (Misra (1997), Endo (1998)). Second, the agreement between the RBI and the government of India to curb monetisation was signed during this period. It was decided to implement the agreement in a phased manner over a period of three years. Third, policies began to be more and more closed-loop in nature. This was imperative because of the flexible exchange rate regime, which required continuous monitoring. A major consequence of this change was in transparency and communication strategy, and also in data dissemination. The market-determined system required transparency and clarity of policy objectives. The RBI’s published reports began to change qualitatively around this period, often focusing more on cross-country experiences on specific aspects.
MT was actively and vigorously pursued during this period. MT, even in this period, was, however, constrained by the fiscal stance of the government. Further, with the opening-up of the economy, increasing capital flows compounded the constraints. The successful stabilisation policy and gradual opening-up of the economy with a market-determined exchange rate led to huge capital flows. To maintain the monetary target, it was necessary to sterilise these flows. This led to changes in the structure of the RBI balance sheet. Figure 1 depicts these changes. It reveals that from 1990-91, NFARMRAT - except during the year 1995-96 - increased continuously. Concurrently, with the changes in the administered interest rate regime and other consequent financial innovations, the stability of money demand in India became a matter of concern. Some of the studies that attempted to examine this aspect during the 1990s were Nag and Upadhyay (1993), Jadhav (1994), Arif (1996) and Mohanty and Mitra (1999). The Report of the Working Group on Money Supply: Analytics and Methodology of Compilation (RBI (1998), popularly known as the Reddy Committee Report) in June 1998 also examined this aspect. The evidence from these studies was, at best, mixed.
India’s second change of monetary policy framework to MIA should be understood with this background. Once again, the economic performance immediately preceding the change to MIA was not bad. After the effective handling of the balance of payments crisis, the economy was recovering. During Phase 2 of MT, the average annual rate of inflation and GDP growth were 7.6% and 6.6% respectively. Given that the rate of inflation was moderate, the central bank’s credibility in maintaining the monetary target was, arguably, not a serious issue. Once again, an interesting question is: why did India change its monetary policy framework in 1998-99?
As in the earlier case, stability of demand for money (or lack of it) was once again an issue. So far as relative sizes of shocks were concerned, in contrast to the early 1980s, market-friendly policies during the 1990s warranted that, compared to the earlier periods, the sizes and frequencies of shocks to the financial system would increase compared to the shocks in the real sector. However, a debate on the relative sizes of financial and real sector shocks was largely absent during this period. The traditional theory of Poole (1970) could, therefore, offer a partial answer to this question.
82 BIS Papers No 31
So far as the coordination aspect of MT is concerned, it is interesting to note that India’s tryst with MT ended almost immediately after the agreement between the government and the RBI (to check automatic monetisation within a defined limit) was operationalised. It could be argued that the major need was not the monetary target per se, but coordination. When the required coordination was achieved, which was earlier considered a necessary precondition for MT, a change to other framework became affordable. Figure 1 reveals a clear decreasing trend in CGRMRAT approximately from this time. Thus the internal coordination theory also offers a partial answer to the change in strategy.
Rather than predictability of money growth or coordination problems, the key to understanding the change in framework perhaps lies in the signalling aspect of policy. The RBI wanted to communicate a strong signal to the market that it was changing the way it would implement monetary policy. The signal was to prepare the market for a gradual move from quantity-based signals to price-based signals. In this context, it is interesting to note that the Reddy Committee Report proposed a set of broader monetary measures that were supposed to capture the effects of new financial innovations better. However, unlike the US case, no attempt was made to shift to alternative monetary measures as targets.
The change in framework was thus an official recognition of a phase in which monetary authorities were constrained to work on both the quantities (money) and the prices (interest rates) front, despite its well known limitations. To increase the efficiency of the banking sector, further reductions in CRR were necessary. This itself was a constraint that prevented a fully fledged change to signal solely through interest rates. Yet, cross-country experiences revealed distinct advantages of interest rate signals. It may be noted that while many of the necessary reforms in the financial sector were complete or near completion at that stage, the necessary operational infrastructure (ie existence of clear corridors for short-term interest rates) to impart clear interest rate signals were not fully ready at that time. Due to short history, the precise relationships between short-term and long-term interest rates and the role of market-determined interest rates in the real sector were also far less understood. The move towards price-based signals was primarily motivated by cross-country experience and judgment.
Abandonment of the MT framework, however, required an alternative. India adopted the multiple indicator framework. The possible other candidates were exchange rate targeting, interest rate targeting and IT. In the Indian context, exchange rate targeting was not appropriate due to the relatively closed nature and large size of the economy. Similarly, stickiness in long-term rates was a major impediment to considering an interest rate targeting framework seriously. IT, in contrast, was a serious option. It is, therefore, relevant to discuss why India did not adopt IT at that time.
The success of many developed and emerging market economies under an IT framework was keenly followed in India. While appreciating many advantages of the IT framework, its critics raised three major concerns in the Indian context. First, fiscal dominance was considered a serious problem. Second, supply shocks and the role played by prices of a few crucial administered commodities in overall price formation were perceived as important. Lack of an official core inflation measure further compounded the problem. The third and final concern was that a move to IT might be too early. Most of the countries that had formally adopted IT approach had not completed a full business cycle by that time. Summarising these concerns, Kannan (1999), in one such article, suggested a “wait and watch” policy.
It may be noted that the problems identified by those arguing against the adoption of IT were not insurmountable. Fiscal dominance, for example, was also an important factor behind

BIS Papers No 31 83
failures to meet monetary targets.10 In the Indian case, the problem could have been solved by clearly mentioning in the IT contract that if the government’s budget exceeded a certain limit, then the RBI would not be held responsible if inflation overshot the target within a stated time period. Similarly, the problem of supply shocks could also have been tackled - at least initially - by adopting a broader range for the acceptable rate of inflation than that practiced by the developed countries. Interestingly, the Advisory Group on Transparency in Monetary and Financial Policy suggested formal acceptance of the IT framework approximately at the same time.
Rather than the concerns for fiscal dominance or supply shocks, India’s decision not to adopt IT during 1998-99 could perhaps be explained from the political economy angle. In many inflation targeting economies, people were fed up with a chronically and persistently high rate of inflation and this created an environment that facilitated formal acceptance of that framework, especially after its startling success in the first few economies that adopted it. In contrast, as inflation in India was moderate all along, the political desire for a major change in the framework was conspicuously absent during the late 1990s. The late 1990s was a politically volatile period in India, with successive unstable governments. As Figure 2 demonstrates, three parliamentary elections were held in qick succession during this period. To incorporate the radical changes that the IT framework demanded, a fair degree of political consensus in India was necessary.
The transition to MIA was arguably a compromise outcome of monetary policy reforms. This approach has been followed since April 1998. In this approach, besides monetary aggregates, information pertaining to a range of rates of return in different financial market segments along with the movements in currency, credit, the fiscal position, merchandise trade, capital flows, the inflation rate, the exchange rate, refinancing and transactions in foreign exchange - which are available on a high frequency basis - is juxtaposed with data on output and the real sector activity for drawing policy perspectives. In a medium- to long-term perspective, the impact of money supply on inflation, however, cannot be ignored and for the purposes of policy, the RBI still continues to announce projections of money supply compatible with the outlook on GDP growth and expected inflation. It may be noted that though India did not formally adopt an IT framework and practiced monetary policies in the subsequent period that are by and large discretionary in nature, it attempted to assimilate many of its desirable features (especially with respect to transparency) in the MIA. This aspect will be reviewed further in Subsection 2.3.
Since the adoption of the MIA, there have been four major changes. The first related to the signalling aspect of monetary policy. The RBI once again undertook the task of creating a corridor for the short-term money market rate in a phased manner, finally enabling to carry out liquidity management in India through open market operations (OMO) and reverse repo/repo operations.
The second major change was in the evolution of policy coordination, culminating in the Fiscal Responsibility and Budget Management Legislation. The objective of the legislation was to impose fiscal discipline on government spending and ensure a transparent and accountable fiscal system.
The third major change was in clearer demarcation of stabilisation policies from structural policies. Earlier, major monetary policy announcements in India used to take place twice a year. As stabilisation of financial markets often needed quick and immediate action, it was repeatedly articulated by the RBI management that necessary policies for that purpose would
10 Failure to meet the monetary target and failure to meet the inflation target would perhaps result in different
types of credibility problems. For example, internationally, the Bundesbank’s reputation was in controlling inflation and not necessarily in maintaining its monetary targets.

84 BIS Papers No 31
be taken immediately and certainly not after a long wait of six months. This, however, did not apply to policies that had long-run structural implications.
The fourth major change was the result of the changed approach regarding the second and the third. It concerned the way these long-run structural aspects were handled. Coordinated efforts were necessary to examine and implement international best practices. Along with other significant market players and other experts (especially those in the academia), both the government of India and the RBI jointly attempted to implement the International Financial Standards and Codes.
2.3. Multiple indicator approach: the current monetary policy framework Although the RBI refers to its current monetary policy framework as the MIA, internationally the more familiar term would perhaps be an implicit nominal anchor approach. Abandonment of an MT framework implied the loss of broad money (M3) as the nominal anchor. Since changing the policy framework, the RBI has not categorically mentioned its nominal anchor.
Internationally, the limitations of the implicit nominal anchor approach are well known. The two central banks that are often benchmarks for the rest of the world, the Federal Reserve (Fed) and the ECB, both seem to follow this approach. In both cases, there is overriding concern for inflation, though there appears to be no explicit public commitment in the case of the United States.11 In both the United States and the Eurpean Union, the rate of inflation thus works like an implicit, but not formally declared nominal anchor. Further, especially in case of the United States, its careful monitoring of signs of inflation and forward-looking actions under the leadership of Alan Greenspan appear to have yielded excellent results.
In his review of international experiences with different monetary policy regimes, Mishkin (1999) has observed similarity in the forward-looking strategic actions of the Fed with inflation targeting economies. Mishkin (1999), however, has severely criticised this approach for its lack of transparency, categorising it as a “just do it” approach. He further observed that the success in this approach would strongly depend on the preferences, skills and trustworthiness of the individuals in charge of the central bank.12
The current Indian monetary policy framework looks remarkably similar to the frameworks of both the Fed and the ECB in this respect. In the Indian case, though the relative emphasis between price stability and growth depends on the underlying macroeconomic conditions, the RBI management has publicly acknowledged price stability as being the overriding concern. In fact, Reddy (2005) has acknowledged price stability as a kind of “informal mandate”.
In the MIA framework, the RBI mentions its own projections with respect to the mandated tasks in any given year.13 None of these projections, including that on inflation, are worded as “targets”, although that pertaining to the rate of inflation could be thus interpreted by economic agents. Apparently, these “projections” are self-imposed and informal. However,
11 The ECB has clarified that its long-term price stability goal should be interpreted as a range for inflation of
0-2%, but is not willing to call its framework an IT framework. This approach has drawn flak from certain quarters. For example, Mishkin (2001) comments “The ECB seems to have decided to try to have its cake and eat it too by not committing too strongly to either a monetary or an inflation targeting strategy” (Box 2, p 518, Sixth Edition)
12 Mishkin (2000) wryly observes that “I think it is fair to say that right now the nominal anchor in the United States is Alan Greenspan”.
13 It may be noted that RBI projections include both GDP growth rate and growth in non-bank credit. Thus, its projections encompass the various ways the mandated task can be interpreted. It also generally declares in a routine fashion that the projected credit growth would be “adequate” for the productive sectors of the economy. Deposit growths and M3 growths are also projected.
BIS Papers No 31 85
given the power of the central government in India, it is imperative that they are set after consultations with the elected representatives.
It may be noted that this form of soft wording that makes the target implicit is not uncommon. In its gradual shift towards IT, Chile had followed this approach. Initially, inflation targets were announced and worded as official projections, rather than hard targets. However, over time as inflation fell, the procedure was changed and inflation targets came to be viewed by the central bank and the markets as hard targets. Mishkin (1999) observed a similar approach in the case of industrial countries as well. The RBI’s current approach, therefore, looks similar to a soft and flexible version of IT.
A relevant question that occurs here is: how are these projections made in India? Central bank projections, in most cases, are initially carried out by the staff members, using different statistical or econometric techniques. Results of these models are then combined with the judgments of the policymakers. It is difficult to judge from the predicted figures to what extent a particular projection has been influenced by the “superiority” of judgment, unless the models are publicly disseminated with all relevant data and other related information. In the case of India, individual reviews like Barman (2002) have summarised the forecast efforts of the RBI staff. However, there is no separate official document like “Economic Models at the Reserve Bank of India” à la Bank of England (2000). Rather, these efforts remain scattered across official documents.
The models in central banks, however, could serve an alternative purpose. These models - especially the macroeconometric ones - serve as communication channels to explain to economic agents the official views on transmission of the monetary policy. In fact, many central banks have their own official views on monetary policy transmission process and this view is articulated in a separate document, eg, Bank of England (1999). In the case of India, once again, the official view remains scattered across documents.
Among the four traditional channels of monetary policy transmission, common sense suggests that the exchange rate channel and the asset prices channel would play a limited role in India. The role of the exchange rate channel is limited because of India’s relatively closed nature. Though the degree of openness of the Indian economy has increased substantially compared to the 1980s, the large size of the domestic market compared to total exports or imports suggests that the exchange rate channel may not be an influential channel. So far as the asset price channel is concerned, compared to the developed economies, the financial system in India has a relatively low vulnerability to asset bubbles. There is limited exposure of bank lending to the sensitive sectors, including real estate. The share of housing loans in the overall loan portfolio stood at about 10% in March 2004 and net non-performing assets were 1.4% of the net outstanding loans as compared with 2.8% of the aggregate portfolio (Reddy (2005)). This suggests a limited role for the asset price channel as well.
The major uncertainty on monetary policy transmission in India is, therefore, on the relative roles of the quantum channel (especially relating to money supply or credit) and the interest rate channel. Earlier, the MT paradigm implicitly took into account the transmission mechanism through the credit channel, as implicit in the targeted monetary growth was also a credit growth target (Rangarajan (2001)).
The many macroeconometric models prepared before the adoption of the MIA in India (eg Pani (1984); Bhattacharya et al (1994); Rao and Singh (1995)) attempted to study the relationships among money, price and output with the implicit recognition of the dominance of the credit channel in India. Alternative policy simulations were also tuned to find out the optimal rate of money or credit growth in specific circumstances and to what extent the changes in CRR would lead the economy to the desired trajectory. This trend was continued
86 BIS Papers No 31
during the late 1990s (Rangarajan and Mohanty (1997); Palanivel and Klein (1999)).14 The so-called atheoretical vector autoregressive models specified during this period were also not exceptions. In the Indian context, Srimany and Samanta (1998) attempted to study the interrelationship among money, price and output by specifying a three-variable structural VAR model.
Despite serious attempts, the model-based exercises to understand the transmission mechanism were severely constrained in India by the lack of comprehensive and timely information in some areas. Conceptually, the entire process of monetary policy transmission through the interest rate channel can be divided into four phases. In the first phase, central bank policy rates affect the explicit or implicit operating target, often the overnight rate. In the next stage, the short-term rates lead to changes in the long-term rates through the yield curve. In the third stage, these long-term rates lead to changes in aggregate demand. In the fourth stage, interactions of aggregate demand and aggregate supply lead to the determination of prices and output.
In the Indian case, clear evidence is at least available for the first three phases. Successful implementation of the corridor for the overnight rates has enabled the RBI to give policy signals through official interest rates that form the bounds of the corridor (eg the repo rate). The adjustments in the short-term money market rates in response to the policy rates are quick and generally take place within a single reserve maintenance period (ie a fortnight). So far as the second phase is concerned, studies like Sastry et al (2001) have found evidence that despite the stickiness, long-term interest rates (eg lending rates) also begin to change, often after a lag of one month. The evidence on the third phase is comparatively recent. Panel studies by Prasad and Ghosh (2005a) on corporate behaviour confirm the importance of the interest rate channel in the case of India. Further, they highlight that the interest rate channel has strengthened considerably post-1998.
Despite progress in understanding, it is the fourth stage in the transmission channel that still leaves many questions unanswered and the paucity of relevant data and information is most serious in this case. For example, until the mid-1990s at least, data on GDP in India were unavailable at quarterly frequency. Further, estimation of crucial measures such as potential output is not easy in the Indian case, notwithstanding some recent efforts. The quality of these estimates would improve if more data on the unorganised sector, employment and capacity utilisation were available. In this context, a major lacuna in India is that the data on employment essentially pertain to the organised sector, which constitutes less than 10% of the total labour force. It is important to stress that this is a severe constraint under which monetary policy in India is still being carried out.15 Further, a lack of reliable wage data is an impediment in determining the relative roles of cost-push and demand-pull factors in specific situations.
Additionally, an assessment of the inflationary conditions in the economy is constrained by the lack of a comprehensive measure of consumer price inflation. The multiple consumer price indices in India, on the basis of occupational classification and residence (rural/urban), compound the problem, especially when differences in weighting diagrams of the commodity baskets lead to differences in inflation numbers.
To illustrate this aspect, Figure 3 reveals the movements of different price indices in India.16 In Figure 3, WPI is the annual rate of inflation based on WPI. AL, UNME and IW are all CPI-
14 Krishnamurty (2002) provides a detailed review of the history of macroeconometric modelling in India at least
until the end of the 1990s. 15 In RBI official publications, discussions on the labour market are generally conspicuous only by their absence. 16 Even the determination of real equilibrium interest rates for India may not be easy because of the absence of
agreement on the price measures to be utilised.

BIS Papers No 31 87
based measures, for agricultural labourers, urban non-manual employees and industrial workers respectively. A casual glance at Figure 3 conveys that in any given year, the rates could be sharply different. However, Figure 3 suggests that their long-term relationships are unlikely to be seriously affected, despite findings to the contrary (Samanta and Mitra (1998)). In fact, Figure 3 also suggests that the three- or five-year moving averages of these rates of inflation are likely to be closer, as shocks to specific commodity groups are averaged out in this process.
Figure 3
Different measures of the rate of inflation in India
So far as other informational requirements are concerned, it may also be noted that India, even at this stage, also lacks a comprehensive service price index. Expectation or outlook surveys are also nascent. As a consequence the time series properties of different series from these surveys cannot be estimated well.
As the transmission mechanism is relatively less understood in India, a natural question is: how does the RBI decide to make changes in the CRR or the official interest rates in the multiple indicator regime? Figure 4 presents the quarterly changes in the Bank Rate (BR) and the CRR since the adoption of the MIA and juxtaposes these changes with the rate of inflation and GDP growth. Figure 4 reveals a few important features of the Indian economy. First, it establishes the “efficiency” compulsion of the Indian policymakers: a typical reduction in the BR or the CRR, even during the late 1990s, may not necessarily reflect “easy” monetary policy.17 In fact, there appears to be an asymmetry in the impacts of a CRR (or BR) rise and that of a CRR reduction. Given the constraints of the policy authorities, an increase in CRR or BR would indicate the monetary authority’s signal of tightening, but relaxing them may not be necessarily so. Three instances of an increase in either CRR or BR are shown in Figure 3, among which the first, during 1998, was a signal of tightening in the context of the
17 The RBI had repeatedly stressed its long-run commitment of reducing the CRR to the statutory minimum level
of 3.0%. The value of CRR as at October 31 2005 is, however, 5.0%, implying that the agenda is, as yet, unfinished.
-20
-10
0
10
20
30
40
70-7
1
75-7
6
80-8
1
85-8
6
90-9
1
95-9
6
00-0
1Financial year
Rat
e of
infla
tion
WPI IW
UNME AL

88 BIS Papers No 31
Southeast Asian financial crisis. It may be noted that in each case, the rate of inflation started to change course after about another quarter, despite relaxations of these measures afterwards. Given that CRR or Bank Rate changes were often initiated at the beginning of a quarter (ie in April or October), Figure 3 seems to suggest that monetary policy measures in India typically begin to affect the real sector with a lag of about six months, a lag that is generally in tune with cross-country findings.
Figure 4
Movements in inflation and output and the RBI policy signals
Working with both CRR and BR is a major impediment to having a clear policy reaction function in India.18 In fact, as late as in the year 2000, the RBI (2000b) suggested that a consequence of the lack of a clear policy reaction function in India could be that policy rules (eg Taylor rule) that could guide discretionary policy of the authorities in stabilising business cycles had not emerged in India. Interestingly, the RBI (2002) attempted to rectify this problem by specifying a policy reaction function in its model for the Indian economy.
So far as individual attempts at finding policy rules are concerned, in an interesting study Rao (2003) attempted an innovative solution. Generalising the concept of a monetary conditions index, Rao proposed a macroeconomic condition index comprising 10 macroeconomic indicators. He normalised each indicator on a scale of 0 to 1 and took a weighted average of these indicators; the weight accorded to each normalised variable was the inverse of its standard deviation over the sample period of 1990-91 to 2001-02. Rao’s technique, therefore, is similar to that of the principal component analysis in multivariate
18 In the Handbook of statistics on Indian economy (13 September 2005), Table 45 (p 96) for Bank Rate, CRR
and SLR mentions only the effective date of the change. It does not give the date of announcement of the policy. It is important to have these dates to study the announcement effect of RBI policies on financial markets.
-2,0
-1,5
-1,0
-0,5
0,0
0,5
1,0
98:2
99:2
00:2
01:2
02:2
03:2
04:2
Quarter
Cha
nge
in C
RR
and
BR
inpe
rcen
tage
poi
nts
0
2
4
6
8
10
Infla
tion
rate
/ G
DP
grow
th
CRR BR Inflation GDP growth

BIS Papers No 31 89
statistics. Rao used this indicator to explain changes in the official interest rates, and thus obtained a policy rule for the Indian economy. Given that this rule was based on most of the indicators listed by the RBI in the MIA, this is probably the only unofficial attempt to extract rules from apparently discretionary policies that characterised the 1990s.
Given the limitations in understanding the transmission channels and limitations in macroeconometric models in a radically changing environment, research, both within and out of RBI, often focussed on single equation techniques, especially in case of inflation.19 Among studies in this category, Callen and Chang (1999) attempted to explain and forecast the rate of inflation in India by alternative techniques. Their study revealed that among alternative indicators, M3 remained an important determinant of inflation. In fact, they observed an increase in the information content of the monetary aggregates since the financial deregulations. Callen and Chang (1999), however, found that an output gap specification did not work well on Indian data.
Besides limitations in the statistical infrastructure that put severe constraints on modelling exercises, three other major differences distinguish the Indian monetary policy framework from that of the developed economies. The first difference is the importance of fiscal dominance in the Indian context. Figure 2 reveals that in many instances, the variable GFD_CEN either peaked or displayed an increasing trend near parliamentary elections, highlighting the existence of the classical time-inconsistency problem. Although numerical values of GFD_CEN have come down sharply from 1998-99 onwards, its value still hovers around 4.0%. The deficits and the consequent borrowing programmes of the government puts serious constraints on the RBI’s monetary management. This is because, as the debt manager of the government, its monetary and debt management activities could sometimes be in conflict.
The second difference is the predominance of publicly owned financial intermediaries in India. Cross holdings and inter-relationships among these organisations could be a problem. In the context of central bank independence, Reddy (2001b) had sharply criticised this “joint family approach” that “ignores the basic tenets of accounting principles”.
The third difference is in the operating target. So far as the tactical aspect of monetary policy is concerned, the operating target in India has - until now - not been clearly mentioned. However, observers of the Indian market would readily verify the increasing inclination of the Indian monetary authorities to keep the short-term interest rate within a given corridor, which suggests that the call money rate in the Indian market could be taken as an informal operating target.20
An important question is: how has the Indian framework performed in terms of transparency and communication of policy? An international benchmark document in this area is the Code of Good Practices on Transparency in Monetary and Financial Policies prepared by the International Monetary Fund (IMF). This document is a development of the late 1990s. The Indian observance of these codes was reviewed by the Advisory Group on Transparency in Monetary and Financial Policies. The Group took a holistic approach and, other than a few lacunae already mentioned, found India to be compliant with most of these codes.
The Advisory Group’s major concern was about the apparent lack of transparency in the setting of monetary policy objectives. In this context, it must be stressed that, for its part, the RBI had clearly mentioned its projections of a few crucial macroeconomic indicators in its policy statements. It can be argued that these projections also reflect the policy priorities at a certain point of time.
19 Barman (2002) provides a review of the forecasting approach within the RBI. 20 For example, Hawkins (2005, Table 1, p 60) has characterised the overnight rate in the money market as
India’s operating target.
90 BIS Papers No 31
In a typical financial year (from April to March), these projections first appear in the annual policy statement. Generally these statements are given by the second half of April or first half of May. The projections may be revised in the Mid-Term Review, which typically occurs in the second half of October or the first half of November. These reports are lengthy and often consist of about 60 pages. As there are no sections devoted to these projections alone, a search for them could be tedious unless the concerned person reads at least a few of these reports to understand the way they are organised. The projections are made available in the part devoted to the monetary policy stance for the coming year. This part (often about two to three pages) not only provides the projections but also attempts to explain the rationale behind them. To examine the “judicious balance” between the objectives mandated to the RBI, one must read this part of the policy statement carefully.
Besides the projections, the long lists of RBI publications, the frequency of the speeches of its top management and its data dissemination appear to be consistent with the international standards in general. It may, however, be pointed out that RBI reports and reviews are often too long. With such a plethora of information dissemination, the very purpose of information dissemination and communication may be lost. For example, the need to prepare a 95-page quarterly report (Macroeconomic and Monetary Development 2004-05) can be questioned, especially when many other central banks can manage that task within about 60 pages (eg the August 2005 Inflation Report of the Bank of England consists of 59 pages, all-inclusive).21 The RBI website, however, appears to be in tune with the international benchmark.
Given all these, an important question is to what extent the RBI had been able to establish credibility. As policies during the 1990s were often discretionary and based on judgment, this question becomes crucial in understanding its role in guiding market expectations - a crucial feature in an IT framework. The question is also important in the Indian context, because if in future the RBI changes its framework to IT, the quality of its own assessments would play a significant role.
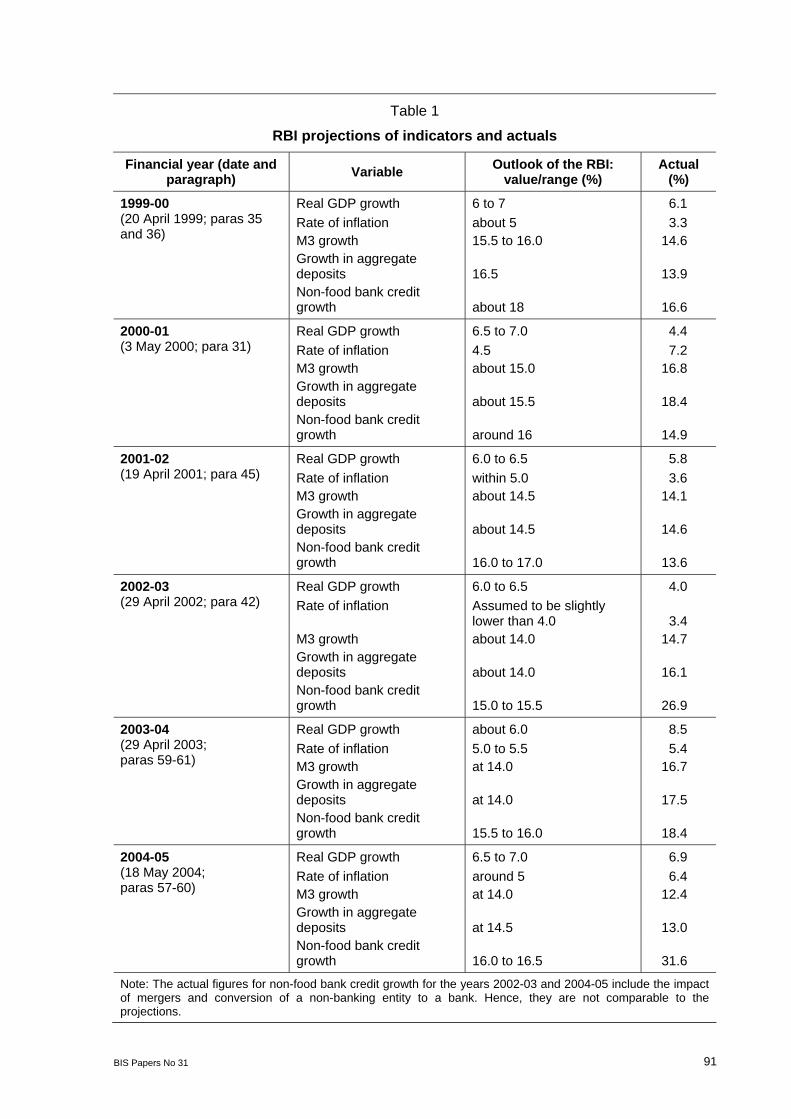
In this paper, we attempt to answer this question by examining to what extent the RBI outlook had actually materialised. The quality of assessments of the RBI during the MT period has already been examined by Mohanty and Mitra (1999). Further, Barman (2002) has reviewed the quality of RBI projections of the rate of inflation and GDP growth rates in the post-MT period from 1998-99 to 2001-02. The MIA approach, however, is based on several indicators. Therefore, it is important to review all RBI projections. In this paper, we examine the RBI projections on five variables, viz, the annual rate of inflation and annual growth rates of GDP, M3, bank deposits and non-food bank credit from the years 1999-00 to 2004-05. Table 1 reports the performance of RBI projections for these five variables.
Table 1 reveals a few important aspects regarding credibility. First, the quality of RBI projections had generally been good. If we allow a 2.0 percentage point band on either side, the major divergence in case of inflation has occurred only once, in the year 2000-01 when the projected rate was about 4.5% whereas the actual turned out to be 7.2%. Its outlook regarding the other variables also reflects a moderate to good performance.
A few general aspects, however, are important to note. First, the projections came at different time during the year. Although sufficient advance notice is given to the general public for the date of the annual policy statements and also for the mid-term review, so far these dates do not follow a clear pattern. For example, in the case of annual policy statements, differences in these dates could be as high as one full month (April 20 in 1999-2000 and May 18 in 2004-05). Hence, the information content that went in these projections and the time horizons of these projections were also different for different years.
21 One way to make a brief report is to make available a few background or survey papers on specific areas by
individual staff members. The Bank’s report may either refer these papers or quote from them liberally.
BIS Papers No 31 91
Table 1
RBI projections of indicators and actuals
Financial year (date and paragraph) Variable Outlook of the RBI:
value/range (%) Actual
(%)
Real GDP growth 6 to 7 6.1 Rate of inflation about 5 3.3 M3 growth 15.5 to 16.0 14.6 Growth in aggregate deposits 16.5 13.9
1999-00 (20 April 1999; paras 35 and 36)
Non-food bank credit growth about 18 16.6
Real GDP growth 6.5 to 7.0 4.4 Rate of inflation 4.5 7.2 M3 growth about 15.0 16.8 Growth in aggregate deposits about 15.5 18.4
2000-01 (3 May 2000; para 31)
Non-food bank credit growth around 16 14.9
Real GDP growth 6.0 to 6.5 5.8 Rate of inflation within 5.0 3.6 M3 growth about 14.5 14.1 Growth in aggregate deposits about 14.5 14.6
2001-02 (19 April 2001; para 45)
Non-food bank credit growth 16.0 to 17.0 13.6
Real GDP growth 6.0 to 6.5 4.0 Rate of inflation Assumed to be slightly
lower than 4.0 3.4 M3 growth about 14.0 14.7 Growth in aggregate deposits about 14.0 16.1
2002-03 (29 April 2002; para 42)
Non-food bank credit growth 15.0 to 15.5 26.9
Real GDP growth about 6.0 8.5 Rate of inflation 5.0 to 5.5 5.4 M3 growth at 14.0 16.7 Growth in aggregate deposits at 14.0 17.5
2003-04 (29 April 2003; paras 59-61)
Non-food bank credit growth 15.5 to 16.0 18.4
Real GDP growth 6.5 to 7.0 6.9 Rate of inflation around 5 6.4 M3 growth at 14.0 12.4 Growth in aggregate deposits at 14.5 13.0
2004-05 (18 May 2004; paras 57-60)
Non-food bank credit growth 16.0 to 16.5 31.6
Note: The actual figures for non-food bank credit growth for the years 2002-03 and 2004-05 include the impact of mergers and conversion of a non-banking entity to a bank. Hence, they are not comparable to the projections.
92 BIS Papers No 31
Second, the wordings of the outlooks do not follow any clear pattern. Sometimes, they are point projections, sometimes expressed with clear upper and lower bounds, sometimes with only one-sided bounds and sometimes with fuzzy words like “about” or “around”. Therefore, if one wants to examine whether the RBI’s projections of specific variables are improving or deteriorating over time, there is no easy quantitative measure (eg average absolute error in projection) to summarise the performance.
Third, the projections that provide clear lower and upper bounds appear to be too narrow vis-à-vis international standards. For example, the range in one-year-ahead forecasts in a fan chart provided by many central banks could be higher than the range provided by the RBI, despite inflation rates in some of these countries being lower and less volatile. The thin range in some of these projections, therefore, could usher in unwarranted credibility problems.
Fourth, despite moving away from monetary targets, the projections for M3 under MIA appear to be good.
Fifth, the apparently high forecast errors in the case of non-food bank credit growth in the years 2002-03 and 2004-05 are due to mergers as well as conversion of a non-banking entity to a bank. In this paper, the figures for that variable corresponding to the “Actual” column in Table 1 have been taken from Table 230 of the Handbook of statistics on Indian economy (13 September 2005) disseminated by the RBI. The notes at the end of the table explain why the growth rates in non-food bank credit have suddenly jumped in those years, but unfortunately do not mention the comparable figures.
3. Performance under different monetary policy frameworks
Earlier, Mohanty and Mitra (1999)’s review compared the performance of MT to that of earlier frameworks. However, being an early study, it could not include observations after the adoption of MIA. Further, Mohanty and Mitra (1999) did not distinguish the performance by breaking the entire MT period into subperiods. In this section, we attempt to extend their findings by focusing on these two tasks. We also attempt to assess the role of monetary policy in these changes. Subsection 3.1 examines the performance, while Subsection 3.2 is devoted to the second objective.
3.1. Performance of the Indian economy under different monetary policy frameworks
In Section 2 it was discussed that the way RBI words its monetary policy objectives makes it difficult to judge its performance against a well defined benchmark. This is for at least three reasons. First, to arrive at the benchmark for “adequate” credit, one would require an accurate estimation of demand for credit in the economy. Second, even if this demand is correctly estimated, the cutoff line for “adequate” may still change depending upon one’s perception of and aversion to risk.22 Third, credit extended “to support growth” may have a time-varying relationship with GDP growth. The strength of association between the two would depend on the efficiency of the banking system, the availability of funds from non-bank sources and corporate behaviour in raising finances for projects. Gauging the “adequate” level of credit is, therefore, not an easy task.
22 For example, results in Banerjee and Duflo (2004) suggest that during the second half of the 1990s, many
small firms in India were severely credit constrained. While credit extended in the economy may not be “adequate” from these firms’ perspective, the same may not hold from the point of view of the banking sector or the central bank.
BIS Papers No 31 93
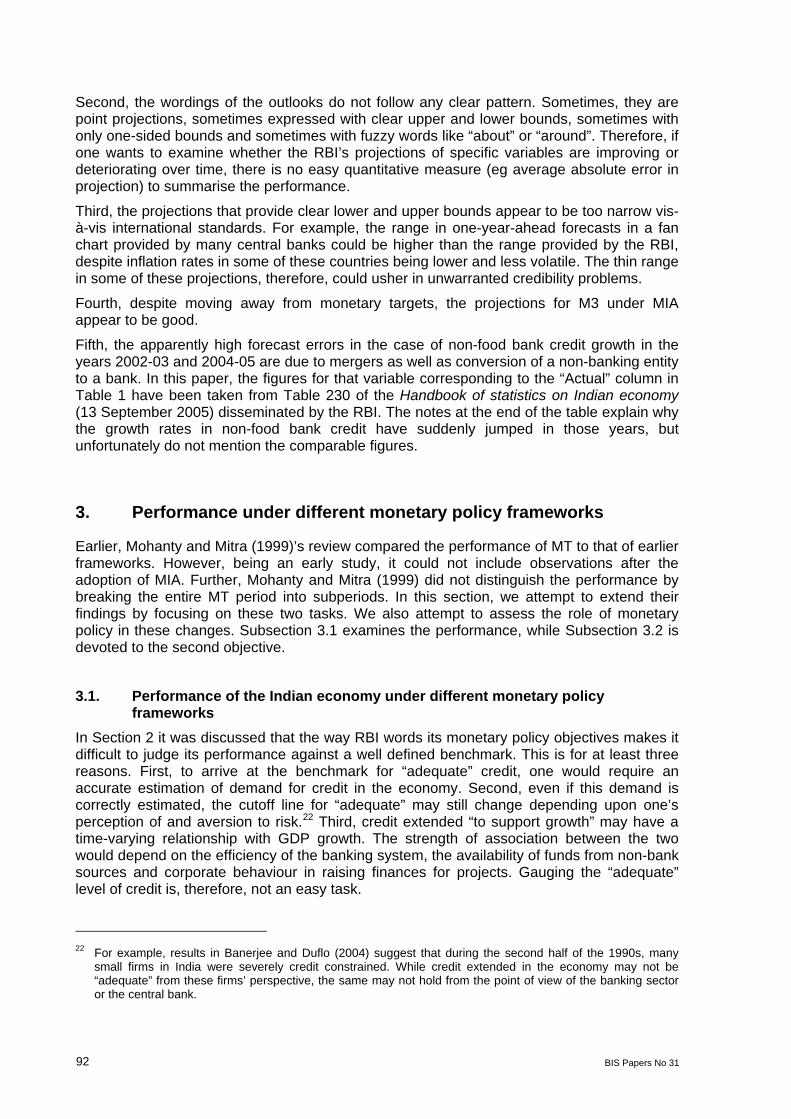
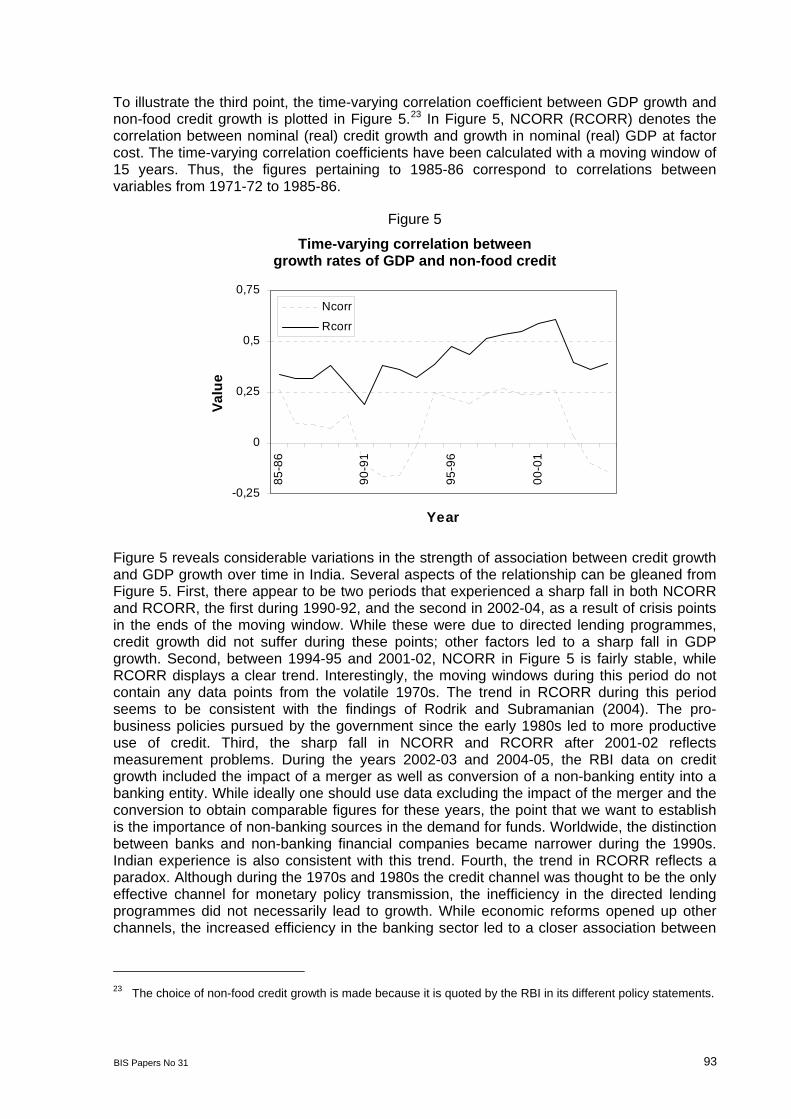
To illustrate the third point, the time-varying correlation coefficient between GDP growth and non-food credit growth is plotted in Figure 5.23 In Figure 5, NCORR (RCORR) denotes the correlation between nominal (real) credit growth and growth in nominal (real) GDP at factor cost. The time-varying correlation coefficients have been calculated with a moving window of 15 years. Thus, the figures pertaining to 1985-86 correspond to correlations between variables from 1971-72 to 1985-86.
Figure 5
Time-varying correlation between growth rates of GDP and non-food credit
-0,25
0
0,25
0,5
0,7585
-86
90-9
1
95-9
6
00-0
1Year
Valu
e
Ncorr
Rcorr
Figure 5 reveals considerable variations in the strength of association between credit growth and GDP growth over time in India. Several aspects of the relationship can be gleaned from Figure 5. First, there appear to be two periods that experienced a sharp fall in both NCORR and RCORR, the first during 1990-92, and the second in 2002-04, as a result of crisis points in the ends of the moving window. While these were due to directed lending programmes, credit growth did not suffer during these points; other factors led to a sharp fall in GDP growth. Second, between 1994-95 and 2001-02, NCORR in Figure 5 is fairly stable, while RCORR displays a clear trend. Interestingly, the moving windows during this period do not contain any data points from the volatile 1970s. The trend in RCORR during this period seems to be consistent with the findings of Rodrik and Subramanian (2004). The pro-business policies pursued by the government since the early 1980s led to more productive use of credit. Third, the sharp fall in NCORR and RCORR after 2001-02 reflects measurement problems. During the years 2002-03 and 2004-05, the RBI data on credit growth included the impact of a merger as well as conversion of a non-banking entity into a banking entity. While ideally one should use data excluding the impact of the merger and the conversion to obtain comparable figures for these years, the point that we want to establish is the importance of non-banking sources in the demand for funds. Worldwide, the distinction between banks and non-banking financial companies became narrower during the 1990s. Indian experience is also consistent with this trend. Fourth, the trend in RCORR reflects a paradox. Although during the 1970s and 1980s the credit channel was thought to be the only effective channel for monetary policy transmission, the inefficiency in the directed lending programmes did not necessarily lead to growth. While economic reforms opened up other channels, the increased efficiency in the banking sector led to a closer association between
23 The choice of non-food credit growth is made because it is quoted by the RBI in its different policy statements.
94 BIS Papers No 31
credit growth and GDP growth. Fifth, despite the increase in the strength of association, the correlation figures are still moderate. The above observations appear to be consistent with the findings of Misra (2003), who analysed the relationship between credit off-take and growth in 25 states in India from 1980-81 to 2000 and concluded that lack of credit off-take should not be seen as a problem in itself, but should be seen in conjunction with what is happening on the growth front.
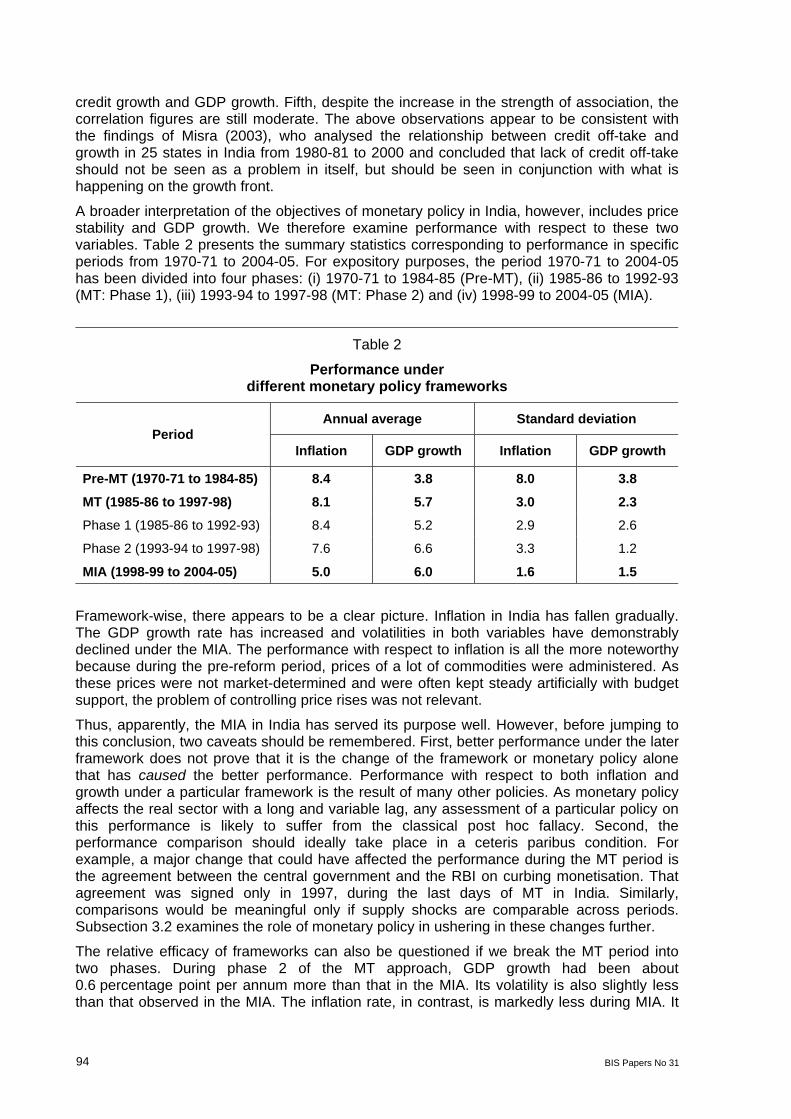
A broader interpretation of the objectives of monetary policy in India, however, includes price stability and GDP growth. We therefore examine performance with respect to these two variables. Table 2 presents the summary statistics corresponding to performance in specific periods from 1970-71 to 2004-05. For expository purposes, the period 1970-71 to 2004-05 has been divided into four phases: (i) 1970-71 to 1984-85 (Pre-MT), (ii) 1985-86 to 1992-93 (MT: Phase 1), (iii) 1993-94 to 1997-98 (MT: Phase 2) and (iv) 1998-99 to 2004-05 (MIA).
Table 2
Performance under different monetary policy frameworks
Annual average Standard deviation Period
Inflation GDP growth Inflation GDP growth
Pre-MT (1970-71 to 1984-85) 8.4 3.8 8.0 3.8
MT (1985-86 to 1997-98) 8.1 5.7 3.0 2.3
Phase 1 (1985-86 to 1992-93) 8.4 5.2 2.9 2.6
Phase 2 (1993-94 to 1997-98) 7.6 6.6 3.3 1.2
MIA (1998-99 to 2004-05) 5.0 6.0 1.6 1.5
Framework-wise, there appears to be a clear picture. Inflation in India has fallen gradually. The GDP growth rate has increased and volatilities in both variables have demonstrably declined under the MIA. The performance with respect to inflation is all the more noteworthy because during the pre-reform period, prices of a lot of commodities were administered. As these prices were not market-determined and were often kept steady artificially with budget support, the problem of controlling price rises was not relevant.
Thus, apparently, the MIA in India has served its purpose well. However, before jumping to this conclusion, two caveats should be remembered. First, better performance under the later framework does not prove that it is the change of the framework or monetary policy alone that has caused the better performance. Performance with respect to both inflation and growth under a particular framework is the result of many other policies. As monetary policy affects the real sector with a long and variable lag, any assessment of a particular policy on this performance is likely to suffer from the classical post hoc fallacy. Second, the performance comparison should ideally take place in a ceteris paribus condition. For example, a major change that could have affected the performance during the MT period is the agreement between the central government and the RBI on curbing monetisation. That agreement was signed only in 1997, during the last days of MT in India. Similarly, comparisons would be meaningful only if supply shocks are comparable across periods. Subsection 3.2 examines the role of monetary policy in ushering in these changes further.
The relative efficacy of frameworks can also be questioned if we break the MT period into two phases. During phase 2 of the MT approach, GDP growth had been about 0.6 percentage point per annum more than that in the MIA. Its volatility is also slightly less than that observed in the MIA. The inflation rate, in contrast, is markedly less during MIA. It
BIS Papers No 31 95
has fallen by 2.6 percentage points per annum more and its volatility (measured in terms of standard deviation) has also nearly halved compared to the second phase of MT.
3.2. role of monetary policy in the observed performance We now attempt to assess the role of monetary policy in India in bringing about the changes in economic performance. The first question before us is: to what extent is monetary policy responsible for the improvement in economic performance? We attempt to answer this question by assessing the contribution of shocks other than monetary policy shocks to inflation in India.
The Indian monetary authorities have repeatedly stressed the importance of supply shocks in the Indian context. In fact, the perceived dominance of supply shocks was one factor besides fiscal dominance that led India not to opt for IT. Among other determinants, the role of supply shocks in inflation in India, therefore, needs careful scrutiny.
The annual rates of inflation observed from 1970-71 onwards seem to confirm the important role of supply shocks. From 1970-71, the Indian economy experienced three high inflation episodes, viz, 1972-75, 1979-81 and 1990-95, leading to double digit inflation rates.24 The first two episodes were clearly due to the increase in international oil prices that had devastating consequences for the Indian economy. Even in the last episode during 1990-95, the role of supply factors cannot be ignored. Though fiscal profligacy and the balance of payments crisis were responsible for the higher rate of inflation during this episode, one incident that triggered the crisis was the Gulf war.
One way to examine the role of monetary policy would be to examine core inflation rates. In the Indian context, though official core estimates are not available, core inflation measures have been estimated by Samanta (1999) and Mohanty et al (2000) based on different principles.25 These studies once again confirm the importance of supply shocks in India. Core inflation estimated by these studies tended to be lower, especially during high inflation episodes. For example, during the high inflation episode of 1990-95, while the average annual rate of inflation based on WPI was 10.7%, core inflation measured using a trimmed mean approach was 9.9% (Mohanty et al, 2000). So far as the contribution of oil shocks is concerned, Bhattacharya and Bhattacharyya (2001) examined the role of oil prices on other commodities in a VAR framework. Their results, largely pertaining to the data on the second half of the 1990s, revealed that a 20 percentage point shock in domestically administered oil prices led to about a 1.3 percentage point price increase in other commodities at its peak, which typically occurred five to seven months after the shock.
Unfortunately, the reference periods in these studies either do not include any observations after the adoption of MIA or include only a few. However, the performance of inflation in India since 1998-99 seems to further corroborate the importance of supply shocks. If, as per Rangarajan (2001), one considers 5.0-6.0% as the tolerable range for inflation in the Indian context, there had been two instances where the rate had overshot, eg 7.2% in 2000-01 and 6.4% in 2004-05. In each case, the increase was due to that in the fuel, power, light and lubricants (FPLL) group (28.5% and 10.1% respectively). The average rate of annual inflation
24 The rate of inflation (based on WPI) in the year 1993-94 was 8.4%. 25 The RBI should prepare a few “official” measures of core inflation. Efforts in this direction so far have come at
the initiative of individual staff. While the appropriateness of a specific core inflation measure in the Indian context may always be questioned, there is no harm in providing more than a single official measure. The debate on the appropriateness of a core inflation measure is primarily an empirical one and unless at least a few such measures are made available, cannot be resolved satisfactorily.

96 BIS Papers No 31
in manufactured commodities, a very crude estimate of core inflation based on exclusion principles, had been only 3.8% per annum since 1998-99.
These observations are generally supportive of the importance of supply shocks. Their implications being that even if the monetary policy framework in India is changed to formal IT, the band of the tolerable range - at least during the initial years - needs to be higher than that in the developed countries.
It may, however, be noted that supply shocks may not necessarily lead to high inflation; they can reduce the rate of inflation as well. Inflation reducing supply shocks occur when technological progress makes the economy more efficient, or when competitive pressure in the economy increases. These changes are generally slow, so the fall in inflation is also likely to be slow.
The Indian experience seems to be supportive of the existence of positive supply shocks as well. For example, studies like Poddar (2004) have found evidence that the liberalisation process in India had resulted in greater domestic competition, increasing firms’ efficiency and India’s ability to export in international markets. This increase in efficiency was achieved by combinations of monetary, fiscal, competition and administrative policies and not by monetary policies alone. One can argue that some of these policies initiated during the economic reforms led to a shift in the aggregate supply curve, giving rise to difficulties in estimating the likely contribution of monetary policy in the reduction of inflation.
Although the precise contribution of monetary policy in reducing the rate of inflation is difficult to arrive at, monetary policy in India facilitated the process of raising competitiveness and efficiency. There is evidence that policies adopted by the RBI led to an increase in the efficiency and competitiveness of the financial sector. For example, Bhattacharya and Das (2003) have observed a clear downward trend in different measures of spreads in the banking sector in the 1990s. Further results in Prasad and Ghosh (2005b) pertaining to the period 1996-2004 suggest that Indian banks had operated during that period under competitive conditions. It is likely that the increase in competitiveness in the financial sector, inter alia, created the background for the increase in competition in other sectors by reducing entry and exit barriers.
The next question that we ask is: whether the rate of inflation in India has fallen to the desired level? Arriving at a socially optimal rate of inflation is not an easy task. Interestingly, the Chakravarty Committee, while highlighting the importance of price stability as the dominant objective of monetary policy, considered the desirable rate of inflation in India to be about 4.0%. Rangarajan (2001), in the case of India, suggested an alternative acceptable range as 5.0 to 6.0%. The figures of both the Chakravarty Committee and Rangarajan (2001) are based on judgments, as it was felt that econometric models could not clearly indicate all the costs of inflation. Interestingly, in the case of India, empirical estimates of the threshold rate of inflation - beyond which it has a negative effect on growth - generally vary between 3 and 7%, although the official estimate is about 5% (RBI (2002)).26
In the developed countries, the current desirable rate typically considered is around 1.0-2.0%. If we allow a 2.0 percentage point band on either side, 0.0-4.0% seems to be the general tolerable range. Thus, since 1998-99 the average annual rate of inflation in India (measured in terms of WPI) has not been too much out of alignment with that in developed countries. It may be noted that in the Indian context, the rates of inflation based on WPI and CPI had sometimes yielded significantly different estimates and even their long-term relationships had been found to be susceptible (Samanta and Mitra (1998)). Incidentally, the
26 One of the latest estimates of the threshold rate of inflation is about 3.5% (Rao (2003)).
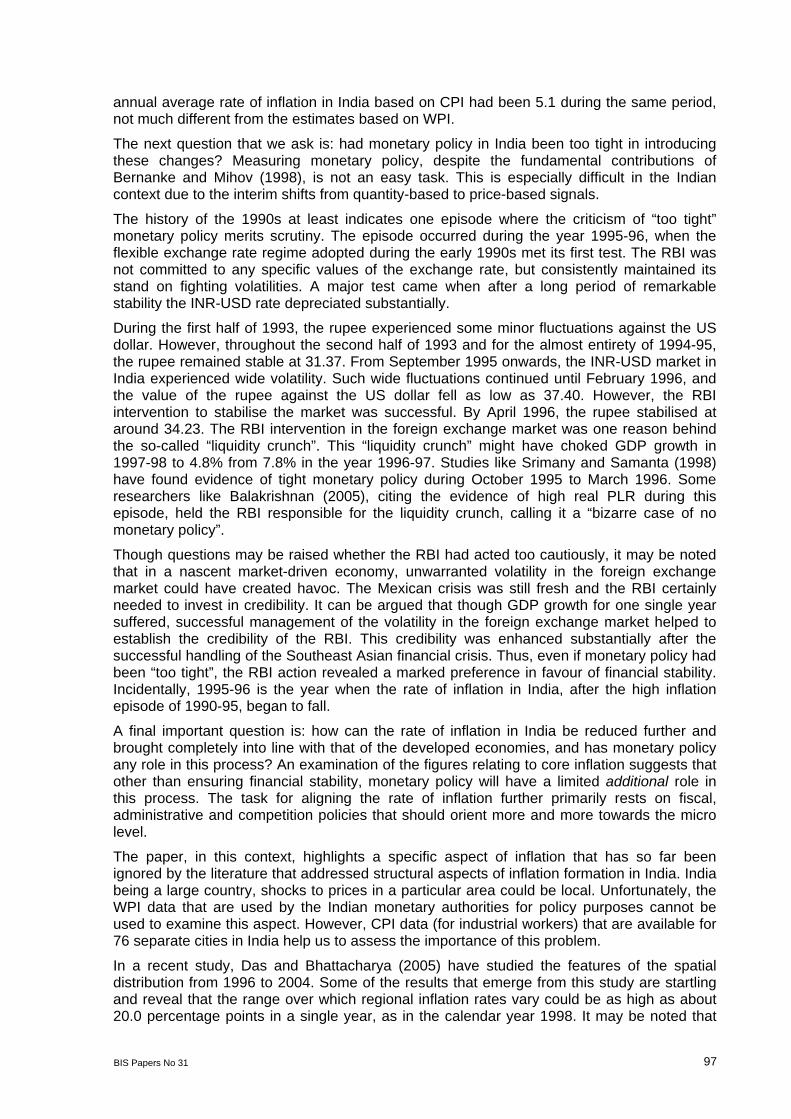
BIS Papers No 31 97
annual average rate of inflation in India based on CPI had been 5.1 during the same period, not much different from the estimates based on WPI.
The next question that we ask is: had monetary policy in India been too tight in introducing these changes? Measuring monetary policy, despite the fundamental contributions of Bernanke and Mihov (1998), is not an easy task. This is especially difficult in the Indian context due to the interim shifts from quantity-based to price-based signals.
The history of the 1990s at least indicates one episode where the criticism of “too tight” monetary policy merits scrutiny. The episode occurred during the year 1995-96, when the flexible exchange rate regime adopted during the early 1990s met its first test. The RBI was not committed to any specific values of the exchange rate, but consistently maintained its stand on fighting volatilities. A major test came when after a long period of remarkable stability the INR-USD rate depreciated substantially.
During the first half of 1993, the rupee experienced some minor fluctuations against the US dollar. However, throughout the second half of 1993 and for the almost entirety of 1994-95, the rupee remained stable at 31.37. From September 1995 onwards, the INR-USD market in India experienced wide volatility. Such wide fluctuations continued until February 1996, and the value of the rupee against the US dollar fell as low as 37.40. However, the RBI intervention to stabilise the market was successful. By April 1996, the rupee stabilised at around 34.23. The RBI intervention in the foreign exchange market was one reason behind the so-called “liquidity crunch”. This “liquidity crunch” might have choked GDP growth in 1997-98 to 4.8% from 7.8% in the year 1996-97. Studies like Srimany and Samanta (1998) have found evidence of tight monetary policy during October 1995 to March 1996. Some researchers like Balakrishnan (2005), citing the evidence of high real PLR during this episode, held the RBI responsible for the liquidity crunch, calling it a “bizarre case of no monetary policy”.
Though questions may be raised whether the RBI had acted too cautiously, it may be noted that in a nascent market-driven economy, unwarranted volatility in the foreign exchange market could have created havoc. The Mexican crisis was still fresh and the RBI certainly needed to invest in credibility. It can be argued that though GDP growth for one single year suffered, successful management of the volatility in the foreign exchange market helped to establish the credibility of the RBI. This credibility was enhanced substantially after the successful handling of the Southeast Asian financial crisis. Thus, even if monetary policy had been “too tight”, the RBI action revealed a marked preference in favour of financial stability. Incidentally, 1995-96 is the year when the rate of inflation in India, after the high inflation episode of 1990-95, began to fall.
A final important question is: how can the rate of inflation in India be reduced further and brought completely into line with that of the developed economies, and has monetary policy any role in this process? An examination of the figures relating to core inflation suggests that other than ensuring financial stability, monetary policy will have a limited additional role in this process. The task for aligning the rate of inflation further primarily rests on fiscal, administrative and competition policies that should orient more and more towards the micro level.
The paper, in this context, highlights a specific aspect of inflation that has so far been ignored by the literature that addressed structural aspects of inflation formation in India. India being a large country, shocks to prices in a particular area could be local. Unfortunately, the WPI data that are used by the Indian monetary authorities for policy purposes cannot be used to examine this aspect. However, CPI data (for industrial workers) that are available for 76 separate cities in India help us to assess the importance of this problem.
In a recent study, Das and Bhattacharya (2005) have studied the features of the spatial distribution from 1996 to 2004. Some of the results that emerge from this study are startling and reveal that the range over which regional inflation rates vary could be as high as about 20.0 percentage points in a single year, as in the calendar year 1998. It may be noted that
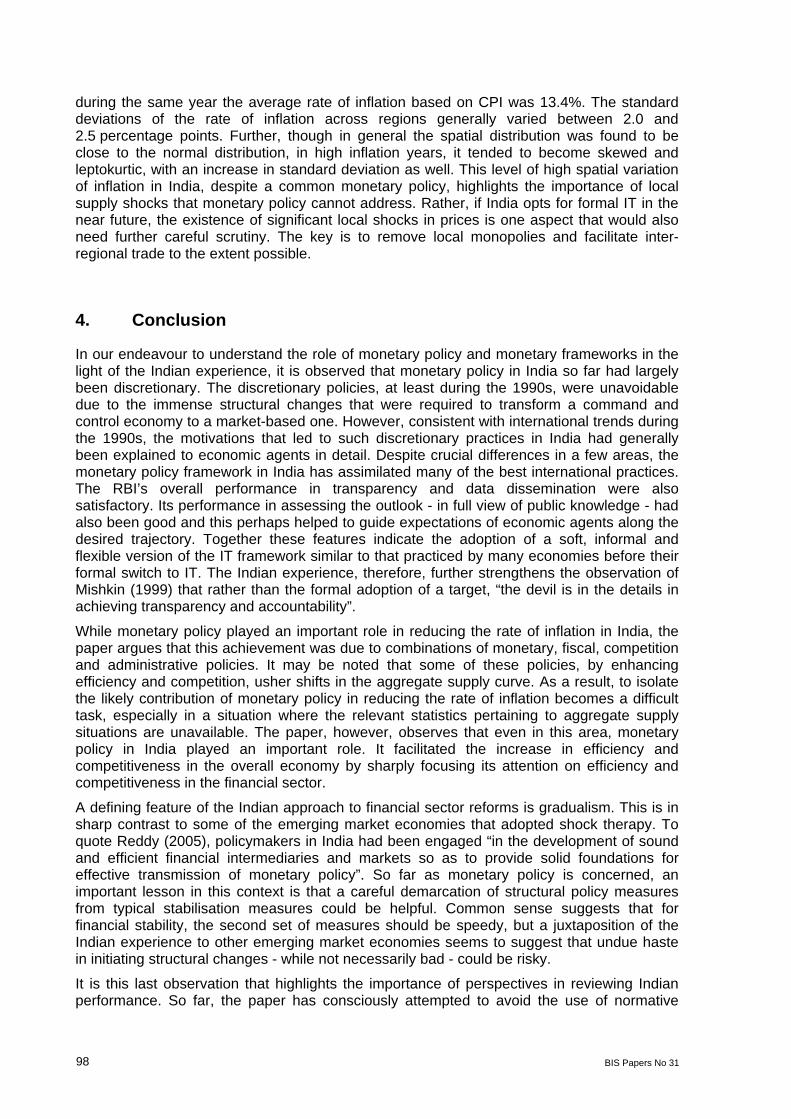
98 BIS Papers No 31
during the same year the average rate of inflation based on CPI was 13.4%. The standard deviations of the rate of inflation across regions generally varied between 2.0 and 2.5 percentage points. Further, though in general the spatial distribution was found to be close to the normal distribution, in high inflation years, it tended to become skewed and leptokurtic, with an increase in standard deviation as well. This level of high spatial variation of inflation in India, despite a common monetary policy, highlights the importance of local supply shocks that monetary policy cannot address. Rather, if India opts for formal IT in the near future, the existence of significant local shocks in prices is one aspect that would also need further careful scrutiny. The key is to remove local monopolies and facilitate inter-regional trade to the extent possible.
4. Conclusion
In our endeavour to understand the role of monetary policy and monetary frameworks in the light of the Indian experience, it is observed that monetary policy in India so far had largely been discretionary. The discretionary policies, at least during the 1990s, were unavoidable due to the immense structural changes that were required to transform a command and control economy to a market-based one. However, consistent with international trends during the 1990s, the motivations that led to such discretionary practices in India had generally been explained to economic agents in detail. Despite crucial differences in a few areas, the monetary policy framework in India has assimilated many of the best international practices. The RBI’s overall performance in transparency and data dissemination were also satisfactory. Its performance in assessing the outlook - in full view of public knowledge - had also been good and this perhaps helped to guide expectations of economic agents along the desired trajectory. Together these features indicate the adoption of a soft, informal and flexible version of the IT framework similar to that practiced by many economies before their formal switch to IT. The Indian experience, therefore, further strengthens the observation of Mishkin (1999) that rather than the formal adoption of a target, “the devil is in the details in achieving transparency and accountability”.
While monetary policy played an important role in reducing the rate of inflation in India, the paper argues that this achievement was due to combinations of monetary, fiscal, competition and administrative policies. It may be noted that some of these policies, by enhancing efficiency and competition, usher shifts in the aggregate supply curve. As a result, to isolate the likely contribution of monetary policy in reducing the rate of inflation becomes a difficult task, especially in a situation where the relevant statistics pertaining to aggregate supply situations are unavailable. The paper, however, observes that even in this area, monetary policy in India played an important role. It facilitated the increase in efficiency and competitiveness in the overall economy by sharply focusing its attention on efficiency and competitiveness in the financial sector.
A defining feature of the Indian approach to financial sector reforms is gradualism. This is in sharp contrast to some of the emerging market economies that adopted shock therapy. To quote Reddy (2005), policymakers in India had been engaged “in the development of sound and efficient financial intermediaries and markets so as to provide solid foundations for effective transmission of monetary policy”. So far as monetary policy is concerned, an important lesson in this context is that a careful demarcation of structural policy measures from typical stabilisation measures could be helpful. Common sense suggests that for financial stability, the second set of measures should be speedy, but a juxtaposition of the Indian experience to other emerging market economies seems to suggest that undue haste in initiating structural changes - while not necessarily bad - could be risky.
It is this last observation that highlights the importance of perspectives in reviewing Indian performance. So far, the paper has consciously attempted to avoid the use of normative
BIS Papers No 31 99
words like “good”, “bad”, “sound” or “desirable” in reviewing the actions of Indian monetary policymakers, as these words often reflect one’s strong normative preferences between high growth and financial stability. A striking contrast in perspectives in this context is worth mentioning. In describing the Indian experience, Reddy (2005) does not rule out “an element of luck”, but opines that investment in institution-building was an “exercise of sound judgment and enhancement of skills at all levels”. At the other extreme, Balakrishnan (2005) perceives the same experience as a “less than imaginative support to growth”, “a failure to show acceleration” and a “bizarre case of a missing monetary policy”, with a grudging approval that “this does not warrant the conclusion that the reforms failed”. Thus, like the proverbial story of the Indian elephant which would look different to different people, the actions of Indian policymakers would perhaps attract different adjectives from different persons or organisations.
References
Ahluwalia M S (2002): “Economic reforms in India since 1991: has gradualism worked?”, Journal of Economic Perspectives, 16, 67-88.
Arif R R (1996): Money demand stability: myth or reality - an econometric analysis, Development Research Group Study No 13, Reserve Bank of India.
Balakrishnan P (2005): “Macroeconomic policy and economic growth in the 1990s”, Economic and Political Weekly, XXXX, 3969-3977.
Banerjee A V and E Duflo (2004): “Do firms want to borrow more? testing credit constraints using a directed lending program”, Mimeo, Department of Economics, MIT.
Bank of England (1999): “The transmission mechanism of monetary policy, Bank of England Quarterly Bulletin, 39, 161-170.
——— (2000): Economic models at the Bank of England, Bank of England.
Barman R B (2002): “Forecasts of economic indicators for monetary policy in India: an assessment”, IFC Bulletin, 13, 80-93.
Bernanke B and I Mihov (1998): “Measuring monetary policy”, Quarterly Journal of Economics, 113, 869-902.
Bhattacharya B B, R B Barman and A K Nag (1994): “Stabilisation policy options: a macroeconometric analysis”, Development Research Group Study No 8, Reserve Bank of India.
Bhattacharya K and A Das (2003): “Dynamics of market structure and competitiveness of the banking sector in India and its impact on output and prices of banking services”, Reserve Bank of India Occasional Papers, 24, 123-159.
Bhattacharya K and I Bhattacharyya (2001): “Impact of increase in oil prices on inflation and output in India”, Economic and Political Weekly, XXXVI, 4735-4741.
Brash D T (1999): “Inflation targeting: is New Zealand’s experience relevant to developing countries”, The Sixth L K Jha Memorial Lecture, Reserve Bank of India, Mumbai, 17 June.
Callen T and D Chang (1999): “Modeling and forecasting inflation in India”, International Monetary Fund Working Paper No WP/99/119.
Chitre V S (1986): “Quarterly prediction of reserve money multiplier and money stock in India”, Artha Vijnana, XXVIII, No 1 (Artha Vijnana Reprint Series No 10).
Cukierman A (1992): Central bank strategy, credibility and independence: theory and evidence, MIT Press.

100 BIS Papers No 31
Das S and K Bhattacharya (2005): “Price convergence across regions in India”, Bonn Graduate School Economics Discussion Paper No 1/2005.
Endo T (1998): The Indian securities market: a guide for foreign and domestic investors, Vision Books, New Delhi.
Hagen J V (1999): “Money growth targeting by the Bundesbank”, Journal of Monetary Economics, 43, 681-701.
Hawkins J (2005): “Globalisation and monetary operations in emerging economies”, BIS Papers No 23, 59-80.
Jadhav N (1994): Monetary economics for India, Macmillan India, New Delhi.
——— (2003): “Central bank strategies, credibility and independence: global evolution and the Indian experience”, Reserve Bank of India Occasional Papers, 24, 1-104.
Joshi V and IMD Little (1996): India’s economic reforms, 1991-2001, Clarendon Press, Oxford.
Kannan R (1999): “Inflation targeting: issues and relevance for India”, Economic and Political Weekly, XXXIV, 115-122.
Krishnamurty K (2002): “Macroeconomic models for India: past, present and prospects”, Economic and Political Weekly, XXXVII, No 42 (October 19).
Malhotra R N (1997): “Liberalising interest rates” in Banking & financial sector reforms in India by R Kapila and U Kapila (Ed), Vol-2, Academic Foundation, 45-49.
McKibbin W J and K Singh (2000): “Issues in the choice of a monetary regime for India”, Mimeo, Australian National University.
Mishkin F S (1999): “International experiences with different monetary policy regimes”, NBER Working Paper 7044.
——— (2000): “What should central banks do?”, Federal Reserve Bank of St Louis Review, November/December, 1-13.
——— (2001): The economics of money, banking and financial markets, Addison Wesley.
Misra B M (1997): “Fifty years of the Indian capital market”, Reserve Bank of India Occasional Papers, 18, 351-384.
Misra B S (2003): “Analytics of credit-output nexus in India”, Reserve Bank of India Occasional Papers, 24, 145-171.
Mohan R (2005a): “Financial sector reforms in India: policies and performance analysis”, Economic and Political Weekly, XXXX, March 19, 1106-1119.
——— (2005b): Communications in central banks: a perspective, speech given at the SAARC FINANCE Governors’ Symposium, Mumbai, 9 September 2005.
——— (2005c): “Globalisation, financial markets and the operation of monetary policy in India” in BIS Papers No 23, 161-170.
Mohanty D and A K Mitra (1999): “Experience with monetary targeting in India”, Economic and Political Weekly, XXXIV, 123-132.
Mohanty D, A K Mitra and M Ramaiah (2000): “Measures of core inflation for India”, Economic and Political Weekly, XXXV (Special Issue: January 29), 273-282.
Nag A K and G Upadhyay (1993): “Estimating money demand function: a cointegration approach”, Reserve Bank of India Occasional Papers, 14, 47-66.
Palanivel T and L R Klein (1999): “An econometric model for India with emphasis on the monetary sector”, The Developing Economies, 37, 275-336.

BIS Papers No 31 101
Pani P K (1984): “A macromodel of Indian economy with special reference to output, demand and prices (1969-70 to 1981-82)”, Reserve Bank of India Occasional Papers, 5, No 2, December.
Pangariya A (2004): “Growth and reforms during 1980s and 1990s”, Economic and Political Weekly, 36, 2581-2594.
Poddar T (2004): “Domestic competition spurs exports: the Indian example”, International Monetray Fund Working Paper No WP/04/173.
Poole W (1970): “Optimal choice of monetary policy instruments in a simple stochastic macro model”, Quarterly Journal of Economics, 84, 197-216.
Prasad A and S Ghosh (2005a): “Monetary policy and corporate behavior in India”, International Monetary Fund Working Paper No WP/05/25.
——— (2005b): “Competition in Indian banking”, International Monetary Fund Working Paper No. WP/05/141.
Rangarajan C. (2001): “Some critical issues in monetary policy”, Economic and Political Weekly, XXXVI, 2139-2146.
Rangarajan C and M S Mohanty (1997): “Fiscal deficit, external balance and monetary growth - a study of Indian economy”, Reserve Bank of India Occasional Papers, 18, No 14, December.
Rao M J M and B Singh (1995): “Analytical foundations of financial programming and growth oriented adjustment”, Development Research Group Study No. 11, Reserve Bank of India.
Rao M J M (2003): “Science of monetary policy: some perspectives on the Indian economy”, Economic and Political Weekly, XXXVIII, 809-818.
Reddy Y V (1999): “Monetary policy operating procedures in India”, in Monetary policy operating procedures in emerging market economies, Bank for International Settlements, (ed), pp 99-109.
——— (2001a): Parameters of monetary policy in India, speech at the 88th Annual Conference of the Indian Econometric Society at Madras School of Economics, Chennai on 15 January 2002.
——— (2001b): “Autonomy of the central bank: changing contours in India”, speech at Indian Institute of Management at Indore on 3 October 2001.
——— (2005): Globalisation of monetary policy and Indian experience, speech at the Eighth Meeting of the BIS Working Party on Monetary Policy in Asia, held at the RBI, Mumbai on 6-7 June 2005.
Reserve Bank of India (1985): Report of the Committee to Review the Working of the Monetary System (the “Chakravarty Committee”).
——— (1998): Report of the Working Group on Money Supply: Analytics and Methodology of Compilation (the “Reddy Committee”).
——— (2000a): Report of the Advisory Group on Transparency in Monetary and Financial Policies.
——— (2000b): Annual Report for the Year 1999-00.
——— (2001a): Report of the Advisory Group on Data Dissemination.
——— (2002): Report on Currency and Finance 2000-01.
Rodrik D and A Subramanian (2004): “From ‘Hindu growth’ to productivity surge: the mystery of the Indian growth transition”, NBER Working Paper No 10376.
102 BIS Papers No 31
Samanta G P (1999): “Core inflation in India: measurement and policy perspectives”, Reserve Bank of India Occasional Papers, 20, 23-53.
Samanta G P and S Mitra (1998): “Recent divergence between wholesale and consumer prices in India - a statistical exploration”, Reserve bank of India Occasional Papers, 19, 329-344.
Sastry D V S, B Singh and K Bhattacharya (2001): “Monetary policy transmission from official interest rates to lending rates in India”, Mimeo, Reserve Bank of India.
Srimany A K and G P Samanta (1998): “Identification of monetary policy shock and its effects on output and price: a structural VAR approach”, Reserve Bank of India Occasional Papers, 19, 109-128.
Vasudevan A (1977): “Demand for money in India - a survey of literature”, Reserve Bank of India Occassional Papers, 2, 58-83.