Embed Size (px)
Citation preview
Mondelez International Inc - Climate Change 2019
C0. Introduction
C0.1
(C0.1) Give a general description and introduction to your organization.
Mondelēz International, Inc. (NASDAQ: MDLZ) empowers people to snack right in over 150 countries around the world. With 2018net revenues of approximately $26 billion, MDLZ is leading the future of snacking with iconic global and local brands such as Oreo,belVita and LU biscuits; Cadbury Dairy Milk , Milka and Toblerone chocolate; Sour Patch Kids candy and Trident gum. MondelēzInternational is a proud member of the Standard and Poor’s 500, Nasdaq 100 and Dow Jones Sustainability Index. Visitwww.mondelezinternational.com or follow the company on Twitter at www.twitter.com/MDLZ.
Our environmental policy is:
“Mondelēz International is committed to doing what is right for our planet and meeting the aspirations of our consumers every day.We aim to make an end-to-end positive impact on the world and the communities where we do business. This is core to who we areas a company. We are committed to: • Increasing the sustainable sourcing of ingredients used to make our much-loved brands; •Enhancing the efficient and sustainable use of resources along our supply chain; • Continuous improvement of our environmentalperformance driving measurable change; and • Meeting or exceeding the requirements of all applicable environmental laws andregulations. Accordingly, Mondelēz International expects all employees to carry out their job responsibilities in accordance with thisPolicy and to report any environmental concerns they have to management.”
Our iconic snacks bring people together and nourish life’s moments. In these simple moments, we want to have a meaningful impacton the lives of our consumers and the world. It’s why we are driven to live up to our purpose to empower people to snack right, andwhy our vision for impact is to lead the future of snacking by making snacks for both people and planet to love.
We understand that the way we live is changing the way we eat—people are more conscious of their health and well-being and areleading lives that are more complicated than ever before. And the world around us is also changing—we’re all more aware of theenvironmental impact of a growing global population on everything from deforestation and ocean plastics to climate change.
Our consumers shouldn’t have to choose between snacking and eating right. And they shouldn’t have to worry about the impact theirsnacking choices have on the world and their communities. We want them to be confident when they are choosing our brands, thatthey are choosing snacks made the right way. Which is why we’re committed to ensuring that snacking can be both sustainable andmindful. These twin priorities are the driving force of our 2025 Snacking Made Right Impact Strategy.
A key strategic goal for us is to Grow our Impact. As stated in our 10K Annual Report:
“A key strategic priority for us is to create a positive impact for people and our planet. Many of the challenges facing people and theplanet are interrelated, so we design our core programs and initiatives holistically by working to reduce our environmental footprint,supporting farmers who grow our key ingredients, helping people to snack mindfully and investing in healthy lifestyle communityprograms through the Mondelēz International Foundation. We continue to leverage our global operating scale to secure sustainableraw materials and work with suppliers to drive meaningful social and environmental changes, focusing where we can make thegreatest impact.”
CDP Page of 741
Our sustainability goals focus on reducing key end-to-end environmental impacts – from the field through distribution. We startedoperating as a new company at the end of 2012. With 2013 as our baseline, by 2020, our goals are to:
· Reduce absolute CO2 emissions from manufacturing by 15%. This aligns with current science-based targets approaches to supportthe global effort to limit climate change to less than 2ºC.
· Reduce absolute incoming water use in manufacturing, focusing on priority sites where water is most scarce. We aim for 10%reduction at priority sites.
· Reduce total manufacturing waste by 20%.
· Eliminate 65,000 tonnes of packaging, without contributing to food waste.
In addition, we have set the following sustainable agriculture goals:
• All chocolate brands will source their cocoa from Cocoa Life• Source 100% of our EU wheat need via Harmony by 2022• Maintain 100% RSPO palm oil
• 100% palm oil traceable to the mill from suppliers with aligned policies
• 100% cage-free eggs in US and Canada by 2020 and rest of the world by 2025 (except Russia, Ukraine and China, where supplychain is developing and requires a longer period to secure cage-free)
We will also implement deforestation interventions in key agriculture supply programs, such as Cocoa Life and our Palm Oil ActionPlan. As progress is made on the ground, we will publicly report the resulting end-to-end carbon footprint reduction.
Our focus on climate change is also consistent with our environmental policy, which is stated above.
C0.2
(C0.2) State the start and end date of the year for which you are reporting data.
Start date End date Indicate if you are providing emissions data for pastreporting years
Select the number of past reporting years you will be providingemissions data for
Row1
January 12018
December 312018
No <Not Applicable>
C0.3
(C0.3) Select the countries/regions for which you will be supplying data.ArgentinaAustraliaAustriaBahrainBelgiumBolivia (Plurinational State of)BrazilBulgariaCanadaChileChinaColombiaCosta Rica
CDP Page of 742
CroatiaCzechiaDenmarkDominican RepublicEcuadorEgyptEl SalvadorFinlandFranceGeorgiaGermanyGhanaGreeceGuatemalaHondurasHungaryIndiaIndonesiaIrelandIsraelItalyJapanKazakhstanLebanonLithuaniaMalaysiaMexicoMoroccoNetherlandsNicaraguaNigeriaNorwayPakistanPanamaPeruPhilippinesPolandPortugalPuerto RicoRomaniaRussian FederationSerbiaSingaporeSlovakiaSloveniaSouth AfricaSpainSwazilandSwedenSwitzerlandThailandTurkeyUkraineUnited Arab EmiratesUnited Kingdom of Great Britain and Northern IrelandUnited States of AmericaUruguayViet Nam
C0.4
CDP Page of 743
(C0.4) Select the currency used for all financial information disclosed throughout your response.USD
C0.5
(C0.5) Select the option that describes the reporting boundary for which climate-related impacts on your business are beingreported. Note that this option should align with your consolidation approach to your Scope 1 and Scope 2 greenhouse gasinventory.Operational control
C-AC0.6/C-FB0.6/C-PF0.6
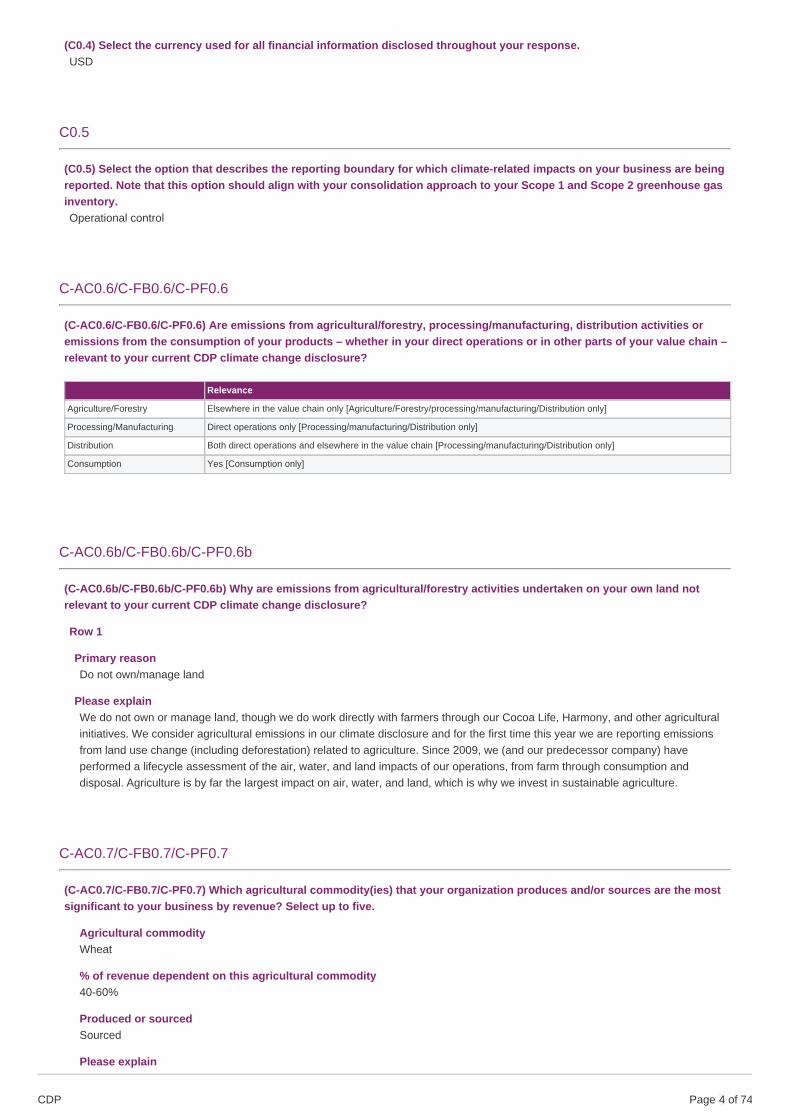
(C-AC0.6/C-FB0.6/C-PF0.6) Are emissions from agricultural/forestry, processing/manufacturing, distribution activities oremissions from the consumption of your products – whether in your direct operations or in other parts of your value chain –relevant to your current CDP climate change disclosure?
Relevance
Agriculture/Forestry Elsewhere in the value chain only [Agriculture/Forestry/processing/manufacturing/Distribution only]
Processing/Manufacturing Direct operations only [Processing/manufacturing/Distribution only]
Distribution Both direct operations and elsewhere in the value chain [Processing/manufacturing/Distribution only]
Consumption Yes [Consumption only]
C-AC0.6b/C-FB0.6b/C-PF0.6b
(C-AC0.6b/C-FB0.6b/C-PF0.6b) Why are emissions from agricultural/forestry activities undertaken on your own land notrelevant to your current CDP climate change disclosure?
Row 1
Primary reasonDo not own/manage land
Please explainWe do not own or manage land, though we do work directly with farmers through our Cocoa Life, Harmony, and other agriculturalinitiatives. We consider agricultural emissions in our climate disclosure and for the first time this year we are reporting emissionsfrom land use change (including deforestation) related to agriculture. Since 2009, we (and our predecessor company) haveperformed a lifecycle assessment of the air, water, and land impacts of our operations, from farm through consumption anddisposal. Agriculture is by far the largest impact on air, water, and land, which is why we invest in sustainable agriculture.
C-AC0.7/C-FB0.7/C-PF0.7
(C-AC0.7/C-FB0.7/C-PF0.7) Which agricultural commodity(ies) that your organization produces and/or sources are the mostsignificant to your business by revenue? Select up to five.
Agricultural commodityWheat
% of revenue dependent on this agricultural commodity40-60%
Produced or sourcedSourced
Please explain
CDP Page of 744
The percent of revenue is a rough estimate. We are reporting revenue from one or more of our product categories as outlined inour 2018 Form 10-K. For this CDP response, we are using the 10K reported revenue for a category if an estimated majority ofproducts in that category uses the selected commodity, even though not all the products in the category use the commodityselected in CDP. For wheat, the % is based on the approximately 43.1% of 2018 revenue attributable to our Biscuit categorybecause we use wheat in a majority of the products in that category, even though there are non-wheat products in the category andeven though wheat may be in products in other categories.
Agricultural commoditySugar
% of revenue dependent on this agricultural commodityMore than 80%
Produced or sourcedSourced
Please explainThe percent of revenue is a rough estimate. We are reporting revenue from one or more of our product categories as outlined inour 2018 Form 10-K. For this CDP response, we are using the 10K reported revenue for a category if an estimated majority ofproducts in that category uses the selected commodity, even though not all the products in the category use the commodityselected in CDP. For sugar, the % is based on the approximately 92.6% of 2018 revenue attributable to our Chocolate, Biscuits,Gum and Candy, and Beverages categories, even though there are non-sugar products in the category and even though sugarmay be in products in other categories.
Agricultural commodityOther, please specify (Cocoa)
% of revenue dependent on this agricultural commodity20-40%
Produced or sourcedSourced
Please explainThe percent of revenue is a rough estimate. We are reporting revenue from one or more of our product categories as outlined inour 2018 Form 10-K. For this CDP response, we are using the 10K reported revenue for a category if an estimated majority ofproducts in that category uses the selected commodity, even though not all the products in the category use the commodityselected in CDP. For cocoa, the % is based on the approximately 31.5% of 2018 revenue attributable to our Chocolate categorybecause we use cocoa in all (or almost all) of the products in that category, even though cocoa may be in products in othercategories.
Agricultural commodityPalm Oil
% of revenue dependent on this agricultural commodity60-80%
Produced or sourcedSourced
Please explainThe percent of revenue is a rough estimate. We are reporting revenue from one or more of our product categories as outlined inour 2018 Form 10-K. For this CDP response, we are using the 10K reported revenue for a category if an estimated majority ofproducts in that category uses the selected commodity, even though not all the products in the category use the commodityselected in CDP. For palm oil, the % is based on the approximately 74.6% of 2018 revenue attributable to our Biscuit and Chocolatecategories because we use palm oil in many of the products in those categories, even though there are non-palm oil products inthe category and even though palm oil may be in products in other categories.
C1. Governance
CDP Page of 745
C1.1
(C1.1) Is there board-level oversight of climate-related issues within your organization?Yes
C1.1a
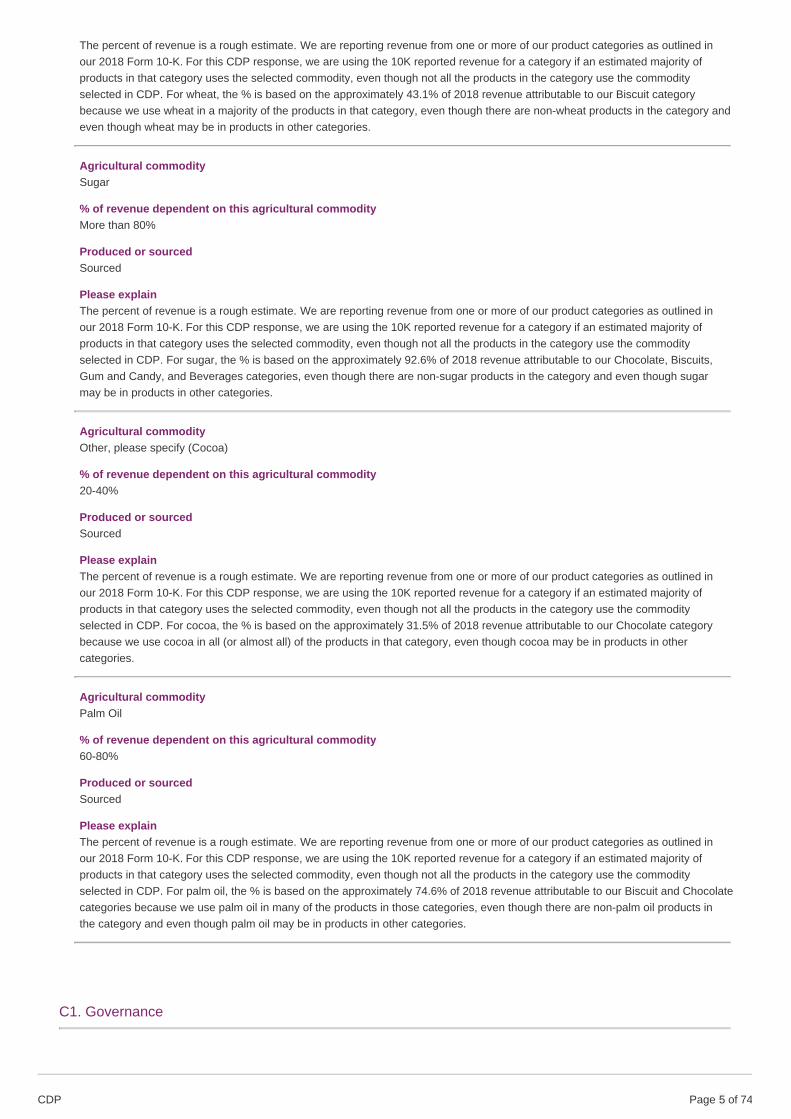
(C1.1a) Identify the position(s) (do not include any names) of the individual(s) on the board with responsibility for climate-related issues.
Position ofindividual(s)
Please explain
Board-levelcommittee
The Governance, Membership and Public Affairs Committee (“Governance Committee”) of our Board of Directors is responsible for overseeingsustainability as part of our Snacking Made Right Impact Strategy, with regular briefings from our VP and Chief of Global Impact (CSO per CDPcategories).
ChiefExecutiveOfficer(CEO)
Our CEO is engaged in the review and progress of our Snacking Made Right Impact Strategy in conjunction with the Governance, Membership andPublic Affairs Committee (“Governance Committee”) of our Board of Directors, which is responsible for overseeing sustainability as part of ourSnacking Made Right Impact Strategy, with regular briefings from our VP and Chief of Global Impact. We take a comprehensive approach tosustainability, integrating it throughout our business processes. Our sustainability goals are part of our strategic planning process, and therefore,progress and key activities are regularly reported to the Board and the business unit leadership teams. CO2 and energy are key focus areas in oursustainability strategy. See C1.2a.
ChiefSustainabilityOfficer(CSO)
Our VP and Chief of Global Impact (CSO) chairs a cross-functional Impact Steering Committee (ISC) with members from our key global functionsand regions to manage our strategy. Our CSO reports on sust to our CEO and the Governance Committee. A working team led by our Dir, GlobalSustainability, who reports to the CSO, recommends sust strategy and goals, oversees implementation and reporting, and is accountable to the ISC.Executive sponsorship is provided by our EVP & General Counsel, EVP Research Development and Quality, and EVP and Region President MDLZEurope. Clear business goals were set as part of the sust strategy led by our CSO. In addition, each business unit (BU) is responsible for integratingsust into their strategic plans, including our operational goals such as CO2 reduction. The BUs are responsible for developing a plan that will enablethem to deliver performance that will contribute to the overall corporate sustainability strategy.
Chief RiskOfficer(CRO)
Our VP & Chief of Global Governance and Corporate Secretary (Chief Risk Officer) is responsible for our Enterprise Risk Management (ERM)process. See our response in Section 2.2a for more information about our ERM process.
C1.1b
(C1.1b) Provide further details on the board’s oversight of climate-related issues.
Frequency with whichclimate-related issuesare a scheduled agendaitem
Governance mechanisms intowhich climate-related issuesare integrated
Please explain
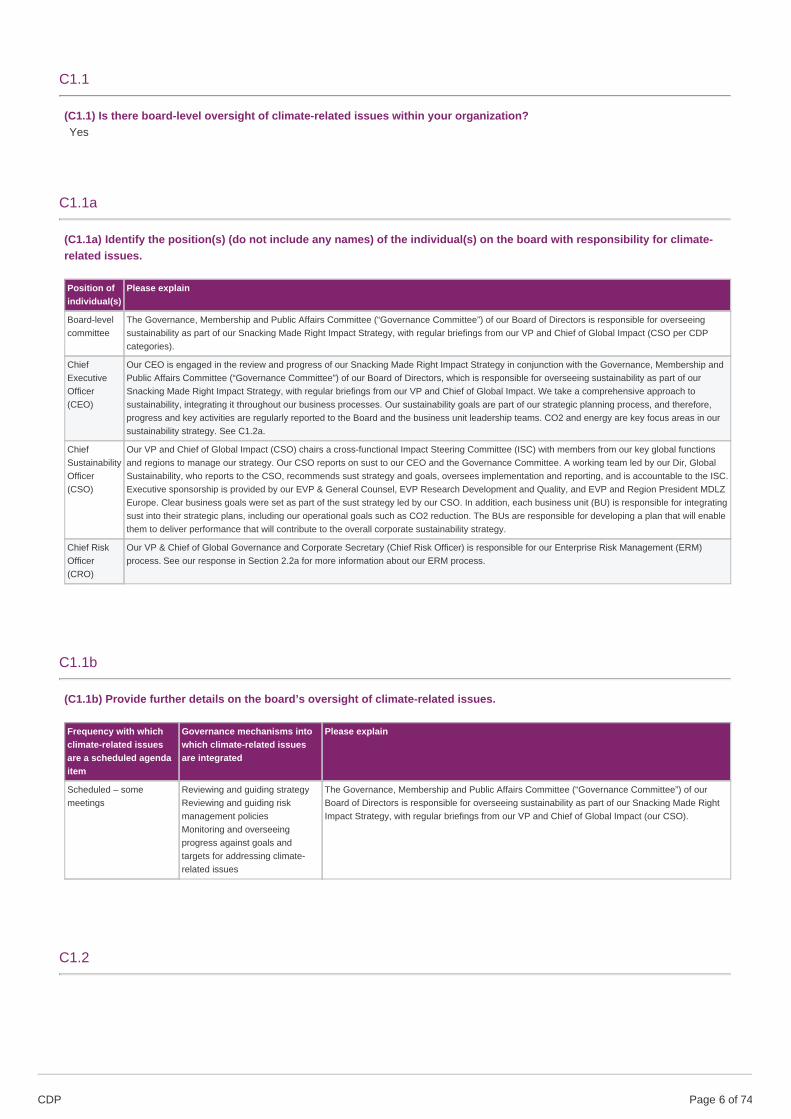
Scheduled – somemeetings
Reviewing and guiding strategyReviewing and guiding riskmanagement policiesMonitoring and overseeingprogress against goals andtargets for addressing climate-related issues
The Governance, Membership and Public Affairs Committee (“Governance Committee”) of ourBoard of Directors is responsible for overseeing sustainability as part of our Snacking Made RightImpact Strategy, with regular briefings from our VP and Chief of Global Impact (our CSO).
C1.2
CDP Page of 746
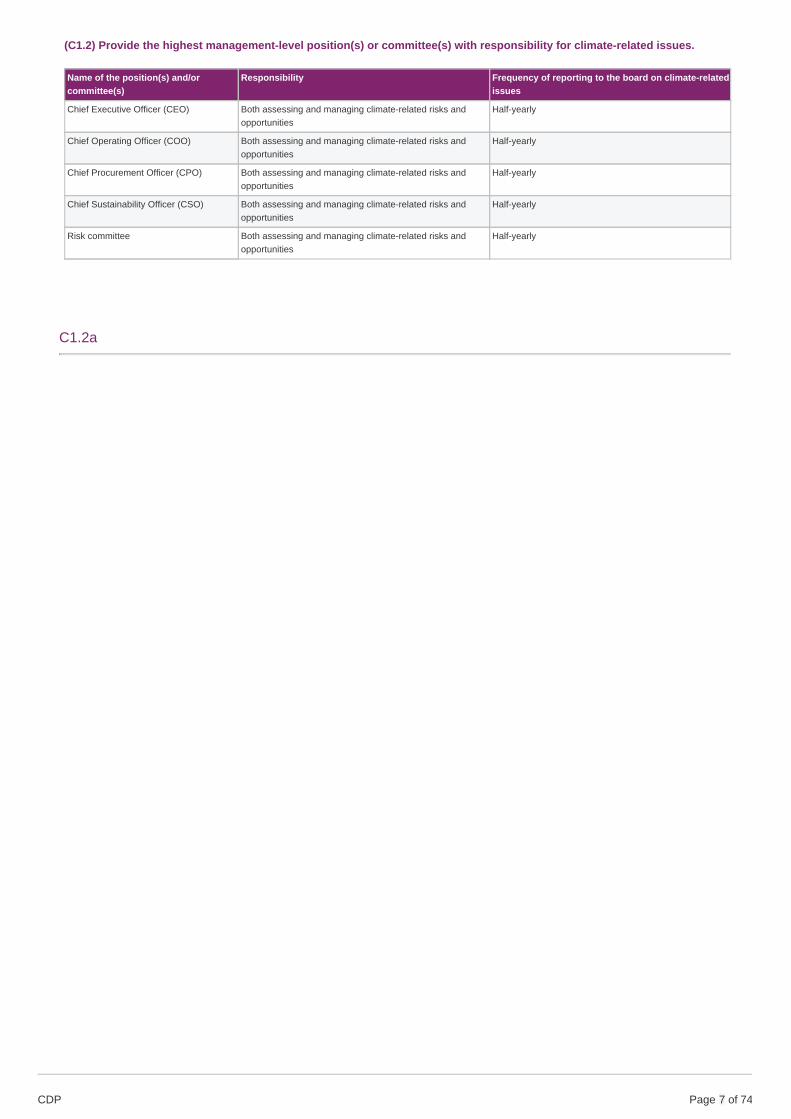
(C1.2) Provide the highest management-level position(s) or committee(s) with responsibility for climate-related issues.
Name of the position(s) and/orcommittee(s)
Responsibility Frequency of reporting to the board on climate-relatedissues
Chief Executive Officer (CEO) Both assessing and managing climate-related risks andopportunities
Half-yearly
Chief Operating Officer (COO) Both assessing and managing climate-related risks andopportunities
Half-yearly
Chief Procurement Officer (CPO) Both assessing and managing climate-related risks andopportunities
Half-yearly
Chief Sustainability Officer (CSO) Both assessing and managing climate-related risks andopportunities
Half-yearly
Risk committee Both assessing and managing climate-related risks andopportunities
Half-yearly
C1.2a
CDP Page of 747
(C1.2a) Describe where in the organizational structure this/these position(s) and/or committees lie, what their associatedresponsibilities are, and how climate-related issues are monitored (do not include the names of individuals).
For Mondelēz International, sustainability is part of our Snacking Made Right Impact Strategy. Our consumers shouldn’t have tochoose between snacking and eating right. And they shouldn’t have to worry about the impact their snacking choices have on theworld and their communities. We want them to be confident when they are choosing our brands, that they are choosing snacks madethe right way. Which is why we’re committed to ensuring that snacking can be both sustainable and mindful. These twin priorities arethe driving force of our 2025 Snacking Made Right Impact Strategy.
We take a comprehensive approach to the strategy, integrating it throughout our business processes at every level of theorganization. To ensure the strategy has high-level direction and endorsement, our CEO is engaged in the review and progress of thestrategy in conjunction with the Governance, Membership and Public Affairs Committee (Governance Committee) of our Board ofDirectors, which is responsible for overseeing sustainability as part of our Snacking Made Right Strategy, with regular briefings fromour VP and Chief of Global Impact (CSO).
Our strategy is managed by a cross-functional Impact Steering Committee (ISC) with members from our key global functions andregions, chaired by the VP and Chief of Global Impact (CSO) who, in turn, reports on sust to our CEO and the GovernanceCommittee. The ISC meets quarterly to review progress and to align on key developments in the Impact strategy. Executivesponsorship is provided by our EVP & General Counsel, EVP Research Development and Quality, and EVP and Region PresidentMDLZ Europe. A working team led by our Dir, Global Sustainability, who reports to the CSO, recommends sust strategy and goals,oversees implementation and reporting, and is accountable to the Impact Steering Committee.
Our Risk Committee reviews sustainability as part of the annual ERM process to identify key risks facing the organisation, strategiesto manage the risk and assign ownership to senior leaders. Sustainability risks are identified during this review, as reported in our10k Annual Report and discussed in our answers to question C2.2.
Our sustainability goals are part of our strategic planning process, and therefore, progress and key activities are regularly reported tothe Board and the business unit leadership teams. CO2 and hence energy are key focus areas in our sustainability strategy.
In 2015, established new 2020 sustainability goals that placed us at the forefront of the fight against climate change and support ourambition to be the leader in well-being snacks while driving down costs and creating efficiencies to accelerate our growth. Weadopted science-based targets to reduce absolute CO2 emissions from manufacturing as part of our ambitious end-to-end approach.This represents a transition from normalized (to production) targets to an absolute target. We also implement deforestationinterventions in key agriculture supply programs, such as Cocoa Life and our Palm Oil Action Plan. This year, we are reporting land-use change impacts to establish a baseline to track and report the resulting emissions reductions.
Clear business goals have been set as part of the sustainability strategy led by the CSO. In addition, each business unit isresponsible for integrating sustainability into their strategic plans, including our operational goals such as CO2 reduction. They areresponsible for developing a plan that will enable them to deliver sustainability performance that will contribute to the overall corporatesustainability goals.
C1.3
(C1.3) Do you provide incentives for the management of climate-related issues, including the attainment of targets?Yes
C1.3a
CDP Page of 748
(C1.3a) Provide further details on the incentives provided for the management of climate-related issues (do not include thenames of individuals).
Who is entitled to benefit from these incentives?All employees
Types of incentivesRecognition (non-monetary)
Activity incentivizedEmissions reduction project
CommentOur CEO and other members of our executive team (MLT) are accountable for delivering including Impact goals, including CO2emissions reduction and supply chain engagement. For non-monetary: Each business unit has sustainability on their strategic planand is held accountable. Therefore, incentives come in the form of internal recognition (publicly recognized by the CEO orhighlighted with the Board, etc.) and external recognition (press releases, customers, etc.), which can drive incremental business.In 2017, we launched a Smart Sustainability Competition asking employees to propose ideas to reduce our environmental impactand save money. The competition was a great success, with winning ideas recognized in regional and global internalcommunications during Q2 of 2018. The KPIs can include emissions reduction, energy reduction, efficiency, purchasing, and/orsupply chain engagement.
Who is entitled to benefit from these incentives?All employees
Types of incentivesMonetary reward
Activity incentivizedEmissions reduction target
CommentOur CEO and other members of our executive team (MLT) are accountable for delivering on key goals, including Grow Impactgoals, which include CO2 emissions reduction and supply chain engagement regarding sustainable agriculture
C2. Risks and opportunities
C2.1
(C2.1) Describe what your organization considers to be short-, medium- and long-term horizons.
From(years)
To(years)
Comment
Short-term
0 1 Our short-term climate-related and financial goals are aligned (i.e., both look to one year ahead). Our programs related to climatechange look at yearly goals to address longer-term issues. For finances, we also consider up to one year to be a short-term issue.
Medium-term
1 6 For medium-term, our climate-related and financial reviews are different. The numbers provided here for the time horizon are for climate-related issues. For climate-related issues, we currently consider medium-term risks/opportunities to be those that may arise betweenone to six years ahead. This aligns with our 2025 goals, which address longer-term climate-related issues. See pages 43-45 of our 2018Progress Report (athttps://www.mondelezinternational.com/~/media/MondelezCorporate/uploads/downloads/2018_Impact_Progress_Report.pdf). Forfinancial issues, we consider medium-term risks/opportunities to be those that may arise between one to three years ahead. Weaddress these financial risks with our strategic planning.
Long-term
6 30 For long-term, our climate-related and financial reviews are different. The numbers provided here for the time horizon are for climate-related issues. For climate-related issues, we consider potential effects to thirty years and beyond. As an example, our goal to reduceCO2 in manufacturing aligns with current approaches to setting science-based targets to support the global effort to limit climate changeto less than 2ºC, which take a long-term approach. For finances, as a general matter, our long-term horizon is three to ten years,depending on the issue.
CDP Page of 749
C2.2
(C2.2) Select the option that best describes how your organization's processes for identifying, assessing, and managingclimate-related issues are integrated into your overall risk management.Integrated into multi-disciplinary company-wide risk identification, assessment, and management processes
C2.2a
(C2.2a) Select the options that best describe your organization's frequency and time horizon for identifying and assessingclimate-related risks.
Frequencyofmonitoring
How far intothe futureare risksconsidered?
Comment
Row1
Six-monthlyor morefrequently
>6 years We have a robust Enterprise Risk Management (ERM) process for identifying, measuring, monitoring, and managing risks, withoversight by the Risk and Compliance Committee (MRCC), which reports annually to the Audit Committee. The executivesponsors of the MRCC are the EVP and Chief Financial Officer, and the EVP and General Counsel. The purpose of the MRCC isto manage our process to identify and assess the most significant inherent risks to us so we may adequately mitigate them and/ormonitor them across the company. All identified risks are vetted by the MRCC and remain under the MRCC’s governance.Ownership of specific risks is assigned at the Leadership Team (MLT) level (MLT members report directly to the CEO). As ownersof each specific risk, MLT members are responsible for verifying that appropriate mitigation controls and monitoring systems arein place. The risk universe considered during this process is wide and varied. Climate change is included in this risk universe.
C2.2b
(C2.2b) Provide further details on your organization’s process(es) for identifying and assessing climate-related risks.
As described in table 2.2a, we have a robust enterprise risk management (ERM) process for identifying, measuring, monitoring, andmanaging risks. The risk universe considered during this process is wide and varied; it includes climate change. The ERM process isoverseen by the Risk and Compliance Committee (MRCC), which annually reports to the Board of Director’s Audit Committee. Thepurpose of the MRCC is to manage our process to identify and assess the most significant inherent risks to us so we may adequatelymitigate them and/or monitor them across the company. All identified risks are vetted by the MRCC and remain under the MRCC’sgovernance. Ownership of specific risks is assigned at the Leadership Team (MLT) level (MLT members report directly to the CEO).As owners of each specific risk, MLT members are responsible for verifying that appropriate mitigation controls and monitoringsystems are in place. We have a standalone ERM risk category for Environmental & Social Sustainability. Thus, for climate-relatedrisks and opportunities identified as part of the ERM process, MLT members are responsible for verifying controls and monitoringsystems to address the risks/opportunities.
In addition, our VP and Chief of Global Impact (our CSO) updates our Board’s Governance, Membership and Public AffairsCommittee (the “Governance Committee”) twice a year. The CSO chairs a cross-functional Impact Steering Committee (ISC) withmembers from our key global functions and regions to manage our strategy. Our CSO reports on sustainability, including climatechange risks and how we manage them, to our CEO and the Governance Committee. A working team led by our Director, GlobalSustainability, who reports to our CSO, recommends sustainability strategy and goals, oversees implementation and reporting, and isaccountable to the ISC, which has executive sponsors. See C1.2 for more information.
Each business unit (BU) is responsible for integrating sustainability into their strategic plans, including our operational goals such asCO2 reduction and other climate-related operational goals. The BUs are responsible for developing a plan that will enable them todeliver performance that will contribute to the overall corporate sustainability strategy.
Our sustainability goals are a key way in which we manage our climate-related risks. We had set goals for 2020 which includeclimate-related goals (including a resilient ingredient supply chain and carbon reductions from our operations) and have since set a
CDP Page of 7410
new strategy for 2025 to continue our focus on these areas. .
In addition, we publicly describe our approach to assess materiality for sustainability issues in our Impact for Growth progress report.In our 2018 report at page 42, we state:
“Materiality: The areas of action outlined in our impact ambition define our concept of materiality for social and environmentalpurposes. As a global snacks powerhouse, our worldwide reach and leadership position enable us to bring together diverse voicesand identify new ideas to drive meaningful change on issues central to our business and our world. Our Board actively oversees ourconcept of materiality for social and environmental purposes.
Since 2012, we have worked with internal and external experts to review the impact of major societal issues on our business andshape our strategic responses to them. This includes representatives from our internal Global Growth Council and Impact SteeringCommittee, as well as from our region business units and global functions. External experts include World Wildlife Fund, Quantis andvarious investment groups. In addition, we consider perspectives from our ongoing stakeholder engagement, as well as participationin various shareholder indices.
Materials and processes that guide our assessment include our Enterprise Risk Management (ERM) program for identifying,measuring, monitoring and managing risks; external affairs analysis of stakeholder and regulatory issues; the greenhouse gas, landand water footprint of our total company; proprietary consumer insight data; and publicly available data on societal issues, includingstatistics and reports from authorities, NGOs and peer companies.
Below are the top environmental* and social issues
1 Consumer well-being—promote improved health and well-being through portfolio enhancements and community partnerships
2 Supply security of key agricultural commodities and social challenges in supply chain
3 Environmental footprint of agriculture and our operations
4 Safety of our people and products
* We refer to our major environmental challenges collectively as the sustainability
of resources and agriculture.”
C2.2c
CDP Page of 7411
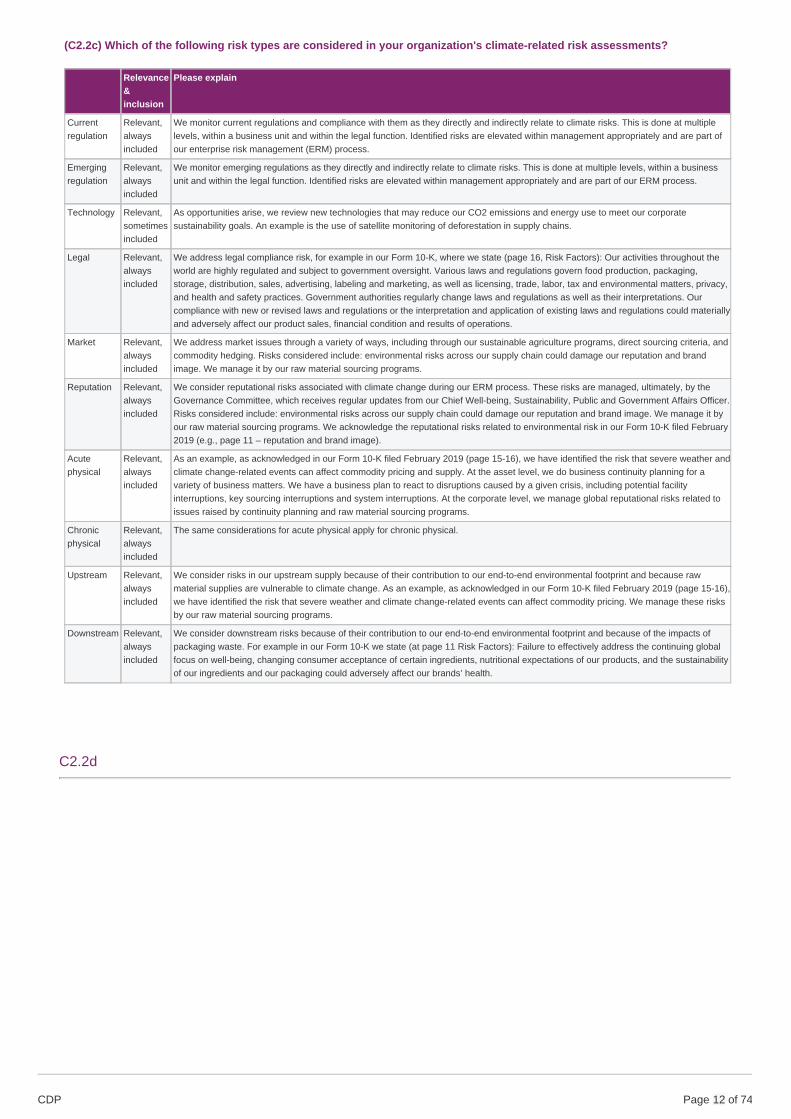
(C2.2c) Which of the following risk types are considered in your organization's climate-related risk assessments?
Relevance&inclusion
Please explain
Currentregulation
Relevant,alwaysincluded
We monitor current regulations and compliance with them as they directly and indirectly relate to climate risks. This is done at multiplelevels, within a business unit and within the legal function. Identified risks are elevated within management appropriately and are part ofour enterprise risk management (ERM) process.
Emergingregulation
Relevant,alwaysincluded
We monitor emerging regulations as they directly and indirectly relate to climate risks. This is done at multiple levels, within a businessunit and within the legal function. Identified risks are elevated within management appropriately and are part of our ERM process.
Technology Relevant,sometimesincluded
As opportunities arise, we review new technologies that may reduce our CO2 emissions and energy use to meet our corporatesustainability goals. An example is the use of satellite monitoring of deforestation in supply chains.
Legal Relevant,alwaysincluded
We address legal compliance risk, for example in our Form 10-K, where we state (page 16, Risk Factors): Our activities throughout theworld are highly regulated and subject to government oversight. Various laws and regulations govern food production, packaging,storage, distribution, sales, advertising, labeling and marketing, as well as licensing, trade, labor, tax and environmental matters, privacy,and health and safety practices. Government authorities regularly change laws and regulations as well as their interpretations. Ourcompliance with new or revised laws and regulations or the interpretation and application of existing laws and regulations could materiallyand adversely affect our product sales, financial condition and results of operations.
Market Relevant,alwaysincluded
We address market issues through a variety of ways, including through our sustainable agriculture programs, direct sourcing criteria, andcommodity hedging. Risks considered include: environmental risks across our supply chain could damage our reputation and brandimage. We manage it by our raw material sourcing programs.
Reputation Relevant,alwaysincluded
We consider reputational risks associated with climate change during our ERM process. These risks are managed, ultimately, by theGovernance Committee, which receives regular updates from our Chief Well-being, Sustainability, Public and Government Affairs Officer.Risks considered include: environmental risks across our supply chain could damage our reputation and brand image. We manage it byour raw material sourcing programs. We acknowledge the reputational risks related to environmental risk in our Form 10-K filed February2019 (e.g., page 11 – reputation and brand image).
Acutephysical
Relevant,alwaysincluded
As an example, as acknowledged in our Form 10-K filed February 2019 (page 15-16), we have identified the risk that severe weather andclimate change-related events can affect commodity pricing and supply. At the asset level, we do business continuity planning for avariety of business matters. We have a business plan to react to disruptions caused by a given crisis, including potential facilityinterruptions, key sourcing interruptions and system interruptions. At the corporate level, we manage global reputational risks related toissues raised by continuity planning and raw material sourcing programs.
Chronicphysical
Relevant,alwaysincluded
The same considerations for acute physical apply for chronic physical.
Upstream Relevant,alwaysincluded
We consider risks in our upstream supply because of their contribution to our end-to-end environmental footprint and because rawmaterial supplies are vulnerable to climate change. As an example, as acknowledged in our Form 10-K filed February 2019 (page 15-16),we have identified the risk that severe weather and climate change-related events can affect commodity pricing. We manage these risksby our raw material sourcing programs.
Downstream Relevant,alwaysincluded
We consider downstream risks because of their contribution to our end-to-end environmental footprint and because of the impacts ofpackaging waste. For example in our Form 10-K we state (at page 11 Risk Factors): Failure to effectively address the continuing globalfocus on well-being, changing consumer acceptance of certain ingredients, nutritional expectations of our products, and the sustainabilityof our ingredients and our packaging could adversely affect our brands’ health.
C2.2d
CDP Page of 7412
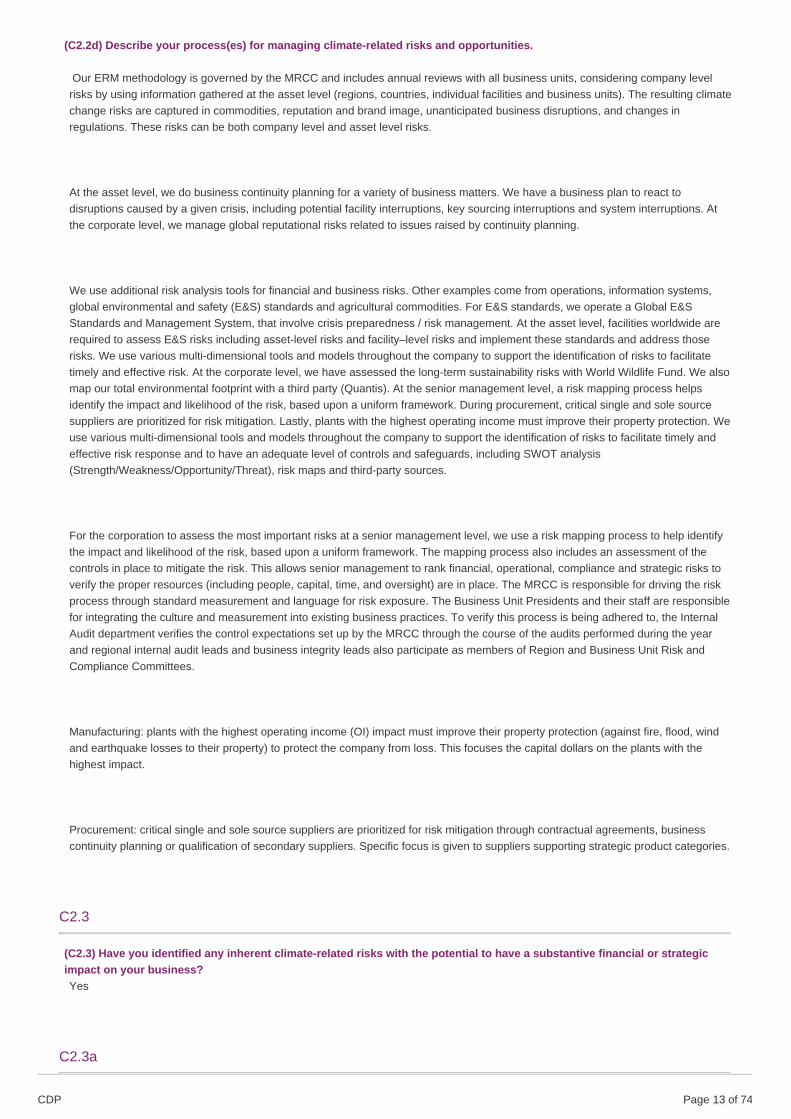
(C2.2d) Describe your process(es) for managing climate-related risks and opportunities.
Our ERM methodology is governed by the MRCC and includes annual reviews with all business units, considering company levelrisks by using information gathered at the asset level (regions, countries, individual facilities and business units). The resulting climatechange risks are captured in commodities, reputation and brand image, unanticipated business disruptions, and changes inregulations. These risks can be both company level and asset level risks.
At the asset level, we do business continuity planning for a variety of business matters. We have a business plan to react todisruptions caused by a given crisis, including potential facility interruptions, key sourcing interruptions and system interruptions. Atthe corporate level, we manage global reputational risks related to issues raised by continuity planning.
We use additional risk analysis tools for financial and business risks. Other examples come from operations, information systems,global environmental and safety (E&S) standards and agricultural commodities. For E&S standards, we operate a Global E&SStandards and Management System, that involve crisis preparedness / risk management. At the asset level, facilities worldwide arerequired to assess E&S risks including asset-level risks and facility–level risks and implement these standards and address thoserisks. We use various multi-dimensional tools and models throughout the company to support the identification of risks to facilitatetimely and effective risk. At the corporate level, we have assessed the long-term sustainability risks with World Wildlife Fund. We alsomap our total environmental footprint with a third party (Quantis). At the senior management level, a risk mapping process helpsidentify the impact and likelihood of the risk, based upon a uniform framework. During procurement, critical single and sole sourcesuppliers are prioritized for risk mitigation. Lastly, plants with the highest operating income must improve their property protection. Weuse various multi-dimensional tools and models throughout the company to support the identification of risks to facilitate timely andeffective risk response and to have an adequate level of controls and safeguards, including SWOT analysis(Strength/Weakness/Opportunity/Threat), risk maps and third-party sources.
For the corporation to assess the most important risks at a senior management level, we use a risk mapping process to help identifythe impact and likelihood of the risk, based upon a uniform framework. The mapping process also includes an assessment of thecontrols in place to mitigate the risk. This allows senior management to rank financial, operational, compliance and strategic risks toverify the proper resources (including people, capital, time, and oversight) are in place. The MRCC is responsible for driving the riskprocess through standard measurement and language for risk exposure. The Business Unit Presidents and their staff are responsiblefor integrating the culture and measurement into existing business practices. To verify this process is being adhered to, the InternalAudit department verifies the control expectations set up by the MRCC through the course of the audits performed during the yearand regional internal audit leads and business integrity leads also participate as members of Region and Business Unit Risk andCompliance Committees.
Manufacturing: plants with the highest operating income (OI) impact must improve their property protection (against fire, flood, windand earthquake losses to their property) to protect the company from loss. This focuses the capital dollars on the plants with thehighest impact.
Procurement: critical single and sole source suppliers are prioritized for risk mitigation through contractual agreements, businesscontinuity planning or qualification of secondary suppliers. Specific focus is given to suppliers supporting strategic product categories.
C2.3
(C2.3) Have you identified any inherent climate-related risks with the potential to have a substantive financial or strategicimpact on your business?Yes
C2.3a
CDP Page of 7413
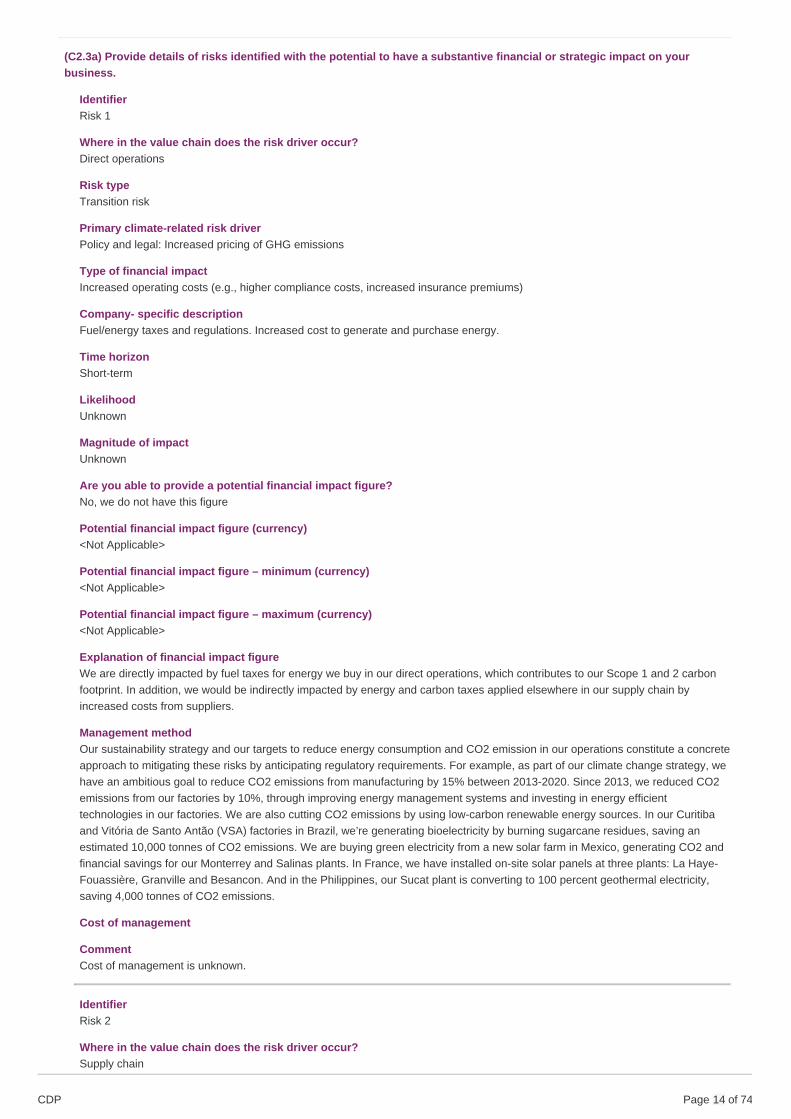
(C2.3a) Provide details of risks identified with the potential to have a substantive financial or strategic impact on yourbusiness.
IdentifierRisk 1
Where in the value chain does the risk driver occur?Direct operations
Risk typeTransition risk
Primary climate-related risk driverPolicy and legal: Increased pricing of GHG emissions
Type of financial impactIncreased operating costs (e.g., higher compliance costs, increased insurance premiums)
Company- specific descriptionFuel/energy taxes and regulations. Increased cost to generate and purchase energy.
Time horizonShort-term
LikelihoodUnknown
Magnitude of impactUnknown
Are you able to provide a potential financial impact figure?No, we do not have this figure
Potential financial impact figure (currency)<Not Applicable>
Potential financial impact figure – minimum (currency)<Not Applicable>
Potential financial impact figure – maximum (currency)<Not Applicable>
Explanation of financial impact figureWe are directly impacted by fuel taxes for energy we buy in our direct operations, which contributes to our Scope 1 and 2 carbonfootprint. In addition, we would be indirectly impacted by energy and carbon taxes applied elsewhere in our supply chain byincreased costs from suppliers.
Management methodOur sustainability strategy and our targets to reduce energy consumption and CO2 emission in our operations constitute a concreteapproach to mitigating these risks by anticipating regulatory requirements. For example, as part of our climate change strategy, wehave an ambitious goal to reduce CO2 emissions from manufacturing by 15% between 2013-2020. Since 2013, we reduced CO2emissions from our factories by 10%, through improving energy management systems and investing in energy efficienttechnologies in our factories. We are also cutting CO2 emissions by using low-carbon renewable energy sources. In our Curitibaand Vitória de Santo Antão (VSA) factories in Brazil, we’re generating bioelectricity by burning sugarcane residues, saving anestimated 10,000 tonnes of CO2 emissions. We are buying green electricity from a new solar farm in Mexico, generating CO2 andfinancial savings for our Monterrey and Salinas plants. In France, we have installed on-site solar panels at three plants: La Haye-Fouassière, Granville and Besancon. And in the Philippines, our Sucat plant is converting to 100 percent geothermal electricity,saving 4,000 tonnes of CO2 emissions.
Cost of management
CommentCost of management is unknown.
IdentifierRisk 2
Where in the value chain does the risk driver occur?Supply chain
CDP Page of 7414
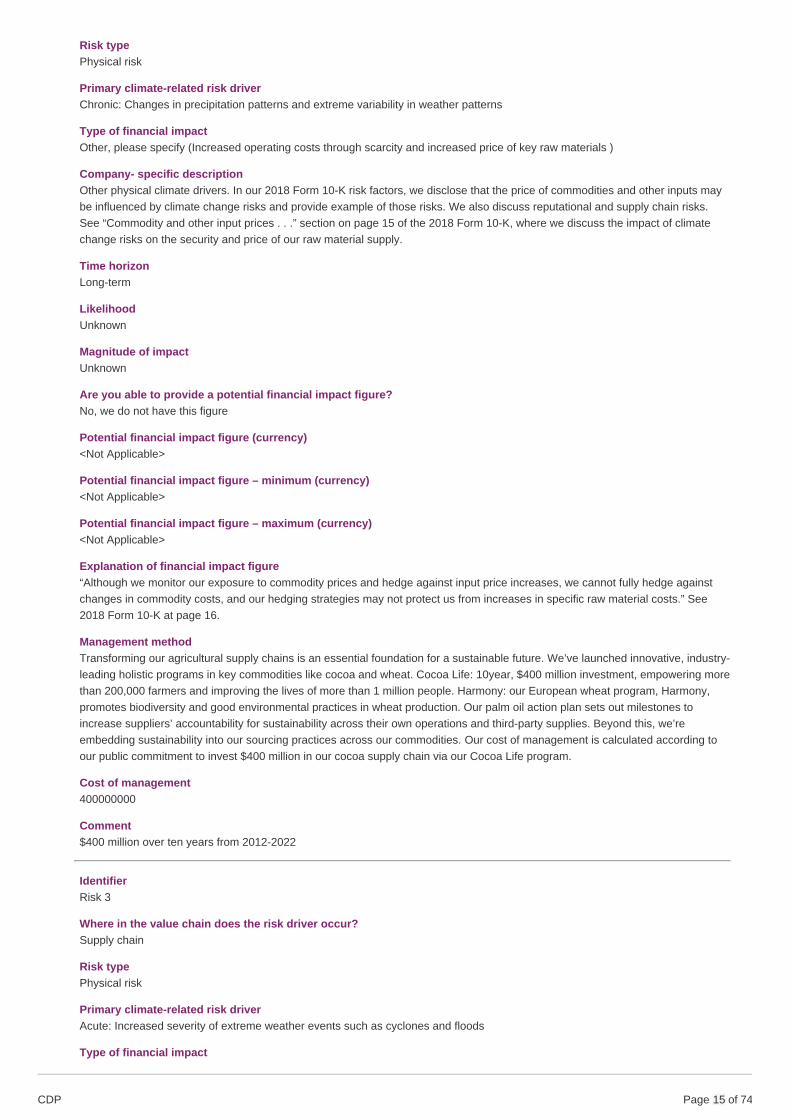
Risk typePhysical risk
Primary climate-related risk driverChronic: Changes in precipitation patterns and extreme variability in weather patterns
Type of financial impactOther, please specify (Increased operating costs through scarcity and increased price of key raw materials )
Company- specific descriptionOther physical climate drivers. In our 2018 Form 10-K risk factors, we disclose that the price of commodities and other inputs maybe influenced by climate change risks and provide example of those risks. We also discuss reputational and supply chain risks.See “Commodity and other input prices . . .” section on page 15 of the 2018 Form 10-K, where we discuss the impact of climatechange risks on the security and price of our raw material supply.
Time horizonLong-term
LikelihoodUnknown
Magnitude of impactUnknown
Are you able to provide a potential financial impact figure?No, we do not have this figure
Potential financial impact figure (currency)<Not Applicable>
Potential financial impact figure – minimum (currency)<Not Applicable>
Potential financial impact figure – maximum (currency)<Not Applicable>
Explanation of financial impact figure“Although we monitor our exposure to commodity prices and hedge against input price increases, we cannot fully hedge againstchanges in commodity costs, and our hedging strategies may not protect us from increases in specific raw material costs.” See2018 Form 10-K at page 16.
Management methodTransforming our agricultural supply chains is an essential foundation for a sustainable future. We’ve launched innovative, industry-leading holistic programs in key commodities like cocoa and wheat. Cocoa Life: 10year, $400 million investment, empowering morethan 200,000 farmers and improving the lives of more than 1 million people. Harmony: our European wheat program, Harmony,promotes biodiversity and good environmental practices in wheat production. Our palm oil action plan sets out milestones toincrease suppliers’ accountability for sustainability across their own operations and third-party supplies. Beyond this, we’reembedding sustainability into our sourcing practices across our commodities. Our cost of management is calculated according toour public commitment to invest $400 million in our cocoa supply chain via our Cocoa Life program.
Cost of management400000000
Comment$400 million over ten years from 2012-2022
IdentifierRisk 3
Where in the value chain does the risk driver occur?Supply chain
Risk typePhysical risk
Primary climate-related risk driverAcute: Increased severity of extreme weather events such as cyclones and floods
Type of financial impact
CDP Page of 7415
Reduced revenue from decreased production capacity (e.g., transport difficulties, supply chain interruptions)
Company- specific descriptionChange in precipitation extremes and droughts. In addition, localized episodic extreme weather events such as floods and severestorms have the potential to temporarily disrupt Mondelēz International’s business operations (including raw material sourcing,manufacturing and product distribution) in affected areas.
Time horizonUnknown
LikelihoodUnknown
Magnitude of impactUnknown
Are you able to provide a potential financial impact figure?No, we do not have this figure
Potential financial impact figure (currency)<Not Applicable>
Potential financial impact figure – minimum (currency)<Not Applicable>
Potential financial impact figure – maximum (currency)<Not Applicable>
Explanation of financial impact figureWe are directly impacted by disruption in our supply chain through potential loss of revenue if we are unable to produce anddistribute our snacks and through exceptional management costs during special situations. Due to the unpredictable nature andlocation of extreme weather events, these costs are hard to predict with accuracy in advance.
Management methodWe have in place several protocols, including special situations management and emergency preparedness and responseprocedures. These allow us to address and help mitigate adverse effects.
Cost of management
CommentCost of management is unkown.
IdentifierRisk 4
Where in the value chain does the risk driver occur?Customer
Risk typeTransition risk
Primary climate-related risk driverReputation: Shifts in consumer preferences
Type of financial impactReduced revenue from decreased demand for goods/services
Company- specific descriptionChanging consumer behavior. In our 2018 Form 10-K, we acknowledge that “Failure to effectively address the continuing globalfocus on … the sustainability of our ingredients and our packaging could adversely affect our brands’ health. Increased attentionfrom the media, shareholders, activists and other stakeholders in these areas as well as on the role of food marketing couldadversely affect our brand image..” See 2018 Form 10-K at 11.
Time horizonUnknown
LikelihoodUnknown
Magnitude of impact
CDP Page of 7416
Unknown
Are you able to provide a potential financial impact figure?No, we do not have this figure
Potential financial impact figure (currency)<Not Applicable>
Potential financial impact figure – minimum (currency)<Not Applicable>
Potential financial impact figure – maximum (currency)<Not Applicable>
Explanation of financial impact figureConsumer expect brands to address sustainability issues and this leads to a risk of consumer rejection for brands that do notmanage sustainability effectively, leading to potential loss of revenue. Increasingly, these risks are seen in markets across theworld and among mainstream consumers.
Management methodTo stay abreast of evolving consumer attitudes regarding climate change we include questions related to sustainability in analysesof consumer attitudes and preferences. To avoid misleading marketing claims, we've developed a set of internal guidelines onenvironmental claims to guide the business in making the right decisions when considering these types of claims. With regard toland use/ deforestation, we have engaged with suppliers, NGOs and the Consumer Goods Forum and, in specific cases, supportedcertain sustainability standards for commodities. Examples include our actions to address deforestation via our Palm Oil ActionPlan.
Cost of management
CommentCost of management is unknown.
C2.4
(C2.4) Have you identified any climate-related opportunities with the potential to have a substantive financial or strategicimpact on your business?Yes
C2.4a
(C2.4a) Provide details of opportunities identified with the potential to have a substantive financial or strategic impact onyour business.
IdentifierOpp1
Where in the value chain does the opportunity occur?Supply Chain
Opportunity typeResilience
Primary climate-related opportunity driverOther
Type of financial impactIncreased reliability of supply chain and ability to operate under various conditions
Company-specific descriptionIn our 2018 Form 10-K risk factors, we disclose that the price of commodities and other inputs may be influenced by climate changerisks and provide example of those risks. We also discuss reputational and supply chain risks. See “Commodity and other inputprices . . .” section on page 15 of the 2018 Form 10-K. By implementing sustainable agriculture programs, we help our supplychains to mitigate their emissions and to become more resilient to the effects of climate change, leading to more stable and secure
CDP Page of 7417
supplies of key raw materials. For example, we source the majority of our cocoa from West Africa, where there is significantopportunity to improve farmers’ productivity and climate change resilience via our Cocoa Life program. In addition, we encouragemore sustainable and climate resilient production of wheat through our Harmony and North American wheat sustainability programsand palm oil through our Palm Oil Action Plan.
Time horizonPlease select
LikelihoodUnknown
Magnitude of impactUnknown
Are you able to provide a potential financial impact figure?No, we do not have this figure
Potential financial impact figure (currency)<Not Applicable>
Potential financial impact figure – minimum (currency)<Not Applicable>
Potential financial impact figure – maximum (currency)<Not Applicable>
Explanation of financial impact figureWe anticipate that more sustainable and climate resilient supplies of key raw materials will increase security of supply and help toreduce exposure to fluctuations in availability and price volatility.
Strategy to realize opportunityTransforming our agricultural supply chains is an essential foundation for a sustainable future. We’ve launched innovative, industry-leading holistic programs in key commodities like cocoa and wheat. Cocoa Life: 10 year, $400 million investment, empowering morethan 200,000 farmers and improving the lives of more than 1 million people. Harmony: our European wheat program, Harmony,promotes biodiversity and good environmental practices in wheat production. Our palm oil action plan sets out milestones toincrease suppliers’ accountability for sustainability across their own operations and third-party supplies. Beyond this, we’reembedding sustainability into our sourcing practices across our commodities.
Cost to realize opportunity400000000
CommentThe cost to realize the opportunity reflects the $400 million we are spending over ten years, from 2012 to 2022, for Cocoa Life. Itdoes not include our investments in Harmony or other sustainable agriculture programs or other related costs.
IdentifierOpp2
Where in the value chain does the opportunity occur?Direct operations
Opportunity typeResource efficiency
Primary climate-related opportunity driverUse of more efficient production and distribution processes
Type of financial impactReduced operating costs (e.g., through efficiency gains and cost reductions)
Company-specific descriptionWe use significant energy in our factories to manufacture our products. Increased energy efficiency in our factories enables us touse less energy and therefore save costs per ton of production. For example, in our factories across the world we haveopportunities to install energy efficient capital equipment for manufacturing processes such as ovens, steam production andrefrigeration. Energy management systems enable us to track and monitor energy use and focus efforts to reduce consumption.
Time horizonPlease select
CDP Page of 7418
LikelihoodUnknown
Magnitude of impactUnknown
Are you able to provide a potential financial impact figure?No, we do not have this figure
Potential financial impact figure (currency)<Not Applicable>
Potential financial impact figure – minimum (currency)<Not Applicable>
Potential financial impact figure – maximum (currency)<Not Applicable>
Explanation of financial impact figureMore efficient production processes enable us to save energy and, therefore, costs.
Strategy to realize opportunityOur sustainability strategy and our targets to reduce energy consumption and CO2 emission in our operations constitute a concreteapproach to realizing these opportunities by increasing energy efficiency and reducing operating costs. We’ve reduced energyconsumption by improving energy management systems and investing in energy-efficient technologies in our factories.
Cost to realize opportunity
CommentCost to realize opportunity is unknown.
IdentifierOpp3
Where in the value chain does the opportunity occur?Direct operations
Opportunity typeEnergy source
Primary climate-related opportunity driverUse of lower-emission sources of energy
Type of financial impactReduced exposure to GHG emissions and therefore less sensitivity to changes in cost of carbon
Company-specific descriptionWe use renewable energy in our factories through installation of on-site renewable energy at various facilities, and by powerpurchase agreements in Mexico and the US. Investing in renewable energy provides opportunities to help us reduce emissions andcosts and grow our business in future.
Time horizonPlease select
LikelihoodUnknown
Magnitude of impactUnknown
Are you able to provide a potential financial impact figure?No, we do not have this figure
Potential financial impact figure (currency)<Not Applicable>
Potential financial impact figure – minimum (currency)<Not Applicable>
Potential financial impact figure – maximum (currency)<Not Applicable>
CDP Page of 7419
Explanation of financial impact figureFinancial impacts of investing in renewable energy vary across the world according to local energy markets, incentives, costs toinstall on-site generation, or the availability of external supplies of renewable power. In recent years, the trend has been for relativecosts of renewables to fall vs fossil fuels and we anticipate opportunities to benefit to reduce our operating costs in future and toinsulate us from potential carbon taxes.
Strategy to realize opportunityOur sustainability strategy and our target to reduce CO2 emissions in our operations constitute a concrete approach to realizingthese opportunities by increasing our use of renewable energy. We are cutting CO2 emissions by using low-carbon renewableenergy sources. In our Curitiba and Vitória de Santo Antão (VSA) factories in Brazil, we’re generating bioelectricity by burningsugarcane residues, saving an estimated 10,000 tonnes of CO2 emissions. We are buying green electricity from a new solar farmin Mexico, generating CO2 and financial savings for our Monterrey and Salinas plants. In France, we have installed on-site solarpanels at three plants: La Haye-Fouassière, Granville and Besancon. And in the Philippines, our Sucat plant is converting to 100percent geothermal electricity, saving 4,000 tonnes of CO2 emissions. In 2019, we signed a twelve-year power purchaseagreement (PPA) to purchase the energy delivered to the electricity grid from a 65 MW portion of Enel Green Power NorthAmerica’s Roadrunner project, a solar farm in Texas, United States. The agreement is our largest renewable energy partnership ata global level and first renewable energy PPA signed in the U.S. The partnership enables us to make substantial progress againstour sustainability goals by reducing 80,000 metric tons of carbon dioxide emissions – 5 percent of our global manufacturingemissions vs 2013 baseline.
Cost to realize opportunity
CommentCost to realize opportunity is unknown.
IdentifierOpp4
Where in the value chain does the opportunity occur?Customer
Opportunity typeProducts and services
Primary climate-related opportunity driverShift in consumer preferences
Type of financial impactBetter competitive position to reflect shifting consumer preferences, resulting in increased revenues
Company-specific descriptionWe are addressing consumer trends for well-being by renovating and innovating on our base portfolio, cleaning up ingredient linesand expanding our use of sustainably sourced ingredients. We communicate to consumers about signature programs in our rawmaterial supply for brands in our Chocolate and Biscuit categories.
Time horizonPlease select
LikelihoodUnknown
Magnitude of impactUnknown
Are you able to provide a potential financial impact figure?No, we do not have this figure
Potential financial impact figure (currency)<Not Applicable>
Potential financial impact figure – minimum (currency)<Not Applicable>
Potential financial impact figure – maximum (currency)<Not Applicable>
Explanation of financial impact figureBetter competitive position to reflect shifting consumer preferences, resulting in increased revenues
CDP Page of 7420
Strategy to realize opportunityOur purpose is to empower people to snack right and our vision for impact is to lead the future of snacking by making snacks forboth people and planet to love. We understand that people are more conscious of their health and well-being and more aware of theenvironmental impact of a growing global population on everything from deforestation and ocean plastics to climate change. Ourconsumers shouldn’t have to worry about the impact their snacking choices have on the world and their communities. We wantthem to be confident when they are choosing our brands, that they are choosing snacks made the right way. We’re committed toensuring that snacking can be both sustainable and mindful. We are renovating and innovating on our base portfolio by cleaning upingredient lines and expanding our use of sustainably sourced ingredients. For example, our Triscuit brand in the US is made fromNon-GMO and sustainably sourced wheat. The packaging graphics reinforce the brand purpose to consumers and help to drivebrand growth. We are working at scale to transform our agricultural supply chains in key commodities like cocoa and wheat. We’velaunched innovative, industry-leading holistic programs. Cocoa Life: 10-year, $400 million investment, empowering more than200,000 farmers, and Harmony, our European wheat program promoting biodiversity and good environmental practices in wheatproduction. We communicate to consumers about Cocoa Life and Harmony for key brands.
Cost to realize opportunity400000000
CommentThe cost to realize the opportunity reflects the $400 million we are spending over ten years, from 2012 to 2022, for Cocoa Life. Itdoes not include our investments in Harmony or other sustainable agriculture programs or other related costs and it does notaddress costs associated with communicating to consumers the work done to address their concerns.
C2.5
(C2.5) Describe where and how the identified risks and opportunities have impacted your business.
Impact Description
Products andservices
Impacted for somesuppliers, facilities, orproduct lines
As described in opportunity 4, we communicate about our signature programs Cocoa Life and Harmony on selected brands inour Chocolate and Biscuit categories.
Supply chainand/or valuechain
Impacted for somesuppliers, facilities, orproduct lines
As described in risks 3 and 4, we see risks from the impacts of climate change for the supply of raw materials and fordisruption to our supply chain. We are working to mitigate these risks and build opportunities for more resilient raw materialsupplies (opportunity 1)
Adaptationandmitigationactivities
Impacted for somesuppliers, facilities, orproduct lines
Through our sustainable agriculture programs, we are building opportunities for more resilient raw material supplies(opportunity 1)
Investment inR&D
Impacted for somesuppliers, facilities, orproduct lines
Our R&D facilities help us to develop improved planting material and good agricultural practices recommendations for ourCocoa Life and Harmony programs (risk 3; opportunities 1 and 4)
Operations Impacted for somesuppliers, facilities, orproduct lines
Through our mitigation plans (risk 4) we are working to reduce risk of disruption to our supply chains and facilities; and throughour resource efficiency (opportunity 2) and renewable energy (opportunity 3) programs we are working to reduce costs,emissions and sensitivity to carbon pricing in operations.
Other,pleasespecify
Please select
C2.6
CDP Page of 7421
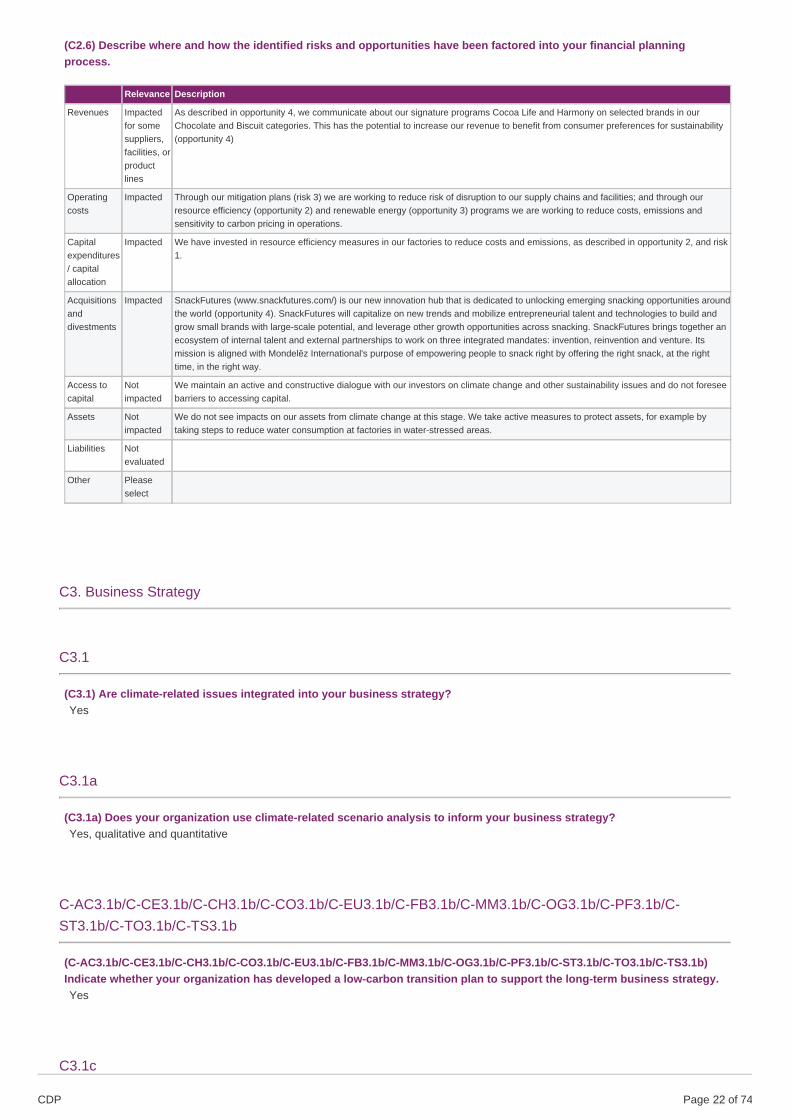
(C2.6) Describe where and how the identified risks and opportunities have been factored into your financial planningprocess.
Relevance Description
Revenues Impactedfor somesuppliers,facilities, orproductlines
As described in opportunity 4, we communicate about our signature programs Cocoa Life and Harmony on selected brands in ourChocolate and Biscuit categories. This has the potential to increase our revenue to benefit from consumer preferences for sustainability(opportunity 4)
Operatingcosts
Impacted Through our mitigation plans (risk 3) we are working to reduce risk of disruption to our supply chains and facilities; and through ourresource efficiency (opportunity 2) and renewable energy (opportunity 3) programs we are working to reduce costs, emissions andsensitivity to carbon pricing in operations.
Capitalexpenditures/ capitalallocation
Impacted We have invested in resource efficiency measures in our factories to reduce costs and emissions, as described in opportunity 2, and risk1.
Acquisitionsanddivestments
Impacted SnackFutures (www.snackfutures.com/) is our new innovation hub that is dedicated to unlocking emerging snacking opportunities aroundthe world (opportunity 4). SnackFutures will capitalize on new trends and mobilize entrepreneurial talent and technologies to build andgrow small brands with large-scale potential, and leverage other growth opportunities across snacking. SnackFutures brings together anecosystem of internal talent and external partnerships to work on three integrated mandates: invention, reinvention and venture. Itsmission is aligned with Mondelēz International's purpose of empowering people to snack right by offering the right snack, at the righttime, in the right way.
Access tocapital
Notimpacted
We maintain an active and constructive dialogue with our investors on climate change and other sustainability issues and do not foreseebarriers to accessing capital.
Assets Notimpacted
We do not see impacts on our assets from climate change at this stage. We take active measures to protect assets, for example bytaking steps to reduce water consumption at factories in water-stressed areas.
Liabilities Notevaluated
Other Pleaseselect
C3. Business Strategy
C3.1
(C3.1) Are climate-related issues integrated into your business strategy?Yes
C3.1a
(C3.1a) Does your organization use climate-related scenario analysis to inform your business strategy?Yes, qualitative and quantitative
C-AC3.1b/C-CE3.1b/C-CH3.1b/C-CO3.1b/C-EU3.1b/C-FB3.1b/C-MM3.1b/C-OG3.1b/C-PF3.1b/C-ST3.1b/C-TO3.1b/C-TS3.1b
(C-AC3.1b/C-CE3.1b/C-CH3.1b/C-CO3.1b/C-EU3.1b/C-FB3.1b/C-MM3.1b/C-OG3.1b/C-PF3.1b/C-ST3.1b/C-TO3.1b/C-TS3.1b)Indicate whether your organization has developed a low-carbon transition plan to support the long-term business strategy.Yes
C3.1c
CDP Page of 7422
(C3.1c) Explain how climate-related issues are integrated into your business objectives and strategy.
Climate-related issues are integrated into our strategy to create positive impact for people and planet and our Sustainable Snackingobjectives to source sustainable ingredients and reduce environmental impact.
As a global food company, it is vital for us to secure sustainable supplies of key raw materials from a resilient supply chain. Oursustainable agriculture programs are designed to address the risks of commodity prices being influenced by climate change as wellas the opportunity arising from increasing the resilience of agriculture to the impacts of climate change. In addition, people around theglobe are increasingly interested in well-being and ensuring a sustainable future. We know people expect more from companies andthe products they make and sell. We believe our growth is linked to enhancing the well-being of the planet, the people, and thecommunities we serve and we see an opportunity to enhance growth by addressing consumer trends in favor of sustainably sourcedingredients.
Our global food system is facing numerous challenges that are weighing down on individual farmers and the land they use. Thesechallenges are complex and call for solutions that require coordinated efforts by governments, industry and scientific, social andenvironmental experts. Smallholder farming communities, in particular, need support to help them conserve resources and build moredurable businesses.
· We are working to empower farmers and their communities to become more productive and climate-resilient, protect theenvironment, drive out deforestation and advance the rights and opportunities of the people in our supply chain.
· We’re working to build a thriving ingredient supply chain to ensure sustainable supplies of high-quality cocoa, wheat and other rawmaterials to create our delicious snacks — chocolate brands like Milka, Cadbury and Côte d’Or; or Oreo and LU biscuits.
· Our signature programs, Cocoa Life and Harmony Wheat, aim to make a positive impact on the farms, communities andenvironments where our main raw materials are grown.
· We are also addressing key areas where we can have the most impact, requiring more transparency, and collaborating with our keysuppliers and others to promote widespread change so that sustainability becomes the normal way to do business in key rawmaterials. And because we believe sustainability should be universal and available to all, we’re collaborating with peer companies,suppliers, governments and non-profit partners to spread best practices beyond our supply chain.
Likewise, our programs to reduce our environmental impact address the opportunities to reduce operating costs and exposure to therisk of increasing carbon taxes and regulation on energy use by using energy more efficiently and switching to renewable energysources.
· We recognize we play a critical role in helping to combat climate change and have increased our focus on ways to continuallyreduce our CO2 emissions from manufacturing. We adopted a science-based approach to reduce our absolute CO2 emissions frommanufacturing by 15 percent by 2020. This aligns with current approaches to support the global effort to limit climate change to lessthan 2ºC. Since 2013, we reduced CO2 emissions from our factories by 10 percent, through improving energy management systemsand investing in energy efficient technologies in our factories.
We also work to minimize the risk of disruption to our direct operations from extreme weather events linked to climate change. Ourstrategy to reduce environmental impact contributes to global efforts to mitigate climate change. In addition, we have in place severalbusiness continuity protocols, including special situations management and emergency preparedness and response procedures toaddress and help mitigate adverse effects.
CDP Page of 7423
C3.1d
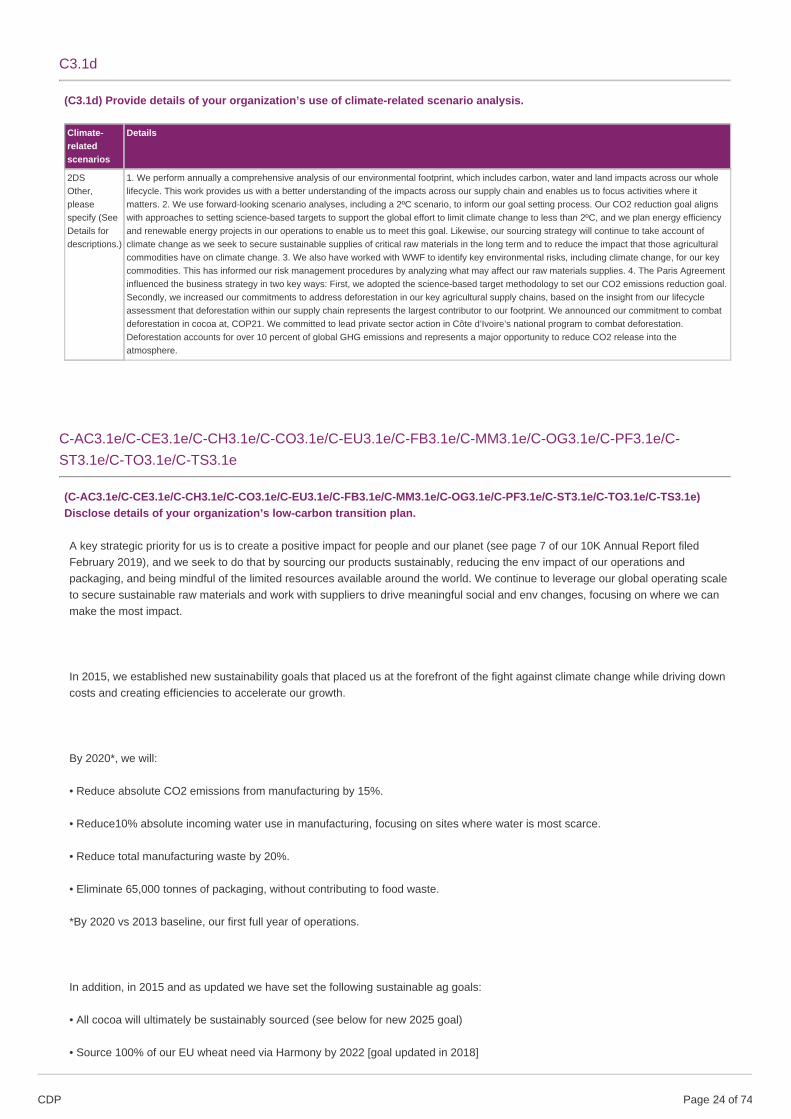
(C3.1d) Provide details of your organization’s use of climate-related scenario analysis.
Climate-relatedscenarios
Details
2DSOther,pleasespecify (SeeDetails fordescriptions.)
1. We perform annually a comprehensive analysis of our environmental footprint, which includes carbon, water and land impacts across our wholelifecycle. This work provides us with a better understanding of the impacts across our supply chain and enables us to focus activities where itmatters. 2. We use forward-looking scenario analyses, including a 2ºC scenario, to inform our goal setting process. Our CO2 reduction goal alignswith approaches to setting science-based targets to support the global effort to limit climate change to less than 2ºC, and we plan energy efficiencyand renewable energy projects in our operations to enable us to meet this goal. Likewise, our sourcing strategy will continue to take account ofclimate change as we seek to secure sustainable supplies of critical raw materials in the long term and to reduce the impact that those agriculturalcommodities have on climate change. 3. We also have worked with WWF to identify key environmental risks, including climate change, for our keycommodities. This has informed our risk management procedures by analyzing what may affect our raw materials supplies. 4. The Paris Agreementinfluenced the business strategy in two key ways: First, we adopted the science-based target methodology to set our CO2 emissions reduction goal.Secondly, we increased our commitments to address deforestation in our key agricultural supply chains, based on the insight from our lifecycleassessment that deforestation within our supply chain represents the largest contributor to our footprint. We announced our commitment to combatdeforestation in cocoa at, COP21. We committed to lead private sector action in Côte d’Ivoire’s national program to combat deforestation.Deforestation accounts for over 10 percent of global GHG emissions and represents a major opportunity to reduce CO2 release into theatmosphere.
C-AC3.1e/C-CE3.1e/C-CH3.1e/C-CO3.1e/C-EU3.1e/C-FB3.1e/C-MM3.1e/C-OG3.1e/C-PF3.1e/C-ST3.1e/C-TO3.1e/C-TS3.1e
(C-AC3.1e/C-CE3.1e/C-CH3.1e/C-CO3.1e/C-EU3.1e/C-FB3.1e/C-MM3.1e/C-OG3.1e/C-PF3.1e/C-ST3.1e/C-TO3.1e/C-TS3.1e)Disclose details of your organization’s low-carbon transition plan.
A key strategic priority for us is to create a positive impact for people and our planet (see page 7 of our 10K Annual Report filedFebruary 2019), and we seek to do that by sourcing our products sustainably, reducing the env impact of our operations andpackaging, and being mindful of the limited resources available around the world. We continue to leverage our global operating scaleto secure sustainable raw materials and work with suppliers to drive meaningful social and env changes, focusing on where we canmake the most impact.
In 2015, we established new sustainability goals that placed us at the forefront of the fight against climate change while driving downcosts and creating efficiencies to accelerate our growth.
By 2020*, we will:
• Reduce absolute CO2 emissions from manufacturing by 15%.
• Reduce10% absolute incoming water use in manufacturing, focusing on sites where water is most scarce.
• Reduce total manufacturing waste by 20%.
• Eliminate 65,000 tonnes of packaging, without contributing to food waste.
*By 2020 vs 2013 baseline, our first full year of operations.
In addition, in 2015 and as updated we have set the following sustainable ag goals:
• All cocoa will ultimately be sustainably sourced (see below for new 2025 goal)
• Source 100% of our EU wheat need via Harmony by 2022 [goal updated in 2018]
CDP Page of 7424
• Maintain 100% RSPO palm oil
• 100% palm oil traceable to the mill from suppliers with aligned policies
• 100% cage-free eggs in US, Canada by 2020 and rest of world by 2025 (except Russia, Ukraine and China, where supply chain isdeveloping and requires a longer period to secure cage-free)
Our manufacturing CO2 reduction goal aligns with approaches to setting science-based targets to support the global effort to limitclimate change to less than 2ºC. To achieve the goal, we have allocated capital to invest in more energy efficient manufacturing andon-site renewable energy projects. We have also purchased supplies of renewable energy from third parties.
Likewise, our sourcing strategy will continue to take account of climate change as we seek to secure sustainable supplies of criticalraw materials in the long term and to reduce the impact that those ag commodities have on climate change. For example, weimplement deforestation interventions in key ag supply programs, such as Cocoa Life and our Palm Oil Action Plan.
Our sustainability goals are applied across our business units (BUs) and are included in the BUs’ strategic plans.
We look at two key impact areas to reduce GHG emissions: direct and indirect control. Matters within our direct control are a relativelyminor portion of our total footprint, but we have direct influence. From 2013-2018, we reduced energy-related emissions 10% on anabsolute basis. For areas beyond our direct control, notably ag, which accounts for the largest share of our CO2e footprint, we havea longer-term strategy and consider our ability to secure the ag commodities we need to make our products and the impact that thoseag commodities have on global warming.
We have focused where we may have better influence and opportunity to drive change. In 2012, through our Cocoa Life initiative, wehave committed $400 million over 10 years to this large and our most comprehensive program to date to support sustainableproduction and improve the livelihoods of cocoa farmers. We are also tackling other commodities, such as sugar, palm oil, wheat, anddairy.
We buy RSPO certificates and segregated palm oil to cover 100 percent of our palm oil purchases. In 2014, we launched anambitious action plan laying out steps so that the palm oil we buy is produced on legally held land, doesn’t lead to deforestation orloss of peat land and respects human rights. We updated the plan in 2016 and 2018, setting out new milestones to increasesuppliers’ accountability for sustainability across their own operations and third-party suppliers.
We are using life-cycle thinking to help uncover ways to eliminate waste in manufacturing, measure how product and pkginginnovations improve on previous designs, and provide a common system to measure and explain those benefits.
Our long-term strategy will continue to be influenced by climate change as we implement our sustainability goals.
Looking toward 2025, we are investing in a future where people and planet can thrive, focusing on three areas:
· building a resilient ingredient supply chain to conserve resources and build more durable farming businesses.
· reducing our environmental impact, focusing on the end-to-end impact of our snacks.
· developing zero net waste packaging
CDP Page of 7425
Our 2025 Sustainable Snacking commitments include, but are not limited to:
· All chocolate brands will source their cocoa from Cocoa Life.
· We will minimize food waste, end-to-end CO2emissions and priority water usage.
· All of our packaging will be recyclable and labeled with consumer recycling information.
C4. Targets and performance
C4.1
(C4.1) Did you have an emissions target that was active in the reporting year?Absolute target
C4.1a
CDP Page of 7426
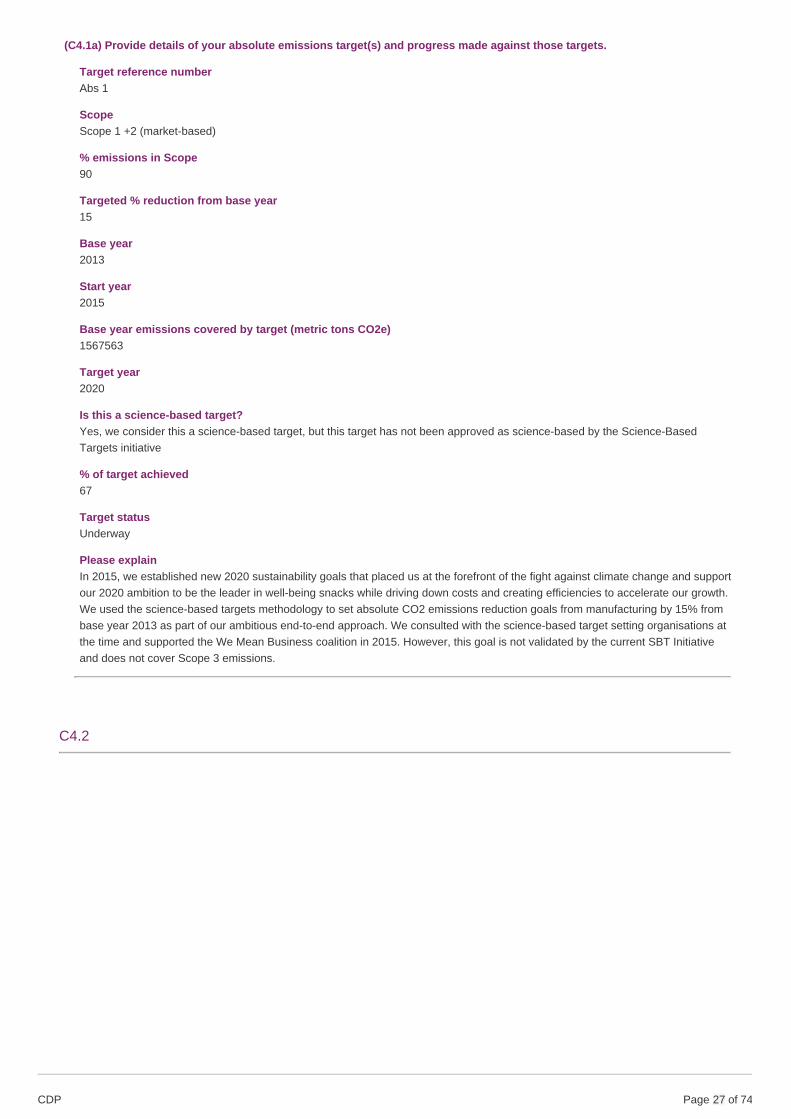
(C4.1a) Provide details of your absolute emissions target(s) and progress made against those targets.
Target reference numberAbs 1
ScopeScope 1 +2 (market-based)
% emissions in Scope90
Targeted % reduction from base year15
Base year2013
Start year2015
Base year emissions covered by target (metric tons CO2e)1567563
Target year2020
Is this a science-based target?Yes, we consider this a science-based target, but this target has not been approved as science-based by the Science-BasedTargets initiative
% of target achieved67
Target statusUnderway
Please explainIn 2015, we established new 2020 sustainability goals that placed us at the forefront of the fight against climate change and supportour 2020 ambition to be the leader in well-being snacks while driving down costs and creating efficiencies to accelerate our growth.We used the science-based targets methodology to set absolute CO2 emissions reduction goals from manufacturing by 15% frombase year 2013 as part of our ambitious end-to-end approach. We consulted with the science-based target setting organisations atthe time and supported the We Mean Business coalition in 2015. However, this goal is not validated by the current SBT Initiativeand does not cover Scope 3 emissions.
C4.2
CDP Page of 7427
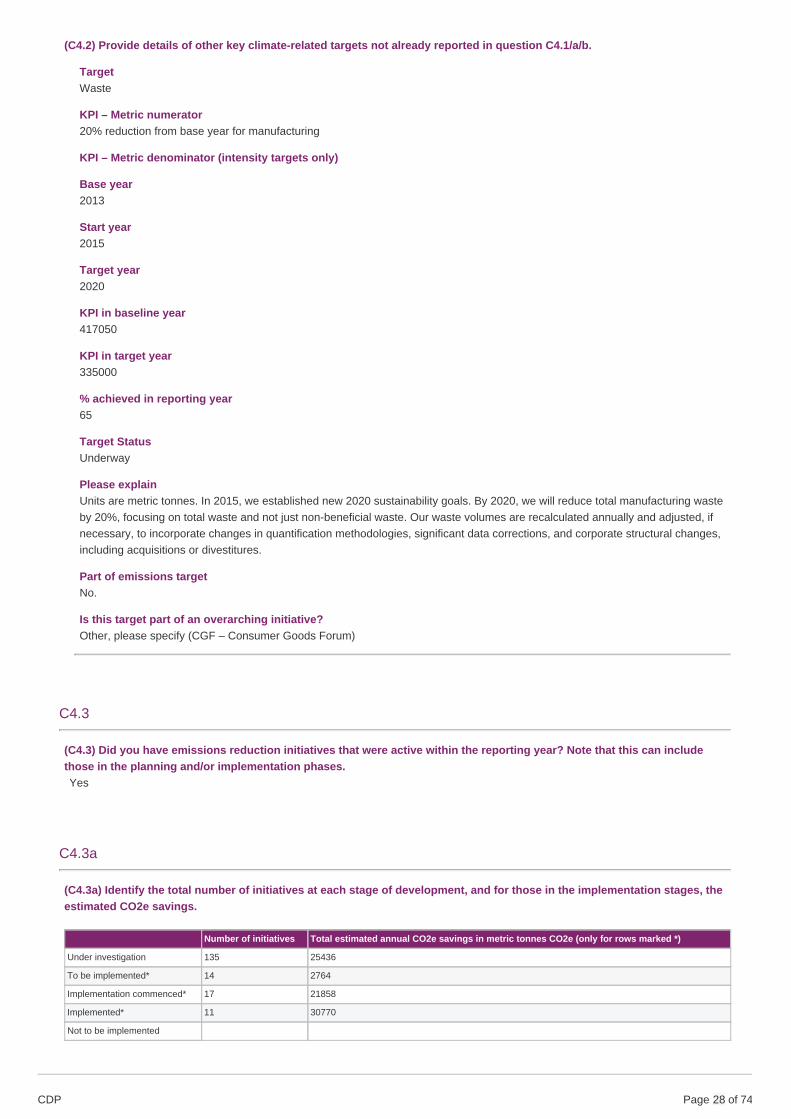
(C4.2) Provide details of other key climate-related targets not already reported in question C4.1/a/b.
TargetWaste
KPI – Metric numerator20% reduction from base year for manufacturing
KPI – Metric denominator (intensity targets only)
Base year2013
Start year2015
Target year2020
KPI in baseline year417050
KPI in target year335000
% achieved in reporting year65
Target StatusUnderway
Please explainUnits are metric tonnes. In 2015, we established new 2020 sustainability goals. By 2020, we will reduce total manufacturing wasteby 20%, focusing on total waste and not just non-beneficial waste. Our waste volumes are recalculated annually and adjusted, ifnecessary, to incorporate changes in quantification methodologies, significant data corrections, and corporate structural changes,including acquisitions or divestitures.
Part of emissions targetNo.
Is this target part of an overarching initiative?Other, please specify (CGF – Consumer Goods Forum)
C4.3
(C4.3) Did you have emissions reduction initiatives that were active within the reporting year? Note that this can includethose in the planning and/or implementation phases.Yes
C4.3a
(C4.3a) Identify the total number of initiatives at each stage of development, and for those in the implementation stages, theestimated CO2e savings.
Number of initiatives Total estimated annual CO2e savings in metric tonnes CO2e (only for rows marked *)
Under investigation 135 25436
To be implemented* 14 2764
Implementation commenced* 17 21858
Implemented* 11 30770
Not to be implemented
CDP Page of 7428
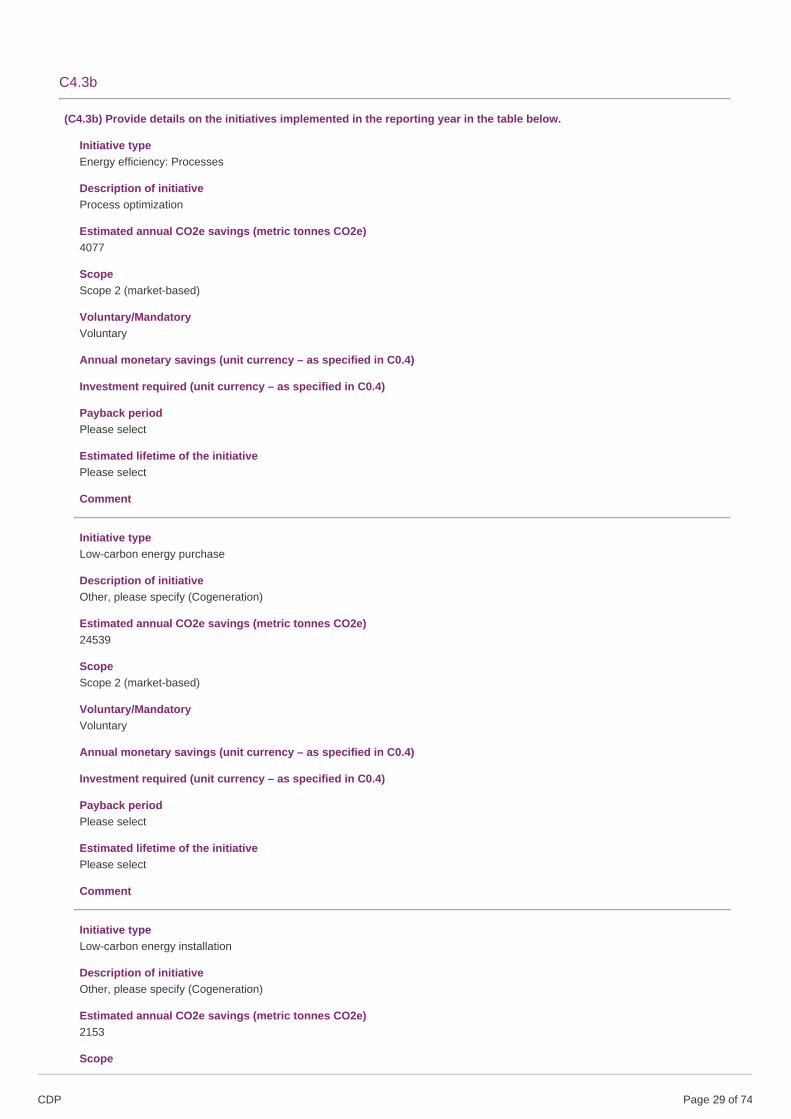
C4.3b
(C4.3b) Provide details on the initiatives implemented in the reporting year in the table below.
Initiative typeEnergy efficiency: Processes
Description of initiativeProcess optimization
Estimated annual CO2e savings (metric tonnes CO2e)4077
ScopeScope 2 (market-based)
Voluntary/MandatoryVoluntary
Annual monetary savings (unit currency – as specified in C0.4)
Investment required (unit currency – as specified in C0.4)
Payback periodPlease select
Estimated lifetime of the initiativePlease select
Comment
Initiative typeLow-carbon energy purchase
Description of initiativeOther, please specify (Cogeneration)
Estimated annual CO2e savings (metric tonnes CO2e)24539
ScopeScope 2 (market-based)
Voluntary/MandatoryVoluntary
Annual monetary savings (unit currency – as specified in C0.4)
Investment required (unit currency – as specified in C0.4)
Payback periodPlease select
Estimated lifetime of the initiativePlease select
Comment
Initiative typeLow-carbon energy installation
Description of initiativeOther, please specify (Cogeneration)
Estimated annual CO2e savings (metric tonnes CO2e)2153
Scope
CDP Page of 7429
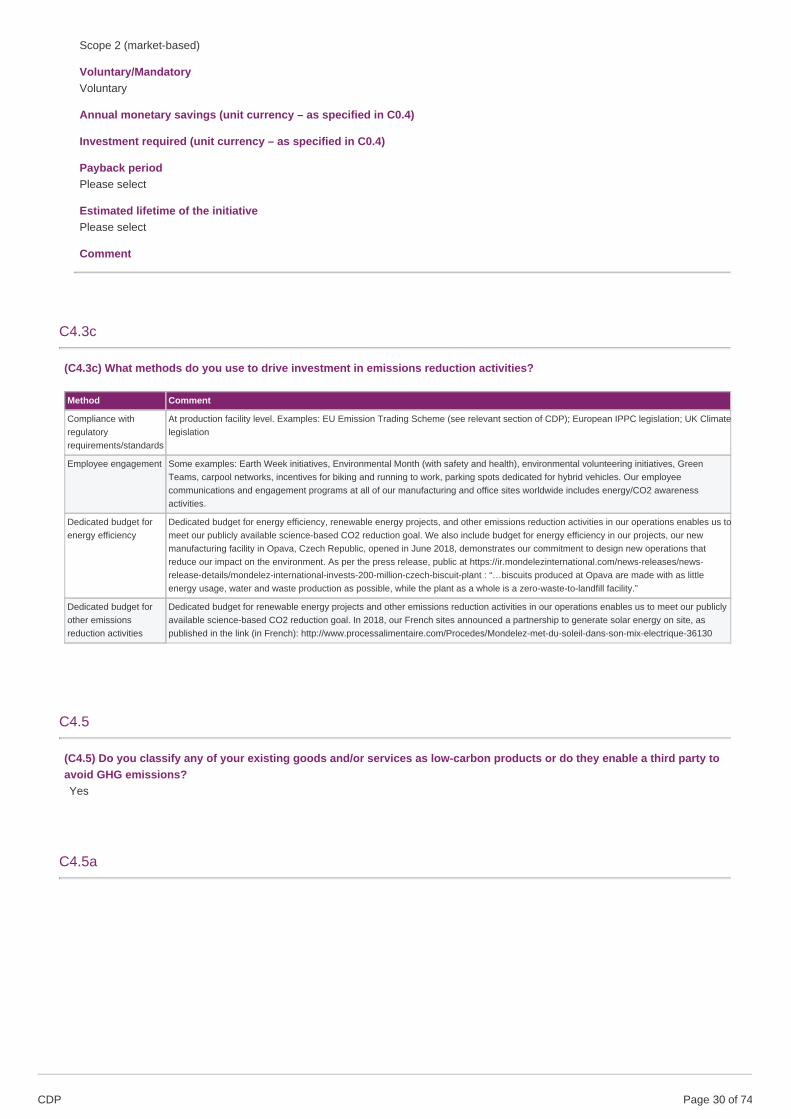
Scope 2 (market-based)
Voluntary/MandatoryVoluntary
Annual monetary savings (unit currency – as specified in C0.4)
Investment required (unit currency – as specified in C0.4)
Payback periodPlease select
Estimated lifetime of the initiativePlease select
Comment
C4.3c
(C4.3c) What methods do you use to drive investment in emissions reduction activities?
Method Comment
Compliance withregulatoryrequirements/standards
At production facility level. Examples: EU Emission Trading Scheme (see relevant section of CDP); European IPPC legislation; UK Climatelegislation
Employee engagement Some examples: Earth Week initiatives, Environmental Month (with safety and health), environmental volunteering initiatives, GreenTeams, carpool networks, incentives for biking and running to work, parking spots dedicated for hybrid vehicles. Our employeecommunications and engagement programs at all of our manufacturing and office sites worldwide includes energy/CO2 awarenessactivities.
Dedicated budget forenergy efficiency
Dedicated budget for energy efficiency, renewable energy projects, and other emissions reduction activities in our operations enables us tomeet our publicly available science-based CO2 reduction goal. We also include budget for energy efficiency in our projects, our newmanufacturing facility in Opava, Czech Republic, opened in June 2018, demonstrates our commitment to design new operations thatreduce our impact on the environment. As per the press release, public at https://ir.mondelezinternational.com/news-releases/news-release-details/mondelez-international-invests-200-million-czech-biscuit-plant : “…biscuits produced at Opava are made with as littleenergy usage, water and waste production as possible, while the plant as a whole is a zero-waste-to-landfill facility.”
Dedicated budget forother emissionsreduction activities
Dedicated budget for renewable energy projects and other emissions reduction activities in our operations enables us to meet our publiclyavailable science-based CO2 reduction goal. In 2018, our French sites announced a partnership to generate solar energy on site, aspublished in the link (in French): http://www.processalimentaire.com/Procedes/Mondelez-met-du-soleil-dans-son-mix-electrique-36130
C4.5
(C4.5) Do you classify any of your existing goods and/or services as low-carbon products or do they enable a third party toavoid GHG emissions?Yes
C4.5a
CDP Page of 7430
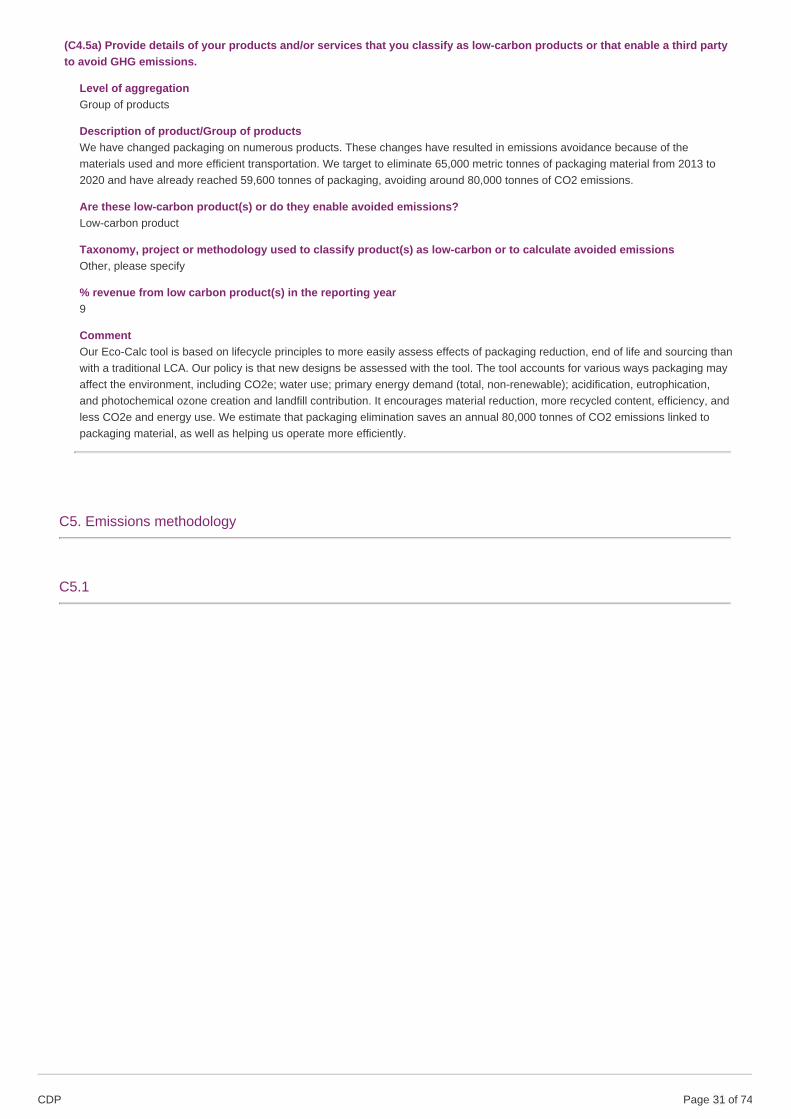
(C4.5a) Provide details of your products and/or services that you classify as low-carbon products or that enable a third partyto avoid GHG emissions.
Level of aggregationGroup of products
Description of product/Group of productsWe have changed packaging on numerous products. These changes have resulted in emissions avoidance because of thematerials used and more efficient transportation. We target to eliminate 65,000 metric tonnes of packaging material from 2013 to2020 and have already reached 59,600 tonnes of packaging, avoiding around 80,000 tonnes of CO2 emissions.
Are these low-carbon product(s) or do they enable avoided emissions?Low-carbon product
Taxonomy, project or methodology used to classify product(s) as low-carbon or to calculate avoided emissionsOther, please specify
% revenue from low carbon product(s) in the reporting year9
CommentOur Eco-Calc tool is based on lifecycle principles to more easily assess effects of packaging reduction, end of life and sourcing thanwith a traditional LCA. Our policy is that new designs be assessed with the tool. The tool accounts for various ways packaging mayaffect the environment, including CO2e; water use; primary energy demand (total, non-renewable); acidification, eutrophication,and photochemical ozone creation and landfill contribution. It encourages material reduction, more recycled content, efficiency, andless CO2e and energy use. We estimate that packaging elimination saves an annual 80,000 tonnes of CO2 emissions linked topackaging material, as well as helping us operate more efficiently.
C5. Emissions methodology
C5.1
CDP Page of 7431
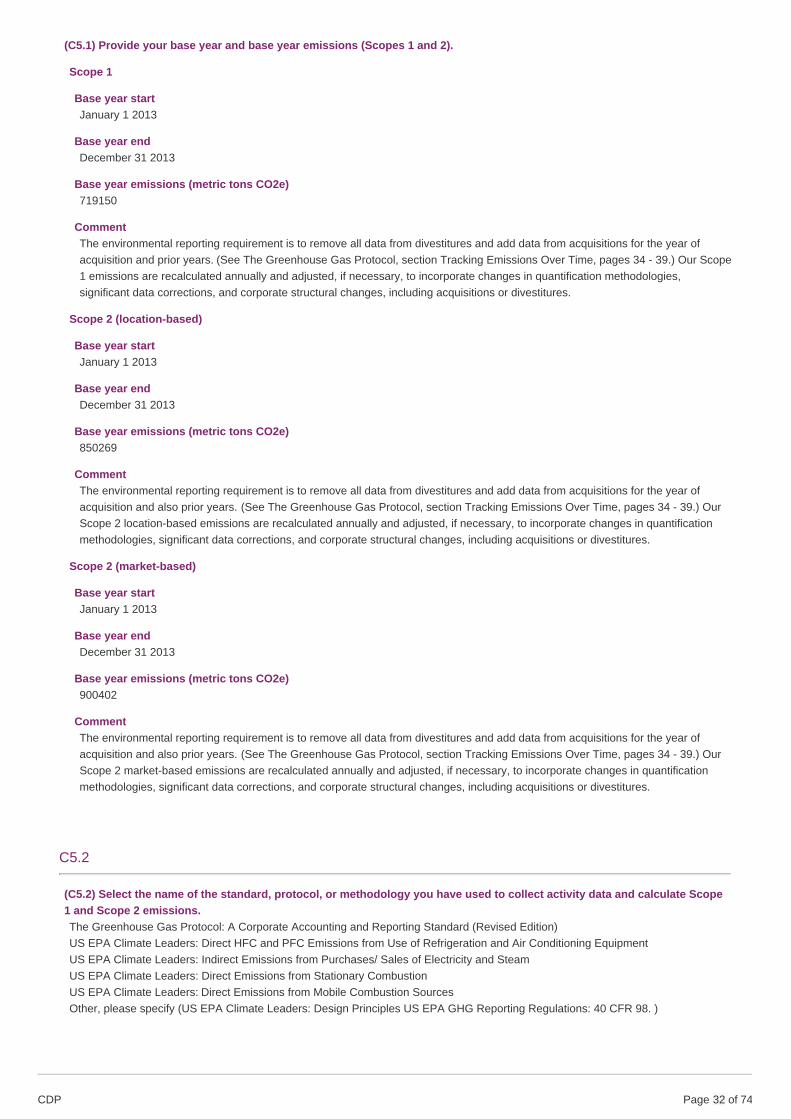
(C5.1) Provide your base year and base year emissions (Scopes 1 and 2).
Scope 1
Base year startJanuary 1 2013
Base year endDecember 31 2013
Base year emissions (metric tons CO2e)719150
CommentThe environmental reporting requirement is to remove all data from divestitures and add data from acquisitions for the year ofacquisition and prior years. (See The Greenhouse Gas Protocol, section Tracking Emissions Over Time, pages 34 - 39.) Our Scope1 emissions are recalculated annually and adjusted, if necessary, to incorporate changes in quantification methodologies,significant data corrections, and corporate structural changes, including acquisitions or divestitures.
Scope 2 (location-based)
Base year startJanuary 1 2013
Base year endDecember 31 2013
Base year emissions (metric tons CO2e)850269
CommentThe environmental reporting requirement is to remove all data from divestitures and add data from acquisitions for the year ofacquisition and also prior years. (See The Greenhouse Gas Protocol, section Tracking Emissions Over Time, pages 34 - 39.) OurScope 2 location-based emissions are recalculated annually and adjusted, if necessary, to incorporate changes in quantificationmethodologies, significant data corrections, and corporate structural changes, including acquisitions or divestitures.
Scope 2 (market-based)
Base year startJanuary 1 2013
Base year endDecember 31 2013
Base year emissions (metric tons CO2e)900402
CommentThe environmental reporting requirement is to remove all data from divestitures and add data from acquisitions for the year ofacquisition and also prior years. (See The Greenhouse Gas Protocol, section Tracking Emissions Over Time, pages 34 - 39.) OurScope 2 market-based emissions are recalculated annually and adjusted, if necessary, to incorporate changes in quantificationmethodologies, significant data corrections, and corporate structural changes, including acquisitions or divestitures.
C5.2
(C5.2) Select the name of the standard, protocol, or methodology you have used to collect activity data and calculate Scope1 and Scope 2 emissions.The Greenhouse Gas Protocol: A Corporate Accounting and Reporting Standard (Revised Edition)US EPA Climate Leaders: Direct HFC and PFC Emissions from Use of Refrigeration and Air Conditioning EquipmentUS EPA Climate Leaders: Indirect Emissions from Purchases/ Sales of Electricity and SteamUS EPA Climate Leaders: Direct Emissions from Stationary CombustionUS EPA Climate Leaders: Direct Emissions from Mobile Combustion SourcesOther, please specify (US EPA Climate Leaders: Design Principles US EPA GHG Reporting Regulations: 40 CFR 98. )
CDP Page of 7432
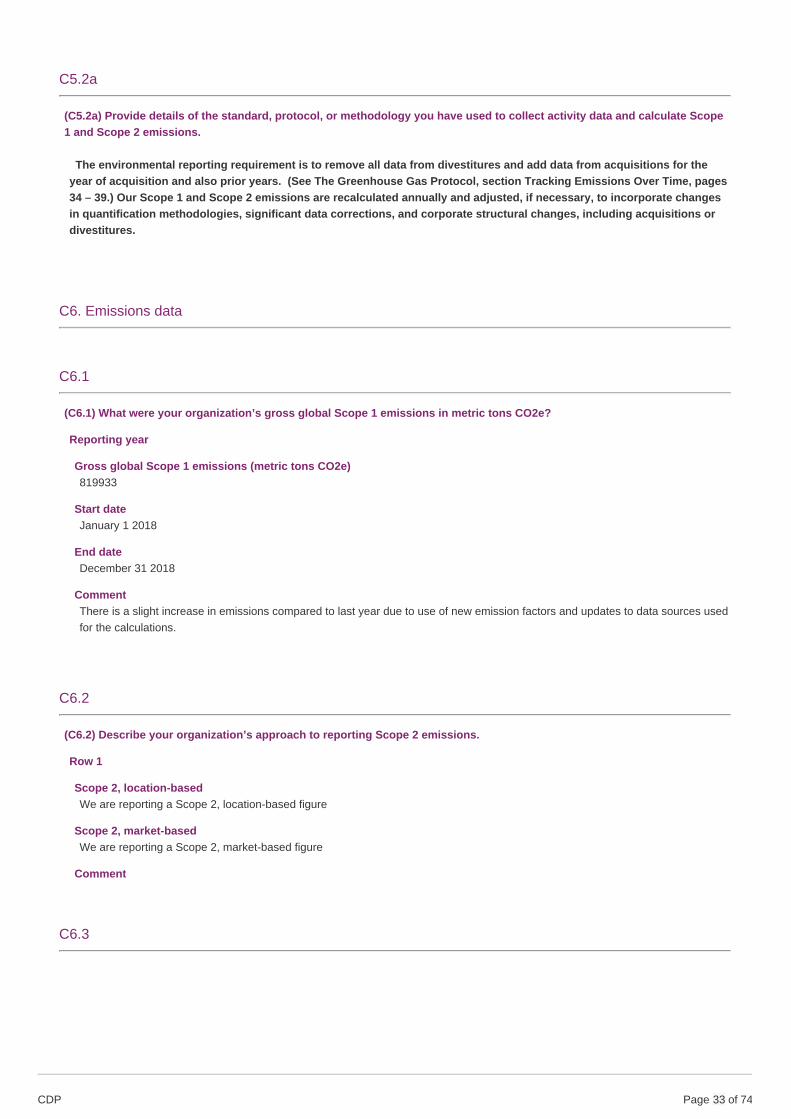
C5.2a
(C5.2a) Provide details of the standard, protocol, or methodology you have used to collect activity data and calculate Scope1 and Scope 2 emissions.
The environmental reporting requirement is to remove all data from divestitures and add data from acquisitions for theyear of acquisition and also prior years. (See The Greenhouse Gas Protocol, section Tracking Emissions Over Time, pages34 – 39.) Our Scope 1 and Scope 2 emissions are recalculated annually and adjusted, if necessary, to incorporate changesin quantification methodologies, significant data corrections, and corporate structural changes, including acquisitions ordivestitures.
C6. Emissions data
C6.1
(C6.1) What were your organization’s gross global Scope 1 emissions in metric tons CO2e?
Reporting year
Gross global Scope 1 emissions (metric tons CO2e)819933
Start dateJanuary 1 2018
End dateDecember 31 2018
CommentThere is a slight increase in emissions compared to last year due to use of new emission factors and updates to data sources usedfor the calculations.
C6.2
(C6.2) Describe your organization’s approach to reporting Scope 2 emissions.
Row 1
Scope 2, location-basedWe are reporting a Scope 2, location-based figure
Scope 2, market-basedWe are reporting a Scope 2, market-based figure
Comment
C6.3
CDP Page of 7433
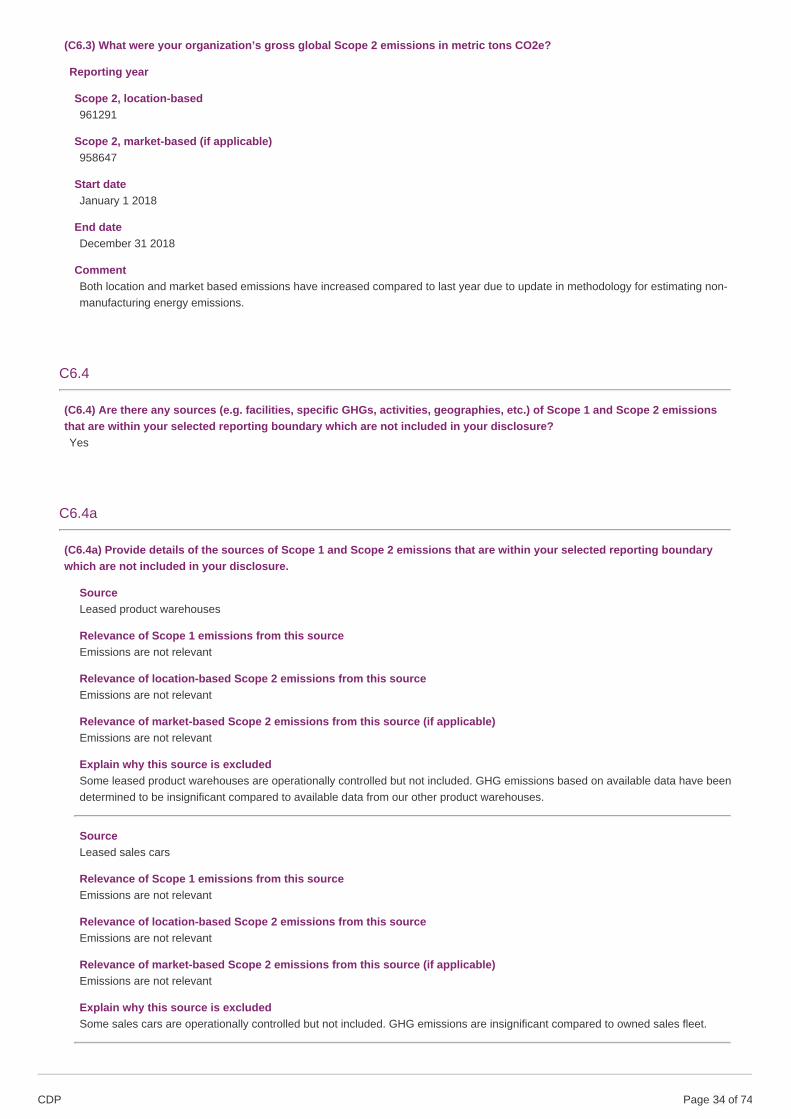
(C6.3) What were your organization’s gross global Scope 2 emissions in metric tons CO2e?
Reporting year
Scope 2, location-based961291
Scope 2, market-based (if applicable)958647
Start dateJanuary 1 2018
End dateDecember 31 2018
CommentBoth location and market based emissions have increased compared to last year due to update in methodology for estimating non-manufacturing energy emissions.
C6.4
(C6.4) Are there any sources (e.g. facilities, specific GHGs, activities, geographies, etc.) of Scope 1 and Scope 2 emissionsthat are within your selected reporting boundary which are not included in your disclosure?Yes
C6.4a
(C6.4a) Provide details of the sources of Scope 1 and Scope 2 emissions that are within your selected reporting boundarywhich are not included in your disclosure.
SourceLeased product warehouses
Relevance of Scope 1 emissions from this sourceEmissions are not relevant
Relevance of location-based Scope 2 emissions from this sourceEmissions are not relevant
Relevance of market-based Scope 2 emissions from this source (if applicable)Emissions are not relevant
Explain why this source is excludedSome leased product warehouses are operationally controlled but not included. GHG emissions based on available data have beendetermined to be insignificant compared to available data from our other product warehouses.
SourceLeased sales cars
Relevance of Scope 1 emissions from this sourceEmissions are not relevant
Relevance of location-based Scope 2 emissions from this sourceEmissions are not relevant
Relevance of market-based Scope 2 emissions from this source (if applicable)Emissions are not relevant
Explain why this source is excludedSome sales cars are operationally controlled but not included. GHG emissions are insignificant compared to owned sales fleet.
CDP Page of 7434
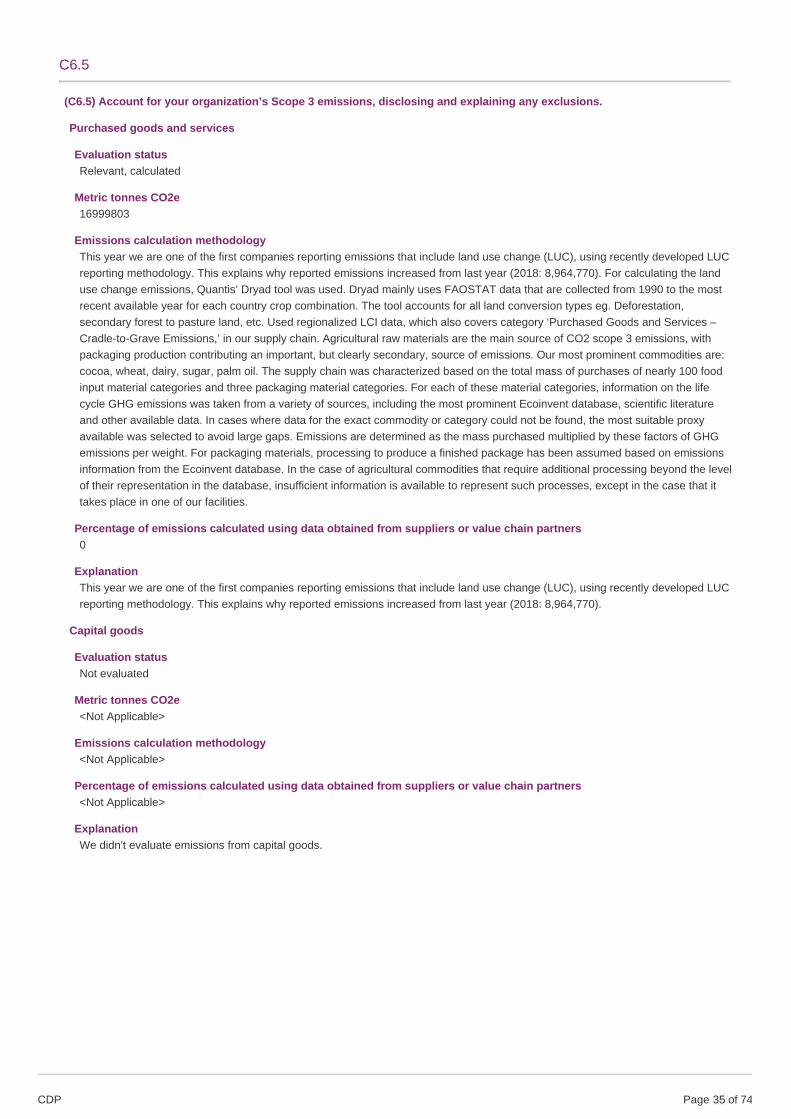
C6.5
(C6.5) Account for your organization’s Scope 3 emissions, disclosing and explaining any exclusions.
Purchased goods and services
Evaluation statusRelevant, calculated
Metric tonnes CO2e16999803
Emissions calculation methodologyThis year we are one of the first companies reporting emissions that include land use change (LUC), using recently developed LUCreporting methodology. This explains why reported emissions increased from last year (2018: 8,964,770). For calculating the landuse change emissions, Quantis’ Dryad tool was used. Dryad mainly uses FAOSTAT data that are collected from 1990 to the mostrecent available year for each country crop combination. The tool accounts for all land conversion types eg. Deforestation,secondary forest to pasture land, etc. Used regionalized LCI data, which also covers category ‘Purchased Goods and Services –Cradle-to-Grave Emissions,’ in our supply chain. Agricultural raw materials are the main source of CO2 scope 3 emissions, withpackaging production contributing an important, but clearly secondary, source of emissions. Our most prominent commodities are:cocoa, wheat, dairy, sugar, palm oil. The supply chain was characterized based on the total mass of purchases of nearly 100 foodinput material categories and three packaging material categories. For each of these material categories, information on the lifecycle GHG emissions was taken from a variety of sources, including the most prominent Ecoinvent database, scientific literatureand other available data. In cases where data for the exact commodity or category could not be found, the most suitable proxyavailable was selected to avoid large gaps. Emissions are determined as the mass purchased multiplied by these factors of GHGemissions per weight. For packaging materials, processing to produce a finished package has been assumed based on emissionsinformation from the Ecoinvent database. In the case of agricultural commodities that require additional processing beyond the levelof their representation in the database, insufficient information is available to represent such processes, except in the case that ittakes place in one of our facilities.
Percentage of emissions calculated using data obtained from suppliers or value chain partners0
ExplanationThis year we are one of the first companies reporting emissions that include land use change (LUC), using recently developed LUCreporting methodology. This explains why reported emissions increased from last year (2018: 8,964,770).
Capital goods
Evaluation statusNot evaluated
Metric tonnes CO2e<Not Applicable>
Emissions calculation methodology<Not Applicable>
Percentage of emissions calculated using data obtained from suppliers or value chain partners<Not Applicable>
ExplanationWe didn't evaluate emissions from capital goods.
CDP Page of 7435
Fuel-and-energy-related activities (not included in Scope 1 or 2)
Evaluation statusRelevant, calculated
Metric tonnes CO2e1043010
Emissions calculation methodologyEmissions from all direct uses of energy have been calculated based on amounts of electricity and fuel used throughout thecompany and applying cradle-to-gate emission factors from the Ecoinvent database, consistent with the methodology usedthroughout the Scope 3 calculations described here. From this result, the Scope 2 emissions, described above, were subtracted.
Percentage of emissions calculated using data obtained from suppliers or value chain partners0
ExplanationScope 3 emissions from utilities were higher in 2018 than 2017, reason being 1) non-manufacturing emissions are reported thisyear 2) use of updated emission factors provided by IEA country level data and regional level data wherever possible 3) updatingfuel combustion calculation methodology.
Upstream transportation and distribution
Evaluation statusRelevant, calculated
Metric tonnes CO2e1261233
Emissions calculation methodologyData excludes warehouses. We use third-party transportation companies (common carriers) to transport raw materials tomanufacturing facilities. The primary GHG emission source from common carriers is CO2 from diesel fuel combustion.Transportation CO2 emissions for production materials were estimated based on a number of simplifying assumptions: averagedistance (e.g., source country to country of use), common modes of transport, average fuel efficiency, assumed shipment weights,etc. The calculation is based on the multiplication of life cycle emissions information for the relevant modes of transport (in units ofemission per tkm) derived from the Ecoinvent database. Previously, the methodology was based on estimating emissions based onquantity of fuel consumed. Starting 2018, a shift was made to estimate emissions based on tkm. The intention behind themethodological update is to better align with the SBTi models.
Percentage of emissions calculated using data obtained from suppliers or value chain partners0
ExplanationPreviously, the methodology was based on estimating emissions based on quantity of fuel consumed. Starting 2018, a shift wasmade to estimate emissions based on tkm. The intention behind the methodological update is to better align with the SBTi models.
Waste generated in operations
Evaluation statusRelevant, calculated
Metric tonnes CO2e124957
Emissions calculation methodologyEmissions from landfill, incineration and recycling of operation waste, inbound packaging, etc. were considered in the calculation.
Percentage of emissions calculated using data obtained from suppliers or value chain partners0
ExplanationEmissions increased this year compared to last year, reasons being 1) new data source that is more comprehensive 2) updatedemissions factors.
CDP Page of 7436
Business travel
Evaluation statusRelevant, calculated
Metric tonnes CO2e47729
Emissions calculation methodologyEmployee air, car and rail business travel emissions were estimated using spend data and EIO-LCA emission model. The source ofthe latest emission factors is taken from Carnegie Mellon University Green Design Institute. (2019) Economic Input-Output LifeCycle Assessment (EIO-LCA) US 2007.
Percentage of emissions calculated using data obtained from suppliers or value chain partners0
ExplanationEmissions show a reduction due to use of new emission factors.
Employee commuting
Evaluation statusRelevant, calculated
Metric tonnes CO2e208314
Emissions calculation methodologyAssumptions: Passenger car, 30 miles per day, 235 days/ yr.
Percentage of emissions calculated using data obtained from suppliers or value chain partners0
ExplanationValue is about the same as last year.
Upstream leased assets
Evaluation statusNot evaluated
Metric tonnes CO2e<Not Applicable>
Emissions calculation methodology<Not Applicable>
Percentage of emissions calculated using data obtained from suppliers or value chain partners<Not Applicable>
ExplanationUpstream leased assets were not evaluated.
CDP Page of 7437
Downstream transportation and distribution
Evaluation statusRelevant, calculated
Metric tonnes CO2e1047969
Emissions calculation methodologyData excludes warehouses. We use third-party transportation companies (common carriers) to supplement our need to transportfinished product from manufacturing facilities to distribution centers, warehouses and customers. The primary GHG emissionsource from common carriers is CO2 from diesel fuel combustion. The calculation is based on the multiplication of life cycleemissions information for the relevant modes of transport per tkm from the Ecoinvent database. Previously, the methodology wasbased on estimating emissions based on quantity of fuel consumed. Starting 2018, a shift was made to estimate emissions basedon tkm. The intention behind the methodological update is to better align with the SBTi models.
Percentage of emissions calculated using data obtained from suppliers or value chain partners
ExplanationPreviously, the methodology was based on estimating emissions based on quantity of fuel consumed. Starting 2018, a shift wasmade to estimate emissions based on tkm. The intention behind the methodological update is to better align with the SBTi models.
Processing of sold products
Evaluation statusNot evaluated
Metric tonnes CO2e<Not Applicable>
Emissions calculation methodology<Not Applicable>
Percentage of emissions calculated using data obtained from suppliers or value chain partners<Not Applicable>
ExplanationWe didn't evaluate processing of sold goods.
Use of sold products
Evaluation statusRelevant, calculated
Metric tonnes CO2e207837
Emissions calculation methodologyThe emissions reported here reflect a rough prediction of the emissions from the use of products. The end-of-life of the foodproducts themselves is not included. The emissions during the use of products include refrigeration for dairy, egg based productsand cheeses. Assumptions have been made based on the proportion of the total of our products sold that are likely to undergo eachuse. For simplicity, it has currently been assumed that all use activities are fueled by electricity. Approximations are then made ofthe amount of electricity use required per kilogram of product. These approximations are made based on preliminary estimates oftypical consumer behaviors and are generic among product categories. The total amount of electricity use is then estimated basedon emissions factors taken from the Ecoinvent database for several countries or an adapted dataset from IEA electricity statistics.
Percentage of emissions calculated using data obtained from suppliers or value chain partners0
ExplanationThis estimate is higher than last year, reasons being: 1) update in emission factors 2) inclusion of refrigeration needed to storeingredients.
CDP Page of 7438
End of life treatment of sold products
Evaluation statusRelevant, calculated
Metric tonnes CO2e789072
Emissions calculation methodologyThe end-of-life of packaging is determined based on the amount of various categories of packaging material that have beenpurchased in the relevant time period (with the assumption that this is also representative of the amount of packaging disposed inthe same period). The proportions of various fates (landfilling, recycling and incineration) of each material have been determined byinformation available for several countries, which has then been applied as an approximation of disposal routes within each of thefive global sales regions. Emissions information is taken from the Ecoinvent database to determine the amount of GHG emissionsoccurring during the landfilling, recycling and incineration of any given material. Generally, an “avoided burden” approach is taken atthe end-of-life routes that result in a beneficial co-product of disposal. For example, in the case of recycling a plastic, it is assumedthat the production of virgin plastic is avoided, and for the combustion of a plastic, it is assumed that a given amount of heat and/orelectricity has been recovered and therefore prevented the production of electricity or heat by other means.
Percentage of emissions calculated using data obtained from suppliers or value chain partners0
Explanation
Downstream leased assets
Evaluation statusNot relevant, explanation provided
Metric tonnes CO2e<Not Applicable>
Emissions calculation methodology<Not Applicable>
Percentage of emissions calculated using data obtained from suppliers or value chain partners<Not Applicable>
ExplanationDownstream leased assets are so far not associated with our business.
Franchises
Evaluation statusNot relevant, explanation provided
Metric tonnes CO2e<Not Applicable>
Emissions calculation methodology<Not Applicable>
Percentage of emissions calculated using data obtained from suppliers or value chain partners<Not Applicable>
ExplanationFranchises are so far not associated with our business.
CDP Page of 7439
Investments
Evaluation statusNot relevant, explanation provided
Metric tonnes CO2e<Not Applicable>
Emissions calculation methodology<Not Applicable>
Percentage of emissions calculated using data obtained from suppliers or value chain partners<Not Applicable>
ExplanationInvestments are so far not associated with our business.
Other (upstream)
Evaluation statusNot relevant, explanation provided
Metric tonnes CO2e<Not Applicable>
Emissions calculation methodology<Not Applicable>
Percentage of emissions calculated using data obtained from suppliers or value chain partners<Not Applicable>
ExplanationNot relevant to our business.
Other (downstream)
Evaluation statusNot relevant, explanation provided
Metric tonnes CO2e<Not Applicable>
Emissions calculation methodology<Not Applicable>
Percentage of emissions calculated using data obtained from suppliers or value chain partners<Not Applicable>
ExplanationNot relevant to our business
C-AC6.6/C-FB6.6/C-PF6.6
(C-AC6.6/C-FB6.6/C-PF6.6) Can you break down your Scope 3 emissions by relevant business activity area?Yes
C-AC6.6a/C-FB6.6a/C-PF6.6a
(C-AC6.6a/C-FB6.6a/C-PF6.6a) Disclose your Scope 3 emissions for each of your relevant business activity areas.
ActivityAgriculture/Forestry
Scope 3 categoryPurchased goods and services
CDP Page of 7440
Emissions (metric tons CO2e)13611085
Please explainThis year we are one of the first companies reporting category 1 emissions that include land use change (LUC), using recentlydevelop LUC reporting methodology. This explains why reported emissions increased from last year (2018: 8,964,770).
ActivityDistribution
Scope 3 categoryUpstream transportation and distribution
Emissions (metric tons CO2e)1261233
Please explainData excludes warehouses. We use third-party transportation companies (common carriers) to transport raw materials tomanufacturing facilities. The primary GHG emission source from common carriers is CO2 from diesel fuel combustion.Transportation CO2 emissions for production materials were estimated based on a number of simplifying assumptions: averagedistance (e.g., source country to country of use), common modes of transport, average fuel efficiency, assumed shipment weights,etc. The calculation is based on the multiplication of life cycle emissions information for the relevant modes of transport (in units ofemission per tkm) derived from the Ecoinvent database. Previously, the methodology was based on estimating emissions based onquantity of fuel consumed. Starting 2018, a shift was made to estimate emissions based on tkm. The intention behind themethodological update is to better align with the SBTi models.
ActivityDistribution
Scope 3 categoryDownstream transportation and distribution
Emissions (metric tons CO2e)1047969
Please explainData excludes warehouses. We use third-party transportation companies (common carriers) to supplement our need to transportfinished product from manufacturing facilities to distribution centers, warehouses and customers. The primary GHG emissionsource from common carriers is CO2 from diesel fuel combustion. The calculation is based on the multiplication of life cycleemissions information for the relevant modes of transport per tkm from the Ecoinvent database. Previously, the methodology wasbased on estimating emissions based on quantity of fuel consumed. Starting 2018, a shift was made to estimate emissions basedon tkm. The intention behind the methodological update is to better align with the SBTi models.
ActivityConsumption
Scope 3 categoryUse of sold products
Emissions (metric tons CO2e)207837
Please explainThe emissions reported here reflect a rough prediction of the emissions from the use of products. The end-of-life of the foodproducts themselves is not included. The emissions during the use of products include refrigeration for dairy, egg based productsand cheeses. Assumptions have been made based on the proportion of the total of our products sold that are likely to undergo eachuse. For simplicity, it has currently been assumed that all use activities are fueled by electricity. Approximations are then made ofthe amount of electricity use required per kilogram of product. These approximations are made based on preliminary estimates oftypical consumer behaviors and are generic among product categories. The total amount of electricity use is then estimated basedon emissions factors taken from the Ecoinvent database for several countries or an adapted dataset from IEA electricity statistics.This estimate is higher than last year, reasons being: 1) update in emission factors 2) inclusion of refrigeration needed to storeingredients.
ActivityConsumption
CDP Page of 7441
Scope 3 categoryEnd of life treatment of sold products
Emissions (metric tons CO2e)789072
Please explainThe end-of-life of packaging is determined based on the amount of various categories of packaging material that have beenpurchased in the relevant time period (with the assumption that this is also representative of the amount of packaging disposed inthe same period). The proportions of various fates (landfilling, recycling and incineration) of each material have been determined byinformation available for several countries, which has then been applied as an approximation of disposal routes within each of thefive global sales regions. Emissions information is taken from the Ecoinvent database to determine the amount of GHG emissionsoccurring during the landfilling, recycling and incineration of any given material. Generally, an “avoided burden” approach is taken atthe end-of-life routes that result in a beneficial co-product of disposal. For example, in the case of recycling a plastic, it is assumedthat the production of virgin plastic is avoided, and for the combustion of a plastic, it is assumed that a given amount of heat and/orelectricity has been recovered and therefore prevented the production of electricity or heat by other means.
C6.7
(C6.7) Are carbon dioxide emissions from biologically sequestered carbon relevant to your organization?Yes
C6.7a
(C6.7a) Provide the emissions from biologically sequestered carbon relevant to your organization in metric tons CO2.
Row 1
Emissions from biologically sequestered carbon (metric tons CO2)20960
CommentEmissions from Bagasse, Wood, Rapeseed Oil and other biomass/biofuel.
C-AC6.8/C-FB6.8/C-PF6.8
(C-AC6.8/C-FB6.8/C-PF6.8) Is biogenic carbon pertaining to your direct operations relevant to your current CDP climatechange disclosure?Yes
C-AC6.8a/C-FB6.8a/C-PF6.8a
CDP Page of 7442
(C-AC6.8a/C-FB6.8a/C-PF6.8a) Account for biogenic carbon data pertaining to your direct operations and identify anyexclusions.
CO2 emissions from biofuel combustion (processing/manufacturing machinery)
Emissions (metric tons CO2)20960
MethodologyDefault emissions factors
Please explainCalculations were made using default emission factors for biogenic fuels as provided by DEFRA.
CO2 emissions from biofuel combustion (other)
Emissions (metric tons CO2)
MethodologyPlease select
Please explain
C-AC6.9/C-FB6.9/C-PF6.9
CDP Page of 7443
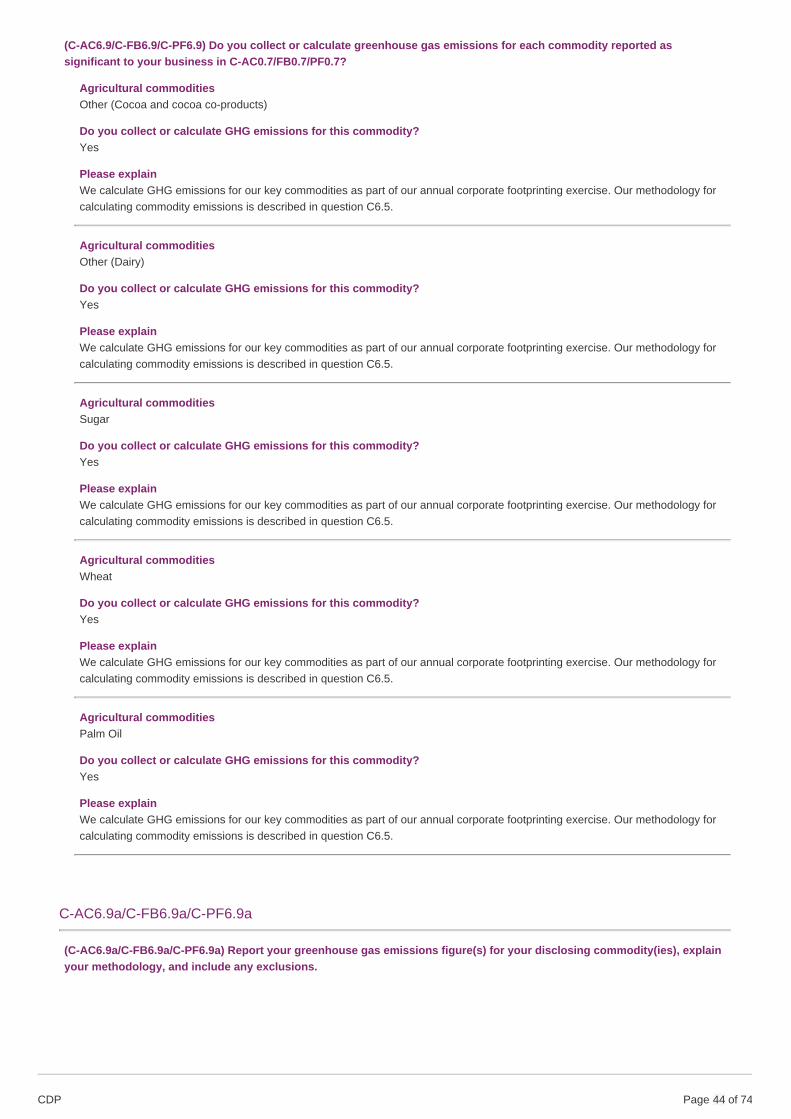
(C-AC6.9/C-FB6.9/C-PF6.9) Do you collect or calculate greenhouse gas emissions for each commodity reported assignificant to your business in C-AC0.7/FB0.7/PF0.7?
Agricultural commoditiesOther (Cocoa and cocoa co-products)
Do you collect or calculate GHG emissions for this commodity?Yes
Please explainWe calculate GHG emissions for our key commodities as part of our annual corporate footprinting exercise. Our methodology forcalculating commodity emissions is described in question C6.5.
Agricultural commoditiesOther (Dairy)
Do you collect or calculate GHG emissions for this commodity?Yes
Please explainWe calculate GHG emissions for our key commodities as part of our annual corporate footprinting exercise. Our methodology forcalculating commodity emissions is described in question C6.5.
Agricultural commoditiesSugar
Do you collect or calculate GHG emissions for this commodity?Yes
Please explainWe calculate GHG emissions for our key commodities as part of our annual corporate footprinting exercise. Our methodology forcalculating commodity emissions is described in question C6.5.
Agricultural commoditiesWheat
Do you collect or calculate GHG emissions for this commodity?Yes
Please explainWe calculate GHG emissions for our key commodities as part of our annual corporate footprinting exercise. Our methodology forcalculating commodity emissions is described in question C6.5.
Agricultural commoditiesPalm Oil
Do you collect or calculate GHG emissions for this commodity?Yes
Please explainWe calculate GHG emissions for our key commodities as part of our annual corporate footprinting exercise. Our methodology forcalculating commodity emissions is described in question C6.5.
C-AC6.9a/C-FB6.9a/C-PF6.9a
(C-AC6.9a/C-FB6.9a/C-PF6.9a) Report your greenhouse gas emissions figure(s) for your disclosing commodity(ies), explainyour methodology, and include any exclusions.
CDP Page of 7444
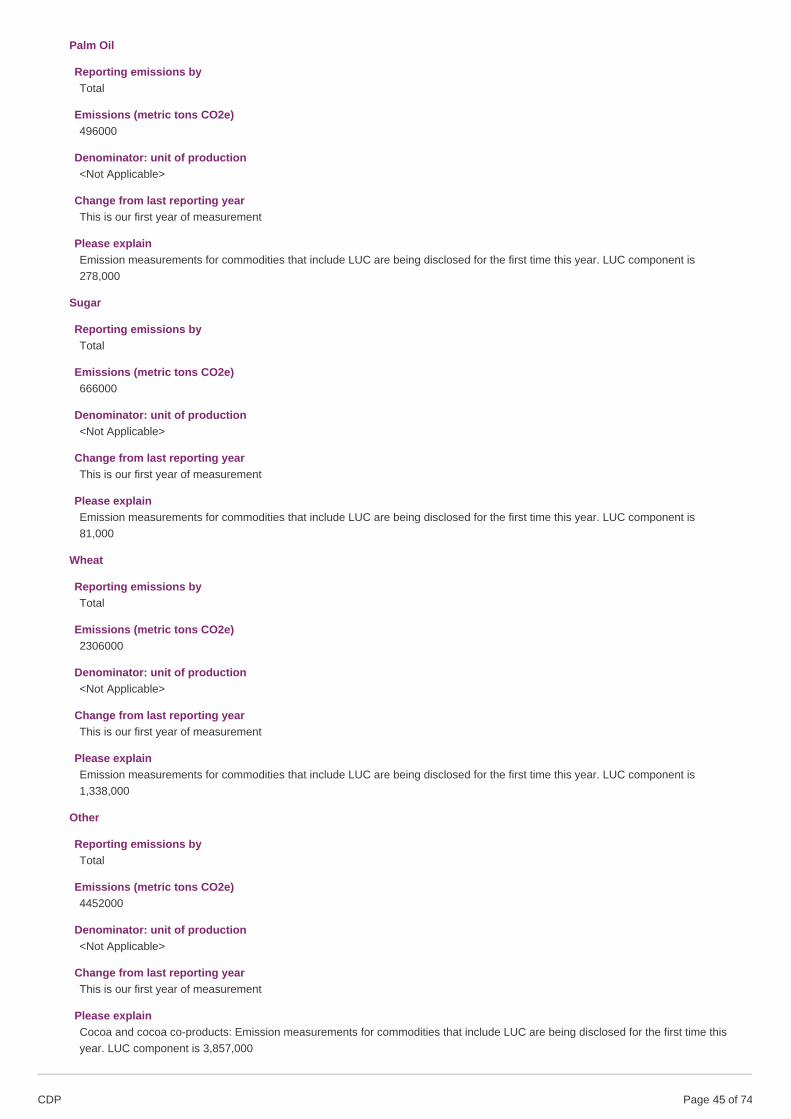
Palm Oil
Reporting emissions byTotal
Emissions (metric tons CO2e)496000
Denominator: unit of production<Not Applicable>
Change from last reporting yearThis is our first year of measurement
Please explainEmission measurements for commodities that include LUC are being disclosed for the first time this year. LUC component is278,000
Sugar
Reporting emissions byTotal
Emissions (metric tons CO2e)666000
Denominator: unit of production<Not Applicable>
Change from last reporting yearThis is our first year of measurement
Please explainEmission measurements for commodities that include LUC are being disclosed for the first time this year. LUC component is81,000
Wheat
Reporting emissions byTotal
Emissions (metric tons CO2e)2306000
Denominator: unit of production<Not Applicable>
Change from last reporting yearThis is our first year of measurement
Please explainEmission measurements for commodities that include LUC are being disclosed for the first time this year. LUC component is1,338,000
Other
Reporting emissions byTotal
Emissions (metric tons CO2e)4452000
Denominator: unit of production<Not Applicable>
Change from last reporting yearThis is our first year of measurement
Please explainCocoa and cocoa co-products: Emission measurements for commodities that include LUC are being disclosed for the first time thisyear. LUC component is 3,857,000
CDP Page of 7445
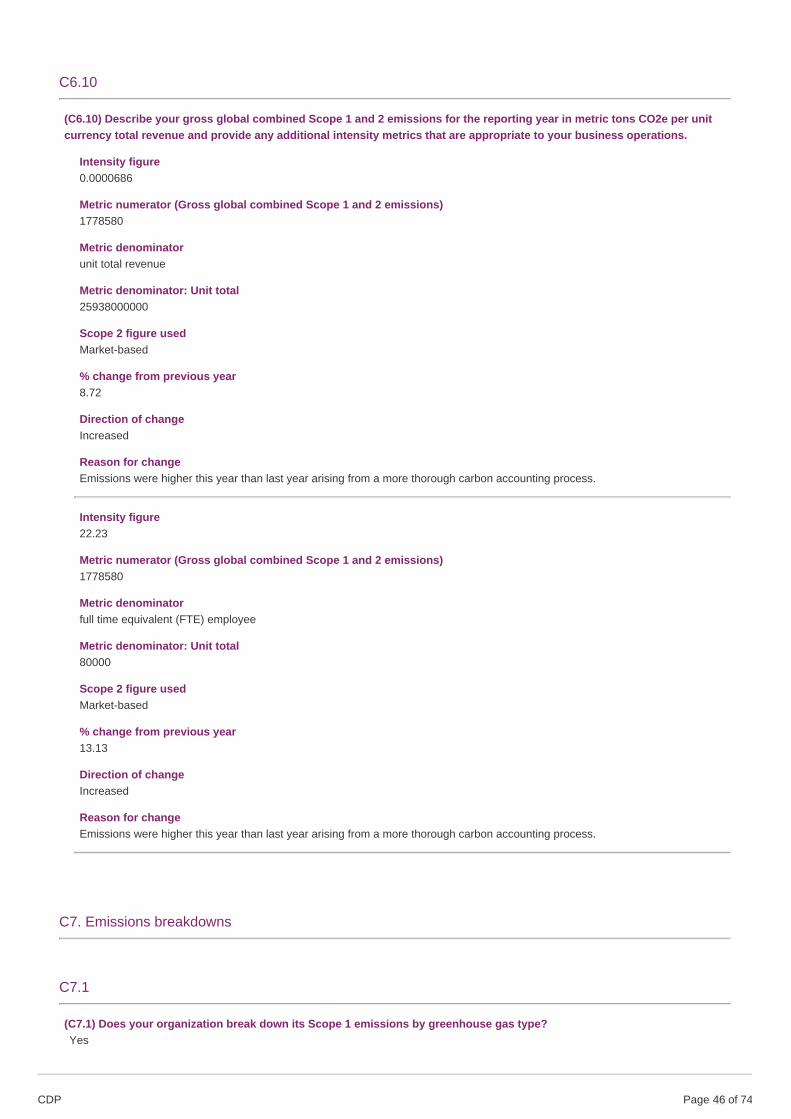
C6.10
(C6.10) Describe your gross global combined Scope 1 and 2 emissions for the reporting year in metric tons CO2e per unitcurrency total revenue and provide any additional intensity metrics that are appropriate to your business operations.
Intensity figure0.0000686
Metric numerator (Gross global combined Scope 1 and 2 emissions)1778580
Metric denominatorunit total revenue
Metric denominator: Unit total25938000000
Scope 2 figure usedMarket-based
% change from previous year8.72
Direction of changeIncreased
Reason for changeEmissions were higher this year than last year arising from a more thorough carbon accounting process.
Intensity figure22.23
Metric numerator (Gross global combined Scope 1 and 2 emissions)1778580
Metric denominatorfull time equivalent (FTE) employee
Metric denominator: Unit total80000
Scope 2 figure usedMarket-based
% change from previous year13.13
Direction of changeIncreased
Reason for changeEmissions were higher this year than last year arising from a more thorough carbon accounting process.
C7. Emissions breakdowns
C7.1
(C7.1) Does your organization break down its Scope 1 emissions by greenhouse gas type?Yes
CDP Page of 7446
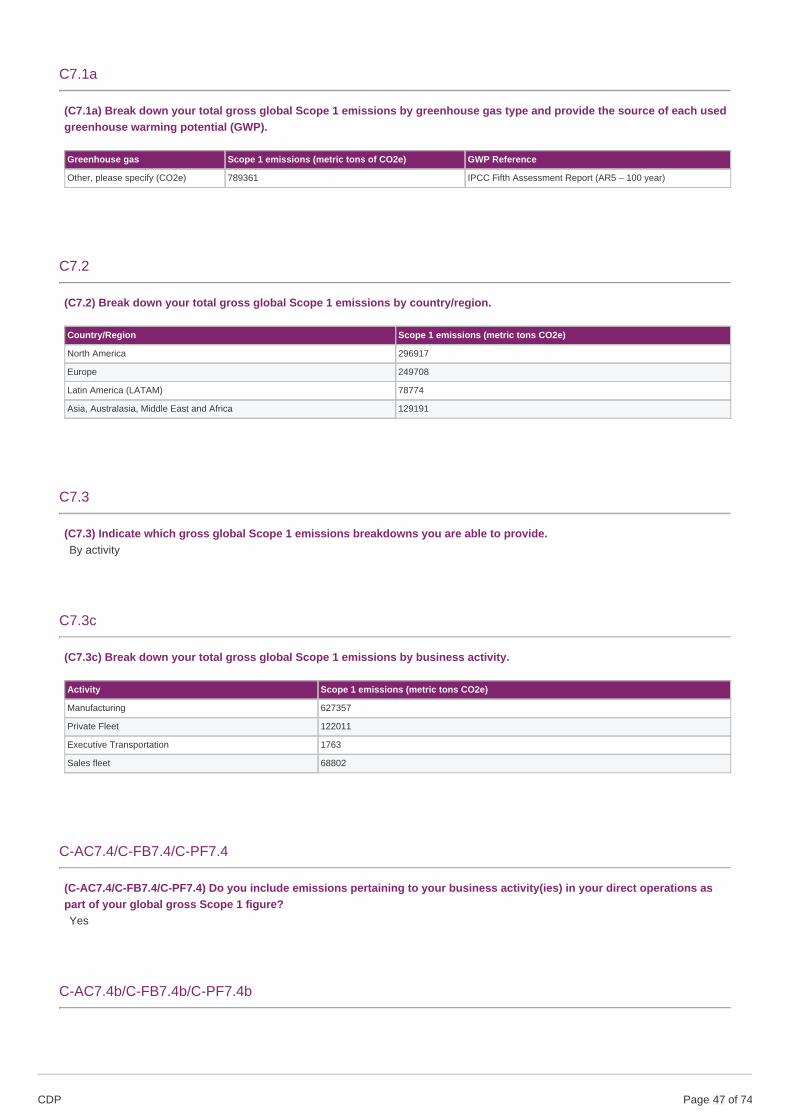
C7.1a
(C7.1a) Break down your total gross global Scope 1 emissions by greenhouse gas type and provide the source of each usedgreenhouse warming potential (GWP).
Greenhouse gas Scope 1 emissions (metric tons of CO2e) GWP Reference
Other, please specify (CO2e) 789361 IPCC Fifth Assessment Report (AR5 – 100 year)
C7.2
(C7.2) Break down your total gross global Scope 1 emissions by country/region.
Country/Region Scope 1 emissions (metric tons CO2e)
North America 296917
Europe 249708
Latin America (LATAM) 78774
Asia, Australasia, Middle East and Africa 129191
C7.3
(C7.3) Indicate which gross global Scope 1 emissions breakdowns you are able to provide.By activity
C7.3c
(C7.3c) Break down your total gross global Scope 1 emissions by business activity.
Activity Scope 1 emissions (metric tons CO2e)
Manufacturing 627357
Private Fleet 122011
Executive Transportation 1763
Sales fleet 68802
C-AC7.4/C-FB7.4/C-PF7.4
(C-AC7.4/C-FB7.4/C-PF7.4) Do you include emissions pertaining to your business activity(ies) in your direct operations aspart of your global gross Scope 1 figure?Yes
C-AC7.4b/C-FB7.4b/C-PF7.4b
CDP Page of 7447
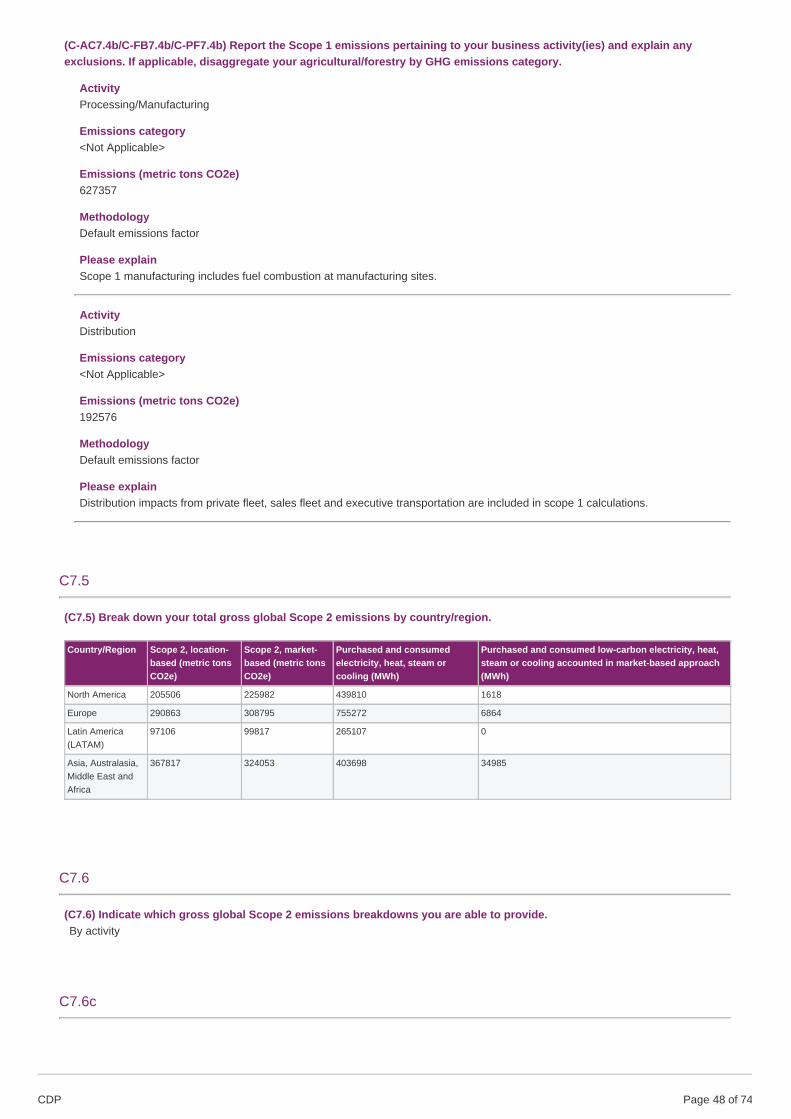
(C-AC7.4b/C-FB7.4b/C-PF7.4b) Report the Scope 1 emissions pertaining to your business activity(ies) and explain anyexclusions. If applicable, disaggregate your agricultural/forestry by GHG emissions category.
ActivityProcessing/Manufacturing
Emissions category<Not Applicable>
Emissions (metric tons CO2e)627357
MethodologyDefault emissions factor
Please explainScope 1 manufacturing includes fuel combustion at manufacturing sites.
ActivityDistribution
Emissions category<Not Applicable>
Emissions (metric tons CO2e)192576
MethodologyDefault emissions factor
Please explainDistribution impacts from private fleet, sales fleet and executive transportation are included in scope 1 calculations.
C7.5
(C7.5) Break down your total gross global Scope 2 emissions by country/region.
Country/Region Scope 2, location-based (metric tonsCO2e)
Scope 2, market-based (metric tonsCO2e)
Purchased and consumedelectricity, heat, steam orcooling (MWh)
Purchased and consumed low-carbon electricity, heat,steam or cooling accounted in market-based approach(MWh)
North America 205506 225982 439810 1618
Europe 290863 308795 755272 6864
Latin America(LATAM)
97106 99817 265107 0
Asia, Australasia,Middle East andAfrica
367817 324053 403698 34985
C7.6
(C7.6) Indicate which gross global Scope 2 emissions breakdowns you are able to provide.By activity
C7.6c
CDP Page of 7448
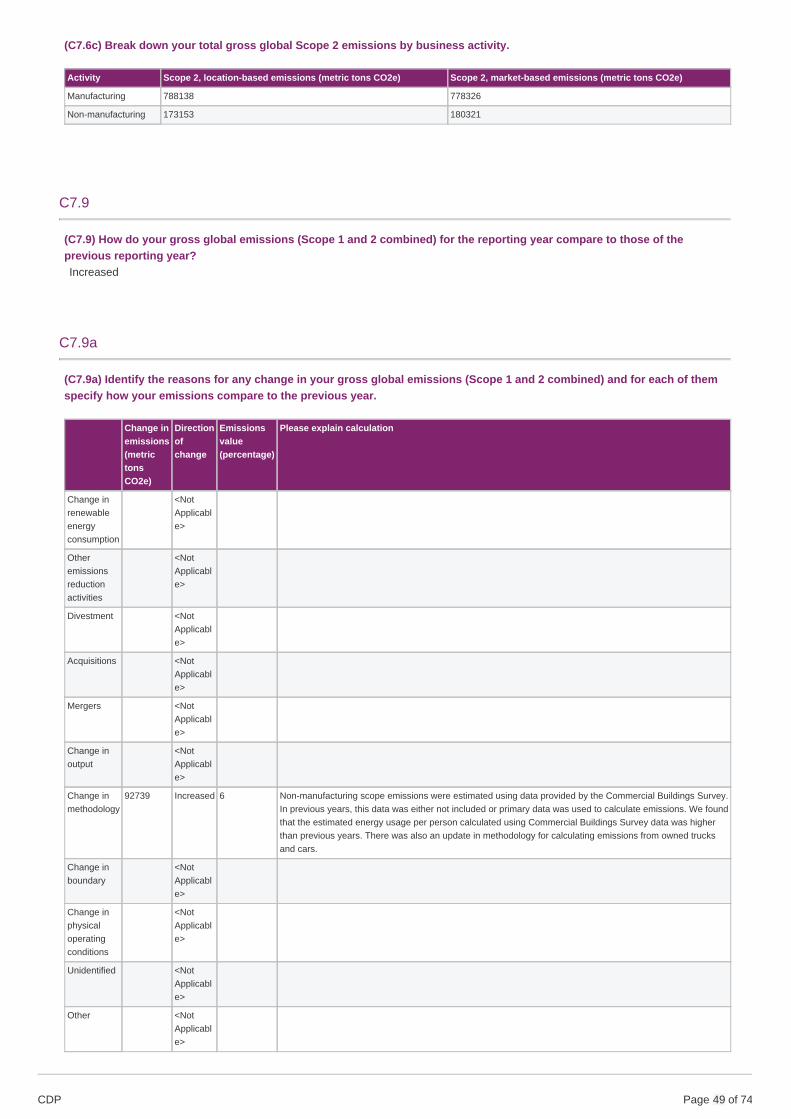
(C7.6c) Break down your total gross global Scope 2 emissions by business activity.
Activity Scope 2, location-based emissions (metric tons CO2e) Scope 2, market-based emissions (metric tons CO2e)
Manufacturing 788138 778326
Non-manufacturing 173153 180321
C7.9
(C7.9) How do your gross global emissions (Scope 1 and 2 combined) for the reporting year compare to those of theprevious reporting year?Increased
C7.9a
(C7.9a) Identify the reasons for any change in your gross global emissions (Scope 1 and 2 combined) and for each of themspecify how your emissions compare to the previous year.
Change inemissions(metrictonsCO2e)
Directionofchange
Emissionsvalue(percentage)
Please explain calculation
Change inrenewableenergyconsumption
<NotApplicable>
Otheremissionsreductionactivities
<NotApplicable>
Divestment <NotApplicable>
Acquisitions <NotApplicable>
Mergers <NotApplicable>
Change inoutput
<NotApplicable>
Change inmethodology
92739 Increased 6 Non-manufacturing scope emissions were estimated using data provided by the Commercial Buildings Survey.In previous years, this data was either not included or primary data was used to calculate emissions. We foundthat the estimated energy usage per person calculated using Commercial Buildings Survey data was higherthan previous years. There was also an update in methodology for calculating emissions from owned trucksand cars.
Change inboundary
<NotApplicable>
Change inphysicaloperatingconditions
<NotApplicable>
Unidentified <NotApplicable>
Other <NotApplicable>
CDP Page of 7449
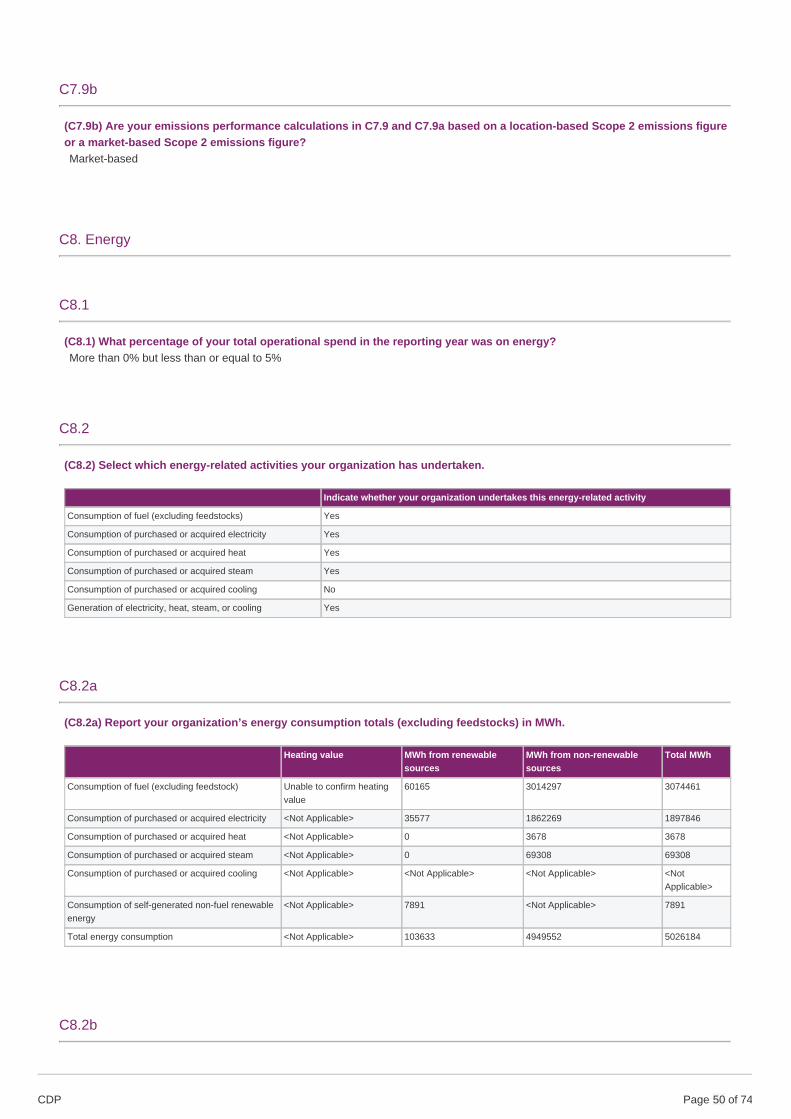
C7.9b
(C7.9b) Are your emissions performance calculations in C7.9 and C7.9a based on a location-based Scope 2 emissions figureor a market-based Scope 2 emissions figure?Market-based
C8. Energy
C8.1
(C8.1) What percentage of your total operational spend in the reporting year was on energy?More than 0% but less than or equal to 5%
C8.2
(C8.2) Select which energy-related activities your organization has undertaken.
Indicate whether your organization undertakes this energy-related activity
Consumption of fuel (excluding feedstocks) Yes
Consumption of purchased or acquired electricity Yes
Consumption of purchased or acquired heat Yes
Consumption of purchased or acquired steam Yes
Consumption of purchased or acquired cooling No
Generation of electricity, heat, steam, or cooling Yes
C8.2a
(C8.2a) Report your organization’s energy consumption totals (excluding feedstocks) in MWh.
Heating value MWh from renewablesources
MWh from non-renewablesources
Total MWh
Consumption of fuel (excluding feedstock) Unable to confirm heatingvalue
60165 3014297 3074461
Consumption of purchased or acquired electricity <Not Applicable> 35577 1862269 1897846
Consumption of purchased or acquired heat <Not Applicable> 0 3678 3678
Consumption of purchased or acquired steam <Not Applicable> 0 69308 69308
Consumption of purchased or acquired cooling <Not Applicable> <Not Applicable> <Not Applicable> <NotApplicable>
Consumption of self-generated non-fuel renewableenergy
<Not Applicable> 7891 <Not Applicable> 7891
Total energy consumption <Not Applicable> 103633 4949552 5026184
C8.2b
CDP Page of 7450
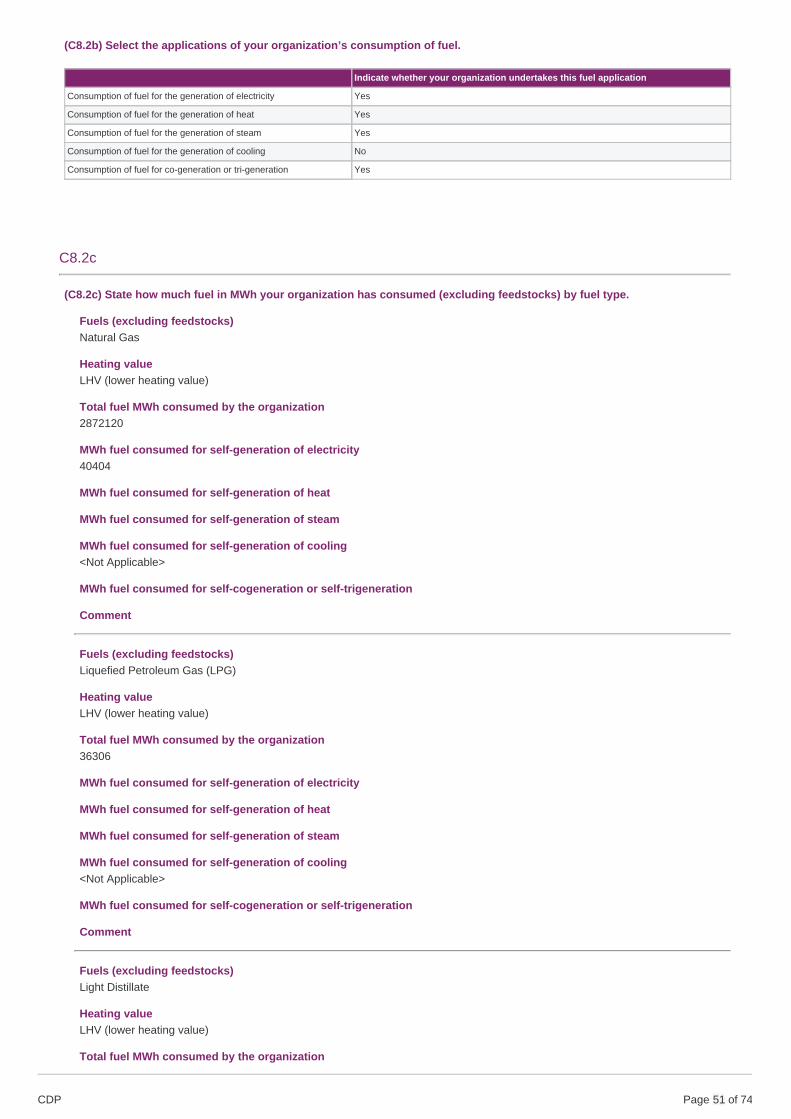
(C8.2b) Select the applications of your organization’s consumption of fuel.
Indicate whether your organization undertakes this fuel application
Consumption of fuel for the generation of electricity Yes
Consumption of fuel for the generation of heat Yes
Consumption of fuel for the generation of steam Yes
Consumption of fuel for the generation of cooling No
Consumption of fuel for co-generation or tri-generation Yes
C8.2c
(C8.2c) State how much fuel in MWh your organization has consumed (excluding feedstocks) by fuel type.
Fuels (excluding feedstocks)Natural Gas
Heating valueLHV (lower heating value)
Total fuel MWh consumed by the organization2872120
MWh fuel consumed for self-generation of electricity40404
MWh fuel consumed for self-generation of heat
MWh fuel consumed for self-generation of steam
MWh fuel consumed for self-generation of cooling<Not Applicable>
MWh fuel consumed for self-cogeneration or self-trigeneration
Comment
Fuels (excluding feedstocks)Liquefied Petroleum Gas (LPG)
Heating valueLHV (lower heating value)
Total fuel MWh consumed by the organization36306
MWh fuel consumed for self-generation of electricity
MWh fuel consumed for self-generation of heat
MWh fuel consumed for self-generation of steam
MWh fuel consumed for self-generation of cooling<Not Applicable>
MWh fuel consumed for self-cogeneration or self-trigeneration
Comment
Fuels (excluding feedstocks)Light Distillate
Heating valueLHV (lower heating value)
Total fuel MWh consumed by the organization
CDP Page of 7451
32572
MWh fuel consumed for self-generation of electricity
MWh fuel consumed for self-generation of heat
MWh fuel consumed for self-generation of steam
MWh fuel consumed for self-generation of cooling<Not Applicable>
MWh fuel consumed for self-cogeneration or self-trigeneration
Comment
Fuels (excluding feedstocks)Bagasse
Heating valueLHV (lower heating value)
Total fuel MWh consumed by the organization27309
MWh fuel consumed for self-generation of electricity
MWh fuel consumed for self-generation of heat
MWh fuel consumed for self-generation of steam
MWh fuel consumed for self-generation of cooling<Not Applicable>
MWh fuel consumed for self-cogeneration or self-trigeneration
Comment
Fuels (excluding feedstocks)Wood
Heating valueLHV (lower heating value)
Total fuel MWh consumed by the organization26413
MWh fuel consumed for self-generation of electricity
MWh fuel consumed for self-generation of heat
MWh fuel consumed for self-generation of steam
MWh fuel consumed for self-generation of cooling<Not Applicable>
MWh fuel consumed for self-cogeneration or self-trigeneration
Comment
Fuels (excluding feedstocks)Butane
Heating valueLHV (lower heating value)
Total fuel MWh consumed by the organization24607
MWh fuel consumed for self-generation of electricity
MWh fuel consumed for self-generation of heat
CDP Page of 7452
MWh fuel consumed for self-generation of steam
MWh fuel consumed for self-generation of cooling<Not Applicable>
MWh fuel consumed for self-cogeneration or self-trigeneration
Comment
Fuels (excluding feedstocks)Heavy Gas Oil
Heating valueLHV (lower heating value)
Total fuel MWh consumed by the organization21995
MWh fuel consumed for self-generation of electricity
MWh fuel consumed for self-generation of heat
MWh fuel consumed for self-generation of steam
MWh fuel consumed for self-generation of cooling<Not Applicable>
MWh fuel consumed for self-cogeneration or self-trigeneration
Comment
Fuels (excluding feedstocks)Coal
Heating valueLHV (lower heating value)
Total fuel MWh consumed by the organization23162
MWh fuel consumed for self-generation of electricity
MWh fuel consumed for self-generation of heat
MWh fuel consumed for self-generation of steam
MWh fuel consumed for self-generation of cooling<Not Applicable>
MWh fuel consumed for self-cogeneration or self-trigeneration
Comment
Fuels (excluding feedstocks)Propane Liquid
Heating valueLHV (lower heating value)
Total fuel MWh consumed by the organization1662
MWh fuel consumed for self-generation of electricity
MWh fuel consumed for self-generation of heat
MWh fuel consumed for self-generation of steam
MWh fuel consumed for self-generation of cooling<Not Applicable>
MWh fuel consumed for self-cogeneration or self-trigeneration
CDP Page of 7453
Comment
C8.2d
(C8.2d) List the average emission factors of the fuels reported in C8.2c.
Bagasse
Emission factor3.65
Unitkg CO2e per GJ
Emission factor sourceDEFRA, 2018
Comment
Butane
Emission factor61.63
Unitkg CO2e per GJ
Emission factor sourceEPA, 2018
Comment
Coal
Emission factor94.975
Unitkg CO2e per GJ
Emission factor sourceDEFRA, 2018
Comment
Heavy Gas Oil
Emission factor79.289
Unitkg CO2e per GJ
Emission factor sourceDEFRA, 2018
Comment
CDP Page of 7454
Light Distillate
Emission factor81.71
Unitkg CO2e per GJ
Emission factor sourceDEFRA, 2018
Comment
Liquefied Petroleum Gas (LPG)
Emission factor63.972
Unitkg CO2e per GJ
Emission factor sourceDEFRA, 2018
Comment
Natural Gas
Emission factor56.769
Unitkg CO2e per GJ
Emission factor sourceDEFRA, 2018
Comment
Propane Liquid
Emission factor59.83
Unitkg CO2e per GJ
Emission factor sourceEPA, 2018
Comment
Wood
Emission factor4.183
Unitkg CO2e per GJ
Emission factor sourceDEFRA, 2018
Comment
C8.2e
CDP Page of 7455
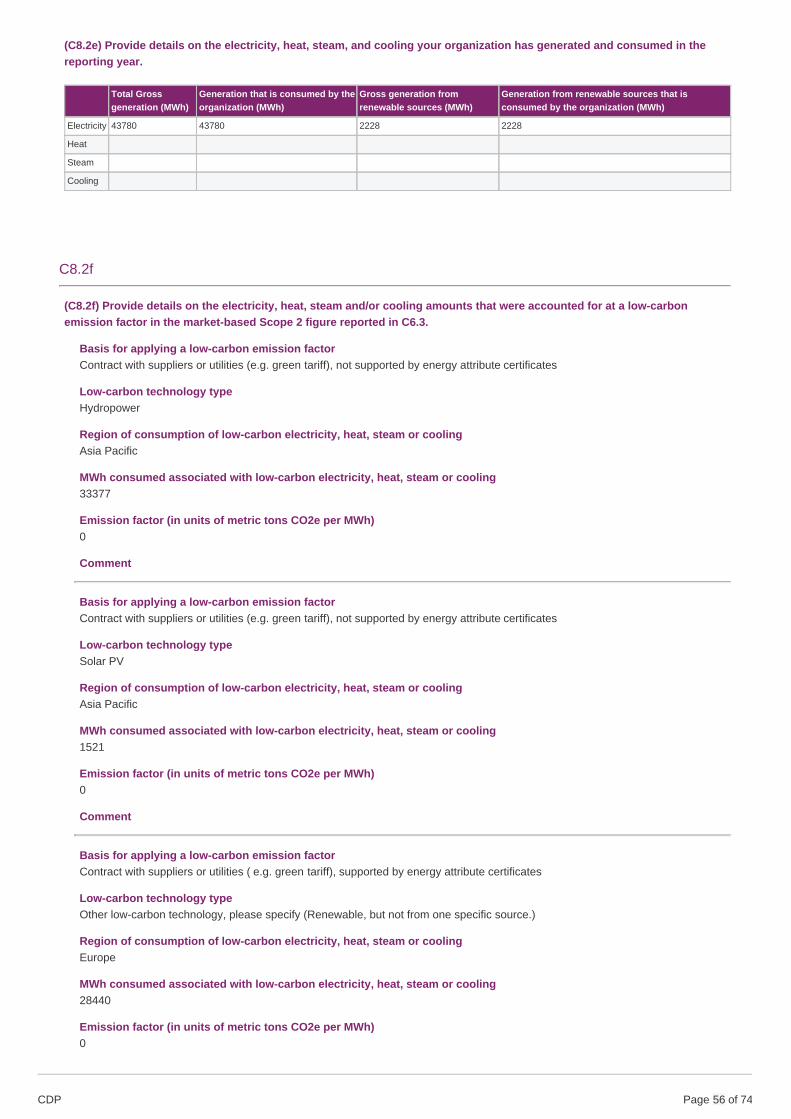
(C8.2e) Provide details on the electricity, heat, steam, and cooling your organization has generated and consumed in thereporting year.
Total Grossgeneration (MWh)
Generation that is consumed by theorganization (MWh)
Gross generation fromrenewable sources (MWh)
Generation from renewable sources that isconsumed by the organization (MWh)
Electricity 43780 43780 2228 2228
Heat
Steam
Cooling
C8.2f
(C8.2f) Provide details on the electricity, heat, steam and/or cooling amounts that were accounted for at a low-carbonemission factor in the market-based Scope 2 figure reported in C6.3.
Basis for applying a low-carbon emission factorContract with suppliers or utilities (e.g. green tariff), not supported by energy attribute certificates
Low-carbon technology typeHydropower
Region of consumption of low-carbon electricity, heat, steam or coolingAsia Pacific
MWh consumed associated with low-carbon electricity, heat, steam or cooling33377
Emission factor (in units of metric tons CO2e per MWh)0
Comment
Basis for applying a low-carbon emission factorContract with suppliers or utilities (e.g. green tariff), not supported by energy attribute certificates
Low-carbon technology typeSolar PV
Region of consumption of low-carbon electricity, heat, steam or coolingAsia Pacific
MWh consumed associated with low-carbon electricity, heat, steam or cooling1521
Emission factor (in units of metric tons CO2e per MWh)0
Comment
Basis for applying a low-carbon emission factorContract with suppliers or utilities ( e.g. green tariff), supported by energy attribute certificates
Low-carbon technology typeOther low-carbon technology, please specify (Renewable, but not from one specific source.)
Region of consumption of low-carbon electricity, heat, steam or coolingEurope
MWh consumed associated with low-carbon electricity, heat, steam or cooling28440
Emission factor (in units of metric tons CO2e per MWh)0
CDP Page of 7456
Comment
Basis for applying a low-carbon emission factorContract with suppliers or utilities (e.g. green tariff), not supported by energy attribute certificates
Low-carbon technology typeOther low-carbon technology, please specify (geothermal)
Region of consumption of low-carbon electricity, heat, steam or coolingEurope
MWh consumed associated with low-carbon electricity, heat, steam or cooling6864
Emission factor (in units of metric tons CO2e per MWh)0
Comment
Basis for applying a low-carbon emission factorContract with suppliers or utilities (e.g. green tariff), not supported by energy attribute certificates
Low-carbon technology typeOther low-carbon technology, please specify (Gas fired power plant)
Region of consumption of low-carbon electricity, heat, steam or coolingAsia Pacific
MWh consumed associated with low-carbon electricity, heat, steam or cooling29136
Emission factor (in units of metric tons CO2e per MWh)0.14
Comment
C9. Additional metrics
C9.1
CDP Page of 7457
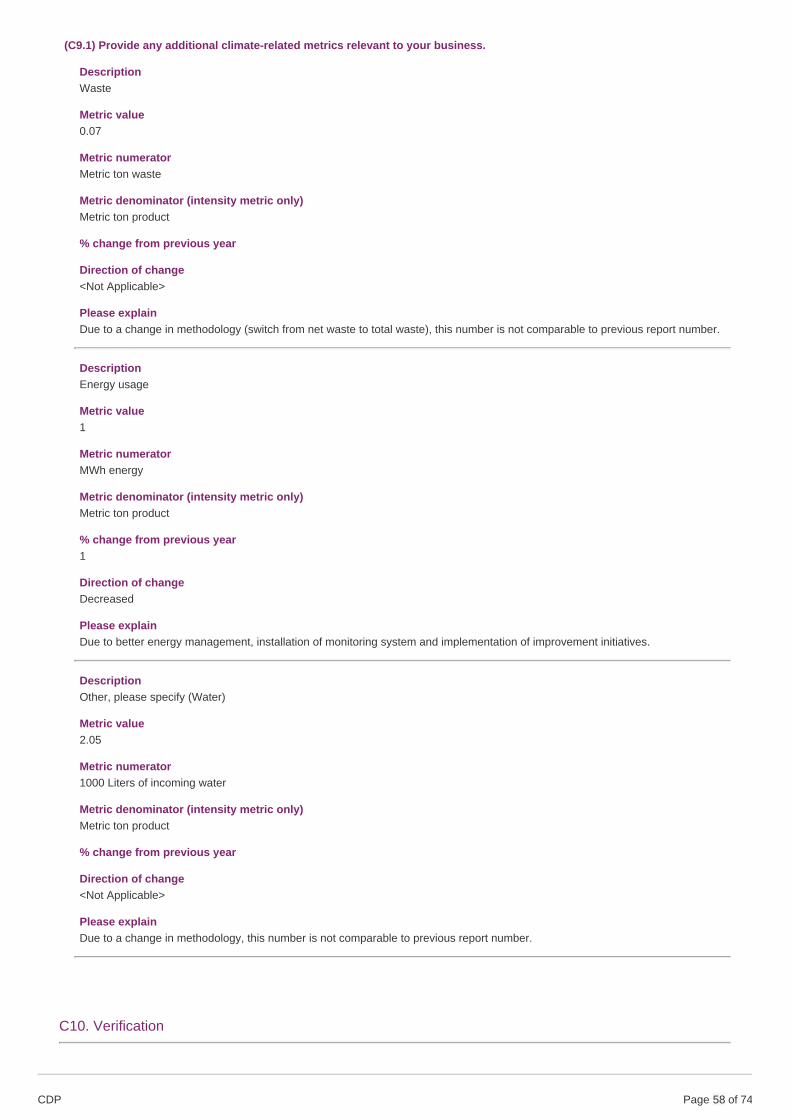
(C9.1) Provide any additional climate-related metrics relevant to your business.
DescriptionWaste
Metric value0.07
Metric numeratorMetric ton waste
Metric denominator (intensity metric only)Metric ton product
% change from previous year
Direction of change<Not Applicable>
Please explainDue to a change in methodology (switch from net waste to total waste), this number is not comparable to previous report number.
DescriptionEnergy usage
Metric value1
Metric numeratorMWh energy
Metric denominator (intensity metric only)Metric ton product
% change from previous year1
Direction of changeDecreased
Please explainDue to better energy management, installation of monitoring system and implementation of improvement initiatives.
DescriptionOther, please specify (Water)
Metric value2.05
Metric numerator1000 Liters of incoming water
Metric denominator (intensity metric only)Metric ton product
% change from previous year
Direction of change<Not Applicable>
Please explainDue to a change in methodology, this number is not comparable to previous report number.
C10. Verification
CDP Page of 7458
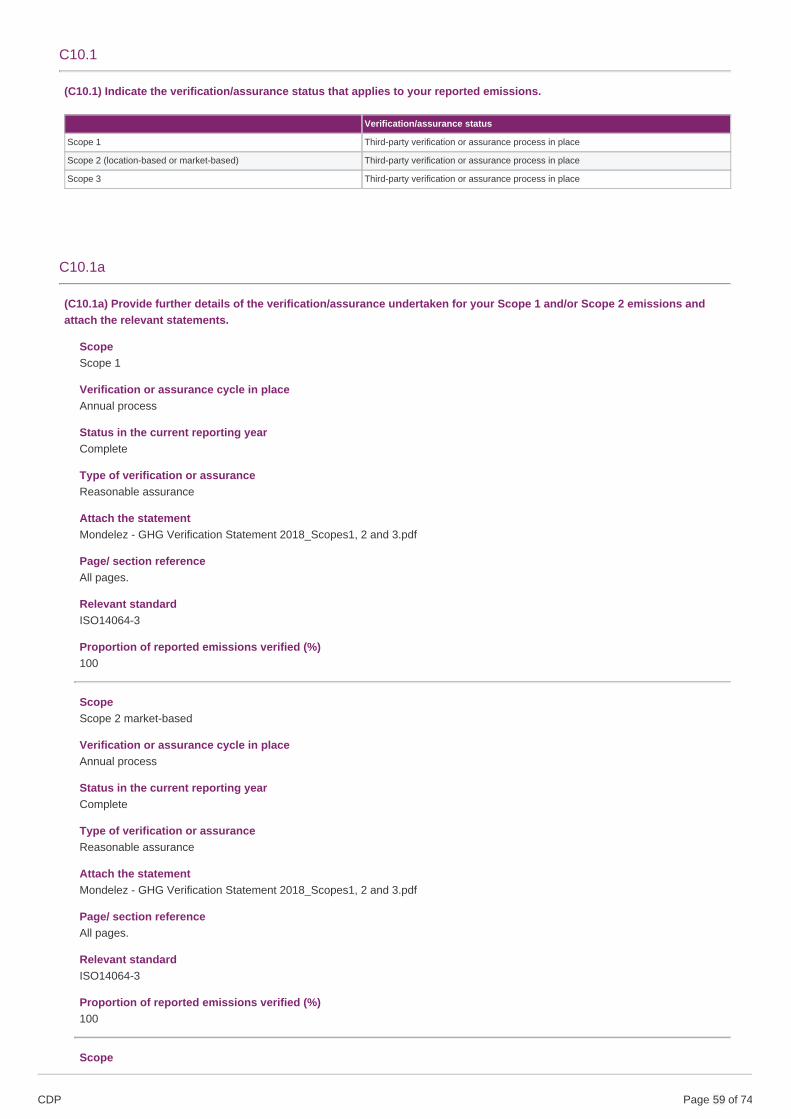
C10.1
(C10.1) Indicate the verification/assurance status that applies to your reported emissions.
Verification/assurance status
Scope 1 Third-party verification or assurance process in place
Scope 2 (location-based or market-based) Third-party verification or assurance process in place
Scope 3 Third-party verification or assurance process in place
C10.1a
(C10.1a) Provide further details of the verification/assurance undertaken for your Scope 1 and/or Scope 2 emissions andattach the relevant statements.
ScopeScope 1
Verification or assurance cycle in placeAnnual process
Status in the current reporting yearComplete
Type of verification or assuranceReasonable assurance
Attach the statementMondelez - GHG Verification Statement 2018_Scopes1, 2 and 3.pdf
Page/ section referenceAll pages.
Relevant standardISO14064-3
Proportion of reported emissions verified (%)100
ScopeScope 2 market-based
Verification or assurance cycle in placeAnnual process
Status in the current reporting yearComplete
Type of verification or assuranceReasonable assurance
Attach the statementMondelez - GHG Verification Statement 2018_Scopes1, 2 and 3.pdf
Page/ section referenceAll pages.
Relevant standardISO14064-3
Proportion of reported emissions verified (%)100
Scope
CDP Page of 7459
Scope 2 location-based
Verification or assurance cycle in placeAnnual process
Status in the current reporting yearComplete
Type of verification or assuranceReasonable assurance
Attach the statementMondelez - GHG Verification Statement 2018_Scopes1, 2 and 3.pdf
Page/ section referenceAll pages.
Relevant standardISO14064-3
Proportion of reported emissions verified (%)100
C10.1b
(C10.1b) Provide further details of the verification/assurance undertaken for your Scope 3 emissions and attach the relevantstatements.
ScopeScope 3- all relevant categories
Verification or assurance cycle in placeAnnual process
Status in the current reporting yearComplete
Attach the statementMondelez - GHG Verification Statement 2018_Scopes1, 2 and 3.pdf
Page/section referenceAll pages.
Relevant standardISO14064-3
C10.2
(C10.2) Do you verify any climate-related information reported in your CDP disclosure other than the emissions figuresreported in C6.1, C6.3, and C6.5?No, we do not verify any other climate-related information reported in our CDP disclosure
C11. Carbon pricing
C11.1
CDP Page of 7460
(C11.1) Are any of your operations or activities regulated by a carbon pricing system (i.e. ETS, Cap & Trade or Carbon Tax)?Yes
C11.1a
(C11.1a) Select the carbon pricing regulation(s) which impacts your operations.EU ETS
C11.1b
(C11.1b) Complete the following table for each of the emissions trading systems in which you participate.
EU ETS
% of Scope 1 emissions covered by the ETS4.08
Period start dateJanuary 1 2018
Period end dateDecember 31 2018
Allowances allocated12721
Allowances purchased19000
Verified emissions in metric tons CO2e31755
Details of ownershipFacilities we own and operate
Comment
C11.1d
(C11.1d) What is your strategy for complying with the systems in which you participate or anticipate participating?
We periodically evaluate exposure to EU ETS and decide if this justifies a centralized approach or local management. We continuedto pursue a strategy of reducing emission at source, supported by evaluating internal trading before external trading.
C11.2
(C11.2) Has your organization originated or purchased any project-based carbon credits within the reporting period?No
C11.3
(C11.3) Does your organization use an internal price on carbon?No, and we do not currently anticipate doing so in the next two years
CDP Page of 7461
C12. Engagement
C12.1
(C12.1) Do you engage with your value chain on climate-related issues?Yes, our suppliers
C12.1a
(C12.1a) Provide details of your climate-related supplier engagement strategy.
Type of engagementEngagement & incentivization (changing supplier behavior)
Details of engagementRun an engagement campaign to educate suppliers about climate change
% of suppliers by number43
% total procurement spend (direct and indirect)
% Scope 3 emissions as reported in C6.58.81
Rationale for the coverage of your engagementThe % of suppliers by number represents the proportion of our cocoa sourced via Cocoa Life during 2018. Our goal is that by 2025,all chocolate brands will source their cocoa from Cocoa Life. At the end of 2018, we reached 142,900 farmers in 1,400communities.
Impact of engagement, including measures of successIn April 2019, we published Cocoa Life’s 2018 Annual Report, the first-ever large-scale impact report in the cocoa industry, whichshows encouraging results from the first six years of the program. The report shows that Cocoa Life is having a positive impact: •Cocoa yields are continuously improving and results show that as cocoa farms become more efficient, their yield increases. This isan important development, as farms that can do more with less land are able to create spare land that can be used for otherincome-generating activities, helping make cocoa farming a prosperous business. • More communities are steering their owndevelopment and Cocoa Life communities can become drivers of change. Through the use of planning and advocacy tools, thesecommunities have been able to attract the funding and resources needed to develop — an important step because sector changewill only be sustained if local actors feel empowered to do so. • Farmers are choosing not to expand into protected forests andencouraging and enabling cocoa farmers and communities to protect the land where cocoa is grown has been fundamental to theCocoa Life approach. Mapping efforts and tools support farmers in understanding how to get more out of their farms – helping thembuild better businesses. Since 2016, we have promoted a coordinated strategy and supply chain transparency by openly publishingour farm mapping updates online. This marked the first time a large cocoa sourcing company had disclosed locations of the cocoafarms they source from. We are the first branded food producer to partner with Global Forest Watch to implement satellite imagemapping practices to analyze how Cocoa Life farms interact with forested and protected land. This allows us to intervene if farmersexpand into protected areas. Our interactive online map provides public traceability of locations of Cocoa Life farms and supportsfarmers in improving yields. • As of 2018, 93,416 of Cocoa Life farms in Ghana, Cote d’Ivoire and Indonesia (63% of the Cocoa Lifefarms in these origin regions) and they are not in priority protected forest areas. • Mondelēz International commits to map 100% ofCocoa Life farms in these origin regions by the end of 2019. • These efforts reduce deforestation, reducing climate changeimpacts.
CommentFor Cocoa Life: We invest in practices and resources to improve farmer productivity on existing land to promote forestconservation. • We have trained 114,380 community members and farmers as of 2018 on good environmental practices. • Inpartnership with the United Nations Development Programme, as of 2018 we planted over one million trees on cocoa farms inGhana and are planting 700,000 trees in Cote d’Ivoire to restore forest lands and make farmer cocoa yields more productive.Cocoa Life efforts also are aimed at helping farmers become more resilient to climate change. See https://www.cocoalife.org/the-program/climate-change. Our climate change strategy addresses deforestation in our raw material supply chain, with a particular
CDP Page of 7462
focus on cocoa and palm oil. Cocoa Life is an integrated cocoa sourcing strategy, addressing farming, community, livelihoods,youth and environment. As part of Cocoa Life’s climate change strategy, we have REDD+ partnerships with the governments ofCote d’Ivoire and Ghana, focused on addressing deforestation in cocoa producing areas. Cocoa Life helps to transform markets byconnecting consumers with cocoa origin communities through the use of an on-pack logo on selected brands, including CadburyDairy Milk, Cote d’Or and Marabou. In addition to Cocoa Life, we helped instigate the sector-wide Cocoa and Forest Initiative,working with cocoa and chocolate companies, the governments of Cote d’Ivoire and Ghana and international partners.
Type of engagementEngagement & incentivization (changing supplier behavior)
Details of engagementRun an engagement campaign to educate suppliers about climate change
% of suppliers by number60
% total procurement spend (direct and indirect)
% Scope 3 emissions as reported in C6.5
Rationale for the coverage of your engagementThe % of suppliers by number represents the proportion of our EU biscuits made with wheat from our Harmony program during2018. Our goal is that by 2022, all EU biscuits will source their wheat from Harmony.
Impact of engagement, including measures of successIn 2007, our biscuit brands in France had a vision of a better way to grow wheat and so Harmony was born. Today, our Harmonyprogram has grown into an industry-leading and well-respected program for sustainable farming. More than 1,500 farmers acrossEurope have joined the initiative and 100 percent of the wheat supply to our French bakeries comes from the Harmony fields.Through Harmony, we work with farmers across Europe to grow wheat in a way that helps conserve water, cares for the soil,protects and promotes biodiversity, and reduces carbon emissions. We also engage with governments and NGOs throughout theprocess, and 10 percent of farmers are audited each year by an independent organization to ensure compliance with the HarmonyCharter. As a result, the program has led to a 20 percent reduction in pesticide use, and nearly 10 million bees and more than 25species of butterflies have been observed in flowers sown around the Harmony fields. In addition to our work in EU, since 2015,we’ve partnered with Michigan State University (MSU) and our supplier of soft white wheat, Cooperative Elevator Company (Coop),a 100+ year old cooperative. In partnership with MSU and Coop, we engage a group of about 100 family farmers each year to tracktheir farming practices, use of inputs such as fertilizer, and their yield. The group anonymously tracks their own year-on-yearperformance, as well as their performance versus peers. In 2018, MSU analyzed data over three years of the program anddetermined that farmers who used advanced agronomy practices improved their yields between 1.5 and 4 bushels per acre morethan those who didn’t. The study also found these improvements are based on better intelligence, enabling better decision-makingby farmers. But the impact benefits did not stop at the wheat we buy for Triscuit. Farmers in our program grew 7.5 times morewheat than we tracked in our program and Coop has 1,100 members, so the benefits can be scaled up across a much wider area.As a result, MSU and Coop’s agronomy team are working to make the program’s learnings more widely accessible.
CommentEach year, the Harmony Charter is reviewed and updated as part of our continuous improvement approach. In 2016, we began anambitious monitoring system to measure and assess the environmental and economic impact of Harmony practices. Working inpartnership with SMAG, a software solutions provider for the agricultural sector, and Agrosolutions, we’ve developed an automatedreporting approach to calculate and monitor 12 key economic and environmental indicators on Harmony farms. The results will beused to inform continuous improvement with farmers and to advocate for the continued shift toward sustainable wheat.
Type of engagementCompliance & onboarding
Details of engagementClimate change is integrated into supplier evaluation processes
% of suppliers by number100
% total procurement spend (direct and indirect)
% Scope 3 emissions as reported in C6.52.28
Rationale for the coverage of your engagementThe % of suppliers by number represents the proportion of our palm oil supply covered by our Palm Oil Action Plan. Our goal is for100% of our palm oil to be traceable to the mill from suppliers with aligned policies.
CDP Page of 7463
Impact of engagement, including measures of successSince 2013, 100% of our supply has been RSPO and in 2018 95%+ was traceable to the mill and 99% from suppliers with policiesaligned to ours. RSPO efforts directly relate to reducing climate impacts by working to eliminate deforestation. We have a fulsomeaction plan available at: https://www.mondelezinternational.com/impact/sustainable-resources-and-agriculture/agricultural-supply-chain/palm-oil We require suppliers to meet the terms of our Palm Oil Action as a condition of doing business and we evaluate theirperformance against it regularly. We called for our suppliers to act faster to eliminate deforestation and to map and monitor all palmoil plantations and concessions. Specifically, we have asked our suppliers to commit to palm oil concession mapping as a vital stepto accountability and change. We also announced our decision to exclude 12 upstream suppliers that were found to be involved indeforestation, because we believe urgent action is needed across the entire supply chain to protect the Earth’s forests and deliverbenefits to countries that produce palm oil.
CommentOur climate change strategy addresses deforestation in our raw material supply chain, with a particular focus on cocoa and palmoil. Among other things, our Palm Oil Action Plan requires suppliers to improve practices across entire operations. It also focuseson risk assessment and engagement of third-party suppliers to drive accountability for traded oil. Key provisions require suppliersto: • Take full responsibility for eliminating deforestation in their own operation and upstream supply chain by mapping andmonitoring all plantations and adopting a “suspend and engage” approach requiring immediate suspension of companies involvedin deforestation. • Take action against the exploitation of worker human rights through adopting the Consumer Goods Forum (CGF)Priority Industry Principles on forced labor. • Improve traceability and transparency by maintaining universal mill lists with grouplevel owners clearly indicated, and publishing them regularly, as well as using satellite technology to map and monitor sources ofpalm. • Demonstrate implementation of supplier progress against this updated Palm Oil Action Plan as a prerequisite of doingbusiness with Mondelēz International.
C-AC12.2/C-FB12.2/C-PF12.2
(C-AC12.2/C-FB12.2/C-PF12.2) Do you encourage your suppliers to undertake any agricultural or forest managementpractices with climate change mitigation and/or adaptation benefits?Yes
C-AC12.2a/C-FB12.2a/C-PF12.2a
(C-AC12.2a/C-FB12.2a/C-PF12.2a) Specify which agricultural or forest management practices with climate change mitigationand/or adaptation benefits you encourage your suppliers to undertake and describe your role in the implementation of eachpractice.
Management practice reference numberMP1
Management practiceAgroforestry
Description of management practiceIntroduction of shade trees and agroforestry practices on cocoa farms to reduce emissions and increase productivity and climatechange resilience.
Your role in the implementationFinancialKnowledge sharingOperationalProcurement
Explanation of how you encourage implementationVia our Cocoa Life program, in partnership with the United Nations Development Programme, we have planted over one milliontrees on cocoa farms in Ghana (2018) and are planting 700,000 trees in Cote d’Ivoire to restore forest lands and make farmercocoa yields more productive. In addition, we invest in agroforestry research, development and implementation as part of thesolution and have identified a knowledge gap on the topic as it relates to the financial impact for smallholders. This is why we arerunning trials and research with farms to introduce agroforestry at different levels of tree density and introduced an incentive modelto promote agroforestry practices. Our Payments for Environmental Services (PES) pilot programs incentivize farmers andcommunities to protect forests and adopt forest-friendly farming techniques such as planting complementary crops alongsidecocoa.
CDP Page of 7464
Climate change related benefitEmissions reductions (mitigation)Increasing resilience to climate change (adaptation)Increase carbon sink (mitigation)
CommentGuided by the measurable, third-party verified key indicator results reported in our Cocoa Life 2018 Annual Report, our Cocoa Lifeprogram will refine its focus to key areas of intervention where we can make the biggest impact, including combating deforestationthrough both conservation and restoration cocoa farming practices. Achieving zero deforestation globally requires public-privatepartnerships. Cocoa origin governments must have the right policies and commitments in place and align on agroforestryprinciples. We will continue to publicly report our impact results and encourage more industry members to implement integratedand holistic approaches to broaden the collective impact at scale.
Management practice reference numberMP2
Management practiceBiodiversity considerations
Description of management practiceFarmers in our Harmony program implement the following actions for biodiversity: • At least 3% of every Harmony wheat fielddedicated to flowers or hedges • Inter-season crops • Actions to sensitize farmers to the issue of biodiversity • Responsible use ofpesticides
Your role in the implementationKnowledge sharingOperationalProcurement
Explanation of how you encourage implementationThrough Harmony, we work with farmers across Europe to grow wheat in a way that helps conserve water, cares for the soil,protects and promotes biodiversity, and reduces carbon emissions. We also engage with governments and NGOs throughout theprocess, and 10 percent of farmers are audited each year by an independent organization to ensure compliance with the HarmonyCharter. As a result, the program has led to a 20 percent reduction in pesticide use, and nearly 10 million bees and more than 25species of butterflies have been observed in flowers sown around the Harmony fields.
Climate change related benefitIncreasing resilience to climate change (adaptation)Reduced demand for pesticides (adaptation)
CommentAt the end of 2018, 75 percent of our biscuits in Western Europe—or 60 percent across the EU—were made with Harmony wheat,including brands such as LU, Oro, LiGA, and Fontaneda. While we’ve made solid progress so far, we know there is still more to bedone. Our planned scale-up will lead to increased planting during 2019 and our ambition is to source 100 percent of our wheat needin the EU by 2022.
Management practice reference numberMP3
Management practiceFertilizer management
Description of management practiceFarmers in our Harmony program grow wheat in a sustainable way to prevent the usage of pesticides and fertilizers, preservewater and soil reduce carbon emissions, through: • Rigorous Selection of seeds for the resilience and quality of our biscuits • Croprotation to minimize treatment • Principled use of water and reasoned treatment at the last resort In North America, our wheatfarmers are adopting innovative practices to optimize pesticide and fertilizer use, growing all of the wheat we need for our Triscuitbrand, with a lower environmental footprint.
Your role in the implementationKnowledge sharingOperationalProcurement
Explanation of how you encourage implementationThrough Harmony, we work with farmers across Europe to grow wheat in a way that helps conserve water, cares for the soil,
CDP Page of 7465
protects and promotes biodiversity, and reduces carbon emissions. We also engage with governments and NGOs throughout theprocess, and 10 percent of farmers are audited each year by an independent organization to ensure compliance with the HarmonyCharter. As a result, the program has led to a 20 percent reduction in pesticide use, and nearly 10 million bees and more than 25species of butterflies have been observed in flowers sown around the Harmony fields. Since 2015, we’ve partnered with MichiganState University (MSU) and our supplier of soft white wheat, Cooperative Elevator Company (Coop), a 100+ year-old cooperative.In partnership with MSU and Coop, we engage a group of about 100 family farmers each year to track their farming practices, useof inputs such as fertilizer, and their yield. The group anonymously tracks their own year-on-year performance, as well as theirperformance versus peers.
Climate change related benefitEmissions reductions (mitigation)
CommentAt the end of 2018, 75 percent of our biscuits in Western Europe—or 60 percent across the EU—were made with Harmony wheat,including brands such as LU, Oro, LiGA, and Fontaneda. While we’ve made solid progress so far, we know there is still more to bedone. Our planned scale-up will lead to increased planting during 2019 and our ambition is to source 100 percent of our wheat needin the EU by 2022. Farmers in our North America program grew 7.5 times more wheat than we tracked in our program and Coophas 1,100 members, so the benefits can be scaled up across a much wider area. As a result, MSU and Coop’s agronomy team areworking to make the program’s learnings more widely accessible.
Management practice reference numberMP4
Management practiceGovernmental or institutional policies and programs
Description of management practicePrograms to address deforestation risks linked to key supply chains, cocoa and palm oil, by engaging in sector-wide actioncoordinated with governments in key producing countries: Cote d’Ivoire and Ghana (cocoa) and Indonesia (palm oil).
Your role in the implementationFinancialKnowledge sharingOperational
Explanation of how you encourage implementationIn 2015, Mondelēz International was the first company to raise the issue of deforestation in the cocoa industry at the COP21summit in Paris and the first chocolate maker to sign Memoranda of Understanding (MoUs) with the governments of Ghana andCôte d’Ivoire. We are a founding member of the Cocoa and Forests Initiative (CFI), a collaboration among the governments of Coted’Ivoire and Ghana – the world’s two largest cocoa producers – as well as 30 cocoa and chocolate companies and other partners, iscommitted to ending deforestation, restoring forested areas and eliminating illegal cocoa production. Our action plans align to theCFI’s three focus areas of Forest Protection & Restoration, Sustainable Production & Farmers' Livelihoods and Social Inclusion &Community Engagement, and feature the following commitments: • We are one of the first chocolate companies to commit to map100% of the farms in our Cocoa Life program in key origins by end of 2019 to ensure that farmers are not operating in forestedland. We’ve already mapped 70% of these farms, using Global Forest Watch to assess the risk of tree loss. • We’re the firstorganization to introduce incentives in the form of Payment for Environmental Services (PES) agreements to a cocoa-farmingcontext, encouraging farmers to protect and restore forests. We aim to have agreements with 33,000 farmers by 2022. • We knowthat deforestation can’t be addressed through cocoa farmers alone, so we involve the whole community. By 2022, nearly 1,300cocoa communities will have active forest restoration and protection programs through Cocoa Life. In palm oil, we worked with theGovernment of Indonesia and other partners to develop the Indonesia Sustainable Palm Oil (SPO) Initiative to help strengthensmallholder farmers, support national policy reform and reduce deforestation through public-private partnerships. This led to thepublication in 2017 of Indonesia’s first-ever National Action Plan (NAP) for sustainable palm oil, which provides a nationalframework for reform. In addition, we co-chair the Consumer Goods Forum’s Palm Oil Working Group, which provided coordinatedinput to the Indonesia NAP.
Climate change related benefitEmissions reductions (mitigation)Increasing resilience to climate change (adaptation)Increase carbon sink (mitigation)
CommentFor palm oil: We also helped Conservation International and other partners to create the Coalition for Sustainable Livelihoods, aninitiative focused on collective action to drive economic development, reduce poverty and improve natural resource management inthe Indonesian provinces of North Sumatra and Aceh. The project supports the aims of the NAP.
Management practice reference number
CDP Page of 7466
Management practice reference numberMP5
Management practiceLand use change
Description of management practicePrograms to address deforestation in key supply chains--cocoa and palm oil--by engaging suppliers (traders) and producers.
Your role in the implementationFinancialKnowledge sharingOperationalProcurement
Explanation of how you encourage implementationOur climate change strategy addresses deforestation in our raw material supply chain, with a particular focus on cocoa and palmoil. Among other things, our Palm Oil Action Plan requires suppliers to improve practices across entire operations. It also focuseson risk assessment and engagement of third-party suppliers to drive accountability for traded oil. Key provisions require suppliersto: • Take full responsibility for eliminating deforestation in their own operation and upstream supply chain by mapping andmonitoring all plantations and adopting a “suspend and engage” approach requiring immediate suspension of companies involvedin deforestation. • Take action against the exploitation of worker human rights through adopting the Consumer Goods Forum (CGF)Priority Industry Principles on forced labor. • Improve traceability and transparency by maintaining universal mill lists with grouplevel owners clearly indicated, and publishing them regularly, as well as using satellite technology to map and monitor sources ofpalm. • Demonstrate implementation of supplier progress against this updated Palm Oil Action Plan as a prerequisite of doingbusiness with Mondelēz International. In April 2019, we published Cocoa Life’s 2018 Annual Report, the first-ever large-scaleimpact report in the cocoa industry, which shows encouraging results from the first six years of the program. The report shows thatCocoa Life is having a positive impact: • Cocoa yields are continuously improving and results show that as cocoa farms becomemore efficient, their yield increases. • More communities are steering their own development and Cocoa Life communities canbecome drivers of change. • Farmers are choosing not to expand into protected forests and encouraging and enabling cocoafarmers and communities to protect the land where cocoa is grown has been fundamental to the Cocoa Life approach.
Climate change related benefitEmissions reductions (mitigation)Increasing resilience to climate change (adaptation)Increase carbon sink (mitigation)
CommentSince 2016, we have promoted a coordinated strategy and supply chain transparency by openly publishing our farm mappingupdates online. This marked the first time a large cocoa sourcing company had disclosed locations of the cocoa farms they sourcefrom. • As of 2018, 93,416 of Cocoa Life farms in Ghana, Cote d’Ivoire and Indonesia (63% of the Cocoa Life farms in these originregions) and they are not in priority protected forest areas. • Mondelēz International commits to map 100% of Cocoa Life farms inthese origin regions by the end of 2019. We invest in practices and resources to improve farmer productivity on existing land topromote forest conservation. • We have trained 114,380 community members and farmers as of 2018 on good environmentalpractices. In partnership with UNDP, as of 2018 we planted over one million trees on cocoa farms in Ghana and are planting700,000 trees in Cote d’Ivoire.
C-AC12.2b/C-FB12.2b/C-PF12.2b
(C-AC12.2b/C-FB12.2b/C-PF12.2b) Do you collect information from your suppliers about the outcomes of any implementedagricultural/forest management practices you have encouraged?Yes
C12.3
(C12.3) Do you engage in activities that could either directly or indirectly influence public policy on climate-related issuesthrough any of the following?Direct engagement with policy makersTrade associationsOther
CDP Page of 7467
C12.3a
(C12.3a) On what issues have you been engaging directly with policy makers?
Focus oflegislation
Corporateposition
Details of engagement Proposed legislative solution
Other,pleasespecify(Sustainablepalm oil)
Support We co-chair the Consumer Goods Forum’s Palm Oil WorkingGroup, which published palm oil sourcing guidelines for membersduring 2015; we work with the Roundtable on Sustainable PalmOil; we supported the NY Declaration on Forests; we supportedUNDP’s work with the Government of Indonesia and companies tosupport the scale up of sustainable palm oil in Indonesia via acommodity platform approach.This led to the publication in 2017 ofIndonesia’s first-ever National Action Plan (NAP) for sustainablepalm oil, which provides a national framework for reform.
The goal is to support the scale-up of sustainable palm oil inIndonesia via jurisdictional initiatives such as the Coalition forSustainable Livelihoods, an initiative set up by ConservationInternational and public-sector partners focused on collective actionto drive economic development, reduce poverty and improve naturalresource management in the Indonesian provinces of North Sumatraand Aceh. The project supports the aims of the NAP.
Climatefinance
Support We announced our commitment to combat deforestation in cocoaat the UN Climate Summit COP21, where world leaders met inParis to negotiate a new climate agreement. MondelēzInternational committed to lead private sector action in Côted’Ivoire’s national program to combat deforestation in cocoa.These actions will contribute to the United Nations sponsoredREDD+ program, with financial support from the World Bank. InJanuary 2018, we agreed to a similar REDD+ partnership with thegovernment of Ghana. In October 2018, we published a casestudy on our pilot REDD+ programme in Cote d’Ivoire:https://www.cocoalife.org/progress/pioneering-forest-protection-work-in-cote-d-ivoire
In Cote d’Ivoire, we work together with the Ivorian government andother experts to map and monitor forested areas,and train farmers ingood agricultural practices and agroforestry. The $280 millionInitiative for Sustainable Forest Landscapes, launched in November2013, seeks to scale up land-management practices across largelandscapes to protect forests and securing green supply chains. InGhana, Mondelēz International is contributing $5 million USD overfive years to the Ghana Cocoa Forest REDD+ Program (GCFRP),which aims to significantly reduce the high rate of deforestation andforest degradation, as well as their associated greenhouse carbonemissions, from cocoa farming within Ghana’s High Forest Zone.
C12.3b
(C12.3b) Are you on the board of any trade associations or do you provide funding beyond membership?Yes
C12.3c
CDP Page of 7468
(C12.3c) Enter the details of those trade associations that are likely to take a position on climate change legislation.
Trade associationConsumer Goods Forum
Is your position on climate change consistent with theirs?Consistent
Please explain the trade association’s positionThe Consumer Goods Forum (“CGF”) is a global, parity-based industry network that is driven by its members to encourage theglobal adoption of practices and standards that serves the consumer goods industry worldwide. It brings together the CEOs andsenior management of some 400 retailers, manufacturers, service providers, and other stakeholders across 70 countries, and itreflects the diversity of the industry in geography, size, product category and format. Its member companies have combined salesof EUR 3.5 trillion and directly employ nearly 10 million people, with a further 90 million related jobs estimated along the valuechain. It is governed by its Board of Directors, which comprises more than 50 manufacturer and retailer CEOs The ConsumerGoods Forum’s environmental sustainability work positions the consumer goods industry as a leader in tackling climate change,reducing waste and improving environmental stewardship in global supply chains In pulling its weight to tackle climate change, theCGF has identified three key areas where its members are well-positioned to effect significant change. These are: • Reducing foodwaste across operations and throughout the rest of the value chain • Tackling deforestation • Phasing out the most pollutingrefrigerants To help the industry align around a common set of targets, CGF members have publicly committed to certain businesspractices through resolutions on deforestation (2010), refrigeration (2010 and 2016) and food waste (2015): these issues continueto be recognised as significant sources of greenhouse gasses. There is additional work with stakeholders to drive progress towardsbroader international goals, such as those set by the UN Sustainable Development Goals with a focus on developing partnerships(SDG 17). The CGF’s environmental work is also working on SDG 12 (ensure sustainable consumption for all), SDG 13 (Combatclimate change and its impacts) and SDG 15 (Protect the planet) By joining forces and acting collectively, members of TheConsumer Goods Forum can have a transformative impact.
How have you influenced, or are you attempting to influence their position?We actively help develop CGF's refrigeration, deforestation and food waste positions and we resolved to do our part in achievingthe Forum‘s goal of assisting countries achieve net-zero deforestation. We remain active in helping CGF develop its work in thisarea and co-chaired the development of sourcing guidelines for palm oil - published during 2015 - and contributed to discussionsbetween CGF and the Tropical Forest Alliance.
C12.3e
(C12.3e) Provide details of the other engagement activities that you undertake.
In 2016, we were one of more than 600 US-based companies that signed the “Business Backs Low-Carbon USA” letter calling on USpolicy makers to continue to support the transition to a low-carbon economy and the Paris Agreement.
C12.3f
(C12.3f) What processes do you have in place to ensure that all of your direct and indirect activities that influence policy areconsistent with your overall climate change strategy?
To maintain consistency, engagement is coordinated by a corporate sustainability team, which includes key functions involved insetting and delivering sustainability strategy, including the Corporate and Government Affairs function, which has responsibility forexternal engagement. In addition, our Public and Government Affairs team includes sustainability as part of its integrated globalstrategy. Decisions to participate in engagement relating to climate change are reviewed by key members of the sustainability andpublic and government affairs teams, under the leadership of the Vice President and Chief Impact Office and VP and Chief of GlobalCommunications and Government Affairs.
C12.4
(C12.4) Have you published information about your organization’s response to climate change and GHG emissionsperformance for this reporting year in places other than in your CDP response? If so, please attach the publication(s).
CDP Page of 7469
PublicationIn voluntary sustainability report
StatusComplete
Attach the document2018_Impact_Progress_Report.pdf
Page/Section referenceImpact 2018 Progress Report and 2025 Strategy: Introduction, At-a-glance, Sustainable Snacking, Compliance and Governance.
Content elementsGovernanceStrategyEmission targetsOther metrics
CommentEach year we publish a report on our strategy to create positive impact for people and planet. Our purpose at MondelēzInternational is to empower people to snack right. And a big part of that is creating sustainable and mindful snacks for both peopleand the planet to love. We believe that consumers should not have to choose between snacking and eating right, or to beconcerned about the impact their snacking choices have on the world and their communities. This is why we are committed toensuring that snacking is both sustainable and mindful. The report details progress we are making towards goals and targets, andlists examples from our programs. This year, we outline the evolution of our Impact Strategy for 2025.
PublicationIn voluntary sustainability report
StatusComplete
Attach the documentCocoa Life 2018 Annual Report.pdf
Page/Section referenceCocoa Life 2018 Annual Report: Introduction, Encouraging Results, p16 and p21 forest protection
Content elementsGovernanceStrategyOther metrics
CommentAnnual report for our Cocoa Life sourcing program, including focus on forest protection. External link to the file:https://www.cocoalife.org/progress/a-major-milestone-to-accelerate-our-journey
PublicationIn voluntary communications
StatusComplete
Attach the documentREDDPilotCaseStudy.pdf
Page/Section referenceAll
Content elementsGovernanceStrategyOther metrics
CommentREDD+ case study, Cote d’Ivoire: Case study on REDD+ work with government of Cote d’Ivoire – our largest cocoa origin country –and other partners to create incentives for farmers and communities to protect and restore forests.
CDP Page of 7470
C13. Other land management impacts
C-AC13.2/C-FB13.2/C-PF13.2
(C-AC13.2/C-FB13.2/C-PF13.2) Do you know if any of the management practices mentioned in C-AC12.2a/C-FB12.2a/C-PF12.2a that were implemented by your suppliers have other impacts besides climate change mitigation/adaptation?No
C14. Signoff
C-FI
(C-FI) Use this field to provide any additional information or context that you feel is relevant to your organization's response.Please note that this field is optional and is not scored.
C14.1
(C14.1) Provide details for the person that has signed off (approved) your CDP climate change response.
Job title Corresponding job category
Row 1 Global Director, Sustainability Environment/Sustainability manager
SC. Supply chain module
SC0.0
(SC0.0) If you would like to do so, please provide a separate introduction to this module.
SC0.1
(SC0.1) What is your company’s annual revenue for the stated reporting period?
Annual Revenue
Row 1
SC0.2
CDP Page of 7471
(SC0.2) Do you have an ISIN for your company that you would be willing to share with CDP?No
SC1.1
(SC1.1) Allocate your emissions to your customers listed below according to the goods or services you have sold them inthis reporting period.
Requesting memberPlease select
Scope of emissionsPlease select
Allocation levelPlease select
Allocation level detail<Not Applicable>
Emissions in metric tonnes of CO2e
Uncertainty (±%)
Major sources of emissions
VerifiedPlease select
Allocation methodPlease select
Please explain how you have identified the GHG source, including major limitations to this process and assumptionsmade
SC1.2
(SC1.2) Where published information has been used in completing SC1.1, please provide a reference(s).
SC1.3
(SC1.3) What are the challenges in allocating emissions to different customers, and what would help you to overcome thesechallenges?
Allocation challenges Please explain what would help you overcome these challenges
SC1.4
(SC1.4) Do you plan to develop your capabilities to allocate emissions to your customers in the future?Please select
SC2.1
CDP Page of 7472
(SC2.1) Please propose any mutually beneficial climate-related projects you could collaborate on with specific CDP SupplyChain members.
SC2.2
(SC2.2) Have requests or initiatives by CDP Supply Chain members prompted your organization to take organizational-levelemissions reduction initiatives?Please select
SC3.1
(SC3.1) Do you want to enroll in the 2019-2020 CDP Action Exchange initiative?Please select
SC3.2
(SC3.2) Is your company a participating supplier in CDP’s 2018-2019 Action Exchange initiative?Please select
SC4.1
(SC4.1) Are you providing product level data for your organization’s goods or services?Please select
Submit your response
In which language are you submitting your response?English
Please confirm how your response should be handled by CDP
Public or Non-Public Submission I am submitting to Are you ready to submit the additional Supply Chain Questions?
I am submitting my response Public InvestorsCustomers
Yes, submit Supply Chain Questions now
Please confirm belowI have read and accept the applicable Terms
CDP Page of 7473