Embed Size (px)
Citation preview

Monaural Speech Segregation: Representation, Pitch,
and Amplitude Modulation
DeLiang Wang
The Ohio State University
Outline of Presentation
Introduction Speech segregation problem Auditory scene analysis (ASA) approach
A multistage model for computational ASA On amplitude modulation and pitch tracking Oscillatory correlation theory for ASA
Speech Segregation Problem
In a natural environment, target speech is usually corrupted by acoustic interference. An effective system for speech segregation has many applications, such as automatic speech recognition, audio retrieval, and hearing aid design
Most speech separation techniques require multiple sensors
Speech enhancement developed for the monaural situation can deal with only specific acoustic interference
Auditory Scene Analysis (Bregman’90)
Listeners are able to parse the complex mixture of sounds arriving at the ears in order to retrieve a mental representation of each sound source
ASA would take place in two conceptual processes:
Segmentation. Decompose the acoustic mixture into sensory elements (segments)
Grouping. Combine segments into groups, so that segments in the same group are likely to have originated from the same environmental source
Auditory Scene Analysis - continued
The grouping process involves two aspects: Primitive grouping. Innate data-driven mechanisms,
consistent with those described by Gestalt psychologists for visual perception (proximity, similarity, common fate, good continuation, etc.)
Schema-driven grouping. Application of learned knowledge about speech, music and other environmental sounds
Computational Auditory Scene Analysis
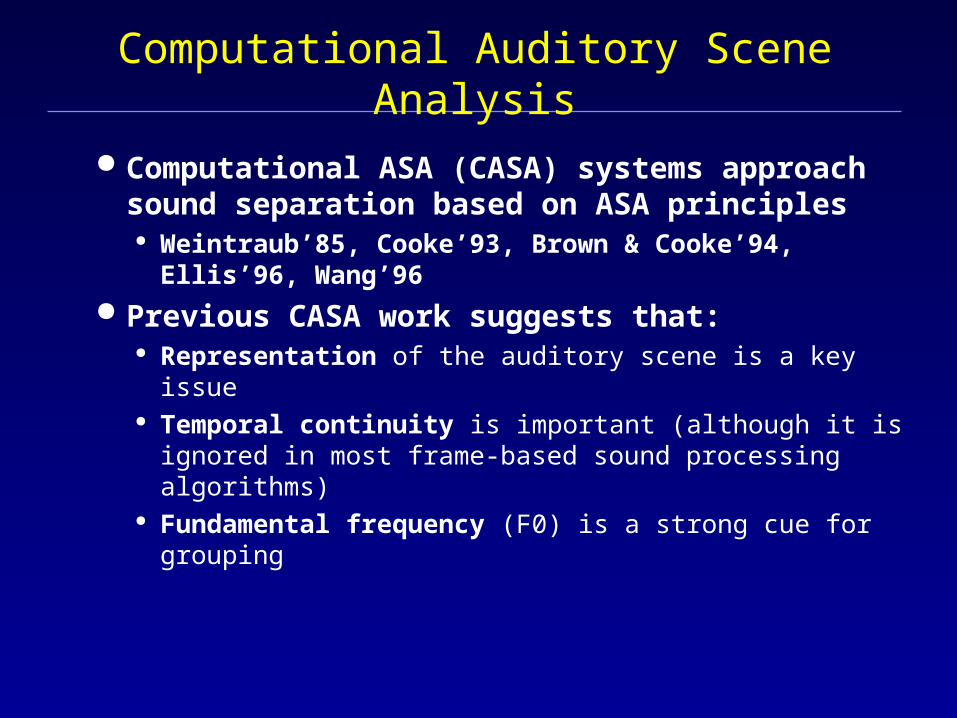
Computational ASA (CASA) systems approach sound separation based on ASA principles
Weintraub’85, Cooke’93, Brown & Cooke’94, Ellis’96, Wang’96
Previous CASA work suggests that: Representation of the auditory scene is a key issue Temporal continuity is important (although it is ignored
in most frame-based sound processing algorithms) Fundamental frequency (F0) is a strong cue for
grouping
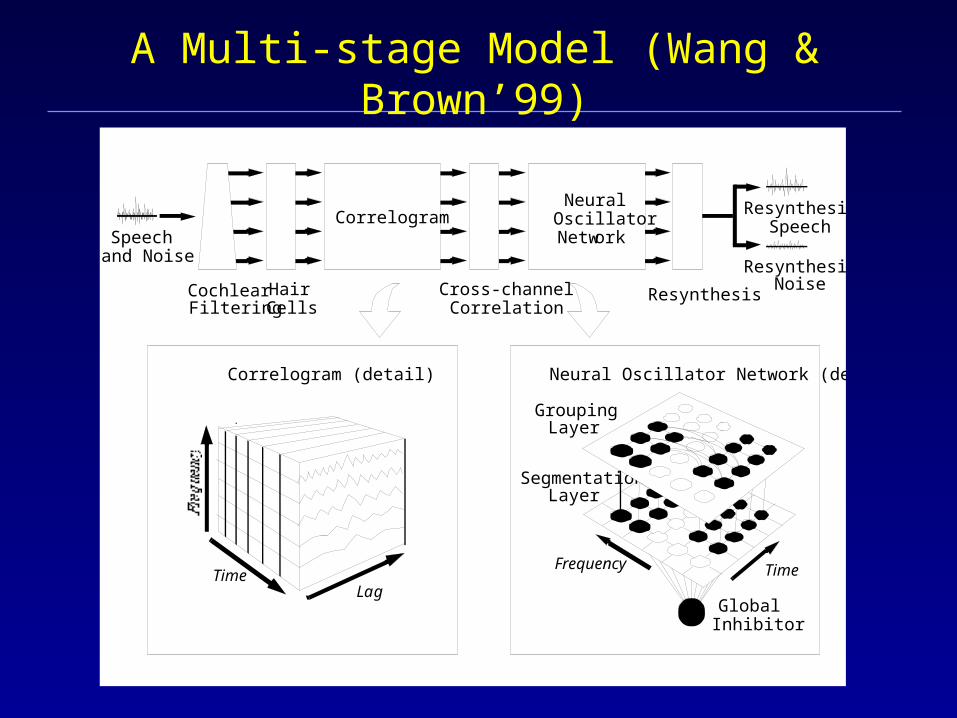
A Multi-stage Model (Wang & Brown’99)
NeuralOscillatorNetwork
Correlogram
Cross-channelCorrelation
ResynthesisHairCells
CochlearFiltering
Speechand Noise
ResynthesizedSpeech
ResynthesizedNoise
Correlogram (detail)
TimeLag
Neural Oscillator Network (detail)
GroupingLayer
SegmentationLayer
GlobalInhibitor
TimeFrequency
Auditory Periphery Model
A bank of fourth-order gammatone filters (Patterson et al.’88)
Meddis hair cell model converts gammatone output to neural firing
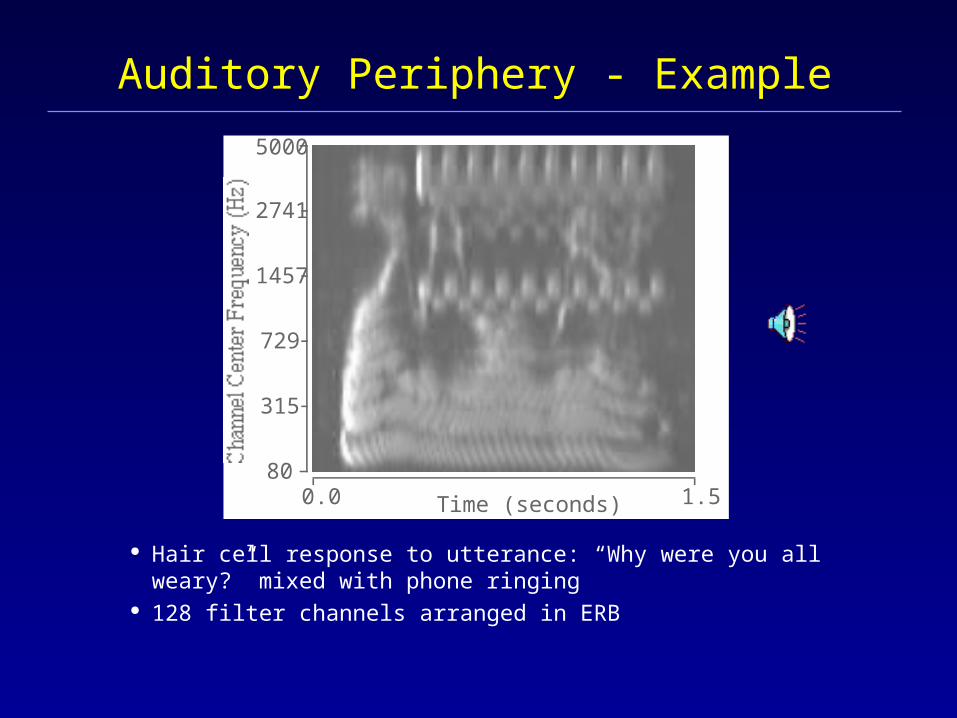
Auditory Periphery - Example
Hair cell response to utterance: “Why were you all weary?” mixed with phone ringing
128 filter channels arranged in ERB
Time (seconds)0.0 1.5
5000
2741
1457
729
315
80
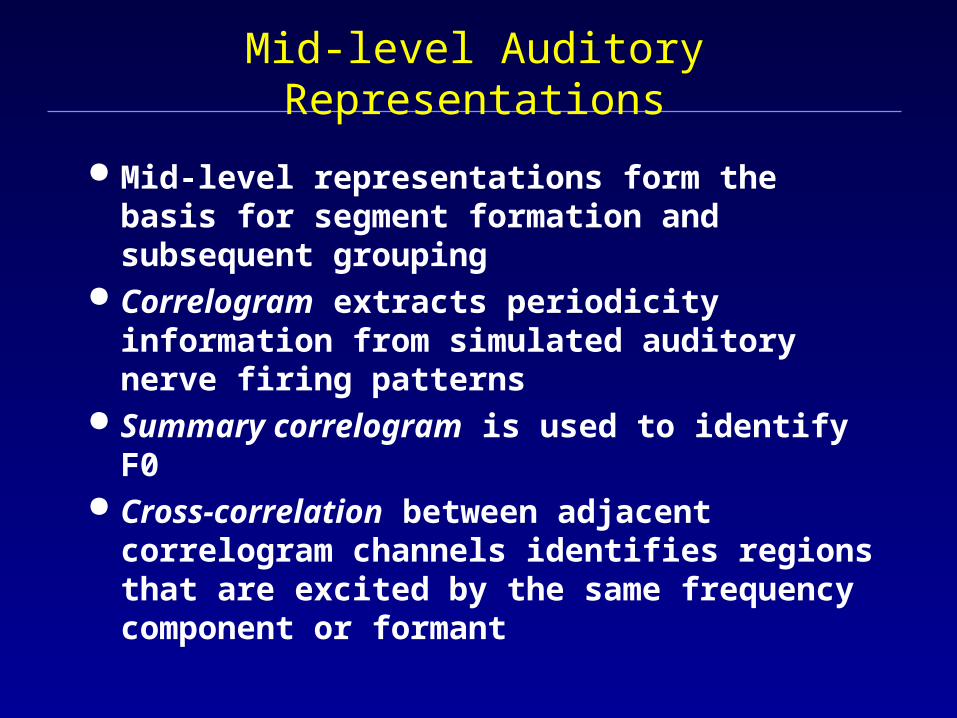
Mid-level representations form the basis for segment formation and subsequent grouping
Correlogram extracts periodicity information from simulated auditory nerve firing patterns
Summary correlogram is used to identify F0 Cross-correlation between adjacent
correlogram channels identifies regions that are excited by the same frequency component or formant
Mid-level Auditory Representations
Mid-level Representations - Example
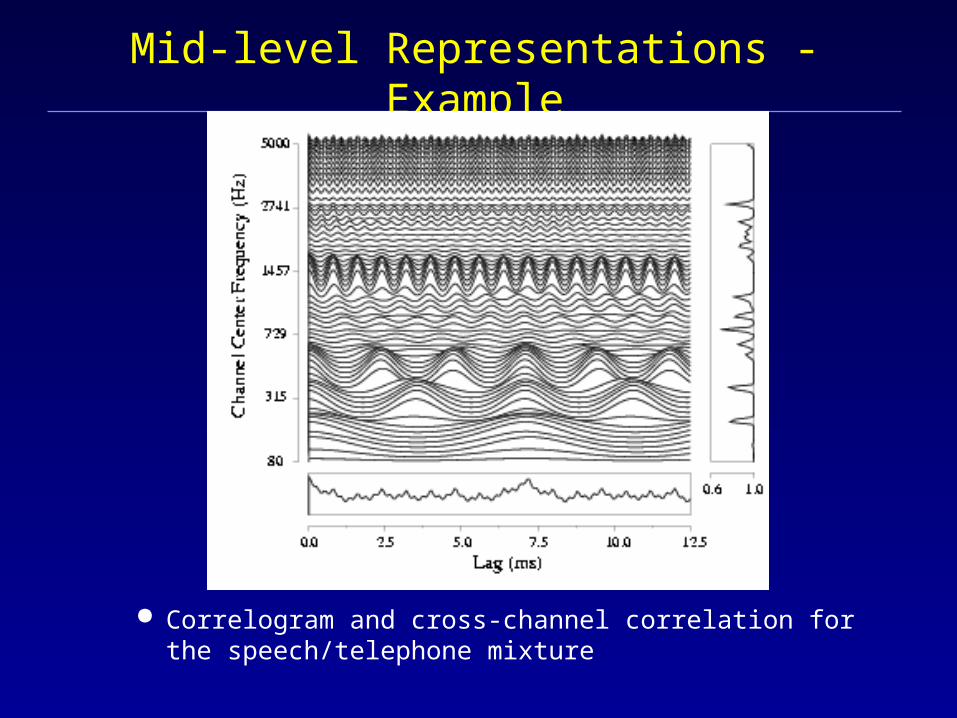
Correlogram and cross-channel correlation for the speech/telephone mixture
Oscillator Network: Segmentation Layer
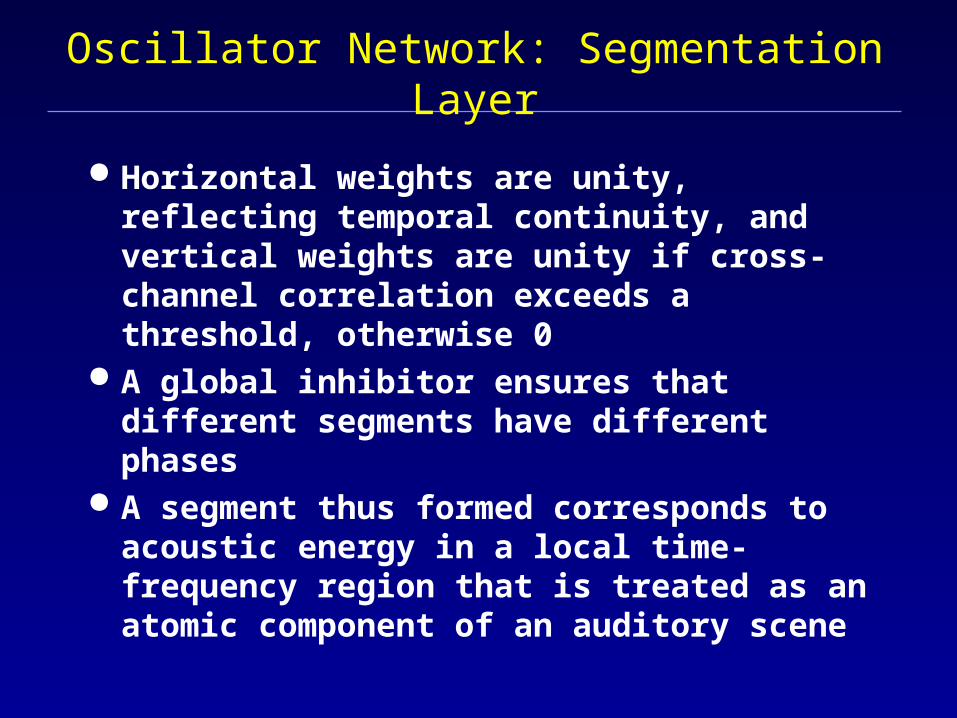
Horizontal weights are unity, reflecting temporal continuity, and vertical weights are unity if cross-channel correlation exceeds a threshold, otherwise 0
A global inhibitor ensures that different segments have different phases
A segment thus formed corresponds to acoustic energy in a local time-frequency region that is treated as an atomic component of an auditory scene
Segmentation Layer - Example
Time (seconds)0.0 1.5
5000
2741
1457
729
315
80
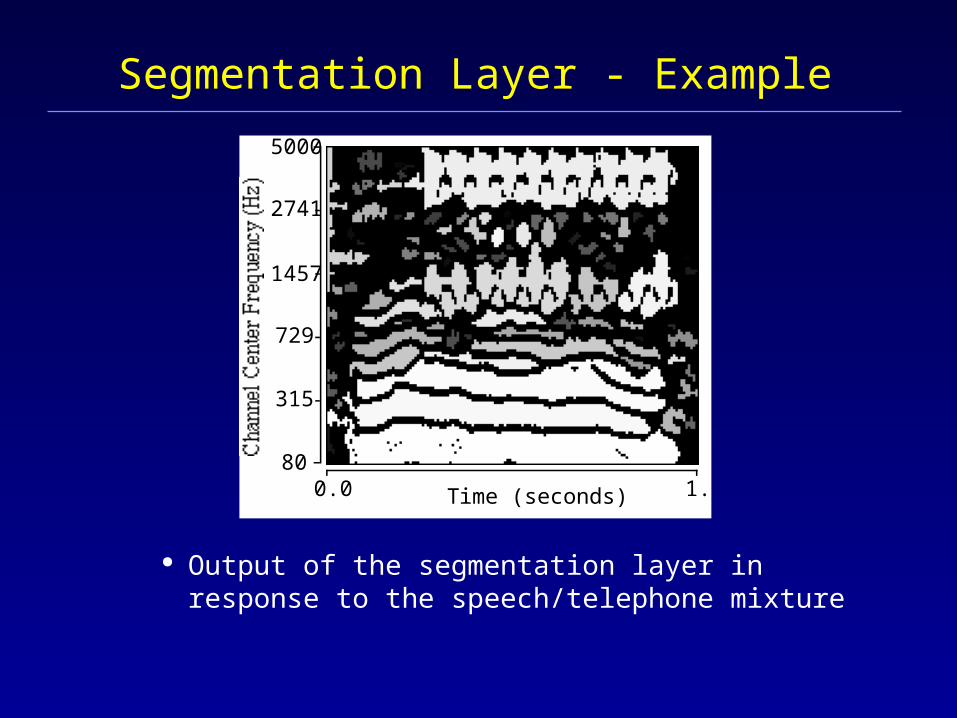
Output of the segmentation layer in response to the speech/telephone mixture
Oscillator Network: Grouping Layer
At each time frame, an F0 estimate from the summary correlogram is used to classify channels into two categories; those that are consistent with the F0, and those that are not
Connections are formed between pairs of channels: mutual excitation if the channels belong to the same F0 category, otherwise mutual inhibition
Strong excitation within each segment The second layer embodies the grouping stage of
ASA
Grouping Layer - Example
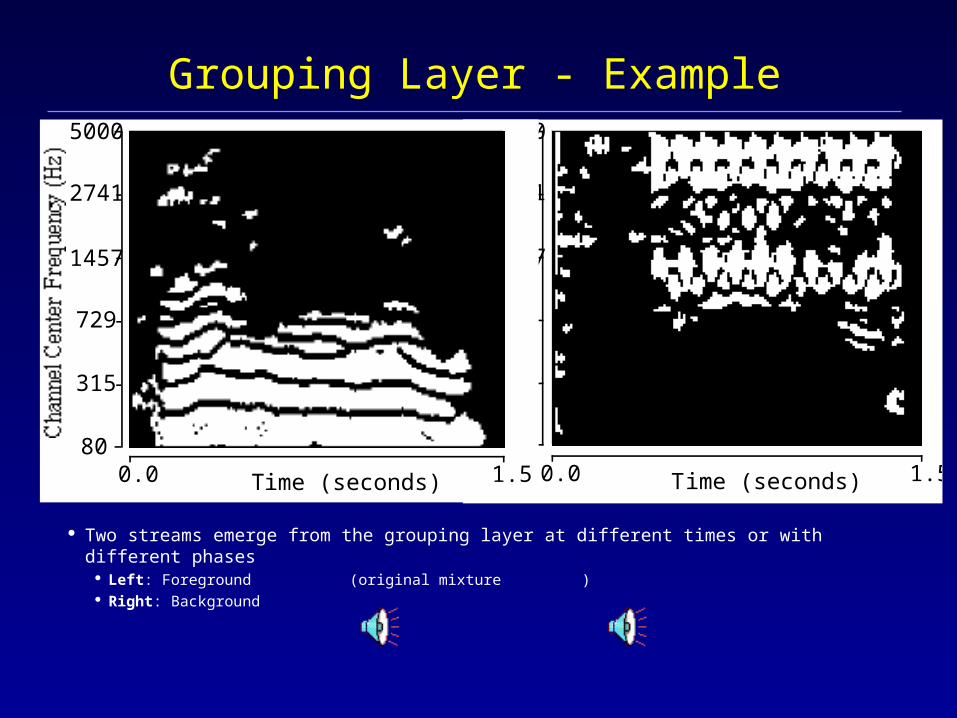
Two streams emerge from the grouping layer at different times or with different phases Left: Foreground (original mixture ) Right: Background
Time (seconds)0.0 1.5
5000
2741
1457
729
315
80
Time (seconds)0.0 1.5
5000
2741
1457
729
315
80
Previous systems, including the Wang-Brown model, have difficulty in
Dealing with broadband high-frequency mixtures Performing reliable pitch tracking for noisy speech Retaining high-frequency energy of the target speaker
Our next step considers perceptual resolvability of various harmonics
Challenges Facing CASA
Resolved and Unresolved Harmonics
For voiced speech, lower harmonics are resolved while higher harmonics are not
For unresolved harmonics, the envelopes of filter responses fluctuate at the fundamental frequency of speech
Hence we apply different grouping mechanisms for low-frequency and high-frequency signals:
Low-frequency signals are grouped based on periodicity and temporal continuity
High-frequency signals are grouped based on amplitude modulation (AM) and temporal continuity
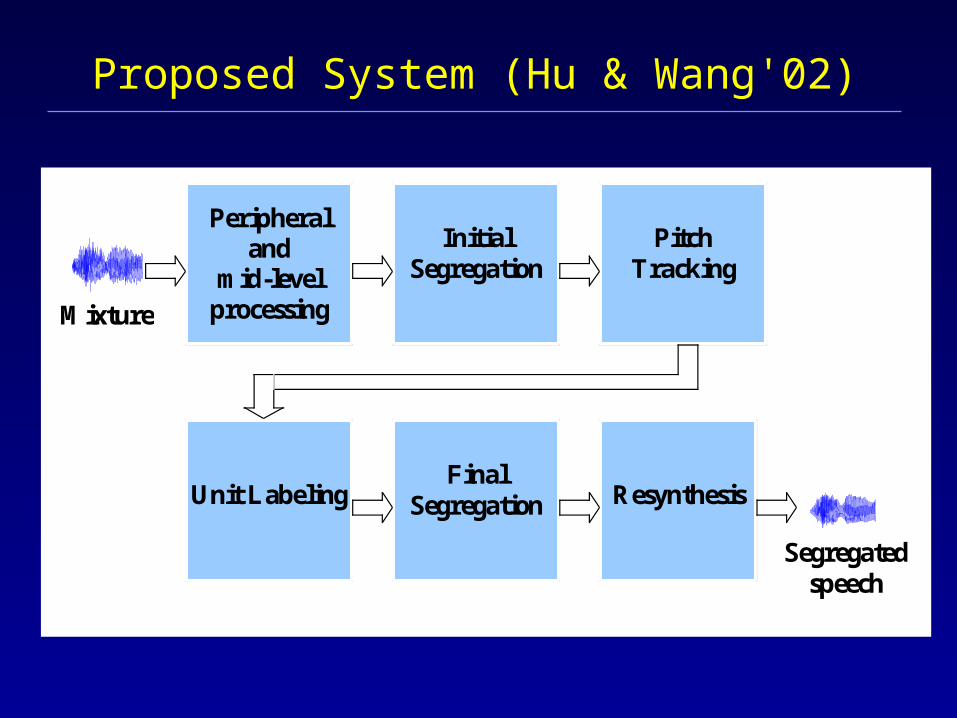
Proposed System (Hu & Wang'02)
Unit Labeling
Mixture
Peripheral and
mid-level processing
Initial Segregation
Resynthesis
Segregated speech
Pitch Tracking
Final Segregation
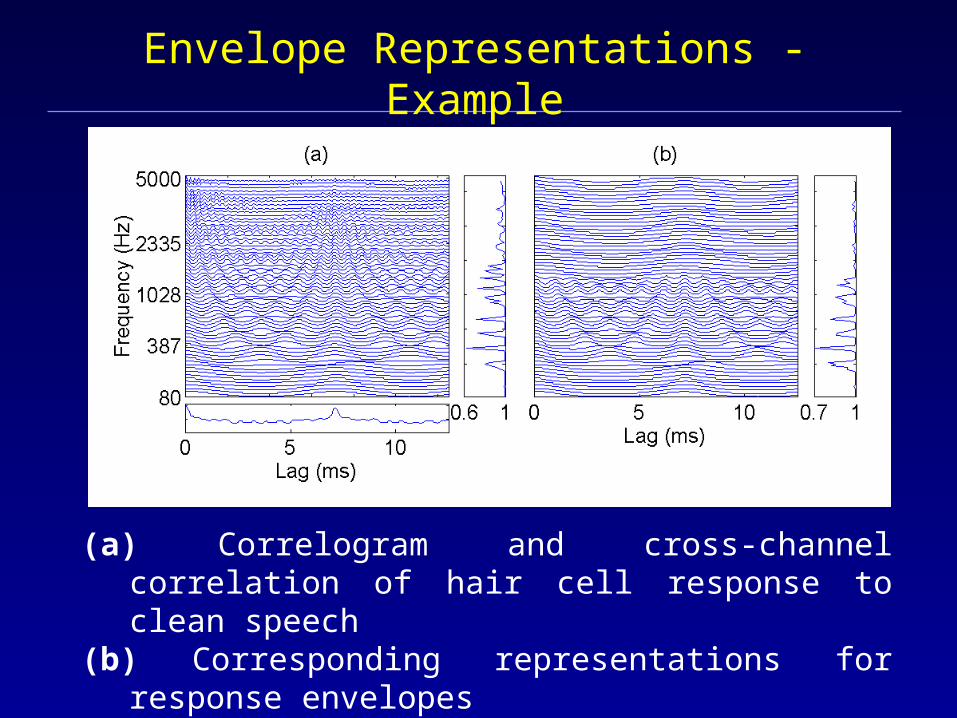
Envelope Representations - Example
(a) Correlogram and cross-channel correlation of hair cell response to clean speech
(b) Corresponding representations for response envelopes
Initial Segregation
The Wang-Brown model is used in this stage to generate segments and select the target speech stream
Segments generated in this stage tend to reflect resolved harmonics, but not unresolved ones
Pitch Tracking
Pitch periods of target speech are estimated from the segregated speech stream
Estimated pitch periods are checked and re-estimated using two psychoacoustically motivated constraints:
Target pitch should agree with the periodicity of the time-frequency (T-F) units in the initial speech stream
Pitch periods change smoothly, thus allowing for verification and interpolation
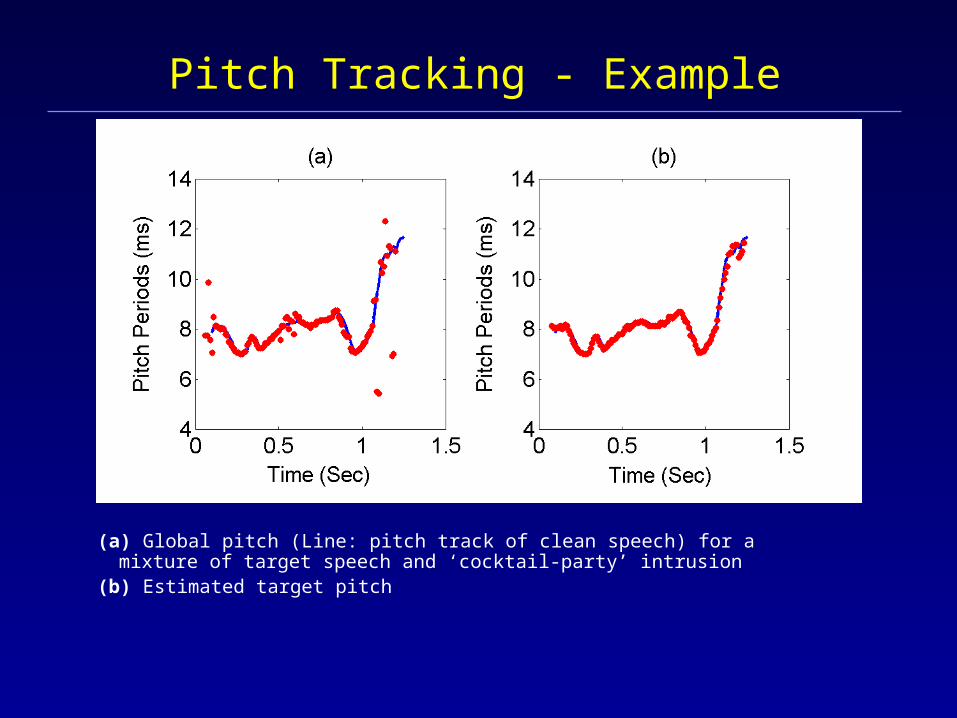
Pitch Tracking - Example
(a) Global pitch (Line: pitch track of clean speech) for a mixture of target speech and ‘cocktail-party’ intrusion
(b) Estimated target pitch
T-F Unit Labeling
In the low-frequency range: A T-F unit is labeled by comparing the periodicity of its
autocorrelation with the estimated target pitch
In the high-frequency range: Due to their wide bandwidths, high-frequency filters
generally respond to multiple harmonics. These responses are amplitude modulated due to beats and combinational tones (Helmholtz, 1863)
A T-F unit in the high-frequency range is labeled by comparing its AM repetition rate with the estimated target pitch
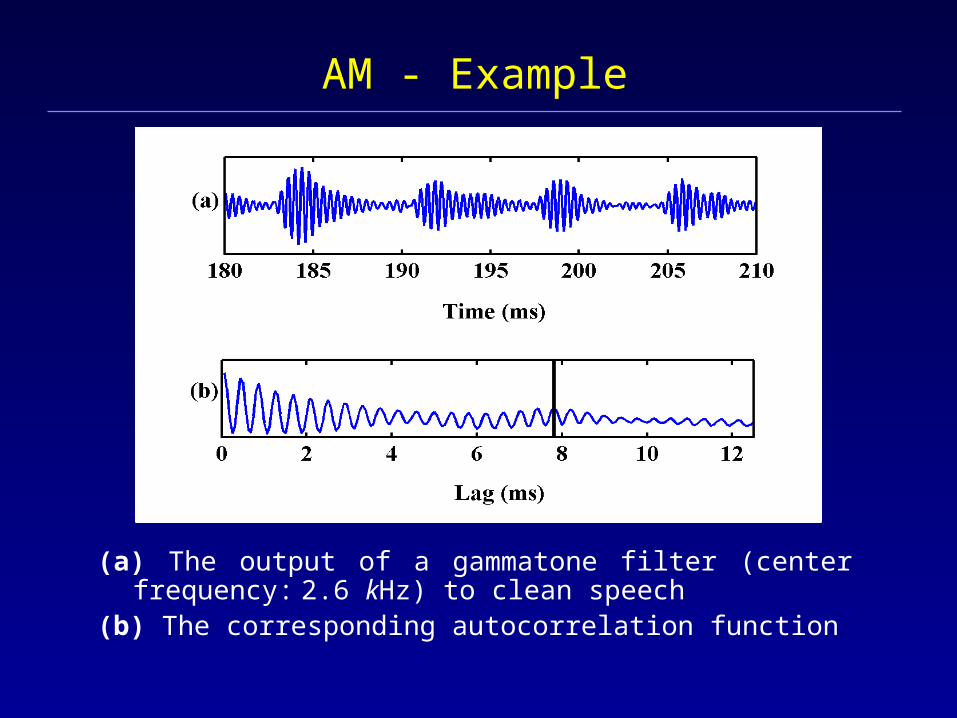
AM - Example
(a) The output of a gammatone filter (center frequency: 2.6 kHz) to clean speech
(b) The corresponding autocorrelation function

AM Repetition Rates
To obtain AM repetition rates, a filter response is half-wave rectified and bandpass filtered
The resulting signal within a T-F unit is modeled by a single sinusoid using the gradient descent method. The frequency of the sinusoid indicates the AM repetition rate of the corresponding response

Final Segregation
New segments corresponding to unresolved harmonics are formed based on temporal continuity and cross-channel correlation of response envelopes (i.e. common AM). Then they are grouped into the foreground stream according to AM repetition rates
The foreground stream is adjusted to remove the segments that do not agree with the estimated target pitch
Other units are grouped according to temporal and spectral continuity
Ideal Binary Mask for Performance Evaluation
Within a T-F unit, the ideal binary mask is 1 if target energy is stronger than interference energy, and 0 otherwise
Motivation: Auditory masking - stronger signal masks weaker one within a critical band
Further motivation: Ideal binary masks give excellent listening experience and automatic speech recognition performance
Thus, we suggest to use ideal binary masks as ground truth for CASA performance evaluation
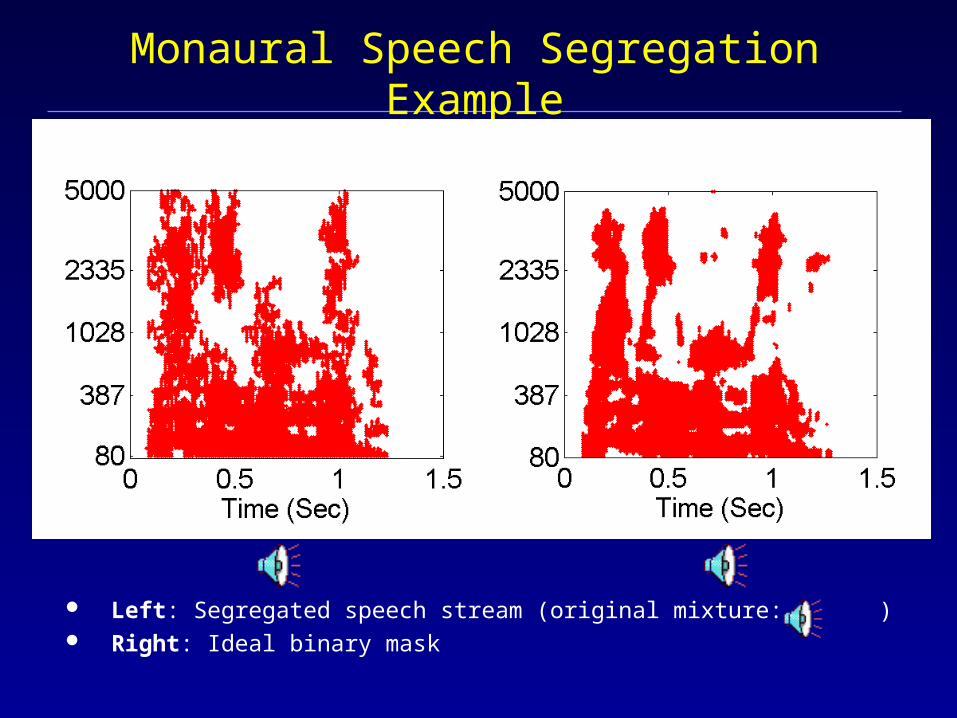
Monaural Speech Segregation Example
Left: Segregated speech stream (original mixture: ) Right: Ideal binary mask
Systematic Evaluation
Evaluated on a corpus of 100 mixtures (Cooke’93): 10 voiced utterances x 10 noise intrusions
Noise intrusions have a large variety
Resynthesis stage allows estimation of target speech waveform
Evaluation is based on ideal binary masks
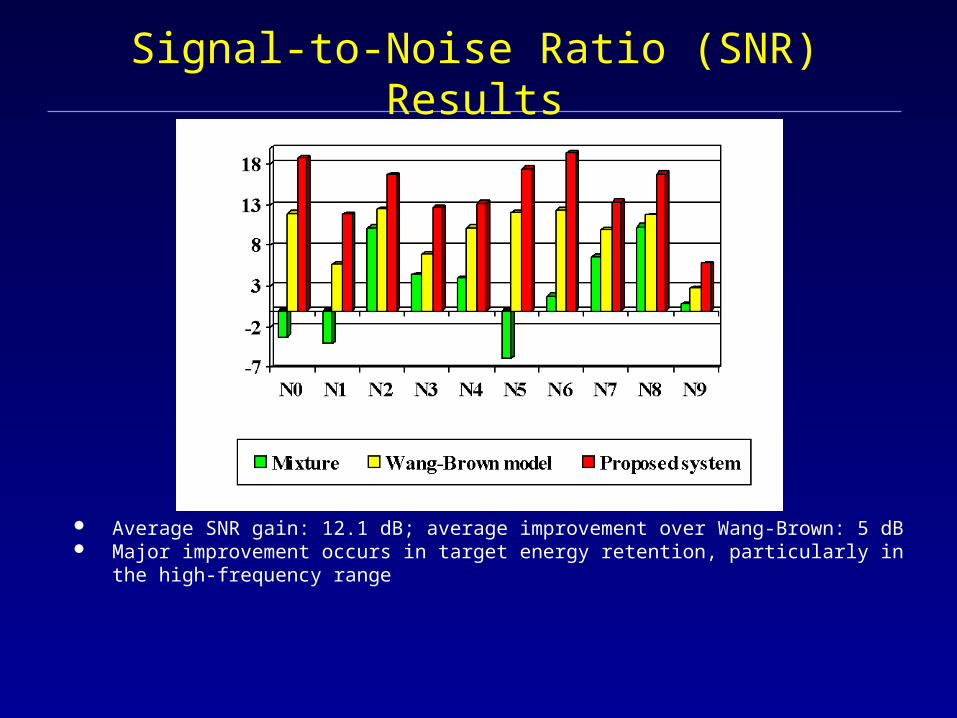
Signal-to-Noise Ratio (SNR) Results
Average SNR gain: 12.1 dB; average improvement over Wang-Brown: 5 dB Major improvement occurs in target energy retention, particularly in the high-
frequency range
Segregation Examples
Mixture
Ideal Binary Mask
Wang-Brown
New System
How Does Auditory System Perform ASA?
Information about acoustic features (pitch, spectral shape, interaural differences, AM, FM) is extracted in distributed areas of the auditory system
Binding problem: How are these features combined to form a perceptual whole (stream)?
Hierarchies of feature-detecting cells exist, but do not seem to constitute a solution to the binding problem
Oscillatory Correlation Theory (von der Malsburg & Schneider’86; Wang’96)
Neural oscillators are used to represent auditory features
Oscillators representing features of the same source are synchronized (phase-locked with zero phase lag), and are desynchronized from oscillators representing different sources
Supported by growing experimental evidence, e.g. oscillations in auditory cortex measured by EEG, MEG and local field potentials
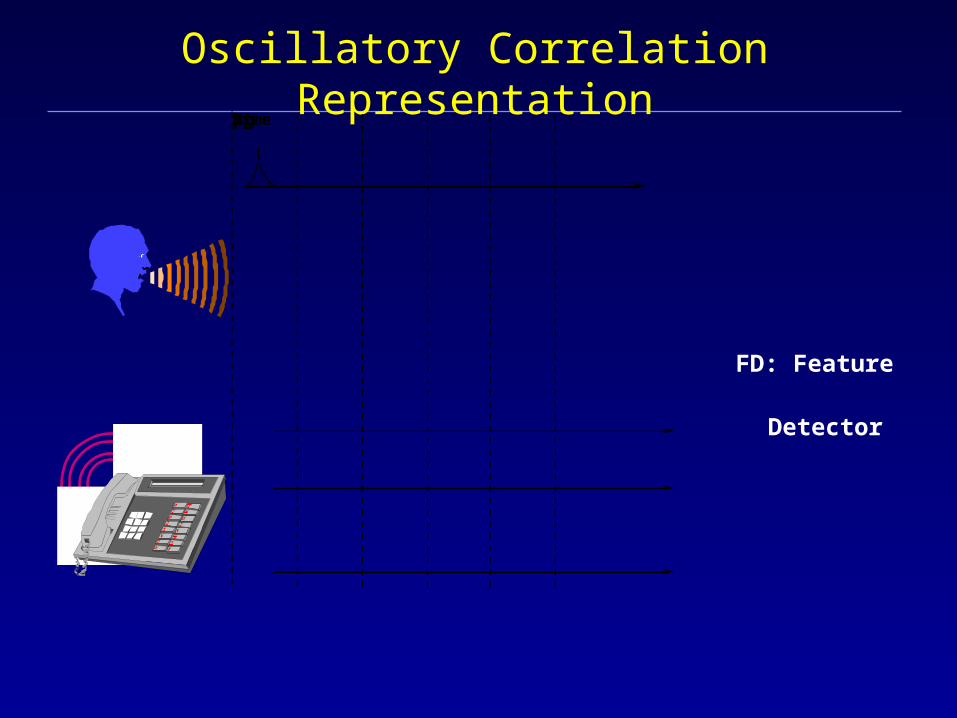
Oscillatory Correlation Representation
FD: Feature
Detector
FD1FDnFD2FDaFDbFDxTimeTime
Oscillatory Correlation for ASA
LEGION dynamics (Terman & Wang’95) provides a computational foundation for the oscillatory correlation theory
The utility of oscillatory correlation has been demonstrated for speech separation (Wang-Brown’99), modeling auditory attention (Wrigley-Brown’01), etc.
Issues
Grouping is entirely pitch-based, hence limited to segregating voiced speech
How to group unvoiced speech?
Target pitch tracking in the presence of multiple voiced sources
Role of segmentation We found increased robustness with segments as an
intermediate representation between streams and T-F units

Summary
Multistage ASA approach to monaural speech segregation
Performs substantially better than previous CASA systems
Oscillatory correlation theory for ASA Key issue is integration of various grouping cues

Collaborators
Recent work with Guoning Hu- Ohio State University
Earlier work with Guy Brown - University of Sheffield