Embed Size (px)
Citation preview
1 *Following the incorporation of several existing SaaS products in Germany, France and South Africa into the Sage One portfolio during the year, prior year Sage One paying subscriptions have been restated on a like-for-like basis. Without the restatement, Sage One paying subscriptions at 30 September 2014 were 52,600 (2013: 22,400) #Research and development ^Sales and marketing
The Sage Group plc audited results for the year ended 30 September 2014
Wednesday 3 December 2014
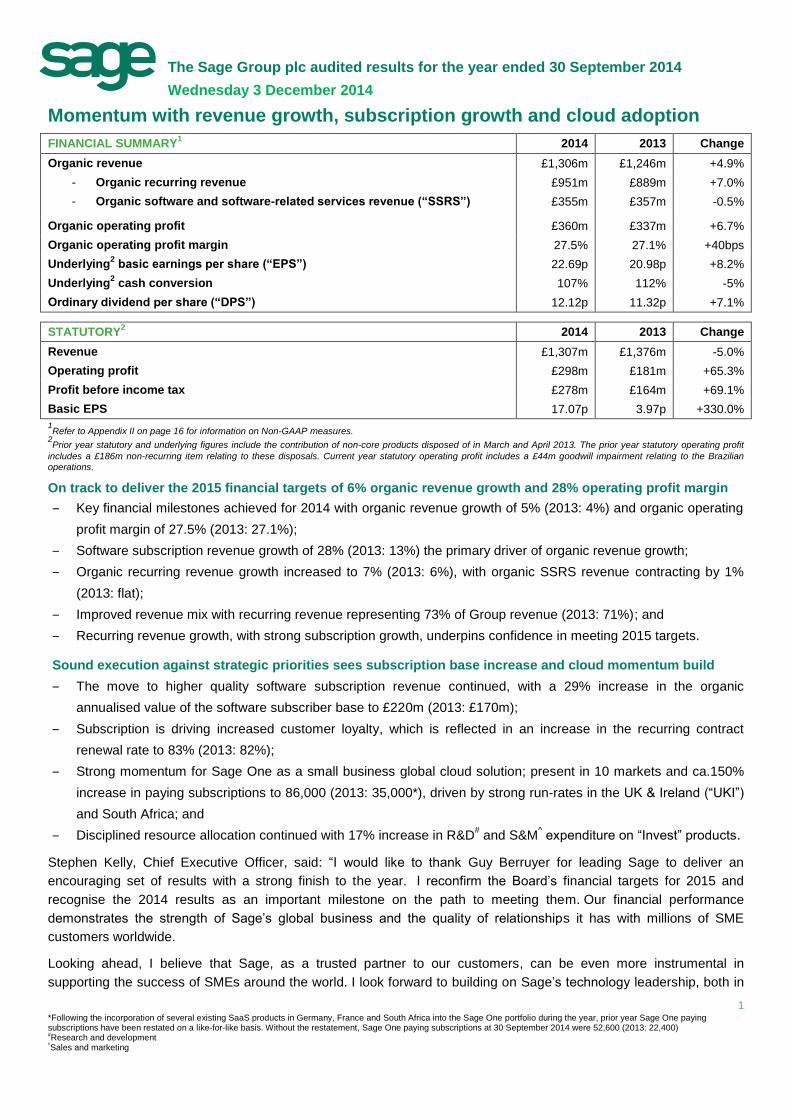
Momentum with revenue growth, subscription growth and cloud adoption
FINANCIAL SUMMARY1 2014 2013 Change
Organic revenue £1,306m £1,246m +4.9%
- Organic recurring revenue £951m £889m +7.0%
- Organic software and software-related services revenue (“SSRS”) £355m £357m -0.5%
Organic operating profit £360m £337m +6.7%
Organic operating profit margin 27.5% 27.1% +40bps
Underlying2 basic earnings per share (“EPS”) 22.69p 20.98p +8.2%
Underlying2 cash conversion 107% 112% -5%
Ordinary dividend per share (“DPS”) 12.12p 11.32p +7.1% STATUTORY
2 2014 2013 Change
Revenue £1,307m £1,376m -5.0%
Operating profit £298m £181m +65.3%
Profit before income tax £278m £164m +69.1%
Basic EPS 17.07p 3.97p +330.0%
1Refer to Appendix II on page 16 for information on Non-GAAP measures.
2Prior year statutory and underlying figures include the contribution of non-core products disposed of in March and April 2013. The prior year statutory operating profit
includes a £186m non-recurring item relating to these disposals. Current year statutory operating profit includes a £44m goodwill impairment relating to the Brazilian
operations.
On track to deliver the 2015 financial targets of 6% organic revenue growth and 28% operating profit margin
‒ Key financial milestones achieved for 2014 with organic revenue growth of 5% (2013: 4%) and organic operating
profit margin of 27.5% (2013: 27.1%);
‒ Software subscription revenue growth of 28% (2013: 13%) the primary driver of organic revenue growth;
‒ Organic recurring revenue growth increased to 7% (2013: 6%), with organic SSRS revenue contracting by 1%
(2013: flat);
‒ Improved revenue mix with recurring revenue representing 73% of Group revenue (2013: 71%); and
‒ Recurring revenue growth, with strong subscription growth, underpins confidence in meeting 2015 targets.
Sound execution against strategic priorities sees subscription base increase and cloud momentum build
‒ The move to higher quality software subscription revenue continued, with a 29% increase in the organic
annualised value of the software subscriber base to £220m (2013: £170m);
‒ Subscription is driving increased customer loyalty, which is reflected in an increase in the recurring contract
renewal rate to 83% (2013: 82%);
‒ Strong momentum for Sage One as a small business global cloud solution; present in 10 markets and ca.150%
increase in paying subscriptions to 86,000 (2013: 35,000*), driven by strong run-rates in the UK & Ireland (“UKI”)
and South Africa; and
‒ Disciplined resource allocation continued with 17% increase in R&D# and S&M
^ expenditure on “Invest” products.
Stephen Kelly, Chief Executive Officer, said: “I would like to thank Guy Berruyer for leading Sage to deliver an
encouraging set of results with a strong finish to the year. I reconfirm the Board’s financial targets for 2015 and
recognise the 2014 results as an important milestone on the path to meeting them. Our financial performance
demonstrates the strength of Sage’s global business and the quality of relationships it has with millions of SME
customers worldwide.
Looking ahead, I believe that Sage, as a trusted partner to our customers, can be even more instrumental in
supporting the success of SMEs around the world. I look forward to building on Sage’s technology leadership, both in
2
the cloud and on-premise, together with our outstanding customer support, to the benefit of our current and future
SME customers.”
Enquiries:
The Sage Group plc +44 (0) 191 294 4190 Tulchan Communications +44 (0) 20 7353 4200
Stephen Kelly, Chief Executive Officer David Shriver
Steve Hare, Chief Financial Officer Jonathan Sibun
Murdo Montgomery, Investor Relations
An analyst presentation will be held at 8.45am today at the London Stock Exchange plc, 10 Paternoster Square, London, EC4M 7LS. A live
webcast of the presentation will be hosted on www.sage.com/investors, dial-in number +44 (0) 20 3139 4830, pin code: 17266415#. A replay of the
call will also be available for two weeks after the event: Tel: +44 (0) 20 3426 2807, pin code: 651519#.
Non-GAAP measures
Unless stated otherwise, growth rates in the Performance review, Operating review and Financial review are on an organic basis. For information
on the calculation of Non-GAAP measures and why they are used, please see Appendix II on page 16.
Rounding
As a result of rounding throughout this document, it is possible that tables may not cast and change percentages may not calculate precisely.
Performance review
On track to deliver the 2015 financial targets
These results are important in demonstrating we are on track to achieve our financial targets for 2015. Reporting
organic revenue growth of 5% (2013: 4%) and operating profit margin of 27.5% (2013: 27.1%) means the Group
remains confident of achieving the targets of 6% organic revenue growth and organic operating profit margin of 28% in
2015.
Recurring revenue grew organically by 7% (2013: 6%), whilst organic SSRS revenue contracted by 1% (2013: flat).
The increase in recurring revenue growth is a key feature of these results and reflected a strong software subscription
performance. Software subscription revenue grew organically by 28%, reflecting acceleration in the second half on
the 23% growth reported in the first half. The recurring revenue growth and strong software subscription performance
are important indicators of the underlying strength of the business and underpin confidence in the improved growth
trajectory expected for 2015.
Recurring revenue, which includes software subscriptions, payments and support, now represents 73% of Group
revenue (2013: 71%). The continuing shift to a higher quality revenue mix reflects the increased contribution from
software subscription. The software subscription contract base continues to grow, with over 450,000 contracts across
the Group.
The increase in organic revenue growth has been achieved despite a weaker performance in payments, particularly in
North America. Improving the performance of payments and driving the number of integrated payments customers
remain key priorities, particularly as they have performed below our expectations this year. Likewise,
underperformance in the mid-market in France continued as a drag on growth. This was reflected in the lower full-year
organic growth rate of 7% (2013: 12%) reported for Sage ERP X3, our global solution for the mid-market. Sage ERP
X3 grew well internationally, however, delivering 20% growth outside of France. The ambition for double-digit long-
term growth for Sage ERP X3 remains.
Software subscription is growing well, in-line with our plans for measured adoption
We are pursuing more active relationships with our customers through subscription. Our progressive approach is
based on demonstrating the benefits and flexibility subscription offers them, rather than by mandatorily moving them
to subscription pricing. The resulting commitment to offering customers choice around how they can buy a software
3
licence reflects the importance we place on customer satisfaction and retention. The emphasis is therefore on Sage to
present customers with differentiated propositions that persuade them to make the transition to subscription.
The growth in the annualised value of the software subscriber base of 29% to £220m, together with subscription
contract renewal rates in the region of 90%, is good evidence that our measured approach is effective.
The move to subscription is attractive for Sage and our customers as it builds greater and more predictable revenue
streams for the future. By balancing subscription adoption across new and existing customers, we are managing the
potential near-term impact on revenue of the transition to subscription. The opportunity we have with existing
customers around growing share of wallet, improving retention rates and increasing recurring contract attachment, is
helping us to manage the near-term impact of subscription displacing licence revenue.
Our cloud solutions, core product modernisation initiatives and growing portfolio of connected services are providing
subscription catalysts for all of our customers, regardless of whether their core system is on-premise or in the cloud.
Core product modernisation is a particularly significant opportunity with the Sage installed based. It creates the flexible
architecture required to liberate customer data and make it available in the cloud so we can deliver an enriched
desktop experience enhanced with connected services. Core product modernisation has been an important catalyst in
driving subscription across our portfolio in 2014. Key highlights during the year include Sage 50 Payroll in the UK,
Sage Ciel Flex in France and Sage 100 i7 in France.
Sage 50 Payroll auto-enrolment connected service
This connected service, which helps SMEs in the UK comply with new pension legislation, has been a strong driver of
growth. It is only available on subscription and is supported on the latest version of Sage 50 Payroll. This revenue is
incremental because we typically added new services into customers’ existing premium support plan bundles in the
past.
At the end of September 2014, the annualised value of our auto-enrolment subscription contract base was
approximately £8m. This reflects an attachment rate amongst customers that needed to comply with auto-enrolment in
2014 of over 60%. We are well placed to continue supporting businesses that will need to comply with auto-enrolment
legislation going forward.
Sage Ciel Flex
Sage Ciel accounting and payroll products are aimed at start-up and small business (“SSB”) customers in France. The
success of the tiered subscription offer called Flex shows that SSB customers are willing to move to a recurring
subscription relationship if they see a product offers added value. At the end of September 2014, the annualised
value of our Sage Ciel Flex subscription contract base was approximately £9m, an increase from £5m in the prior
year. Over 60% of customers on subscription have chosen to subscribe to Sage Ciel Ultraflex, which is the highest tier
available and includes premium features and cloud capability.
Sage Ciel Flex demonstrates well the reactivation of off-plan customers. Approximately 50% of revenue from new Flex
contracts secured in the financial year was derived from customers who were previously not on a recurring support
plan.
Sage 100 i7
Sage 100 i7 is aimed at small to medium sized customers (“SMB”) in France. It is a premium subscription product and
has now been a driver of upgrade activity in the French installed base for several consecutive reporting periods. It
offers a major user interface upgrade, can be accessed through a web browser and incorporates business intelligence
and spreadsheet integration capabilities. We also launched Sage 100 i7 Payroll during the year, which has driven
upgrade activity in the second half.
At the end of September 2014, the annualised value of our Sage 100 i7 ERP and payroll subscription contract base
was over £16m. The vast majority of the subscriber base is made up of migrating existing customers who have a
4
support contract, where the strategy is to drive higher average selling price on subscription. This reflects the premium
positioning of the product. Sage 100 i7 is either available on a subscription-only contract or a lower-priced subscription
contract together with an up-front fee. These fees are helping us to smooth the impact our subscription transition is
having on our SSRS revenue base.
Momentum building in the cloud, with 86,000 Sage One paying subscriptions globally
Sage One is well established in the market as our global software-as-a-service (“SaaS”) solution for smaller
businesses, with a ca.150% increase in paying subscriptions to 86,000 (2013: 35,000). We continue to push ahead
with our global roll-out for Sage One, which is available in 10 countries, so that we are well placed to drive growth in
markets as cloud adoption accelerates.
We continue to make good progress with Sage One in the UKI, where the number of paying subscriptions more than
doubled to 47,000 from over 21,000 in the last 12 months. This represents a strong increase in average run-rate to
over 2,100 per month, up from around 1,300 per month last year, and reflects acceleration to 2,300 per month in the
second half of the year.
We also have strong traction with Sage One in South Africa, where the number of paying subscriptions increased from
8,700 to over 21,000 in the last 12 months. Adoption in Continental Europe remains low, reflecting nascent uptake of
cloud solutions amongst SSB customers more generally in that market. In North America, the number of paying
subscriptions remains behind plan, but we continue to build a product portfolio to provide an attractive cloud platform
for small businesses. We see accountants as a key channel for driving Sage One growth, with the introduction of
Sage One Accountant Edition in North America an important development in 2014. Driving accountants’ engagement
and the introduction of Sage One Extra in the US and Canada are key priorities for 2015.
As part of the Group’s continued investment in the cloud, our SaaS entry-level products in France, Germany and
South Africa were redesigned and incorporated into the Sage One portfolio during the year. This involved rebranding
and aligning the user interface and product workflows to create global consistency. Excluding the newly incorporated
products, year-end Sage One paying subscriptions were 52,600 (2013: 22,400).
Sage’s hybrid cloud solutions for SMB customers are gaining traction, with the number of paying subscriptions
doubling during the year to 1,500. The launch of Sage ERP X3 version 7 in the summer means we also offer the mid-
market a solution with mobility and web access at its core. We expect to see further good progress in adoption for
these solutions in 2015.
Disciplined approach to resource and capital allocation
62% of total research and development (“R&D”) expenditure (2013: 52%) and 57% of total sales and marketing
(“S&M”) expenditure (2013: 52%) is now directed towards the Invest portfolio. This has resulted in an overall increase
in absolute spend during the year across Invest products of 17%, alongside an incremental improvement in organic
operating profit margin to 27.5%. The disciplined approach to resource allocation supports the 28% organic operating
profit margin target in 2015, which we are on track to deliver.
We are also disciplined in our approach to acquisitions, focusing on opportunities that support growth in our core
business and meet our returns criteria. During the year we announced two in-fill acquisitions, which strengthen our
payroll capability in the US and Germany, and acquired the remaining 25% of Folhamatic in Brazil. We also performed
an impairment review and recorded a £44m non-cash charge relating to our Brazilian operations. This reflects the
deterioration in the financial and economic environment in Brazil. Notwithstanding this impairment, we remain
confident about our growth prospects in Brazil, as reflected in the 9% organic revenue growth reported for 2014.
Consistent with our focus on shareholder returns, the Board is proposing a 7% increase in the total ordinary dividend
for the year to 12.12p per share (2013: 11.32p per share). The ordinary dividend for the year is covered 1.9x by
underlying earnings per share.

5
The Board
In August 2014, we announced the appointment of Stephen Kelly to the Board as Chief Executive Officer, effective
from 5 November 2014. Earlier this year, Steve Hare joined the Board as Chief Financial Officer, effective from 3
January 2014.
We also announced the appointment of two new non-executive directors to the Board, namely Drummond Hall and
Inna Kuznetsova, effective from 1 January 2014 and 6 March 2014 respectively. In November 2013, Mark Rolfe and
Ian Mason retired from their roles on the Board as non-executive directors.
Summary and outlook
These results are important in demonstrating we are on track to achieve our financial targets for 2015. Revenue
growth is increasing, the subscription base is growing and cloud momentum is building. The Group remains confident
of achieving 6% organic revenue growth in 2015, with the anticipated acceleration in growth weighted to the second
half of the year, and organic operating profit margin of 28%.
6
Operating review
Group performance
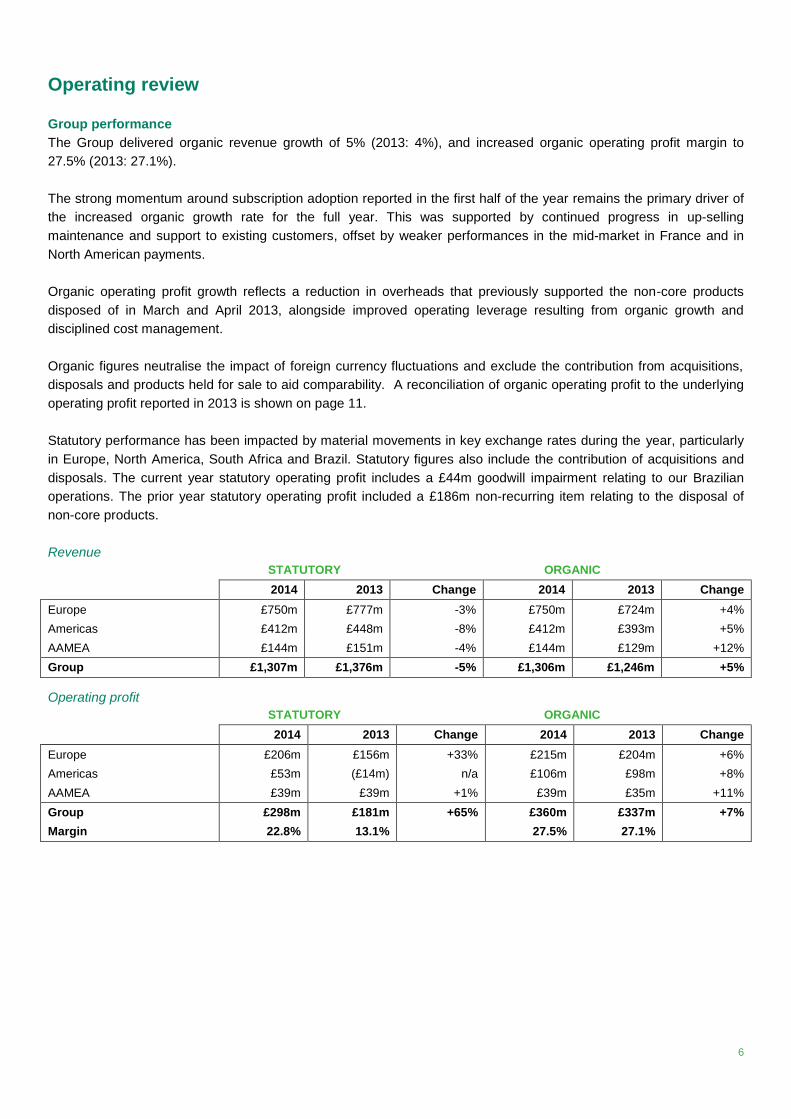
The Group delivered organic revenue growth of 5% (2013: 4%), and increased organic operating profit margin to
27.5% (2013: 27.1%).
The strong momentum around subscription adoption reported in the first half of the year remains the primary driver of
the increased organic growth rate for the full year. This was supported by continued progress in up-selling
maintenance and support to existing customers, offset by weaker performances in the mid-market in France and in
North American payments.
Organic operating profit growth reflects a reduction in overheads that previously supported the non-core products
disposed of in March and April 2013, alongside improved operating leverage resulting from organic growth and
disciplined cost management.
Organic figures neutralise the impact of foreign currency fluctuations and exclude the contribution from acquisitions,
disposals and products held for sale to aid comparability. A reconciliation of organic operating profit to the underlying
operating profit reported in 2013 is shown on page 11.
Statutory performance has been impacted by material movements in key exchange rates during the year, particularly
in Europe, North America, South Africa and Brazil. Statutory figures also include the contribution of acquisitions and
disposals. The current year statutory operating profit includes a £44m goodwill impairment relating to our Brazilian
operations. The prior year statutory operating profit included a £186m non-recurring item relating to the disposal of
non-core products.
Revenue
. STATUTORY . ORGANIC .
. 2014 2013 Change 2014 2013 Change
Europe £750m £777m -3% £750m £724m +4%
Americas £412m £448m -8% £412m £393m +5%
AAMEA £144m £151m -4% £144m £129m +12%
Group £1,307m £1,376m -5% £1,306m £1,246m +5%
Operating profit
. STATUTORY . ORGANIC .
. 2014 2013 Change 2014 2013 Change
Europe £206m £156m +33% £215m £204m +6%
Americas £53m (£14m) n/a £106m £98m +8%
AAMEA £39m £39m +1% £39m £35m +11%
Group £298m £181m +65% £360m £337m +7%
Margin 22.8% 13.1% 27.5% 27.1%
7
Revenue mix
. RECURRING REVENUE . SSRS REVENUE .
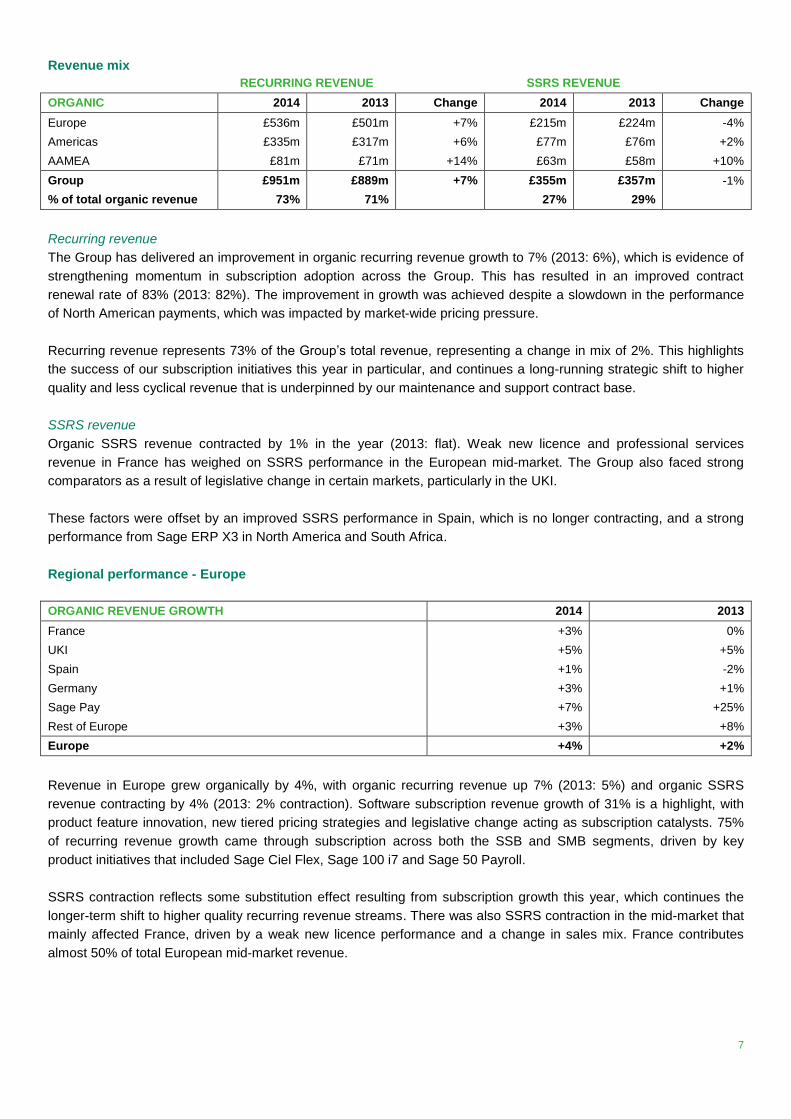
ORGANIC 2014 2013 Change 2014 2013 Change
Europe £536m £501m +7% £215m
£224m -4%
Americas £335m £317m +6% £77m £76m +2%
AAMEA £81m £71m +14% £63m £58m +10%
Group £951m £889m +7% £355m £357m -1%
% of total organic revenue 73% 71% 27% 29%
Recurring revenue
The Group has delivered an improvement in organic recurring revenue growth to 7% (2013: 6%), which is evidence of
strengthening momentum in subscription adoption across the Group. This has resulted in an improved contract
renewal rate of 83% (2013: 82%). The improvement in growth was achieved despite a slowdown in the performance
of North American payments, which was impacted by market-wide pricing pressure.
Recurring revenue represents 73% of the Group’s total revenue, representing a change in mix of 2%. This highlights
the success of our subscription initiatives this year in particular, and continues a long-running strategic shift to higher
quality and less cyclical revenue that is underpinned by our maintenance and support contract base.
SSRS revenue
Organic SSRS revenue contracted by 1% in the year (2013: flat). Weak new licence and professional services
revenue in France has weighed on SSRS performance in the European mid-market. The Group also faced strong
comparators as a result of legislative change in certain markets, particularly in the UKI.
These factors were offset by an improved SSRS performance in Spain, which is no longer contracting, and a strong
performance from Sage ERP X3 in North America and South Africa.
Regional performance - Europe
ORGANIC REVENUE GROWTH 2014 2013
France +3% 0%
UKI +5% +5%
Spain +1% -2%
Germany +3% +1%
Sage Pay +7% +25%
Rest of Europe +3% +8%
Europe +4% +2%
Revenue in Europe grew organically by 4%, with organic recurring revenue up 7% (2013: 5%) and organic SSRS
revenue contracting by 4% (2013: 2% contraction). Software subscription revenue growth of 31% is a highlight, with
product feature innovation, new tiered pricing strategies and legislative change acting as subscription catalysts. 75%
of recurring revenue growth came through subscription across both the SSB and SMB segments, driven by key
product initiatives that included Sage Ciel Flex, Sage 100 i7 and Sage 50 Payroll.
SSRS contraction reflects some substitution effect resulting from subscription growth this year, which continues the
longer-term shift to higher quality recurring revenue streams. There was also SSRS contraction in the mid-market that
mainly affected France, driven by a weak new licence performance and a change in sales mix. France contributes
almost 50% of total European mid-market revenue.
8
France – strong subscription momentum offsets mid-market weakness
In France, organic revenue grew by 3%, with growth excluding the mid-market of 4%. Strong subscription momentum
remained the primary driver, with over 40% of France’s recurring revenue base comprised of software subscription
revenue that grew 24% in the year.
Success continues to centre on the Sage 100 i7 upgrade programme, which is now available across both accounts
and payroll, and the tiered subscription-only Sage Ciel Flex offering. Sage Ciel Flex has been particularly successful in
offsetting a declining performance of the legacy Ciel product in the retail channel. These initiatives highlight the
attraction of subscription to both SMB and SSB customers respectively.
UKI – value-adding subscription catalysts drives growth
UKI revenue has grown organically by 5%. Subscription is taking hold in the UKI with growth of 30% in the year, with
Sage 50 Payroll in the SSB segment and Sage 200 in the SMB segment behind this strong performance. Subscription
revenue now represents almost 25% of total UKI recurring revenue.
Sage One also delivered strong growth in paying subscriptions, which grew from over 21,000 to 47,000. Whilst Sage
One is not yet a material constituent part of the UKI revenue base, it is an important product in driving market share
growth in the SSB segment.
These good performances were partially offset by a decline in SSRS revenue, which was boosted last year by the
Real-Time Information (“RTI”) legislative change initiative.
Spain – new pricing strategies and up-selling drive return to growth
Revenue in Spain grew 1% organically after several consecutive reporting periods of contraction. The recovery was
led by a return to SSRS growth, which contracted by 7% last year alongside modest contraction in recurring revenue.
Sage Murano and Sage Despachos upgrade initiatives were the primary drivers of this improvement in the SMB and
Accountants segments respectively.
Spain’s return to growth is the result of positive and successful management action in an economic environment that
is still uncertain despite some signs of improvement. We are now seeing better growth rates for Sage Contaplus, our
flagship SSB product in Spain. This follows the introduction of new, simplified pricing tiers and software and support
bundles, which have improved renewal rates and encouraged customers to move to higher value plans.
Germany – improved recurring revenue growth supports growth
In Germany, the rate of organic growth increased to 3%. SSRS contraction slowed to 2% compared to the prior year
contraction of 4%, whilst recurring revenue growth increased to 7% from 5% last year, reflecting focus on premium
support up-selling across several SSB and SMB products including Sage Office Line.
Sage Pay – growth rate slows after one-off price increase supported prior year growth
Sage Pay delivered organic revenue growth of 7%. Growth of 25% in the prior year was primarily due to a price
increase made in the second half of 2012 that is now fully represented in the comparator. The payments landscape in
the UK is highly competitive and this has impacted the rate of new customer acquisition. Progress around the cross-
sell of payments into the accounting installed base has also been below expectation but remains an opportunity for
2015.
Rest of Europe
Organic revenue in Portugal grew by 1% (2013: 17%), with prior year growth largely due to a non-recurring legislative
catalyst. Whilst current year SSRS revenue has therefore contracted by 21% against a strong comparator, recurring
revenue has grown by 19% through focus on support contract penetration and renewals as customers look to remain
legislatively compliant.
In Switzerland, revenue grew 3% organically (2013: 3%), whilst organic revenue grew 5% in Poland (2013: 7%).
9
Organic operating profit
Organic operating profit in Europe increased to £215m (2013: £204m), representing a margin of 28.6% (2013: 28.1%),
primarily as a result of revenue growth improving operating leverage. The Group continues to invest in Europe in
support of growth, particularly across R&D, S&M and customer support, whilst reducing the overhead base that
supported non-core products that were disposed of last year.
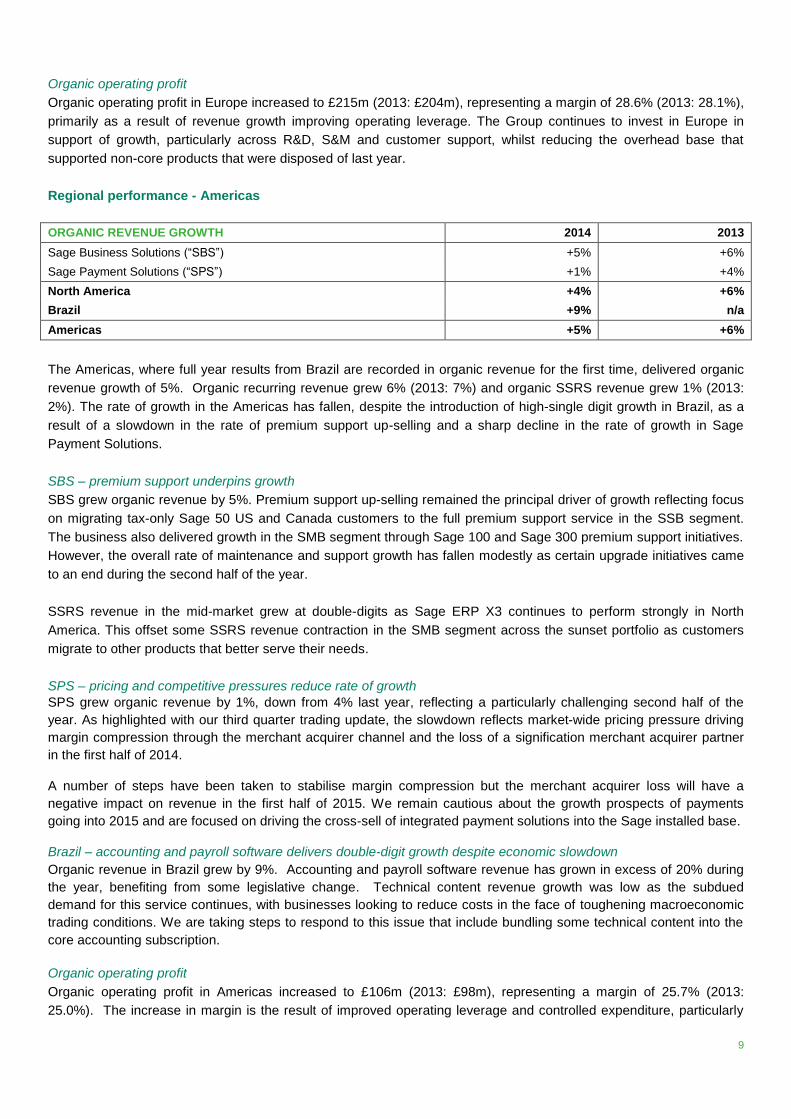
Regional performance - Americas
ORGANIC REVENUE GROWTH 2014 2013
Sage Business Solutions (“SBS”) +5% +6%
Sage Payment Solutions (“SPS”) +1% +4%
North America +4% +6%
Brazil +9% n/a
Americas +5% +6%
The Americas, where full year results from Brazil are recorded in organic revenue for the first time, delivered organic
revenue growth of 5%. Organic recurring revenue grew 6% (2013: 7%) and organic SSRS revenue grew 1% (2013:
2%). The rate of growth in the Americas has fallen, despite the introduction of high-single digit growth in Brazil, as a
result of a slowdown in the rate of premium support up-selling and a sharp decline in the rate of growth in Sage
Payment Solutions.
SBS – premium support underpins growth
SBS grew organic revenue by 5%. Premium support up-selling remained the principal driver of growth reflecting focus
on migrating tax-only Sage 50 US and Canada customers to the full premium support service in the SSB segment.
The business also delivered growth in the SMB segment through Sage 100 and Sage 300 premium support initiatives.
However, the overall rate of maintenance and support growth has fallen modestly as certain upgrade initiatives came
to an end during the second half of the year.
SSRS revenue in the mid-market grew at double-digits as Sage ERP X3 continues to perform strongly in North
America. This offset some SSRS revenue contraction in the SMB segment across the sunset portfolio as customers
migrate to other products that better serve their needs.
SPS – pricing and competitive pressures reduce rate of growth
SPS grew organic revenue by 1%, down from 4% last year, reflecting a particularly challenging second half of the
year. As highlighted with our third quarter trading update, the slowdown reflects market-wide pricing pressure driving
margin compression through the merchant acquirer channel and the loss of a signification merchant acquirer partner
in the first half of 2014.
A number of steps have been taken to stabilise margin compression but the merchant acquirer loss will have a
negative impact on revenue in the first half of 2015. We remain cautious about the growth prospects of payments
going into 2015 and are focused on driving the cross-sell of integrated payment solutions into the Sage installed base.
Brazil – accounting and payroll software delivers double-digit growth despite economic slowdown
Organic revenue in Brazil grew by 9%. Accounting and payroll software revenue has grown in excess of 20% during
the year, benefiting from some legislative change. Technical content revenue growth was low as the subdued
demand for this service continues, with businesses looking to reduce costs in the face of toughening macroeconomic
trading conditions. We are taking steps to respond to this issue that include bundling some technical content into the
core accounting subscription.
Organic operating profit
Organic operating profit in Americas increased to £106m (2013: £98m), representing a margin of 25.7% (2013:
25.0%). The increase in margin is the result of improved operating leverage and controlled expenditure, particularly
10
around headcount costs. There has also been a strong focus on reallocation of R&D investment towards Invest
products and on reducing non-core product-related overheads.
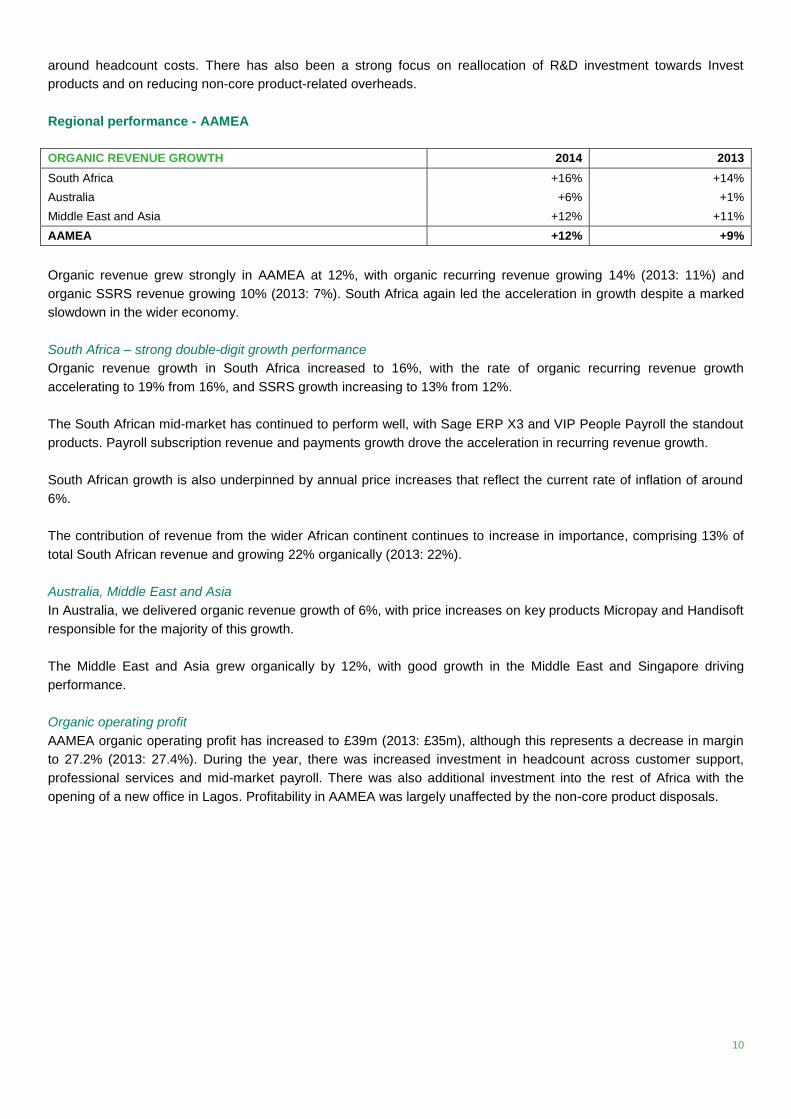
Regional performance - AAMEA
ORGANIC REVENUE GROWTH 2014 2013
South Africa +16% +14%
Australia +6% +1%
Middle East and Asia +12% +11%
AAMEA +12% +9%
Organic revenue grew strongly in AAMEA at 12%, with organic recurring revenue growing 14% (2013: 11%) and
organic SSRS revenue growing 10% (2013: 7%). South Africa again led the acceleration in growth despite a marked
slowdown in the wider economy.
South Africa – strong double-digit growth performance
Organic revenue growth in South Africa increased to 16%, with the rate of organic recurring revenue growth
accelerating to 19% from 16%, and SSRS growth increasing to 13% from 12%.
The South African mid-market has continued to perform well, with Sage ERP X3 and VIP People Payroll the standout
products. Payroll subscription revenue and payments growth drove the acceleration in recurring revenue growth.
South African growth is also underpinned by annual price increases that reflect the current rate of inflation of around
6%.
The contribution of revenue from the wider African continent continues to increase in importance, comprising 13% of
total South African revenue and growing 22% organically (2013: 22%).
Australia, Middle East and Asia
In Australia, we delivered organic revenue growth of 6%, with price increases on key products Micropay and Handisoft
responsible for the majority of this growth.
The Middle East and Asia grew organically by 12%, with good growth in the Middle East and Singapore driving
performance.
Organic operating profit
AAMEA organic operating profit has increased to £39m (2013: £35m), although this represents a decrease in margin
to 27.2% (2013: 27.4%). During the year, there was increased investment in headcount across customer support,
professional services and mid-market payroll. There was also additional investment into the rest of Africa with the
opening of a new office in Lagos. Profitability in AAMEA was largely unaffected by the non-core product disposals.
11
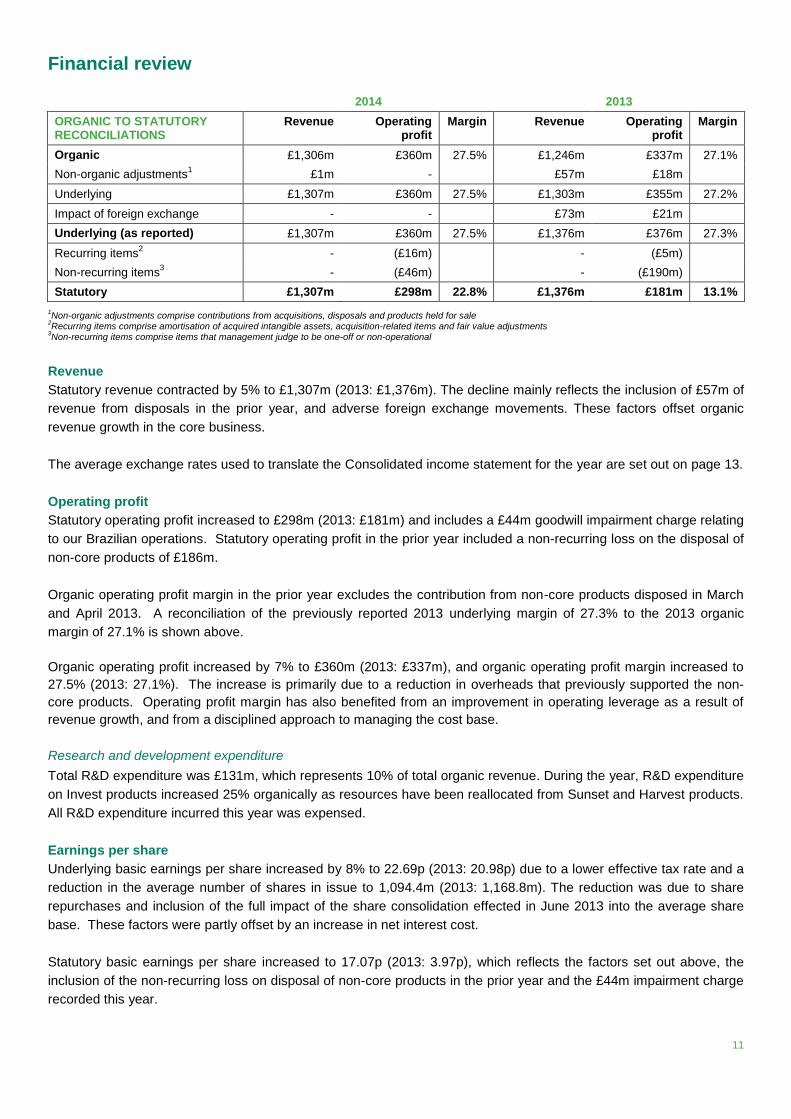
Financial review
2014 2013
ORGANIC TO STATUTORY RECONCILIATIONS
Revenue Operating profit
Margin Revenue Operating profit
Margin
Organic £1,306m £360m 27.5% £1,246m £337m 27.1%
Non-organic adjustments1 £1m - £57m £18m
Underlying £1,307m £360m 27.5% £1,303m £355m 27.2%
Impact of foreign exchange - - £73m £21m
Underlying (as reported) £1,307m £360m 27.5% £1,376m £376m 27.3%
Recurring items2 - (£16m) - (£5m)
Non-recurring items3 - (£46m) - (£190m)
Statutory £1,307m £298m 22.8% £1,376m £181m 13.1%
1Non-organic adjustments comprise contributions from acquisitions, disposals and products held for sale
2Recurring items comprise amortisation of acquired intangible assets, acquisition-related items and fair value adjustments
3Non-recurring items comprise items that management judge to be one-off or non-operational
Revenue
Statutory revenue contracted by 5% to £1,307m (2013: £1,376m). The decline mainly reflects the inclusion of £57m of
revenue from disposals in the prior year, and adverse foreign exchange movements. These factors offset organic
revenue growth in the core business.
The average exchange rates used to translate the Consolidated income statement for the year are set out on page 13.
Operating profit
Statutory operating profit increased to £298m (2013: £181m) and includes a £44m goodwill impairment charge relating
to our Brazilian operations. Statutory operating profit in the prior year included a non-recurring loss on the disposal of
non-core products of £186m.
Organic operating profit margin in the prior year excludes the contribution from non-core products disposed in March
and April 2013. A reconciliation of the previously reported 2013 underlying margin of 27.3% to the 2013 organic
margin of 27.1% is shown above.
Organic operating profit increased by 7% to £360m (2013: £337m), and organic operating profit margin increased to
27.5% (2013: 27.1%). The increase is primarily due to a reduction in overheads that previously supported the non-
core products. Operating profit margin has also benefited from an improvement in operating leverage as a result of
revenue growth, and from a disciplined approach to managing the cost base.
Research and development expenditure
Total R&D expenditure was £131m, which represents 10% of total organic revenue. During the year, R&D expenditure
on Invest products increased 25% organically as resources have been reallocated from Sunset and Harvest products.
All R&D expenditure incurred this year was expensed.
Earnings per share
Underlying basic earnings per share increased by 8% to 22.69p (2013: 20.98p) due to a lower effective tax rate and a
reduction in the average number of shares in issue to 1,094.4m (2013: 1,168.8m). The reduction was due to share
repurchases and inclusion of the full impact of the share consolidation effected in June 2013 into the average share
base. These factors were partly offset by an increase in net interest cost.
Statutory basic earnings per share increased to 17.07p (2013: 3.97p), which reflects the factors set out above, the
inclusion of the non-recurring loss on disposal of non-core products in the prior year and the £44m impairment charge
recorded this year.
12
Net finance cost
Net finance costs increased to £21m (2013: £16m). This was principally due to the annualisation of interest on gross
debt following the raising of US$400m of US private placement (“USPP”) loan notes in May 2013. The average
interest rate on borrowings during the year was broadly in line with the prior year at 3.75% (2013: 3.78%).
Taxation
The statutory income tax expense was £90m (2013: £117m). The effective tax rate on statutory profit before tax was
32% (2013: 71%). The effective tax rate on underlying profit before tax was 27% (2013: 28%). This is in excess of the
standard rate of UK tax due to the higher tax rates applicable in the other jurisdictions in which we operate. The prior
year expense includes a non-recurring tax charge of £17m on the disposal of the non-core products.
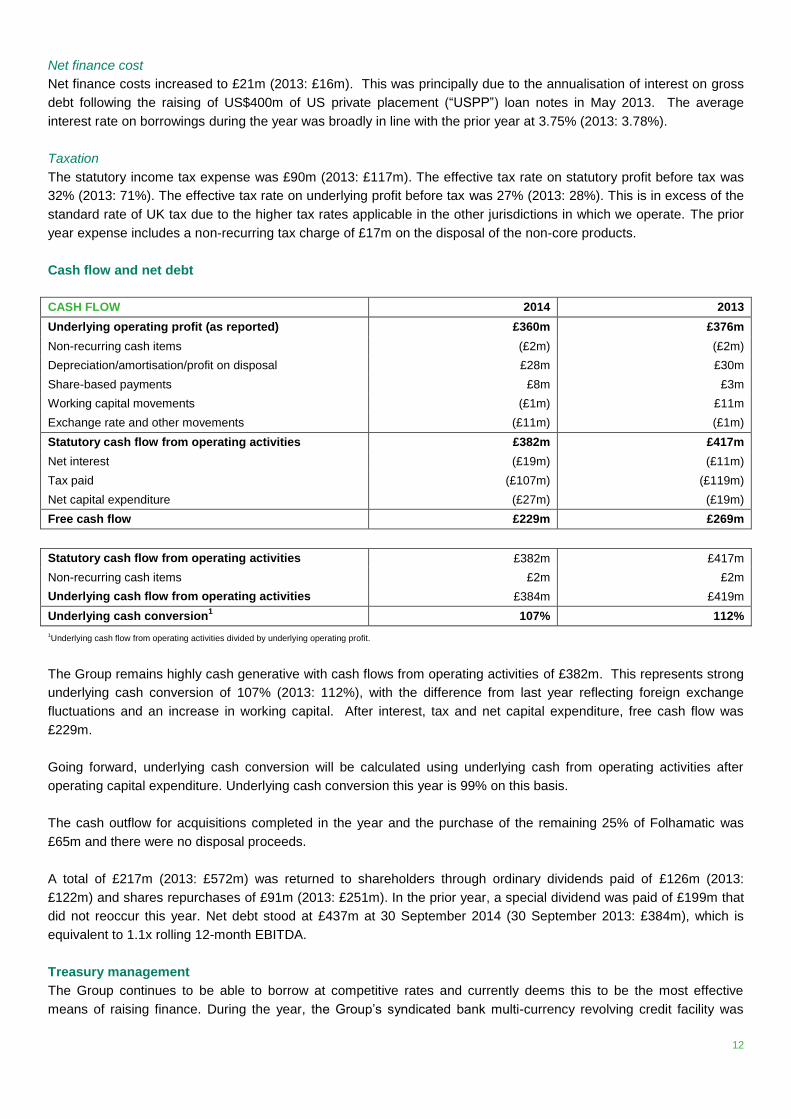
Cash flow and net debt
CASH FLOW 2014 2013
Underlying operating profit (as reported) £360m £376m
Non-recurring cash items (£2m) (£2m)
Depreciation/amortisation/profit on disposal £28m £30m
Share-based payments £8m £3m
Working capital movements (£1m) £11m
Exchange rate and other movements (£11m) (£1m)
Statutory cash flow from operating activities £382m £417m
Net interest (£19m) (£11m)
Tax paid (£107m) (£119m)
Net capital expenditure (£27m) (£19m)
Free cash flow £229m £269m
Statutory cash flow from operating activities £382m £417m
Non-recurring cash items £2m £2m
Underlying cash flow from operating activities £384m £419m
Underlying cash conversion1 107% 112%
1Underlying cash flow from operating activities divided by underlying operating profit.
The Group remains highly cash generative with cash flows from operating activities of £382m. This represents strong
underlying cash conversion of 107% (2013: 112%), with the difference from last year reflecting foreign exchange
fluctuations and an increase in working capital. After interest, tax and net capital expenditure, free cash flow was
£229m.
Going forward, underlying cash conversion will be calculated using underlying cash from operating activities after
operating capital expenditure. Underlying cash conversion this year is 99% on this basis.
The cash outflow for acquisitions completed in the year and the purchase of the remaining 25% of Folhamatic was
£65m and there were no disposal proceeds.
A total of £217m (2013: £572m) was returned to shareholders through ordinary dividends paid of £126m (2013:
£122m) and shares repurchases of £91m (2013: £251m). In the prior year, a special dividend was paid of £199m that
did not reoccur this year. Net debt stood at £437m at 30 September 2014 (30 September 2013: £384m), which is
equivalent to 1.1x rolling 12-month EBITDA.
Treasury management
The Group continues to be able to borrow at competitive rates and currently deems this to be the most effective
means of raising finance. During the year, the Group’s syndicated bank multi-currency revolving credit facility was
13
renewed to June 2019, with the facility level increased to £510m (US$551m and €218m tranches) (2013: £346m,
US$271m and €214m tranches). At 30 September 2014, £111m (2013: £10m) of these facilities were drawn, with the
increase primarily due to the completion of the acquisition in Germany close to the year-end and the purchase of the
remaining 25% of Folhamatic in Brazil.
Total USPP loan notes at 30 September 2014 were £432m (US$700m) (2013: £432m, US$700m). Approximately
£123m (US$200m) of USPP borrowings are due for repayment in March 2015. After the year-end, the Group has,
subject to documentation, priced and agreed investor allocations for the refinancing of this debt in the USPP market.
The agreed refinancing is US$200m (£123m) at 3.73% fixed until 2025, €55m (£43m) at 1.89% fixed until 2022 and
€30m (£23m) at 2.07% fixed until 2023.
Acquisitions
On 15 September 2014, the Group acquired 100% of the share capital of Exact Software Deutschland GmbH (“Exact
Lohn”), a provider of payroll services and software, for a cash consideration of €16m (£13m). As a result of the
acquisition the Group expects to become one of the leading providers of payroll software solutions in Germany.
The put and call arrangement to acquire the remaining 25% non-controlling interest in Folhamatic in Brazil was settled
during the year for consideration of £50m, increasing the Group’s ownership to 100%.
Foreign exchange
The Group does not hedge foreign currency profit and loss translation exposures and the statutory results are
therefore impacted by movements in exchange rates.
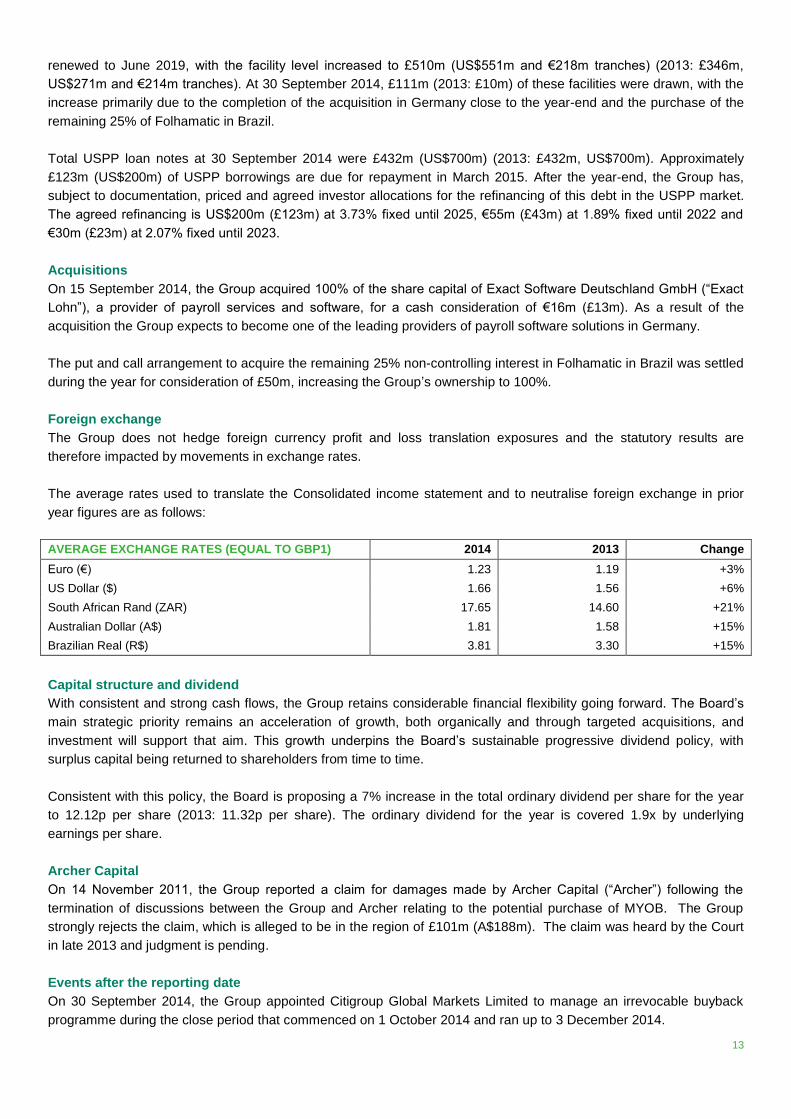
The average rates used to translate the Consolidated income statement and to neutralise foreign exchange in prior
year figures are as follows:
AVERAGE EXCHANGE RATES (EQUAL TO GBP1) 2014 2013 Change
Euro (€) 1.23 1.19 +3%
US Dollar ($) 1.66 1.56 +6%
South African Rand (ZAR) 17.65 14.60 +21%
Australian Dollar (A$) 1.81 1.58 +15%
Brazilian Real (R$) 3.81 3.30 +15%
Capital structure and dividend
With consistent and strong cash flows, the Group retains considerable financial flexibility going forward. The Board’s
main strategic priority remains an acceleration of growth, both organically and through targeted acquisitions, and
investment will support that aim. This growth underpins the Board’s sustainable progressive dividend policy, with
surplus capital being returned to shareholders from time to time.
Consistent with this policy, the Board is proposing a 7% increase in the total ordinary dividend per share for the year
to 12.12p per share (2013: 11.32p per share). The ordinary dividend for the year is covered 1.9x by underlying
earnings per share.
Archer Capital
On 14 November 2011, the Group reported a claim for damages made by Archer Capital (“Archer”) following the
termination of discussions between the Group and Archer relating to the potential purchase of MYOB. The Group
strongly rejects the claim, which is alleged to be in the region of £101m (A$188m). The claim was heard by the Court
in late 2013 and judgment is pending.
Events after the reporting date
On 30 September 2014, the Group appointed Citigroup Global Markets Limited to manage an irrevocable buyback
programme during the close period that commenced on 1 October 2014 and ran up to 3 December 2014.

14
On 16 October 2014, the Group acquired PAI Group, Inc. (“PayChoice”), a provider of payroll and HR services for
small and medium sized businesses in the US, for US$158m (£97m) in cash. The acquisition strengthens Sage’s
position in the large and growing US payroll market.
On 5 November 2014, Stephen Kelly joined the Board as Chief Executive Officer.
Steve Hare
Chief Financial Officer
15
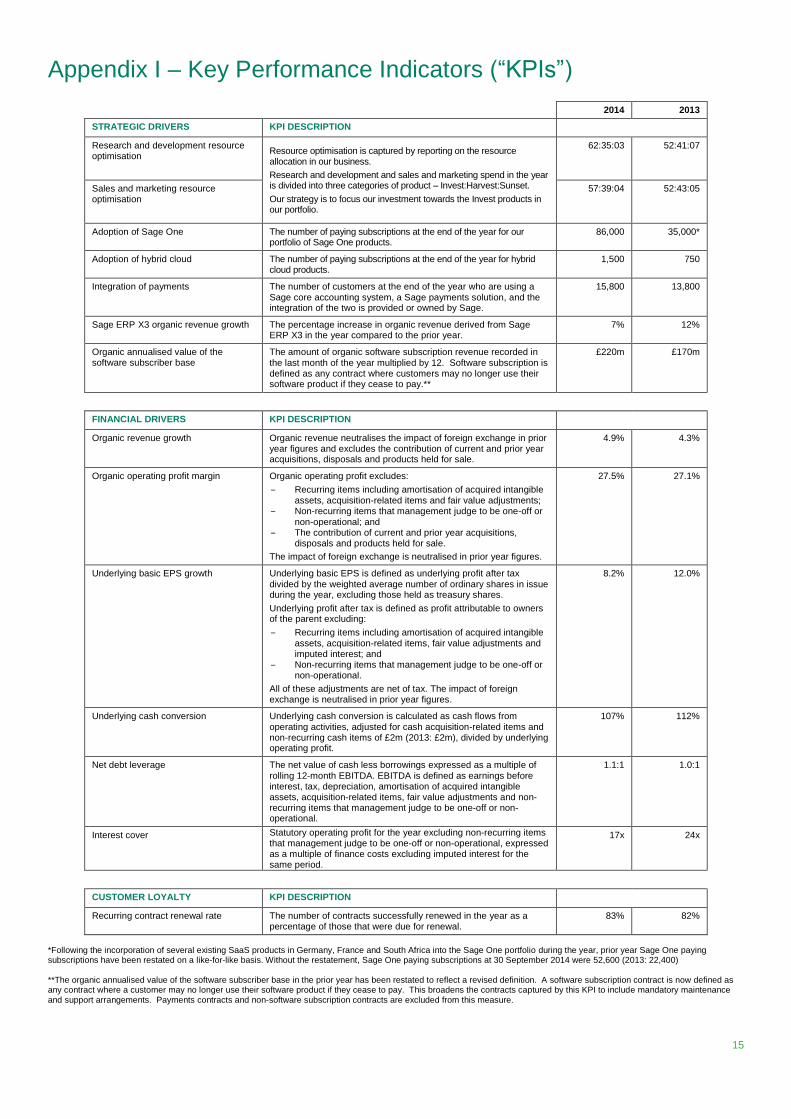
Appendix I – Key Performance Indicators (“KPIs”)
. . 2014 2013
STRATEGIC DRIVERS KPI DESCRIPTION . .
Research and development resource optimisation
Resource optimisation is captured by reporting on the resource allocation in our business.
Research and development and sales and marketing spend in the year is divided into three categories of product – Invest:Harvest:Sunset.
Our strategy is to focus our investment towards the Invest products in our portfolio.
62:35:03 52:41:07
Sales and marketing resource optimisation
57:39:04 52:43:05
Adoption of Sage One The number of paying subscriptions at the end of the year for our portfolio of Sage One products.
86,000 35,000*
Adoption of hybrid cloud The number of paying subscriptions at the end of the year for hybrid cloud products.
1,500 750
Integration of payments The number of customers at the end of the year who are using a Sage core accounting system, a Sage payments solution, and the integration of the two is provided or owned by Sage.
15,800 13,800
Sage ERP X3 organic revenue growth The percentage increase in organic revenue derived from Sage ERP X3 in the year compared to the prior year.
7% 12%
Organic annualised value of the software subscriber base
The amount of organic software subscription revenue recorded in the last month of the year multiplied by 12. Software subscription is defined as any contract where customers may no longer use their software product if they cease to pay.**
£220m £170m
. . . .
FINANCIAL DRIVERS KPI DESCRIPTION . .
Organic revenue growth Organic revenue neutralises the impact of foreign exchange in prior year figures and excludes the contribution of current and prior year acquisitions, disposals and products held for sale.
4.9% 4.3%
Organic operating profit margin Organic operating profit excludes:
‒ Recurring items including amortisation of acquired intangible assets, acquisition-related items and fair value adjustments;
‒ Non-recurring items that management judge to be one-off or non-operational; and
‒ The contribution of current and prior year acquisitions, disposals and products held for sale.
The impact of foreign exchange is neutralised in prior year figures.
27.5% 27.1%
Underlying basic EPS growth Underlying basic EPS is defined as underlying profit after tax divided by the weighted average number of ordinary shares in issue during the year, excluding those held as treasury shares.
Underlying profit after tax is defined as profit attributable to owners of the parent excluding:
‒ Recurring items including amortisation of acquired intangible assets, acquisition-related items, fair value adjustments and imputed interest; and
‒ Non-recurring items that management judge to be one-off or non-operational.
All of these adjustments are net of tax. The impact of foreign exchange is neutralised in prior year figures.
8.2% 12.0%
Underlying cash conversion Underlying cash conversion is calculated as cash flows from operating activities, adjusted for cash acquisition-related items and non-recurring cash items of £2m (2013: £2m), divided by underlying operating profit.
107% 112%
Net debt leverage The net value of cash less borrowings expressed as a multiple of rolling 12-month EBITDA. EBITDA is defined as earnings before interest, tax, depreciation, amortisation of acquired intangible assets, acquisition-related items, fair value adjustments and non-recurring items that management judge to be one-off or non-operational.
1.1:1 1.0:1
Interest cover Statutory operating profit for the year excluding non-recurring items that management judge to be one-off or non-operational, expressed as a multiple of finance costs excluding imputed interest for the same period.
17x 24x
. . . .
CUSTOMER LOYALTY KPI DESCRIPTION
Recurring contract renewal rate The number of contracts successfully renewed in the year as a percentage of those that were due for renewal.
83% 82%
*Following the incorporation of several existing SaaS products in Germany, France and South Africa into the Sage One portfolio during the year, prior year Sage One paying subscriptions have been restated on a like-for-like basis. Without the restatement, Sage One paying subscriptions at 30 September 2014 were 52,600 (2013: 22,400) **The organic annualised value of the software subscriber base in the prior year has been restated to reflect a revised definition. A software subscription contract is now defined as any contract where a customer may no longer use their software product if they cease to pay. This broadens the contracts captured by this KPI to include mandatory maintenance and support arrangements. Payments contracts and non-software subscription contracts are excluded from this measure.
16
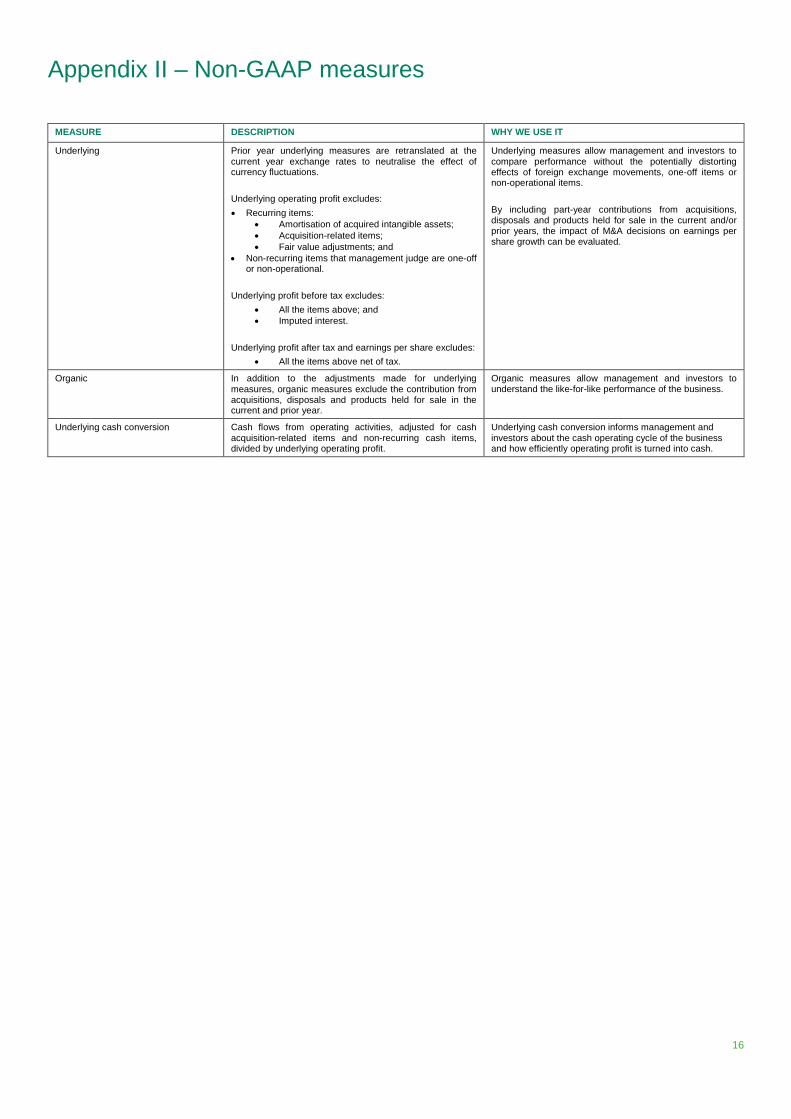
Appendix II – Non-GAAP measures
MEASURE DESCRIPTION WHY WE USE IT
Underlying Prior year underlying measures are retranslated at the current year exchange rates to neutralise the effect of currency fluctuations.
Underlying operating profit excludes:
Recurring items:
Amortisation of acquired intangible assets;
Acquisition-related items;
Fair value adjustments; and
Non-recurring items that management judge are one-off or non-operational.
Underlying profit before tax excludes:
All the items above; and
Imputed interest.
Underlying profit after tax and earnings per share excludes:
All the items above net of tax.
Underlying measures allow management and investors to compare performance without the potentially distorting effects of foreign exchange movements, one-off items or non-operational items.
By including part-year contributions from acquisitions, disposals and products held for sale in the current and/or prior years, the impact of M&A decisions on earnings per share growth can be evaluated.
Organic In addition to the adjustments made for underlying measures, organic measures exclude the contribution from acquisitions, disposals and products held for sale in the current and prior year.
Organic measures allow management and investors to understand the like-for-like performance of the business.
Underlying cash conversion Cash flows from operating activities, adjusted for cash acquisition-related items and non-recurring cash items, divided by underlying operating profit.
Underlying cash conversion informs management and investors about the cash operating cycle of the business and how efficiently operating profit is turned into cash.
17
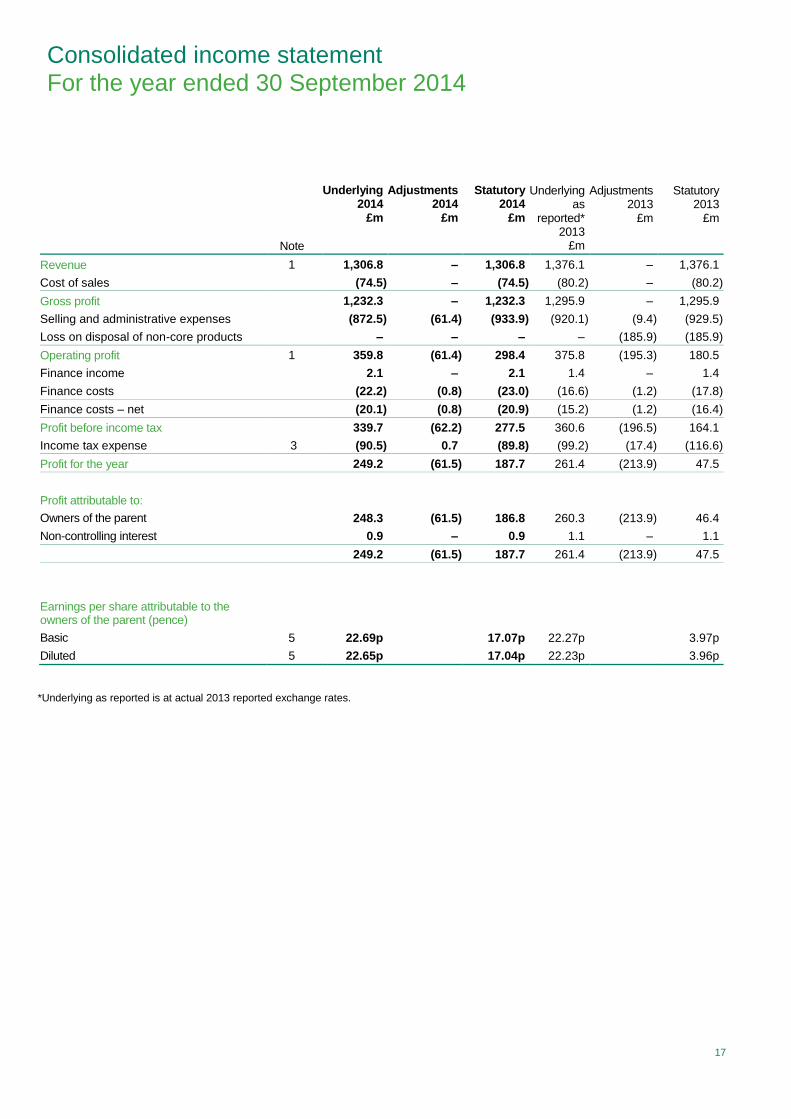
Consolidated income statement For the year ended 30 September 2014
Note
Underlying 2014
£m
Adjustments 2014
£m
Statutory 2014
£m
Underlying as
reported* 2013
£m
Adjustments 2013
£m
Statutory 2013
£m
Revenue 1 1,306.8 – 1,306.8 1,376.1 – 1,376.1
Cost of sales (74.5) – (74.5) (80.2) – (80.2)
Gross profit 1,232.3 – 1,232.3 1,295.9 – 1,295.9
Selling and administrative expenses (872.5) (61.4) (933.9) (920.1) (9.4) (929.5)
Loss on disposal of non-core products – – – – (185.9) (185.9)
Operating profit 1 359.8 (61.4) 298.4 375.8 (195.3) 180.5
Finance income 2.1 – 2.1 1.4 – 1.4
Finance costs (22.2) (0.8) (23.0) (16.6) (1.2) (17.8)
Finance costs – net (20.1) (0.8) (20.9) (15.2) (1.2) (16.4)
Profit before income tax 339.7 (62.2) 277.5 360.6 (196.5) 164.1
Income tax expense 3 (90.5) 0.7 (89.8) (99.2) (17.4) (116.6)
Profit for the year 249.2 (61.5) 187.7 261.4 (213.9) 47.5
Profit attributable to:
Owners of the parent 248.3 (61.5) 186.8 260.3 (213.9) 46.4
Non-controlling interest 0.9 – 0.9 1.1 – 1.1
249.2 (61.5) 187.7 261.4 (213.9) 47.5
Earnings per share attributable to the owners of the parent (pence)
Basic 5 22.69p 17.07p 22.27p 3.97p
Diluted 5 22.65p 17.04p 22.23p 3.96p
*Underlying as reported is at actual 2013 reported exchange rates.
18
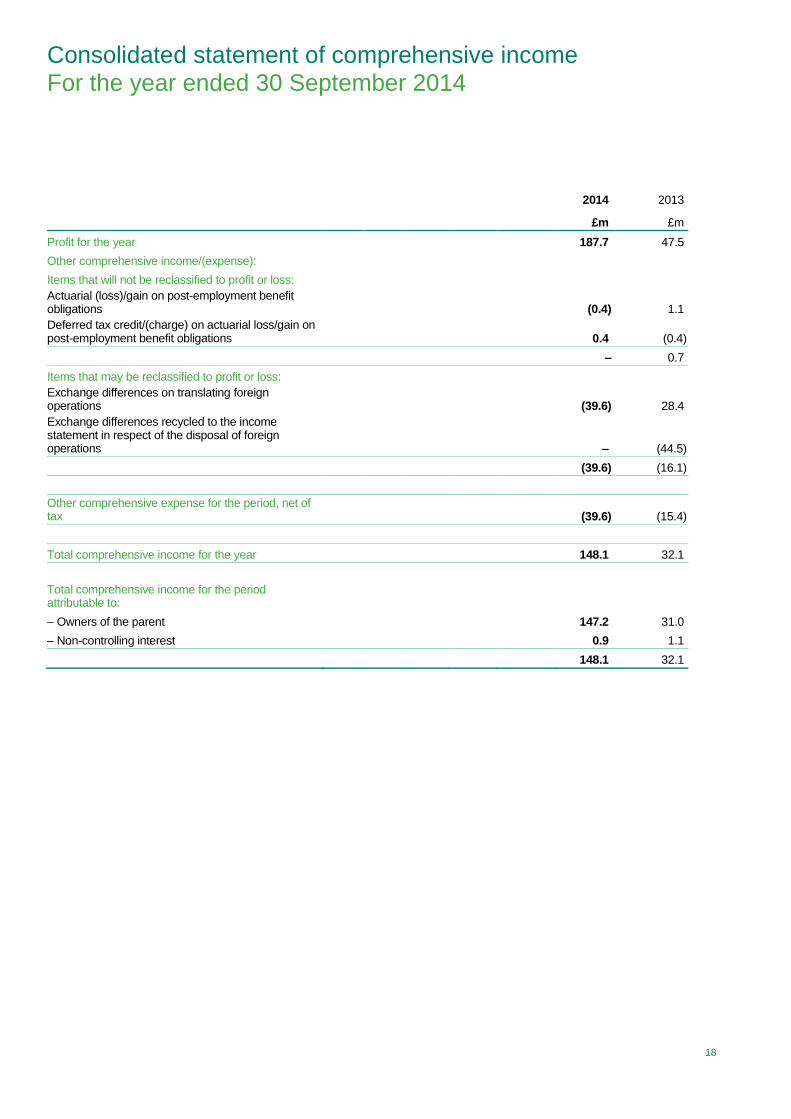
Consolidated statement of comprehensive income For the year ended 30 September 2014
2014
£m
2013
£m
Profit for the year 187.7 47.5
Other comprehensive income/(expense):
Items that will not be reclassified to profit or loss:
Actuarial (loss)/gain on post-employment benefit obligations
(0.4) 1.1
Deferred tax credit/(charge) on actuarial loss/gain on post-employment benefit obligations
0.4 (0.4)
– 0.7
Items that may be reclassified to profit or loss:
Exchange differences on translating foreign operations
(39.6) 28.4
Exchange differences recycled to the income statement in respect of the disposal of foreign operations
– (44.5)
(39.6) (16.1)
Other comprehensive expense for the period, net of tax
(39.6) (15.4)
Total comprehensive income for the year 148.1 32.1
Total comprehensive income for the period attributable to:
– Owners of the parent 147.2 31.0
– Non-controlling interest 0.9 1.1
148.1 32.1
19
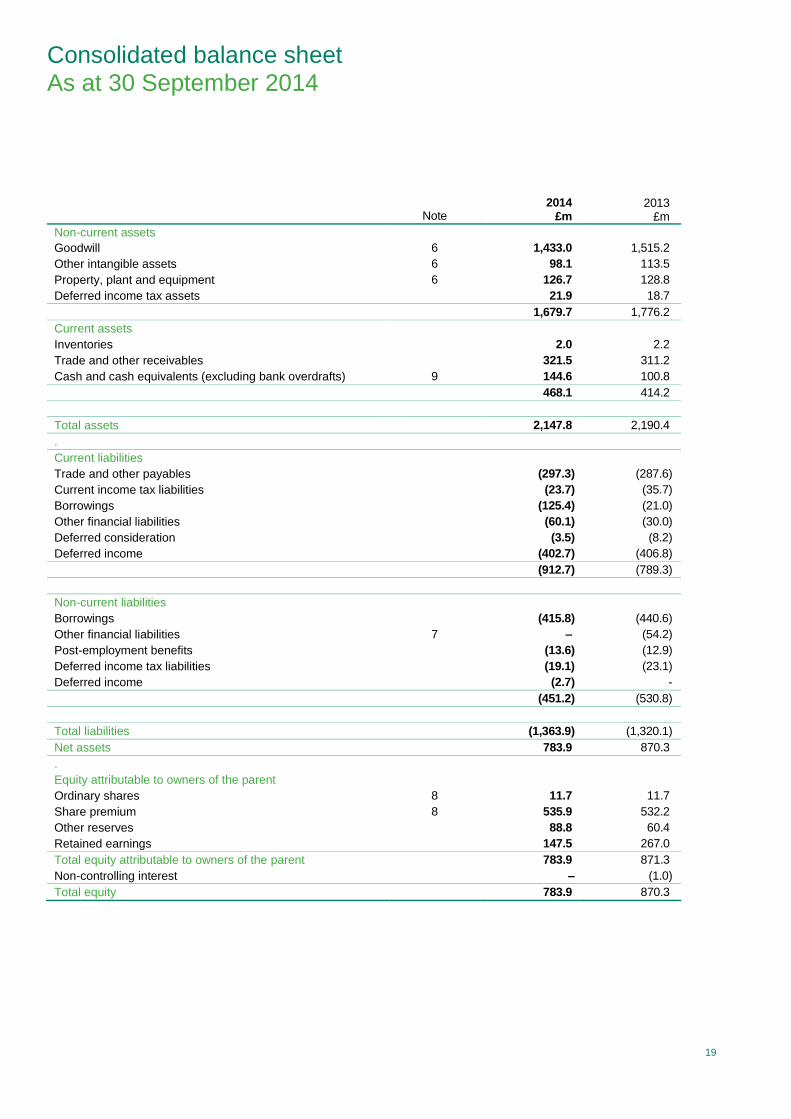
Consolidated balance sheet As at 30 September 2014
Note
2014
£m
2013
£m
Non-current assets .
Goodwill 6 1,433.0 1,515.2
Other intangible assets 6 98.1 113.5
Property, plant and equipment 6 126.7 128.8
Deferred income tax assets 21.9 18.7
. 1,679.7 1,776.2
Current assets
Inventories 2.0 2.2
Trade and other receivables 321.5 311.2
Cash and cash equivalents (excluding bank overdrafts) 9 144.6 100.8
. 468.1 414.2
.
Total assets 2,147.8 2,190.4
.
Current liabilities
Trade and other payables (297.3) (287.6)
Current income tax liabilities (23.7) (35.7)
Borrowings (125.4) (21.0)
Other financial liabilities (60.1) (30.0)
Deferred consideration (3.5) (8.2)
Deferred income (402.7) (406.8)
. (912.7) (789.3)
Non-current liabilities
Borrowings (415.8) (440.6)
Other financial liabilities 7 – (54.2)
Post-employment benefits (13.6) (12.9)
Deferred income tax liabilities (19.1) (23.1)
Deferred income (2.7) -
. (451.2) (530.8)
.
Total liabilities (1,363.9) (1,320.1)
Net assets 783.9 870.3
.
Equity attributable to owners of the parent
Ordinary shares 8 11.7 11.7
Share premium 8 535.9 532.2
Other reserves 88.8 60.4
Retained earnings 147.5 267.0
Total equity attributable to owners of the parent 783.9 871.3
Non-controlling interest – (1.0)
Total equity 783.9 870.3
20
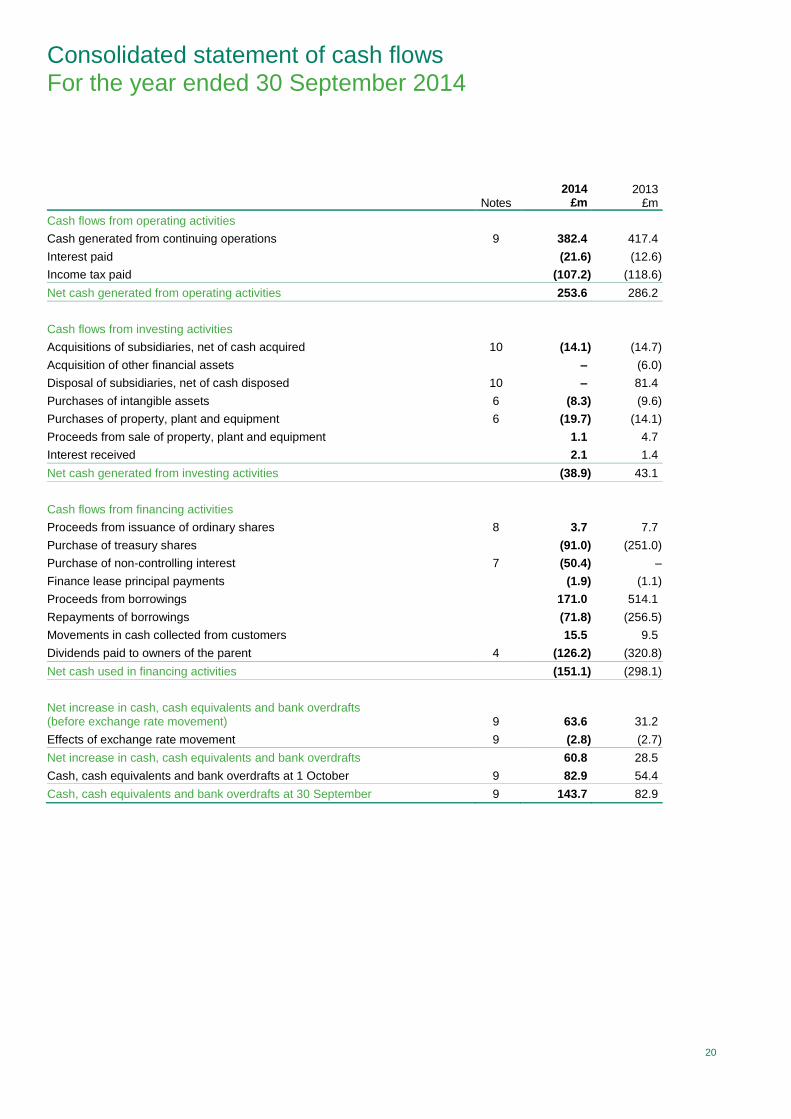
Consolidated statement of cash flows For the year ended 30 September 2014
Notes
2014 £m
2013 £m
Cash flows from operating activities
Cash generated from continuing operations 9 382.4 417.4
Interest paid (21.6) (12.6)
Income tax paid (107.2) (118.6)
Net cash generated from operating activities 253.6 286.2
Cash flows from investing activities
Acquisitions of subsidiaries, net of cash acquired 10 (14.1) (14.7)
Acquisition of other financial assets – (6.0)
Disposal of subsidiaries, net of cash disposed 10 – 81.4
Purchases of intangible assets 6 (8.3) (9.6)
Purchases of property, plant and equipment 6 (19.7) (14.1)
Proceeds from sale of property, plant and equipment 1.1 4.7
Interest received 2.1 1.4
Net cash generated from investing activities (38.9) 43.1
Cash flows from financing activities
Proceeds from issuance of ordinary shares 8 3.7 7.7
Purchase of treasury shares (91.0) (251.0)
Purchase of non-controlling interest 7 (50.4) –
Finance lease principal payments (1.9) (1.1)
Proceeds from borrowings 171.0 514.1
Repayments of borrowings (71.8) (256.5)
Movements in cash collected from customers 15.5 9.5
Dividends paid to owners of the parent 4 (126.2) (320.8)
Net cash used in financing activities (151.1) (298.1)
Net increase in cash, cash equivalents and bank overdrafts (before exchange rate movement) 9 63.6 31.2
Effects of exchange rate movement 9 (2.8) (2.7)
Net increase in cash, cash equivalents and bank overdrafts 60.8 28.5
Cash, cash equivalents and bank overdrafts at 1 October 9 82.9 54.4
Cash, cash equivalents and bank overdrafts at 30 September 9 143.7 82.9
21
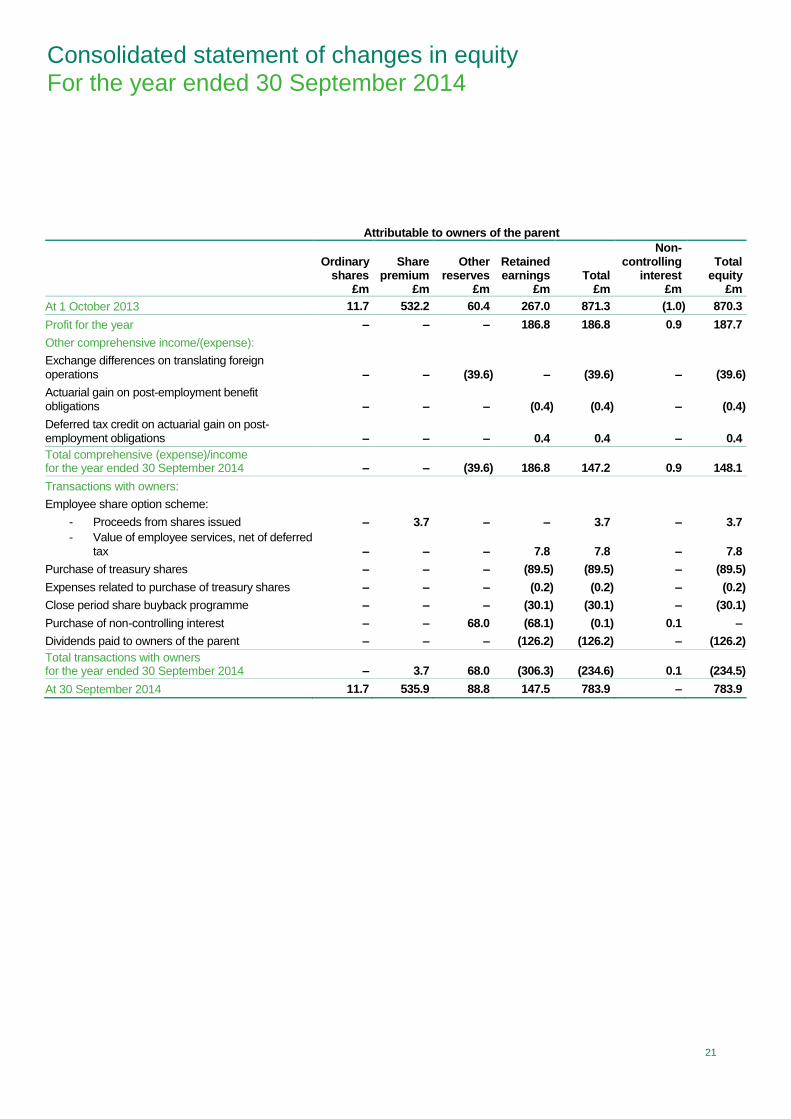
Consolidated statement of changes in equity For the year ended 30 September 2014
Attributable to owners of the parent
Ordinary shares
£m
Share premium
£m
Other reserves
£m
Retained earnings
£m Total
£m
Non-controlling
interest £m
Total equity
£m
At 1 October 2013 11.7 532.2 60.4 267.0 871.3 (1.0) 870.3
Profit for the year – – – 186.8 186.8 0.9 187.7
Other comprehensive income/(expense):
Exchange differences on translating foreign operations – – (39.6) – (39.6) – (39.6)
Actuarial gain on post-employment benefit obligations – – – (0.4) (0.4) – (0.4)
Deferred tax credit on actuarial gain on post-employment obligations – – – 0.4 0.4 – 0.4
Total comprehensive (expense)/income for the year ended 30 September 2014 – – (39.6) 186.8 147.2 0.9 148.1
Transactions with owners:
Employee share option scheme:
- Proceeds from shares issued – 3.7 – – 3.7 – 3.7
- Value of employee services, net of deferred
tax – – – 7.8 7.8 – 7.8
Purchase of treasury shares – – – (89.5) (89.5) – (89.5)
Expenses related to purchase of treasury shares – – – (0.2) (0.2) – (0.2)
Close period share buyback programme – – – (30.1) (30.1) – (30.1)
Purchase of non-controlling interest – – 68.0 (68.1) (0.1) 0.1 –
Dividends paid to owners of the parent – – – (126.2) (126.2) – (126.2)
Total transactions with owners for the year ended 30 September 2014 – 3.7 68.0 (306.3) (234.6) 0.1 (234.5)
At 30 September 2014 11.7 535.9 88.8 147.5 783.9 – 783.9
22
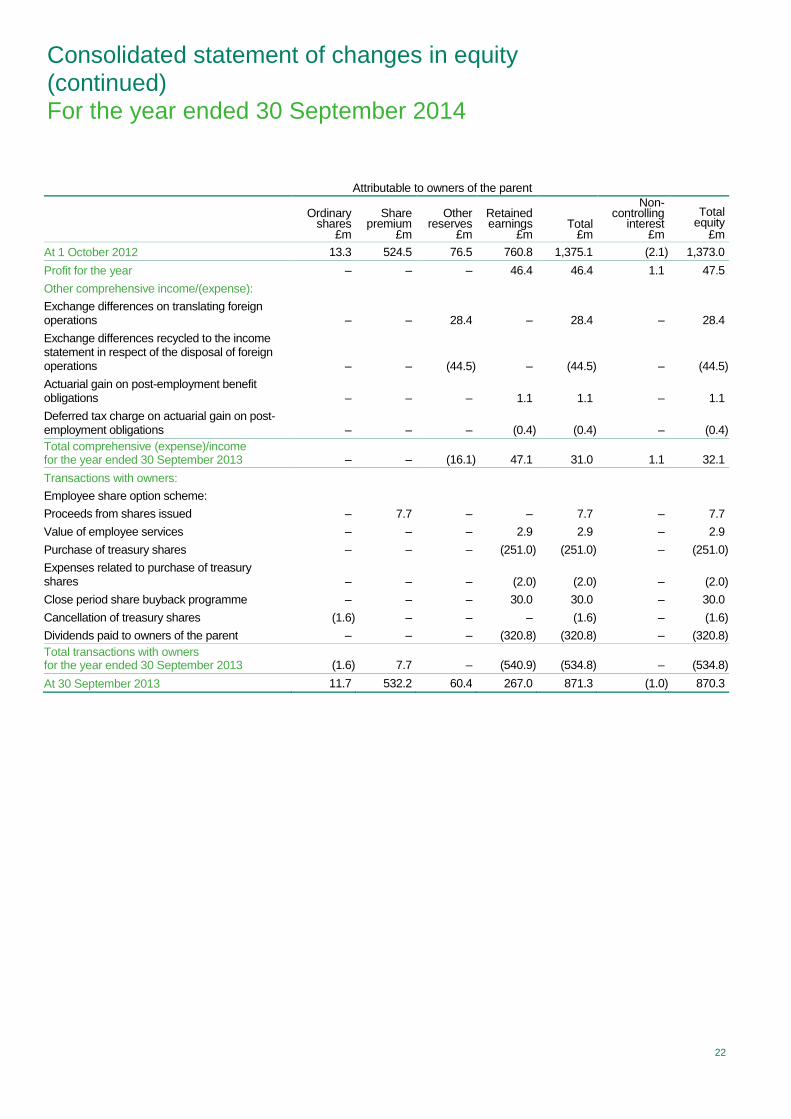
Consolidated statement of changes in equity (continued) For the year ended 30 September 2014
Attributable to owners of the parent
Ordinary shares
£m
Share premium
£m
Other reserves
£m
Retained earnings
£m Total £m
Non-controlling
interest £m
Total equity
£m
At 1 October 2012 13.3 524.5 76.5 760.8 1,375.1 (2.1) 1,373.0
Profit for the year – – – 46.4 46.4 1.1 47.5
Other comprehensive income/(expense):
Exchange differences on translating foreign operations – – 28.4 – 28.4 – 28.4
Exchange differences recycled to the income statement in respect of the disposal of foreign operations – – (44.5) – (44.5) – (44.5)
Actuarial gain on post-employment benefit obligations – – – 1.1 1.1 – 1.1
Deferred tax charge on actuarial gain on post-employment obligations – – – (0.4) (0.4) – (0.4)
Total comprehensive (expense)/income for the year ended 30 September 2013 – – (16.1) 47.1 31.0 1.1 32.1
Transactions with owners:
Employee share option scheme:
Proceeds from shares issued – 7.7 – – 7.7 – 7.7
Value of employee services – – – 2.9 2.9 – 2.9
Purchase of treasury shares – – – (251.0) (251.0) – (251.0)
Expenses related to purchase of treasury shares – – – (2.0) (2.0) – (2.0)
Close period share buyback programme – – – 30.0 30.0 – 30.0
Cancellation of treasury shares (1.6) – – – (1.6) – (1.6)
Dividends paid to owners of the parent – – – (320.8) (320.8) – (320.8)
Total transactions with owners for the year ended 30 September 2013 (1.6) 7.7 – (540.9) (534.8) – (534.8)
At 30 September 2013 11.7 532.2 60.4 267.0 871.3 (1.0) 870.3
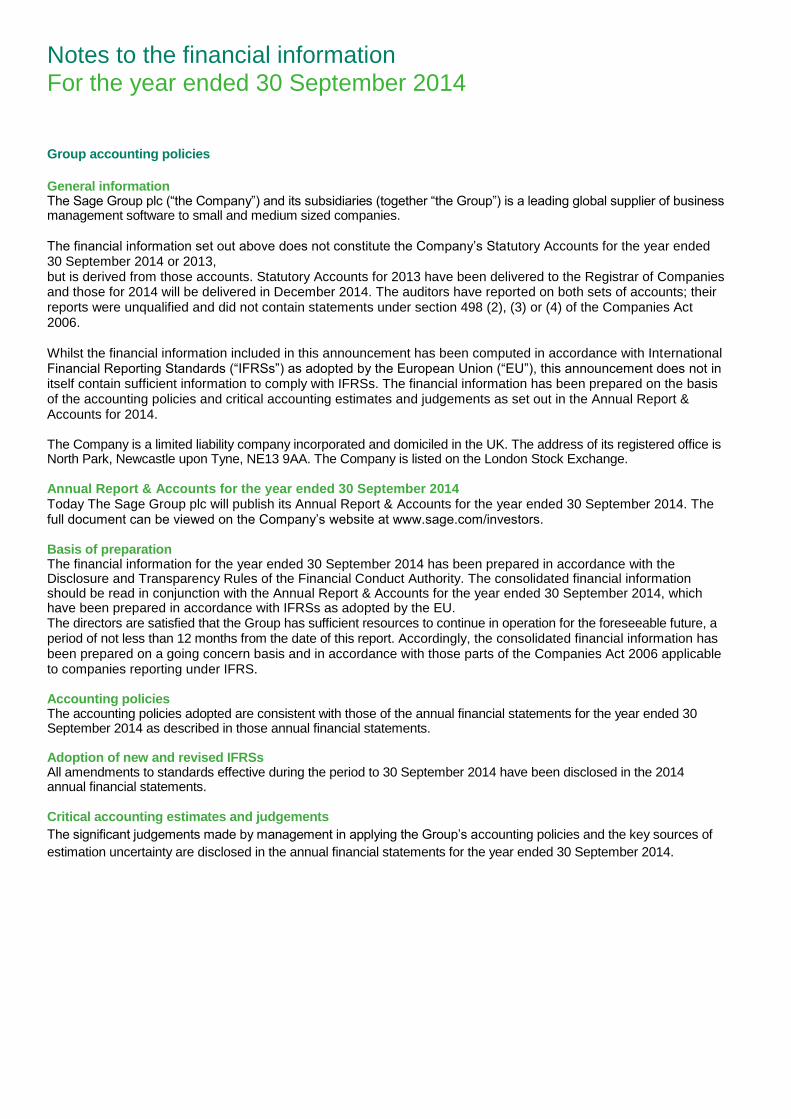
Notes to the financial information For the year ended 30 September 2014
Group accounting policies
General information The Sage Group plc (“the Company”) and its subsidiaries (together “the Group”) is a leading global supplier of business management software to small and medium sized companies. The financial information set out above does not constitute the Company’s Statutory Accounts for the year ended 30 September 2014 or 2013, but is derived from those accounts. Statutory Accounts for 2013 have been delivered to the Registrar of Companies and those for 2014 will be delivered in December 2014. The auditors have reported on both sets of accounts; their reports were unqualified and did not contain statements under section 498 (2), (3) or (4) of the Companies Act 2006. Whilst the financial information included in this announcement has been computed in accordance with International Financial Reporting Standards (“IFRSs”) as adopted by the European Union (“EU”), this announcement does not in itself contain sufficient information to comply with IFRSs. The financial information has been prepared on the basis of the accounting policies and critical accounting estimates and judgements as set out in the Annual Report & Accounts for 2014. The Company is a limited liability company incorporated and domiciled in the UK. The address of its registered office is North Park, Newcastle upon Tyne, NE13 9AA. The Company is listed on the London Stock Exchange. Annual Report & Accounts for the year ended 30 September 2014 Today The Sage Group plc will publish its Annual Report & Accounts for the year ended 30 September 2014. The full document can be viewed on the Company’s website at www.sage.com/investors. Basis of preparation The financial information for the year ended 30 September 2014 has been prepared in accordance with the Disclosure and Transparency Rules of the Financial Conduct Authority. The consolidated financial information should be read in conjunction with the Annual Report & Accounts for the year ended 30 September 2014, which have been prepared in accordance with IFRSs as adopted by the EU. The directors are satisfied that the Group has sufficient resources to continue in operation for the foreseeable future, a period of not less than 12 months from the date of this report. Accordingly, the consolidated financial information has been prepared on a going concern basis and in accordance with those parts of the Companies Act 2006 applicable to companies reporting under IFRS. Accounting policies The accounting policies adopted are consistent with those of the annual financial statements for the year ended 30 September 2014 as described in those annual financial statements. Adoption of new and revised IFRSs All amendments to standards effective during the period to 30 September 2014 have been disclosed in the 2014 annual financial statements. Critical accounting estimates and judgements
The significant judgements made by management in applying the Group’s accounting policies and the key sources of
estimation uncertainty are disclosed in the annual financial statements for the year ended 30 September 2014.
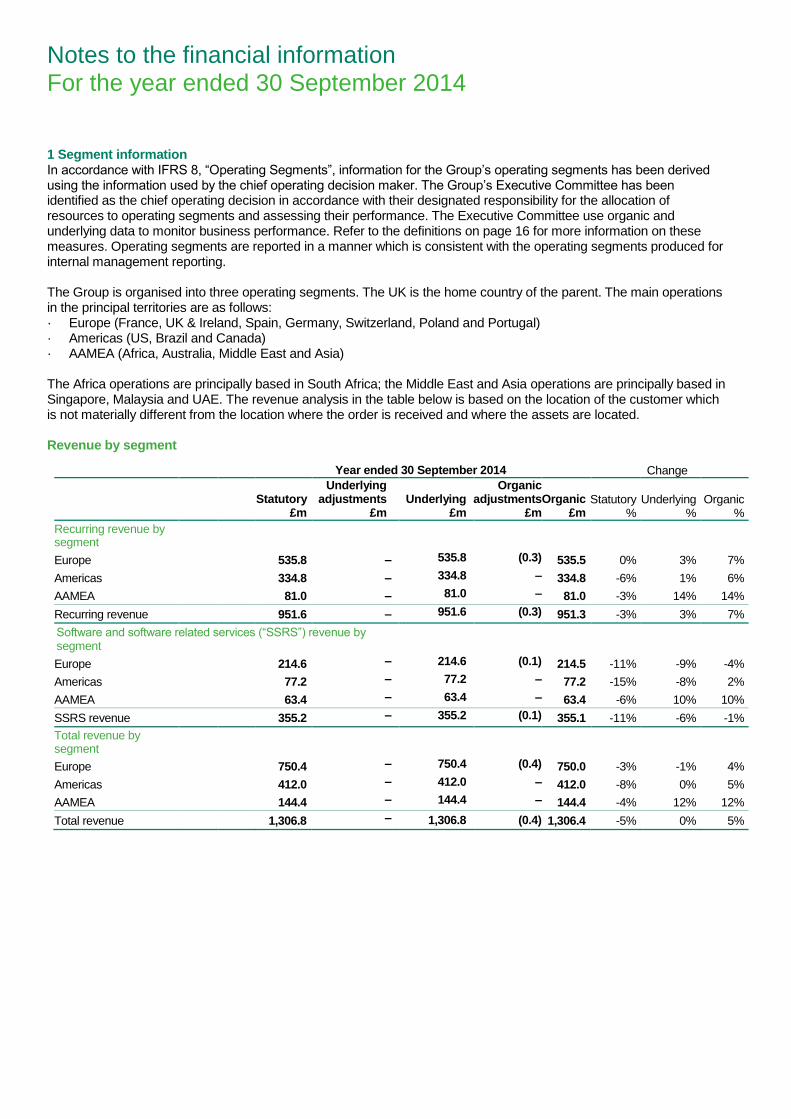
Notes to the financial information For the year ended 30 September 2014
1 Segment information In accordance with IFRS 8, “Operating Segments”, information for the Group’s operating segments has been derived using the information used by the chief operating decision maker. The Group’s Executive Committee has been identified as the chief operating decision in accordance with their designated responsibility for the allocation of resources to operating segments and assessing their performance. The Executive Committee use organic and underlying data to monitor business performance. Refer to the definitions on page 16 for more information on these measures. Operating segments are reported in a manner which is consistent with the operating segments produced for internal management reporting. The Group is organised into three operating segments. The UK is the home country of the parent. The main operations in the principal territories are as follows: · Europe (France, UK & Ireland, Spain, Germany, Switzerland, Poland and Portugal) · Americas (US, Brazil and Canada) · AAMEA (Africa, Australia, Middle East and Asia) The Africa operations are principally based in South Africa; the Middle East and Asia operations are principally based in Singapore, Malaysia and UAE. The revenue analysis in the table below is based on the location of the customer which is not materially different from the location where the order is received and where the assets are located. Revenue by segment
Year ended 30 September 2014 Change
Statutory
£m
Underlying adjustments
£m Underlying
£m
Organic adjustments
£m Organic
£m Statutory
% Underlying
% Organic
%
Recurring revenue by segment
Europe 535.8 – 535.8 (0.3) 535.5 0% 3% 7%
Americas 334.8 – 334.8 – 334.8 -6% 1% 6%
AAMEA 81.0 – 81.0 – 81.0 -3% 14% 14%
Recurring revenue 951.6 – 951.6 (0.3) 951.3 -3% 3% 7%
Software and software related services (“SSRS”) revenue by segment
Europe 214.6 – 214.6 (0.1) 214.5 -11% -9% -4%
Americas 77.2 – 77.2 – 77.2 -15% -8% 2%
AAMEA 63.4 – 63.4 – 63.4 -6% 10% 10%
SSRS revenue 355.2 – 355.2 (0.1) 355.1 -11% -6% -1%
Total revenue by segment
Europe 750.4 – 750.4 (0.4) 750.0 -3% -1% 4%
Americas 412.0 – 412.0 – 412.0 -8% 0% 5%
AAMEA 144.4 – 144.4 – 144.4 -4% 12% 12%
Total revenue 1,306.8 – 1,306.8 (0.4) 1,306.4 -5% 0% 5%
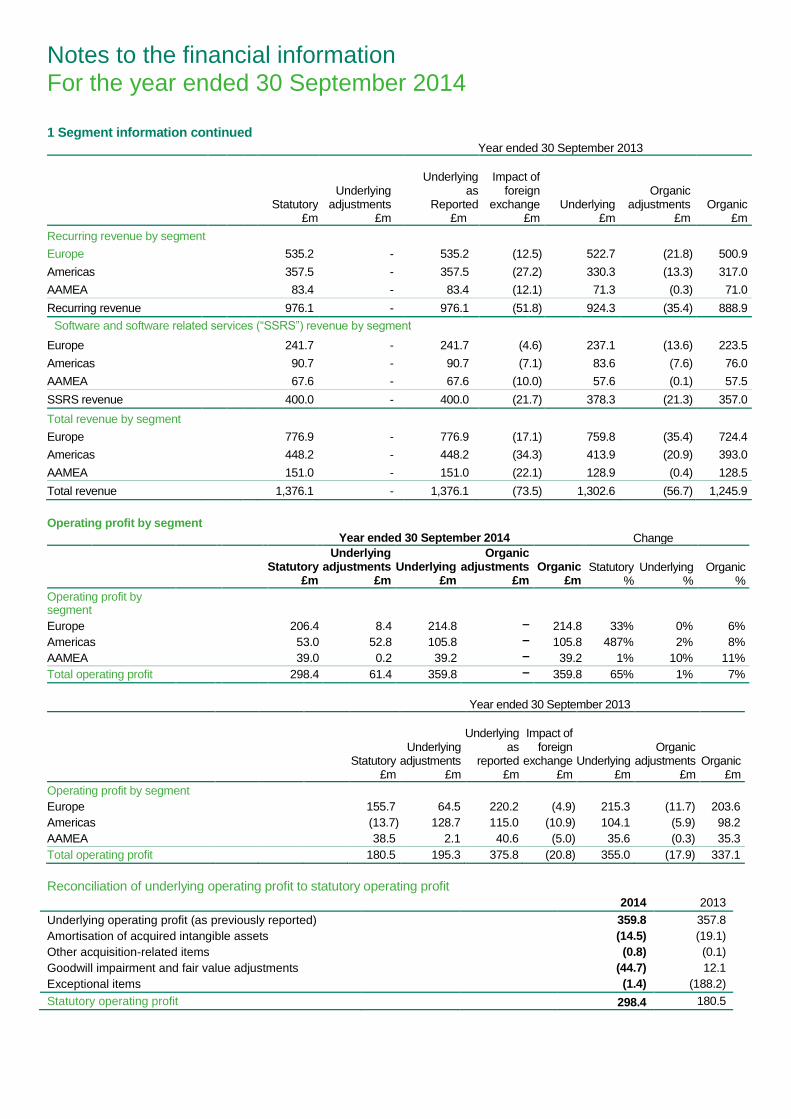
Notes to the financial information For the year ended 30 September 2014
1 Segment information continued Year ended 30 September 2013
Statutory
£m
Underlying adjustments
£m
Underlying as
Reported £m
Impact of
foreign exchange
£m Underlying
£m
Organic adjustments
£m Organic
£m
Recurring revenue by segment
Europe 535.2 - 535.2 (12.5) 522.7 (21.8) 500.9
Americas 357.5 - 357.5 (27.2) 330.3 (13.3) 317.0
AAMEA 83.4 - 83.4 (12.1) 71.3 (0.3) 71.0
Recurring revenue 976.1 - 976.1 (51.8) 924.3 (35.4) 888.9
Software and software related services (“SSRS”) revenue by segment
Europe 241.7 - 241.7 (4.6) 237.1 (13.6) 223.5
Americas 90.7 - 90.7 (7.1) 83.6 (7.6) 76.0
AAMEA 67.6 - 67.6 (10.0) 57.6 (0.1) 57.5
SSRS revenue 400.0 - 400.0 (21.7) 378.3 (21.3) 357.0
Total revenue by segment
Europe 776.9 - 776.9 (17.1) 759.8 (35.4) 724.4
Americas 448.2 - 448.2 (34.3) 413.9 (20.9) 393.0
AAMEA 151.0 - 151.0 (22.1) 128.9 (0.4) 128.5
Total revenue 1,376.1 - 1,376.1 (73.5) 1,302.6 (56.7) 1,245.9
Operating profit by segment
Year ended 30 September 2014 Change
Statutory
£m
Underlying adjustments
£m Underlying
£m
Organic adjustments
£m Organic
£m Statutory
% Underlying
% Organic
%
Operating profit by segment
Europe 206.4 8.4 214.8 – 214.8 33% 0% 6%
Americas 53.0 52.8 105.8 – 105.8 487% 2% 8%
AAMEA 39.0 0.2 39.2 – 39.2 1% 10% 11%
Total operating profit 298.4 61.4 359.8 – 359.8 65% 1% 7%
Year ended 30 September 2013
Statutory £m
Underlying adjustments
£m
Underlying as
reported £m
Impact of
foreign exchange
£m Underlying
£m
Organic adjustments
£m Organic
£m
Operating profit by segment
Europe 155.7 64.5 220.2 (4.9) 215.3 (11.7) 203.6
Americas (13.7) 128.7 115.0 (10.9) 104.1 (5.9) 98.2
AAMEA 38.5 2.1 40.6 (5.0) 35.6 (0.3) 35.3
Total operating profit 180.5 195.3 375.8 (20.8) 355.0 (17.9) 337.1
Reconciliation of underlying operating profit to statutory operating profit
2014 2013
Underlying operating profit (as previously reported) 359.8 357.8
Amortisation of acquired intangible assets (14.5) (19.1)
Other acquisition-related items (0.8) (0.1)
Goodwill impairment and fair value adjustments (44.7) 12.1
Exceptional items (1.4) (188.2)
Statutory operating profit 298.4 180.5
Notes to the financial information For the year ended 30 September 2014
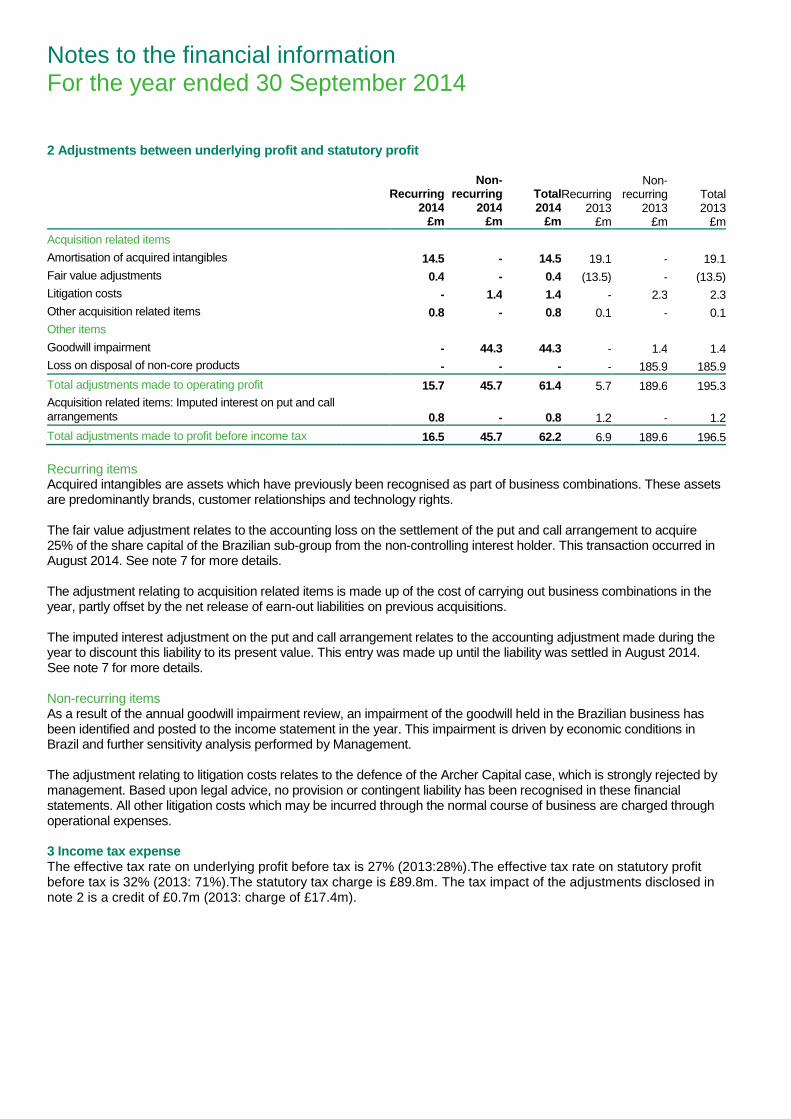
2 Adjustments between underlying profit and statutory profit
Recurring 2014
£m
Non-recurring
2014 £m
Total 2014
£m
Recurring 2013
£m
Non-recurring
2013 £m
Total 2013
£m
Acquisition related items
Amortisation of acquired intangibles 14.5 - 14.5 19.1 - 19.1
Fair value adjustments 0.4 - 0.4 (13.5) - (13.5)
Litigation costs - 1.4 1.4 - 2.3 2.3
Other acquisition related items 0.8 - 0.8 0.1 - 0.1
Other items
Goodwill impairment - 44.3 44.3 - 1.4 1.4
Loss on disposal of non-core products - - - - 185.9 185.9
Total adjustments made to operating profit 15.7 45.7 61.4 5.7 189.6 195.3
Acquisition related items: Imputed interest on put and call
arrangements 0.8 - 0.8 1.2 - 1.2
Total adjustments made to profit before income tax 16.5 45.7 62.2 6.9 189.6 196.5
Recurring items Acquired intangibles are assets which have previously been recognised as part of business combinations. These assets are predominantly brands, customer relationships and technology rights. The fair value adjustment relates to the accounting loss on the settlement of the put and call arrangement to acquire 25% of the share capital of the Brazilian sub-group from the non-controlling interest holder. This transaction occurred in August 2014. See note 7 for more details. The adjustment relating to acquisition related items is made up of the cost of carrying out business combinations in the year, partly offset by the net release of earn-out liabilities on previous acquisitions. The imputed interest adjustment on the put and call arrangement relates to the accounting adjustment made during the year to discount this liability to its present value. This entry was made up until the liability was settled in August 2014. See note 7 for more details. Non-recurring items As a result of the annual goodwill impairment review, an impairment of the goodwill held in the Brazilian business has been identified and posted to the income statement in the year. This impairment is driven by economic conditions in Brazil and further sensitivity analysis performed by Management. The adjustment relating to litigation costs relates to the defence of the Archer Capital case, which is strongly rejected by management. Based upon legal advice, no provision or contingent liability has been recognised in these financial statements. All other litigation costs which may be incurred through the normal course of business are charged through operational expenses. 3 Income tax expense The effective tax rate on underlying profit before tax is 27% (2013:28%).The effective tax rate on statutory profit before tax is 32% (2013: 71%).The statutory tax charge is £89.8m. The tax impact of the adjustments disclosed in note 2 is a credit of £0.7m (2013: charge of £17.4m).
Notes to the financial information For the year ended 30 September 2014
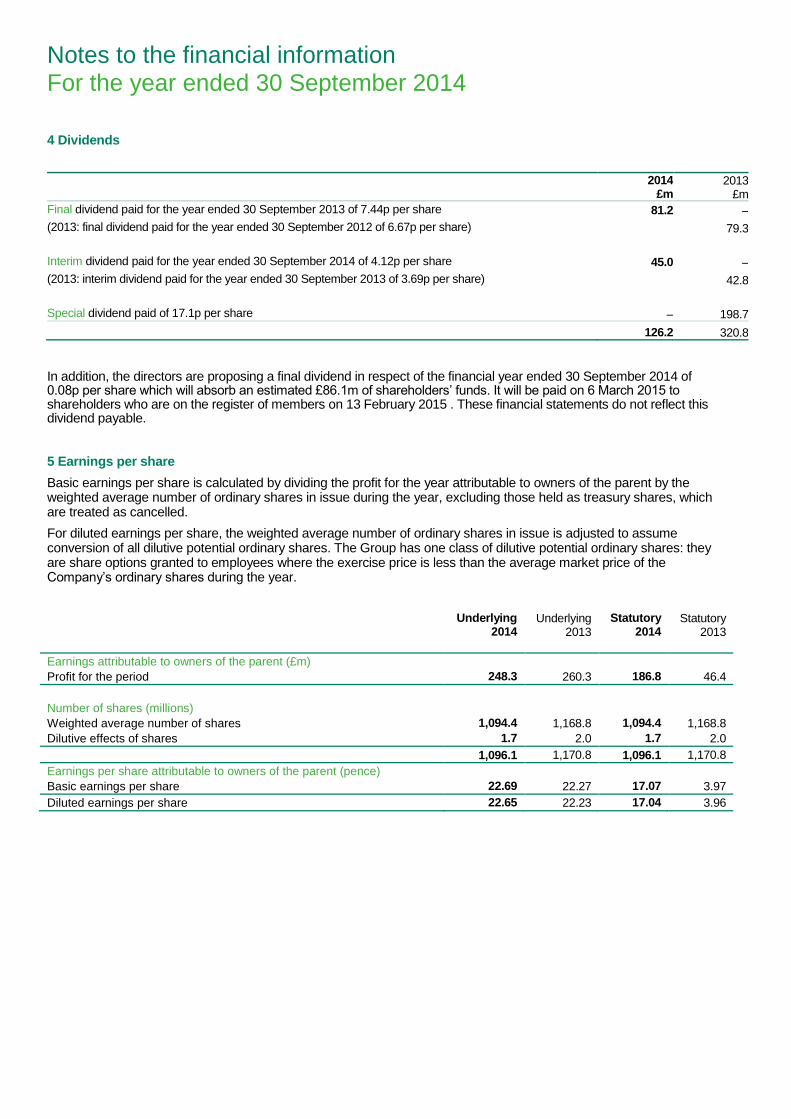
4 Dividends
2014
£m 2013
£m
Final dividend paid for the year ended 30 September 2013 of 7.44p per share 81.2 –
(2013: final dividend paid for the year ended 30 September 2012 of 6.67p per share) 79.3
Interim dividend paid for the year ended 30 September 2014 of 4.12p per share 45.0 –
(2013: interim dividend paid for the year ended 30 September 2013 of 3.69p per share) 42.8
Special dividend paid of 17.1p per share – 198.7
126.2 320.8
In addition, the directors are proposing a final dividend in respect of the financial year ended 30 September 2014 of 0.08p per share which will absorb an estimated £86.1m of shareholders’ funds. It will be paid on 6 March 2015 to shareholders who are on the register of members on 13 February 2015 . These financial statements do not reflect this dividend payable.
5 Earnings per share
Basic earnings per share is calculated by dividing the profit for the year attributable to owners of the parent by the weighted average number of ordinary shares in issue during the year, excluding those held as treasury shares, which are treated as cancelled.
For diluted earnings per share, the weighted average number of ordinary shares in issue is adjusted to assume conversion of all dilutive potential ordinary shares. The Group has one class of dilutive potential ordinary shares: they are share options granted to employees where the exercise price is less than the average market price of the Company’s ordinary shares during the year.
Underlying
2014
Underlying 2013
Statutory
2014
Statutory 2013
Earnings attributable to owners of the parent (£m)
Profit for the period 248.3 260.3 186.8 46.4
Number of shares (millions)
Weighted average number of shares 1,094.4 1,168.8 1,094.4 1,168.8
Dilutive effects of shares 1.7 2.0 1.7 2.0
1,096.1 1,170.8 1,096.1 1,170.8
Earnings per share attributable to owners of the parent (pence)
Basic earnings per share 22.69 22.27 17.07 3.97
Diluted earnings per share 22.65 22.23 17.04 3.96
Notes to the financial information For the year ended 30 September 2014
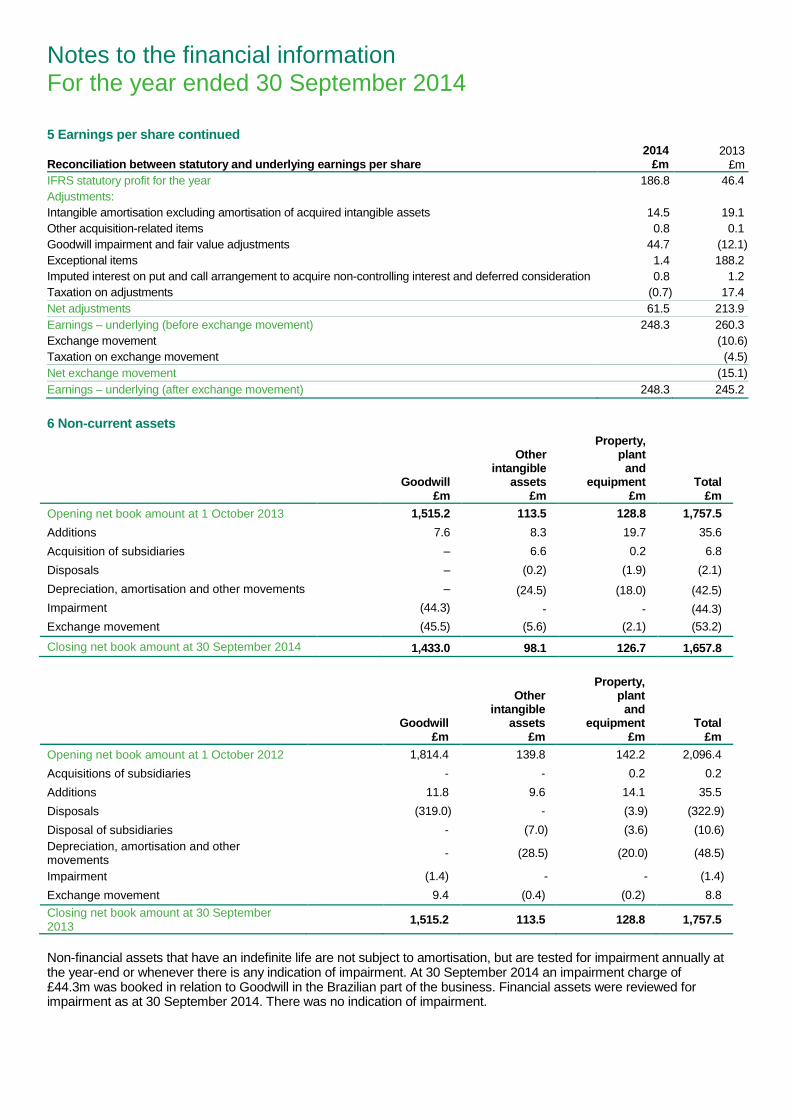
5 Earnings per share continued Reconciliation between statutory and underlying earnings per share
2014 £m
2013 £m
IFRS statutory profit for the year 186.8 46.4
Adjustments:
Intangible amortisation excluding amortisation of acquired intangible assets 14.5 19.1
Other acquisition-related items 0.8 0.1
Goodwill impairment and fair value adjustments 44.7 (12.1)
Exceptional items 1.4 188.2
Imputed interest on put and call arrangement to acquire non-controlling interest and deferred consideration 0.8 1.2
Taxation on adjustments (0.7) 17.4
Net adjustments 61.5 213.9
Earnings – underlying (before exchange movement) 248.3 260.3
Exchange movement (10.6)
Taxation on exchange movement (4.5)
Net exchange movement (15.1)
Earnings – underlying (after exchange movement) 248.3 245.2
6 Non-current assets
Goodwill
£m
Other intangible
assets £m
Property, plant
and equipment
£m Total
£m
Opening net book amount at 1 October 2013 1,515.2 113.5 128.8 1,757.5
Additions 7.6 8.3 19.7 35.6
Acquisition of subsidiaries – 6.6 0.2 6.8
Disposals – (0.2) (1.9) (2.1)
Depreciation, amortisation and other movements – (24.5) (18.0) (42.5)
Impairment (44.3) - - (44.3)
Exchange movement (45.5) (5.6) (2.1) (53.2)
Closing net book amount at 30 September 2014 1,433.0 98.1 126.7 1,657.8
Goodwill £m
Other intangible
assets £m
Property, plant
and equipment
£m Total
£m
Opening net book amount at 1 October 2012 1,814.4 139.8 142.2 2,096.4
Acquisitions of subsidiaries - - 0.2 0.2
Additions 11.8 9.6 14.1 35.5
Disposals (319.0) - (3.9) (322.9)
Disposal of subsidiaries - (7.0) (3.6) (10.6)
Depreciation, amortisation and other movements
- (28.5) (20.0) (48.5)
Impairment (1.4) - - (1.4)
Exchange movement 9.4 (0.4) (0.2) 8.8
Closing net book amount at 30 September 2013
1,515.2 113.5 128.8 1,757.5
Non-financial assets that have an indefinite life are not subject to amortisation, but are tested for impairment annually at the year-end or whenever there is any indication of impairment. At 30 September 2014 an impairment charge of £44.3m was booked in relation to Goodwill in the Brazilian part of the business. Financial assets were reviewed for impairment as at 30 September 2014. There was no indication of impairment.
Notes to the financial information For the year ended 30 September 2014
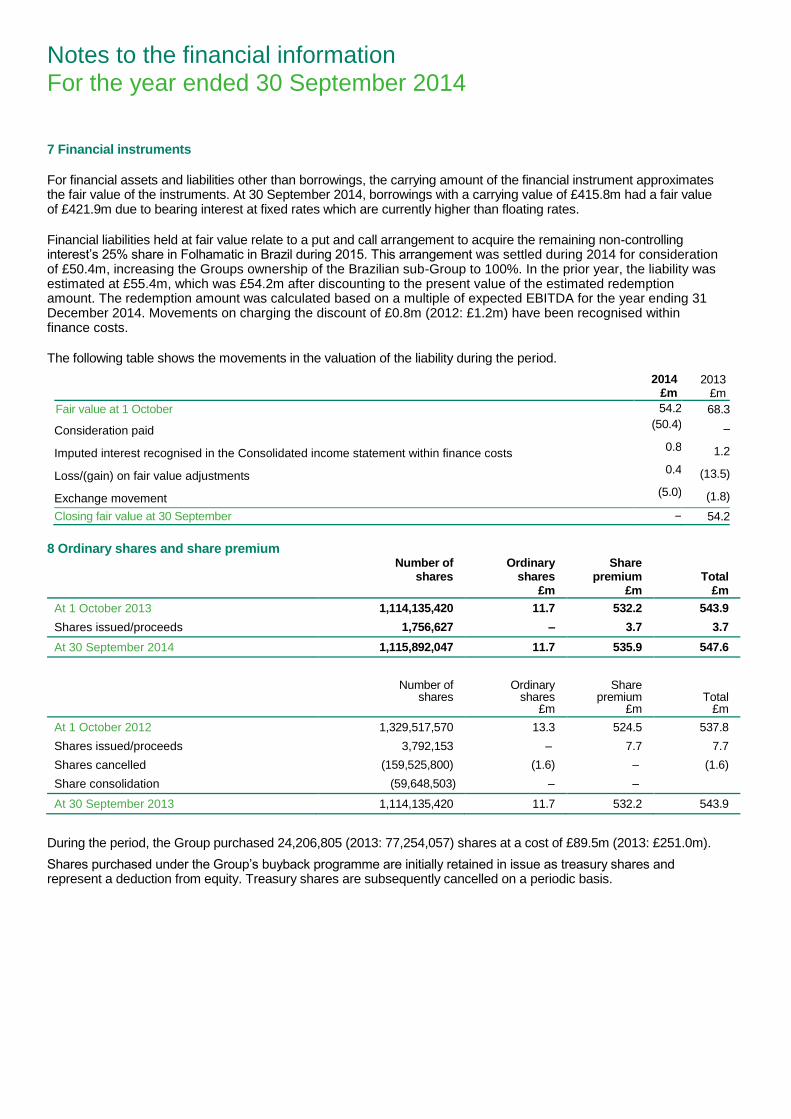
7 Financial instruments
For financial assets and liabilities other than borrowings, the carrying amount of the financial instrument approximates the fair value of the instruments. At 30 September 2014, borrowings with a carrying value of £415.8m had a fair value of £421.9m due to bearing interest at fixed rates which are currently higher than floating rates.
Financial liabilities held at fair value relate to a put and call arrangement to acquire the remaining non-controlling interest’s 25% share in Folhamatic in Brazil during 2015. This arrangement was settled during 2014 for consideration of £50.4m, increasing the Groups ownership of the Brazilian sub-Group to 100%. In the prior year, the liability was estimated at £55.4m, which was £54.2m after discounting to the present value of the estimated redemption amount. The redemption amount was calculated based on a multiple of expected EBITDA for the year ending 31 December 2014. Movements on charging the discount of £0.8m (2012: £1.2m) have been recognised within finance costs.
The following table shows the movements in the valuation of the liability during the period.
2014 £m
2013 £m
OpeniF Fair value at 1 October 54.2 68.3
Consideration paid (50.4) –
Imputed interest recognised in the Consolidated income statement within finance costs 0.8 1.2
Loss/(gain) on fair value adjustments 0.4 (13.5)
Exchange movement (5.0) (1.8)
Closing fair value at 30 September – 54.2
8 Ordinary shares and share premium
.
Number of shares
Ordinary shares £m
Share premium
£m Total
£m
At 1 October 2013 1,114,135,420 11.7 532.2 543.9
Shares issued/proceeds 1,756,627 – 3.7 3.7
At 30 September 2014 1,115,892,047 11.7 535.9 547.6
.
Ordinary
shares £m
Share premium
£m Total
£m
Number of shares
At 1 October 2012 1,329,517,570 13.3 524.5 537.8
Shares issued/proceeds 3,792,153 – 7.7 7.7
Shares cancelled (159,525,800) (1.6) – (1.6)
Share consolidation (59,648,503) – –
At 30 September 2013 1,114,135,420 11.7 532.2 543.9
During the period, the Group purchased 24,206,805 (2013: 77,254,057) shares at a cost of £89.5m (2013: £251.0m).
Shares purchased under the Group’s buyback programme are initially retained in issue as treasury shares and represent a deduction from equity. Treasury shares are subsequently cancelled on a periodic basis.
Notes to the financial information For the year ended 30 September 2014
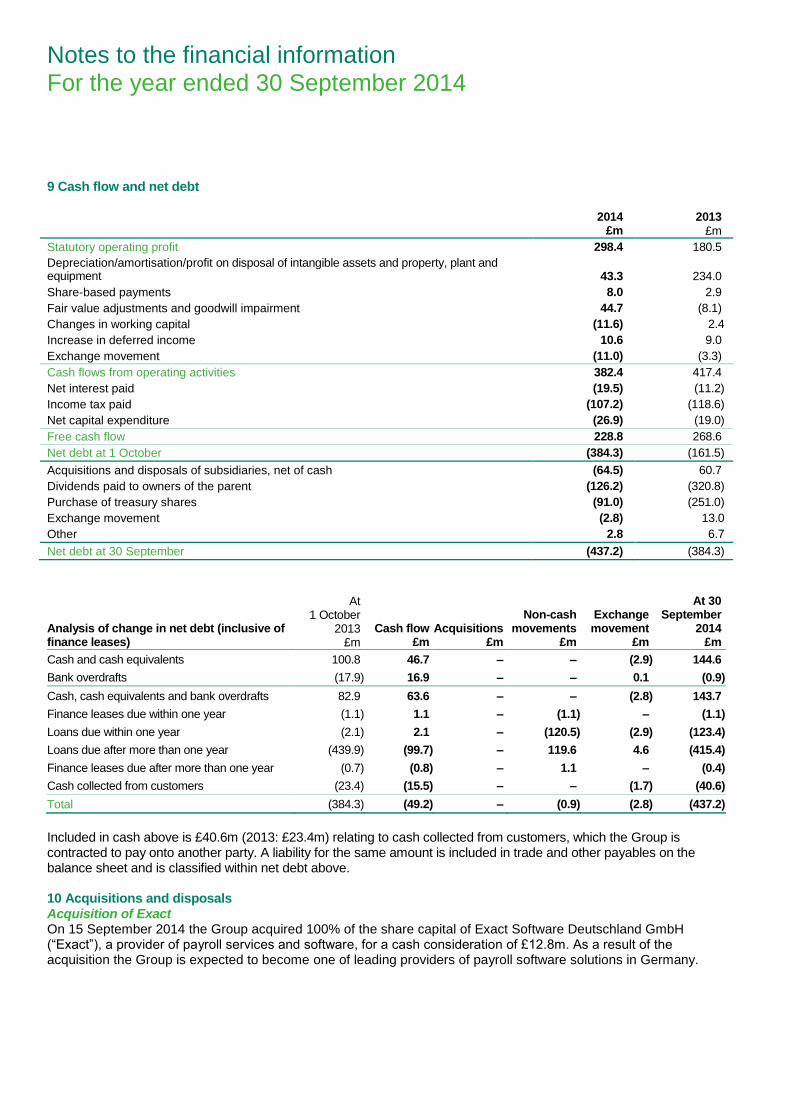
9 Cash flow and net debt
2014
£m
2013
£m
Statutory operating profit 298.4 180.5
Depreciation/amortisation/profit on disposal of intangible assets and property, plant and equipment 43.3 234.0
Share-based payments 8.0 2.9
Fair value adjustments and goodwill impairment 44.7 (8.1)
Changes in working capital (11.6) 2.4
Increase in deferred income 10.6 9.0
Exchange movement (11.0) (3.3)
Cash flows from operating activities 382.4 417.4
Net interest paid (19.5) (11.2)
Income tax paid (107.2) (118.6)
Net capital expenditure (26.9) (19.0)
Free cash flow 228.8 268.6
Net debt at 1 October (384.3) (161.5)
Acquisitions and disposals of subsidiaries, net of cash (64.5) 60.7
Dividends paid to owners of the parent (126.2) (320.8)
Purchase of treasury shares (91.0) (251.0)
Exchange movement (2.8) 13.0
Other 2.8 6.7
Net debt at 30 September (437.2) (384.3)
Analysis of change in net debt (inclusive of finance leases)
At 1 October
2013 £m
Cash flow £m
Acquisitions £m
Non-cash movements
£m
Exchange movement
£m
At 30 September
2014 £m
Cash and cash equivalents 100.8 46.7 – – (2.9) 144.6
Bank overdrafts (17.9) 16.9 – – 0.1 (0.9)
Cash, cash equivalents and bank overdrafts 82.9 63.6 – – (2.8) 143.7
Finance leases due within one year (1.1) 1.1 – (1.1) – (1.1)
Loans due within one year (2.1) 2.1 – (120.5) (2.9) (123.4)
Loans due after more than one year (439.9) (99.7) – 119.6 4.6 (415.4)
Finance leases due after more than one year (0.7) (0.8) – 1.1 – (0.4)
Cash collected from customers (23.4) (15.5) – – (1.7) (40.6)
Total (384.3) (49.2) – (0.9) (2.8) (437.2)
Included in cash above is £40.6m (2013: £23.4m) relating to cash collected from customers, which the Group is contracted to pay onto another party. A liability for the same amount is included in trade and other payables on the balance sheet and is classified within net debt above. 10 Acquisitions and disposals Acquisition of Exact On 15 September 2014 the Group acquired 100% of the share capital of Exact Software Deutschland GmbH (“Exact”), a provider of payroll services and software, for a cash consideration of £12.8m. As a result of the acquisition the Group is expected to become one of leading providers of payroll software solutions in Germany.
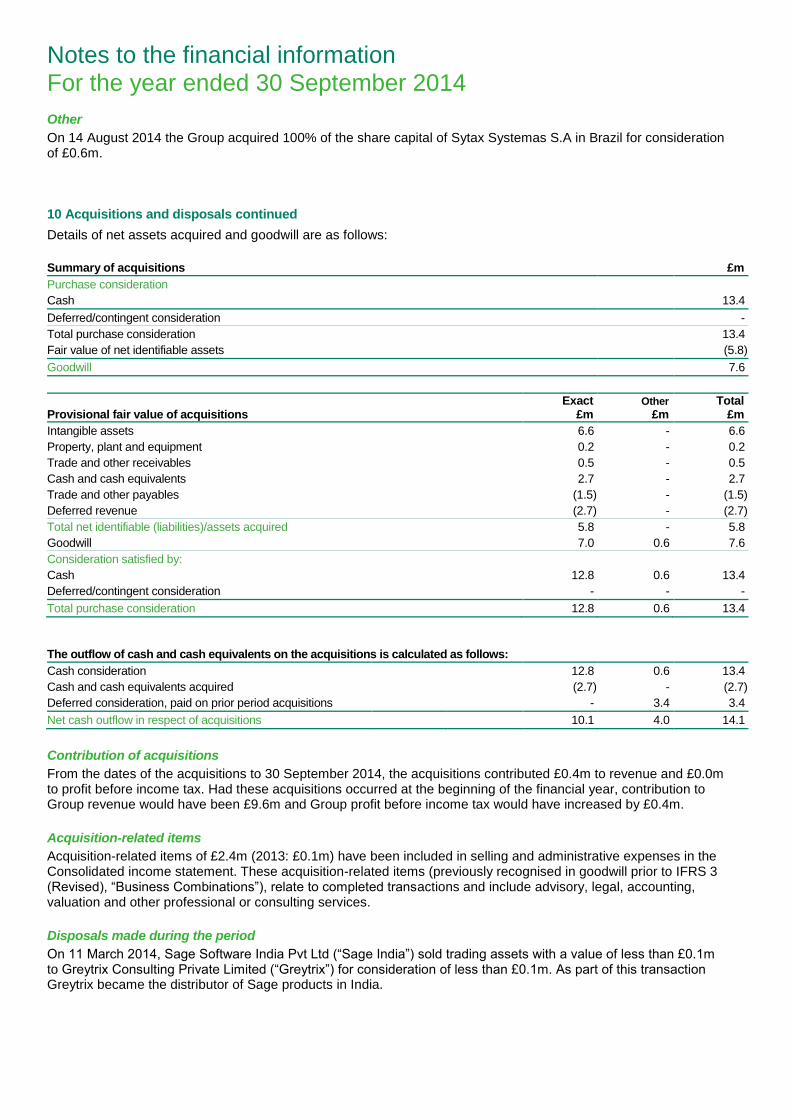
Notes to the financial information For the year ended 30 September 2014
Other
On 14 August 2014 the Group acquired 100% of the share capital of Sytax Systemas S.A in Brazil for consideration of £0.6m.
10 Acquisitions and disposals continued
Details of net assets acquired and goodwill are as follows:
Summary of acquisitions £m
Purchase consideration
Cash 13.4
Deferred/contingent consideration -
Total purchase consideration 13.4
Fair value of net identifiable assets (5.8)
Goodwill 7.6
Provisional fair value of acquisitions Exact
£m Other
£m Total
£m
Intangible assets 6.6 - 6.6
Property, plant and equipment 0.2 - 0.2
Trade and other receivables 0.5 - 0.5
Cash and cash equivalents 2.7 - 2.7
Trade and other payables (1.5) - (1.5)
Deferred revenue (2.7) - (2.7)
Total net identifiable (liabilities)/assets acquired 5.8 - 5.8
Goodwill 7.0 0.6 7.6
Consideration satisfied by:
Cash 12.8 0.6 13.4
Deferred/contingent consideration - - -
Total purchase consideration 12.8 0.6 13.4
The outflow of cash and cash equivalents on the acquisitions is calculated as follows:
Cash consideration 12.8 0.6 13.4
Cash and cash equivalents acquired (2.7) - (2.7)
Deferred consideration, paid on prior period acquisitions - 3.4 3.4
Net cash outflow in respect of acquisitions 10.1 4.0 14.1
Contribution of acquisitions
From the dates of the acquisitions to 30 September 2014, the acquisitions contributed £0.4m to revenue and £0.0m to profit before income tax. Had these acquisitions occurred at the beginning of the financial year, contribution to Group revenue would have been £9.6m and Group profit before income tax would have increased by £0.4m.
Acquisition-related items
Acquisition-related items of £2.4m (2013: £0.1m) have been included in selling and administrative expenses in the Consolidated income statement. These acquisition-related items (previously recognised in goodwill prior to IFRS 3 (Revised), “Business Combinations”), relate to completed transactions and include advisory, legal, accounting, valuation and other professional or consulting services.
Disposals made during the period
On 11 March 2014, Sage Software India Pvt Ltd (“Sage India”) sold trading assets with a value of less than £0.1m to Greytrix Consulting Private Limited (“Greytrix”) for consideration of less than £0.1m. As part of this transaction Greytrix became the distributor of Sage products in India.
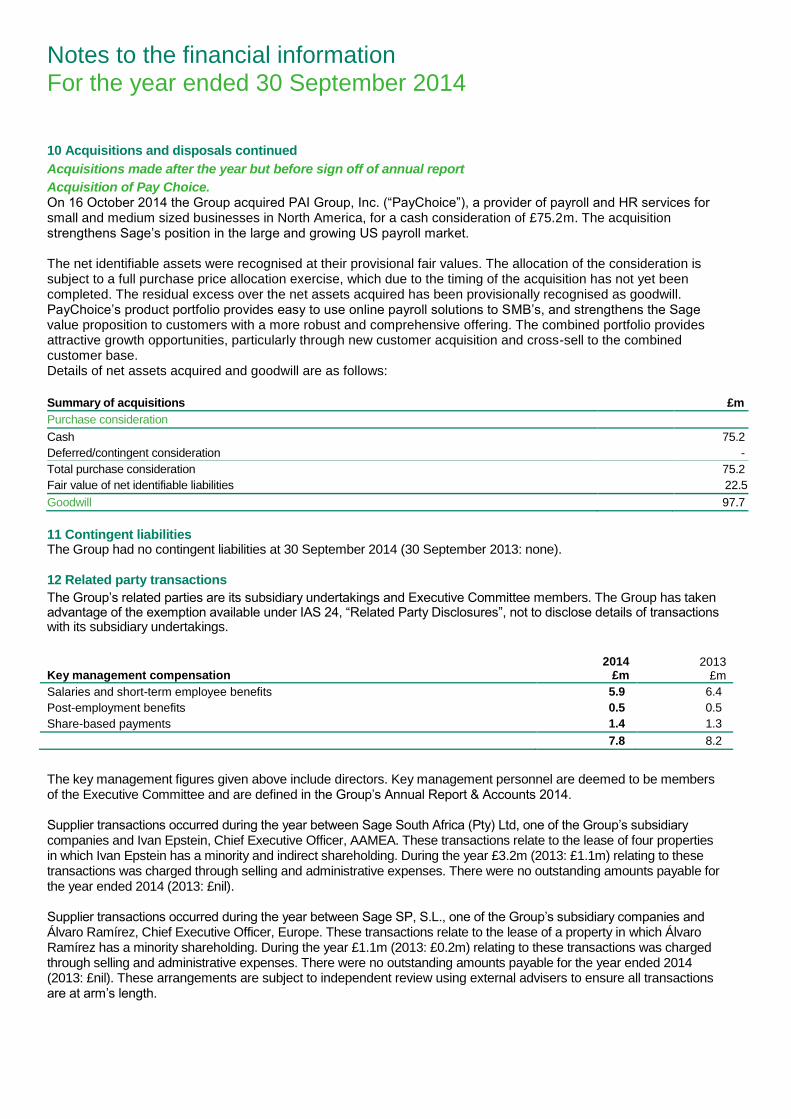
Notes to the financial information For the year ended 30 September 2014
10 Acquisitions and disposals continued
Acquisitions made after the year but before sign off of annual report
Acquisition of Pay Choice. On 16 October 2014 the Group acquired PAI Group, Inc. (“PayChoice”), a provider of payroll and HR services for small and medium sized businesses in North America, for a cash consideration of £75.2m. The acquisition strengthens Sage’s position in the large and growing US payroll market. The net identifiable assets were recognised at their provisional fair values. The allocation of the consideration is subject to a full purchase price allocation exercise, which due to the timing of the acquisition has not yet been completed. The residual excess over the net assets acquired has been provisionally recognised as goodwill. PayChoice’s product portfolio provides easy to use online payroll solutions to SMB’s, and strengthens the Sage value proposition to customers with a more robust and comprehensive offering. The combined portfolio provides attractive growth opportunities, particularly through new customer acquisition and cross-sell to the combined customer base. Details of net assets acquired and goodwill are as follows:
Summary of acquisitions £m
Purchase consideration
Cash 75.2
Deferred/contingent consideration -
Total purchase consideration 75.2
Fair value of net identifiable liabilities 22.5
Goodwill 97.7
11 Contingent liabilities The Group had no contingent liabilities at 30 September 2014 (30 September 2013: none).
12 Related party transactions
The Group’s related parties are its subsidiary undertakings and Executive Committee members. The Group has taken advantage of the exemption available under IAS 24, “Related Party Disclosures”, not to disclose details of transactions with its subsidiary undertakings.
Key management compensation
2014
£m
2013
£m
Salaries and short-term employee benefits 5.9 6.4
Post-employment benefits 0.5 0.5
Share-based payments 1.4 1.3
7.8 8.2
The key management figures given above include directors. Key management personnel are deemed to be members of the Executive Committee and are defined in the Group’s Annual Report & Accounts 2014. Supplier transactions occurred during the year between Sage South Africa (Pty) Ltd, one of the Group’s subsidiary companies and Ivan Epstein, Chief Executive Officer, AAMEA. These transactions relate to the lease of four properties in which Ivan Epstein has a minority and indirect shareholding. During the year £3.2m (2013: £1.1m) relating to these transactions was charged through selling and administrative expenses. There were no outstanding amounts payable for the year ended 2014 (2013: £nil). Supplier transactions occurred during the year between Sage SP, S.L., one of the Group’s subsidiary companies and Álvaro Ramírez, Chief Executive Officer, Europe. These transactions relate to the lease of a property in which Álvaro Ramírez has a minority shareholding. During the year £1.1m (2013: £0.2m) relating to these transactions was charged through selling and administrative expenses. There were no outstanding amounts payable for the year ended 2014 (2013: £nil). These arrangements are subject to independent review using external advisers to ensure all transactions are at arm’s length.
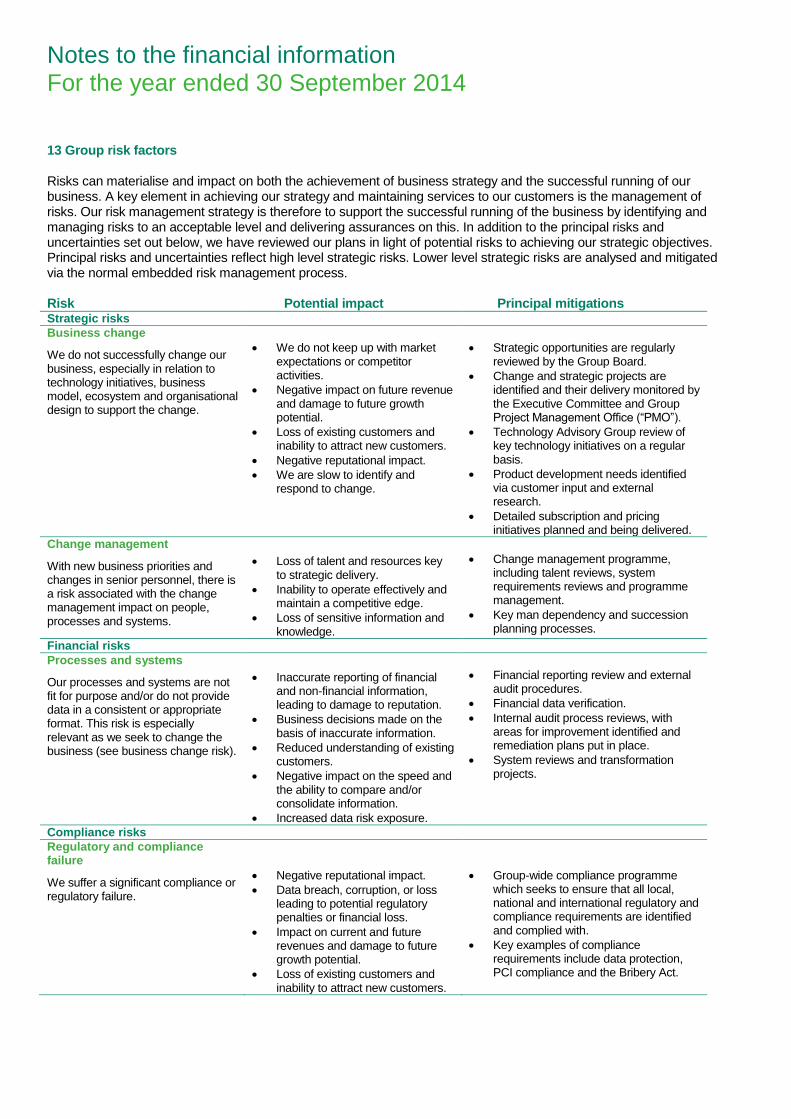
Notes to the financial information For the year ended 30 September 2014
13 Group risk factors
Risks can materialise and impact on both the achievement of business strategy and the successful running of our business. A key element in achieving our strategy and maintaining services to our customers is the management of risks. Our risk management strategy is therefore to support the successful running of the business by identifying and managing risks to an acceptable level and delivering assurances on this. In addition to the principal risks and uncertainties set out below, we have reviewed our plans in light of potential risks to achieving our strategic objectives. Principal risks and uncertainties reflect high level strategic risks. Lower level strategic risks are analysed and mitigated via the normal embedded risk management process. Risk Potential impact Principal mitigations Strategic risks
Business change
We do not successfully change our business, especially in relation to technology initiatives, business model, ecosystem and organisational design to support the change.
We do not keep up with market expectations or competitor activities.
Negative impact on future revenue and damage to future growth potential.
Loss of existing customers and inability to attract new customers.
Negative reputational impact.
We are slow to identify and respond to change.
Strategic opportunities are regularly reviewed by the Group Board.
Change and strategic projects are identified and their delivery monitored by the Executive Committee and Group Project Management Office (“PMO”).
Technology Advisory Group review of key technology initiatives on a regular basis.
Product development needs identified via customer input and external research.
Detailed subscription and pricing initiatives planned and being delivered.
Change management
With new business priorities and changes in senior personnel, there is a risk associated with the change management impact on people, processes and systems.
Loss of talent and resources key to strategic delivery.
Inability to operate effectively and maintain a competitive edge.
Loss of sensitive information and knowledge.
Change management programme, including talent reviews, system requirements reviews and programme management.
Key man dependency and succession planning processes.
Financial risks
Processes and systems
Our processes and systems are not fit for purpose and/or do not provide data in a consistent or appropriate format. This risk is especially relevant as we seek to change the business (see business change risk).
Inaccurate reporting of financial and non-financial information, leading to damage to reputation.
Business decisions made on the basis of inaccurate information.
Reduced understanding of existing customers.
Negative impact on the speed and the ability to compare and/or consolidate information.
Increased data risk exposure.
Financial reporting review and external audit procedures.
Financial data verification.
Internal audit process reviews, with areas for improvement identified and remediation plans put in place.
System reviews and transformation projects.
Compliance risks
Regulatory and compliance failure
We suffer a significant compliance or regulatory failure.
Negative reputational impact.
Data breach, corruption, or loss leading to potential regulatory penalties or financial loss.
Impact on current and future revenues and damage to future growth potential.
Loss of existing customers and inability to attract new customers.
Group-wide compliance programme which seeks to ensure that all local, national and international regulatory and compliance requirements are identified and complied with.
Key examples of compliance requirements include data protection, PCI compliance and the Bribery Act.
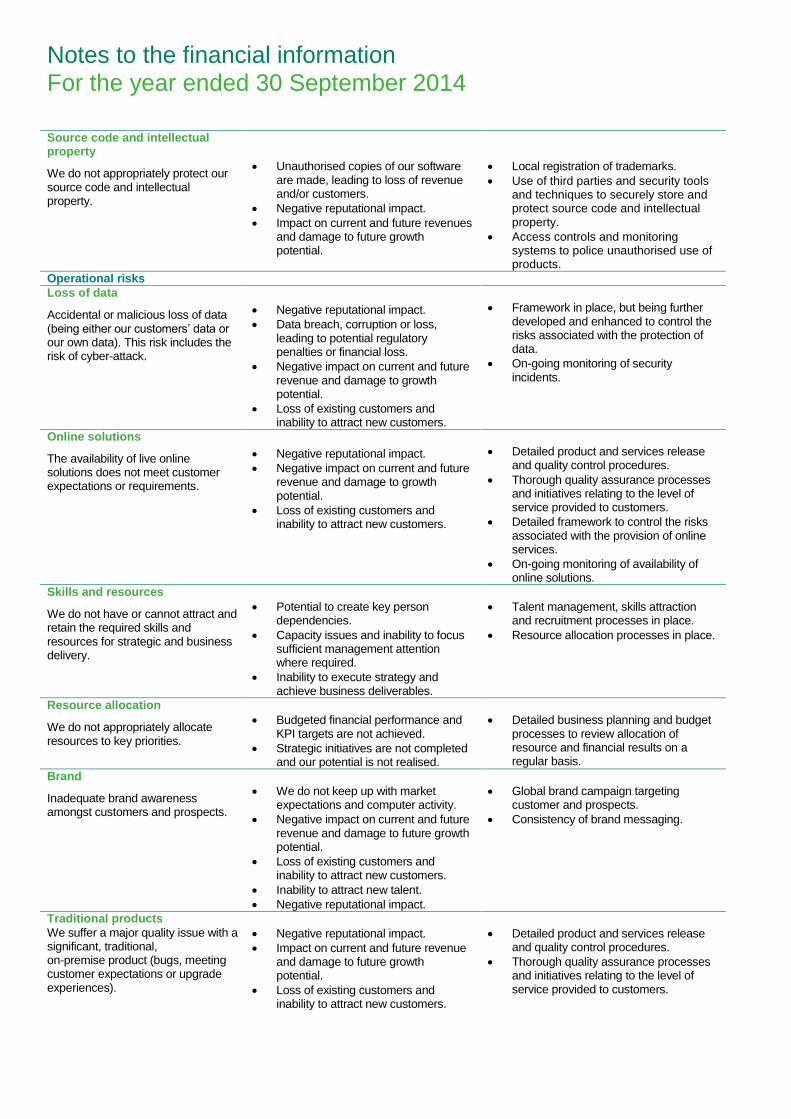
Notes to the financial information For the year ended 30 September 2014
Source code and intellectual property
We do not appropriately protect our source code and intellectual property.
Unauthorised copies of our software are made, leading to loss of revenue and/or customers.
Negative reputational impact.
Impact on current and future revenues and damage to future growth potential.
Local registration of trademarks.
Use of third parties and security tools and techniques to securely store and protect source code and intellectual property.
Access controls and monitoring systems to police unauthorised use of products.
Operational risks
Loss of data
Accidental or malicious loss of data (being either our customers’ data or our own data). This risk includes the risk of cyber-attack.
Negative reputational impact.
Data breach, corruption or loss, leading to potential regulatory penalties or financial loss.
Negative impact on current and future revenue and damage to growth potential.
Loss of existing customers and inability to attract new customers.
Framework in place, but being further developed and enhanced to control the risks associated with the protection of data.
On-going monitoring of security incidents.
Online solutions
The availability of live online solutions does not meet customer expectations or requirements.
Negative reputational impact.
Negative impact on current and future revenue and damage to growth potential.
Loss of existing customers and inability to attract new customers.
Detailed product and services release and quality control procedures.
Thorough quality assurance processes and initiatives relating to the level of service provided to customers.
Detailed framework to control the risks associated with the provision of online services.
On-going monitoring of availability of online solutions.
Skills and resources
We do not have or cannot attract and retain the required skills and resources for strategic and business delivery.
Potential to create key person dependencies.
Capacity issues and inability to focus sufficient management attention where required.
Inability to execute strategy and achieve business deliverables.
Talent management, skills attraction and recruitment processes in place.
Resource allocation processes in place.
Resource allocation
We do not appropriately allocate resources to key priorities.
Budgeted financial performance and KPI targets are not achieved.
Strategic initiatives are not completed and our potential is not realised.
Detailed business planning and budget processes to review allocation of resource and financial results on a regular basis.
Brand
Inadequate brand awareness amongst customers and prospects.
We do not keep up with market expectations and computer activity.
Negative impact on current and future revenue and damage to future growth potential.
Loss of existing customers and inability to attract new customers.
Inability to attract new talent.
Negative reputational impact.
Global brand campaign targeting customer and prospects.
Consistency of brand messaging.
Traditional products
We suffer a major quality issue with a significant, traditional, on-premise product (bugs, meeting customer expectations or upgrade experiences).
Negative reputational impact.
Impact on current and future revenue and damage to future growth potential.
Loss of existing customers and inability to attract new customers.
Detailed product and services release and quality control procedures.
Thorough quality assurance processes and initiatives relating to the level of service provided to customers.
Notes to the financial information For the year ended 30 September 2014
Statement of Directors’ Responsibilities Responsibility statement of the directors on the Annual Report & Accounts The Groups Annual Report & Accounts for the year ended 30 September 2014 includes the following responsibility statement. Each of the directors confirms that, to the best of their knowledge:
the Group financial statements, which have been prepared in accordance with IFRSs as adopted by the EU, give a true and fair view of the assets, liabilities, financial position and profit of the Group; and
the Directors’ report includes a fair review of the development and performance of the business and the position of the Group, together with a description of the principal risks and uncertainties that it faces.
On behalf of the Board S Hare Chief Financial Officer 3 December 2014