Embed Size (px)
Citation preview
This article was downloaded by: [University of Cambridge]On: 08 October 2014, At: 13:18Publisher: RoutledgeInforma Ltd Registered in England and Wales Registered Number: 1072954 Registered office: Mortimer House,37-41 Mortimer Street, London W1T 3JH, UK
Applied Financial EconomicsPublication details, including instructions for authors and subscription information:http://www.tandfonline.com/loi/rafe20
Momentum investing across economic states: evidenceof market inefficiency in good timesY. Hammami aa Department of Finance , University of Tunis , ISG Tunis , TunisiaPublished online: 30 Jul 2012.
To cite this article: Y. Hammami (2013) Momentum investing across economic states: evidence of market inefficiency in goodtimes, Applied Financial Economics, 23:1, 51-56, DOI: 10.1080/09603107.2012.705426
To link to this article: http://dx.doi.org/10.1080/09603107.2012.705426
PLEASE SCROLL DOWN FOR ARTICLE
Taylor & Francis makes every effort to ensure the accuracy of all the information (the “Content”) containedin the publications on our platform. However, Taylor & Francis, our agents, and our licensors make norepresentations or warranties whatsoever as to the accuracy, completeness, or suitability for any purpose of theContent. Any opinions and views expressed in this publication are the opinions and views of the authors, andare not the views of or endorsed by Taylor & Francis. The accuracy of the Content should not be relied upon andshould be independently verified with primary sources of information. Taylor and Francis shall not be liable forany losses, actions, claims, proceedings, demands, costs, expenses, damages, and other liabilities whatsoeveror howsoever caused arising directly or indirectly in connection with, in relation to or arising out of the use ofthe Content.
This article may be used for research, teaching, and private study purposes. Any substantial or systematicreproduction, redistribution, reselling, loan, sub-licensing, systematic supply, or distribution in anyform to anyone is expressly forbidden. Terms & Conditions of access and use can be found at http://www.tandfonline.com/page/terms-and-conditions
Applied Financial Economics, 2013, 23, 51–56
Momentum investing across
economic states: evidence of
market inefficiency in good times
Y. Hammami
Department of Finance, University of Tunis, ISG Tunis, Tunisia
E-mail: [email protected]
Hammami (2011) contends that excessive optimism and overconfidence
arise naturally in good times when the economy is strong. This implies that
market inefficiency might occur principally in good times. To examine this
hypothesis, we investigate the momentum strategy (buying recent winners
and selling recent losers) across economic states. We find that the
profitability of the momentum strategy in the US stock market appears
only in periods in which the expected market risk premium is low (good
times). Traditional explanations based on seasonal effects or systematic
risk do not account for the abnormal returns generated by momentum
investing in good times. Alternatively, we discover that the profitability of
the momentum strategy disappears in the post-1993 sample (following the
discovery of momentum), which is consistent with the view that if
momentum is an anomaly, then it will not appear in future data. These
findings are viewed as evidence that the momentum anomaly is a market
inefficiency, which has appeared especially in good times.
Keywords: momentum anomaly; market efficiency; market inefficiency;
asset pricing
JEL Classification: G10; G12; G14
I. Introduction
It is well documented in the financial literature that
buying stocks with high recent performance and
selling stocks with low recent performance yield
significant positive returns over 1-year holding
period (e.g. Jegadeesh and Titman, 1993, 2002).
From an investment perspective, the momentum
strategy generates substantial positive returns com-
pared with other strategies such as value investing.
Also, momentum profits are remarkably stable across
international financial markets (Rouwenhorst, 1998).
In addition, the momentum effect is not fully
captured by firm characteristics such as size,
book-to-market, liquidity and volatility (Grundy
and Martin, 2001; Grinblatt and Moskowitz, 2004).Explaining the source of the rewards to momentum
investing has been hotly debated in the financial
literature. On the one hand, a body of work suggests
that the profitability of momentum is generated by
irrational investor behaviour (Barberis et al., 1998;
Daniel et al., 1998; Hong et al., 2000; Zhang, 2006).
On the other hand, a strand of literature argues that
the return difference between winners and losers is
warranted by the difference in their systematic risk
(Sadka, 2006; Liu and Zhang, 2008, 2011).A recent literature has hinted at the possibility that
market efficiency might vary over time (see Lim and
Applied Financial Economics ISSN 0960–3107 print/ISSN 1466–4305 online � 2013 Taylor & Francis 51http://www.tandfonline.com
http://dx.doi.org/10.1080/09603107.2012.705426
Dow
nloa
ded
by [
Uni
vers
ity o
f C
ambr
idge
] at
13:
18 0
8 O
ctob
er 2
014
Brooks (2011) for a survey of the literature on time-varying efficiency). Specifically, Lo (2004) and Selfand Mathur (2006) emphasize that since investorrationality as well as institutions evolve over time,financial markets might experience long periods ofmarket inefficiency followed by long periods ofmarket efficiency (and vice versa). This issue leadsto a fundamental question: what are the events andfactors that generate time-varying market efficiency?
Hammami (2011) asserts that asymmetric investorbehaviour across economic states could be an impor-tant factor that generates time-varying efficiency. Therationale is that high risk aversion in bad times mayprompt investors to be more cautious and morerational, whereas in good times they might be toooptimistic and too overconfident. This asymmetricinvestor behaviour might lead to market efficiency inbad times and market inefficiency in good times.Using the expected market risk premium as a metricof economic states as in Petkova and Zhang (2005),Hammami (2011) finds that value, size and cyclicalstrategies seem to be explained by risk in bad timesand by investor sentiment in good times.
The main purpose of this article is to test thehypothesis of asymmetric market efficiency acrosseconomic states by exploring the momentum strategyacross bad times and good times. We document thatthe profitability of momentum investing is confinedto periods of low risk premium (good times), whereasit is almost nonexistent in periods of high riskpremium (bad times). This result holds whether weexamine the post- or the pre-1963 sample. Moreover,there are no seasonal effects in the performance of themomentum strategy in good times.
Furthermore, we demonstrate that the abnormalreturns on momentum portfolios cannot be explainedby risk in strong economic states, even if we imple-ment the Carhart (1997) model to adjust for system-atic risk. Besides, we re-examine the results ofJegadeesh and Titman (2001), who find that momen-tum continues to be strong following its discovery.Surprisingly, we discover that momentum profitshave disappeared over the period 1994–2009. Thevanishing of momentum profitability has occurredespecially after the Jegadeesh and Titman’s (2001)work. This finding substantiates the behaviouralexplanations of momentum investing based onbounded rationality of investors such as overconfi-dence or slow diffusion of private informationthrough the economy.
This article is organized as follows. Section IIexamines momentum investing across bad times andgood times. Section III provides evidence that
seasonal effects cannot explain completely the prof-itability of the momentum strategy in good times.Section IV explores whether risk can capturethe momentum effect in good times. Section Vre-examines the momentum effect after its discovery.Section VI concludes the article.
II. Momentum Profits AcrossEconomic States
The monthly data on the momentum strategy overthe period 1927–2009 are from Kenneth French’sWeb site.1 In order to isolate the effect of momentumfrom size, the momentum mimicking portfolio isconstructed from the intersection of two portfoliosformed on market equity and three portfolios formedon 1-year prior return. The six portfolios includeNew York Stock Exchange (NYSE), American StockExchange (AMEX) and National Association ofSecurities Dealers Automated Quotation(NASDAQ) stocks with prior return data. The1-year prior return at month t is the continuouslycompounded returns between t� 11 and t� 1. Themonthly returns to the momentum strategy are equalto the average return on winners (the two high priorreturn portfolios) minus the average return on losers(the two low prior return portfolios). Portfolios arerebalanced each month (for more details see KennethFrench’s Web site).
To split the sample period into bad times and goodtimes, we compute the expected market risk premiumusing the following regression:
rm,tþ1 ¼ �0 þ �1divt þ �2termt þ �3deft þ �4tbt þ "m,tþ1
ð1Þ
where rm,tþ1 is the market excess return, div the laggeddividend yield on the market, term the lagged termspread, def the lagged default spread and tb thelagged treasury bill rate. The expected market riskpremium (emrp) is computed as follows:
emrpt ¼ �̂0 þ �̂1divt þ �̂2termt þ �̂3deft þ �̂4tbt ð2Þ
The months in which expected market risk pre-mium is below its median are classified as good timesand the remaining months are classified as bad times.The data on yields are from the website of the FederalReserve Bank of Minneapolis. Def is the yielddifference between Moody’s BAA and AAA corpo-rate bonds, and term is the difference betweenMoody’s Aaa corporate bond yield and the
1 http://mba.tuck.dartmouth.edu/pages/faculty/ken.french/data_library.html
52 Y. Hammami
Dow
nloa
ded
by [
Uni
vers
ity o
f C
ambr
idge
] at
13:
18 0
8 O
ctob
er 2
014
1-month treasury bill rate. The dividend yield is
obtained from Robert Shiller’s Web site.2
To examine the robustness of the momentum
strategy across economic states, the sample period is
subdivided into two subperiods: 1927–1963 and
1964–2009. The subperiods were selected to make
the comparison easier with previous researches.
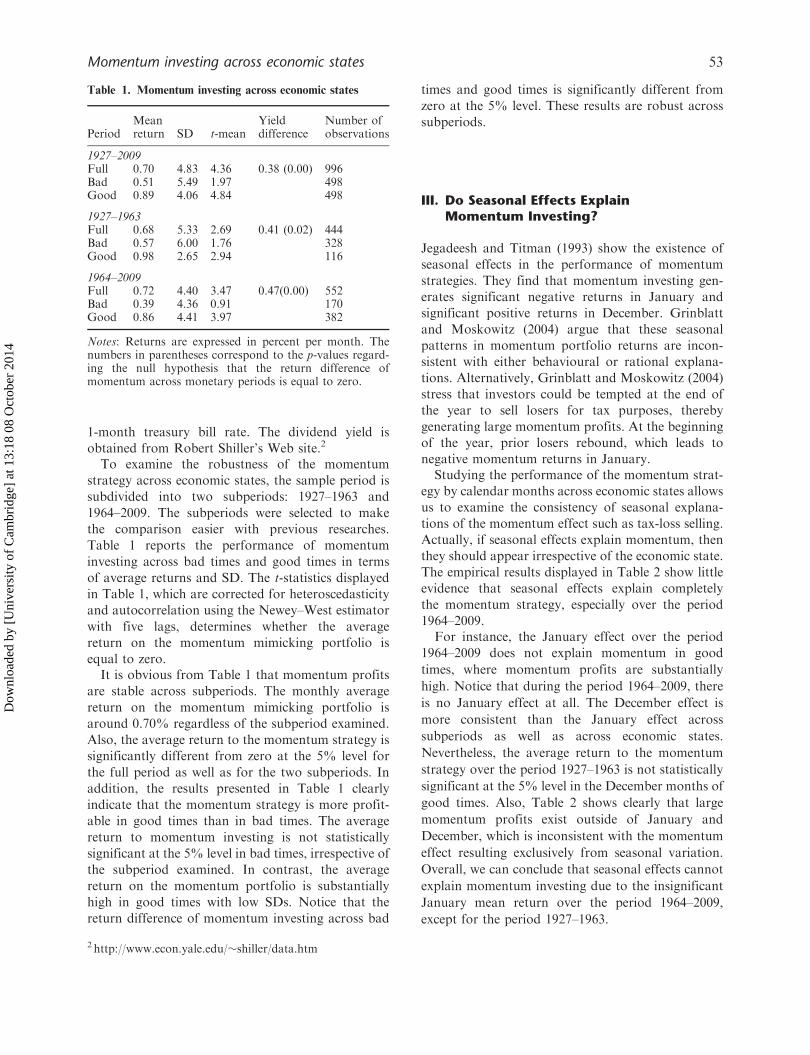
Table 1 reports the performance of momentum
investing across bad times and good times in terms
of average returns and SD. The t-statistics displayed
in Table 1, which are corrected for heteroscedasticity
and autocorrelation using the Newey–West estimator
with five lags, determines whether the average
return on the momentum mimicking portfolio is
equal to zero.It is obvious from Table 1 that momentum profits
are stable across subperiods. The monthly average
return on the momentum mimicking portfolio is
around 0.70% regardless of the subperiod examined.
Also, the average return to the momentum strategy is
significantly different from zero at the 5% level for
the full period as well as for the two subperiods. In
addition, the results presented in Table 1 clearly
indicate that the momentum strategy is more profit-
able in good times than in bad times. The average
return to momentum investing is not statistically
significant at the 5% level in bad times, irrespective of
the subperiod examined. In contrast, the average
return on the momentum portfolio is substantially
high in good times with low SDs. Notice that the
return difference of momentum investing across bad
times and good times is significantly different from
zero at the 5% level. These results are robust across
subperiods.
III. Do Seasonal Effects ExplainMomentum Investing?
Jegadeesh and Titman (1993) show the existence of
seasonal effects in the performance of momentum
strategies. They find that momentum investing gen-
erates significant negative returns in January and
significant positive returns in December. Grinblatt
and Moskowitz (2004) argue that these seasonal
patterns in momentum portfolio returns are incon-
sistent with either behavioural or rational explana-
tions. Alternatively, Grinblatt and Moskowitz (2004)
stress that investors could be tempted at the end of
the year to sell losers for tax purposes, thereby
generating large momentum profits. At the beginning
of the year, prior losers rebound, which leads to
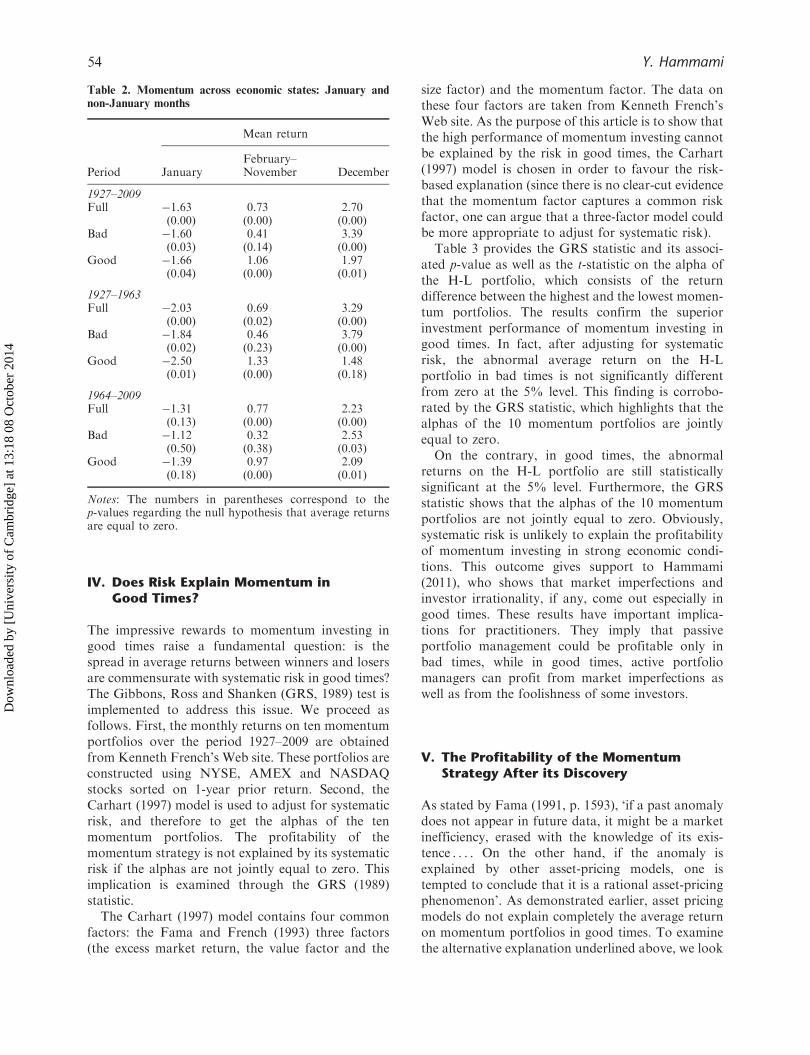
negative momentum returns in January.Studying the performance of the momentum strat-
egy by calendar months across economic states allows
us to examine the consistency of seasonal explana-
tions of the momentum effect such as tax-loss selling.
Actually, if seasonal effects explain momentum, then
they should appear irrespective of the economic state.
The empirical results displayed in Table 2 show little
evidence that seasonal effects explain completely
the momentum strategy, especially over the period
1964–2009.For instance, the January effect over the period
1964–2009 does not explain momentum in good
times, where momentum profits are substantially
high. Notice that during the period 1964–2009, there
is no January effect at all. The December effect is
more consistent than the January effect across
subperiods as well as across economic states.
Nevertheless, the average return to the momentum
strategy over the period 1927–1963 is not statistically
significant at the 5% level in the December months of
good times. Also, Table 2 shows clearly that large
momentum profits exist outside of January and
December, which is inconsistent with the momentum
effect resulting exclusively from seasonal variation.
Overall, we can conclude that seasonal effects cannot
explain momentum investing due to the insignificant
January mean return over the period 1964–2009,
except for the period 1927–1963.
Table 1. Momentum investing across economic states
PeriodMeanreturn SD t-mean
Yielddifference
Number ofobservations
1927–2009Full 0.70 4.83 4.36 0.38 (0.00) 996Bad 0.51 5.49 1.97 498Good 0.89 4.06 4.84 498
1927–1963Full 0.68 5.33 2.69 0.41 (0.02) 444Bad 0.57 6.00 1.76 328Good 0.98 2.65 2.94 116
1964–2009Full 0.72 4.40 3.47 0.47(0.00) 552Bad 0.39 4.36 0.91 170Good 0.86 4.41 3.97 382
Notes: Returns are expressed in percent per month. Thenumbers in parentheses correspond to the p-values regard-ing the null hypothesis that the return difference ofmomentum across monetary periods is equal to zero.
2 http://www.econ.yale.edu/�shiller/data.htm
Momentum investing across economic states 53
Dow
nloa
ded
by [
Uni
vers
ity o
f C
ambr
idge
] at
13:
18 0
8 O
ctob
er 2
014
IV. Does Risk Explain Momentum inGood Times?
The impressive rewards to momentum investing ingood times raise a fundamental question: is thespread in average returns between winners and losersare commensurate with systematic risk in good times?The Gibbons, Ross and Shanken (GRS, 1989) test isimplemented to address this issue. We proceed asfollows. First, the monthly returns on ten momentumportfolios over the period 1927–2009 are obtainedfrom Kenneth French’s Web site. These portfolios areconstructed using NYSE, AMEX and NASDAQstocks sorted on 1-year prior return. Second, theCarhart (1997) model is used to adjust for systematicrisk, and therefore to get the alphas of the tenmomentum portfolios. The profitability of themomentum strategy is not explained by its systematicrisk if the alphas are not jointly equal to zero. Thisimplication is examined through the GRS (1989)statistic.
The Carhart (1997) model contains four commonfactors: the Fama and French (1993) three factors(the excess market return, the value factor and the
size factor) and the momentum factor. The data onthese four factors are taken from Kenneth French’sWeb site. As the purpose of this article is to show thatthe high performance of momentum investing cannotbe explained by the risk in good times, the Carhart(1997) model is chosen in order to favour the risk-based explanation (since there is no clear-cut evidencethat the momentum factor captures a common riskfactor, one can argue that a three-factor model couldbe more appropriate to adjust for systematic risk).
Table 3 provides the GRS statistic and its associ-ated p-value as well as the t-statistic on the alpha ofthe H-L portfolio, which consists of the returndifference between the highest and the lowest momen-tum portfolios. The results confirm the superiorinvestment performance of momentum investing ingood times. In fact, after adjusting for systematicrisk, the abnormal average return on the H-Lportfolio in bad times is not significantly differentfrom zero at the 5% level. This finding is corrobo-rated by the GRS statistic, which highlights that thealphas of the 10 momentum portfolios are jointlyequal to zero.
On the contrary, in good times, the abnormalreturns on the H-L portfolio are still statisticallysignificant at the 5% level. Furthermore, the GRSstatistic shows that the alphas of the 10 momentumportfolios are not jointly equal to zero. Obviously,systematic risk is unlikely to explain the profitabilityof momentum investing in strong economic condi-tions. This outcome gives support to Hammami(2011), who shows that market imperfections andinvestor irrationality, if any, come out especially ingood times. These results have important implica-tions for practitioners. They imply that passiveportfolio management could be profitable only inbad times, while in good times, active portfoliomanagers can profit from market imperfections aswell as from the foolishness of some investors.
V. The Profitability of the MomentumStrategy After its Discovery
As stated by Fama (1991, p. 1593), ‘if a past anomalydoes not appear in future data, it might be a marketinefficiency, erased with the knowledge of its exis-tence . . . . On the other hand, if the anomaly isexplained by other asset-pricing models, one istempted to conclude that it is a rational asset-pricingphenomenon’. As demonstrated earlier, asset pricingmodels do not explain completely the average returnon momentum portfolios in good times. To examinethe alternative explanation underlined above, we look
Table 2. Momentum across economic states: January and
non-January months
Mean return
Period JanuaryFebruary–November December
1927–2009Full �1.63 0.73 2.70
(0.00) (0.00) (0.00)Bad �1.60 0.41 3.39
(0.03) (0.14) (0.00)Good �1.66 1.06 1.97
(0.04) (0.00) (0.01)
1927–1963Full �2.03 0.69 3.29
(0.00) (0.02) (0.00)Bad �1.84 0.46 3.79
(0.02) (0.23) (0.00)Good �2.50 1.33 1.48
(0.01) (0.00) (0.18)
1964–2009Full �1.31 0.77 2.23
(0.13) (0.00) (0.00)Bad �1.12 0.32 2.53
(0.50) (0.38) (0.03)Good �1.39 0.97 2.09
(0.18) (0.00) (0.01)
Notes: The numbers in parentheses correspond to thep-values regarding the null hypothesis that average returnsare equal to zero.
54 Y. Hammami
Dow
nloa
ded
by [
Uni
vers
ity o
f C
ambr
idge
] at
13:
18 0
8 O
ctob
er 2
014
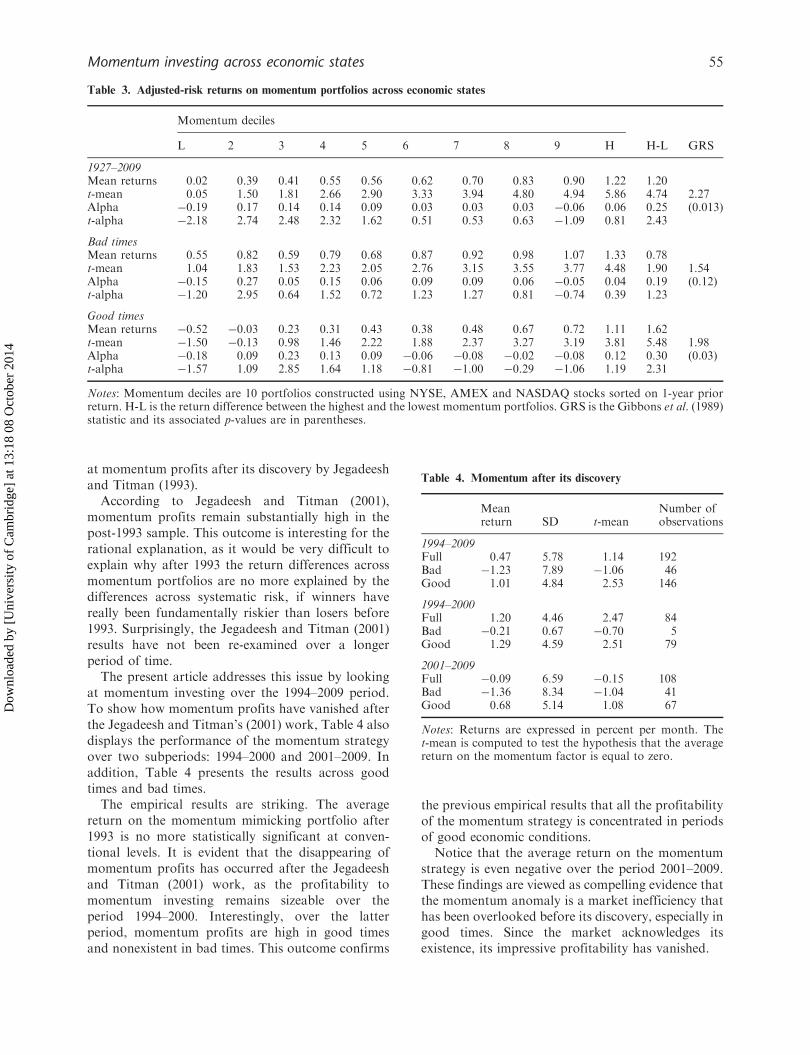
at momentum profits after its discovery by Jegadeeshand Titman (1993).
According to Jegadeesh and Titman (2001),momentum profits remain substantially high in thepost-1993 sample. This outcome is interesting for therational explanation, as it would be very difficult toexplain why after 1993 the return differences acrossmomentum portfolios are no more explained by thedifferences across systematic risk, if winners havereally been fundamentally riskier than losers before1993. Surprisingly, the Jegadeesh and Titman (2001)results have not been re-examined over a longerperiod of time.
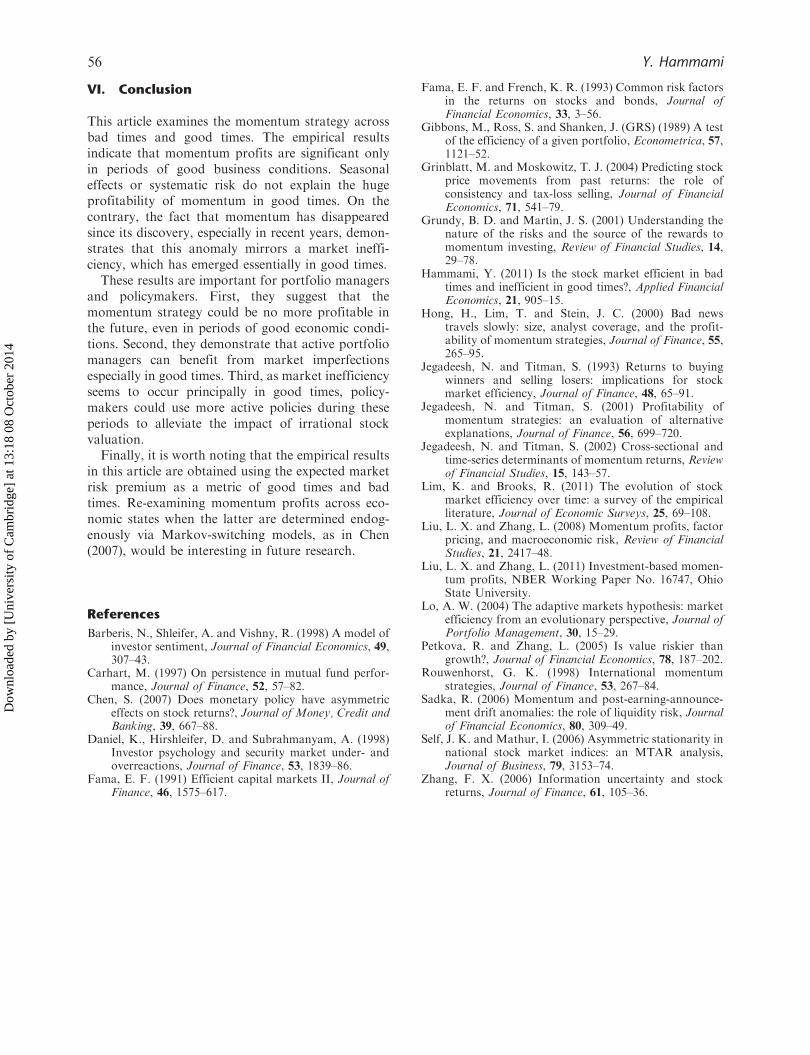
The present article addresses this issue by lookingat momentum investing over the 1994–2009 period.To show how momentum profits have vanished afterthe Jegadeesh and Titman’s (2001) work, Table 4 alsodisplays the performance of the momentum strategyover two subperiods: 1994–2000 and 2001–2009. Inaddition, Table 4 presents the results across goodtimes and bad times.
The empirical results are striking. The averagereturn on the momentum mimicking portfolio after1993 is no more statistically significant at conven-tional levels. It is evident that the disappearing ofmomentum profits has occurred after the Jegadeeshand Titman (2001) work, as the profitability tomomentum investing remains sizeable over theperiod 1994–2000. Interestingly, over the latterperiod, momentum profits are high in good timesand nonexistent in bad times. This outcome confirms
the previous empirical results that all the profitabilityof the momentum strategy is concentrated in periodsof good economic conditions.
Notice that the average return on the momentumstrategy is even negative over the period 2001–2009.These findings are viewed as compelling evidence thatthe momentum anomaly is a market inefficiency thathas been overlooked before its discovery, especially ingood times. Since the market acknowledges itsexistence, its impressive profitability has vanished.
Table 3. Adjusted-risk returns on momentum portfolios across economic states
Momentum deciles
L 2 3 4 5 6 7 8 9 H H-L GRS
1927–2009Mean returns 0.02 0.39 0.41 0.55 0.56 0.62 0.70 0.83 0.90 1.22 1.20t-mean 0.05 1.50 1.81 2.66 2.90 3.33 3.94 4.80 4.94 5.86 4.74 2.27Alpha �0.19 0.17 0.14 0.14 0.09 0.03 0.03 0.03 �0.06 0.06 0.25 (0.013)t-alpha �2.18 2.74 2.48 2.32 1.62 0.51 0.53 0.63 �1.09 0.81 2.43
Bad timesMean returns 0.55 0.82 0.59 0.79 0.68 0.87 0.92 0.98 1.07 1.33 0.78t-mean 1.04 1.83 1.53 2.23 2.05 2.76 3.15 3.55 3.77 4.48 1.90 1.54Alpha �0.15 0.27 0.05 0.15 0.06 0.09 0.09 0.06 �0.05 0.04 0.19 (0.12)t-alpha �1.20 2.95 0.64 1.52 0.72 1.23 1.27 0.81 �0.74 0.39 1.23
Good timesMean returns �0.52 �0.03 0.23 0.31 0.43 0.38 0.48 0.67 0.72 1.11 1.62t-mean �1.50 �0.13 0.98 1.46 2.22 1.88 2.37 3.27 3.19 3.81 5.48 1.98Alpha �0.18 0.09 0.23 0.13 0.09 �0.06 �0.08 �0.02 �0.08 0.12 0.30 (0.03)t-alpha �1.57 1.09 2.85 1.64 1.18 �0.81 �1.00 �0.29 �1.06 1.19 2.31
Notes: Momentum deciles are 10 portfolios constructed using NYSE, AMEX and NASDAQ stocks sorted on 1-year priorreturn. H-L is the return difference between the highest and the lowest momentum portfolios. GRS is the Gibbons et al. (1989)statistic and its associated p-values are in parentheses.
Table 4. Momentum after its discovery
Meanreturn SD t-mean
Number ofobservations
1994–2009Full 0.47 5.78 1.14 192Bad �1.23 7.89 �1.06 46Good 1.01 4.84 2.53 146
1994–2000Full 1.20 4.46 2.47 84Bad �0.21 0.67 �0.70 5Good 1.29 4.59 2.51 79
2001–2009Full �0.09 6.59 �0.15 108Bad �1.36 8.34 �1.04 41Good 0.68 5.14 1.08 67
Notes: Returns are expressed in percent per month. Thet-mean is computed to test the hypothesis that the averagereturn on the momentum factor is equal to zero.
Momentum investing across economic states 55
Dow
nloa
ded
by [
Uni
vers
ity o
f C
ambr
idge
] at
13:
18 0
8 O
ctob
er 2
014
VI. Conclusion
This article examines the momentum strategy acrossbad times and good times. The empirical resultsindicate that momentum profits are significant onlyin periods of good business conditions. Seasonaleffects or systematic risk do not explain the hugeprofitability of momentum in good times. On thecontrary, the fact that momentum has disappearedsince its discovery, especially in recent years, demon-strates that this anomaly mirrors a market ineffi-ciency, which has emerged essentially in good times.
These results are important for portfolio managersand policymakers. First, they suggest that themomentum strategy could be no more profitable inthe future, even in periods of good economic condi-tions. Second, they demonstrate that active portfoliomanagers can benefit from market imperfectionsespecially in good times. Third, as market inefficiencyseems to occur principally in good times, policy-makers could use more active policies during theseperiods to alleviate the impact of irrational stockvaluation.
Finally, it is worth noting that the empirical resultsin this article are obtained using the expected marketrisk premium as a metric of good times and badtimes. Re-examining momentum profits across eco-nomic states when the latter are determined endog-enously via Markov-switching models, as in Chen(2007), would be interesting in future research.
References
Barberis, N., Shleifer, A. and Vishny, R. (1998) A model ofinvestor sentiment, Journal of Financial Economics, 49,307–43.
Carhart, M. (1997) On persistence in mutual fund perfor-mance, Journal of Finance, 52, 57–82.
Chen, S. (2007) Does monetary policy have asymmetriceffects on stock returns?, Journal of Money, Credit andBanking, 39, 667–88.
Daniel, K., Hirshleifer, D. and Subrahmanyam, A. (1998)Investor psychology and security market under- andoverreactions, Journal of Finance, 53, 1839–86.
Fama, E. F. (1991) Efficient capital markets II, Journal ofFinance, 46, 1575–617.
Fama, E. F. and French, K. R. (1993) Common risk factorsin the returns on stocks and bonds, Journal ofFinancial Economics, 33, 3–56.
Gibbons, M., Ross, S. and Shanken, J. (GRS) (1989) A testof the efficiency of a given portfolio, Econometrica, 57,1121–52.
Grinblatt, M. and Moskowitz, T. J. (2004) Predicting stockprice movements from past returns: the role ofconsistency and tax-loss selling, Journal of FinancialEconomics, 71, 541–79.
Grundy, B. D. and Martin, J. S. (2001) Understanding thenature of the risks and the source of the rewards tomomentum investing, Review of Financial Studies, 14,29–78.
Hammami, Y. (2011) Is the stock market efficient in badtimes and inefficient in good times?, Applied FinancialEconomics, 21, 905–15.
Hong, H., Lim, T. and Stein, J. C. (2000) Bad newstravels slowly: size, analyst coverage, and the profit-ability of momentum strategies, Journal of Finance, 55,265–95.
Jegadeesh, N. and Titman, S. (1993) Returns to buyingwinners and selling losers: implications for stockmarket efficiency, Journal of Finance, 48, 65–91.
Jegadeesh, N. and Titman, S. (2001) Profitability ofmomentum strategies: an evaluation of alternativeexplanations, Journal of Finance, 56, 699–720.
Jegadeesh, N. and Titman, S. (2002) Cross-sectional andtime-series determinants of momentum returns, Reviewof Financial Studies, 15, 143–57.
Lim, K. and Brooks, R. (2011) The evolution of stockmarket efficiency over time: a survey of the empiricalliterature, Journal of Economic Surveys, 25, 69–108.
Liu, L. X. and Zhang, L. (2008) Momentum profits, factorpricing, and macroeconomic risk, Review of FinancialStudies, 21, 2417–48.
Liu, L. X. and Zhang, L. (2011) Investment-based momen-tum profits, NBER Working Paper No. 16747, OhioState University.
Lo, A. W. (2004) The adaptive markets hypothesis: marketefficiency from an evolutionary perspective, Journal ofPortfolio Management, 30, 15–29.
Petkova, R. and Zhang, L. (2005) Is value riskier thangrowth?, Journal of Financial Economics, 78, 187–202.
Rouwenhorst, G. K. (1998) International momentumstrategies, Journal of Finance, 53, 267–84.
Sadka, R. (2006) Momentum and post-earning-announce-ment drift anomalies: the role of liquidity risk, Journalof Financial Economics, 80, 309–49.
Self, J. K. and Mathur, I. (2006) Asymmetric stationarity innational stock market indices: an MTAR analysis,Journal of Business, 79, 3153–74.
Zhang, F. X. (2006) Information uncertainty and stockreturns, Journal of Finance, 61, 105–36.
56 Y. Hammami
Dow
nloa
ded
by [
Uni
vers
ity o
f C
ambr
idge
] at
13:
18 0
8 O
ctob
er 2
014