Embed Size (px)
Citation preview

Beazley plc | Annual report and accounts 2017
Moments of truth

Moments of truth
When catastrophes hit, for us and our clients they are moments of truth
Insurance cannot make everything right. However, it can help people begin to rebuild their lives after devastating natural catastrophes. In 2017, one of the worst years on record for such events, Beazley’s claims teams worked tirelessly to fulfil the promises that our underwriters had made.
www.beazley.comBeazley Annual report 2017
Find out more pages 10 to 13
Strategic reportIFC Highlights Our key performance indicators1 Our key differentiators 2 Entrepreneurial spirit 3 Strong partnerships 4 Diversified business8 Our business model and strategy10 Moments of truth 14 Active investors16 Chairman’s statement18 Chief executive’s statement22 Q&A with the chief executive24 Chief underwriting officer’s report28 Performance by division 30 Marine 32 Political, accident & contingency 34 Property 36 Reinsurance 38 Specialty lines40 32 years of profitable growth42 Financial review 42 Group performance 48 Balance sheet management 50 Capital structure52 Operational update55 Risk management62 Responsible business70 Directors’ report
Governance75 Letter from our chairman76 Board of directors80 Investor relations81 Statement of corporate governance96 Letter from the chairman of our remuneration committee97 Directors’ remuneration report117 Statement of directors’ responsibilities118 Independent auditor’s report
Financial statements126 Consolidated statement of profit or loss127 Statements of comprehensive income128 Statements of changes in equity130 Statements of financial position 131 Statements of cash flows132 Notes to the financial statements193 Glossary
Please turn overleaf for our business model and strategy and key performance indicators.

Gross premiums written
$2,343.8m(2016: $2,195.6m)
Cash and investments
$4,890.1m(2016: $4,702.6m)
Net premiums written
$1,978.8m(2016: $1,854.0m)
Net investment income
$138.3m(2016: $93.1m)
Net earned premiums
$1,869.4m(2016: $1,768.2m)
Investment return
2.9%(2016: 2.0%)
Renewal rate decrease
1%(2016: decrease 2%)
Profit before tax for the financial year
$168.0m(2016: $293.2m)
Highlights
Beazley Annual report 2017

Key performance indicators
KPIs
Financial highlightsEarnings per share (c)
2017201520142013
25.0
2016
48.852.443.1
0102030405060
48.6
EPS is at x1.8 total dividend cover for 2017.
Net assets per share (c)
2017201520142013
17.818.2263.9
2016
18.7
247.0248.3
050
100150200250300
■ Tangible ■ Intangible
25.5
261.6
18.7
268.2
Net assets per share growth despite a challenging environment.
0
500
1,000
1,500
2,000
2,500
Gross premiums written ($m)
2,02
1.8
2,08
0.9
1,97
0.2
2017201520142013 2016
2,34
3.8
2,19
5.6
Growth of 7% in 2017 and 19% since 2013.
05
1015202530
Dividends per share (p)
18.49.9 11.116.1
8.8
■ Interim and second interim ■ Special
11.89.3
2017201520142013 2016
10.010.5
The interim and second interim dividend for 2017 is in line with our dividend strategy and has grown by 6%.
0
5
10
15
20
25
Return on equity (%)
1917
21
2017201520142013 2016
9
18
Average five year return on equity of 17%.
0
20
40
60
80
100
Combined ratio (%)
4039
8984
4939
87
4845
2017201520142013 2016
41
99
5841
89
48
■ Claims ratio ■ Expense ratio
Our combined ratio has averaged 90% over five years.
www.beazley.com
Find out more page 125
The group is of the view that some of the above metrics constitute alternative performance measures (APMs). Further information on our APMs can be found in the financial review on page 43 and in the glossary on page 193.

Strategic report
www.beazley.com Annual report 2017 Beazley 01
Our key differentiators
We create value through the implementation of three key differentiators – consistently applied and nurtured across our specialist insurance operations around the world
Entrepreneurial spiritWe look for individuals with a strong sense of ownership for the business they handle who are willing – indeed keen – to be accountable for their decisions
Strong partnerships Strong long term relationships with brokers, reinsurers and clients have sustained our business over three decades
Diversified businessWe target a diverse underwriting portfolio and actively manage the different insurance cycles to achieve consistent results year on year

Entrepreneurial spiritWe look for individuals with a strong sense of ownership for the business they handle who are willing – indeed keen – to be accountable for their decisions
www.beazley.com02 Beazley Annual report 2017
Our key differentiators
A little over a decade ago, Mike Donovan joined Beazley’s then fledgling business in the US with similarly large ambitions. In 2009, his team launched Beazley Breach Response, now one of the leading cyber insurance products in a market that has seen explosive growth in demand in recent years.
Beazley is a well regarded company and is perceived as offering a congenial environment in which teams can come and build their business. These teams typically have a strong underwriting track record and excellent market relationships. Beazley’s property and marine divisions have both grown and diversified their books successfully in this way in recent years.
Beazley’s success over more than three decades has been due, largely, to its ability to attract talented individuals and teams with an entrepreneurial mindset, and give them the resources and tools to build a profitable business.
This process continued to take place in 2017. Plans to expand our specialty lines business internationally outside the US are the responsibility of a team led by Gerard Bloom, who joined Beazley in 2016, excited by this entrepreneurial challenge. The team plans to harness technology to maximise the productivity of underwriters and develop Beazley’s products across a number of geographies outside the US. There is also a new focus within the team on providing coverage for financial institutions. Lorena Segovia, pictured left, joined the team in May 2017 to spearhead the growth of Beazley’s financial lines business in continental Europe.
“ Beazley’s successful track record for organic growth and innovation was something which was attractive to me. It generates an extremely strong and cohesive corporate culture.”
Lorena Segovia Financial lines regional manager for continental Europe
Strong partnerships Strong long term relationships with brokers, reinsurers and clients have sustained our business over three decades
Strategic report
www.beazley.com Annual report 2017 Beazley 03
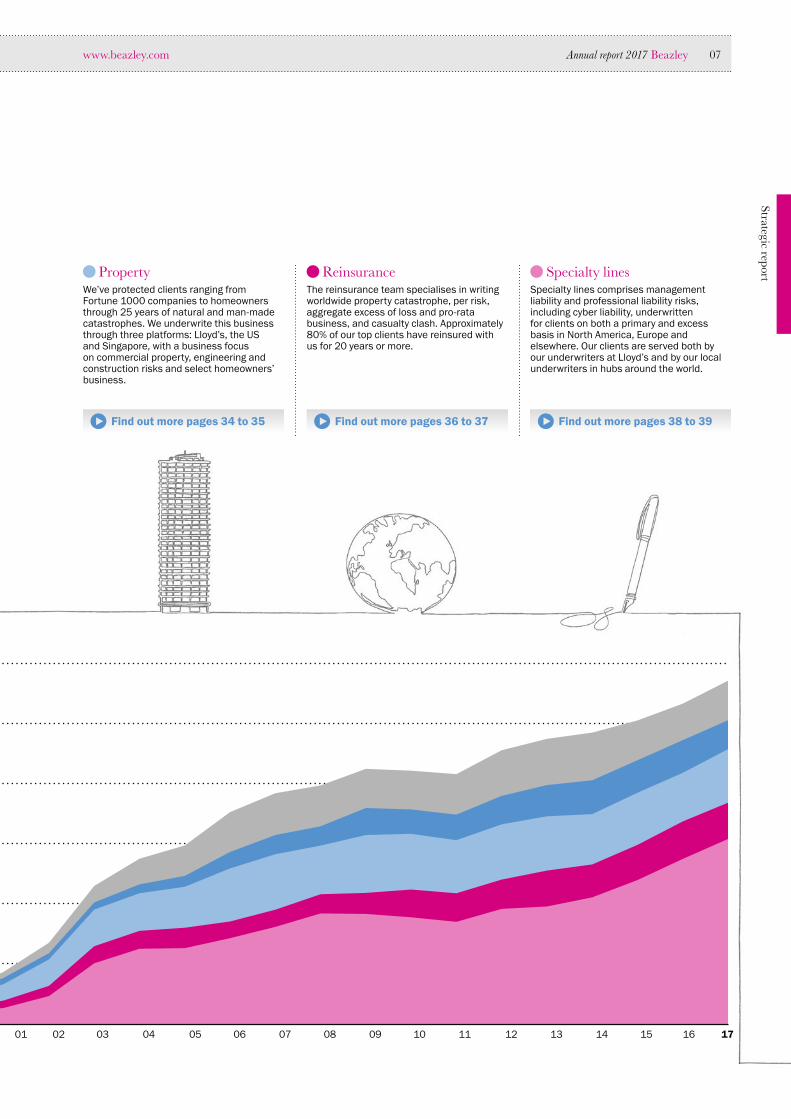
Nearly all of Beazley’s business is transacted through brokers and the quality of our broker relationships influences the business we see at Lloyd’s and around the world. Maintaining those relationships is central to the role of our underwriters and to our growing broker relations team around the world, led by Dan Jones.
Each year, we conduct detailed research with our brokers to understand how they view the service that Beazley offers. Results naturally vary by team and geography, but the view of the company as a whole that emerged from the 2017 survey was very positive. Our net promoter score – a measure of brokers’ willingness to recommend Beazley – was even higher among claims brokers than among the brokers who deal exclusively with our underwriters. Not all insurers see claims service as a source of differentiation: Beazley does.
Many of our client relationships are also long term, and all are underpinned by trust. Our treaty reinsurance team, in particular, has supported many of its cedents for more than two decades. In the summer of 2017, when three major hurricanes hit the Caribbean and south eastern coast of the US in quick succession, the affected insurers backed by Beazley knew that our support would be swift.
Moment of truth Customer relationships can be strengthened – or damaged – in the aftermath of catastrophe events. The reaction from brokers to Beazley’s claims performance was very positive. One observed: “Beazley have been very supportive and proactive pre/post the hurricanes. We are in regular communication on a number of accounts and they are already assisting many clients by advancing funds.”

www.beazley.com04 Beazley Annual report 2017
Our key differentiators continued
Diversified businessWe target a diverse underwriting portfolio and actively manage the different insurance cycles to achieve consistent results year on year
The diversification of an insurer’s portfolio shows its worth most clearly in years in which one or more lines of business incur heavy losses. This proved to be the case in 2017 with the treaty reinsurance division recording a combined ratio of 107% and the property division a combined ratio of 130%. Balancing this, our specialty lines division, the company’s largest, delivered a combined ratio of 89%.
The outcome for Beazley as a whole was a modest underwriting profit in a year in which the Lloyd’s market is expected to incur a material underwriting loss.
Geographic diversification also plays an important role in our business. Beazley’s historical focus primarily on the US market is beginning to weaken due to the growth of our business in Europe, Asia and Latin America. Our specialty lines division, in particular, is driving
forward plans for significant growth in these markets that will further reduce our net exposure to claims spikes or economic weakening in the US.
The principle of diversification also extends to the management of our cash and investments. Beazley’s $4.9bn investment portfolio, which generated a return of 2.9% in 2017, includes a variety of uncorrelated asset classes to maximise risk-adjusted performance (see page 47).
BarcelonaBirminghamDublinIpswichLeedsLondonManchesterMunichParisOslo
New office
Existing office
Growing our network of Beazley offices

Strategic report
www.beazley.com Annual report 2017 Beazley 05
Diversified portfolio achieves consistent combined ratio through market cycles
Diversified portfolioThe spread of our overall portfolio by division and the impact this diversification has had on our combined ratio over the past eight years can be seen in the chart below.
140%
160%
100%
120%
80%
40%
60%
2009 2014 2015 2016 2017
Lines of business Diversified portfolio
2012 201320112010

www.beazley.com06 Beazley Annual report 2017
Our key differentiators continued
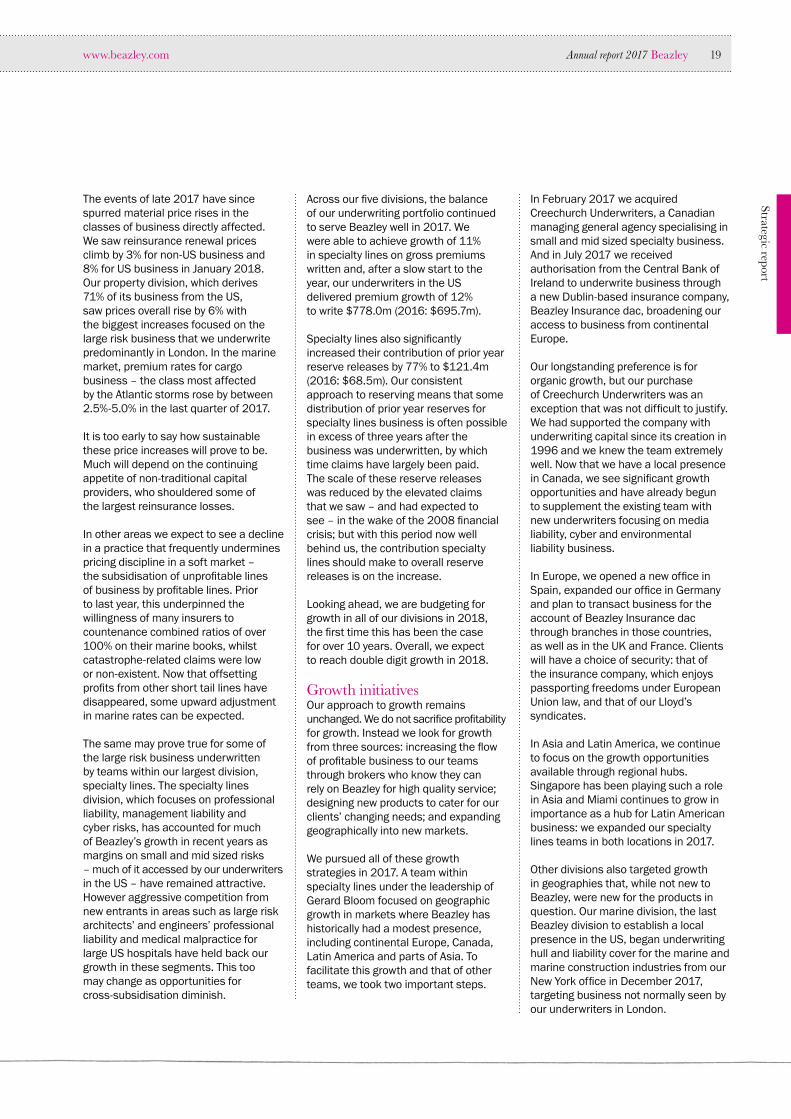
MarineWe help insure in excess of 20% of the world’s ocean-going tonnage and are the pre-eminent leader of voyage and tow business in the London market. We insure 60% of the Forbes’ List of the 25 Biggest Public Oil & Gas Companies. We have extensive experience insuring a wide variety of cargoes including project cargo, fine art and specie.
Political, accident & contingency
In addition to traditional lines such as contract frustration, expropriation and credit, we insure a growing number of businesses against terrorism and political violence. Our personal accident product is written on both an insurance and reinsurance basis and covers a number of niche classes.
88 8987 90 91 92 93 94 95 96 97 98 99 00 01 02 03 04 05 06 07 08 09 10 11 1312 160
500
1,000
1,500
2,000
2,500
3,000
151486 17
Diversified business
Managed gross premiums growth by division $m
Find out more pages 30 to 31 Find out more pages 32 to 33
Strategic report
www.beazley.com Annual report 2017 Beazley 07
ReinsuranceThe reinsurance team specialises in writing worldwide property catastrophe, per risk, aggregate excess of loss and pro-rata business, and casualty clash. Approximately 80% of our top clients have reinsured with us for 20 years or more.
PropertyWe’ve protected clients ranging from Fortune 1000 companies to homeowners through 25 years of natural and man-made catastrophes. We underwrite this business through three platforms: Lloyd’s, the US and Singapore, with a business focus on commercial property, engineering and construction risks and select homeowners’ business.
Specialty linesSpecialty lines comprises management liability and professional liability risks, including cyber liability, underwritten for clients on both a primary and excess basis in North America, Europe and elsewhere. Our clients are served both by our underwriters at Lloyd’s and by our local underwriters in hubs around the world.
88 8987 90 91 92 93 94 95 96 97 98 99 00 01 02 03 04 05 06 07 08 09 10 11 1312 160
500
1,000
1,500
2,000
2,500
3,000
151486 17
Find out more pages 34 to 35 Find out more pages 36 to 37 Find out more pages 38 to 39

www.beazley.com08 Beazley Annual report 2017
Our business model and strategy
Beazley’s vision is to become, and be recognised as, the highest performing specialist insurer. The company’s business model, strategy, and approach to risk management are geared to the achievement of this vision, as well as to creating value for our stakeholders
Our strategyOur business model
Reconfirmed annually through the business planning process, our business model is as follows:
• Beazley is a specialist insurer. We have a targeted product set, largely in commercial lines of business, and underwrite each risk on its own merits;
• We employ highly skilled, experienced and specialist underwriters and claims managers;
• We tend to write capped liabilities;
• We operate through specific insurance hubs rather than seeking a local presence in every country in which we do business; and
• We transact business through brokers and work with selected managing general agencies and managing general underwriters to improve distribution in specialist niches.
Our strategy is directed towards the achievement of our vision, which is to become, and be recognised as, the highest performing specialist insurer. To this end, our strategy comprises:
• Prudent capital allocation to achieve a well diversified portfolio that is resistant to shocks in any individual line of business;
• The creation of an environment in which talented individuals with entrepreneurial spirit can build successful businesses;
• The ability to scale our operations to ensure that client and broker service keeps pace and, wherever possible, improves as the company grows; and
• Consistent investment in product innovations to provide better products and services to improve our clients’ risk transfer.

Strategic report
www.beazley.com Annual report 2017 Beazley 09
Risks How we measure value creation
Given the nature of Beazley’s business, the key risks that impact financial performance arise from insurance activities and fall into the following categories:
• Market cycle risk: The risk of systematic mispricing of the medium tailed specialty lines business which could arise due to a change in the US tort environment, changes to the supply and demand of capital, and companies using incomplete data to make decisions;
• Natural catastrophe risk: The risk of one large event caused by nature affecting a number of policies and therefore giving rise to multiple losses. Given Beazley’s risk profile, this could be a hurricane, major windstorm or earthquake;
• Non natural catastrophe risk: This risk is similar to natural catastrophe risk except that multiple losses arise from one event caused by mankind. Given Beazley’s risk profile, examples include a coordinated cyber attack, an act of terrorism, an act of war or a political event;
• Reserve risk: The risk that the reserves put aside for claims to be settled in the future turn out to be insufficient; and
• Market (asset) risk: The risk that the value of investments could be adversely impacted by movements in interest rates, exchange rates, default rates or external market forces.
For shareholdersWe measure our value creation for shareholders through earnings per share, the growth of net assets per share, and total shareholder returns in dollars as this is the currency of the majority of our transactions. Underpinning our strong results against all of these metrics has been our consistently strong underwriting performance, reflected in our combined ratio. Our combined ratio in 2017, a year of exceptionally high natural catastrophes, was 99%. In the five years prior to 2017 it averaged 88%.
For staffBeazley employs talented people and we invest accordingly in expanding their skills and helping them build rewarding careers. We measure the impact of these investments on the perceptions of our people in two main ways: by monitoring staff retention levels and through a detailed employee engagement survey, which we conduct every two years. On both counts, the evidence is strongly positive. Our staff retention levels are very high and the most recent employee engagement survey, conducted in 2017, positioned Beazley in the top quartile of the 6,000 companies surveyed by Aon Hewitt.
For customersNearly all business at Beazley comes through brokers. We monitor broker and client perceptions of our service – particularly our claims service – in a variety of ways, including through a detailed annual broker survey. The 2017 survey, conducted with more than 4,000 brokers, showed a strong net promoter score (NPS) for our underwriters, reflecting a high willingness to recommend Beazley. Among brokers who had experienced our claims service the NPS was higher still.
Our approach to managing these and other risks is described in detail on page 55

www.beazley.com10 Beazley Annual report 2017
Moments of truth
Unlike other products and services, the quality of an insurance policy cannot be fully assessed at the time of purchase. However, the natural catastrophes of 2017 gave Beazley’s claims teams ample opportunity to demonstrate the value of the company’s coverage

Strategic report
www.beazley.com Annual report 2017 Beazley 11
The trio of hurricanes – Harvey, Irma and Maria – that devastated large areas of Texas, Florida and the Caribbean in August and September caused total insured losses now estimated between $90-95bn. For Beazley, advanced technology – and in particular satellite imagery – enabled funds to be sent to policyholders far faster than would have been possible even a few years ago.
“In 2005 when Katrina hit New Orleans, it might have taken us 90 days to get money into the hands of our policyholders,” says Trevor Self, head of property claims at Beazley. “This time around we were able to do it much faster.”
In the wake of such devastating events, access to relief supplies is critical. In the USVI, this depends heavily on the air and sea ports managed by the Virgin Islands Port Authority. As the port authority’s website puts it: “Just about everything that is used or consumed by the residents of the US Virgin Islands enters the islands through boat or by plane. Food, clothing, machinery, mail, furniture, vehicles, building supplies, medical equipment – it all enters through the ports.”
Beazley was among the insurers that moved swiftly to supply the funds needed to enable the Virgin Islands Port Authority to rebuild. The first cheque – for $5m – for damage from Irma was paid on 20 September and the second – for a further $5m – was paid seven days later. Beazley’s entire limit was thus disbursed within three weeks of the storm.
The inhabitants of the US Virgin Islands (USVI) are used to storms. However, Hurricane Irma, which ripped through the islands as a category five storm on 6 September 2017, was exceptional. Two weeks later, another category five storm – Maria – delivered a second massive blow. In the weeks following the hurricanes, almost a third of the islands’ 108,000 residents applied for assistance from the Federal Emergency Management Agency (FEMA). Two months after the storms, nearly three quarters of the population remained without power.
Total estimated insurance market losses for large catastrophes in 2017
$100bn
Hurricane Irma
The remnants of a plane in a ditch on the St. Thomas airport runway after Hurricane Irma*
March of the hurricanes: By early September four named storms were churning across the Gulf of Mexico
US Virgin Islands – September 2017
* Credit: Hilary Swift / The New York Times / Redux / Eyevine
Katia
Irma
Harvey’s tail
Jose

www.beazley.com12 Beazley Annual report 2017
Moments of truth continued
“It’s all about a more efficient claims service. For the client that equates to a better claims service,” says Trevor Self. “Now we can send an adjuster out on one trip rather than three or four, and we instruct our adjusters to bring architects or engineers along with them, as needed, so that they can quantify costs up front.”
Technology plays an important part in delivering excellent claims service after a natural catastrophe, but it is by no means the whole story. Good advance planning is also essential. Beazley’s property team has a detailed catastrophe plan embedded in its annual business plan, ensuring that when a storm or earthquake hits, the damage can be ascertained swiftly. In many cases, advance payments are wired to the policyholder, ahead of the final determination of the claim.
Technology plays an important part in delivering excellent claims service, but it is not the whole story.
Since May 2016, Beazley, in common with other Lloyd’s insurers, has been working with McKenzie Intelligence Services, a company founded by British military intelligence veterans seeking to apply military knowhow and technology – particularly high resolution satellite imaging – in the service of the private sector. The technology was first employed after the Fort McMurray wildfires in the summer of 2016 in Alberta, Canada. Since then it has been progressively refined. In conjunction with Beazley’s exposure maps, reliable satellite imagery can enable the right experts to be sent, posthaste, to the scene of expected damage to ascertain the cost.
Tubbs fire, Napa County – October 2017
California wildfires
Total impact of losses to Beazley for large natural catastrophes in 2017
$200- 300m

Strategic report
www.beazley.com Annual report 2017 Beazley 13
Beazley’s exposure to these events was through facultative reinsurance, but the need to respond swiftly was nevertheless pressing. In particular, a number of schools that were destroyed or badly damaged by the quakes were in urgent need of repair.
“Within 24 hours of notification of the Mexican earthquakes we had advanced funds to our cedents in Mexico,” says reinsurance claims manager Stephen Black. “Less than a month later, we were doing the same for our cedents in the US after the Californian wildfires. Our business is based on strong, long term relationships – in situations such as these we understand the pressures our clients are under and make every effort to give them our full support.”
While a sequence of massive storms were striking the Caribbean, Mexico was contending with catastrophes of a different kind.
On 7 September a magnitude 8.1 earthquake, the largest to hit Mexico in more than a century, killed at least 90 people and destroyed or damaged more than 40,000 homes in the southern state of Chiapas. Less than a fortnight later, on 19 September, a magnitude 7.1 quake hit a more densely populated region south of Mexico City, causing 370 deaths and extensive damage.
First wind, then earth and fire
Chiapas – September 2017
Mexican earthquakes

www.beazley.com14 Beazley Annual report 2017
Active investors
Stuart Simpson, who took on the role of chief investment officer from 2016, observes: “In investment management, conservatism does not mean being slow off the mark and decisiveness need not be rash. Sometimes you need to act quickly and decisively in pursuit of a conservative strategy, to extract additional value or to protect returns.”
An example of the latter occurred on the evening of 8 November 2016, the date of the US general election. As the result began to crystallise, the team foresaw a sharp jump in US bond yields as markets anticipated higher economic growth and inflation.
Beazley’s investment team favours a variety of investment strategies for different elements of the company’s $4.9bn portfolio, some of them passive to limit fees. However, as chief investment officer Stuart Simpson explains, the team’s overall approach to its role is anything but passive
The skills of Beazley’s investment team played an important role in the company’s success in 2017, generating a return of 2.9%. The team was restructured in 2014, with the recruitment of Stuart Simpson, who had headed Lloyd’s investment function, and Linda Zuberi, who was responsible for global credit investments at another insurance company. Since 2015, the team has delivered strong returns through a series of carefully judged portfolio adjustments within the constraints of a conservative investment strategy.
Stuart SimpsonChief investment officer
Beazley investment portfolio mix
Investment grade credit 44.6%Government, quasi government and supranational 28.4%
Cash and cash equivalents 9.0%Hedge funds 7.7%Illiquid credit assets 3.7%Equity funds 3.4%Senior secured loans 1.8%Other credit 1.4%

Strategic report
www.beazley.com Annual report 2017 Beazley 15
In the brief window before yields rose significantly – a matter of hours – they reduced the duration of Beazley’s bond portfolio, to protect against losses in this scenario.
As yields rose in the following days and weeks, this move insulated Beazley’s portfolio from losses of as much as $16m.
Equally effective in 2017 was the decision taken early in the year to increase Beazley’s exposure to equities. Additional investments were made during the year, with a particular focus on emerging market equities which the team regarded as relatively undervalued.
From 3% of total investments at the end of 2016, equities made up as much as 6% during the year. Equity exposure returned 22% for the year as a whole, outperforming the global equity benchmark by more than 3%, largely thanks to overweight exposure to emerging market equities. Although equities only averaged 4% of total investments in the course of the year, they generated a quarter of the total return.
Lower investment expenses have also contributed to Beazley’s investment performance. In 2016, management of most of the group’s fixed income portfolio was brought in-house, with significant savings in management fees. Also, many of Beazley’s externally managed investments, including equities, utilise strategies that avoid the high fees associated with active fund management.
“We see a role for active stock picking in emerging markets and our managers delivered a good return, net of expenses, on these investments in 2017,” says Stuart Simpson. “However in developed markets we prefer essentially passive and systematic strategies with lower fees.”
Beazley’s overall investment framework (excluding cash and cash equivalents) remains unchanged. Between 75% and 85% is invested conservatively in a core portfolio of government bonds and highly rated corporate debt. That leaves between 15% and 25% available for investments in more volatile capital growth assets with higher expected return, including high yield debt, illiquid credit, equities, hedge funds, and systematic “absolute return” investments, similar to hedge funds but with lower fees.
Looking ahead to 2018, Stuart Simpson notes that bond yields are generally higher than in recent years, which should be supportive of investment returns. However, despite a generally benign global economic background, there are many developing risks for financial markets, including the long awaited tightening of monetary policies and ongoing geo-political tensions. Given these uncertainties, the ability of Beazley’s investment team to respond quickly to market developments is likely to remain key.
Beazley’s investment team

www.beazley.com16 Beazley Annual report 2017
Chairman’s statement
The value of insurance was brought home to millions of people in 2017
Dennis HoltChairman
The diversification of Beazley’s business once again showed its value in 2017, enabling the company to generate a return on average shareholders’ equity of 9% (2016: 18%), despite recognising substantial claims due to policyholders affected by natural catastrophes in the second half of the year.
In a year in which many insurers and reinsurers are expected to post underwriting losses, Beazley recorded a combined ratio of 99% (2016: 89%) and a strong investment return of 2.9% (2016: 2.0%). Earnings per share were 25.0c (2016: 48.6c) and net tangible assets per share were 261.6c (2016: 268.2c).
The value of insurance was brought home to millions of people in 2017 and Beazley’s claims teams responded swiftly, as they did in the wake of comparably severe events in 2011.
Natural catastrophes shine a spotlight on the claims paying ability of insurers, and particularly the speed with which funds can be dispatched to those in need. However, the less high profile work of claims teams who focus on other lines of business plays an equally important role. Beazley is often able to distinguish itself by the quality of the claims service provided for third party risks as well as first party risks: for many businesses a lawsuit can be just as damaging as a hurricane.
The board is pleased to announce a second interim dividend of 7.4p per ordinary share. Together with the first interim dividend of 3.7p this takes the total dividends declared for 2017 to 11.1p per ordinary share (2016: first interim dividend of 3.5p, second interim dividend of 7.0p plus a special dividend of 10.0p, totalling 20.5p).
Since Beazley’s stock market flotation in 2002, we have aimed to achieve dividend growth (excluding special dividends) of between 5% and 10%, a record we have maintained this year. We identified a number of opportunities to invest further in the business in 2017, particularly in the growth of our specialty lines division outside the US. Our long term approach to capital management is clear. We do not hoard capital and we will continue to distribute excess capital to shareholders if cash flow exceeds the opportunity to invest in profitable growth.
Beazley has a track record of premium growth, even in challenging markets, and in 2017 we delivered the high single digit growth we are targeting, with gross premiums written increasing 7% to $2,343.8m (2016: $2,195.6m). Profitable growth has proved steadily harder for insurers to achieve in recent years as premium rates for short tail, catastrophe exposed business have declined, but 2017’s catastrophe events have arrested these declines and – in the lines of business most directly affected – reversed them. Beazley is accordingly well placed for stronger growth in 2018.

Strategic report
www.beazley.com Annual report 2017 Beazley 17
Beazley has demonstrated an impressive ability to weather rapidly shifting market conditions, as the past year has once again demonstrated. David’s experience and acumen give me added confidence that the company will be well equipped to continue to grow profitably in the years ahead.
It has been a privilege to work with such a strong executive and non-executive team on the board and also to get to know so many talented individuals at many levels across the company. It is a cliché – but true – that the success of a service-oriented business such as Beazley depends on the quality of its people and the culture that binds them together. On both counts, Beazley should have a very successful future.
Dennis HoltChairman
7 February 2018
Innovation is the lifeblood of a specialist insurer, which must stay ahead of the inevitable commoditisation that affects insurance products as much as any other products over time. Beazley has had notable successes in launching products that are entirely new to world markets, but innovation also consists of bringing products developed in one market to others. This approach has informed the thinking behind the geographic expansion of our specialty lines division, which began in earnest in 2017. The team identified an opportunity to offer products that are market-leading in the US – such as our cyber, management liability and medical malpractice policies – to clients in Europe, Asia and Latin America.
Most of the growth resulting from this strategy is likely to be organic, but small scale acquisitions where there is an excellent strategic fit can also contribute. Our acquisition of Creechurch Underwriters, a managing general agency in Canada that we have supported for many years, fell into this category. Beazley now has an underwriting platform for growth in Canada which would have taken far longer to establish organically.
Another building block for future growth was put in place in July, when we received authorisation from the Central Bank of Ireland to convert our long established Dublin-based reinsurance company (Beazley Re dac) into an insurance company (Beazley Insurance dac) permitted to transact business throughout the European Union. Planning for this predated the British referendum vote to withdraw from the European Union in June 2016. We can now offer prospective clients in continental Europe a choice of cover, backed by either the Dublin-based insurance company or by our Lloyd’s syndicates.
Investments in technology have also underpinned Beazley’s growth and these have increased significantly in recent years. 2017 saw the establishment of a data and analytics strategic initiative, the performance of which will be followed closely by the board.
Money has continued to pour into so-called insurtech ventures in recent months, but the distinction that is sometimes drawn in the media between disruptive startups and stodgy incumbents oversimplifies and distorts the changes that are taking place. The most successful businesses are likely to be those that combine the expertise of established insurers with new tools and data sources that the insurtech ventures are developing. A priority for Beazley is to increase the volume of business that underwriters can handle without diminishing the focus they can bring to bear on the more complex risks. Advances in areas such as robotics can play an important role here.
Board changesClive Washbourn stood down from the Beazley board in July 2017. I am extremely grateful to Clive for his exceptional contribution to the board over the past 10 years. Clive will continue to provide a valuable service to Beazley by remaining head of our marine division.
David Roberts joined the board in November 2017. I have now served two, three year terms as chairman of Beazley and I am delighted that David will be succeeding me as chairman following the annual general meeting in March 2018.

www.beazley.com18 Beazley Annual report 2017
Chief executive’s statement
Claims service is our product and our claims team moved swiftly in 2017 to redeem our promise to our policyholders
Andrew HortonChief executive
In a year that tested the mettle of many insurers, Beazley performed strongly, delivering a profit before income tax of $168.0m (2016: $293.2m) on gross premiums written that rose by 7% to $2,343.8m (2016: $2,195.6m). After absorbing the impact of an exceptional series of natural catastrophes, we achieved a modest underwriting profit, with a combined ratio of 99% (2016: 89%).
Claims service is our product and our claims teams moved swiftly in the wake of the hurricanes, earthquakes and wildfires to redeem our promise to our policyholders. By the end of the year we had disbursed more than $110m in cash advances and claims settlements to help our insureds in the Caribbean and US in the wake of Hurricanes Harvey, Irma and Maria, the two earthquakes that rocked central Mexico in September 2017 and the California wildfires in October and December 2017, the worst in that state’s history.
All told, these claims added roughly 10 percentage points to our combined ratio for last year and directly affected all of our five divisions. The largest claims were, naturally, focused on our reinsurance and property divisions, but our marine division also incurred some cargo claims while our newly amalgamated political, accident & contingency division (PAC) picked up some event cancellation claims due to the storms.
The losses we paid in 2017 were well within the scenarios for which our underwriting teams routinely plan. As described on page 12, a detailed claims plan is a major part of the annual business plan for divisions exposed to potential catastrophe losses. In 2017 our plans included a larger role for technology than in prior years, with sophisticated satellite imagery enabling claims adjusters to be dispatched rapidly to the Beazley clients located in the areas most severely affected by the storms.
These events were, in aggregate, by far the largest insurance industry losses since 2011, accounting for an estimated $100bn in claims. After five years of largely benign catastrophe experience (superstorm Sandy in 2012 being the only significant exception), it is not surprising that pricing for the affected lines of business had eroded significantly. In the property insurance and reinsurance markets, price declines were aggravated by a large influx of new capital from pension funds and other investors seeking profitable diversification from other asset classes. Across Beazley’s portfolio as a whole, premium rates fell 1% in 2017.
Prudent risk selection and effective cycle management are disciplines that any insurer must get right if it is to prosper in the long term. The events of 2017 punished insurers that had succumbed to the lure of premium growth in short tail lines with inadequate pricing. Beazley’s relatively strong performance in such a challenging year speaks to the resilience of our business model.
Strategic report
www.beazley.com Annual report 2017 Beazley 19
The events of late 2017 have since spurred material price rises in the classes of business directly affected. We saw reinsurance renewal prices climb by 3% for non-US business and 8% for US business in January 2018. Our property division, which derives 71% of its business from the US, saw prices overall rise by 6% with the biggest increases focused on the large risk business that we underwrite predominantly in London. In the marine market, premium rates for cargo business – the class most affected by the Atlantic storms rose by between 2.5%-5.0% in the last quarter of 2017.
It is too early to say how sustainable these price increases will prove to be. Much will depend on the continuing appetite of non-traditional capital providers, who shouldered some of the largest reinsurance losses.
In other areas we expect to see a decline in a practice that frequently undermines pricing discipline in a soft market – the subsidisation of unprofitable lines of business by profitable lines. Prior to last year, this underpinned the willingness of many insurers to countenance combined ratios of over 100% on their marine books, whilst catastrophe-related claims were low or non-existent. Now that offsetting profits from other short tail lines have disappeared, some upward adjustment in marine rates can be expected.
The same may prove true for some of the large risk business underwritten by teams within our largest division, specialty lines. The specialty lines division, which focuses on professional liability, management liability and cyber risks, has accounted for much of Beazley’s growth in recent years as margins on small and mid sized risks – much of it accessed by our underwriters in the US – have remained attractive. However aggressive competition from new entrants in areas such as large risk architects’ and engineers’ professional liability and medical malpractice for large US hospitals have held back our growth in these segments. This too may change as opportunities for cross-subsidisation diminish.
Across our five divisions, the balance of our underwriting portfolio continued to serve Beazley well in 2017. We were able to achieve growth of 11% in specialty lines on gross premiums written and, after a slow start to the year, our underwriters in the US delivered premium growth of 12% to write $778.0m (2016: $695.7m).
Specialty lines also significantly increased their contribution of prior year reserve releases by 77% to $121.4m (2016: $68.5m). Our consistent approach to reserving means that some distribution of prior year reserves for specialty lines business is often possible in excess of three years after the business was underwritten, by which time claims have largely been paid. The scale of these reserve releases was reduced by the elevated claims that we saw – and had expected to see – in the wake of the 2008 financial crisis; but with this period now well behind us, the contribution specialty lines should make to overall reserve releases is on the increase.
Looking ahead, we are budgeting for growth in all of our divisions in 2018, the first time this has been the case for over 10 years. Overall, we expect to reach double digit growth in 2018.
Growth initiativesOur approach to growth remains unchanged. We do not sacrifice profitability for growth. Instead we look for growth from three sources: increasing the flow of profitable business to our teams through brokers who know they can rely on Beazley for high quality service; designing new products to cater for our clients’ changing needs; and expanding geographically into new markets.
We pursued all of these growth strategies in 2017. A team within specialty lines under the leadership of Gerard Bloom focused on geographic growth in markets where Beazley has historically had a modest presence, including continental Europe, Canada, Latin America and parts of Asia. To facilitate this growth and that of other teams, we took two important steps.
In February 2017 we acquired Creechurch Underwriters, a Canadian managing general agency specialising in small and mid sized specialty business. And in July 2017 we received authorisation from the Central Bank of Ireland to underwrite business through a new Dublin-based insurance company, Beazley Insurance dac, broadening our access to business from continental Europe.
Our longstanding preference is for organic growth, but our purchase of Creechurch Underwriters was an exception that was not difficult to justify. We had supported the company with underwriting capital since its creation in 1996 and we knew the team extremely well. Now that we have a local presence in Canada, we see significant growth opportunities and have already begun to supplement the existing team with new underwriters focusing on media liability, cyber and environmental liability business.
In Europe, we opened a new office in Spain, expanded our office in Germany and plan to transact business for the account of Beazley Insurance dac through branches in those countries, as well as in the UK and France. Clients will have a choice of security: that of the insurance company, which enjoys passporting freedoms under European Union law, and that of our Lloyd’s syndicates.
In Asia and Latin America, we continue to focus on the growth opportunities available through regional hubs. Singapore has been playing such a role in Asia and Miami continues to grow in importance as a hub for Latin American business: we expanded our specialty lines teams in both locations in 2017.
Other divisions also targeted growth in geographies that, while not new to Beazley, were new for the products in question. Our marine division, the last Beazley division to establish a local presence in the US, began underwriting hull and liability cover for the marine and marine construction industries from our New York office in December 2017, targeting business not normally seen by our underwriters in London.
www.beazley.com20 Beazley Annual report 2017
Chief executive’s statement continued
Earlier in 2017 we also began writing large scale property business locally in the US on the same basis – a move that should stand us in good stead in the changed market conditions now prevailing.
All measures to grow internationally come with risk and they do not always pay off. In 2017 we closed the office in Dubai that we had opened in 2014 and sold the renewal rights to our Australian accident and health portfolio. In both instances we did not see the profit potential as large enough to warrant further investment. Crispin Hodges, who set up our Dubai office, has a strong track record of business development for Beazley in Asia and Europe and upon his return has taken up the position of international business producer as a cross division resource for our marine, political, accident & contingency and property divisions. Also members of our Australian accident and health team joined Blend Insurance Solutions, a Sydney-based Lloyd’s service company, which took over our local portfolio.
Product innovation is another important source of growth in the specialist markets in which Beazley operates. Our track record in this area is strong and we continued to expand our product range in 2017. We have seen particularly strong demand in the US for our Virtual Care product, launched in July 2017, which addresses the wide range of risks affecting both healthcare and technology companies in the fast-growing telemedicine market.
Sometimes product adaptation can be as important as pure innovation. In November, we relaunched our market-leading cyber product for small and mid sized businesses, Beazley Breach Response (BBR). When the product was first launched in 2009, the strongest demand was for liability cover and breach response services following the loss or theft of large numbers of customer records. This need has not gone away, but recent cyber attacks have sensitised other organisations, such as manufacturers, to the operational risks they face. The new BBR offers far broader protection against first party risks such as business interruption.
Given the depth of our experience, the cyber market continues to afford strong growth opportunities for Beazley. This spring the European Union’s General Data Protection Regulation will come into force, continuing a process through which data regulation outside the US has been catching up with – and in some respects exceeding – the stringency of US regulation. Beazley’s product range is adapted to the needs of clients of all sizes and in all industries.
All of our business at Beazley is sourced through brokers and, even when we are not offering new products or expanding geographically, we can rely on brokers to show us attractive business in our specialist lines. Our brokers continue to rate our teams highly for service – both in underwriting and claims – and we strive to maintain their confidence and that of their clients. In most of the markets in which we do business, there remains significant headroom for growth, providing pricing levels are attractive – as in many cases they are now becoming.
We are also exploring writing a portfolio of facilities business through a newly created syndicate, syndicate 5623. This syndicate will be backed mainly by third party capital and is expected to deliver returns with lower volatility.
Investment performanceBeazley’s profitability in 2017 was supported by a very strong investment performance. Our financial assets returned $138.3m, or 2.9% (2016: $93.1m, 2.0%). Signs of strength in the global economy helped equities and corporate credit exposures to rally strongly throughout much of the year, generating good returns on these elements of our portfolio. However, expectations of higher US interest rates led to rising yields later in the year, adversely impacting the value of our bond exposures.
We restructured our fixed income investments in 2016, adopting additional credit exposures, and this proved helpful in 2017 as declining credit spreads generated additional value. As a result, our core portfolio returned a respectable 1.6% (2016: 1.5%), despite rising yields in the final months of the year. Our capital growth investments produced a particularly strong return, at 11.0% (2016: 5.6%), driven by equities, to which we added during the year. We kept a focus on emerging markets, which performed particularly well in 2017.
Risk management2017 was our second year of operating within the new Solvency II regime with our internal model approved by the Central Bank of Ireland. During this period we have seen the work undertaken by the capital modelling team in the pre-application stages pay off. As our chief risk officer Andrew Pryde explains on page 56, we have in place a capital model which reflects the reality of the business and can be used across the group to support business processes and inform the board on how risk is changing. We have continued to use an external consultancy to provide independent challenge and to support the production of a detailed validation report to the board.
Although risk appetite is established with reference to earnings volatility, there are a number of risks that do not necessarily have an immediate financial consequence but which are taken into account by our processes. Reputational risk is one example. The qualitative risk appetite statements first introduced in 2015 have helped business functions prioritise activity within their teams to ensure that all parts of the business operate as the board expects.
The latest chief risk officer report to the board confirmed that the control environment has not identified any significant failings or weaknesses in key processes and that Beazley is operating within risk appetite as at 31 December 2017.Investment return
2.9%

Strategic report
www.beazley.com Annual report 2017 Beazley 21
Board changesIn October 2017, we announced the appointment of David Roberts as a non-executive director. David has been chairman of Nationwide Building Society since July 2015 and during his career has served as an executive director at Barclays Bank and deputy chairman at Lloyds Banking Group. He will take up the position of non-executive chairman following the annual general meeting in March 2018, succeeding Dennis Holt who will step down from the board having served two full three year terms as chairman.
Dennis took on the role of non-executive chairman in March 2012. During his tenure, Beazley has achieved premium growth of 37% in often challenging market conditions, an average return on equity of 17%, and ordinary dividend growth of 5-6% annually.
During this period, the board has benefited enormously from his sound judgement and guidance, and his influence has been widely felt and appreciated across the company. The antithesis of an ivory tower chairman, Dennis has engaged consistently with colleagues at all levels within the organisation, always looking for ways in which we can build on our successes and learn from our failures. We are immensely grateful to him.
Clive Washbourn also stepped down from the board in 2017 but will remain an important part of the executive committee heading up our marine division. I am very grateful for Clive’s contribution to the board and am delighted we will continue to benefit from Clive’s expertise through the executive committee. OutlookSome variations in profitability, year on year, should be expected in a business such as ours that specialises in assuming the risks of others. However over the years we have built a portfolio that is expressly designed to cushion the shocks that will inevitably occur from time to time in individual lines of business. As such we were able to obtain an average combined ratio of 99% across all divisions.
Our business model should, equally, prove well adapted to the more favourable market conditions now prevailing. Our underwriters have shown patience and discipline through a difficult period during which the supply of capital in many parts of our market significantly outstripped demand, resulting in steadily falling prices. Through this period we have continued to invest in talent and today we employ 117 more underwriters than we did in 2011, the last year in which premium rates were significantly affected by catastrophe losses.
Looking ahead, the expertise and dedication of our underwriters will be a necessary but not sufficient condition for profitable growth. We are also looking to our technology and operations teams to enhance our underwriters’ productivity and ensure they have the data they need to make well informed decisions.
Also, as in 2017, we will continue to rely heavily on the preparedness of our claims teams to redeem the promises that our underwriters have made.
The breadth of our expertise in all these areas means that we can innovate in ways that benefit our clients and our brokers but without necessarily assuming more underwriting risk. Insurance is, for the most part, a complicated, jargon-laden business and anything we can do to make our clients’ lives simpler and easier is likely to be rewarded with increased loyalty. This is particularly true of small business clients that do not employ professional risk managers. Last year we simplified and streamlined our data breach product, BBR, while expanding the cover offered. We are committed to providing ‘beautifully designed insurance’ across our product range and see considerable scope for further simplification of policies and processes.
A well established design precept is sometimes expressed as ‘what you see is what you get’, meaning that there should be no mismatch between the way in which a product or service is sold and the way in which it performs. It is a precept we have long sought to apply at Beazley in relation to all of our stakeholders. Today’s world offers enough surprises: we have no desire to add to them.
In a catastrophe year such as that of 2017, a short term reduction in profits is inevitable. However, with appropriate cycle management and a balanced portfolio of business, the temporary reduction in profits can be minimised before deploying resources to take advantage of improving underwriting conditions.
Andrew HortonChief executive
7 February 2018

www.beazley.com22 Beazley Annual report 2017
Q&A with the chief executive
Andrew HortonChief executive
Q – How would you rate the performance of the insurance industry in responding to the massive damage and disruption caused by storms, earthquakes and wildfires in 2017?Generally speaking, we did well. By the end of November Lloyd’s reported that around $2bn had been paid out by the Lloyd’s market, of which we’re proud to be a part, to help people rebuild in the US, the Caribbean and Mexico. Enhanced satellite imagery is speeding the settlement of claims.
One weak area remains the lack of coverage for flood damage in the US. According to data collated by the US Federal Emergency Management Agency (FEMA), only 17% of homeowners in the eight counties most directly affected by Hurricane Harvey had flood insurance policies. That of course is a matter of individual choice, but our industry could do a better job in helping people understand the risk. Houston, as has been frequently said, has been visited by three one-in-500 year storms in three years.
Q – Premium rates for US catastrophe-exposed business have reacted to last year’s events. How sustainable do you expect these adjustments to be?Capital has been flowing ever faster into insurance markets in the wake of major catastrophes for many years now, turning what used to be a plateau of higher rates into more of a peak. However the wild card this time will be the attitude of non traditional capital providers, such as pension funds, a number of whom sustained heavy losses last year. We still do not know to what degree they will reload. That could have a major bearing on the levels at which prices settle.
Q – In 2017, 41 cents in every dollar Beazley received in premiums went to pay expenses, of which distribution costs were by far the largest component. How can the insurance industry become more efficient?We launched a new Beazley syndicate in 2017 (which will start underwriting in 2018) with one aspect of this issue in mind. We see broker facilities – in which syndicates agree to write an entire book of business – as a much more efficient way of providing follow capacity than a broker going from syndicate to syndicate to complete the slip. We are keen to encourage efficiency in the Lloyd’s market and win a share of this business, which doesn’t clash with the ability of our existing syndicates to select and lead individual risks.
We accordingly launched syndicate 5623 to write a portfolio of facilities supported by external investors with a lower cost of capital. It will, we expect, deliver lower returns and lower volatility than our existing syndicates, which are backed by our own capital. Our own syndicate 3623 will underwrite the facilities and then reinsure them to syndicate 5623. Beazley will retain 25% of the portfolio directly through 3623 as well as having a share of 5623, providing capital through a Beazley corporate member.
Andrew Horton reviews Beazley’s performance and describes the risks and opportunities he foresees in 2018

Strategic report
www.beazley.com Annual report 2017 Beazley 23
Overall, I believe that the costs associated with transacting insurance remain too high, and we hope syndicate 5623 will help lead to a reduction in these costs of doing business in London and, therefore, a widening of our market’s underwriting appetite.
Q – How do you see technology, including new sources and uses of data, changing Beazley’s business in the next five years?Every year our operations get more efficient through the use of technology. In five years’ time we should have significantly expanded the availability of our products available on e-trading platforms. We also plan to harness advances in technologies such as natural language processing and robotics to eliminate much of the low complexity manual intervention in the end-to-end underwriting and claims process. Improvements in the way we capture our data, and access to previously untapped data sources – for example from social media or the internet of things – present us with opportunities to make more informed underwriting and claims decisions, more quickly. Finally, as a leading insurer of technology and the technology industry, all of this change should create new opportunities for us to grow.
Q – The economic fundamentals of the European Union look stronger today than at any time in recent years. How important are European markets to Beazley?Today, Europe is not a major market for us. Tomorrow, we hope, it will be much more important. At present about 15% of our total business derives from Europe and 4% from the EU excluding the UK. We have plans to grow this business significantly in the years ahead, particularly for our specialty lines products, and we have been actively hiring talent during 2017. We see strong demand for cyber, management liability and medical malpractice insurance in Europe and we believe that financial institutions in particular will value our products and expertise. We do not expect Brexit to be an impediment to European growth: we will access business after Brexit both through Lloyd’s and through our new Dublin-based insurance company, which was authorised in 2017.
Q – Reserve releases contributed strongly to Beazley’s pre-tax profits in 2017. Can we expect substantial releases to continue?Beazley concentrates on setting reserves consistently over time. If our initial opening reserves are set in a consistent way with a margin for prudence, then, all other things being equal, we’ll continue to see the same levels of reserve release, although there may well be a slight dip in 2018 as we start the year with the margin at the bottom of the range we target following the 2017 catastrophe events.
One of Beazley’s great strengths is our presence in a wide range of different specialist markets driven by different cycles and trends. Whilst the total reserve release at Beazley is very consistent, the teams that contribute the most can change quite markedly over a period of two or three years.
Q – Do you expect the recent reforms of US taxation to affect Beazley? The over-riding objective of these reforms is to stimulate the US economy. If they are successful this should be good for Beazley, as the US is our largest market and it may also cause US interest rates to rise which will boost our investment earnings. There are aspects of the legislation that affect companies that are doing business in the US using structures that involve overseas companies, but we do not expect those to have a significant effect on Beazley.
Q – Is the reinsurance that Beazley buys for itself going to be much more expensive following the catastrophes in 2017?The results of our reinsurers have generally been excellent which is testament to our philosophy of underwriting for profit gross of reinsurance. Quite a lot of our reinsurance is purchased on a proportional basis and so our reinsurers will share any price increases we get. On the non proportional side we have to expect some increases, but the 2017 events didn’t hit our cover very hard, so hopefully nothing too significant.
Q – What keeps you up at night?Generally I sleep very well! I am concerned, however, at the stubbornly high costs of our industry’s products, which are fuelled, I believe, by inefficient ways of doing business. We should be giving more back to our clients in claims and we cannot do that because our costs for writing and placing insurance are too high.
The thing that definitely does not keep me up at night is the money that we pay out to our clients for claims. I find it odd when people commiserate with me over heavy claims. It is why we’re in business and – more than that – it’s why I’m proud to be in the insurance business.

www.beazley.com24 Beazley Annual report 2017
Chief underwriting officer’s report
Diverse portfolio delivers underwriting profit
Neil MaidmentChief underwriting officer
In a year defined by a high incidence of natural catastrophe events, Beazley delivered a creditable underwriting performance achieving a combined ratio of 99% (2016: 89%) on gross premiums written of $2,343.8m (2016: $2,195.6m).
The combined cost to the insurance industry of Hurricanes Harvey, Irma, Maria, the Mexican earthquakes and the California wildfires is estimated to be around $100bn. The loss to Beazley arising from these events, net of reinsurance, is expected to be between $200m to $300m, with the majority of the impact being felt in our property and reinsurance divisions. Our balanced portfolio, which has underpinned our consistent underwriting performance in recent years, meant we were able to weather the events of 2017, while continuing to support our insureds who have been affected.

Strategic report
www.beazley.com Annual report 2017 Beazley 25
Given the level of insured natural catastrophe losses during the year, we were pleased to report a positive underwriting result. This result was driven by a number of factors. In particular, we have benefited from the fact that our largest division, specialty lines, was largely unaffected by these natural disasters. We have also benefited from effective cycle management over the past few years, reducing our exposure to catastrophe business, with our risk budget decreasing from $574m in 2013 to $370m in 2017.
Rating environmentThe rating environment in 2017 once again proved to be challenging, with an average decrease in rates of 1% (2016: decrease 2%). Most of our lines of business saw decreases in rates compared to 2016, with political, accident & contingency experiencing rate decreases of 4%, marine decreasing by 3% and reinsurance rates decreasing by 2%. Rates on renewals in the property and specialty lines divisions remained stable compared to 2016.
With the claims activity seen in the second half of the year, market rate increases across a number of lines of business are expected in 2018.
Premium retention ratesIn 2017, we were able to maintain a strong retention of business from existing clients and brokers. We believe that being able to work with clients and brokers for a number of years has enabled Beazley to provide coverage which was sustainably priced while still covering the insureds’ needs.
The table below shows our premium retention rates by division compared to 2016:
Retention rates1 2017 2016Marine 88% 87%Political, accident & contingency 79% 79%Property 82% 81%Reinsurance 85% 85%Specialty lines 84% 84%Overall 84% 83%
1 Based on premiums due for renewal in each calendar year.
We would generally expect to experience some level of volatility between individual divisions, however, we are pleased that our overall premium retention rate remains broadly in line with our five year average.
Divisional commentaryIn 2017, specialty lines once again delivered strong growth, achieving an 11% increase on 2016 with premiums of $1,292.2m (2016: $1,159.8m). Profit increased to $227.4m (2016: $133.9m), partly driven by the prior year reserve releases which increased from $68.5m to $121.4m while the combined ratio improved to 89% (2016: 93%).
Premiums written by our underwriters based locally in the US increased to $778.0m (2016: $695.7m). Despite strong growth in recent years, we continue to see opportunities and our US business remains a key area of focus for us as we move into 2018.
Cumulative renewal rate changes since 2008 (%)
08 09 10 11 1612 13
■ Marine■ Property
■ Specialty lines■ Reinsurance
■ Political, accident & contingency■ All divisions
Underwriting year
Rate change
14 15708090
100110120
17

www.beazley.com26 Beazley Annual report 2017
In 2017 our specialty lines international strategy, led by Gerard Bloom, laid the foundations for the future with the acquisition of a Canadian managing general agent, Creechurch Underwriters, as well as the conversion of our Irish reinsurance company to an insurance company, Beazley Insurance dac, which has licences to write throughout the EU. On the back of this conversion we have created strategic hubs in the UK, France, Germany and Spain and we expect that in 2018 business written through these offices will begin to complement our well established US operations.
Demand for our cyber product continues to increase and in 2017 we were pleased to relaunch our Beazley Breach Response (BBR) product in the US to address growing demand for robust first party cover. Our offering of BBR, alongside our Beazley InfoSec product and our Vector partnership (a large scale cyber risk facility offering capacity up to $100m) with Munich Re, means that Beazley is a market leader in cyber insurance, able to leverage a depth of expertise within the team.
Chief underwriting officer’s report continued
Our reinsurance division achieved a break-even result despite heightened catastrophe activity. Its combined ratio increased to 107% (2016: 65%) on gross premiums written of $206.8m (2016: $213.4m) with net insurance claims increasing to $97.5m (2016: $40.2m). Over the last 10 years we have enhanced our access to business globally with underwriters in Munich, Paris, Singapore, Shanghai and Miami complementing our team in London. The improved balance of the portfolio, alongside active management of our risk appetite, helped mitigate the effect of the losses in 2017.
Our property division experienced its most active year for catastrophe losses since 2011. Hurricanes, earthquakes and wildfires all affected the US and Central America in the second half of the year, contributing to a combined ratio of 130% (2016: 87%) on gross premiums written of $362.9m (2016: $329.7m).
We continue to look for areas to grow our property business and in 2017 we achieved this in both the US and the UK. In the US, we expanded our local presence by increasing our large risk underwriting capabilities, while outside the US we continued to grow our specialist property lines such as jewellers’ block, fine art and specie, and our small business unit. As has been the case for many years, we remain focused on managing a balanced and diverse book of business.
In 2017 we combined our political risk & contingency division and our life, accident & health division to form a new division: political, accident & contingency (PAC). Through the newly created division, headed up by Christian Tolle, we see potential for a number of cross selling opportunities between several of these classes of business.
Our newly created division took the difficult decision to close its Australian operations in 2017 which, alongside an uptick in claims in our political and contingency teams, contributed to a reduction in profits to $7.9m (2016: $27.6m). Our plans for 2018 include growing our accident and health business in the US, under the leadership of Brian Thompson, and exploiting some of the cross selling opportunities between the division’s various product lines.
Our marine division has experienced tough underwriting conditions over the past few years and 2017 was no exception. Overall, our marine division wrote gross premiums of $267.6m (2016: $247.4m) and achieved a combined ratio of 98% (2016: 90%). 2017 saw the launch of our US marine business, led by Stephen Vivian. We see potential to expand our US liability and hull business through local underwriters accessing business which generally would not be seen in London.

Strategic report
www.beazley.com Annual report 2017 Beazley 27
OutlookAfter a sustained period of low catastrophe activity, the insurance industry experienced one of the most costly years for natural disaster losses on record in 2017. Beazley’s 2017 result benefited from our balanced business model and our active risk appetite management, leaving us well placed to benefit from any improvement in market conditions in 2018. We have already seen rate increases in the latter part of 2017 and early 2018 across our property and treaty books as the market recalibrates its pricing of catastrophe exposed risks.
We also see continued opportunities for profitable growth in specialty lines in 2018, with further development of our US platform and the first full year of operation for our international business.
While market conditions may improve across some of our product lines in 2018, Beazley’s core underwriting philosophy remains stable. Our underwriting approach of exercising discipline across a diverse portfolio of specialist insurance products, particularly in lines of business where competitive pressures are strongest, will remain a key component of our underwriting strategy. This strategy has delivered an underwriting profit in difficult market conditions during 2017 and we are confident that we are well placed as we move into 2018.
Neil MaidmentChief underwriting officer
7 February 2018

0
50
100
150
■ Claims ratio ■ Expense ratio
43
55
46
44
2017 2016
Combined ratio %
2017$m
2016$m
Gross premiums written 267.6 247.4Net premiums written 233.2 220.7Results from operating activities 19.3 34.5Claims ratio 55% 44%Expense ratio 43% 46%Combined ratio 98% 90%Rate change (3%) (7%)
0
50
100
150
■ Claims ratio ■ Expense ratio
50
51
46
45
2017 2016
Combined ratio %
2017$m
2016$m
Gross premiums written 214.3 245.3Net premiums written 190.8 215.6Results from operating activities 7.9 27.6Claims ratio 51% 45%Expense ratio 50% 46%Combined ratio 101% 91%Rate change (4%) (4%)
Find out more page 30 Find out more page 32
www.beazley.com28 Beazley Annual report 2017
Performance by division
Balanced portfolio leads to overall underwriting profit in active catastrophe market
Marine Political, accident& contingency
Clive WashbournHead of marine
Christian TolleHead of political, accident & contingency

0
50
100
150
■ Claims ratio ■ Expense ratio
44
86 47
40
2017 2016
Combined ratio %
2017$m
2016$m
Gross premiums written 362.9 329.7Net premiums written 300.0 277.1Results from operating activities (68.3) 51.5Claims ratio 86% 40%Expense ratio 44% 47%Combined ratio 130% 87%Rate change – (4%)
0
50
100
150
■ Claims ratio ■ Expense ratio
36
71 36
29
2017 2016
Combined ratio %
2017$m
2016$m
Gross premiums written 206.8 213.4Net premiums written 134.6 141.2Results from operating activities 3.8 60.9Claims ratio 71% 29%Expense ratio 36% 36%Combined ratio 107% 65%Rate change (2%) (4%)
0
50
100
150
■ Claims ratio ■ Expense ratio
39
50
37
56
2017 2016
Combined ratio %
2017$m
2016$m
Gross premiums written 1,292.2 1,159.8Net premiums written 1,120.2 999.4Results from operating activities 227.4 133.9Claims ratio 50% 56%Expense ratio 39% 37%Combined ratio 89% 93%Rate change – 1%
Strategic report
www.beazley.com Annual report 2017 Beazley 29
Property Reinsurance Specialty lines
Mark BernackiHead of property
Patrick HartiganHead of reinsurance
Adrian CoxHead of specialty lines
Find out more page 34 Find out more page 36 Find out more page 38

Marine
www.beazley.com30 Beazley Annual report 2017
Gross premiums written
$267.6m
Portfolio mix
Liability 25%Cargo 21%Hull & miscellaneous 20%Energy 16%War 8%Aviation 7%Satellite 3%
0
70
140
210
280
350
20172016201520142013
315.9 325.2
269.3247.4
267.6
Gross premiums written ($m)
Clive WashbournHead of marine
Competition in the lines of business transacted by the marine division intensified further in 2017, leading to a combined ratio of 98% (2016: 90%) on gross premiums written of $267.6m (2016: $247.4m).

Strategic report
www.beazley.com Annual report 2017 Beazley 31
The exceptional string of storms that buffeted the Caribbean and south eastern coast of the US in August and September 2017 resulted in substantial cargo and pleasure craft losses, neither of which significantly affected Beazley. Despite this, net insurance claims still increased by 26% in 2017 to $124.7m (2016: $98.9m). For the marine market as a whole, the practice of subsidising underperforming marine lines with profits from other lines of business may now become less feasible in the wake of large industry-wide catastrophe losses.
Renewal rates for marine and energy risks at the beginning of 2018 suggest that a period of more disciplined underwriting may indeed be beginning.
A focus on disciplined underwriting is not new to our team. In recent years our strategy has also included diversifying our book into new lines of business and niches. This can continue to offer profitable opportunities when market conditions in our historical lines are severely depressed.
Pricing in the marine hull and machinery market remained exceptionally competitive throughout 2017 – an indication, as in previous years, of too much insurance capacity chasing too few ships. Rates in the war risks market also continued their downward trajectory. The waters off Yemen, Libya and Nigeria are now among the world’s most dangerous but demand for cover is far lower than it was in the sea lanes off the horn of Africa in the earlier years of this century.
In the cargo market, we underwrite both a global account out of London and a UK account from the regional offices located in Ipswich, Manchester, Leeds and Birmingham. Premiums for our UK account have continued to build, rising 30% to $18.6m in 2017. For global business we have found the terms of many of the broker-led market facilities that have proliferated in recent years unattractive. Some of these were only marginally profitable prior to the recent catastrophes.
Our marine liability account performed well in 2017. The team, led by Phil Sandle, provides liability cover for shipowners and a wide variety of marine and other businesses. In the US, we write a substantial trucking account in Texas through a Lloyd’s coverholder. We see some potential to expand our US liability and hull business through local underwriters accessing business that would not normally come to London.
Market conditions for our energy business remained very challenging in 2017. This business is naturally sensitive to the price of oil, which at recent levels has led to many rigs standing idle. However more efficient drilling techniques are changing the economics of the industry and may stimulate stronger demand for insurance. This would also benefit our team focusing on insuring sub-sea equipment, much of which is used for energy exploration and exploitation.
Our aviation team saw a spike in claims activity earlier in the year, which has now normalised. The aviation market remains exceptionally competitive, a tendency our team counteracts by focusing on smaller, hard to place risks that command higher premiums.
Our satellite book performed well in 2017, avoiding some substantial losses on risks that our underwriter, Denis Bensoussan, had seen but had declined to underwrite.
The quality of our underwriting and the strength of our claims service have long distinguished Beazley’s marine team. We continued to hire highly experienced individuals with exceptional track records. In 2017 we welcomed Stephen Vivian and John Moy in New York to focus on the development of our US business and Richard Young in London, who joined our hull team.

www.beazley.com32 Beazley Annual report 2017
Political, accident & contingency
An upsurge in political risk, terrorism and contingency claims reduced profits for Beazley’s political, accident & contingency (PAC) division in 2017. The division – created through the merger of the political risk & contingency division with the life, accident & health division – recorded a combined ratio of 101% (2016: 91%) on gross premiums written of $214.3m (2016: $245.3m).
Christian TolleHead of political, accident & contingency
Gross premiums written
$214.3m
Portfolio mix
Political 23%Contingency 18%PA direct 16%PA reinsurance 15%Stand alone terrorism 14%Life direct 9%Sports 3%Life reinsurance 2%
200
210
220
230
240
250
260
19020172016201520142013
231.5
255.4
243.4 245.3
214.3
Gross premiums written ($m)
Strategic report
www.beazley.com Annual report 2017 Beazley 33
The division writes political risks, terrorism and contingency business (the latter predominately event cancellation risks) from offices in London, New York, Paris and Singapore. London is currently the focus for all of our life business, through a dedicated Lloyd’s life syndicate, and most of our current accident and health business. Nevertheless we see substantial growth opportunities for our accident and health team in the US.
Our political risks team, led by Roddy Barnett, saw its heaviest claims since 2008. Our political risk underwriters take large lines – typically up to $20m – on carefully evaluated risks which unfortunately did not generate the strong returns in 2017 that had been seen previously. This was due to negative developments on risks from prior years.
Claims for property damage following terrorist attacks have also been subdued in recent years, although the attacks on Brussels airport in March 2016 were an exception, with significant property damage alongside the unfortunate loss of life.
Contingency claims also rose in 2017 due to the cancellation of a number of events following the devastation wrought by Hurricanes Harvey, Irma and Maria in the US in August and September.Our business exists to pay claims and the events that impacted our results in 2017 were also an opportunity for our claims teams to reinforce the value of the Beazley policy. A survey of brokers specialising in contingency insurance conducted in the second half of the year showed that those brokers who had direct experience of our claims service rated us more highly than those that did not (both categories rated our service highly, however). This came as no surprise.
Market conditions for our life, accident & health team in London continued to prove challenging last year, with competition depressing premium rates. We saw rates on this business fall by 3% in the course of the year, following rate declines in 2016 and 2015.
In May we made the difficult decision to withdraw from the Australian market, selling the renewal rights to our local accident and health business to Blend Insurance Solutions, a Sydney-based Lloyd’s service company. The team in Australia had worked hard to expand our group personal accident business, moving away from unprofitable superannuation fund accounts, but we did not see sufficient scope for growth in this market to warrant continued investment.
In May, we were delighted to welcome Brian Thompson to head our US accident and health team. Our focus in the US remains on the sale of supplemental medical products to help employees enhance the cover their employers provide under high deductible benefit plans. This market continues to grow in line with the growing burden of healthcare costs on American employers.
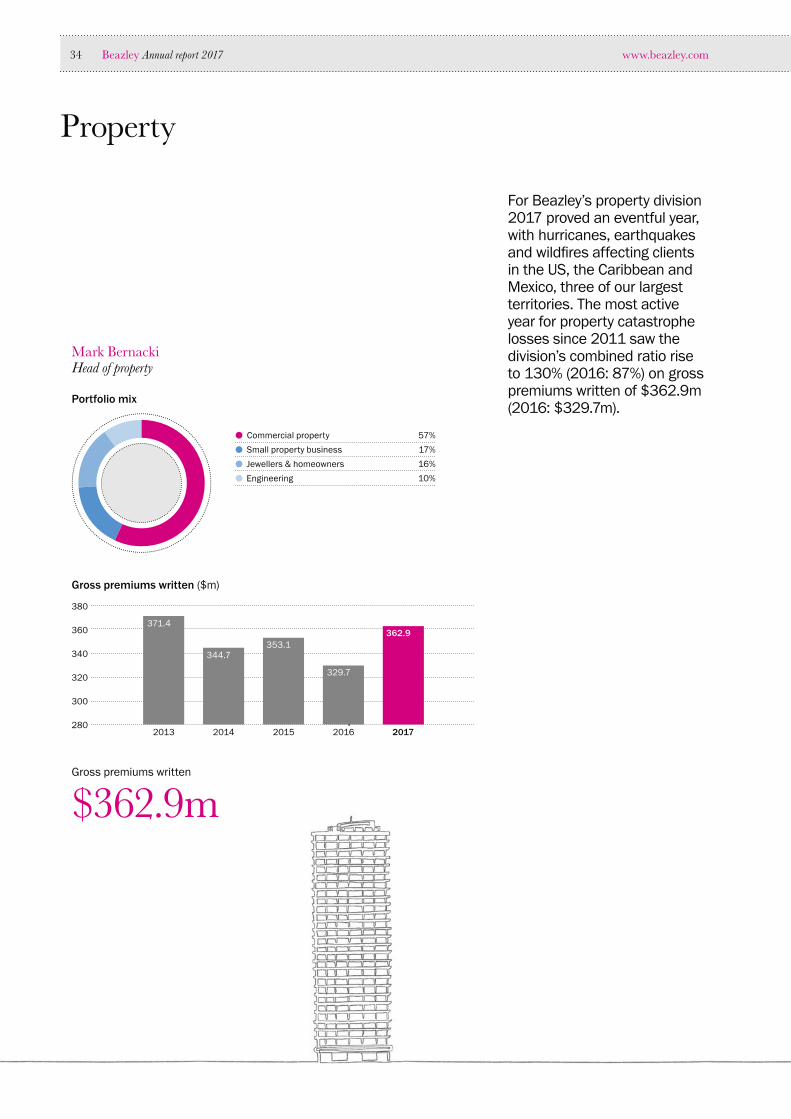
www.beazley.com34 Beazley Annual report 2017
Property
For Beazley’s property division 2017 proved an eventful year, with hurricanes, earthquakes and wildfires affecting clients in the US, the Caribbean and Mexico, three of our largest territories. The most active year for property catastrophe losses since 2011 saw the division’s combined ratio rise to 130% (2016: 87%) on gross premiums written of $362.9m (2016: $329.7m).
Mark BernackiHead of property
Gross premiums written
$362.9m
Portfolio mix
Commercial property 57%Small property business 17%Jewellers & homeowners 16%Engineering 10%
280
300
320
340
360
380
20172016201520142013
371.4
344.7353.1
329.7
362.9
Gross premiums written ($m)

Strategic report
www.beazley.com Annual report 2017 Beazley 35
For Beazley, the financial impact of the losses was within expectations. Crucially for our clients, our claims team had meticulously prepared for such scenarios. These preparations, described on pages 11 to 13, ensured we were able to provide the supportive claims service our policyholders have the right to expect, whether they be large or small businesses or homeowners. As at the end of the year the property division had already disbursed $41.2m in advance payments to help our clients begin repairs.
The impact of the events on pricing in the market has been material, partly because prices had fallen so low in the relatively benign catastrophe environment over the last decade. Renewal rates on our large risk property book underwritten at Lloyd’s rose 6% at the beginning of 2018. We have seen similar rate rises on our smaller property book, written on a surplus lines basis locally in the US.
We are a specialist insurer with individual risk selection and pricing at the heart of our business. We will not therefore be applying blanket rate rises of equal size to all accounts and will continue to recognise and reward high quality clients.
Stronger prospective margins have prompted us to review our underwriting appetite for 2018. However for our open market large risk property team in London, 2017 was a challenging year with rates falling 2% at January 1 renewals, reflecting a continuation in the pricing declines we had seen in previous years. The profitability of our book was materially stronger than the Lloyd’s market average, but to achieve this we had to turn down a growing volume of risks that did not meet our requirements.
In April, we extended our large risk property underwriting capabilities to the US in order to obtain access to business that we were not seeing in London. London will continue to be the main focus for our large risk property business with Simon Jackson retaining global responsibility for this segment. In the past, Beazley has found that the flow of US risks to our London underwriters has continued to grow in tandem with the development of our locally underwritten US business, and we expect that this will also prove the case for large property risks given the stronger demand now in evidence.
In the US, our commercial property team and our homeowners’ team both performed well in 2017, achieving premium growth of 7% and 13% respectively in a challenging market. We were delighted to welcome Joe Morrello back to Beazley at the beginning of the year to lead both teams. We underwrite US business on a surplus lines basis, focusing on risks that are not normally attractive to the standard, or ‘admitted’ market. Our clients and brokers value speed of service, both in underwriting and claims, which we were able to demonstrate in 2017.
In London, we saw growth of 74% in 2017 in specialist property lines such as jewellers’ block, fine art and specie under the leadership of Simon Aitchison. Our small business unit, led by Paul Bromley, grew 21% to $121m, supported by accounts that came to us through our acquisition of Creechurch Underwriters in Canada. Most of the business this team underwrites is sourced from Lloyd’s coverholders, with whom we have strong long term relationships, but we avoided the US flood risks that made coverholder business a source of large losses to some Lloyd’s syndicates in 2017.
Our last major line of business – construction and engineering – saw a decline in demand in Singapore in 2017, where we underwrite risks through the Lloyd’s construction consortium. However, the consortium, which is active in London as well as Singapore, expanded to six syndicates in the course of the year and is now a well recognised lead market for the largest construction risks. As tightening capacity brings rate rises for these large complex risks, our team, led by Colin Rose, should be well positioned.
Overall, we expect market conditions and margins to improve in 2018, which will positively impact most of our trading teams.

www.beazley.com36 Beazley Annual report 2017
Reinsurance
A tumultuous year for reinsurers resulted in a sharp increase in the combined ratio of Beazley’s reinsurance division, to 107% (2016: 65%) on gross premiums written of $206.8m (2016: $213.4m). However, a combined ratio of 107% is still a good performance in such conditions and was possible because of the balance of the portfolio, which is actively managed.
Patrick HartiganHead of reinsurance
Gross premiums written
$206.8m
Portfolio mix
Property catastrophe 70%Property risk 17%Korean Re 8%Miscellaneous 4%Casualty clash 1%
20172016201520142013
221.6
200.8 199.9
213.4
206.8
Gross premiums written ($m)
195
200
205
210
215
220
225
190

Strategic report
www.beazley.com Annual report 2017 Beazley 37
The impact of catastrophe losses in the US and Mexico was mitigated by the steps we have taken in recent years to diversify our book geographically. A little over half of our business now derives from US cedents, down from 66% a decade ago. Outside the US, our European and Asian books performed well in 2017.
However, we remain committed to supporting our US cedents and to retaining a strong presence in the world’s largest reinsurance market. In the weeks following Hurricanes Harvey, Irma and Maria, we advanced substantial funds to US insurers who were, themselves, under pressure to respond swiftly to clients’ claims. We did the same in the wake of the wildfires in California in October.
All of these were material events for the reinsurance market. Current estimates of the total insured cost of the 2017 Atlantic hurricane season stand between $90bn and $95bn. The two Mexican earthquakes are expected to cost insurers between $2.5bn and $5bn, while the Californian wildfires, which destroyed or damaged more than 14,000 homes, are expected to add a further $10bn to the total insurance bill. These events contributed to an increase of $57.3m to the division’s net insurance claims in 2017.
Losses from these events all fell within our expectations and provided an opportunity for the traditional reinsurance market to demonstrate its value and staying power.
As a result, we saw rate rises of 5% on average on renewal business at the beginning of 2018. We plan to increase our underwriting by 3% for non-US business and 8% for US business in the course of 2018, reflecting the improved margins now available.
Looking ahead, it is possible that the events of 2017 will accelerate changes in the pattern of demand for reinsurance as well as supply. The impact of this year’s storms has refocused attention in the US on the heavy public subsidies which are currently required to maintain the National Flood Insurance Program and the potential partnership role that private sector insurance and reinsurance could play in providing sustainable cover in the future.

www.beazley.com38 Beazley Annual report 2017
Specialty lines
Specialty lines, Beazley’s largest division, delivered strong growth in 2017, writing gross premiums of $1,292.2m (2016: $1,159.8m). The division’s most developed geographic market – the US – continued to perform well, while we moved to capitalise on the growing demand for our products in Canada, Europe, Asia and Latin America.
Specialty lines encompasses a diverse portfolio of management liability, professional liability and cyber insurance business, underwritten for companies and professional services firms of all sizes around the world. Our London underwriters tend to mainly focus on large risks, whereas underwriters elsewhere – and particularly in the US – focus more on small and mid sized risks.
We do not expect to see material spill over effects in specialty lines from the large scale catastrophe-related claims that other lines of business experienced in 2017. Nevertheless, the market may show less tolerance for underpricing in our lines, where competition for US business has been particularly acute and the claims environment has deteriorated. These include commercial directors’ and officers’ (D&O) insurance and some large professional liability business.
As has been the case for several years now, we saw better margins, and the most attractive growth opportunities, in smaller scale business in 2017. Our acquisition in February of Creechurch Underwriters, a Canadian managing general agency focusing on small business, expanded our access to this business in North America.
Adrian CoxHead of specialty lines
Gross premiums written
$1,292.2m
Portfolio mix
Technology, media & business services 27%Management liability 18%Small business 17%Professions 16%Healthcare 12%Treaty 8%Crime 1%International financial lines 1%
020172016201520142013
829.8 895.71,015.2
1,159.81,292.2
Gross premiums written ($m)
200
400
600
800
1,000
1,200
1,400

Strategic report
www.beazley.com Annual report 2017 Beazley 39
Beazley maintains a consistent approach to reserving, which means that prior year reserve releases from years with relatively benign claims experience can make a significant contribution to our profits. This proved to be the case in 2017, with reserve releases from recent underwriting years increasing to $121.4m (2016: $68.5m). The more difficult years, from a claims perspective, immediately following the 2008 credit crunch are now well behind us.
Demand for cyber insurance, both in the US and around the world, continued to grow in 2017 and Beazley benefited from the depth of our expertise and the quality of our products in this market. In November we relaunched our market-leading Beazley Breach Response (BBR) cyber product in the US to address growing demand for robust first party cyber cover from small and mid sized US businesses. In the years after BBR was first launched in 2009, the main driver of demand for cover was third party liability for data breaches and the onerous regulatory requirements governing how breaches must be handled. These factors still weigh heavily, but the risk of production stoppages from cyber attacks – particularly ransomware attacks – has recently grown. We relaunched BBR to provide 360° protection for the full array of cyber risks that now concern our clients.
For larger clients, we continue to offer robust cyber cover through our Beazley InfoSec product. And, for the world’s largest enterprises, our Vector partnership with Munich Re affords fully customised cover for each organisation. Working closely with Munich Re, we have been instrumental in helping clients build some of the highest ‘towers’ of cyber coverage seen in today’s market. Moving steadily closer to $1bn, these towers reflect the scale of cyber risk as perceived by multinational corporations.
Growing international demand for cyber cover is one of the trends that prompted us, early in 2016, to develop plans to accelerate the growth of our international business outside the US. In December that year we hired Gerard Bloom to lead a new team focusing on these international opportunities, including financial institutions risks. Financial institutions can in some respects be seen as ‘regulated technology companies’ and the relevance of our specialist products to their needs – not just cyber insurance but also D&O and professional indemnity cover – is high.
We made good progress in the implementation of our international growth strategy in 2017. In July we obtained authorisation from the Central Bank of Ireland for our new Dublin-based insurance company, Beazley Insurance dac, which will transact business in Europe from branches located in the UK, France, Germany and Spain. We began writing our first risks through the company in October. During the course of the year we also hired underwriters in Spain and Germany and – further afield – in our two hub offices in Singapore (serving Asian markets) and Miami (serving Latin American markets).
Our product range in all of these markets is geared to local needs but – in addition to cyber cover – we anticipate strong demand in the years to come for D&O cover, and for medical malpractice cover for healthcare providers. Healthcare markets around the world are highly regulated – often a driver of demand for insurance – and we see much of our US medical malpractice experience as relevant to the needs of healthcare clients in other countries.
In all of these markets, we have considerable headroom in which to grow. The same remains true of the US where, despite our strong recent growth, we are far from having exhausted profitable growth opportunities. However, the profitability of our growth will also depend on the efficiency of our operations. With this in mind, we have been investigating opportunities to reduce distribution costs for small business and to streamline and package our products.
One key measure of efficiency is the volume of business that an individual underwriter can transact. This is particularly relevant in the small business arena where a swift response to submissions also boosts the productivity of our brokers. Working closely with Ian Fantozzi and his operations team, we are exploring the scope to apply robotics to many of the repetitive tasks that have historically constrained the productivity of underwriters.
Much talk in the insurance industry has focused on the impact of technology; some of it utopian, some apocalyptic. Beazley ended 2017 with 239 specialty lines underwriters – 69 more than we began the year with. We see technology as a supplementary tool for our underwriters and claims professionals, not a substitute for their skills.

www.beazley.com40 Beazley Annual report 2017
1986
1,762.0
1991 1992 1997 1998 2000 2001 2003 2004 2005 2006 2007 2008 2009 2010 2011 2012 2013 2014 2015 2016 2017
1,371.01,485.1
1,015.6
1,374.9
736.2
1,148.7
431.6256.1168.8128.458.842.513.4
1,919.6
1,561.0
1,984.9
1,620.0
2,121.7
1,751.3
2,108.5
1,741.6
2,079.2
1,712.5
2,278.0
1,895.9
2,352.3
1,970.2
2,424.7
2,021.8
2,525.6
2,080.9
2,666.4
2,195.6
2,857.1
2,343.8
13.4
32 years of profitable growth
Beazley’s vision is to become, and be recognised as, the highest performing specialist insurer
Beazley in Hong Kong takes full ownership of APUA and renames it Beazley Limited
Expansion of construction & engineering team into Singapore
Beazley opens new office in Paris
Lloyd’s active members: 2,211
Capacity: £14.8bn
Syndicates: 65
Beazley opens new office in Munich
Political risks & contingency group formed as new division
Acquisition of Momentum Underwriting Management
Accident & life formed as a new division
US Hurricane Ike $20bn
Raised £150m through rights issue to develop our business at Lloyd’s and in the US
Acquisition of First State Management Group, Inc., a US underwriting manager focusing on surplus lines commercial property business
Beazley plc becomes the new holding company for the group, incorporated in Jersey and tax-resident in Ireland
Andrew Beazley, co-founder of Beazley Group and chief executive until September 2008, dies at the age of 57
Beazley changes functional and presentational currency to US dollar
Beazley opens new office in Oslo
Special purpose syndicate 6107 formed to grow reinsurance business
Chile and NZ earthquakes $14bn
Deepwater Horizon explosion triggers biggest oil spill in history
Expansion of Australian accident & health business through acquisition of two MGAs
Launch of the Andrew Beazley Broker Academy
Nick Furlonge, co-founder, retires as an executive member but becomes a non- executive of Beazley Furlonge Limited
Beazley remains profitable in worst year ever for insured natural catastrophe losses
Tohoku earthquake in Japan $37bn
Floods in Thailand $16bn
US tornadoes $15bn
NZ earthquake $16bn
200920072006 2008 2010 2011
1986 1991 1992 1997Began trading at the ‘old’ 1958 Lloyd’s building in 1986 with a capacity of £8.3m
Beazley, Furlonge & Hiscox established and takes over managing syndicate 623
Specialty lines and treaty accounts started
UK windstorms $3.5bn
European storms $10bn
Management buyout of Hiscox share
Commercial property account started
Corporate capital introduced at Lloyd’s followed by Lloyd’s Reconstruction and Renewal
APUA, based in Hong Kong, forms a strategic partnership with Beazley Furlonge
US Hurricane Andrew $17bn
UK Bishopsgate explosion $750m
US Northridge earthquake $12.5bn
Managed gross premiums Group share
Managed gross premiums and Group share$m
BICI begins writing US admitted mid-market commercial property
Tradingbegan1986

Strategic report
www.beazley.com Annual report 2017 Beazley 41
1986
1,762.0
1991 1992 1997 1998 2000 2001 2003 2004 2005 2006 2007 2008 2009 2010 2011 2012 2013 2014 2015 2016 2017
1,371.01,485.1
1,015.6
1,374.9
736.2
1,148.7
431.6256.1168.8128.458.842.513.4
1,919.6
1,561.0
1,984.9
1,620.0
2,121.7
1,751.3
2,108.5
1,741.6
2,079.2
1,712.5
2,278.0
1,895.9
2,352.3
1,970.2
2,424.7
2,021.8
2,525.6
2,080.9
2,666.4
2,195.6
2,857.1
2,343.8
13.4
Expansion into aviation and kidnap & ransom markets
Reinsurance division broadens access to South East Asia, China and South Korea business with local presence in Singapore
Political risks & contingency expands into French market
Superstorm Sandy $25-30bn
Construction Consortium launched at Lloyd’s
Miami office opened to access Latin American reinsurance business
Beazley Flight –comprehensive emergency evacuation cover – launched
Beazley data breach cover extended in Europe. 1,000th breach managed
Local representation added in Rio to develop Latin American insurance business
Construction Consortium extended to Lloyd’s Asia
Middle East office opened to access local political risk and violence, terrorism, trade credit and contingency business
Space and satellite insurance account started
D&O Consortium launched at Lloyd’s
Locally underwritten US business grows 19% to $537m
Entered into a reinsurance agreement with Korean Re
US underwritten premium grows by 21%
Cyber consortium launched at Lloyd’s
Beazley welcomes its 1,000th employee globally
Beazley celebrated its 30th anniversary
10th anniversary of operations in Singapore and Paris
Beazley plc becomes the new holding company for the group, incorporated in England & Wales and tax-resident in the United Kingdom
Partnership established with Munich Re to broaden and enhance the cyber cover available to the world’s largest companies
Beazley Insurance dac acquires licence to write business within the EU
Beazley opens a new office in Barcelona and acquires Creechurch Underwriters in Canada
Beazley closes Middle East office and sells Australian renewal rights
Hurricanes Harvey, Irma and Maria $90-95bn
Californian wildfires $10bn
Mexican earthquakes $2-5bn
Beazley began life in 1986Since then, we have grown steadily in terms of the risks we cover, the clients we serve and our geographic reach, and today Beazley is a mature insurance business with a well-diversified portfolio. We have weathered some of the toughest times the Lloyd’s market has seen in more than three centuries and our underwriting operations have an unbroken record of profitability.
2015 2016 201720142013
1998 2000 2001 2005
2012
Recall, contingency and political risks accounts started
Marine account started
European storms $12bn
Management buyout of minority shareholders
EPL and UK PI accounts started
Flotation raised £150m to set up Beazley Group plc
D&O healthcare, energy, cargo and specie accounts started
Local representation established in the US
Beazley MGA started in the US
Beazley acquires Omaha P&C and renames it Beazley Insurance Company, Inc. (BICI)
US 9/11 terrorist attack $20.3bn
SARS outbreak in Asia $3.5bn
US Hurricanes Katrina, Rita and Wilma $101bn
Flotation2002
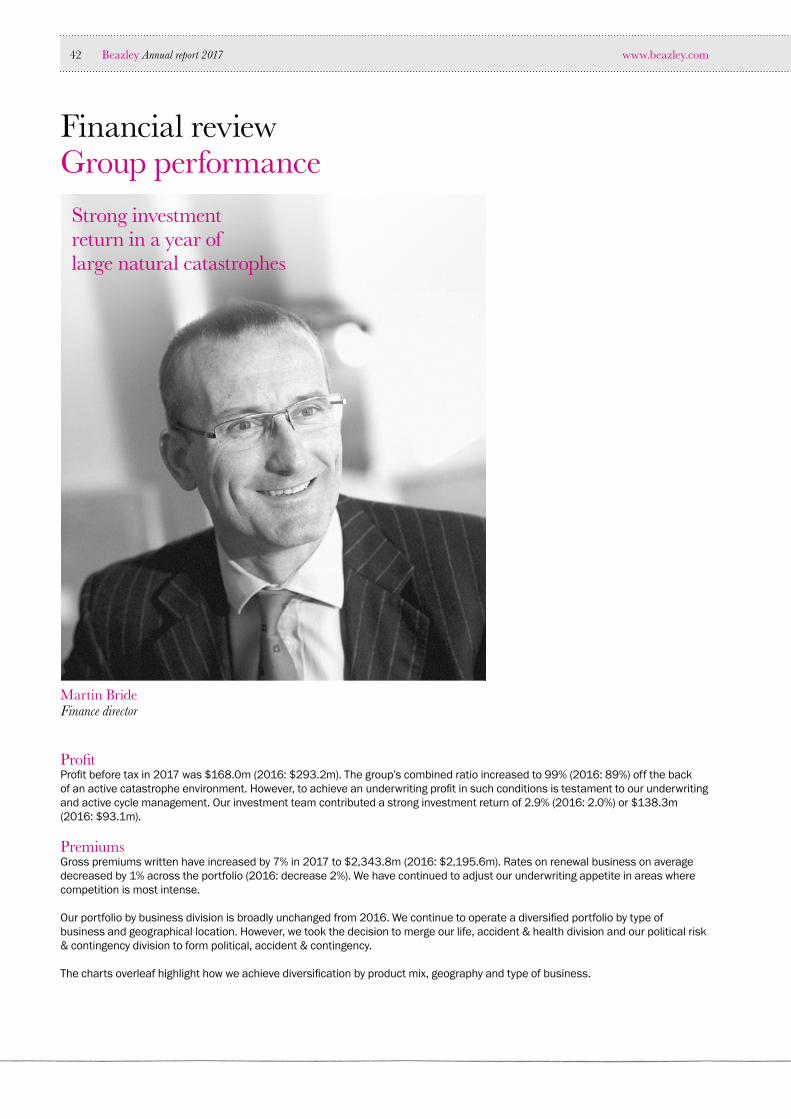
www.beazley.com42 Beazley Annual report 2017
Financial reviewGroup performance
Strong investment return in a year of large natural catastrophes
Martin BrideFinance director
ProfitProfit before tax in 2017 was $168.0m (2016: $293.2m). The group’s combined ratio increased to 99% (2016: 89%) off the back of an active catastrophe environment. However, to achieve an underwriting profit in such conditions is testament to our underwriting and active cycle management. Our investment team contributed a strong investment return of 2.9% (2016: 2.0%) or $138.3m (2016: $93.1m).
PremiumsGross premiums written have increased by 7% in 2017 to $2,343.8m (2016: $2,195.6m). Rates on renewal business on average decreased by 1% across the portfolio (2016: decrease 2%). We have continued to adjust our underwriting appetite in areas where competition is most intense.
Our portfolio by business division is broadly unchanged from 2016. We continue to operate a diversified portfolio by type of business and geographical location. However, we took the decision to merge our life, accident & health division and our political risk & contingency division to form political, accident & contingency.
The charts overleaf highlight how we achieve diversification by product mix, geography and type of business.

Strategic report
www.beazley.com Annual report 2017 Beazley 43
Statement of profit or loss2017
$m2016
$mMovement
%
Gross premiums written 2,343.8 2,195.6 7%Net premiums written 1,978.8 1,854.0 7%
Net earned premiums 1,869.4 1,768.2 6%Net investment income 138.3 93.1 49%Other income 35.5 32.7 9%Revenue 2,043.2 1,894.0 8%
Net insurance claims 1,075.7 855.6 26%Acquisition and administrative expenses 774.4 720.3 8%Foreign exchange loss 3.1 9.5 (67%)Expenses 1,853.2 1,585.4 17%
Share of profit/(loss) of associates 0.1 (0.2) (150%)Finance costs (22.1) (15.2) 45%Profit before tax 168.0 293.2Income tax expense (38.0) (42.2)Profit after tax 130.0 251.0
Claims ratio 58% 48%Expense ratio 41% 41%Combined ratio 99% 89%Rate decrease (1%) (2%)Investment return 2.9% 2.0%
The group is of the view that some of the above metrics constitute alternative performance measures (APMs). Further information on our APMs can be found in the key performance indicators section (inside front cover) and in the glossary on page 193.
Insurance type
Insurance 87%Reinsurance 13%
Gross premiums written by division
Specialty lines 56%Property 15%Marine 11%Reinsurance 9%Political, accident & contigency 9%
Premium written by claim settlement term
Short tail 52%Medium tail 48%
Geographical distribution
USA 63%Worldwide 22%Europe 15%

www.beazley.com44 Beazley Annual report 2017
Financial review continuedGroup performance continued
Reinsurance purchasedReinsurance is purchased for a number of reasons:• to mitigate the impact of natural catastrophes such as hurricanes and non natural catastrophes such as cyber attacks;• to enable the group to put down large lead lines on the risks we underwrite; and• to manage capital to lower levels.
The amount the group spent on reinsurance in 2017 was $365.0m (2016: $341.6m). The increase in purchased reinsurance was in line with our growth in gross premiums written of 7%.
Combined ratioThe combined ratio of an insurance company is a measure of its operating performance and represents the ratio of its total costs (including claims and expenses) to total net earned premium. A combined ratio under 100% indicates an underwriting profit. Consistent delivery of operating performance across the market cycle is clearly a key objective for an insurer. Beazley’s combined ratio increased in 2017 to 99% (2016: 89%) due to a high incidence of claims from natural catastrophes in the second half of 2017, which added circa 10% to the full year ratio.
Claims2017 experienced a number of natural catastrophes with Hurricanes Harvey, Irma and Maria, the Mexican earthquakes and Californian wildfires, all of which were major contributors to an increase in net insurance claims of $220.1m, which brought the 2017 total net insurance claims to $1,075.7m (2016: $855.6m). These claims, while large, were not outside of our expectation for such types of natural catastrophes. The claims ratio increased to 58% (2016: 48%).

Strategic report
www.beazley.com Annual report 2017 Beazley 45
0
5
10
Whole account reserve strength within our 5-10% target range (%)
03 04 05 06 07 08 09 11 12 1310 16
Surplus in net held assets: reserves
Financial year1514 17
Reserve releasesBeazley has a consistent reserving philosophy, with initial reserves being set to include risk margins that may be released over time as and when any uncertainty reduces. Historically these margins have given rise to held reserves within the range of 5-10% above our actuarial estimates, which themselves include some margin for uncertainty. The margin held above the actuarial estimate was 5.0% at the end of 2017 (2016: 6.6%). This margin decreased in 2017 which was in part due to the catastrophe activity in the second half of the year, which resulted in much lower margins than usual in the affected areas. As the overall margin is at the lower end of the range that management target, reserve releases in 2018 may be slightly lower than those over the last three years. However, it is important to recognise that while there is strong correlation between the level of margin and future reserve releases, current year developments can also affect releases either positively or negatively.
Reserve monitoring is performed at a quarterly ‘peer review’, which involves a challenge process contrasting the claims reserves of underwriters and claim managers, who make detailed claim-by-claim assessments, and the actuarial team, who provide statistical analysis. This process allows early identification of areas where claims reserves may need adjustment.
Prior year reserve adjustments across all divisions over the last five years are shown below:
2013$m
2014$m
2015$m
2016$m
2017$m
5 year average
$m
Marine 47.3 40.2 31.2 15.9 10.7 29.0Political, accident & contingency1 34.8 24.5 23.7 27.2 3.9 22.8Property 33.7 35.9 37.8 36.8 13.2 31.5Reinsurance 55.6 27.8 44.9 32.3 54.7 43.1Specialty lines 46.6 29.7 38.7 68.5 121.4 61.0Total 218.0 158.1 176.3 180.7 203.9 187.4Releases as a percentage of net earned premium 13.7% 9.5% 10.4% 10.2% 10.9% 10.9%
1 During 2017, the life, accident & health division and political risks & contingency division were combined to form the political, accident & contingency division.
The reserve releases in 2017 increased to $203.9m (2016: $180.7m). Our specialty lines division continued to increase its reserve releases as the post recession portfolio from 2012 onwards matures. This division’s releases also included meaningful amounts from the 2014/2015 cyber portfolio, an area that has more year on year variability than the balance of the specialty lines account. This counter-balanced lower releases on short tail classes, where the mechanical effect that reduced margins have on reserve releases, along with the effects of a large series of natural disasters, is now visible.
Please refer to the financial statements for information on reserve releases and loss development tables.

www.beazley.com46 Beazley Annual report 2017
Financial review continuedGroup performance continued
Comparison of returns – major asset classes ($m)
71.0 67.3
Capital growth portfolio Core portfolio0
20
40
80
60
■ 2016 ■ 2017
31.8
61.3
Acquisition costs and administrative expensesBusiness acquisition costs and administrative expenses increased during 2017 to $774.4m from $720.3m in 2016. The breakdown of these costs is shown below:
2017$m
2016$m
Brokerage costs 431.1 390.0Other acquisition costs 88.6 82.5Total acquisition costs 519.7 472.5Administrative expenses 254.7 247.8Total acquisition costs and administrative expenses 774.4 720.3
Brokerage costs are the premium commissions paid to insurance intermediaries for providing business. As a percentage of net earned premiums they have increased slightly to 23% in the current year (2016: 22%). Brokerage costs are deferred and expensed over the life of the associated premiums in accordance with the group’s accounting policy.
Other acquisition costs comprise costs that have been identified as being directly related to underwriting activity (e.g. underwriters’ salaries and Lloyd’s box rental). These costs are also deferred in line with premium earning patterns.
The group expense ratio remained unchanged compared to the previous year. Internal administrative expenses have increased less than premium due to a continued conscious drive to challenge costs. This was offset by the aforementioned small increase in acquisition costs versus our earned premium growth.
Foreign exchangeThe majority of Beazley’s business is transacted in US dollars, which is the currency we have reported in since 2010 and the currency in which we hold the company’s net assets. Changes in the US dollar exchange rate with sterling, the Canadian dollar and the euro do have an impact as we receive premiums in those currencies and the majority of our staff still receive their salary in sterling. Beazley’s foreign exchange loss taken through the statement of profit or loss in 2017 was $3.1m (2016: loss of $9.5m).
Investment performanceGeo-political headlines had limited overall impact on financial markets in 2017. Instead, more traditional macro-economic considerations provided direction: improving global growth, controlled inflation and easy monetary policy helped equities and corporate credit exposures to rally strongly whilst, later in the year, expectations of rising interest rates, particularly in the US, led risk-free yields to increase significantly. Our core portfolio of mainly fixed income assets, which constitute the majority of our investments, returned 1.6% overall in 2017 (2016: 1.5%) helped, as credit spreads declined, by the additional corporate bond exposures which we added in 2016. Our capital growth investments, which target higher returns whilst accepting some additional volatility, increased to 14.8% of assets in 2017 (2016: 12.0%), which was beneficial as these investments returned 11.0% in the period (2016: 5.6%), driven by strong performance from our equity and illiquid credit exposures. Our overall investment return for the year ended 31 December 2017 was 2.9%, or $138.3m (2016: 2.0%, $93.1m). More information about our investment strategy is included on page 14.

Strategic report
www.beazley.com Annual report 2017 Beazley 47
Beazley group funds ($m)
20172016201520142013
■ Group funds including funds at Lloyd’s■ Syndicates 2623, 3623 and 3622
4,426 4,7034,519
01,0002,0003,0004,0005,0006,000
4,442 4,890
The table below details the breakdown of our portfolio by asset class: 31 Dec 2017 31 Dec 2016
$m % $m %
Cash and cash equivalents 440.5 9.0 507.2 10.8Fixed and floating rate debt securities– Government, quasi-government and supranational 1,390.6 28.4 1,261.5 26.8– Corporate bonds – Investment grade 2,179.7 44.6 2,158.0 45.9 – High yield 58.8 1.2 97.1 2.1– Senior secured loans 85.6 1.8 96.2 2.0– Asset backed securities – – 4.6 0.1Derivative financial instruments 8.8 0.2 12.2 0.3Core portfolio 4,164.0 85.2 4,136.8 88.0Equity funds 168.3 3.4 116.3 2.5Hedge funds 377.4 7.7 317.1 6.7Illiquid credit assets 180.4 3.7 132.4 2.8Total capital growth assets 726.1 14.8 565.8 12.0Total 4,890.1 100.0 4,702.6 100.0
Comparison of return by major asset class: 31 Dec 2017 31 Dec 2016
$m % $m %
Core portfolio 67.3 1.6 61.3 1.5Capital growth assets 71.0 11.0 31.8 5.6Overall return 138.3 2.9 93.1 2.0
In 2017, the funds managed by the Beazley group increased on the prior year, with financial assets at fair value and cash and cash equivalents of $4,890.1m at the end of the year (2016: $4,702.6m). The chart below shows the increase in our group funds since 2013.
TaxBeazley is liable to corporation tax in a number of jurisdictions, notably the UK, the US and Ireland. Beazley’s effective tax rate is thus a composite tax rate mainly driven by the Irish, UK and US tax rates. The weighted average of the statutory tax rates for the year was 18.7% (2016: 14.9%) and has increased over 2016 due to an increased level of US based profits which are taxed at 35%. We expect this rate to be around 16% to 17% in 2018 as the group benefits from a reduced US corporation tax rate and non-US profits hopefully revert to long term levels. Our effective tax rate for the year was 22.6% (2016: 14.4%). The increases compared to 2016 were due to the higher composite tax rate and a reduction of approximately $5m in the value of our US deferred tax asset following the reduction in the US corporation tax rate from 35% to 21%, which was enacted in 2017.
The application of the diverted profits tax legislation passed by the government early in 2015 still remains uncertain. We have considered the implication of this and retain the view that this tax should not apply to Beazley (see note 9 in the financial statements).

www.beazley.com48 Beazley Annual report 2017
Financial review continued
Balance sheet managementSummary statement of financial position
2017$m
2016$m
Movement%
Intangible assets 133.5 96.6 38%Reinsurance assets 1,231.1 1,082.1 14%Insurance receivables 918.0 794.7 16%Other assets 386.0 332.5 16%Financial assets at fair value and cash and cash equivalents 4,890.1 4,702.6 4%Total assets 7,558.7 7,008.5 8%
Insurance liabilities 5,167.8 4,657.7 11%Financial liabilities 367.3 363.8 1%Other liabilities 524.7 503.3 4%Total liabilities 6,059.8 5,524.8 10%Net assets 1,498.9 1,483.7 1%Net assets per share (cents) 287.1c 286.9c –Net tangible assets per share (cents) 261.6c 268.2c (2%)
Net assets per share (pence) 215.3p 225.9p (5%)Net tangible assets per share (pence) 196.2p 211.2p (7%)Number of shares 1 522.0m 517.2m 1%
1 Excludes shares held in the employee share trust and treasury shares.
Intangible assetsIntangible assets consist of goodwill on acquisitions of $62.0m (2016: $62.0m), purchased syndicate capacity of $10.7m (2016: $10.7m), US admitted licences of $9.3m (2016: $9.3m), renewal rights of $35.2m (2016: $7.0m) and capitalised expenditure on IT projects of $16.3m (2016: $7.6m).
Reinsurance assetsReinsurance assets represent recoveries from reinsurers in respect of incurred claims of $993.2m (2016: $853.9m), and the unearned reinsurance premiums reserve of $237.9m (2016: $228.2m). The reinsurance receivables from reinsurers are split between recoveries on claims paid or notified of $219.4m (2016: $201.8m) and an actuarial estimate of recoveries on claims that have not yet been reported of $773.8m (2016: $652.1m). The group’s exposure to reinsurers is managed through:• minimising risk through selection of reinsurers who meet strict financial criteria (e.g. minimum net assets, minimum ‘A’ rating
by S&P). These criteria vary by type of business (short vs medium tail). The chart on page 49 shows the profile of these assets (based on their S&P rating) at the end of 2017;
• timely calculation and issuance of reinsurance collection notes from our ceded reinsurance team; and • regular monitoring of the outstanding debtor position by our reinsurance security committee and credit control committee.
We continue to provide against impairment of reinsurance recoveries, and at the end of 2017 our provision in respect of reinsurance recoveries totalled $13.2m (2016: $12.6m).
Insurance receivablesInsurance receivables are amounts receivable from brokers in respect of premiums written. The balance at 31 December 2017 was $918.0m (2016: $794.7m).

Strategic report
www.beazley.com Annual report 2017 Beazley 49
Other assetsOther assets are analysed separately in the notes to the financial statements. The largest items included comprise:• deferred acquisition costs of $281.4m (2016: $242.8m);• profit commissions of $10.1m (2016: $15.2m); and • deferred tax assets available for use against future taxes payable of $6.9m (2016: $11.0m).
Judgement is required in determining the policy for deferring acquisition costs. Beazley’s policy assumes that variable reward paid to underwriters relates to prior years’ business and is not an acquisition cost. As a result, the quantum of costs classified as acquisition is towards the lower end of the possible range. Costs identified as related to acquisition are then deferred in line with premium earnings.
Insurance liabilitiesInsurance liabilities of $5,167.8m (2016: $4,657.7m) consist of two main elements, being the unearned premium reserve (UPR) and gross insurance claims liabilities.
Our UPR has increased by 10% to $1,259.2m (2016: $1,140.8m). The majority of the UPR balance relates to current year premiums that have been deferred and will be earned in future periods. Current indicators are that this business is profitable.
Gross insurance claims reserves are made up of claims which have been notified to us but not yet paid of $1,056.3m (2016: $949.5m) and an estimate of claims incurred but not yet reported (IBNR) of $2,852.3m (2016: $2,567.4m). These are estimated as part of the quarterly reserving process involving the underwriters and group actuary. Gross insurance claims reserves have increased 11% from 2016 to $3,908.6m (2016: $3,516.9m).
Financial liabilitiesFinancial liabilities comprise borrowings and derivative financial liabilities. The group utilises three long term debt facilities:• a US$18m subordinated debt facility was raised in 2004. This loan is also unsecured and interest is payable at the
US$ London interbank offered rate (LIBOR) plus 3.65%. These subordinated notes are due in 2034 and have been callable at the group’s option since 2009;
• during September 2012 we issued a sterling denominated 5.375% retail bond under a £250m euro medium term note programme which raised £75m for the group and is due in 2019. This diversified the source and maturity profile of the group’s debt financing; and
• in November 2016, Beazley Insurance dac issued $250m of 5.875% subordinated tier 2 notes due in 2026.
A syndicated short term banking facility led by Lloyds Banking Group plc provides potential borrowings up to $225m. Under the facility $225m may be drawn as letters of credit to support underwriting at Lloyd’s. Of this, 100% may be advanced as cash under a revolving facility. The cost of the facility is based on a commitment fee of 0.385% per annum and any amounts drawn are charged at a margin of 1.1% per annum. The cash element of the facility will expire on 31 July 2019, whilst letters of credit issued under the facility can be used to provide support for the 2017, 2018 and 2019 underwriting years. The facility is currently unutilised.
Reinsurance debtor credit quality
AA+ 2%AA 1%AA- 49%A+ 38%A 4%A- 1%Collateralised 4%Others 1%

www.beazley.com50 Beazley Annual report 2017
Financial review continued
Capital structureCapital structure Beazley has a number of requirements for capital at a group and subsidiary level. Capital is primarily required to support underwriting at Lloyd’s and in the US and is subject to prudential regulation by local regulators (PRA, Lloyd’s, Central Bank of Ireland, and the US state level supervisors). Beazley is subject to the capital adequacy requirements of the European Union (EU) Solvency II regime (‘SII’). We comply with all relevant SII requirements.
Further capital requirements come from rating agencies who provide ratings for Beazley Insurance Company, Inc and Beazley Insurance dac. We aim to manage our capital levels to obtain the ratings necessary to trade with our preferred client base.
Beazley holds a level of capital over and above its regulatory requirements. The amount of surplus capital held is considered on an ongoing basis in light of the current regulatory framework, opportunities for organic or acquisitive growth and a desire to maximise returns for investors.
The group actively seeks to manage its capital structure. Our preferred use of capital is to deploy it on opportunities to underwrite profitably. However, there may be times in the cycle when the group will generate excess capital and not have the opportunity to deploy it. At such points in time the board will consider returning capital to shareholders.
On issuance of the new tier 2 subordinated debt in 2016, Beazley Insurance dac was assigned an Insurer Financial Strength (IFS) rating of ‘A+’ by Fitch.
In 2017, Beazley acquired 3.0m of its own shares into the employee benefit trust. These were acquired at an average price of 437p and the cost to the group was £13.1m.
The following table sets out the group’s sources of funds:2017
$m2016
$m
Shareholders’ funds 1,498.9 1,483.7Tier 2 subordinated debt (2026) 248.5 248.3Retail bond (2019) 99.5 94.7Long term subordinated debt (2034) 18.0 18.0
1,864.9 1,844.7
Our funding comes from a mixture of our own equity alongside $248.5m of tier 2 subordinated debt, $18.0m of subordinated long term debt, a $99.5m retail bond and an undrawn banking facility of $225.0m.
We signalled at the interim results that we expected the Lloyd’s economic capital requirement (ECR) to increase, reflecting our plans for growth. The final figure at year end 2017 is lower than our projection reflecting the improved profitability of the natural catastrophe underwriting expected in 2018. Our guidance, that we expect underwriting capital to grow in the mid to high single digits, remains.
The following table sets out the group’s capital requirement:2017
$m2016
$m
Lloyd’s economic capital requirement (ECR) 1,517.2 1,489.2Capital for US insurance company1 96.5 107.7
1,613.7 1,596.9
1 The A.M. Best rating of our US insurance company Beazley Insurance Company Inc. (BICI) is now maintained via a group support mechanism rather than on a stand alone basis. As a result the capital requirement for BICI is now taken as a minimum realistic risk based capital (RBC) level as opposed to the capital level required to achieve a stand alone A.M. Best rating.
At 31 December 2017, we have surplus capital of 39% of ECR (on a Solvency II basis). Following payment of the second interim dividend of 7.4p, this surplus reduces to 35% compared to our current target range of 15% to 25% of ECR.
Solvency IIThe Solvency II regime came into force on 1 January 2016. Beazley continue to provide quarterly Solvency II pillar 3 reporting to both Lloyd’s for the Beazley managed syndicates and the Central Bank of Ireland for Beazley Insurance dac and Beazley plc. In 2017 the first annual solvency financial condition report (SFCR) of Beazley plc was published.
Under Solvency II requirements, the group is required to produce a Solvency Capital Requirement (SCR) which sets out the amount of capital that is required to reflect the risks contained within the business. Lloyd’s reviews the syndicates’ SCRs to ensure that SCRs are consistent across the market. On 10 December 2015 Beazley received internal model approval from the Central Bank of Ireland (the group supervisor under Solvency II).

Strategic report
www.beazley.com Annual report 2017 Beazley 51
The current SCR has been established using our Solvency II approved internal model which has been run within the regime as prescribed by Lloyd’s. In order to perform the capital assessment, we have made significant investments in both models and process:• we use sophisticated mathematical models that reflect the key risks in the business allowing for probability of occurrence,
impact if they do occur, and interaction between risk types. A key focus of these models is to understand the risk posed to individual teams, and to the business as a whole, of a possible deterioration in the underwriting cycle; and
• the internal model process is embedded so that teams can see the direct and objective link between underwriting decisions and the capital allocated to that team. This gives a consistent and comprehensive picture of the risk/reward profile of the business and allows teams to focus on strategies that improve return on capital.
Group structureThe group operates across Lloyd’s, Europe, Asia, Canada and the US through a variety of legal entities and structures. The main entities within the legal entity structure are as follows:• Beazley plc – group holding company and investment vehicle, quoted on the London Stock Exchange;• Beazley Ireland Holdings plc – intermediate holding company which holds £75m sterling denominated notes; • Beazley Underwriting Limited – corporate member at Lloyd’s writing business through syndicates 2623, 3622 and 3623;• Beazley Furlonge Limited – managing agency for the seven syndicates managed by the group (623, 2623, 3622, 3623, 6107, 6050
and 5623);• Beazley Insurance dac – reinsurance company that accepts non-life reinsurance premiums ceded by the corporate member,
Beazley Underwriting Limited and writes direct business in Europe;• Syndicate 2623 – corporate body regulated by Lloyd’s through which the group underwrites its general insurance business
excluding accident & life. Business is written in parallel with syndicate 623;• Syndicate 623 – corporate body regulated by Lloyd’s which has its capital supplied by third party names;• Syndicate 6107 – special purpose syndicate writing reinsurance business, and from 2017 cyber, on behalf of third party names;• Syndicate 3622 – corporate body regulated by Lloyd’s through which the group underwrites its life insurance and
reinsurance business;• Syndicate 3623 – corporate body regulated by Lloyd’s through which the group underwrites its personal accident,
BICI reinsurance business and, from 2018, facilities business;• Syndicate 6050 – special purpose syndicate which has its capital provided by third party names and provides reinsurance
to syndicates 623 and 2623 on the 2015, 2016 and 2017 years of account;• Syndicate 5623 – special purpose syndicate writing facilities ceded from syndicate 3623;• Beazley Insurance Company, Inc. (BICI) – insurance company regulated in the US. Licensed to write insurance business
in all 50 states; and• Beazley USA Services, Inc. (‘BUSA’) – managing general agent based in Farmington, Connecticut. Underwrites business
on behalf of Beazley syndicates and BICI.
Beazley Insurance dac Beazley Group Ltd
Beazley Underwriting Ltd(Corporate member)
Beazley Furlonge Ltd(Managing agency)
Capital
Capital
Reinsurancecontract Beazley USA
Beazley Ireland Holdings plc
Third party capital providers
Quota share
Management
Quota share and surplus treaties
BeazleyUSA
Services,Inc.
(servicecompany)
BeazleyInsuranceCompany,
Inc.(admittedinsurancecompany;A rated)
Syndicate 2623
Syndicate 623
Syndicate 3622
Syndicate 6107
Syndicate 3623
Beazley plc
Syndicate 6050
Syndicate 5623** Syndicate 5623 is supported by both Beazley capital and third party capital.
Quota share

www.beazley.com52 Beazley Annual report 2017
Operational update
Ian FantozziChief operating officer
Beazley continues to demonstrate profitable growth, and we have developed a diversified portfolio of products that are distributed globally, through 29 locations. To support this growth, we have developed a scalable and efficient operating platform that, through focused investment, has become an important competitive advantage.
A high performing global operations function relies on us maintaining consistency in operational standards throughout the group, while simultaneously being prepared to try new things and leverage our depth of insurance operations expertise to give us a lead over the competition. In order to achieve this, we pursue our group operations strategy. This focuses on the areas below.
Supporting growth initiatives In support of our strategic growth initiatives in areas such as the US, Europe, Asia Pacific, and small enterprise we have continued to enhance our infrastructure so that we can bring attractive new products to market as efficiently as possible. Virtual Care and Execuguard are examples of two new types of insurance that we launched in 2017.
Maintaining operations and preparing our business for high performance in an increasingly digital world
In early 2017, we announced the establishment of our European based insurance company, Beazley Insurance dac. The operations team has worked hard to ensure all the necessary operations and technology infrastructure is in place to support this business. As well as supporting the launch of over 40 insurance product coverages as part of the rollout of our new financial institutions business, we have developed our back-office systems to be able to efficiently process both large co-insured business and smaller 100% Beazley written business. Key to growing the distribution of smaller risk business has been the ongoing expansion of our myBeazley.com e-trading platform. The latest e-trading product launches, in the US and in Europe for our German professional indemnity book will support the growth of our small enterprise package products.
In February, we announced the acquisition of Creechurch Underwriters. The addition of this business to Beazley presents new opportunities to increase distribution of our specialist underwriting products in Canada. The acquisition brought three additional office locations in Toronto, Montreal and Vancouver – all of which have had their technology and processing infrastructure integrated with our wider business. There will be further opportunities for us to share operational capability as this integration develops in 2018, and for us to leverage our existing product delivery capability in this region.
Supporting business growth relies on effective processes and systems, but it is also important that we have a high quality working environment that is conducive to team working and thought leadership. In 2017, we opened a new office in Barcelona that will help to increase our access to continental European business, and expanded our Los Angeles office in support of our growing underwriting portfolio in the south west of the US.

Strategic report
www.beazley.com Annual report 2017 Beazley 53
Cost efficiencyBeazley is organised to a large degree around global underwriting and claims teams. This model has served us well in ensuring that products that succeed in one market can be swiftly introduced in others. However, it is important that this does not result in back office systems and support resources becoming duplicative or the administration of insurance transactions impeding the business in any way.
In pursuit of greater efficiency and consistency of operational service, we have centralised operations support or outsourced it where this brings further value. We want to make sure that operations and processing are done by appropriately skilled people, at the most cost effective location, whilst providing the best service levels. To help achieve this, we have built operations service centres in the US in Connecticut and in Georgia. We also make use of global outsourcing agreements for business processing support and information technology support. These arrangements have been carefully planned and selected to ensure we can maximise a highly efficient and scalable operating platform to support our business growth.
In 2017, we commenced a project to build a new operational service centre in Birmingham (UK) to support our London and Rest of World platform growth. This location is proving to be a cost-effective alternative to London. It also benefits from excellent access to skills relevant to Beazley’s future growth plans, for example in technology, data analytics and financial services support generally. This year we have built our capabilities in software development, robotics, project delivery, as well as multi-lingual underwriting support and credit control at this location. In early 2018, we will open a new Birmingham office to house the operational service teams, as well as underwriters from our UK regional teams.
Managing operational risk effectively Effective risk management requires clear visibility of the level of operational risk we maintain. Critical to supporting an effective control environment is consistency of ownership for operations support and the provision of management information.
As we continue to make our operational support more efficient, we have defined clear ownership for processes, establishing clear accountability for process execution and planning. This simplifies operational control reporting and strengthens our ability to provide a coordinated rapid response to support business growth opportunities.
A widely discussed topic across our industry is preparation for the General Data Protection Regulation (GDPR), which comes into effect during 2018. We see the privacy of our customer data and the associated rights to the use of personal data as very important to preserve. In previous years, Beazley has made significant investment in this area and so our preparation for GDPR has been a continuation of this work. Similarly, we see the threat of cyber attack as an ever evolving threat, and over the years have developed a framework of preventative, detective and response controls to counter this threat. In 2017, we increased the size of our in-house information security and IT security teams in support of this framework.
Managing for performanceA market differentiator for Beazley is the considerable experience that we have amassed within our global operations team. Whether providing support services or delivering large projects, we know what works and what does not. The operations team and the underwriting teams have developed strong working relationships over the years, and collectively we have developed considerable expertise in bringing new products and distribution channels to fruition. As with all Beazley talent we recognise the importance of developing attractive career paths. We equip our operations team with the right skills for the job. We routinely review our talent for potential skills gaps and then provide the most relevant training to ensure a high standard of service provision.
Although Beazley receives plenty of interest when attracting new operations and technology talent, we recognise that our working environment needs to keep evolving to remain attractive, and to then retain and further motivate this talent. In 2017, after a successful pilot with our London based IT team, we commenced a project to develop our larger offices into activity based working (ABW) environments. Although a benefit of ABW is more efficient use of office space, it also creates an environment where our workforce has a physical space and technology environment that maximises the potential for them to carry out their daily activities. Our first ABW environment will be the new Birmingham office opening in 2018, followed by a new location in New York. We are also reviewing ABW options for our London based teams.

www.beazley.com54 Beazley Annual report 2017
Operational update continued
Looking ahead to a digital BeazleyIn our industry, the word digital has become a catch-all term for the application of new technologies, data analytics and disruptive business models. It can be easy to get caught in the hype surrounding these, or worse to get distracted by opportunities that may not align with the future direction of our markets or customer needs. In 2017, our focus has been towards synthesising how best to leverage new technology to further strengthen the value that Beazley already brings to its customers, and to keep differentiating ourselves within the specialist insurance market. We do see this as requiring a digital transformation of our business, but the question has been how best to achieve this. This year, our board approved a new digital strategy for the group which takes a two-pronged approach towards answering this question:
1) Building the data and technology research capabilityIn late 2016, we created a new team called Beazley Labs, and dedicated resource to the research of new technology and data analytics solutions. Since its inception, the Beazley Labs team has run a series of hackathons to prototype new technologies responding to real business problems and opportunities. In 2017, we raised the profile of this work across the whole business – establishing a new group strategic initiative called the Data & Analytics Strategic Initiative (DASI). As well as providing regular board level updates, this strategic initiative has further increased business engagement and awareness of how new data and technology ideas can be applied across our product lines.
Of course, the proof of these technologies goes beyond trials and prototypes. Ideas that were mentioned in last year’s annual report are already in production. Some examples are robotics, for which we now have an in-house delivery team and ‘live’ robots now operating processes in Beazley day-to-day; natural language processing, which is being used to extract and process unstructured data from the thousands of risk submission emails we receive from our brokers; and the rollout of a new suite of data analytics tools to all Beazley users.
2) Organising our business to deliver, and leverage, the technologyThis year we reorganised our operational capability so that equal attention is applied to both the day-to-day efficient support of the business, and to transforming our business for a digital future. This saw the creation of a new Digital Transformation team that will focus on changing our business in terms of product design, processes, workforce and physical infrastructure in order to maximise the value we get from new data and technology solutions.
We have also reorganised the way our IT systems fit together, moving from a model with a number of separate components towards a customer centric model. This means we have created a new global IT platform, which went into production in July 2017, that provides a single customer and broker record onto which we can attach all our business activity associated with them. Ultimately, this means we will be able to give our customers a more joined up digital service experience, and crucially it will enable us to optimise our response times.
As we proceed into 2018, we are well placed not only as a high performing specialist insurer, but we also have developed great strength in our operational capability. The changes we have made in 2017, will allow us to build on this operational strength and ensure we are a high performing specialist insurer in an increasingly digital world.

Strategic report
www.beazley.com Annual report 2017 Beazley 55
Risk management
Managing risk in an evolving business environment
Preparing for and responding to catastrophesBeazley is exposed to three key insurance risks where one event can lead to multiple claims. These are, in order of potential impact to Beazley, 1) a specialty lines catastrophe, 2) a natural catastrophe and 3) a cyber catastrophe. The natural catastrophes of hurricanes, earthquakes and wildfires which occurred in the second half of 2017 demonstrate why careful aggregate management is important to avoid undue surprises. This starts with the board setting risk appetite which is managed to throughout the year as risks are underwritten. The monitoring is performed using catastrophe modelling tools which help to manage the aggregation of exposure in different geographical areas. The same catastrophe modelling tools are used to assist the underwriting teams with pricing the risk and to establish the amount of capital that must be held to support the underwriting given the risk being taken. Therefore, when natural catastrophes occur, it is important to test the models, particularly the methods and assumptions used, to ensure that they are still fit for purpose. This validation exercise has been completed and has confirmed that the catastrophe modelling tools remain reasonable in light of the events observed without the need for an immediate off cycle adjustment, and they remain a useful aid to the underwriting process.
Andrew PrydeChief risk officer
The aggregation potential of multiple claims arising from a cyber event is managed using a similar process. However, given that there have been very few cyber events that have led to a notable aggregation of claims, the monitoring is based on a suite of realistic disaster scenarios – which is how the monitoring of natural catastrophes started. We have been undertaking a cyber risk review for the past four years, which has charted the evolution of the modelling approach and has evidenced improvements in sophistication each year. This year, Beazley has added new coverages to the cyber product to meet the needs of our clients. As a result, we have introduced a new realistic disaster scenario to monitor this additional exposure. We have also added a new realistic disaster scenario to monitor the increasing trend of ransomware attacks. We have supplemented the knowledge of Beazley’s internal cyber experts with advice and analysis from external experts working in the cyber field to ensure that we have sight of emerging technical trends. Finally, we continue to monitor and support the development of third party catastrophe modelling tools as more analysis is being performed in this risk area. We expect, over time, that the modelling of cyber risks will be able to mirror the sophistication of the modelling of natural catastrophe risks.
Realistic disaster scenarios are also used to monitor the potential impact of a specialty lines catastrophe – for example the impact that a recession might have on the various professional indemnity risks underwritten. This approach was tested and validated following the 2008 global financial crisis and, whilst there has been less reserve release than usual from the underwriting years immediately following the crisis, they remained profitable.
The purpose of performing this modelling and monitoring is to ensure that in the event of a catastrophe occurring, such as those in the second half of 2017, claims can be paid promptly to our policyholders in their time of greatest need and a return can still be provided to the investors who support Beazley’s ongoing business.
2017 in reviewThis year has included organisational changes which have impacted the risk and control environment. Firstly, we received approval of Beazley Insurance dac’s licence from the Central Bank of Ireland to underwrite insurance business in Europe in addition to the reinsurance of syndicate 2623 and syndicate 3623. Secondly, Beazley purchased a managing general agent, Creechurch Underwriters, which is now called Beazley Canada Limited, in order to provide more of Beazley’s products to our clients in Canada.

www.beazley.com56 Beazley Annual report 2017
Risk management continued
We have been involved throughout these processes which, in each case, started with the production of an Own Risk and Solvency Assessment (ORSA) report which informed the board of the risk and capital considerations and subsequently has involved updating the risk register, controls and governance to reflect the new risk profile. This has included ensuring that the new underwriting and claims processes meet Beazley’s group-wide consistent underwriting and claims standards.
Beazley has also established a new special purpose syndicate, syndicate 5623. We have supported the establishment of this syndicate including setting the processes and controls appropriate for the portfolio nature of the underwriting, which is different to the majority of underwriting performed at Beazley.
We have also started a risk review of our US operations. Whilst there were already two risk managers based full time in the US, the chief risk officer is spending nine months, spanning 2017 and 2018, in the US in order to provide assurance to the board that the US operations are working appropriately following the recent growth – we now have over 500 staff, or around 40% of the total workforce, based in the US – and that we are ready for the continued growth planned over the next few years.
We worked with the board to produce Beazley’s contingency plan for the UK’s exit from the European Union (‘Brexit’), setting out a central plan and testing it against a range of potential outcomes. The main risk is the ability to offer insurance to European clients following Brexit and, for context, around 4% of Beazley’s current European business is within scope. The central plan is to be able to offer policies, at the client’s choice, either through Beazley’s insurance company in Dublin or through the subsidiary that Lloyd’s is in the process of establishing in Brussels. A Brexit working group, led by the chief risk officer, was established to oversee Beazley’s response to Brexit and this working group will remain in place until the conclusion of the Brexit process.
We facilitated a discussion of emerging and strategic risks at the board strategy day in May. The discussions focused on five topics, namely; developments in the US which is our largest market, developments of broker facilities as a method of placement, preparing for the office of the future, insuring uninsured risks, and developments at Lloyd’s. The analysis performed by board members and members of the executive committee provided an opportunity to test how Beazley’s strategy may have to evolve if these risks were to crystallise.
Against the backdrop of increased scrutiny of remuneration arrangements by shareholders and regulators, the risk management report to the remuneration committee is now in its seventh year. The analysis performed has confirmed that the design of remuneration at Beazley is driving appropriate risk behaviour.
2017 was the second year of operating within the new Solvency II regime, with our internal model approved by the Central Bank of Ireland. There have been no major changes to the model during the year and the output of the model continues to be used extensively to support business decisions. This year we changed the external consulting firm who support the independent validation process. The feedback of this review related mainly to capturing efficiencies rather than any recommendations to change the approach or assumptions. In particular, the feedback was particularly complimentary about the quality of the documentation (a key Solvency II standard) which helped the third party consultancy understand how the model operates and how it reflects the risks within the group. The capital modelling team continue to operate a programme of regular and tailored director briefings to ensure that the internal model is understood and provide an opportunity for directors to suggest enhancements to the internal model.
The latest chief risk officer report to the board has confirmed that the control environment has not identified any significant failings or weaknesses in key processes and that Beazley is operating within risk appetite as at 31 December 2017.

Strategic report
www.beazley.com Annual report 2017 Beazley 57
Business risk managementRisk ownership– Identifies risk– Assesses risk– Mitigates risk– Monitors risk– Records status– Remediates when required
Risk managementRisk oversight– Are risks being identified?– Are controls operating effectively?– Are controls being signed off?– Reports to committees and board
Internal auditRisk assurance– Independently tests control design– Independently tests control operation– Reports to committees and board
Risk management philosophyBeazley’s risk management philosophy is to balance the risks the business takes on with the associated cost of controlling these risks, whilst also operating within the risk appetite agreed by the board. In addition, our risk management processes are designed to continuously monitor our risk profile against risk appetite and to exploit opportunities as they arise.
Risk management strategyThe Beazley plc board has delegated executive oversight of the risk management department to the executive committee, which in turn has delegated immediate oversight to the risk and regulatory committee. The Beazley plc board has also delegated oversight of the risk management framework to the audit and risk committee and the primary regulated subsidiary boards have each established a board risk committee.
Clear roles, responsibilities and accountabilities are in place for the management of risks and controls, and all employees are aware of the role they play in all aspects of the risk management process, from identifying sources of risk to their part in the control environment. The impact of each risk is recorded in the risk register on a 1:10 likelihood of that risk manifesting in the next 12 months. A risk owner has been assigned responsibility for each risk, and it is the responsibility of that individual to periodically assess the impact of the risk and to ensure appropriate risk mitigation procedures are in place. External factors facing the business and the internal controls in place are routinely reassessed and changes are made when necessary. On an annual basis, the board agrees the risk appetite for each risk event and this is documented in the risk management framework document. The residual financial impact is managed in a number of ways, including:• mitigating the impact of the risk
through the application of controls;• transferring or sharing risk through
outsourcing and purchasing insurance and reinsurance; and
• tolerating risk in line with the risk appetite.

www.beazley.com58 Beazley Annual report 2017
Risk management continued
In addition, the following risk management principles have been adopted:• risk management is a part of the
wider governance environment;• techniques employed are fit for
purpose and proportionate to the business;
• risk management is a core capability for all employees;
• risk management is embedded in day-to-day activities;
• there is a culture of risk awareness, in which risks are identified, assessed and managed;
• risk management processes are robust and supported by verifiable management information; and
• risk management information and reporting is timely, clear, accurate and appropriately escalated.
Risk register Control assessment (monthly)
Consolidated assurance report
Committees1st line: Underwriting, Investment, Operations, Executive committees2nd line: Risk and regulatory, Risk committees3rd line: Audit committeesBoards
Risk incidents reporting
Risk appetite(annual)
Risk assessment(biannual)
Stress and scenario framework(annual)
Risk profiles(ad hoc)
Strategic and emerging risk(annual)
Control performance aggregation (monthly)
Key risk indicators(quarterly)Internal model
Risk management frameworkBeazley has adopted the ‘three lines of defence’ framework: namely business risk management, the risk management function and the internal audit function. Within business risk management, there are two defined risk and control roles: risk owner and control reporter. Each risk event is owned by the risk owner who is a senior member of staff. Risk owners, supported by the risk management team, formally perform a risk assessment twice a year, including an assessment of heightened and emerging risks.
The risk management framework comprises a number of risk management components, which when added together describe how risk is managed on a day to day basis. The framework includes a risk register that captures the risk universe (53 risk events grouped into eight risk categories: insurance, market, credit, liquidity, operational, regulatory and legal, group and strategic), the risk appetite set by the Beazley plc board, and the control environment that is operated by the business to remain within the risk appetite.
The above diagram illustrates the components of the risk management framework.
In summary, the board identifies risk, assesses risk and sets risk appetite. The business then implements a control environment which describes how the business should operate to stay within risk appetite. Risk management then reports to the board on how well the business is operating using a consolidated assurance report. For each risk, the consolidated assurance report brings together a view of how successfully the business is managing risk, qualitative commentary from the assurance functions and whether there have been any events that we can learn from (risk incidents). Finally, the framework is continually evaluated and where appropriate improved, through the consideration of stress and scenario testing, themed reviews using risk profiles and an assessment of strategic and emerging risks.

Strategic report
www.beazley.com Annual report 2017 Beazley 59
A suite of risk management reports are provided to the boards and committees to assist senior management and board members to discharge their oversight and decision making responsibilities. The risk reports include the risk appetite statement, the consolidated assurance report, risk profiles, stress and scenario testing, reverse stress testing, an emerging and strategic report, a report to the remuneration committee and the ORSA report.
The internal audit function considers the risk management framework in the development of its audit universe to determine its annual risk-based audit plan. The plan is based on, among other inputs, the inherent and residual risk scores as captured in the risk register. Finally, a feedback loop operates, with recommendations from the internal audit reviews being assessed by the business and the risk management function for inclusion in the risk register as appropriate.
Viability statementThe directors have completed a robust assessment of the viability of the group over a three year period. A period of three future years has been selected to be short enough to be reasonably assessable but long enough to reflect Beazley’s risk profile of a portfolio of diversified short-tailed and medium-tailed insurance liabilities. This three year period also aligns with the length of time over which business underwritten at Lloyd’s, being the majority of our insurance business, is managed. The board has performed an annual risk assessment and the key risks to the group in the future are summarised on pages 60 and 61.
The risks and associated capital requirements have been brought together into a five year plan. The main assumption is that the current market conditions will prevail, over which the outcomes of the board’s strategic initiatives are overlaid. In addition, the board has reviewed the sensitivity of key assumptions and has performed scenario testing to understand the impact on cashflows of the key risks of a major natural catastrophe and/or a systemic mispricing of the medium-tailed liability classes.
The chief risk officer provides a quarterly ORSA to the board summarising the short term and longer term risks to the group and the capital implications.
The directors have concluded, based on this review, that there is a reasonable expectation that the group will be able to continue in operation and meet its liabilities as they fall due over the three year period of assessment.

www.beazley.com60 Beazley Annual report 2017
Risk management continued
The risks to financial performance
The board monitors and manages risks grouped into eight categories, which cover the universe of risk that could affect Beazley. There have been no new risk areas identified and no major shifts in existing risks. The board considers the following two risk categories to be the most significant.
Insurance riskGiven the nature of Beazley’s business, the key risks that impact financial performance arise from insurance activities. The main insurance risks can be summarised in the following categories:• Market cycle risk: The risk of
systematic mispricing of the medium tailed specialty lines business which could arise due to a change in the US tort environment, changes to the supply and demand of capital, and companies using incomplete data to make decisions. This risk would affect multiple classes within the specialty lines division across a number of underwriting years. The group uses a range of techniques to mitigate this risk including sophisticated pricing tools, analysis of macro trends, analysis of claim frequency and the expertise of our experienced underwriters and claims managers.
• Natural catastrophe risk: The risk of one or more large events caused by nature affecting a number of policies and therefore giving rise to multiple losses. Given Beazley’s risk profile, such an event could be a hurricane, major windstorm or earthquake. This risk is monitored using exposure management techniques to ensure that the risk and reward are appropriate and that the exposure is not overly concentrated in one area.
• Non natural catastrophe risk: This risk is similar to natural catastrophe risk except that multiple losses arise from one event caused by mankind. Given Beazley’s risk profile, examples include a coordinated cyber attack, an act of terrorism, an act of war or a political event. This risk is monitored using exposure management techniques to ensure that the risk and reward are appropriate and that the exposure is not overly concentrated in one area.
• Reserve risk: Beazley has a consistent reserving philosophy. However, there is a risk that the reserves put aside for expected losses turn out to be insufficient. This could be due to any of the three drivers of risk described above. The group uses a range of techniques to mitigate this risk including a detailed reserving process which compares, claim by claim, estimates established by the claims team with a top down statistical view developed by the actuarial team. A suite of metrics is also used to ensure consistency each year.
• Single risk losses: Given the size of policy limits offered on each risk, it is unlikely that the poor performance of one policy will have a material impact on the group’s financial performance.
Strategic riskAlongside these insurance risks, the success of the group depends on the execution of an appropriate strategy. The main strategic risks can be summarised as follows:• Strategic decisions: The group’s
performance would be affected in the event of making strategic decisions that do not add value. The group mitigates this risk through the combination of recommendations and challenge from non-executive directors, debate at the executive committee and input from the strategy and performance group (a group of approximately 35 senior individuals from across different disciplines at Beazley).
• Environment: There is a risk that the chosen strategy cannot be executed because of the current environmental conditions within which Beazley operates, thereby delaying the timing of the strategy.
• Communication: Having the right strategy and environment is of little value if it is not communicated internally so that the whole group is heading in the same direction, or if key external stakeholders are not aware of Beazley’s progress against its strategy.
• Senior management performance: There is a risk that senior management could be overstretched or could fail to perform, which would have a detrimental impact on the group’s performance. The performance of the senior management team is monitored by the chief executive and talent management team and overseen by the nomination committee.

Strategic report
www.beazley.com Annual report 2017 Beazley 61
• Reputation: Although reputational risk is a consequential risk, i.e. it emerges upon the occurrence of another risk manifesting, it has the potential to have a significant impact on an organisation. Beazley expects its staff to act honourably by doing the right thing.
• Flight: There is a risk that Beazley could be unable to deliver its strategy due to the loss of key personnel. Beazley has controls in place to identify and monitor this risk, for example, through succession planning.
• Crisis management: This is the risk caused by the destabilising effect of the group having to deal with a crisis and is mitigated by having a detailed crisis management plan.
• Corporate transaction: There is a risk that Beazley could undertake a corporate transaction which did not return the expected value to shareholders. This risk is mitigated through the due diligence performed, the financial structure of transactions and the implementation activity.
Under the environmental risk heading, the board identifies and analyses emerging and strategic risk on an annual basis for discussion at the board strategy day in May.
Other risksThe remaining six risk categories monitored by the board are:• Market (asset) risk: This is the risk
that the value of investments could be adversely impacted by movements in interest rates, exchange rates, default rates or external market forces. This risk is monitored by the investment committee.
• Operational risk: This risk is the failure of people, processes and systems or the impact of an external event on Beazley’s operations, and is monitored by the operations committee. An example would be a cyber attack having a detrimental impact on our operations.
• Credit risk: Beazley has credit risk to its reinsurers, brokers and coverholders of which the reinsurance asset is the largest. The underwriting committee monitors this risk.
• Regulatory and legal risk: This is the risk that Beazley might fail to operate in line with the relevant regulatory framework in the territories where it does business. Of the eight risk categories, the board has the lowest tolerance for this risk. This risk is monitored by the risk and regulatory committee.
• Liquidity risk: This is the risk that the group might not have sufficient liquid funds following a catastrophic event. The investment committee monitors this risk which, given the nature of the asset portfolio, is currently small.
• Group risk: The structure of the Beazley group is not complex and so the main group risk is that one group entity might operate to the detriment of another group entity or entities. This includes, for example, changes in tax legislation such as the US Tax Cuts and Jobs Act enacted in late 2017 which affects which types of intra-group reinsurance it is efficient for Beazley to use. The Beazley plc board monitors this risk through the reports it receives from each entity.
Anti-bribery and corruption risk The group also considered anti-bribery and corruption risk across all risk categories. We are committed to ensuring that all business is conducted in an ethical and honest manner, and that we are not involved in any illicit activity defined under the UK Bribery Act and US Foreign Corrupt Practices Act. This risk includes the risk of bribery and corruption we are exposed to and manifests itself in the susceptibility to unethical or dishonest influences whereby illicit payments and/or inducements are either made or received. Such activity has severe reputational, regulatory and legal consequences, including fines and penalties. Considerations relevant to this risk include the nature, size and type of transactions, the jurisdiction in which transactions occur, and the degree to which agents or third parties are used during such transactions. Every employee and individual acting on Beazley’s behalf is responsible for maintaining our reputation. We have a zero-tolerance approach to bribery and corruption and are committed to acting professionally, fairly and with integrity in all aspects of our business. In doing so, we aim to recruit and retain high-calibre employees who carry out their responsibilities honestly, professionally and with integrity. We maintain a number of policies designed to prevent any risk of bribery and corruption, which are communicated to all employees and supplemented with appropriate training.

www.beazley.com62 Beazley Annual report 2017
Responsible businessKeeping our momentum in 2017Our vision is to use our expertise, influence and passion as a force for good in our local communities and the wider world
The energy and passion of our people contributed to making a difference, within our communities and in the wider world, in 2017. Four years ago we launched our global Make a Difference month with 75 employees taking action in our communities. This year almost 500 employees took part. We raised over $115,000 for our global charity partner, All Hands and Hearts, and by supporting the fundraising efforts of our people we donated a further $33,000 to charities around the world. We also launched our first ever global volunteering with All Hands and Hearts, which saw eight Beazley employees spend two weeks in Nepal building a much-needed community school.
We began a conversation across the business on how we can design more products that are not only profitable but that also benefit society and the environment.
We are determined to keep our momentum going – throughout this year our volunteering increased by 14% and we want to keep building on that next year. We plan to do more environmentally next year as well as delivering products with a purpose.
Products with a purpose Beazley’s Marketplace workstream focuses on the impact that we have on the world through our business, insurance. We strongly believe that insurance in itself is a force for good – facilitating economic activity and development, helping to protect people, property and businesses from the worst effects of adverse events, and enabling them to recover more swiftly when risks materialise.
However, beyond this, we think there is a huge amount of scope for the insurance industry to bring its expertise in risk management to bear in improving outcomes for our insureds and the societies and environment in which they operate. Our insurance products can work harder to achieve this. We call them ‘Products with a Purpose’ – a positive purpose, beyond the direct cover provided to the insured.
“ At Beazley, we pride ourselves on our ability to think creatively and provide innovative solutions to challenges. We are now bringing this innovative force to bear on some of the challenges the world faces. The insurance industry is well positioned to do this – our business is managing risks. Beyond helping to meet the financial costs of insured events, we can use our expertise to promote sustainability efforts through managing and mitigating risks, and promoting resilience.”
Christian Tolle Head of political, accident & contingency
Marketplace

Strategic report
www.beazley.com Annual report 2017 Beazley 63
Finding products with a purposeOur new Marketplace strategy prioritises the pursuit of positive externalities. With the support of the executive committee, underwriters from across the business are embarking on a process to explore how, through our insurance products, we can improve environmental and social outcomes, not just for our clients but for the uninsured people and places affected by an insured event occurring.
Using the United Nations’ Sustainable Development Goals to inspire and motivate participants, we are working with an external sustainability consultant to run workshops to raise our business teams’ understanding of global environmental and social challenges. Through this process we will consider how we can make changes to existing policies to incentivise better outcomes, create new policies addressing these issues, and/or design additional risk mitigation services to help our insureds better manage their risks – while continuing to meet our clients’ needs and maintain profitability.
Marketplace
Capacity of Lloyd’s Disaster Risk Facility
$425m
Emma Whiteacre Lloyd’s Disaster Risk Facility
This year we have formalised our participation in the Lloyd’s Disaster Risk Facility (DRF) with a consortium agreement with six other syndicates, although this was not utilised in 2017. With a headline capacity of $425m for any risk, the facility can support governments or organisations in emerging markets to improve resilience and deal with the economic consequences of natural disasters. Through the DRF, we are represented on the Insurance Development Forum, an industry body focused on increasing the use of insurance and its associated risk management capabilities to increase resilience and protection for vulnerable countries and communities.
“ I am very proud of the way we at Beazley contribute to our communities, our charities and the environment. It is a key part of Being Beazley and something that matters enormously to our people.”
Andrew Horton Chief executive

Charity and community
www.beazley.com64 Beazley Annual report 2017
Responsible business continuedKeeping our momentum in 2017 continued
Our charity efforts are overseen by two charity and community committees, one for the US and one for UK, Asia and Europe, made up of volunteers across the business. The committees manage our charity partnerships and this year launched our global charity partnership with All Hands and Hearts. We chose this charity because of their innovative approach focused on deploying volunteers to areas in need and their relatively small size, which means that our involvement can be more impactful.
$417,000+Donated to charity
All Hands and Hearts have offices in both the UK and US and respond to the needs of communities impacted by devastation from natural disasters, which encompasses the following steps:
> Respond – engaging and leveraging volunteers, partner organisations and local communities to take part in activities like ‘mucking and gutting’ after a flood, clearing after an earthquake or safe demolition for buildings that are dangerous;
> Recover – working together with communities to meet their longer term needs by rebuilding the basic ‘hubs’ of a community, including homes, schools, daycare facilities and community centres; and
> Renew – becoming part of the fabric of the communities they serve. Projects have included weekly movie nights for kids in Malawi to offset the devastation with smiles and laughter, holding weekly English tutoring sessions in the Philippines or hosting a Thanksgiving dinner for hundreds of flood victims in Detroit.
This is the first time Beazley has had one global charity partner and we have seen strong engagement from our employees in the partnership. In addition to supporting Beazley organised fundraising, we have seen employees fundraise for All Hands and Hearts through individual and group activities. We have also seen the benefit of choosing a charity partner that links to our business, with Texas based colleagues being able to work with All Hands and Hearts to make a difference immediately in Houston following Hurricane Harvey.
As part of our partnership agreement Beazley donated $52,000 to All Hands and Hearts in 2017, a sum which was supplemented by fundraising and matchfunding from our employees.
Our committees also encourage and support Beazley people to participate in charitable activities. The most significant change this year has been the introduction of a business sponsored volunteer event. We offered the chance for eight employees to volunteer on an All Hands and Hearts project to rebuild a school in Nepal. This was very well received by employees with over 150 colleagues registering interest and then almost 50 applying. A working group was established to select the volunteers. Eight colleagues from across the business were then chosen, including a charity committee member to lead the group. The volunteers were in Nepal for two weeks from Saturday, 4 November to Saturday, 18 November.
Nepal volunteers
“ We are truly thankful to Beazley for their support over the past 11 months.”
All Hands and Hearts

Charity and community Strategic report
www.beazley.com Annual report 2017 Beazley 65
“ Their (Team Beazley) contribution to the two projects was commendable and is highly appreciated. We miss them all and would love to have them back.”
All Hands and Hearts
Also in 2017 we increased our employee matchfunding threshold from $500 to $750 (or local currency equivalent) per employee. We match employee fundraising efforts so that employees are encouraged to make a difference on a local level for charities close to their own hearts. We’ve continued to promote this benefit thoughout the year and have seen a consistently strong level of take up.
The charity committees help support employees who would like to organise internal fundraising activities or activities for groups of people to get involved in.
> Ten Beazley colleagues, led by Dan Jones, took part in the Rocky Mountain Colorado challenge, raising over $10,000 for All Hands and Hearts, which went towards helping families recover from severe flooding in Louisiana, US.
> Also, in September, the ‘All Hands No Legs’ team of seven Beazley employees took part in the 75km Thames Kayak Challenge over two days, raising over £4,000 for All Hands and Hearts to support their work in Nepal, Peru and Houston.
Beazley volunteers
Atlanta volunteers
In addition, examples of other employee led events in 2017 included:
> Numerous Cycle for Survival events to raise funds for rare cancer research;
> Singapore’s first fundraising event of a broker quiz night;
> Members of the New York office teamed up with Marsh and volunteered to serve a catered lunch for families with sick children, including donating toys to children;
> Farmington’s chilli cook-off;
> Members of the Dallas office partnered with Lockton to help feed children in need for the Children’s Hunger Fund in Dallas; they supported Arthur J. Gallagher at a charity sand volleyball game to support children in need and have been working with our charity partner, All Hands and Hearts, to support those recovering from Hurricane Harvey; and
> Over 80 employees took part in the JP Morgan Run, raising money for the Macmillan Trust in London. Colleagues in Farmington and Paris also took part in similar 5K runs to raise money to support local cancer charities.
These events not only raise donations and awareness for All Hands and Hearts and other charities, but also help strengthen employee engagement.

Global Crises Response With the support and encouragement of our people, we respond during large scale disasters, particularly if it affects the communities where we work. We have donated over $33,000 to charities, including the relief efforts for the flooding in Peru, South Asia, Quebec, and the aftermath of Hurricanes Harvey and Irma.
Celebrating making a difference in our communitiesWe successfully delivered our global Make a Difference volunteering initiative for a fourth consecutive year, which gives employees up to one day to volunteer in their communities. This year we had nearly 500 employees take part, including employees from Canada and Birmingham who participated for the first time. Activities were selected at a local level, with the support of the Charity and Community Committee, in order to ensure that our people could select activities they were passionate about. Activities ranged from working at a farm to harvest crops for local food pantries, sorting food at food banks, preparing and serving meals to the homeless, spending time with local pensioners, upgrading community facilities likes crèches and parks through to supporting young people to get back to school with school supplies. The Farmington office also hosted 60 of our employees’ children who helped assemble care packages and thank you notes for members of the military. The children also drew pictures for an All Hands and Hearts initiative for families in Nepal.
Educating and supporting the next generationWe continued our mentoring programme for a third successful year with 35 Beazley volunteers mentoring Year 10 (15-16 year old) students in East London.
Nineteen local young people were hired as summer interns in our UK and US offices, with seven being returnees from last year. Also, 10 Beazley volunteers helped improve reading and numerical skills for six children in Tower Hamlets.
Beazley was awarded the ‘Employer of the Year’ award for the second time by the Brokerage CityLink to recognise our work on their internship programme.
Beazley volunteers in mentoring programme
35
In the US and the UK we have facilitated and hosted four workshops for over 90 young people to increase their knowledge of the insurance sector and how to build their careers as part of our aim to inspire interest in the insurance market within our community. We have expanded our community focus in the US, after initially focusing on our offices in Farmington and Atlanta.
We hosted a stall at the Lloyd’s Careers Fair event for school leavers and undergraduates in our community, with six volunteers taking part.
Intern graduation
Hurricane Irma aftermath
Volunteering in London
Charity and community continued
www.beazley.com66 Beazley Annual report 2017
Responsible business continuedKeeping our momentum in 2017 continued

Scope 1
51.48Scope 2
1,057.04Scope 3
5,718.74tCO2e/employee/year
7.11 For further information, please refer to page 72.
Latest Greenhouse Gas Emission figures (tonnes CO2 equivalent)1
To ensure we support and protect the environment as effectively as possible, we focus on three key areas:
1. Our offices: ensuring the environmental impact from our offices is minimal and finding ways to enhance our buildings so they have a more positive impact;
2. Our procurement: leveraging our buying power and working with suppliers to make a positive environmental impact; for example reviewing packaging from lunch providers to ensure minimum packaging used; if feasible sharing suppliers with other tenants to decrease deliveries; and
3. Our people & communications: engaging our people to help achieve our goals, encourage them to consider their environmental approach outside of work and keep them informed of what we are doing.
EnvironmentWe refreshed our Environmental Policy in November 2017, renewing our commitment to managing our environmental impacts, including:
> Monitoring environmental performance – Since 2008 we have monitored a range of environmental key performance indicators including energy consumption and greenhouse gas emissions, and are using this information to identify and realise opportunities to improve our performance;
> Sustainable procurement – We have developed and implemented formal procedures to ensure that environmental impacts are considered and managed during the procurement process;
> Waste management – We actively facilitate recycling of our office waste at all Beazley office locations and review regularly our waste management practices and identify opportunities to improve. Our focus is on reduction and on implementing methods to support this; and
> ClimateWise – Beazley has been a signatory to the insurance sector’s ClimateWise initiative since 2007.
We are tenants in all our buildings globally and, working closely with our landlords, we lead and support on environmental initiatives in our offices.
In January 2018 we will be moving to a new office in Birmingham and have created a green environment which features recyclable furniture and energy-saving initiatives.
This year, the New York office adopted more stringent recycling procedures, following the enactment of a local law in August 2017, which enforces more rigorous procedures within the building and enables Beazley as a tenant to recycle more effectively. Also, in our London office we have implemented ‘follow me’ printing technology and installed hand dryers in our bathrooms to reduce our paper usage.
Strategic report
www.beazley.com Annual report 2017 Beazley 67

Diversity & InclusionDiversity in our workforce Having a talented workforce that reflects the customers we serve and the communities we work in is a key enabler of our vision. Our diversity and inclusion vision is to inspire and develop people with diverse perspectives to thrive at all levels of our business.
During 2017, we continued with our focus on enhancing gender diversity, in particular at more senior levels of the organisation. As part of that, we became the first Lloyd’s managing agent to sign up to HMT’s Women in Finance Charter. Through the charter we have committed to increase the women in our senior leadership team to at least 35% by the end of 2020. You can see more information about the charter at www.beazley.com including the other commitments we have made, such as a link to the chief executive and finance director’s variable pay. We are also members of the 30% Club, which is further demonstration of our commitment to gender diversity.
#BeBoldForChange
Workplace
“We are proud of the progress we’re making on our journey to an inclusive culture that capitalises on the diversity of our people. We know there is still a fair distance to travel but we are confident that the steps we’re taking will lead us to our vision.” Rob Anarfi Chairman of diversity steering group
Senior managementMale
76Female
30
3
Total 2017 – 106
All employeesMale
607Female720
Total 2017 – 1,327
Employee diversity by gender
Beazley plc boardMale
10Female
Total 2017 – 13
www.beazley.com68 Beazley Annual report 2017
Responsible business continuedKeeping our momentum in 2017 continued

Statement on the Modern Slavery Act 2015 We abide by and are committed to the requirements of the Modern Slavery Act. We continue to work to ensure there is no slavery, human trafficking or forced labour in our supply chains.
Anti-corruption and anti-bribery We are committed to ensuring that our business is conducted in an ethical and honest manner, and to ensuring our continued compliance with all applicable bribery and corruption legislation, including the UK Bribery Act and US Foreign Corrupt Practices Act.
We maintain an anti-bribery and corruption policy, which is communicated to all employees and is supplemented with appropriate training.
Further information regarding our approach to anti-bribery and corruption can be found on our website.
Health & Wellbeing Beazley supports and encourages employees to have healthy lifestyles and considers their wellbeing a part of Being Beazley. We actively ensure our office environments support a healthy workplace, even down to providing fresh fruit every day in our offices.
We have health and wellbeing champions across the business globally and this year they have organised and promoted a range of health and wellbeing activities in our offices, from informative briefing sessions on healthy living through to massage sessions. We continually update and promote our Beazley health and wellbeing online site so our people have advice and information to hand about healthy lifestyles.
In November we focused on mental health and featured a different article each week on our intranet homepage with colleagues opening up and sharing their stories including depression and obsessive compulsive disorder. We also had colleagues share experiences on living with type 1 diabetes and balancing work and family.
We carry out health and safety risk assessments at all locations to ensure safety and correct protocols are in place at all locations. We also ensure our people are trained in first aid and fire procedures to ensure the safety of our employees.
We have also expanded our activity to cover other areas of diversity. The 2017 highlights are set out below.
NetworksOur 2017 staff survey showed that our people have become increasingly engaged with our diversity and inclusion initiative.
This has also been demonstrated by people initiating three employee networks, each of which is sponsored by an executive committee member:
> PROUD@BEAZLEY for our LGBT+ employees and their allies;
> Beazley Young Professionals representing the interests of our young talent; and
> Empowered, which supports the varying cultures represented within our organisation.
StonewallWe have become proud members of Stonewall who will work with us to identify the best support for our colleagues in the LGBT+ community.
Disability ForumWe have also joined the Disability Forum. Our learning from the forum will help us to make our organisation and working environment more ‘disability smart’.
We believe it is important that our people feel comfortable to be themselves at work. Acknowledging important events in the diversity calendar helps to reinforce our inclusive culture and environment. This is why in 2017 we celebrated across all locations in the group, PRIDE, International Men’s and International Women’s days.
Workplace Strategic report
www.beazley.com Annual report 2017 Beazley 69

www.beazley.com70 Beazley Annual report 2017
Principal activityBeazley plc is the ultimate holding company for the Beazley group, a global specialist risk insurance and reinsurance business operating through: its managed syndicates at Lloyd’s in the UK; Beazley Insurance Company, Inc., a US admitted carrier in the US; and Beazley Insurance dac, a European insurance company, in Ireland.
Management reportThe directors’ report, together with the strategic report on pages 1 to 73, serves as the management report for the purpose of Disclosure and Transparency Rule 4.1.8R.
Directors’ responsibilitiesThe statement of directors’ responsibilities in respect of the annual report and financial statements is set out on page 117.
Review of businessA more detailed review of the business for the year and a summary of future developments are included in the chairman’s statement, the chief executive’s statement and the financial review.
Results and dividendsThe consolidated profit before taxation for the year ended 31 December 2017 amounted to $168.0m (2016: $293.2m).
The directors announce a second interim dividend of 7.4p per ordinary share (2016 second interim dividend: 7.0p; 2016 special dividend: 10.0p per ordinary share). The dividend, together with the first interim dividend of 3.7p per ordinary share (2016 first interim dividend: 3.5p), give a total of 11.1p (2016: 20.5p).
The aforementioned second interim dividend will be paid on 28 March 2018 to shareholders on the register on 2 March 2018.
Going concern and viability statementA review of the financial performance of the group is set out on pages 42 to 51. The financial position of the group, its cash flows and borrowing facilities are included therein.
After reviewing the group’s budgets and medium term plans, the directors have a reasonable expectation that the group has adequate resources to continue in operational existence for the foreseeable future. For this reason they continue to adopt the going concern basis in preparing the accounts.
In accordance with provision C.2.2 of the UK Corporate Governance Code, the directors have assessed the viability of the group. The viability statement, which supports the going concern basis mentioned above, is included in the risk management section at page 59.
DirectorsThe directors of the company who served during 2017 and/or to the date of this report were as follows:Dennis Holt Non-executive chairman David Andrew Horton Chief executiveGeorge Patrick Blunden Non-executive directorMartin Lindsay Bride Finance directorAdrian Peter Cox DirectorAngela Doreen Crawford-Ingle Non-executive directorChristine LaSala Non-executive directorSir John Andrew Likierman Non-executive directorNeil Patrick Maidment DirectorDavid Lawton Roberts Non-executive director (appointed 01/11/2017)John Peter Sauerland Non-executive director Robert Arthur Stuchbery Non-executive director Clive Andrew Washbourn Director (resigned 20/07/2017)Catherine Marie Woods Non-executive director
Directors’ report

Strategic report
www.beazley.com Annual report 2017 Beazley 71
The board is complying with the provision on annual re-election of all directors in accordance with the UK Corporate Governance Code. The appointment and replacement of directors is governed by the Company’s Articles of Association (the ‘Articles’), the UK Corporate Governance Code (the ‘Code’), the Companies Act 2006 and related legislation. The Articles may be amended by a special resolution of the shareholders. Subject to the Articles, the Companies Act 2006 and any directions given by special resolution, the business of the company will be managed by the board who may exercise all the powers of the company.
Further information can be found in the statement of corporate governance on page 81.
Directors’ interestsThe directors’ interests in shares of the company, for those directors in office at the end of the year, including any interests of a connected person (as defined in the Disclosure and Transparency Rules of the UK’s Financial Conduct Authority), can be found in the directors’ remuneration report on page 97.
Details of directors’ service contracts are given in the directors’ remuneration report. The directors’ biographies are set out in the board of directors section of this report.
Corporate governanceThe company’s compliance with corporate governance is disclosed in the statement of corporate governance on pages 81 to 95.
Corporate, social and environmental responsibilityThe company’s corporate, social and environmental policy is disclosed pages 62 to 69. During 2017 Beazley donated over $417,000 to charities, details of which can be found in the responsible business report on page 64.
No political donations were made by the group in either the current or prior reporting period.
Risk managementThe group’s approach to risk management is set out on pages 55 to 61 and further detail is contained in note 2 to the financial statements on pages 142 to 154.
Substantial shareholdingsAs at 7 February 2018, the board had been notified of, or was otherwise aware of, the following shareholdings of 3% or more of the company’s issued ordinary share capital:
Number ofordinary shares %
Invesco Perpetual 70,727,770 13.5MFS Investment Management 62,481,250 11.9Aberdeen Standard Investment 22,959,155 4.4Dimensional Fund Advisors 22,798,729 4.3BlackRock 20,454,634 3.9SKAGEN Fondene 17,463,726 3.3JP Morgan Asset Management 16,521,041 3.1
Note: All interests disclosed to the company in accordance with DTRs that have occurred can be found on the news and alerts section of our corporate website: www.beazley.com
Recent developments and post balance sheet eventsRecent developments and post balance sheet events are given in note 34 to the financial statements on page 192.
Likely future developmentsInformation relating to likely future developments can be found in the strategic report.
Research and developmentIn the ordinary course of business the group develops new products and services in each of its business divisions and develops IT solutions to support the business requirements.
Diversity and inclusionInformation concerning diversity and inclusion can be found in the responsible business section on page 68 and in the statement on corporate governance on page 94.
The directors have pleasure in presenting their report and the audited financial statements of the group for the year ended 31 December 2017
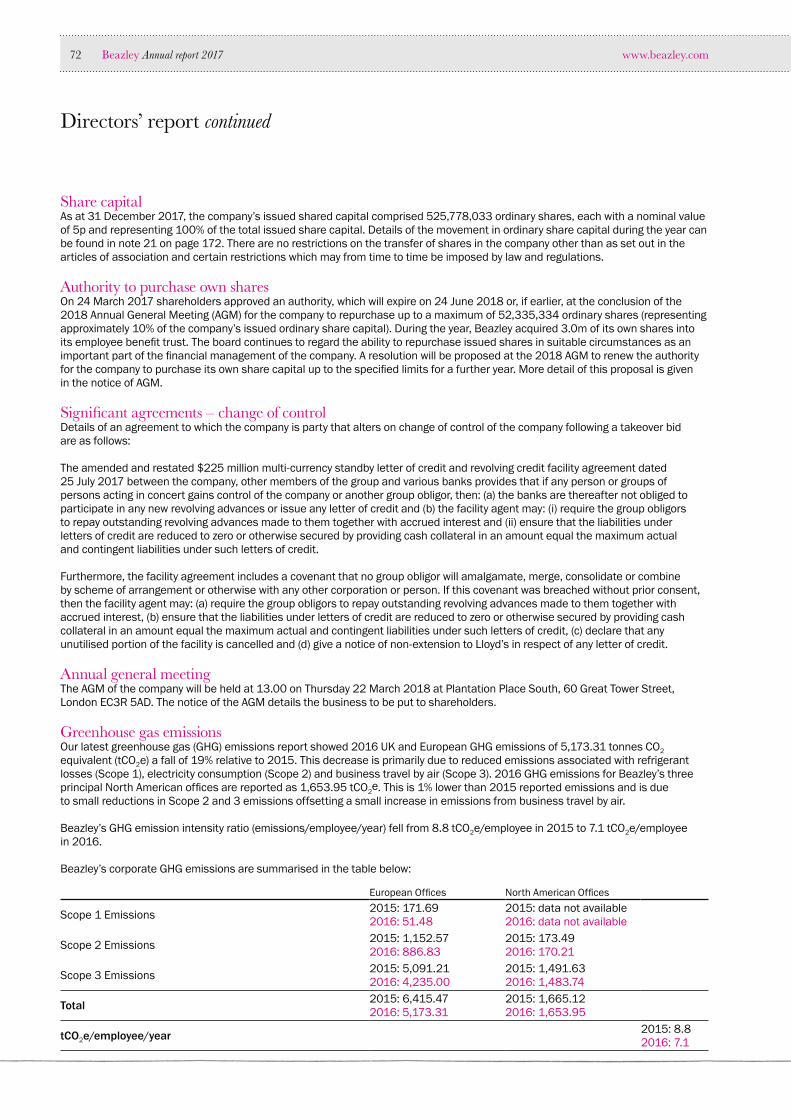
www.beazley.com72 Beazley Annual report 2017
Share capitalAs at 31 December 2017, the company’s issued shared capital comprised 525,778,033 ordinary shares, each with a nominal value of 5p and representing 100% of the total issued share capital. Details of the movement in ordinary share capital during the year can be found in note 21 on page 172. There are no restrictions on the transfer of shares in the company other than as set out in the articles of association and certain restrictions which may from time to time be imposed by law and regulations.
Authority to purchase own sharesOn 24 March 2017 shareholders approved an authority, which will expire on 24 June 2018 or, if earlier, at the conclusion of the 2018 Annual General Meeting (AGM) for the company to repurchase up to a maximum of 52,335,334 ordinary shares (representing approximately 10% of the company’s issued ordinary share capital). During the year, Beazley acquired 3.0m of its own shares into its employee benefit trust. The board continues to regard the ability to repurchase issued shares in suitable circumstances as an important part of the financial management of the company. A resolution will be proposed at the 2018 AGM to renew the authority for the company to purchase its own share capital up to the specified limits for a further year. More detail of this proposal is given in the notice of AGM.
Significant agreements – change of controlDetails of an agreement to which the company is party that alters on change of control of the company following a takeover bid are as follows:
The amended and restated $225 million multi-currency standby letter of credit and revolving credit facility agreement dated 25 July 2017 between the company, other members of the group and various banks provides that if any person or groups of persons acting in concert gains control of the company or another group obligor, then: (a) the banks are thereafter not obliged to participate in any new revolving advances or issue any letter of credit and (b) the facility agent may: (i) require the group obligors to repay outstanding revolving advances made to them together with accrued interest and (ii) ensure that the liabilities under letters of credit are reduced to zero or otherwise secured by providing cash collateral in an amount equal the maximum actual and contingent liabilities under such letters of credit.
Furthermore, the facility agreement includes a covenant that no group obligor will amalgamate, merge, consolidate or combine by scheme of arrangement or otherwise with any other corporation or person. If this covenant was breached without prior consent, then the facility agent may: (a) require the group obligors to repay outstanding revolving advances made to them together with accrued interest, (b) ensure that the liabilities under letters of credit are reduced to zero or otherwise secured by providing cash collateral in an amount equal the maximum actual and contingent liabilities under such letters of credit, (c) declare that any unutilised portion of the facility is cancelled and (d) give a notice of non-extension to Lloyd’s in respect of any letter of credit.
Annual general meetingThe AGM of the company will be held at 13.00 on Thursday 22 March 2018 at Plantation Place South, 60 Great Tower Street, London EC3R 5AD. The notice of the AGM details the business to be put to shareholders.
Greenhouse gas emissionsOur latest greenhouse gas (GHG) emissions report showed 2016 UK and European GHG emissions of 5,173.31 tonnes CO2 equivalent (tCO2e) a fall of 19% relative to 2015. This decrease is primarily due to reduced emissions associated with refrigerant losses (Scope 1), electricity consumption (Scope 2) and business travel by air (Scope 3). 2016 GHG emissions for Beazley’s three principal North American offices are reported as 1,653.95 tCO2e. This is 1% lower than 2015 reported emissions and is due to small reductions in Scope 2 and 3 emissions offsetting a small increase in emissions from business travel by air.
Beazley’s GHG emission intensity ratio (emissions/employee/year) fell from 8.8 tCO2e/employee in 2015 to 7.1 tCO2e/employee in 2016.
Beazley’s corporate GHG emissions are summarised in the table below:
European Offices North American Offices
Scope 1 Emissions 2015: 171.692016: 51.48
2015: data not available2016: data not available
Scope 2 Emissions 2015: 1,152.572016: 886.83
2015: 173.492016: 170.21
Scope 3 Emissions 2015: 5,091.212016: 4,235.00
2015: 1,491.632016: 1,483.74
Total 2015: 6,415.472016: 5,173.31
2015: 1,665.122016: 1,653.95
tCO2e/employee/year 2015: 8.82016: 7.1
Directors’ report continued

Strategic report
www.beazley.com Annual report 2017 Beazley 73
Notes:i) We have disclosed global GHG emissions that we are responsible for as set out by the Companies Act 2006 (Strategic Report and Directors’ Report) Regulations 2013.ii) GHG emissions are calculated and presented in accordance with DEFRA Environmental Reporting Guidelines, using the UK Government’s GHG Conversion Factors for Company Reporting 2016. iii) Reporting is based on operational control. Beazley does not have operational control over the building infrastructure and plant at its offices due to the presence of facility management companies and shared tenancies; as a result, emissions primarily fall within Scope 2 and 3 of the Greenhouse Gas Protocol.iv) Reported Scope 1 sources are: company cars, fuel use in back-up generators and fugitive refrigerant losses from AC systems. Emissions associated with electricity used in Beazley’s offices and data centres are reported as Scope 2 emissions. Scope 3 sources include: business travel by air, rail and leased cars, and transmission and distribution of electricity. v) UK and European office reporting covers activity associated with our principal UK office, Plantation Place South, and our Dublin office. These sites collectively account for 96% of Beazley’s UK/European permanent and contracted staff in 2016.vi) US office reporting covers activity associated with three US offices, Farmington, New York and Chicago, which in 2016 collectively accounted for 63% of Beazley’s US employees.
The scope of 2016 reporting is consistent with that for 2015. We plan to expand the 2017 scope of reporting to include our Atlanta office; this will take US office coverage to 80% of employees (based on 2016 occupancy).
AuditorKPMG LLP has indicated their willingness to continue in office. Accordingly, a resolution to reappoint KPMG LLP as the auditor of the company will be proposed at the annual general meeting.
Disclosure of information to auditorThe directors who held office at the date of approval of this directors’ report confirm that, so far as they are each aware, there is no relevant audit information of which the company’s auditors are unaware; and each director has taken all the steps that he or she ought to have taken as a director to make himself or herself aware of any relevant audit information and to establish that the company’s auditors are aware of that information.
By order of the board, covering the strategic report from pages 1 to 69 and the directors’ report from pages 70 to 73.
C P OldridgeCompany secretary Plantation Place South 60 Great Tower Street LondonEC3R 5AD
7 February 2018

www.beazley.com74 Beazley Annual report 2017
Governance
75 Letter from our chairman76 Board of directors80 Investor relations81 Statement of corporate governance96 Letter from the chairman of our remuneration committee97 Directors’ remuneration report117 Statement of directors’ responsibilities118 Independent auditor’s report

Governance
www.beazley.com Annual report 2017 Beazley 75
Letter from our chairman
The board’s role is to set the company’s strategic aim, scrutinise management’s performance and ensure that the necessary financial and human resources are in place for the company to meet its objectives.
The board and its committees met regularly during the year to set direction and risk appetite and provided oversight and control of management in the day-to-day running of the business. We promote a culture of openness and debate at each meeting and seek to receive constructive challenge from the non-executive directors to help develop proposals on strategy and other matters. As chairman, I seek to ensure this is achieved, that appropriate decisions are then reached, and that we empower management to then execute those decisions, with our ongoing oversight and support. Each of the strategic initiatives has been assigned a non-executive sponsor. In May, we held our annual board strategy day and topics included were the long term plan, emerging risks and opportunities, deep dives into our specialty lines division and the Data and Analytics strategic initiative and a competitor analysis.
As part of planning for board succession, the nomination committee led the search for a new chairman and David Roberts was appointed to the board on 1 November 2017. I will step down from the board at the AGM in March 2018, having served two full three year terms as chairman, and David Roberts will take up the role of non-executive chairman. Details of the search process are set out in the nomination committee report.
Clive Washbourn resigned from the board on 20 July 2017 and we would like to thank him for his valuable contributions during his time on the board.
The company continues to be committed to the highest standards of corporate governance and the group’s robust system of governance has been designed to establish, implement and maintain effective controls, internal reporting and communication of information across all levels within the group. We believe these to be fundamental to the long term success of the company.
We ensure directors continually update their skills through individual development plans and board training. Talent development and succession planning are critical components of sustainable success and this starts at the very top, in the boardroom. On the board it is vital that we have the right balance and diversity of expertise, skills, experience and perspectives, in addition to independence of thought and action.
The group believes that diversity of the board contributes to group effectiveness and has developed a diversity strategy to support our commitment to being an equal opportunities employer. We achieved our goal of three female directors by the 2017 AGM, having gone from none to three within five years. We remain committed to our goal of a minimum of 35% of female senior managers within the organisation by 2020 and of 33% of female board members at group level by 2021. We are nevertheless committed to ensuring appointments are made on merit against selection criteria. Further details of our policy and goals are set out in the nomination committee report.
The board continues to engage with staff and a number of the non-executive directors travelled to various Beazley offices around the globe in 2017, met with staff and witnessed the culture of the company operating in practice.
The provision of timely, accurate and appropriate information to the board and committees is key to good governance. We regularly review the board information to ensure it is in a form, and of a quality, to enable the board to discharge its duties.
I am pleased to confirm the company has complied with the principles and provisions set out in the UK Corporate Governance Code throughout the year ended 31 December 2017. Details of the activities of the board and its committee also are set out on pages 82 to 95.
Dennis HoltChairman

www.beazley.com76 Beazley Annual report 2017
Board of directors

Governance
www.beazley.com Annual report 2017 Beazley 77
An effective board of directors made up of diverse and experienced members
Our committees and committee chairmen The audit and risk committee assists the board of directors in fulfilling its oversight responsibilities for the financial reporting process, the system of internal control, the audit process, and the company’s process for monitoring compliance with laws and regulations and the Beazley code of conduct. It also ensures that an effective risk management process exists in the major regulated subsidiaries and that the Beazley group has an effective framework and process for managing its risks.
The remuneration committee ensures that remuneration arrangements support the strategic aims of the business and enable the recruitment, motivation and retention of senior executives while complying with the requirements of regulatory and governance bodies, satisfying the expectations of shareholders and remaining consistent with the expectations of the wider employee population.
The nomination committee is focused on evaluating the board of directors, ensuring an appropriate balance of skills, considering and recommending board and committee candidates and considering board and executive committee succession.
Governance frameworkBoard of directorsAudit and risk committeeThe audit and risk committee is chaired by Angela Crawford-Ingle.
Nomination committeeThe nomination committee is chaired by Dennis Holt.
Remuneration committeeThe remuneration committee is chaired by Sir Andrew Likierman.
Executive committeeThe executive committee is chaired by Andrew Horton and acts under delegated authority from the board.
Find out more pages 87 to 96

www.beazley.com78 Beazley Annual report 2017
Appointed: 15 March 2001*Experience: Neil joined Beazley in 1990 and was appointed to the board in 1993. He has 33 years of Lloyd’s experience and, in 2011, joined the board of the Lloyd’s Market Association, becoming chairman on 1 January 2016. Neil was elected to the Council of Lloyd’s with effect from 1 February 2016. Committee: Executive committee
Neil MaidmentChief underwriting officer
Appointed: 12 June 2003*Experience: Andrew joined Beazley in June 2003 as finance director. Prior to that he held various financial positions within ING, NatWest and Lloyds Bank and was the chief financial officer for the UK wholesale banking division of ING immediately prior to joining Beazley. He qualified as a chartered accountant with Coopers and Lybrand in 1987. He joined the board of Man Group plc in 2013 as a non-executive director.Committee: Executive committee (chairman)
Andrew HortonChief executive officer
David RobertsNon-executive directorAppointed: 1 November 2017Experience: David is chairman of Nationwide Building Society and vice chairman of NHS England. He has over 30 years’ experience in financial services and was previously chairman and CEO of Bawag PSK AG, Austria’s second largest retail bank and an executive director and member of the group executive committee at Barclays plc, where he was responsible for the international retail and commercial banking business. Prior to joining Nationwide he was group deputy chairman at Lloyds Banking Group. His previous non-executive directorships include Absa Group SA and BAA plc.
Appointed: 1 January 2010*Experience: George is the senior independent director. He retired as senior vice president and director from AllianceBernstein Ltd in December 2009. He had previously been chief executive of Union plc, and a director of SG Warburg Securities, Seccombe, Marshall and Campion plc and Meridian Investment Performance Services. He is the chairman of the Charity Bank Ltd and chairman of Stonewater Ltd.Committees: Audit and risk committee, remuneration committee, nomination committee
George BlundenNon-executive director
Appointed: 25 March 2015*Experience: Andrew is Professor of Management Practice at the London Business School having served as Dean from 2009-2017. His career has spanned the public and private sectors as well as academic life, including ten years as Head of the UK Government Accountancy Service. He has had many non-executive director appointments, including the Bank of England, and is currently also a non-executive director of Times Newspapers Ltd.Committees: Remuneration committee (chairman), nomination committee
Sir Andrew LikiermanNon-executive director
Appointed: 21 July 2011*Experience: Dennis has more than 46 years’ experience in financial services markets. He was formerly a main board executive director at Lloyds TSB (2000-2001), chief executive of AXA UK and a member of AXA’s Global executive committee (2001-2006). He has been chairman of Liverpool Victoria and deputy chairman of Bank of Ireland. Dennis was appointed chairman of The Co-operative Bank plc in 2014.Committee: Nomination committee (chairman)
Dennis HoltChairman
Board of directors continued

Governance
www.beazley.com Annual report 2017 Beazley 79
Appointed: 27 March 2013*Experience: Angela is a chartered accountant with extensive audit experience of multinational and listed companies. She was a partner in PricewaterhouseCoopers specialising in financial services for 20 years during which time she led the insurance and investment management division and retired in 2008. She is currently a partner in Ambre Partners, a firm providing strategic, financial and operational advice. Angela is also currently a non-executive director and audit chair of Swinton Group Ltd and River and Mercantile Group plc.Committee: Audit and risk committee (chairman)
Angela Crawford-Ingle Non-executive director
Appointed: 5 May 2009*Experience: Martin joined Beazley in April 2009 as finance director. He began his career in insurance in 1985 and took up his first role as a finance director in 1996. He trained as a general insurance actuary, and his experience spans personal and commercial lines general insurance, the London market, life insurance and asset management in both the UK and France.Committee: Executive committee
Martin BrideGroup finance director
Appointed: 6 December 2010*Experience: Adrian joined Beazley in June 2001. Prior to this, Adrian was at General Re for eight years, writing both treaty and facultative business. Since 2001 his responsibilities have included the casualty treaty portfolio and the SME and large risks portfolios, before being promoted to head of specialty lines in 2008.Committee: Executive committee
Adrian CoxHead of specialty lines
Appointed: 1 January 2016*Experience: Catherine Woods is a non-executive director of AIB Plc, AIB Mortgage Bank, and EBS Dac. She is also the deputy chairman of the board at AIB Plc, senior independent director and chair of the audit committee. She was previously the finance expert on the adjudication panel established by the Irish government to oversee the rollout of the national broadband scheme. Her executive career was with JP Morgan where she was a vice president and head of the European banks equity research team. Catherine is a former non-executive director of An Post, and a former member of the Electronic Communications Appeals Panel.Committee: Audit and risk committee
Catherine WoodsNon-executive director
Executive directors Non-executive directors
* Where the appointment date of a director pre-dates 13 April 2016 (being the date that Beazley plc became the holding company of the Beazley group) this appointment date refers to their representation on the parent company of the Beazley group.
Appointed: 1 July 2016Experience: Based in New York, Christine retired as chair of Willis Towers Watson North America in 2016. She has 40 years of management, client leadership and financial experience in the insurance industry. This has included work as an underwriter and 27 years as an insurance broker working with large corporate and public institution clients designing their risk management programmes which included leadership roles at Johnson & Higgins and Marsh.Committee: Audit and risk committee
Christine LaSalaNon-executive director
Appointed: 5 May 2016Experience: John is chief financial officer of the Progressive Corporation, a US based insurance holding company. Prior to his current role, he was Progressive’s personal lines group president for eight years, responsible for the company’s primary business unit with $17bn in revenues. During his tenure as personal lines group president, he led the introduction of many innovations such as Name Your Price® and Snapshot®, the industry leading pay-as-you-drive offering. He also oversaw significant growth of the company’s direct marketing efforts and consumer facing web and mobile technology.Committee: Remuneration committee
John SauerlandNon-executive director
Robert StuchberyNon-executive directorAppointed: 11 August 2016Experience: Bob had previously been appointed as a non-executive director to the board of Beazley Furlonge Ltd, the group’s Lloyd’s managing agency, where he chairs the risk committee. He brings extensive Lloyd’s experience, having been CEO of Chaucer until 2015 and a deep knowledge of the Lloyd’s market and distribution and operational strategies.Committee: Audit and risk committee

www.beazley.com80 Beazley Annual report 2017
Investor relations
We place great importance on communication with shareholders. The annual report and accounts and the interim report are available to shareholders on the company’s website (www.beazley.com). A mailed copy of the accounts is also available on request. The company responds to individual letters from shareholders and maintains a separate investor relations centre within the existing www.beazley.com website, as a repository for all investor relations matters.
Financial reporting for insurance companies can seem to be complex. In order to help shareholders and potential investors better understand the key drivers of the business and its prospects, we have endeavoured to provide increasing levels of transparency and explanation in our communications. As a result, in addition to enhancing the information contained in the annual and interim reports, the investor relations centre on the company website contains a substantial amount of relevant information for investors, including key corporate data and news, presentations to analysts, information for the names’ of syndicate 623 and special purpose syndicate 6107, analyst estimates and a financial calendar. The website also gives investors the opportunity to sign up for an alert service as new information becomes available.
There is regular dialogue with institutional shareholders, as well as general presentations after the preliminary and interim results. The board is advised of any specific comments from institutional investors, to enable it to develop an understanding of the views of major shareholders. All shareholders have the opportunity to put questions at the company’s annual general meeting.
The company’s shares are listed on the London Stock Exchange. Prices are given daily in newspapers including the Financial Times, The Times, the Daily Telegraph, the Daily Mail and the Evening Standard.
Shareholding by type of investor
Mutual funds 52%Retail 12%Pensions 11%SWF 6%Insurance 6%Investment trusts 5%Trading 4%Directors 1%Hedge funds 1%Charities 1%ETF 1%
There are currently 14 analysts publishing research notes on the group. In addition to research coverage from Numis and JP Morgan, the company’s joint corporate broker, coverage is provided by Autonomous, Berenberg, Credit Suisse, Jefferies, Keefe Bruyette & Woods, Peel Hunt, Shore Capital, Investec, Sanford Bernstein, Stockdale Securities, UBS and RBC.
Share price performance
Beazley MCX Index FTSE 350 IndexASX Index
0
100
200
300
400
500
600
700
Jan2006
Jan2007
Jan2008
Jan2009
Jan2010
Jan2012
Jan2011
Jan2015
Jan2014
Jan2013
Jan2016
Jan2017
Jan2018
Financial calendar2 March 2018 Second interim dividend record date22 March 2018 Annual general meeting28 March 2018 Second interim dividend payment date for the six months ended 31 December 201720 July 2018 First interim dividend announcement for the six months ended 30 June 2018

Governance
www.beazley.com Annual report 2017 Beazley 81
Statement of corporate governance
Compliance with Code provisionsThe board confirms that the company and the group have complied with the provisions set out in the 2014 version of the Financial Reporting Council’s UK Corporate Governance Code (the Code) throughout the year ended 31 December 2017. The company has not, however, tendered for audit services in the past ten years as explained on page 91. An audit tender will be carried out in 2018 with a view to appointing a new external auditor for the 2019 accounting year.
The Code can be viewed on the www.frc.org.uk website. The governance section, together with the directors’ and remuneration reports, describes how we have applied the main principles of the Code and complied with its detailed provisions.
The board considers that the annual report and accounts, taken as a whole, are fair, balanced and understandable; and that they provide the information necessary for shareholders to assess the company’s performance, business model and strategy. The company’s auditors have reviewed the company’s compliance to the extent required by the UK listing rules for review by auditors of UK listed companies.
The board is accountable to the company’s shareholders for good governance and the statements set out below describe how the main principles identified in the Code have been applied by the group.
Governance frameworkThe company operates through the main board, the managing agent board, the board of the Irish insurance company (that accepts non-life reinsurance premiums ceded by the corporate member, Beazley Underwriting Limited) and their board committees. The group has established properly constituted audit and risk, remuneration and nomination committees of the board. There are terms of reference for each committee and details of their main responsibilities and activities in 2017 are set out on pages 82 to 95. The board has also appointed an executive committee that is chaired by Andrew Horton and acts under delegated authority from the board. The executive committee meets on a monthly basis and is responsible for managing all activities of the operational group. The governance framework of the main board and its committees is shown in the diagram on the following page.
The roles of the chairman and chief executive are separate, with each having clearly defined responsibilities. They maintain a close working relationship to ensure the integrity of the board’s decision making process and the successful delivery of the group’s strategy. The board evaluates the membership of its individual board committees on an annual basis and the board committees are governed by terms of reference which detail the matters delegated to each committee and for which they have authority to make decisions. The terms of reference for the board committees can be found on www.beazley.com.

www.beazley.com82 Beazley Annual report 2017
Statement of corporate governance continued
Audit and risk committeeChairmanAngela Crawford-IngleMembersGeorge BlundenChristine LaSalaRobert StuchberyCatherine WoodsKey responsibilitiesThe audit and risk committee assists the board of directors in fulfilling its oversight responsibilities for the financial reporting process, the system of internal control, the audit process and the company’s process for monitoring compliance with laws and regulations and the Beazley code of conduct. It also ensures that an effective risk management process exists in the major regulated subsidiaries and that the Beazley group has an effective framework and process for managing its risks.
Nomination committeeChairmanDennis HoltMembersGeorge BlundenSir Andrew LikiermanKey responsibilitiesThe nomination committee is focused on evaluating the board of directors, ensuring an appropriate balance of skills, considering and recommending board and committee candidates and considering board succession.
Remuneration committeeChairmanSir Andrew LikiermanMembersGeorge BlundenJohn SauerlandKey responsibilitiesThe remuneration committee ensures that remuneration arrangements support the strategic aims of the business and enable the recruitment, motivation and retention of senior executives while complying with the requirements of regulatory and governance bodies, satisfying the expectations of shareholders and remaining consistent with the expectations of the wider employee population.
Executive committeeChairmanAndrew Horton MembersMark BernackiMartin BrideAdrian CoxMike DonovanIan FantozziPatrick HartiganAnthony HobkinsonDan JonesNeil MaidmentPenny MalikAndrew PrydeChristian TolleClive WashbournKey responsibilitiesThe executive committee manages all operational activities of the group and acts under the powers delegated by the board. It has responsibility for proposing strategic initiatives and group/syndicate business plans to the board as well as for reviewing the risk management framework and oversight of the group’s sub-committees and business functions.
The boardKey responsibilitiesLeadership, strategic aims, risks, values and standards.
ChairmanDennis HoltMembersGeorge BlundenMartin BrideAdrian CoxAngela Crawford-IngleAndrew Horton
Christine LaSala Sir Andrew LikiermanNeil MaidmentDavid Roberts1
John Sauerland
Robert Stuchbery Clive Washbourn2
Catherine Woods
Chief executiveAndrew HortonKey responsibilitiesThe chief executive is responsible for the implementation and delivery of the strategy agreed by the board and the day to day management of the business.
Company secretaryChristine OldridgeKey responsibilitiesThe company secretary’s responsibilities include ensuring good information flows within the board and its committees and between senior management and non-executive directors, as well as advising the board through the Chairman on all governance matters.
ChairmanDennis HoltKey responsibilitiesThe chairman leads the board, managing constructive dialogue between executive and non-executive directors. He is responsible for ensuring that the board discharges its duties effectively.
Shareholders
1 David Roberts was appointed to the Beazley plc board with effect from 1 November 2017.
2 Clive Washbourn resigned from the Beazley plc board with effect from 20 July 2017.

Governance
www.beazley.com Annual report 2017 Beazley 83
The boardThe board has a schedule of matters reserved for its decision. This includes inter alia: strategic matters; statutory matters intended to generate and preserve value over the longer term acquisitions; approval of financial statements and dividends; appointments and terminations of directors, officers and auditors; and appointments of committees and setting of their terms of reference. It is responsible for: reviewing group performance against budgets; approving material contracts; determining authority levels within which management is required to operate; reviewing the group’s annual forecasts; and approving the group’s corporate business plans, including capital adequacy and the Own Risk and Solvency Assessment. The board is responsible for determining the nature and extent of the principal risks it is willing to take in pursuing its strategic objectives. To this end, the board is responsible for the capital strategy, including the group’s Solvency II internal model.
The board consists of a non-executive chairman, Dennis Holt, together with eight independent non-executive directors, of whom George Blunden is the senior independent non-executive director, and four executive directors, of whom Andrew Horton is chief executive. The non-executive directors, who have been appointed for specified terms, are considered by the board to be independent of management and free of any relationship which could materially interfere with the exercise of their independent judgement.
George Blunden has served a term in excess of six years and continues to bring strong challenge and insight to the board and its committees. His appointment was extended for a further three years at the 2016 AGM, subject to annual reappointment at the AGM. The nomination committee carried out a rigorous assessment of George Blunden’s continuing independence, taking into account the length of his tenure on the boards of both Beazley plc and Beazley Furlonge Ltd, and concluded that he remained independent. As senior independent director George will, if required, deputise for the chairman. He is available to talk to shareholders if they have any issues or concerns or if there are any unresolved matters that shareholders believe should be brought to his attention.
David Roberts was appointed to the board as a non-executive director on 1 November 2017 and will replace Dennis Holt as non-executive chairman at the AGM in March 2018. Dennis Holt will be stepping down from the board at that time, having served two full three-year terms as chairman. Clive Washbourn resigned from the board on 20 July 2017.
In accordance with the Code, the board has recommended that all directors should submit themselves for election or re-election on an annual basis and as such all directors will stand for election or re-election at the forthcoming AGM.
Biographies of current board members appear in the board of directors section of this report. The biographies indicate the high level and wide range of business experience that are essential to manage a business of this size and complexity. A well defined operational and management structure is in place and the roles and responsibilities of senior executives and key members of staff are clearly defined.
Board meeting attendanceThe full board meets at least five times each year and more frequently where business needs require. In 2017, in addition to the five regular board meetings, there were further meetings to consider the Q3 2017 interim statement and director changes. Attendance at the meetings was high. All the directors also attend an annual strategy day. The remuneration, nomination, and audit and risk committees had additional ad hoc meetings with full attendance. The chairman holds meetings as required with the non-executive directors without the executive directors being present.
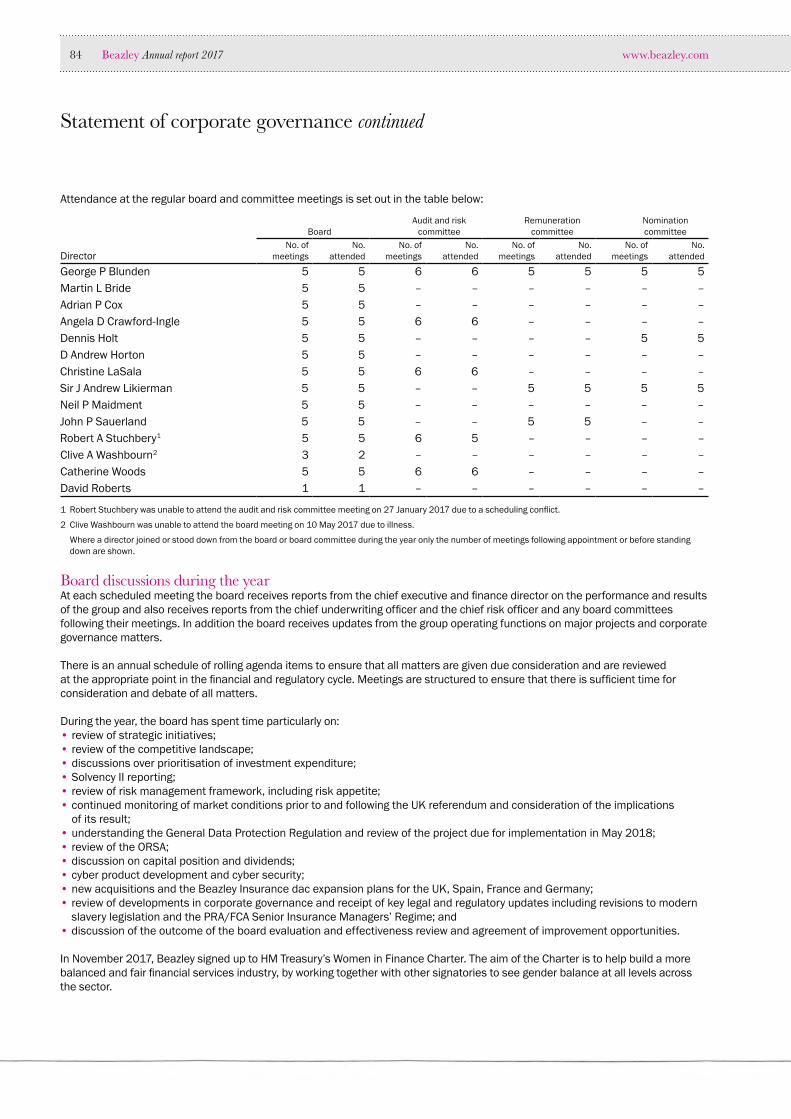
www.beazley.com84 Beazley Annual report 2017
Statement of corporate governance continued
Attendance at the regular board and committee meetings is set out in the table below:
Director
BoardAudit and risk
committeeRemuneration
committeeNominationcommittee
No. of meetings
No. attended
No. of meetings
No. attended
No. of meetings
No. attended
No. of meetings
No. attended
George P Blunden 5 5 6 6 5 5 5 5Martin L Bride 5 5 – – – – – –Adrian P Cox 5 5 – – – – – –Angela D Crawford-Ingle 5 5 6 6 – – – –Dennis Holt 5 5 – – – – 5 5D Andrew Horton 5 5 – – – – – –Christine LaSala 5 5 6 6 – – – –Sir J Andrew Likierman 5 5 – – 5 5 5 5Neil P Maidment 5 5 – – – – – –John P Sauerland 5 5 – – 5 5 – –Robert A Stuchbery1 5 5 6 5 – – – –Clive A Washbourn 2 3 2 – – – – – –Catherine Woods 5 5 6 6 – – – –David Roberts 1 1 – – – – – –
1 Robert Stuchbery was unable to attend the audit and risk committee meeting on 27 January 2017 due to a scheduling conflict.
2 Clive Washbourn was unable to attend the board meeting on 10 May 2017 due to illness.
Where a director joined or stood down from the board or board committee during the year only the number of meetings following appointment or before standing down are shown.
Board discussions during the yearAt each scheduled meeting the board receives reports from the chief executive and finance director on the performance and results of the group and also receives reports from the chief underwriting officer and the chief risk officer and any board committees following their meetings. In addition the board receives updates from the group operating functions on major projects and corporate governance matters.
There is an annual schedule of rolling agenda items to ensure that all matters are given due consideration and are reviewed at the appropriate point in the financial and regulatory cycle. Meetings are structured to ensure that there is sufficient time for consideration and debate of all matters.
During the year, the board has spent time particularly on:• review of strategic initiatives;• review of the competitive landscape;• discussions over prioritisation of investment expenditure; • Solvency II reporting;• review of risk management framework, including risk appetite;• continued monitoring of market conditions prior to and following the UK referendum and consideration of the implications
of its result;• understanding the General Data Protection Regulation and review of the project due for implementation in May 2018; • review of the ORSA;• discussion on capital position and dividends;• cyber product development and cyber security;• new acquisitions and the Beazley Insurance dac expansion plans for the UK, Spain, France and Germany;• review of developments in corporate governance and receipt of key legal and regulatory updates including revisions to modern
slavery legislation and the PRA/FCA Senior Insurance Managers’ Regime; and• discussion of the outcome of the board evaluation and effectiveness review and agreement of improvement opportunities.
In November 2017, Beazley signed up to HM Treasury’s Women in Finance Charter. The aim of the Charter is to help build a more balanced and fair financial services industry, by working together with other signatories to see gender balance at all levels across the sector.

Governance
www.beazley.com Annual report 2017 Beazley 85
The Beazley diversity and inclusion steering group provides diversity and inclusion support for all employees and aims to foster open dialogue about gender, social, ethnicity, LGBT+, disability and parental/carer inclusion. Two new networks were recently launched in 2017: the LGBT+ and young professionals networks.
Beazley also joined Stonewall and the Business Disability Forum in 2017. Both organisations will work closely with Beazley to provide the best possible support for our colleagues in the LGBT+ community, and for those living with disabilities, to help Beazley become a more inclusive and supportive place to work.
Training, information and support New directors receive appropriate induction training when they join the board of Beazley plc. They are asked to complete a skills and knowledge assessment and the company secretary, in conjunction with talent management, arranges and coordinates the appropriate training. There are a number of modules available to the directors which are regularly reviewed to ensure they meet best practice. Where appropriate, mentoring is provided to new directors by an external provider. Annual training is provided for all directors. The training sessions include business and industry specific topics and information on changes to director duties and responsibilities and to legal, accounting, information security and tax matters. Bespoke training may also be provided if requested by any director.
To enable the board to function effectively and directors to discharge their responsibilities, full and timely access is given to all relevant information. In the case of board meetings, this consists of a comprehensive set of papers, including regular business progress reports and discussion documents regarding specific matters. Directors have access to an electronic information repository to support their activities. During 2017 the board continued to support the maintenance and development of Beazley’s information security programme to address changing and emerging cyber security threats. All directors allocate sufficient time to the company to enable them to discharge their responsibilities effectively. The terms and conditions of appointment for all the non-executive directors set out the expected time commitment and they agree that they have sufficient time to provide what is expected of them.
There is an agreed principle that directors may take independent professional advice if necessary at the company’s expense, assuming that the expense is reasonable. This is in addition to the access which every director has to the company secretary. The company secretary is charged by the board with ensuring that board procedures are followed.
Board performance evaluationUnder the UK Corporate Governance Code, the board is required to undertake formal and rigorous evaluation of its own performance and that of its committees and individual directors, and this should be externally facilitated every three years. An externally facilitated assessment of the board and its committees will be conducted in 2018. A self-assessment of the board and its committees was carried out in 2017, the results of which are described in the nomination committee report on page 94. No significant issues were raised.
Audit and internal controlThe respective responsibilities of the directors and the auditors in connection with the accounts are explained in the statement of directors’ responsibilities and the independent auditor’s report, together with the statement of the directors on going concern in the directors’ report.
The board confirms that there is a continuous process for identifying, evaluating and managing any significant compliance issues and risks facing the group. All significant known risks are captured in the Beazley risk register and monitored on a monthly basis. The risk register and the related internal capital assessment process are subject to review, challenge and approval by the board.
The board agreed the 2017 risk appetite for the group at the end of 2016 and, throughout 2017, the board has considered and acted upon the information presented to it in order to make risk based decisions against the 2017 risk appetite. Key components of the risk management framework include monthly control self assessments and six monthly risk assessments, with ad hoc risk assessments being conducted when required. These matters have been considered by the executive risk and regulatory committee each month and the audit and risk committee and board quarterly. In addition, the board has considered the quarterly Own Risk and Solvency Assessment report in the past year. This risk management framework has provided the board with an ongoing process for identifying, assessing, monitoring and managing the risks to the company, and accords with the UK Financial Reporting Council’s ‘Guidance on Risk Management, Internal Control and Related Financial Business Reporting’ document.
The board is responsible for the group’s system of internal control and for reviewing its effectiveness. However, such a system can only provide reasonable, not absolute, assurance against material misstatement or loss. The system is designed to manage, rather than eliminate, the risk of failure to achieve business objectives within the risk appetite set by the board.

www.beazley.com86 Beazley Annual report 2017
Statement of corporate governance continued
The key procedures that the board has established to ensure that internal controls are effective and commensurate with a group of Beazley’s size include:• day-to-day supervision of the business by the executive directors;• review and analysis by the various group committees of standard monthly, quarterly and periodic reporting, as prescribed
by the board;• review of financial, operational and assurance reports from management; and• review of any significant issues arising from internal and external audits.
The board therefore confirms that it has, during 2017, reviewed the effectiveness of the group’s risk management and internal controls (including financial, operational and compliance controls), which have been in place throughout the year under review and continue to operate up to the date of approval of the annual report and accounts.
The chairman of the audit and risk committee also had regular contact with external and internal auditors during 2017 and members of the audit and risk committee met individually with the Central Bank of Ireland and the Prudential Regulation Authority.
Further information on the role of the audit and risk committee is set out on page 87 and further information on risk management at Beazley is set out in the risk management report.
Shareholder engagementThe company places great importance on communication with shareholders. The annual report and accounts and the interim report are available from www.beazley.com and, where elected or on request, will be mailed to shareholders and to stakeholders who have an interest in the group’s performance. The company responds to individual letters from shareholders and maintains a separate investor relations centre within the existing www.beazley.com website, as a repository for all investor relations matters.
There is regular dialogue with institutional shareholders, as well as general presentations attended by executive directors, after the preliminary and interim results. The board is advised of any specific comments from institutional investors, to enable it to develop an understanding of the views of major shareholders. All shareholders have the opportunity to put forward questions at the company’s annual general meeting.
The company has the authority within its articles to communicate with its shareholders using electronic and website communication and to allow for electronic proxy voting.

Governance
www.beazley.com Annual report 2017 Beazley 87
Statement of corporate governance continued
Audit and risk committee
Angela Crawford-Ingle
The board has delegated oversight of audit and risk matters to the audit and risk committee which currently comprises Angela Crawford-Ingle (chairman), George Blunden, Catherine Woods, Christine LaSala and Robert Stuchbery. The members of the committee are unchanged from 2016 which has aided us in carrying out the full range of our responsibilities in a consistent manner.
The committee’s key overall responsibilities are broadly unchanged from the prior year. The committee’s objective is to assist the board of directors in fulfilling its oversight responsibilities for the financial reporting process, the system of internal control, the audit process and the company’s process for monitoring compliance with laws and regulations and the code of conduct. The committee receives information from, and makes enquiries of, numerous functions across the business with a view to ensuring that the control and risk environment continues to be appropriate for the group. In particular, 2017 saw the committee consider a number of specific issues including our proposed external audit tender strategy, initial discussions and presentations in respect of IFRS 17 including potential areas of impact, the ongoing changes in the regulatory and tax environments, and emerging risks.
The audit and risk committee is required to meet at least quarterly, with meetings scheduled at appropriate intervals in the reporting and audit cycle. Additional meetings are held as required. In 2017 there were a total of six meetings, reflecting the workload of the committee during the year.
As part of the appointments process the nomination committee reviewed the membership of the committee during the year. Taken as a whole, the committee has an appropriate balance of skills specific to the industry within which the group operates, including recent and relevant financial experience, as required by the UK Corporate Governance Code. Details of the members’ financial, accounting and other relevant financial experience are given in their biographies under ‘board of directors’ on pages 78 to 79. All committee members are independent non-executives.
There is regular attendance by plc audit and risk committee members at the group’s regulated entity audit and/or risk committees, further demonstrating our proactive approach to understanding our control and risk environment at all levels of the organisation.
Only members of the committee have the right to attend meetings; however standing invitations are extended to the chief executive officer, the group finance director, the chief underwriting officer, the chief risk officer, the head of internal audit and the head of compliance. Other non-members may be invited to attend all or part of any meeting as and when appropriate. The company secretary acts as secretary to the committee.
The internal and external auditors attend committee meetings and regularly meet in private with the committee. In addition the chairman of the audit and risk committee has regular contact with the external and internal auditors throughout the year and members of the committee met individually with the Central Bank of Ireland and the Prudential Regulation Authority during 2017.
Responsibilities of the committeeThe committee’s main audit-related responsibilities are broadly unchanged from the prior year and are detailed in the section below. The primary role of the audit and risk committee in relation to financial reporting is to monitor the integrity of the financial statements of the group and any formal announcements relating to the group’s financial performance, and to review significant financial reporting judgements. The committee has continued to approach its review of the annual report as a whole with focus on behalf of the board on considering the concept of ‘fair, balanced and understandable’. We have challenged ourselves to ensure the key messages about the performance of the business are delivered in a manner consistent with our own understanding and interpretation of the information we receive.
Membership and attendance
AppointmentAttendance at full
meetings during 2017
Angela Crawford-Ingle 27 March 2013 6/6George Blunden 1 October 2010 6/6Christine LaSala 1 July 2016 6/6Robert Stuchbery1 11 August 2016 5/6Catherine Woods 11 March 2016 6/6
1 Robert Stuchbery was unable to attend the audit and risk committee meeting on 27 January 2017 due to a scheduling conflict.
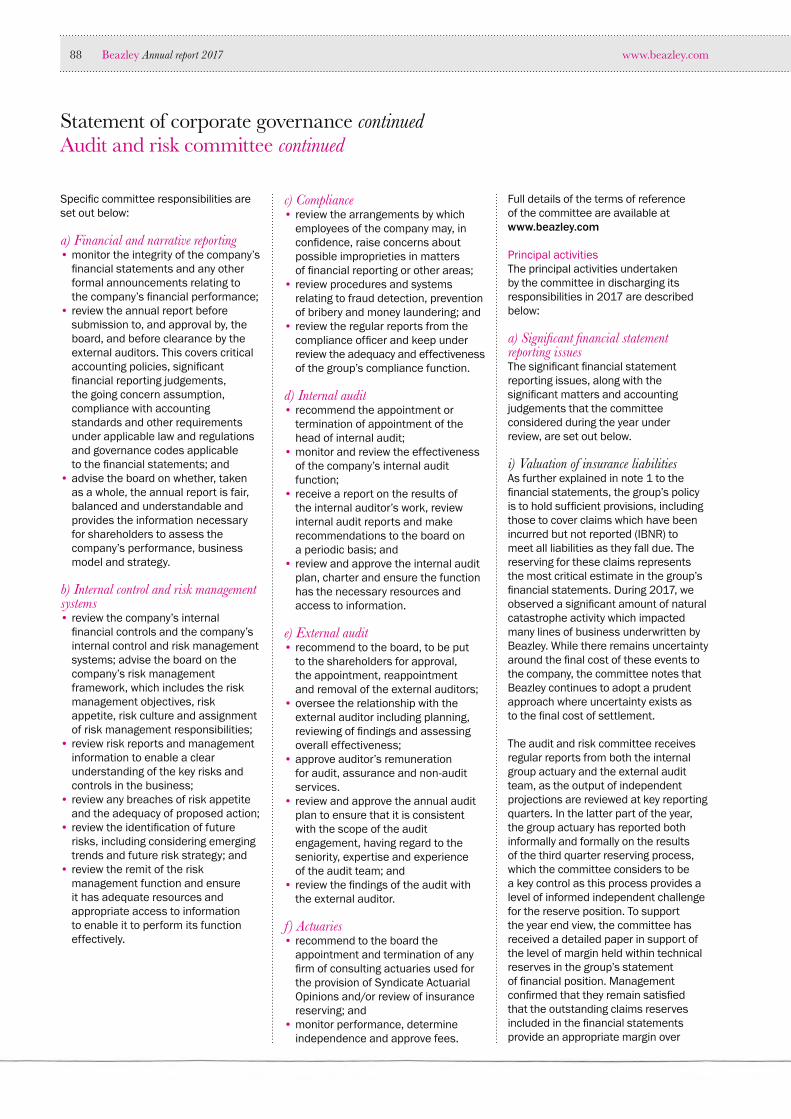
www.beazley.com88 Beazley Annual report 2017
Statement of corporate governance continued Audit and risk committee continued
Specific committee responsibilities are set out below:
a) Financial and narrative reporting• monitor the integrity of the company’s
financial statements and any other formal announcements relating to the company’s financial performance;
• review the annual report before submission to, and approval by, the board, and before clearance by the external auditors. This covers critical accounting policies, significant financial reporting judgements, the going concern assumption, compliance with accounting standards and other requirements under applicable law and regulations and governance codes applicable to the financial statements; and
• advise the board on whether, taken as a whole, the annual report is fair, balanced and understandable and provides the information necessary for shareholders to assess the company’s performance, business model and strategy.
b) Internal control and risk management systems• review the company’s internal
financial controls and the company’s internal control and risk management systems; advise the board on the company’s risk management framework, which includes the risk management objectives, risk appetite, risk culture and assignment of risk management responsibilities;
• review risk reports and management information to enable a clear understanding of the key risks and controls in the business;
• review any breaches of risk appetite and the adequacy of proposed action;
• review the identification of future risks, including considering emerging trends and future risk strategy; and
• review the remit of the risk management function and ensure it has adequate resources and appropriate access to information to enable it to perform its function effectively.
c) Compliance• review the arrangements by which
employees of the company may, in confidence, raise concerns about possible improprieties in matters of financial reporting or other areas;
• review procedures and systems relating to fraud detection, prevention of bribery and money laundering; and
• review the regular reports from the compliance officer and keep under review the adequacy and effectiveness of the group’s compliance function.
d) Internal audit• recommend the appointment or
termination of appointment of the head of internal audit;
• monitor and review the effectiveness of the company’s internal audit function;
• receive a report on the results of the internal auditor’s work, review internal audit reports and make recommendations to the board on a periodic basis; and
• review and approve the internal audit plan, charter and ensure the function has the necessary resources and access to information.
e) External audit• recommend to the board, to be put
to the shareholders for approval, the appointment, reappointment and removal of the external auditors;
• oversee the relationship with the external auditor including planning, reviewing of findings and assessing overall effectiveness;
• approve auditor’s remuneration for audit, assurance and non-audit services.
• review and approve the annual audit plan to ensure that it is consistent with the scope of the audit engagement, having regard to the seniority, expertise and experience of the audit team; and
• review the findings of the audit with the external auditor.
f) Actuaries• recommend to the board the
appointment and termination of any firm of consulting actuaries used for the provision of Syndicate Actuarial Opinions and/or review of insurance reserving; and
• monitor performance, determine independence and approve fees.
Full details of the terms of reference of the committee are available at www.beazley.com
Principal activitiesThe principal activities undertaken by the committee in discharging its responsibilities in 2017 are described below:
a) Significant financial statement reporting issues The significant financial statement reporting issues, along with the significant matters and accounting judgements that the committee considered during the year under review, are set out below.
i) Valuation of insurance liabilitiesAs further explained in note 1 to the financial statements, the group’s policy is to hold sufficient provisions, including those to cover claims which have been incurred but not reported (IBNR) to meet all liabilities as they fall due. The reserving for these claims represents the most critical estimate in the group’s financial statements. During 2017, we observed a significant amount of natural catastrophe activity which impacted many lines of business underwritten by Beazley. While there remains uncertainty around the final cost of these events to the company, the committee notes that Beazley continues to adopt a prudent approach where uncertainty exists as to the final cost of settlement.
The audit and risk committee receives regular reports from both the internal group actuary and the external audit team, as the output of independent projections are reviewed at key reporting quarters. In the latter part of the year, the group actuary has reported both informally and formally on the results of the third quarter reserving process, which the committee considers to be a key control as this process provides a level of informed independent challenge for the reserve position. To support the year end view, the committee has received a detailed paper in support of the level of margin held within technical reserves in the group’s statement of financial position. Management confirmed that they remain satisfied that the outstanding claims reserves included in the financial statements provide an appropriate margin over

Governance
www.beazley.com Annual report 2017 Beazley 89
projected ultimate claims costs to allow for the risks and uncertainties within the portfolio, and the committee was satisfied that there were no errors or inconsistencies that were material in the context of the financial statements as a whole.
As with the prior years, the committee also considers the report of the external auditor following its re-projection of reserves using its own methodologies. On the basis of the work the auditor undertook, it reported no material misstatements in respect of the level of reserves held by the group at the balance sheet date. On the basis of the information provided by the group actuary throughout the year and at the year end, the consistent application of Beazley’s reserving philosophy, and the review work carried out by our external auditor, the committee was satisfied that the reserves held on the group statement of financial position at 31 December 2017 are reasonable.
ii) Financial close processThe audit and risk committee continues to focus on the group’s close and estimation processes generally, and the related controls carried out by the business and specifically the finance team. The close process is particularly important in the current environment where insurers are being required to adhere to increasingly tight regulatory reporting timelines and the audit and risk committee remains committed to ensuring that the robust nature of our control environment is not compromised during this period of change.
During the year and at year end, we received updates from management on the level of estimations used in our close process and the controls carried out to review these estimates retrospectively. The main areas of estimation and judgement remain materially consistent with prior years, with IBNR representing the most crucial estimate within the group’s financial statements. The committee also reviews the process and controls related to actuarial and underwriting estimates of written premium. The committee continued to receive periodic reporting from both the finance and actuarial functions on our estimation process, and the related
controls, in respect of claims reserves, premium income estimates and other key financial statement captions. The committee was satisfied that, based on the information provided to them, the estimates used in the financial close process are appropriate.
On the basis of the reporting received and reviewed during the last 12 months, the audit and risk committee remains satisfied that the estimation and control processes deployed by the group are appropriate.
The committee also discussed the likely impact of IFRS 17 and in particular the impact that this new standard would have on the current financial close process, including data flows and controls. The committee expects that this new standard will remain a key focus over the next 3-4 years. The committee notes management’s intention to undertake more detailed impact analysis throughout 2018 and will monitor the progress of this analysis throughout the year.
iii) Valuation of financial assets at fair valueThe group reports its financial assets at fair value. The board is responsible for setting the investment strategy, defining the risk appetite and overseeing the internal and outsourced providers via the chief investment officer. The committee notes that the overall investment strategy is broadly unchanged from prior periods. The committee receives updates from the group finance director and/or the chief investment officer and it has reported for 2017 that the investment portfolio is in line with the board approved risk appetite, that carrying values of the portfolio as at 31 December 2017 are appropriate and that the valuation methodologies applied to each hierarchy level are consistent with the accounting policies. Committee members are invited to and regularly attend the investment committee.
No misstatements that were material in the context of the financial statements as a whole were identified and the committee was satisfied with the approach employed by management in valuing the financial assets at fair value on the balance sheet at 31 December 2017.
iv) Recoverability of insurance receivablesDuring 2017, management noted, in part due to the continued growth of the group, a number of additional controls and data enhancements which could be made to aid the process of aged debt analysis, as well as the end to end processing and monitoring of debtor balances. The committee noted the additional efficiencies and the enhanced control environment expected to be delivered as a result of these changes.
Following a review of the group’s year end debtor position, the committee is comfortable that the level of insurance receivables on the group’s balance sheet do not require adjustment.
v) Recoverability of reinsurance assetsThe committee received confirmation from management that the majority of Beazley’s reinsurance receivables are due from highly rated institutions. Based on previous experience, the committee has not noted any instances where poor quality reinsurers have led to a material financial loss and is comfortable with the monitoring processes management have described and put in place to ensure this continues.
Considering management updates and supported by the external auditor’s report on the output of their work over assessing the recoverability of the group’s reinsurance assets, the committee was satisfied that the judgements applied by management in making provision for bad debts are appropriate.
vi) Dividends, going concern and viabilityDuring key reporting periods, management outlined to the committee in detail their support for the basis of preparation adopted in the financial statements and any statements around the future viability of the group. In addition, the committee considers the appropriateness of management’s dividend strategy of growing the ordinary dividend each year and the appropriateness of applying this strategy in the current year.

www.beazley.com90 Beazley Annual report 2017
Statement of corporate governance continued Audit and risk committee continued
The committee reviews detailed projections of future cash flows, profit forecasts and capital requirements under various scenarios, including scenarios stressed in terms of claims frequency and liquidity. In the current year, we considered in particular the impact of the natural catastrophe activity during the second half of 2017. We also consider the appropriateness of management’s viability statement and the period over which this analysis is performed. The committee was satisfied by the level of analysis presented during the year, and the related approach taken and statements made in the group’s key external reporting.
vii) TaxThe committee continues to monitor the evolving tax environment and in particular considered management’s approach to Diverted Profits Tax in the UK. The committee is of the view that the approach taken by management, as outlined in note 9 to the financial statements, is reasonable.
viii) Intangible asset valuationThe audit and risk committee received an overview of management’s valuation of intangibles. The committee reviewed and noted the approach in relation to the creation of an intangible asset on the acquisition of Creechurch Underwriters, a managing general agency in Canada, and the amortisation period of 5 years. The committee was satisfied that management’s approach in respect of this acquisition, and the carrying value of all of the group’s intangible assets, is reasonable.
b) Other updatesDuring 2017, in addition to the financial reporting matters mentioned above the following items were key topics of discussion for the committee:• oversight of the reporting and control
processes and procedures relating to the increased Solvency II reporting requirements;
• overview of key reporting and regulatory updates, including updates on accounting standards, changes in tax legislation, changes in regulatory requirements and the upcoming General Data Protection Regulation in particular;
• compliance, financial crime and assurance reporting including risk incident information;
• the group’s proposed audit tender strategy (discussed further below);
• quarterly reserving and actuarial data; and
• the consideration of strategic, emerging and heightened risks identified by management and the group’s risk management team, along side the processes and controls in place to mitigate these risks.
Committee meetings are scheduled to ensure that they support the financial and regulatory reporting timetables and the internal audit and risk cycle.
Function updatesThe Beazley plc board has delegated a number of oversight responsibilities to the audit and risk committee in relation to the risk management framework, compliance, internal audit and external audit.
The work undertaken and key matters considered during the year in these areas are set out below:
a) Risk managementTo assist the board, the committee, supported by the risk committees of the subsidiary boards, receives and reviews reports from the risk management function focusing on the following areas:• risk appetite: The committee has
monitored the actual risk profile against risk appetite throughout 2017 and can confirm that Beazley plc has been operating within risk appetite as at 31 December 2017. The committee has also reviewed the proposed 2018 risk appetite;
• risk assessment: The committee has performed a review of the group’s risk profile to assess its coverage of the universe of risk and that major underlying risks are visible and are being monitored;
• risk profiles: The committee and the risk committees of the subsidiary boards have reviewed Beazley’s risk profiles, which are focused risk assessments of specific topics. In 2017, the committee received a review of cyber risk aimed at ensuring our suite of realistic disaster scenarios are appropriate. There was also a number of other operational risk profiles presented which supported the committee’s oversight of the on-going business processes;
• emerging risk: The committee supported the identification of strategic and emerging risks which were discussed at the board meeting in May 2017 and have been subsequently monitored and reported in the quarterly Own Risk and Solvency Assessment (ORSA);
• oversight of the control environment: The committee has received a quarterly consolidated assurance report which provides commentary on the status of the control environment with perspective from the business, risk management, compliance and internal audit. It also includes entries from the risk incident log;
• reverse stress testing: The committee has received the results of the reverse stress testing exercise, which explores what would have to happen for the group to be unviable and has been able to provide assurance to the board that this work has been performed with the appropriate level of depth and expertise; and
• oversight of the internal model: The committee and the risk committees of the subsidiary boards have reviewed regular reports associated with the internal model. These have included a standing report on internal model output, and a validation report featuring both internal and independent validation and themed reviews, for example, on the approach used to aggregate risk in individual entities which consolidate up to the group level. These assessments have supported the boards’ use of the internal model; and
• quarterly ORSA: The committee has received a quarterly ORSA report and has reviewed it as part of the quality assurance process before commending it to the board.

Governance
www.beazley.com Annual report 2017 Beazley 91
b) ComplianceThe group head of compliance has direct access to the committee members and attends all committee meetings.
To assist the board the committee receives reports and updates from the compliance function on various issues including, but not limited to, regulatory developments, routine and non-routine interactions with the group’s regulators, any significant instances of non-compliance with regulatory or internal compliance requirements.
During 2017, the committee:• monitored the implementation of
the 2017 compliance plan;• reviewed and approved the 2018
annual compliance plan, including the compliance monitoring programme;
• reviewed changes in the regulatory environment applicable to Beazley;
• received updates on relationships with key group regulators, and oversight of regulatory requests;
• provided oversight to regulatory responses to corporate developments;
• reviewed updates from the money laundering reporting officer on the adequacy and effectiveness of the company’s anti-money laundering systems and controls;
• provided oversight of the progress of the business in addressing identified enhancements to compliance requirements;
• approved the group policies and controls in respect of whistleblowing, anti-bribery and corruption, and anti-fraud; and
• received updates on the structure and effectiveness of the company’s compliance function.
In reviewing the effectiveness of the function the audit and risk committee remained satisfied that the compliance function had sufficient resources during the year to undertake its duties.
In addition, the risk committees and/or boards of the group’s regulated subsidiaries receive more locally-focused compliance reports which are specific to those entities.
c) Internal auditThe group’s internal audit function reports directly, and is accountable to the committee, and the head of internal audit has direct access to the committee chairman. The committee has reviewed the effectiveness of the function and remains satisfied that the internal audit function had sufficient resources during the year to undertake its duties.
During 2017, the committee:• considered the results of all internal
audit reports, and the finding and themes emerging from them;
• monitored the implementation of the 2017 internal audit plan;
• reviewed and approved the basis for internal audit planning. This included reviewing and approving the group’s risk-based audit universe and the internal audit plan, and reviewing other business developments which could also potentially be the subject of internal audit work in the coming year. This included challenging the frequency of audits in certain areas of the business, and challenging the balance between thematic reviews and full end-to-end audits;
• reviewed and approved the internal audit charter;
• reviewed and approved the internal audit budget for 2018;
• received information relating to the internal audit functions quality assurance activities;
• reviewed how the internal audit, risk management and compliance functions contributed information and assurance relating to the group’s control effectiveness;
• received and reviewed an overall summary assessment of 2017 internal audit activity; and
• monitored the timely implementation of agreed management actions and reviewing the status of the same.
During the course of 2017 a number of internal audit recommendations were made to management in relation to its systems of control which have been subsequently implemented. Overall the internal audit function was able to report that for those areas it reviewed, the design and operation of our risk management framework, controls and processes have supported the group in operating within its risk appetite
d) External auditi) Audit tenderingKPMG have been the group’s auditors since its listing and, while KPMG were requested to submit a non-competitive tender in 2016, the provision of external audit services has not been subject to a formal tender process since 2002. The current audit partner is Mr. Daniel Cazeaux and the 2017 financial year was his first year as Beazley’s engagement partner.
As disclosed in the group’s annual report for the year ended 31 December 2016, the board have committed to changing group auditor no later than for the 2019 financial year. In this regard, a comprehensive audit tender process will take place during 2018 and is expected to be a priority of the audit committee throughout the year.
To date, the committee has reviewed management’s initial strategy for the tender process. The audit committee expects the tender process to involve three main steps being the creation of an initial list of potential firms that are willing to be involved in the tender process, narrowing this initial list down to two preferred service providers through a combination of information requests and presentations, and finally making a recommendation to our shareholders following a final round of submissions and presentations to the committee. Among our primary aims throughout this process will be ensuring that any incumbent external audit firm possesses an appropriate range of technical skills and expertise, while demonstrating an understanding of the key markets in which we operate. The committee will also engage with subsidiary audit committees with a view to ensuring that each Public Interest Entity (‘PIE’) is able to operate a comprehensive audit tender process in its own right.
ii) Assessing the effectiveness of the external auditorThe committee places great emphasis on ensuring there are high standards of quality and effectiveness in the external audit process. Audit quality is assessed throughout the year, with a focus on strong audit governance and the quality of the team.

www.beazley.com92 Beazley Annual report 2017
Statement of corporate governance continued Audit and risk committee continued
The effectiveness of the audit is assessed through discussion throughout the year, taking into account considerations such as:• reviewing the quality and scope of the
audit planning and its responsiveness to changes in the business;
• monitoring of the auditor’s independence;
• considering the level of challenge evidenced in discussions and reporting; and
• discussing the output of the FRC’s Audit Quality Review (AQR) with our auditors.
During 2017, the FRC’s AQR team reviewed our external auditor’s audit of our 2016 financial statements. The committee has discussed this review with the AQR team and the external auditor. The review noted a small number of observations, the implementation of which have not had a significant impact on the audit approach of the external auditor.
These considerations are taken in to account by the committee when determining whether to reappoint the external auditor. Noting the intention to run a comprehensive audit tender process during 2018 with a view to appointing a new external auditor for 2019 reporting year, the committee recommends that the board re-appoint KPMG to perform the 2018 external audit.
iii) Non-audit servicesThe audit and risk committee’s responsibility to monitor and review the objectivity and independence of the external auditor is supported by a policy that we have developed in relation to the provision of non-audit services by the auditor. During 2017, our non-audit services policy was updated, enhanced and reviewed by the committee.
The objective is to ensure that the provision of such services does not impair the external auditor’s objectivity. The policy specifically disallows certain activities from being provided by the auditor, such as bookkeeping and accounting services, internal actuarial services and executive remuneration services. The policy requires consideration and pre-approval for all other material services such as due diligence assistance, tax services and advice on accounting and audit matters.
The committee reviews the terms of such proposed services to ensure they have been robustly justified.
The committee receives a report from the external auditors twice a year setting out all non-audit services undertaken, so that it can monitor the types of services being provided, and the fees incurred for that work. The aim is to limit the total spend on non-audit services to a maximum of the annual audit fee, unless it is deemed that not doing so is in shareholders’ interest from an efficiency and effectiveness point of view.
The split between audit and non-audit fees for the year under review is disclosed in note 6 to the financial statements. In the year the audit fees for the statutory audit of the consolidated financial statements were $0.9m (2016: $1.0m) while fees paid for non audit and assurance services were $1.4m (2016: $1.2m). Fees for non audit and assurance services include work related to the accounts and regulatory reporting of the syndicates managed by Beazley, work which would commonly be carried out by the external auditor.
KPMG is a panel member eligible to provide services under our cyber breach response service to policy holders. To date KPMG has not been called upon to provide any services under this arrangement and the committee receives regular updates to monitor the level of activity and to ensure conflicts of interest do not occur.
None of the non-audit services provided are considered by the audit and risk committee to affect the auditor’s independence or objectivity.
Committee effectivenessThe committee considers its effectiveness regularly. An assessment was externally facilitated in 2017 using an online survey completed by members of the committee. The review concluded that the committee was operating effectively and efficiently and there were no major issues highlighted for attention.
Fair, balanced and understandable assessmentIt is a key compliance requirement of the group’s financial statements to be fair, balanced and understandable. The annual report is prepared following a well documented process and is performed in parallel with the formal process undertaken by the external auditor. The committee has reviewed a report presenting the approach taken during the preparation of the annual report. Following its review, the committee is satisfied that the annual report is fair, balanced and understandable, and provides the information necessary for shareholders and other stakeholders to assess the company’s position and performance, business model and strategy, and has advised the board accordingly.
Furthermore, the audit committee notes the receipt of correspondence from the Financial Reporting Council (FRC) in June 2017 in respect of the group’s annual report and accounts for the year ended 31 December 2016. We note that the FRC carried out a high level review of the annual report and raised no questions or queries requiring a response from the board or the audit committee. The FRC did make a small number of minor recommendations which could be included in future reports to aid the users of the accounts, and the committee is pleased that these recommendations have been implemented in the 2017 annual report and accounts. We note that the review carried out by the FRC was not a full review and was based solely on the group’s report and accounts without the benefit of detailed knowledge of the group’s business or a detailed understanding of the underlying transactions entered into during the year. We remain committed to continuous improvement in the quality and transparency of information included in the group’s annual report.
Competition and Markets Authority Order 2014 statement of complianceThe committee confirms that during 2017 the group complied with the mandatory audit processes and audit committee responsibilities provisions of the Competition and Markets Authority Statutory Audit Services Order 2014 as presented in this report.

Governance
www.beazley.com Annual report 2017 Beazley 93
Statement of corporate governance continued
Remuneration committee
• recommend the remuneration of the chief executive, the other executive directors, the direct reports to the chief executive, the company secretary and such other members of the executive management as it is designated to consider. No director or manager shall be involved in any decisions as to his or her own remuneration;
• obtain reliable, up-to-date information about remuneration in other companies; and
• appoint and review the performance of remuneration committee consultants, currently Deloitte LLP.
Key activities in 2017During 2017 the committee:• reviewed the key aspects of the
remuneration policy, and oversaw its implementation and application;
• satisfied itself that the current remuneration structure is appropriate to attract and retain talented people;
• considered the chief risk officer’s report which confirmed that the design of remuneration promotes appropriate risk behaviour throughout the organisation. In addition, the analysis considered the performance of the control environment, profit related pay targets, calculation of the bonus pool, share awards, a suite of risk metrics for each Solvency II member of staff and any individual who has created a higher than expected level of risk;
• ensured incentives continued to be appropriate and to align company and shareholders;
• approved the grant of share awards under the group’s deferred, retention and LTIP plans;
• considered the salary and bonus awards for 2017 for executive directors, heads of control functions, material risk takers and other officers;
• considered the actions required in relation to gender pay gap reporting;
• approved the chairman’s fees; and• reviewed the executive director
employment contracts.
Further information on the work of the remuneration committee is set out in the directors’ remuneration report.
Currently the membership of the remuneration committee comprises Sir Andrew Likierman (chairman), George Blunden and John Sauerland.
Responsibilities of the committeeThe committee’s main responsibilities are to, inter alia:• set the remuneration policy for the
group for approval at the annual general meeting. The objective of such policy shall be to ensure that members of the executive management of the company are provided with appropriate incentives to encourage enhanced performance and are, in a fair and responsible manner, rewarded for their individual contributions to the success of the company;
• recommend and where appropriate approve targets for performance related pay schemes and seek shareholder approval for any long term incentive arrangements;
• recommend and approve the remuneration of the chairman of the company;
Sir Andrew Likierman
Membership and attendance
AppointmentAttendance at scheduled
meetings during 2017
Sir Andrew Likierman 25 March 2015 6/6George Blunden 1 January 2011 6/6John Sauerland 11 May 2016 6/6

www.beazley.com94 Beazley Annual report 2017
Statement of corporate governance continued
Nomination committee
The nomination committee is chaired by Dennis Holt and currently comprises George Blunden and Sir Andrew Likierman.
The nomination committee meets at least twice annually and at such other times during the year as is necessary to discharge its duties. In 2017 there were five scheduled meetings, reflecting the workload of the committee during the year. Only members of the committee have the right to attend meetings; however other individuals, such as the chief executive and external advisers, may be invited to attend for all or part of any meeting.
The specific responsibilities and duties of the committee are set out in its terms of reference which were updated in July 2017 to include specific responsibility to keep under review the leadership needs of the organisation, both executive and non-executive, with a view to ensuring the continued ability of the organisation to compete effectively in the marketplace. The terms of reference are available to download from the company’s website.
Responsibilities of the committeeThe committee’s main responsibilities are to, inter alia:• regularly review the structure, size
and composition (including the skills, knowledge, experience and diversity) required of the board compared to its current and projected position;
• give full consideration to succession planning for executive and non-executive directors and in particular for the key roles of chairman and chief executive, senior executives and any other member of the senior management that it is relevant to consider;
• ensure the directors have the required skills and competencies;
• review annually the time required from non-executive directors;
• review the results of the board performance evaluation process that relate to the composition and skills and competencies of the board and ensure an appropriate response to development needs;
• recommend to the board appointments to the role of senior independent director and chairman as well as membership of board committees; and
• recommend, if appropriate, all directors for re-election by shareholders under the annual re-election provisions of the UK Corporate Governance Code.
Policy on gender, diversity and inclusionWe believe having a diverse and inclusive workplace will support our vision for growth and outperforming the market. We continually review our approach to diversity and our aim is to have nurtured diverse employees across the business who are given the tools and opportunities to progress their career within Beazley. We believe employing individuals with wider perspectives and from a broader skill base will lead to a more dynamic, innovative, responsive organisation in touch with changes and developments in our business environment.
We have a defined policy and strategy that will enable us to:• nurture diverse individuals across all
areas of the business and encourage them to grow into senior positions with our organisation;
• develop plans on how to best support diversity in a way that is both locally relevant and globally impactful;
• support, mentor and encourage individuals from diverse backgrounds to grow and develop within Beazley;
• have leadership and sponsorship of our vision at the most senior level of our organisation;
• regularly review our employment policies and practices. We expect our people to work with us to further enhance our diversity objectives; and
• ensure all employees receive equality of opportunity in recruitment, training, development, promotion and remuneration.
Dennis Holt
Membership and attendance
AppointmentAttendance at scheduled
meetings during 2017
Dennis Holt 21 July 2011 5/5George Blunden 1 January 2010 5/5Sir Andrew Likierman 25 March 2015 5/5
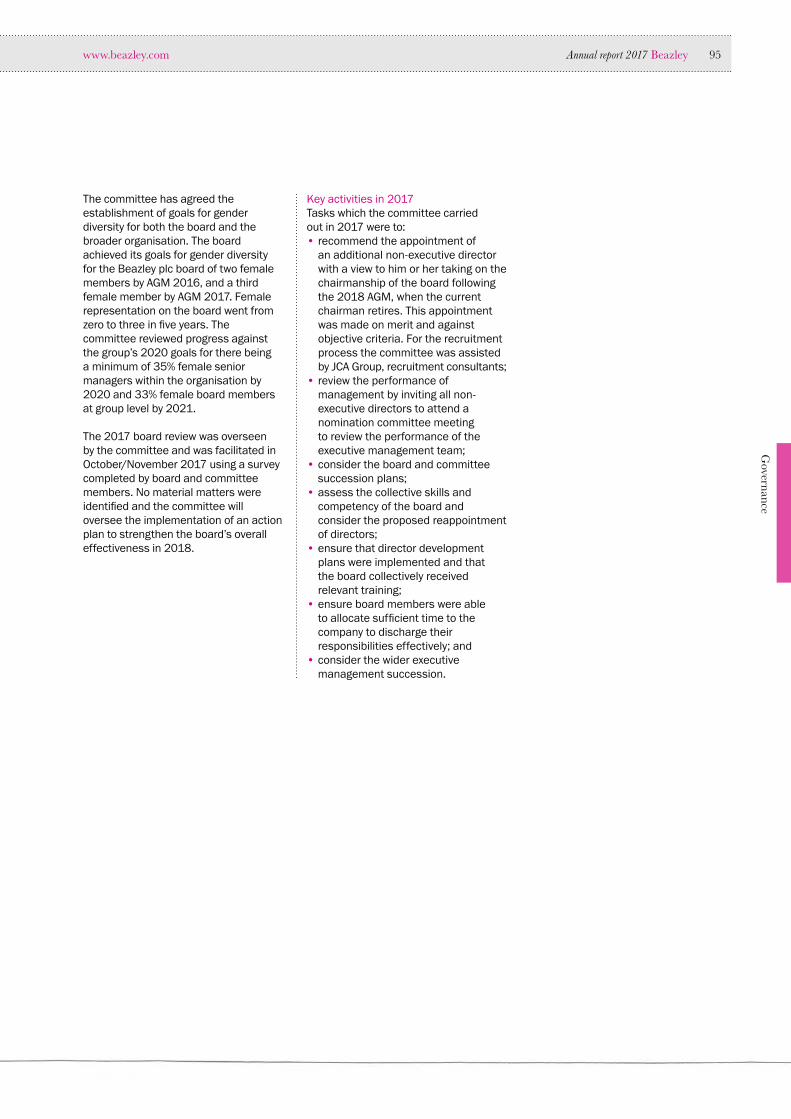
Governance
www.beazley.com Annual report 2017 Beazley 95
The committee has agreed the establishment of goals for gender diversity for both the board and the broader organisation. The board achieved its goals for gender diversity for the Beazley plc board of two female members by AGM 2016, and a third female member by AGM 2017. Female representation on the board went from zero to three in five years. The committee reviewed progress against the group’s 2020 goals for there being a minimum of 35% female senior managers within the organisation by 2020 and 33% female board members at group level by 2021.
The 2017 board review was overseen by the committee and was facilitated in October/November 2017 using a survey completed by board and committee members. No material matters were identified and the committee will oversee the implementation of an action plan to strengthen the board’s overall effectiveness in 2018.
Key activities in 2017Tasks which the committee carried out in 2017 were to:• recommend the appointment of
an additional non-executive director with a view to him or her taking on the chairmanship of the board following the 2018 AGM, when the current chairman retires. This appointment was made on merit and against objective criteria. For the recruitment process the committee was assisted by JCA Group, recruitment consultants;
• review the performance of management by inviting all non-executive directors to attend a nomination committee meeting to review the performance of the executive management team;
• consider the board and committee succession plans;
• assess the collective skills and competency of the board and consider the proposed reappointment of directors;
• ensure that director development plans were implemented and that the board collectively received relevant training;
• ensure board members were able to allocate sufficient time to the company to discharge their responsibilities effectively; and
• consider the wider executive management succession.

www.beazley.com96 Beazley Annual report 2017
Letter from the chairman of our remuneration committee
Dear shareholder
The 2017 Annual General Meeting approved the latest version of Beazley’s remuneration policy. This can be found on our website at www.beazley.com. The basis of the policy is to attract and keep those who are among the best in the world in specialist insurance, rewarding sustained performance as well as keeping the company competitive. There are no significant changes to the implementation of the policy this year.
Salary increases The average executive director salary increase for 2018 was 2.6%, below the average salary increase for the rest of the organisation.
Annual bonus framework and reportingAs in previous years, bonuses are linked to return on equity (ROE). The senior team are rewarded on their individual performance, not through a formula. Later in the report you can find how targets were set and the link to the bonuses through individual achievements. This year we have expanded on our disclosure to provide shareholders with additional clarity on the way in which we determine individual bonuses.
Performance out-turnsThe average executive director bonus this year is 38% of the maximum reflecting ROE for the year of 9%. In addition, directors will receive the second tranche (instalment) of the 2013 long term incentive plan (LTIP) and the first tranche of the 2015 LTIP. The tranches are due to vest (pay out) at 100% and 96.3% of the maximum respectively. These percentages reflect sustained growth in net asset value of 18.1% p.a and 16.1% p.a for the five and three year performance periods. We will award a 2018 LTIP subject to performance conditions in line with our usual policy level.
Gender payWe will soon publish our first gender pay gap report on the Beazley website. We have plans to reduce the gap as an important part of our diversity agenda, reinforced by signing the HM Treasury Women in Finance charter.
Executive director changeIn July 2017 Clive Washbourn, head of marine, stepped down from the board having served as an executive director since 2006. He remains a member of the executive committee of Beazley and a board member of Beazley Furlonge Ltd. He did not receive any payment for loss of office. He did, however, receive the final tranche of the legacy marine share incentive plan.
DevelopmentsThe committee is keeping in mind the Government’s proposed corporate governance reforms and the Financial Reporting Council’s consultation on the changes to the UK Corporate Governance Code.
2017 was the second year for which the remuneration requirements of Solvency II applied. As you would expect, the committee ensures that Beazley complies with evolving best practice and the Prudential Regulatory Authority’s guidance. We get regular updates on wider executive pay market practice to make sure our policies remain aligned to best practice.
ShareholdersThe committee monitors remuneration developments and considers – indeed welcomes – the views of shareholders. We were grateful for a favourable vote of 98% on last year’s annual remuneration report, and one of 95% on our remuneration policy.
Sir Andrew LikiermanRemuneration committee chairman

Governance
www.beazley.com Annual report 2017 Beazley 97
Directors’ remuneration reportRemuneration in brief
Remuneration principlesThe main aim of Beazley’s policy is to ensure that management and staff are remunerated fairly and in such a manner as to facilitate the recruitment, retention and motivation of suitably qualified personnel. In particular we believe that:• performance-related remuneration is an essential motivation to management and staff and should be structured to ensure
that executives’ interests are aligned with those of shareholders;• individual rewards should reflect the group objectives but be dependent on the profitability of the group and be appropriately
balanced against risk considerations;• the structure of packages should support meritocracy, an important part of Beazley’s culture;• reward potentials should be market-competitive; and• executives’ pay should include an element of downside risk.
Remuneration policyOur policy, which remains unchanged for 2018, has two guiding principles: alignment to shareholders’ interests and performance of the group. The key features and basis of alignment are:• key performance indicators used in incentives. Two important factors in the determination of the annual bonus pool are profit before tax and return on equity, both of which are key performance indicators for the company. In addition the long term incentive plan (LTIP) uses another key performance indicator, net asset value per share (NAVps) growth, since it is aligned to shareholders’ interest. For the maximum awards to vest, NAVps growth of 15% above the risk-free return has to be sustained for five years;
• five year performance. For a number of years we have operated an LTIP where performance is measured over five years as well as three. This longer period aligns reward with the long term performance of the business and the additional clawback period for executive directors, taking reclaim provisions to seven years, ensures alignment with longer term decision-taking. Further strengthening alignment with longer term decision making is the company’s policy to defer a portion of annual bonuses into shares and our shareholding guidelines; and
• risk. The features which align remuneration with risk include a long time horizon, deferral of bonus into shares and personal shareholding requirements. The committee receives an annual report from the chief risk officer on remuneration policy to ensure it is consistent with, and promotes, effective risk management.

www.beazley.com98 Beazley Annual report 2017
Performance in 2017Beazley performed strongly in a challenging year with an exceptional series of natural catastrophes and the incentive outcomes reflect this.
050
100150200250300350
Profit before tax ($m)
2017
168
293
2015 2016
284
048
12162024
Return on equity (%)
2017
9
2015 2016
19 18
050
100150200250300350
■ Special dividend■ Interim and second interim dividend■ Net asset per share
Net assets and cumulative dividend per share (p)
2017
327.864.747.8215.3
2015 2016
249.8
186.527.036.3
317.7
37.154.7
225.9
0100200300400500600
Share price (p)
■ Share price at grant■ Share price appreciation
292.1204.2
200.6295.7
2013 award 2015 award
The group’s performance over the longer term was strong in terms of NAVps growth and total shareholder return, as illustrated in the charts below.
31 Dec2012
31 Dec2013
31 Dec2014
31 Dec2015
31 Dec2016
31 Dec2017
■ NAV target range (RFR +7.5% p.a. to RFR +15% p.a.)■ TSR growth (1 month average)■ NAV growth (including dividends)
0%
150%100%
50%
200%
300%250%
350%LTIP performance 2012-2017 NAV and TSR growth
31 Dec2014
31 Dec2015
31 Dec2016
31 Dec2017
■ NAV target range (RFR +7.5% p.a. to RFR +15% p.a.)■ TSR growth (1 month average)■ NAV growth (including dividends)
0%25%50%75%
100%
150%LTIP performance 2014-2017 NAV and TSR growth
125%
Directors’ remuneration report continuedRemuneration in brief

Governance
www.beazley.com Annual report 2017 Beazley 99
Directors’ remuneration report continued
Outcomes for 2017 and implementation for 2018
Element Overview of policyImplementation and outcomes during 2017 Implementation for 2018
Base salary Salaries are set at a level to appropriately recognise responsibilities and to be broadly market competitive.
Any salary increases will generally reflect our standard approach to all-employee salary increases across the group.
Salaries for 2017 were as follows:• D A Horton: £457,000• M L Bride: £320,000• A P Cox: £342,500• N P Maidment: £342,500• C A Washbourn: £342,500
Salary increases of c.2.6% were awarded to executive directors, below the average for the wider employee workforce. Salaries for 2018 will be as follows:• D A Horton: £468,500• M L Bride: £330,000• A P Cox: £351,000• N P Maidment: £351,000
Benefits To provide market levels of benefits. Benefits include private medical insurance, travel insurance, and company car or monthly car allowance.
In line with policy.
Pension To provide market levels of pension provision through contributions to a defined contribution pension plan.
Executive directors receive a pension contribution or cash payment in lieu of pension of 15% of base salary.
In line with policy.
Annual bonus
Discretionary annual bonus determined by reference to both financial and individual performance.
A portion is generally deferred into shares for three years (between 0% and 37.5% of bonus) dependent on level of bonus.
Maximum bonus opportunity for executive directors was 400% of salary.
ROE in the year was 9%.Profit for the year was $168m.
Bonus outcomes range from 31% to 44% of maximum. A portion of each director’s bonus was deferred into shares as shown on page 105.
In line with policy.
Long term incentive plan (LTIP)
Vesting of LTIP awards is dependent on net asset value per share (NAVps) performance against the risk-free rate of return.
50% of awards are subject to performance over three years and 50% over five years.
NAVps performance % of award vesting
< average risk-free rate +7.5% p.a. 0%= average risk-free rate +7.5% p.a. 10%= average risk-free rate +10% p.a. 25%= average risk-free rate +15% p.a. 100%Straight-line vesting between points
The first tranche of the 2015 LTIP award vested at 96.3% of maximum following three year NAVps performance of 16.1% p.a.
The second tranche of the 2013 LTIP award vested at 100% of maximum following five year NAVps performance of 18.1% p.a. In 2017, the following grants as a percentage of base salary were made, subject to the usual NAVps performance condition:• D A Horton: 200%• M L Bride: 150%• A P Cox: 175%• N P Maidment: 150%• C A Washbourn: 150%
In 2018, the following grants as a percentage of base salary will be made, subject to the usual NAVps performance condition:• D A Horton: 200%• M L Bride: 150%• A P Cox: 150%• N P Maidment: 150%
Shareholding guidelines
Executive directors are expected to build up and maintain a shareholding of 150% of salary (200% for the CEO).
LTIP awards may be forfeited if shareholding requirements are not met.
All executive directors met their shareholder guidelines.
In line with policy.

www.beazley.com100 Beazley Annual report 2017
Directors’ remuneration report continued
Annual remuneration reportThe symbol ▪ by a heading indicates that the information in that section has been audited.
This part of the report, the annual remuneration report, sets out the remuneration out-turns for 2017 (and how these relate to our performance in the year) and details of the operation of our policy for 2018.
Single total figure of remuneration ▪The tables below set out the single figure of total remuneration for executive directors and non-executive directors for the financial years ending 31 December 2017 and 31 December 2016.
Executive directorsFixed pay Pay for performance
£ Salary Benefits Pension
Total annual bonus1
Long term incentives
(LTI)Total
remuneration 2
Martin L Bride2017 320,000 11,548 42,179 400,000 922,677 1,696,4042016 313,100 11,861 41,270 800,000 963,282 2,129,513
Adrian P Cox2017 342,500 12,226 45,145 600,000 986,775 1,986,6462016 336,200 12,347 45,804 1,100,000 990,665 2,485,016
D Andrew Horton2017 457,000 17,399 60,237 700,000 1,763,205 2,997,8412016 448,000 17,479 59,051 1,250,000 1,940,616 3,715,146
Neil P Maidment2017 342,500 16,383 45,145 500,000 992,244 1,896,2722016 336,200 16,503 44,315 980,000 1,091,789 2,468,807
Clive A Washbourn3 2017 188,609 7,944 24,861 – 3,137,599 3,359,0132016 336,200 14,527 44,315 700,000 1,091,789 2,186,831
1 A portion of the bonus awards shown in the table above is deferred into shares for three years. Details of the deferral in respect of 2017 awards can be found on page 105.
2 A significant portion of the single figure values shown arises from the substantial share price appreciation over the period. For 2017 the share price at the time LTI awards were made was 204.2p for the 2013 award and 295.73p for the 2015 award, while the average share price in the last three months of 2017 was 496.34p. This represents share price growth of 60% and 41% over the five and three year periods respectively.
3 Clive Washbourn stepped down from the board effective 20 July 2017. He remains employed by the group. Figures in the table above have been pro-rated to reflect the period of time during which he was an executive director. The LTI figure for 2017 includes the vesting of the second and final tranche of the legacy MSIP award granted in 2013 to address a commercial risk to the business. This was an award, approved by shareholders, with performance conditions which required sustained exceptional divisional performance. The marine division achieved average ROE results over the five years to 31 December 2017 of 39.8% p.a resulting in 100% of the award vesting. For Clive Washbourn £2,258,690 of the single figure is a direct result of the MSIP award.
The figures in the preceding table reflect the following:• salaries for 2017 increased by an average of 2.0%, which was below the average increase for all employees; • annual bonus out-turns were lower than last year, commensurate with group performance; and• LTI out-turns reflect that the second tranche of the 2013 LTI award vested in full and that the first tranche of the 2015 LTI award vested at 96.3% of maximum. Beazley achieved sustained NAV growth of 16.1% per annum and 18.1% per annum over the three and five year periods respectively. Beazley also achieved significant share price appreciation as detailed in the notes to the table.
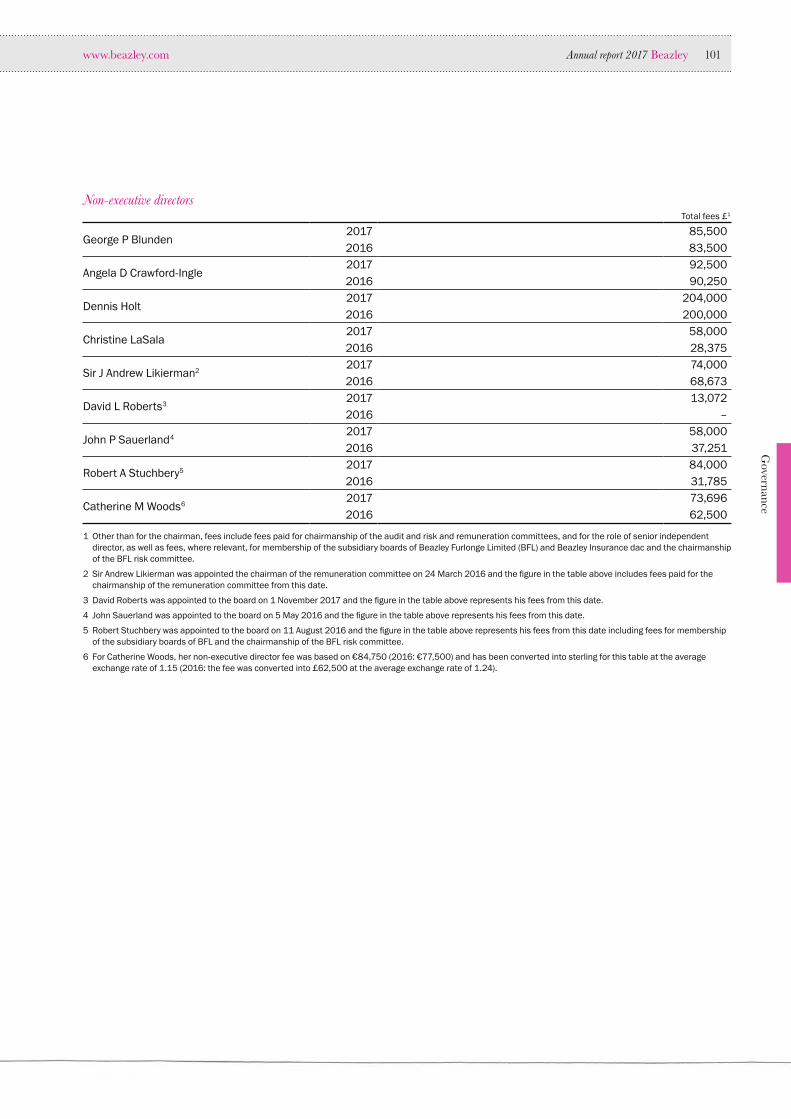
Governance
www.beazley.com Annual report 2017 Beazley 101
Non-executive directors Total fees £1
George P Blunden2017 85,5002016 83,500
Angela D Crawford-Ingle2017 92,5002016 90,250
Dennis Holt2017 204,0002016 200,000
Christine LaSala2017 58,0002016 28,375
Sir J Andrew Likierman2 2017 74,0002016 68,673
David L Roberts3 2017 13,0722016 –
John P Sauerland 42017 58,0002016 37,251
Robert A Stuchbery5 2017 84,0002016 31,785
Catherine M Woods 62017 73,6962016 62,500
1 Other than for the chairman, fees include fees paid for chairmanship of the audit and risk and remuneration committees, and for the role of senior independent director, as well as fees, where relevant, for membership of the subsidiary boards of Beazley Furlonge Limited (BFL) and Beazley Insurance dac and the chairmanship of the BFL risk committee.
2 Sir Andrew Likierman was appointed the chairman of the remuneration committee on 24 March 2016 and the figure in the table above includes fees paid for the chairmanship of the remuneration committee from this date.
3 David Roberts was appointed to the board on 1 November 2017 and the figure in the table above represents his fees from this date.
4 John Sauerland was appointed to the board on 5 May 2016 and the figure in the table above represents his fees from this date.
5 Robert Stuchbery was appointed to the board on 11 August 2016 and the figure in the table above represents his fees from this date including fees for membership of the subsidiary boards of BFL and the chairmanship of the BFL risk committee.
6 For Catherine Woods, her non-executive director fee was based on €84,750 (2016: €77,500) and has been converted into sterling for this table at the average exchange rate of 1.15 (2016: the fee was converted into £62,500 at the average exchange rate of 1.24).

www.beazley.com102 Beazley Annual report 2017
Directors’ remuneration report continuedAnnual remuneration report continued
Salary ▪The committee reviews salaries annually taking into consideration any changes in role and responsibilities, development of the individual in the role, and levels in comparable positions in similar financial service companies. It also considers the performance of the group and the individual as well as the average salary increase for employees across the whole group. Salary reviews take place in December of each year, with new salaries effective from 1 January.
For 2018, the average salary increase for executive directors was 2.6%, below the average salary increase across the group.
The base salaries for the executive directors in 2017 and 2018 are as set out below:2017
base salary£
2018 base salary
£Increase
%
Martin L Bride 320,000 330,000 3.1Adrian P Cox 342,500 351,000 2.5D Andrew Horton 457,000 468,500 2.5Neil P Maidment 342,500 351,000 2.5
Benefits ▪Benefits include private medical insurance for the director and their immediate family, income protection insurance, death in service benefit at four times annual salary, travel insurance, health-club membership, season ticket and the provision of either a company car or a monthly car allowance.
Annual bonus plans ▪The enterprise bonus plan is a discretionary plan in which all employees are eligible to participate. The operation of a pool approach reflects Beazley’s commitment to encourage teamwork at every level, which, culturally, is one of its key strengths.
Bonus frameworkThe framework for determining bonuses is as follows:• a percentage of profit is allocated to a bonus pool subject to a minimum group ROE; and• the percentage of profit increases for higher levels of ROE.
This ensures that outcomes are strongly aligned with shareholders’ interests.
A broad senior management team, beyond executive directors, participate in the bonus pool, reinforcing the company’s collegiate culture.
Bonus calculation Recommended awards to individuals from the available pool are determined by taking into account performance based on each individual’s contribution to the group, including a review of performance against individual objectives. For heads of the business divisions, divisional performance is also taken into account. The bonus is discretionary and, rather than adopting a prescriptive formulaic framework, the committee considers wider factors in its deliberations at the end of the year: for example quality of profit and risk considerations.
In determining awards, the committee will not necessarily award the enterprise bonus pool in aggregate (i.e. the sum of the bonus awards may be less than the enterprise bonus pool).
The approach to the calculation of bonuses is aligned to shareholders’ interests and ensures that bonuses are affordable, while the ROE targets increase the performance gearing. The committee reviews the bonus pool framework each year to ensure it remains appropriate, taking into account the prevailing environment, interest rates and expected investment returns, headcount and any other relevant factors.

Governance
www.beazley.com Annual report 2017 Beazley 103
Performance out-turn for 2017The process for determining 2017 bonuses is described below, including full details of the ROE targets underpinning our bonus approach along with the guideline levels which are used by the committee in its determination for each executive director.• ROE for 2017 was 9% and the overall enterprise bonus pool (in which executive directors as well as other senior employees
participate) was calculated based on this. • The committee then considered the individual bonus award for the executive directors and other senior employees within
the committee’s remit. In determining the bonus award for each individual the committee took into account the individual’s contribution including, where relevant, the performance of their division.
• In considering individual awards in respect of executive directors for 2017, the committee had regard to the broad framework detailed below:
At the beginning of the financial year, the risk-free return (RFR) was set at 1.5% taking into account the yield on US treasuries of two to five year maturities. This resulted in the following ROE hurdles and guideline bonus awards:
ROE performance hurdles ROE performanceGuideline/illustrative
bonus award as a % of maximum
Threshold performance 1.5% 0%4.5% 12.5%
11.5% 37.5%19% 75%
Maximum performance 26.5% 100%
These percentages are indicative only and based on broad group results. Within the pool framework bonus out-turns may be higher or lower taking into account divisional, strategic and personal performance.
■ 2016 performance range■ 2016 ROE performance
2016 ROE performance (%)
0 5 10 15 20 25 30■ 2017 performance range■ 2017 ROE performance
2017 ROE performance (%)
0 5 10 15 20 25 30
The framework is used by the committee as a broad guideline rather than being formulaic and applies to a broader group of executives than board directors. A key principle of the process is that the committee exercises its judgement in determining individual awards taking into account the individual’s contribution and performance. In particular, there may be a diverse spread of returns earned across the various divisions within the business which will be reflected in bonus out-turns achieved. The table therefore provides full retrospective disclosure of all the group financial targets that determine the annual bonuses.

www.beazley.com104 Beazley Annual report 2017
Directors’ remuneration report continuedAnnual remuneration report continued
Corporate achievementsCorporate achievements that the committee took into account for the year included the following:• the delivery of a profit after tax of $130.0m, and the return of $76.5m to shareholders by way of dividend despite paying out
substantial claims due to the natural catastrophes in the second half of the year;• delivery of growth in our gross premiums written of 7% in a market where premium rates continued to be under pressure;• extending the reach of our market leading products in the US, such as cyber, management liability and medical malpractice,
to clients in Europe, Asia and Latin America;• acquisition and integration of Creechurch Underwriters in the Canada;• creation of a Dublin based insurance company permitted to transact business throughout the European Union;• strong investment performance with a portfolio return of 2.9%; and• continued growth of the US business, with gross premiums written growing 12% in 2017.
Individual contributionsWhile a number of the specific individual objectives of the executive directors are considered commercially sensitive, the following provides details of executive director achievements which the committee took into account:
Martin L Bride • Continued successful management of the European strategic initiative• Conversion of the Dublin based reinsurance company into an insurance company permitted to transact business throughout the European Union
• Strong investment return of 2.9%Adrian P Cox • Delivery of strong results across the book with a combined ratio below 90%
• Strong growth of the book with an increase of 11% this year• Execution of the specialty lines international plan, building out the team and opening a new office in Spain and acquisition of Creechurch Underwriters in Canada
• Extending the reach of US specialty lines products to new clients in Europe, Asia and Latin America• Syndicate 5623 to focus on facilities in the London market
D Andrew Horton • Delivery of $130.0m profit after tax and dividends to shareholders of $76.5m in a challenging market• Premium growth of 7% across our business including growth of 12% in the US• Acquisition of Creechurch Underwriters in Canada and continued to recruit new talent• Continued to build on our culture with strong employee engagement results• Robust risk management in a highly volatile and competitive market
Neil P Maidment • Achievement of underwriting profit with a combined ratio of 99%, despite paying substantial claims due to natural catastrophes
• Growth of 7% in overall portfolio in environment of falling rates in many classes• Oversaw the successful merger of the life, accident & health and political risk & contingency divisions and
disposal of the Australian A&H businessClive A Washbourn • Achievement of sustained cumulative ROE of 39.8% over the past five years.
Bonus awards for 2017 Within the framework of the annual bonus, in respect of individual performance and achievements, awards are dependent on a profit pool and minimum level of ROE performance.
The resultant bonuses were as follows:Bonus (delivered as
a mix of cash and deferred shares) % of maximum % of salary
Martin L Bride £400,000 31% 125%Adrian P Cox £600,000 44% 175%D Andrew Horton £700,000 38% 153%Neil P Maidment £500,000 37% 146%Clive A Washbourn – – –

Governance
www.beazley.com Annual report 2017 Beazley 105
The following graph and table set out the out-turn for 2017 against performance and illustrate the way in which bonuses over time reflect profit and ROE performance.
Average executive director bonus (% of salary)
2011 2013 2014 20170%50%100%150%200%250%300%
400%350%
■ Profit before tax (PBT) $Average executive director bonus as a % of salary
2015 20160
50100150200250300
400350
2012
2011 2012 2013 2014 2015 2016 2017
Pre-tax profit $63m $251m $313m $262m $284m $293m $168mPost-tax ROE 6% 19% 21% 17% 19% 18% 9%Average executive director bonus as a percentage of salary c.64% c.272% c.333% c.294% c.291% c.272% c.150%
Bonus deferral ▪A portion of the bonus will generally be deferred into shares for three years. The deferral will range from 0% to 37.5% dependent on the level of bonus. Deferred shares are generally subject to continued employment.
A portion of bonus may also be deferred under the investment in underwriting plan, and this capital can be lost if underwriting performance is poor. No such deferral was made in 2017 (see investment in underwriting section on pages 108 and 109 for further details).
For 2017, the portion of each director’s annual bonus deferred into shares was as follows:Deferred
into shares
Martin L Bride £100,000Adrian P Cox £150,000D Andrew Horton £170,000Neil P Maidment £125,000Clive A Washbourn –

www.beazley.com106 Beazley Annual report 2017
Directors’ remuneration report continuedAnnual remuneration report continued
Long term incentive plan (LTIP) ▪Under the LTIP executive directors, senior management and selected underwriters receive awards of shares subject to the achievement of stretching performance conditions measured over three and five years.
The key features of the plan are as follows:• 50% of the award is measured after three years and 50% after five years;• awards are in the form of nil-cost options with a ten-year term; and• participants are expected to build a shareholding in Beazley equal to their annual award level. For example the CEO has a shareholding requirement of 200% of salary. Participants have three years to build this shareholding. LTIP awards may be forfeited if shareholding requirements are not met.
Given the five year performance period for 50% of the award, as well as the significant shareholding requirement and additional clawback provisions (which extend to seven years from date of award), the committee considers that the LTIP is significantly aligned to long term performance. Against that background it does not consider that further holding periods are required.
Vesting of awards is based on growth in net asset value per share (NAVps), one of Beazley’s key performance indicators. The committee considers the LTIP NAVps growth targets to be very stretching, particularly taking into account that growth must be over a sustained three and five year period.
Growth in NAVps is calculated taking into account any payment of dividends by the company. In line with our reporting to shareholders, NAVps is denominated in US dollars.
LTIP awards vesting in respect of the year ▪The LTIP awards shown in the single total figure of remuneration for 2017 include:• the second tranche of awards granted on 13 February 2013. These are due to vest on 13 February 2018, subject to the achievement of a NAVps growth performance condition over the five years ended 31 December 2017; and
• the first tranche of awards granted on 10 February 2015. These are due to vest on 12 February 2018, subject to the achievement of a NAVps growth performance condition over the three years ended 31 December 2017.
The results were independently calculated by Deloitte LLP.
The NAVps performance conditions for both these awards are as follows:
NAVps performance% of
award vesting
NAVps growth < average risk-free rate +7.5% p.a. 0%NAVps growth = average risk-free rate +7.5% p.a. 10%NAVps growth = average risk-free rate +10% p.a. 25%NAVps growth = average risk-free rate +15% p.a. 100%Straight-line vesting between points
Actual NAVps growth achieved in the five years to 31 December 2017 was 18.1% p.a. which resulted in 100% of the second tranche of the 2013 awards vesting.
Actual NAVps growth achieved in the three years to 31 December 2017 was 16.1% p.a. which resulted in 96.3% of the first tranche of the 2015 awards vesting.
MSIP award vesting in respect of the year ▪The MSIP award shown in the single total figure of remuneration for 2017 includes:• the second tranche of the award granted on 5 April 2013. This is due to vest on 5 April 2018, subject to pre-tax divisional ROE performance over the five years ended 31 December 2017.
The ROE performance condition for this award is as follows:
Average annual pre tax divisional ROE performance% of award
vesting
Average annual pre tax ROE <15% p.a. 0%Average annual pre tax ROE = 15% p.a. 20%Average annual pre tax ROE = 25% p.a. 100%Straight-line vesting between points
Actual ROE achieved in the five years to 31 December 2017 was 39.8% p.a. resulting in 100% of the award vesting.

Governance
www.beazley.com Annual report 2017 Beazley 107
LTIP awards for 2017 ▪During 2017 LTIP awards with a face value equal to 200% of salary for the CEO and 150% of salary were granted to executive directors, other than for the head of specialty lines. For the head of specialty lines an LTIP award of 175% of salary was granted in recognition of his contribution to the group. The awards were as shown in the table below.
Share awards granted during the year ▪
Individual Type of interest
Basis on which award
made
Number of shares awarded
Face value of shares (£)1
% vesting at threshold
Performance period endThree years (50%) Five years (50%)
LTIPMartin L Bride Nil cost option (LTIP) 150% of salary 110,515 480,000 10% 31/12/2019 31/12/2021Adrian P Cox Nil cost option (LTIP) 175% of salary 137,999 599,375 10% 31/12/2019 31/12/2021D Andrew Horton Nil cost option (LTIP) 200% of salary 210,439 914,000 10% 31/12/2019 31/12/2021Neil P Maidment Nil cost option (LTIP) 150% of salary 118,285 513,750 10% 31/12/2019 31/12/2021Clive A Washbourn Nil cost option (LTIP) 150% of salary 118,285 513,750 10% 31/12/2019 31/12/2021Deferred bonus (in respect of 2016 bonus)Martin L Bride Deferred shares
n/a
55,257 240,000 – – –Adrian P Cox Deferred shares 75,979 330,000 – – –D Andrew Horton Deferred shares 86,339 375,000 – – –Neil P Maidment Deferred shares 67,690 294,000 – – –Clive A Washbourn Deferred shares 48,350 210,000 – – –
1 The face value of shares awarded was calculated using the three day average share price prior to grant, which was 434.33p.
NAVps performance% of
award vesting
NAVps growth < risk-free rate +7.5% p.a. 0%NAVps growth = risk-free rate +7.5% p.a. 10%NAVps growth = risk-free rate +10% p.a. 25%NAVps growth = risk-free rate +15% p.a. 100%Straight-line vesting between points
LTIP awards for 2018 It is intended that the performance conditions for the LTIP awards for 2018 will be in line with those granted in 2017 (see table above). LTIP awards will be 200% of salary for the CEO and 150% for other executive directors.
DilutionThe share plans permit 10% of the company’s issued share capital to be issued pursuant to awards under the LTIP, SAYE and option plan in a ten-year period.
The company adheres to a dilution limit of 5% in a ten year period for executive schemes.
Investment in underwriting ▪Traditionally, Lloyd’s underwriters contributed their personal capital to syndicates in which they worked. With the move to corporate provision of capital, individual membership of Lloyd’s has declined significantly. The committee feels that having personal capital at risk in the syndicate is an important part of the remuneration policy and provides a healthy counterbalance to incentivisation through bonuses and long term incentive awards. The company has operated the Beazley staff underwriting plan for this purpose since 2004 and executive directors and other selected staff are invited to participate through bonus deferral with an element of their cash incentives ‘at risk’ as capital commitments. These capital commitments can be lost in full if underwriting performance is poor.
The group funds the capital for the plan. The individual capital commitment is then funded through individual bonus deferral. The aim is for individuals to fund their capital within three years.
To date over 270 employees of the group have committed to put at risk £13.3m of bonuses to the underwriting results of syndicate 623. Of the total at risk, £11.8m has already been deferred from the bonuses awarded.

www.beazley.com108 Beazley Annual report 2017
Directors’ remuneration report continuedAnnual remuneration report continued
The following executive directors participated in syndicate 623 through Beazley Staff Underwriting Limited:
Totalbonusesdeferred
£
2016year of
accountunderwriting
capacity £
2017year of
accountunderwriting
capacity £
2018year of
accountunderwriting
capacity £
Martin L Bride 191,600 400,000 400,000 400,000Adrian P Cox 191,600 400,000 400,000 400,000D Andrew Horton 191,600 400,000 400,000 400,000Neil P Maidment 191,600 400,000 400,000 400,000Clive A Washbourn1 191,600 400,000 400,000 n/a
1 Clive Washbourn stepped down from the board effective 20 July 2017. He remains employed by the group but no reporting will be due for 2018.
The executive directors are currently fully funded in the plan and no further bonus deferral was made in 2017.
Malus and clawback Clawback provisions have operated for incentives in respect of 2015 and onwards. Under these provisions the committee has the discretion to require clawback in certain circumstances for a defined period following payment or vesting. Annual bonus and LTIP awards may be subject to clawback in the event of:• material misstatement of results;• gross misconduct; or• factual error in calculating vesting or award. Annual bonus awards may be subject to clawback for a period of three years following payment of the cash bonus. These clawback provisions will also extend to any deferred shares delivered before the end of the three year period and to any bonus which is voluntarily deferred as notional capital into the staff underwriting plan (excluding any returns on the investment, which will not be subject to clawback).
LTIP awards may be subject to clawback for a period of two years following vesting. Malus provisions have applied to the LTIP and deferred share plan for a number of years. The committee has the discretion to reduce or withhold an award in circumstances of:• conduct which justifies summary dismissal;• an exceptional development which has a material adverse impact on the company, including but not limited to reputational damage, material failure of risk management, a material misstatement or any significant sanction from a government agency or regulatory authority; or
• where the committee considers it is necessary in order to comply with a law or regulatory requirement.
Pensions ▪The pension benefits for executive directors and staff are provided by way of a defined contribution scheme arranged through Fidelity, which is non-contributory. The company contributes 15% of salary for directors.
Following changes to pension tax legislation that came into force from April 2011, an equivalent cash alternative may be offered if an individual exceeds the lifetime or annual allowance.
Prior to 31 March 2006 the company provided pension entitlements to directors that are defined benefit in nature, based on its legacy policy under the Beazley Furlonge Limited Final Salary Pension Scheme. Future service accruals ceased on 31 March 2006. Only base salary is pensionable, subject to an earnings cap. The normal retirement age for pension calculation purposes is 60 years. A spouse’s pension is the equivalent of two-thirds of the member’s pension (before any commutation) payable on the member’s death after retirement.

Governance
www.beazley.com Annual report 2017 Beazley 109
Details of the defined benefit entitlements of those who served as directors during the year are as follows:
Accruedbenefit at
31 Dec 2017
£
Increasein accrued benefits
excluding inflation (A)
£
Increase in accrued benefits
including inflation
£
Transfer value of (A) less
directors’ contributions
£
Transfer value
of accrued benefits at
31 Dec2017
£
Transfer value less directors’
contributions£
Normal retirement date
Adrian P Cox 13,114 – 531 – 400,378 (34,460) 12 Mar 2031Neil P Maidment 44,770 – 1,815 – 1,439,452 (27,925) 21 Oct 2022Clive A Washbourn 19,898 – 807 – 654,565 (2,377) 26 Oct 2020
Under the Beazley Furlonge Limited Final Salary Pension Scheme, on early retirement the director receives a pension which is reduced to reflect early payment in accordance with the rules of the scheme.
No other pension provisions are made.
Risk and reward at BeazleyThe committee regularly reviews developing remuneration governance in the context of Solvency II remuneration guidance, other corporate governance developments and institutional shareholders’ guidance. The chief risk officer reports annually to the remuneration committee on risk and remuneration as part of the regular agenda. The committee believes the group is adopting an approach which is consistent with, and takes account of, the risk profile of the group.
We believe reward at Beazley is appropriately balanced in light of risk considerations, particularly taking into account the following features:
Features aligned with risk considerationsShare deferral A portion of the LTIP has performance measured over an extended five-year period.Extended performance periods A portion of the LTIP has performance measured over an extended five-year period. Shareholding requirements Executive directors are expected to build up and maintain a shareholding of 150% of salary (200% for the CEO).
LTIP awards may be forfeited if shareholding requirements are not met.Investment in underwriting Management and underwriters may defer part of their bonuses into the Beazley staff underwriting plan,
providing alignment with capital providers. Capital commitments can be lost if underwriting performance is poor.Underwriters’ remuneration aligned with profit achieved
Under the profit related bonus plan payments are aligned with the timing of profits achieved on the account. For long tail accounts this may be in excess of six years.
If the account deteriorates then payouts are ‘clawed back’ through adjustments to future payments. Since 2012 profit related pay plans may be at risk of forfeiture or reduction if, in the opinion of the remuneration committee, there has been a serious regulatory breach by the underwriter concerned, including in relation to the group’s policy on conduct risk.
Clawback and malus provisions for annual bonus and LTIP shares
For deferred share awards and LTIP awards from 2012 malus provisions were introduced. For LTIP awards from 2015 and annual bonus in respect of 2015 and onwards, clawback provisions also apply for executive directors.
Service contracts and payments for loss of office No loss of office payments have been made in the year.
Having served as an executive director since 2006 Clive Washbourn stepped down from the board for personal reasons effective 20 July 2017. Clive remains a member of the executive committee and continues to serve on the board of Beazley Furlonge Ltd. His outstanding share awards subsist to their normal release/vesting date subject to performance where applicable.
The current contracts in place for executive directors are as follows:Date of contract
Martin L Bride 2 Nov 2015Adrian P Cox 2 Nov 2015D Andrew Horton 2 Nov 2015Neil P Maidment 22 Feb 2016
The notice period for each of the above contracts is 12 months. There is no unexpired term as each of the executive directors’ contracts is on a rolling basis.

www.beazley.com110 Beazley Annual report 2017
Directors’ remuneration report continuedAnnual remuneration report continued
External appointmentsAndrew Horton has been a non-executive director of Man Group plc since 3 August 2013, and he retains the fees in respect of this appointment. Fees for the year 2017 were £80,000.
Neil Maidment was appointed to the Council of Lloyd’s on 1 February 2016, and he retains the fees in respect of this appointment. Fees for the year 2017 were £47,500.
Non-executive directors’ feesThe fees of non-executive directors are determined by the board. When setting fee levels consideration is given to levels in comparable companies for comparable services and also to the time commitment and responsibilities of the individual non-executive director. No non-executive director is involved in the determination of their fees. The board reviews fees annually.
No non-executive director participates in the group’s incentive arrangements or pension plan.
Non-executive directors are appointed for fixed terms, normally for three years, and may be reappointed for future terms. Non-executive directors are typically appointed through a selection process that assesses whether the candidate brings the desired competencies and skills to the group. The board has identified several key competencies for non-executive directors to complement the existing skill-set of the executive directors. These competencies may include:• insurance sector expertise;• asset management skills;• public company and corporate governance experience; • risk management skills;• finance skills; and• IT and operations skills.
Beazley operates across Lloyd’s, Europe and the US markets through a variety of legal entities and structures. Non-executive directors, in addition to the plc board, typically sit on either one of our key subsidiary boards, namely Beazley Furlonge Ltd, our managing agency at Lloyd’s, or Beazley Insurance dac, our Irish insurance company. As a result of developments in regulation, the degree of autonomy in the operation of each board has increased in recent years, with a consequent increase in time commitment and scope of the role.
Non-executive directors’ service contracts ▪Details of the non-executive directors’ terms of appointment are set out below:
Commencementof appointment Expires
George P Blunden 1 Jan 2010 AGM 2019Angela D Crawford-Ingle 27 Mar 2013 AGM 2019Dennis Holt 21 Jul 2011 AGM 2018Christine LaSala 1 Jul 2016 AGM 2020Sir J Andrew Likierman 25 Mar 2015 AGM 2021David L Roberts 1 Nov 2017 AGM 2021John P Sauerland 5 May 2016 AGM 2020Robert A Stuchbery 11 Aug 2016 AGM 2020Catherine M Woods 1 Jan 2016 AGM 2019
The standard approach for non-executive director appointments is that the appointment expires at the AGM following the end of a three year term, notwithstanding the fact that each non-executive director is subject to annual re-election at each AGM.

Governance
www.beazley.com Annual report 2017 Beazley 111
Approach to remuneration for employees other than directorsThe committee also has oversight of remuneration arrangements elsewhere in the group. The following tables set out the additional incentive arrangements for other staff within the organisation.
Other incentive arrangements at Beazley (not applicable to executive directors):
Element Objective Summary
Profit related pay plan
To align underwriters’ reward with the profitability of their account.
Profit on the relevant underwriting account as measured at three years and later.
Support bonus plan
To align staff bonuses with individual performance and achievement of objectives.
Participation is limited to staff members not on the executive or in receipt of profit related pay bonus. The support bonus pool may be enhanced by a contribution from the enterprise bonus pool.
Retention shares To retain key staff. Used in certain circumstances. Full vesting dependent on continued employment over six years.
Underwriter bonus plan – profit related pay planUnderwriters participate in a profit related pay plan based upon the profitability of their underwriting account. Executive directors do not participate in this plan.
The objective of the plan is to align the interests of the group and the individual through aligning an underwriter’s reward to the long term profitability of their portfolio. Underwriters who have significant influence over a portfolio may be offered awards under the plan. There is no automatic eligibility. Profit related pay is awarded irrespective of the results of the group. Awards are capped.
This bonus is awarded as cash and is based upon a fixed proportion of profit achieved on the relevant underwriting account as measured at three years and later. Any movements in prior years are reflected in future year payments as the account develops after three years. For long-tail accounts the class is still relatively immature at the three-year stage and therefore payments will be modest. Underwriters may receive further payouts in years four, five and six (and even later) as the account matures. Therefore each year they could be receiving payouts in relation to multiple underwriting years.
If the account deteriorates as it develops any payouts are ‘clawed back’ through reductions in future profit related pay bonuses. From 2012 onwards any new profit related pay plans may be at risk of forfeiture or reduction if, in the opinion of the remuneration committee, there has been a serious regulatory breach by the underwriter concerned, including in relation to the group’s policy on conduct risk.
The fixed proportion is calculated based upon profit targets which are set through the business planning process and reviewed by a committee formed of executive committee members and functional specialists including the group actuary. Underwriting risk is taken into account when setting profit targets.
In addition to profit related pay, underwriters are also eligible to receive a discretionary bonus, based upon performance, from the enterprise bonus pool. A proportion of this bonus may be paid in deferred shares, which vest after three years subject to continued employment.
Support bonus planEmployees who are not members of the executive and who do not participate in the underwriters’ profit related pay plan participate in a discretionary bonus pool. This pool provides employees with a discretionary award of an annual performance bonus that reflects overall individual performance including meeting annual objectives.
A proportion of this award may also be dependent on the group’s ROE and therefore allocated from the enterprise bonus pool. A proportion of this bonus may be paid in deferred shares, which vest after three years subject to continued employment.
UK SAYEThe company operates an HMRC-approved SAYE scheme for the benefit of UK-based employees. The scheme offers a three-year savings contract period with options being offered at a 20% discount to the share price on grant. Monthly contributions are made through a payroll deduction on behalf of participating employees. The UK SAYE scheme has been extended to eligible employees in Singapore and Ireland. The Irish SAYE scheme has been approved by the Irish Revenue.

www.beazley.com112 Beazley Annual report 2017
Directors’ remuneration report continuedAnnual remuneration report continued
US SAYEThe Beazley plc savings-related share option plan for US employees permits all eligible US-based employees to purchase shares of Beazley plc at a discount of up to 15% to the shares’ fair market value. Participants may exercise options after a two-year period. The plan is compliant with the terms of section 423 of the US Internal Revenue Code and is similar to the SAYE scheme operated for UK-based Beazley employees.
Retention sharesThe retention plan may be used for recruitment or retention purposes. Any awards vest at 25% per annum over years three to six. Policy going forward is that existing executive directors do not participate in this plan and no executive directors have subsisting legacy awards outstanding.
CEO pay increase in relation to all employees Percentage change in remuneration from 31 Dec 2016 to 31 Dec 2017
Percentage change in base salary % Percentage change in benefits % Percentage change in annual bonus %
CEO 2.5% 1.5% (44.0%)All employees 3.0% 1.8% (22.5%)
Note: Salary and bonus are compared against all employees of the group. Benefits (including pension) are compared against all UK employees, reflecting the group’s policy that benefits are provided by reference to local market levels.
Statement of directors’ shareholdings and share interests ▪LTIP participants are expected to build a shareholding in Beazley equal to their annual award level. The CEO has a shareholding requirement of 200% of salary and other executive directors have a shareholding requirement of 150% of salary. LTIP awards may be forfeited if shareholding requirements are not met. All executive directors have met their shareholding requirements (see chart below).
Directors’ shareholdings (% of salary)
■ Actual holding as % of salary■ Holding requirement as % of salary
1,803
200A Horton M Bride
0800
1,6002,4003,2004,0004,800
373150
828
150
4,403
150570150
A Cox N Maidment C Washbourn
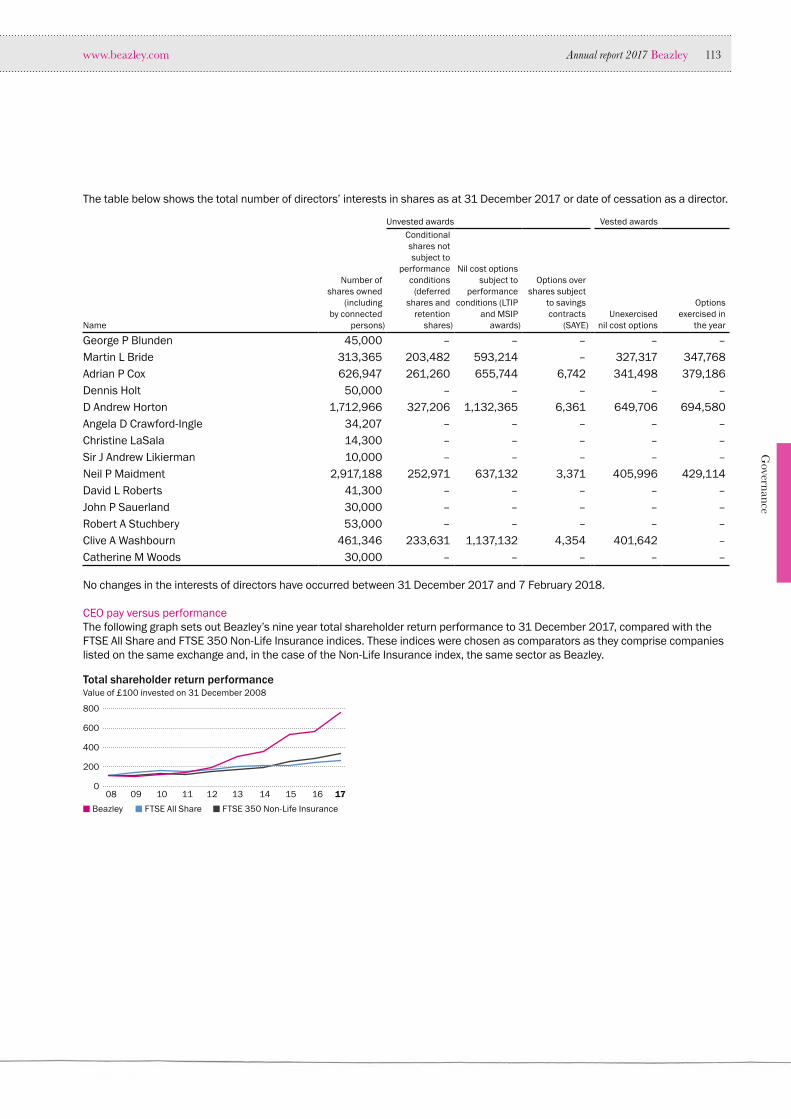
Governance
www.beazley.com Annual report 2017 Beazley 113
The table below shows the total number of directors’ interests in shares as at 31 December 2017 or date of cessation as a director.
Unvested awards Vested awards
Name
Number of shares owned
(includingby connected
persons)
Conditional shares not subject to
performance conditions
(deferred shares and
retention shares)
Nil cost options subject to
performance conditions (LTIP
and MSIP awards)
Options over shares subject
to savings contracts
(SAYE)Unexercised
nil cost options
Options exercised in
the year
George P Blunden 45,000 – – – – –Martin L Bride 313,365 203,482 593,214 – 327,317 347,768Adrian P Cox 626,947 261,260 655,744 6,742 341,498 379,186Dennis Holt 50,000 – – – – –D Andrew Horton 1,712,966 327,206 1,132,365 6,361 649,706 694,580Angela D Crawford-Ingle 34,207 – – – – –Christine LaSala 14,300 – – – – –Sir J Andrew Likierman 10,000 – – – – –Neil P Maidment 2,917,188 252,971 637,132 3,371 405,996 429,114David L Roberts 41,300 – – – – –John P Sauerland 30,000 – – – – –Robert A Stuchbery 53,000 – – – – –Clive A Washbourn 461,346 233,631 1,137,132 4,354 401,642 –Catherine M Woods 30,000 – – – – –
No changes in the interests of directors have occurred between 31 December 2017 and 7 February 2018.
CEO pay versus performanceThe following graph sets out Beazley’s nine year total shareholder return performance to 31 December 2017, compared with the FTSE All Share and FTSE 350 Non-Life Insurance indices. These indices were chosen as comparators as they comprise companies listed on the same exchange and, in the case of the Non-Life Insurance index, the same sector as Beazley.
0
200
400
600
800
Total shareholder return performance
08 09 10 11 12 13 17
■ Beazley ■ FTSE All Share ■ FTSE 350 Non-Life Insurance
Value of £100 invested on 31 December 2008
1614 15
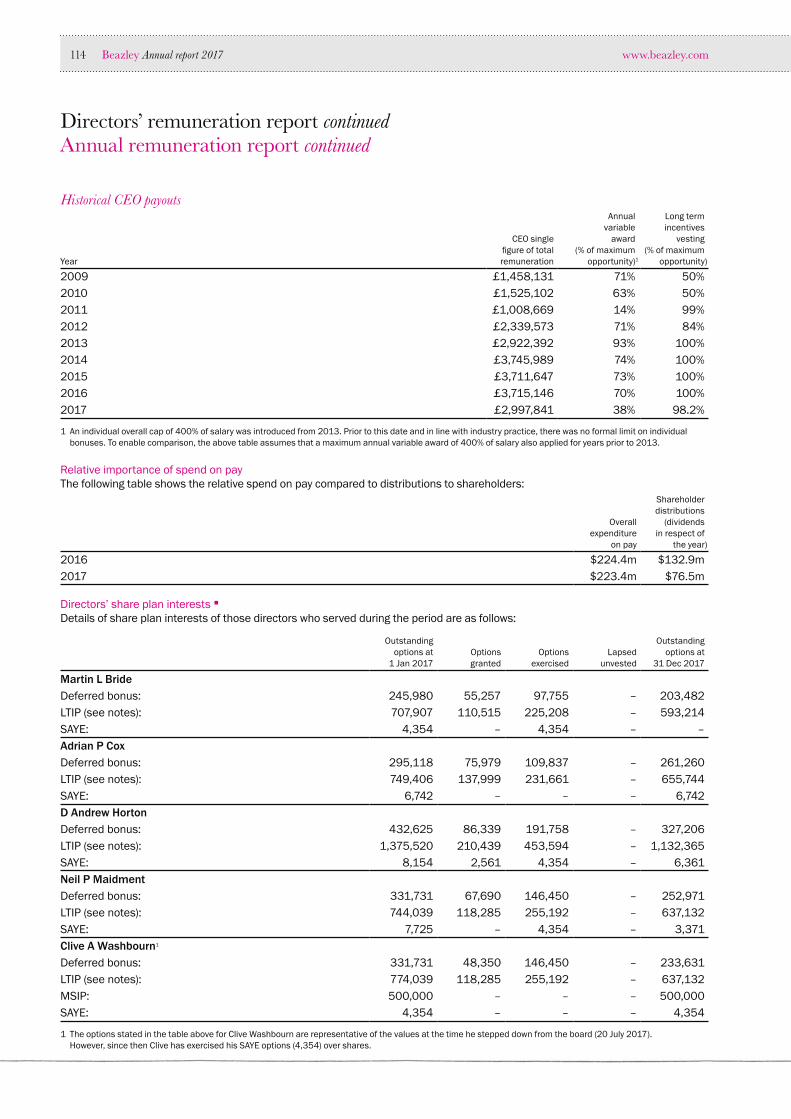
www.beazley.com114 Beazley Annual report 2017
Directors’ remuneration report continuedAnnual remuneration report continued
Historical CEO payouts
Year
CEO single figure of total
remuneration
Annualvariable
award(% of maximum
opportunity)1
Long term incentives
vesting (% of maximum
opportunity)
2009 £1,458,131 71% 50%2010 £1,525,102 63% 50%2011 £1,008,669 14% 99%2012 £2,339,573 71% 84%2013 £2,922,392 93% 100%2014 £3,745,989 74% 100%2015 £3,711,647 73% 100%2016 £3,715,146 70% 100%2017 £2,997,841 38% 98.2%
1 An individual overall cap of 400% of salary was introduced from 2013. Prior to this date and in line with industry practice, there was no formal limit on individual bonuses. To enable comparison, the above table assumes that a maximum annual variable award of 400% of salary also applied for years prior to 2013.
Relative importance of spend on payThe following table shows the relative spend on pay compared to distributions to shareholders:
Overallexpenditure
on pay
Shareholder distributions
(dividends in respect of
the year)
2016 $224.4m $132.9m2017 $223.4m $76.5m
Directors’ share plan interests ▪ Details of share plan interests of those directors who served during the period are as follows:
Outstandingoptions at
1 Jan 2017Options
grantedOptions
exercisedLapsed
unvested
Outstandingoptions at
31 Dec 2017
Martin L BrideDeferred bonus: 245,980 55,257 97,755 – 203,482LTIP (see notes): 707,907 110,515 225,208 – 593,214SAYE: 4,354 – 4,354 – –Adrian P CoxDeferred bonus: 295,118 75,979 109,837 – 261,260LTIP (see notes): 749,406 137,999 231,661 – 655,744SAYE: 6,742 – – – 6,742D Andrew HortonDeferred bonus: 432,625 86,339 191,758 – 327,206LTIP (see notes): 1,375,520 210,439 453,594 – 1,132,365SAYE: 8,154 2,561 4,354 – 6,361Neil P MaidmentDeferred bonus: 331,731 67,690 146,450 – 252,971LTIP (see notes): 744,039 118,285 255,192 – 637,132SAYE: 7,725 – 4,354 – 3,371Clive A Washbourn1
Deferred bonus: 331,731 48,350 146,450 – 233,631LTIP (see notes): 774,039 118,285 255,192 – 637,132MSIP: 500,000 – – – 500,000SAYE: 4,354 – – – 4,354
1 The options stated in the table above for Clive Washbourn are representative of the values at the time he stepped down from the board (20 July 2017). However, since then Clive has exercised his SAYE options (4,354) over shares.
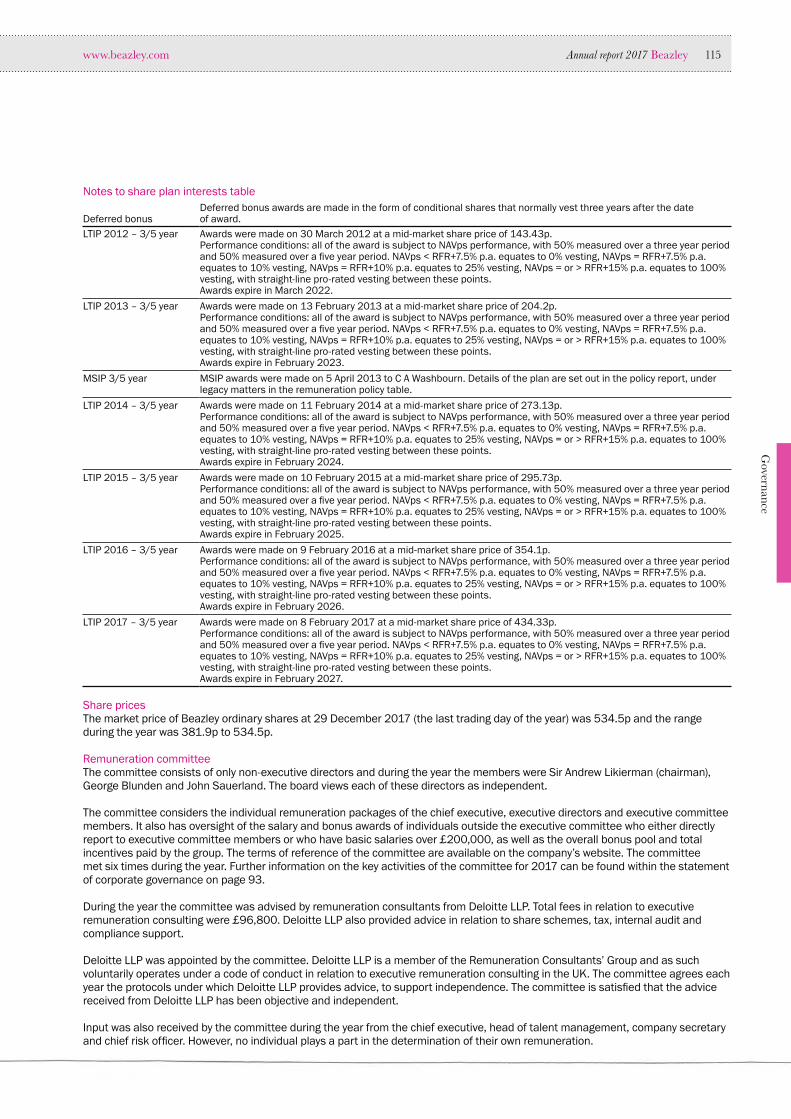
Governance
www.beazley.com Annual report 2017 Beazley 115
Notes to share plan interests table
Deferred bonusDeferred bonus awards are made in the form of conditional shares that normally vest three years after the date of award.
LTIP 2012 – 3/5 year Awards were made on 30 March 2012 at a mid-market share price of 143.43p.Performance conditions: all of the award is subject to NAVps performance, with 50% measured over a three year period and 50% measured over a five year period. NAVps < RFR+7.5% p.a. equates to 0% vesting, NAVps = RFR+7.5% p.a. equates to 10% vesting, NAVps = RFR+10% p.a. equates to 25% vesting, NAVps = or > RFR+15% p.a. equates to 100% vesting, with straight-line pro-rated vesting between these points.Awards expire in March 2022.
LTIP 2013 – 3/5 year Awards were made on 13 February 2013 at a mid-market share price of 204.2p.Performance conditions: all of the award is subject to NAVps performance, with 50% measured over a three year period and 50% measured over a five year period. NAVps < RFR+7.5% p.a. equates to 0% vesting, NAVps = RFR+7.5% p.a. equates to 10% vesting, NAVps = RFR+10% p.a. equates to 25% vesting, NAVps = or > RFR+15% p.a. equates to 100% vesting, with straight-line pro-rated vesting between these points.Awards expire in February 2023.
MSIP 3/5 year MSIP awards were made on 5 April 2013 to C A Washbourn. Details of the plan are set out in the policy report, under legacy matters in the remuneration policy table.
LTIP 2014 – 3/5 year Awards were made on 11 February 2014 at a mid-market share price of 273.13p.Performance conditions: all of the award is subject to NAVps performance, with 50% measured over a three year period and 50% measured over a five year period. NAVps < RFR+7.5% p.a. equates to 0% vesting, NAVps = RFR+7.5% p.a. equates to 10% vesting, NAVps = RFR+10% p.a. equates to 25% vesting, NAVps = or > RFR+15% p.a. equates to 100% vesting, with straight-line pro-rated vesting between these points.Awards expire in February 2024.
LTIP 2015 – 3/5 year Awards were made on 10 February 2015 at a mid-market share price of 295.73p.Performance conditions: all of the award is subject to NAVps performance, with 50% measured over a three year period and 50% measured over a five year period. NAVps < RFR+7.5% p.a. equates to 0% vesting, NAVps = RFR+7.5% p.a. equates to 10% vesting, NAVps = RFR+10% p.a. equates to 25% vesting, NAVps = or > RFR+15% p.a. equates to 100% vesting, with straight-line pro-rated vesting between these points.Awards expire in February 2025.
LTIP 2016 – 3/5 year Awards were made on 9 February 2016 at a mid-market share price of 354.1p.Performance conditions: all of the award is subject to NAVps performance, with 50% measured over a three year period and 50% measured over a five year period. NAVps < RFR+7.5% p.a. equates to 0% vesting, NAVps = RFR+7.5% p.a. equates to 10% vesting, NAVps = RFR+10% p.a. equates to 25% vesting, NAVps = or > RFR+15% p.a. equates to 100% vesting, with straight-line pro-rated vesting between these points.Awards expire in February 2026.
LTIP 2017 – 3/5 year Awards were made on 8 February 2017 at a mid-market share price of 434.33p.Performance conditions: all of the award is subject to NAVps performance, with 50% measured over a three year period and 50% measured over a five year period. NAVps < RFR+7.5% p.a. equates to 0% vesting, NAVps = RFR+7.5% p.a. equates to 10% vesting, NAVps = RFR+10% p.a. equates to 25% vesting, NAVps = or > RFR+15% p.a. equates to 100% vesting, with straight-line pro-rated vesting between these points.Awards expire in February 2027.
Share prices The market price of Beazley ordinary shares at 29 December 2017 (the last trading day of the year) was 534.5p and the range during the year was 381.9p to 534.5p.
Remuneration committee The committee consists of only non-executive directors and during the year the members were Sir Andrew Likierman (chairman), George Blunden and John Sauerland. The board views each of these directors as independent.
The committee considers the individual remuneration packages of the chief executive, executive directors and executive committee members. It also has oversight of the salary and bonus awards of individuals outside the executive committee who either directly report to executive committee members or who have basic salaries over £200,000, as well as the overall bonus pool and total incentives paid by the group. The terms of reference of the committee are available on the company’s website. The committee met six times during the year. Further information on the key activities of the committee for 2017 can be found within the statement of corporate governance on page 93.
During the year the committee was advised by remuneration consultants from Deloitte LLP. Total fees in relation to executive remuneration consulting were £96,800. Deloitte LLP also provided advice in relation to share schemes, tax, internal audit and compliance support.
Deloitte LLP was appointed by the committee. Deloitte LLP is a member of the Remuneration Consultants’ Group and as such voluntarily operates under a code of conduct in relation to executive remuneration consulting in the UK. The committee agrees each year the protocols under which Deloitte LLP provides advice, to support independence. The committee is satisfied that the advice received from Deloitte LLP has been objective and independent.
Input was also received by the committee during the year from the chief executive, head of talent management, company secretary and chief risk officer. However, no individual plays a part in the determination of their own remuneration.

www.beazley.com116 Beazley Annual report 2017
Directors’ remuneration report continuedAnnual remuneration report continued
Statement of shareholder votingThe voting outcomes of the 2016 annual remuneration report and remuneration policy were as follows:
Votes for % for Votes against % against Total votes castVotes withheld
(abstentions)
2016 annual remuneration report 382,347,355 97.91 8,172,340 2.09 390,519,695 13,748,4372016 remuneration policy 382,443,087 94.63 21,721,581 5.37 404,164,668 103,464
Annual general meetingAt the forthcoming annual general meeting to be held on 22 March 2018, an advisory resolution will be proposed to approve this annual remuneration report.
I am keen to encourage an ongoing dialogue with shareholders. Accordingly, please feel free to contact me if you would like to discuss any matter arising from this report or remuneration issues generally, either by writing to me at the company’s head office or by email through Christine Oldridge at [email protected].
By order of the board
J A LikiermanChairman of the remuneration committee
7 February 2018

Governance
www.beazley.com Annual report 2017 Beazley 117
Statement of directors’ responsibilities in respect of the annual report and financial statementsThe directors are responsible for preparing the annual report and the group and parent company financial statements in accordance with applicable law and regulations.
Company law requires the directors to prepare group and parent company financial statements for each financial year. Under that law they are required to prepare the group financial statements in accordance with International Financial Reporting Standards as adopted by the European Union (IFRSs as adopted by the EU) and applicable law and have elected to prepare the parent company financial statements on the same basis.
Under company law the directors must not approve the financial statements unless they are satisfied that they give a true and fair view of the state of affairs of the group and parent company and of their profit or loss for that period. In preparing each of the group and parent company financial statements, the directors are required to: • select suitable accounting policies and then apply them consistently;• make judgements and estimates that are reasonable, relevant and reliable;• state whether they have been prepared in accordance with IFRSs as adopted by the EU; • assess the group and parent company’s ability to continue as a going concern, disclosing, as applicable, matters related to
going concern; and • use the going concern basis of accounting unless they either intend to liquidate the group or the parent company or to cease
operations, or have no realistic alternative but to do so.
The directors are responsible for keeping adequate accounting records that are sufficient to show and explain the parent company’s transactions and disclose with reasonable accuracy at any time the financial position of the parent company and enable them to ensure that its financial statements comply with the Companies Act 2006. They are responsible for such internal control as they determine is necessary to enable the preparation of financial statements that are free from material misstatement, whether due to fraud or error, and have general responsibility for taking such steps as are reasonably open to them to safeguard the assets of the Group and to prevent and detect fraud and other irregularities.
Under applicable law and regulations, the directors are also responsible for preparing a strategic report, directors’ report, directors’ remuneration report and corporate governance statement that complies with that law and those regulations.
The directors are responsible for the maintenance and integrity of the corporate and financial information included on the company’s website. Legislation in the UK governing the preparation and dissemination of financial statements may differ from legislation in other jurisdictions.
Responsibility statement of the directors in respect of the annual financial reportWe confirm that to the best of our knowledge:• the financial statements, prepared in accordance with the applicable set of accounting standards, give a true and fair view of
the assets, liabilities, financial position and profit or loss of the company and the undertakings included in the consolidation taken as a whole; and
• the strategic report/directors’ report includes a fair review of the development and performance of the business and the position of the issuer and the undertakings included in the consolidation taken as a whole, together with a description of the principal risks and uncertainties that they face.
We consider the annual report and accounts, taken as a whole, is fair, balanced and understandable and provides the information necessary for shareholders to assess the group’s position and performance, business model and strategy.
D HoltChairman
M L BrideFinance director
7 February 2018

1. Our opinion is unmodified
We have audited the financial statements of Beazley plc (“the Company”) for the year ended 31 December 2017 which comprise the consolidated statement of profit or loss, statement of comprehensive income, statement of changes in equity, statements of financial position, statements of cash flows, and the related notes, including the accounting policies in note 1.
In our opinion:
— the financial statements give a true and fair view of the state of the Group’s and of the parent Company’s affairs as at 31 December 2017 and of the Group’s profit for the year then ended;
— the Group financial statements have been properly prepared in accordance with International Financial Reporting Standards as adopted by the European Union (IFRSs as adopted by the EU);
— the parent Company financial statements have been properly prepared in accordance with IFRSs as adopted by the EU and as applied in accordance with the provisions of the Companies Act 2006; and
— the financial statements have been prepared in accordance with the requirements of the Companies Act 2006 and, as regards the Group financial statements, Article 4 of the IAS Regulation.
Basis for opinion
We conducted our audit in accordance with International Standards on Auditing (UK) (“ISAs (UK)”) and applicable law. Our responsibilities are described below. We believe that the audit evidence we have obtained is a sufficient and appropriate basis for our opinion. Our audit opinion is consistent with our report to the audit committee.
We were appointed as auditor by the shareholders on 6 November 2002. The period of total uninterrupted engagement is for the 15 financial years ended 31 December 2017. We have fulfilled our ethical responsibilities under, and we remain independent of the Group in accordance with, UK ethical requirements including the FRC Ethical Standard as applied to listed public interest entities. No non-audit services prohibited by that standard were provided.
Independent auditor’s reportto the members of Beazley plc
Overview
Materiality: group financial statements as a whole
$20m (2016: $20m)
1% (2016: 1%) of Gross written premium
Coverage 99% (2016: 99%) of group revenue
Risks of material misstatement vs 2016
Recurring risks Valuation of insurance liabilities
◄►
Recoverability of insurance receivables and reinsurance assets
◄►
Valuation of investments
◄►
Valuation of premium estimates
◄►
Pa rent: Recoverabilityof parent company’s investment in subsidiaries
◄►
118

2. Key audit matters: our assessment of risks of material misstatement
Key audit matters are those matters that, in our professional judgment, were of most significance in the audit of the financial statements and include the most significant assessed risks of material misstatement (whether or not due to fraud) identified by us, including those which had the greatest effect on: the overall audit strategy; the allocation of resources in the audit; and directing the efforts of the engagement team. We summarise below the key audit matters (unchanged from 2016), in decreasing order of audit significance, in arriving at our audit opinion above, together with our key audit procedures to address those matters and, as required for public interest entities, our results from those procedures. These matters were addressed, and our results are based on procedures undertaken, in the context of, and solely for the purpose of, our audit of the financialstatements as a whole, and in forming our opinion thereon, and consequently are incidental to that opinion, and we do not provide a separate opinion on these matters.
The risk Our response
Valuation of insuranceliabilities
($5,167.8m, gross, $3,936.7m, net, of which incurred but not reported (‘IBNR’) represented $2,852.3m, gross, $2,078.5m, net; 2016: $4,657.7m, gross, $3,575.6m, net, of which IBNR represented $2,564.7m, gross, $1,915.3m, net)
Refer to page 88 (Audit and Risk Committee Report), page 135 (Statement of accounting policies) and page 175 (financial disclosures).
Subjective valuation:
Insurance liabilities represent the single largest liability for the Group. Valuation of these liabilitiesis highly judgemental because it requires a number of assumptions to be made with high estimation uncertainty such as expected loss ratios, estimates of ultimate premium and of the frequency and severity of claims and, where appropriate, the discount rate for longer tail classes of business by territory and line of business. The determination and application of the methodology and performance of the calculations are also complex.
These judgemental and complex calculations for insurance liabilities are also used to derive the valuation of the related reinsurance assets.
A margin is added to the actuarial best estimate of insurance liabilities to make allowance for specific risks identified in assessment of the best estimate. The appropriate margin to recognise is a subjective judgement and estimate taken by the directors, based on the perceived uncertainty and potential for volatility in the underlying claims.
Completeness and accuracy of data:
The valuation of insurance liabilities depends on complete and accurate data about the volume, amount and pattern of current and historical claims since they are often used to form expectations about future claims. If the data used in calculating the insurance liabilities, or for forming judgements over key assumptions, is not complete and accurate then material impacts on the valuation of insurance liabilities may arise.
We used our own actuarial specialists to assistus in performing our procedures in this area.
Our procedures included:
— Sector experience and benchmarking: Performed benchmarking of Beazley’s ultimate loss ratios, initial expected loss ratios, premium rate change, expectationsof total losses on natural catastrophes, the rate at which IBNR has been utilised in the year and reserve releases in comparison to the rest of the market, in order to identify specific trends and outliers.
— Re-projections: Used our projection of premiums and claims (on a gross and net basis) that we carried out as part of our overall actuarial audit testing and compared these with the Group’s estimates.
— Methodology assessment: Assessed the reserving assumptions and methodology (on a gross basis and net of outwards reinsurance) for reasonableness using our professional and sector experience and for consistency year on year, including inspecting the Group’s margin paper.
— Actual versus expected testing: Challenged the quality of Beazley’s historical reserving estimates by monitoring progression of loss ratios against expectations.
In addition to the above, the audit team performed procedures to assess the completeness and accuracy of data:
— Data reconciliations: Checked the completeness and accuracy of the data used within the reserving process by reconciling the actuarial source data to the financial systems. We have also checked the completeness and accuracy of the data flow from the claims and policy systems into the financial systems primarily through the testing of automated controls.
Our results
— We found the resulting estimate of insurance liabilities to be acceptable (2016 result: acceptable).
Governance
119

The risk Our response
Recoverability of insurance receivables and reinsurance assets
(Insurance receivables $920.2m; 2016: $794.7m, Reinsuranceassets: $1,231.1m;2016: $1,082.1m)
Refer to page 89 (Audit and Risk Committee Report), page 139 (Statement of accounting policies) and pages 171 & 172 (financial disclosures).
Recoverability of debtors
— Insurance receivables:
The ability to identify, monitor and age insurance debtors relies on the timely availability of reliable data. The availability of this data is also impacted by the source, being either settled direct through intermediaries or through Xchanging.
— Reinsurance assets:
Major catastrophes could impair the group’s ability to recover incurred losses from its reinsurers, depending on the financial strength of the counterparties, which would then impact the recoverability of reinsurance assets.
Reinsurance contracts are often complex. The calculations of recoveries includes a number of judgements, and an assessment of the risk transferred.
In recent years, Beazley has adopted a consistent approach in determining the bad debt provisions to be booked in the financial statements. However, judgement is required in ensuring this approach remains relevant and that any aged balances are being given appropriate attention.
Our procedures included:
— Data reconciliations: Reperformed the Group’s prepared reconciliations between Xchanging and the Group’s financial systems.
— Assessing future premium debtors: Performed an analysis over the unsigned debtors within the insurance receivables balance in order to assess the valuation and recoverability of these debtors.
— Provisioning analysis: Critically assessed, based on our sector experience, the adequacy of the provisioning policy in place for Beazley by assessing and investigating any material movements in policy and the overall percentage of bad debt during the reporting period.
— Recoverability assessment: Considered potential indications of non-recovery for a sample of reinsurance assets, in light of the credit standing of the counterparty and age of the debt.
Our results
— We found the resulting estimate of the recoverability of insurance and reinsurance debtors to be acceptable (2016 result: acceptable).
Valuation of investments
($4,449.6m, of which hedge funds and illiquid credit assets comprised $557.8m; 2016: $4,195.4m, of which hedge funds and illiquid credit assets comprised $449.5m)
Refer to page 89 (Audit and Risk Committee Report), page 138 (Statement of accounting policies) and page 165 (financial disclosures).
Subjective valuation:
A proportion of the Group’s investment assets are comprised of either illiquid credit assets or investments in hedge funds. These assets are inherently harder to value due to the inability to obtain a market price of these assets as at the balance sheet date. As such there is judgement involved in the valuation of these assets.
The valuation of the investments are based on third party valuation reports which are received at dates other than the year end date. The investments are subject to variations in value between the date of the valuation report and the period end date. These variations where applicable require judgement to assess whether adjustments are required to the valuation of the investments at the period end date.
Our procedures included:
— Reconciliation controls: Tested the design and operating effectiveness of the controls associated with the existence of the hedge funds and illiquid credit assets.
— Comparing valuations: For investments in hedge funds we inspected the financial statements of the underlying funds to confirm that the valuation approach was acceptable.
— Historical accuracy: For illiquid credit assets and investments in hedge funds the historical accuracy of the valuations was assessed by comparing interim valuation reports to the final year-end reports for prior periods.
— Roll forward testing: Assessed the quantum of change in the valuation of investments between the early close date and the period end date to consider whether there was a material movement post the early close date that required adjustment.
Our results
— We found the resulting estimate of the valuation of hedge fund and illiquid credit assets to be acceptable (2016 result: acceptable).
2. Key audit matters: our assessment of risks of material misstatement (cont.)
120
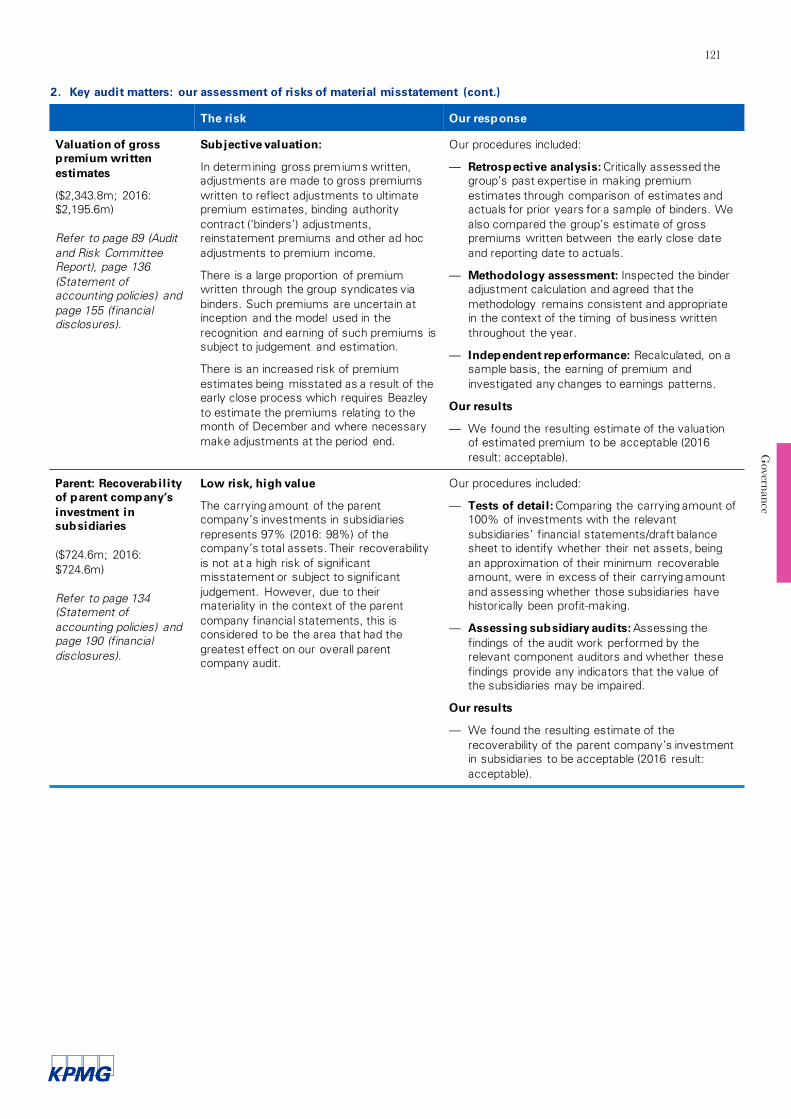
The risk Our response
Valuation of gross premium written estimates
($2,343.8m; 2016: $2,195.6m)
Refer to page 89 (Audit and Risk Committee Report), page 136 (Statement of accounting policies) and page 155 (financial disclosures).
Subjective valuation:
In determining gross premiums written, adjustments are made to gross premiums written to reflect adjustments to ultimate premium estimates, binding authority contract (‘binders’) adjustments, reinstatement premiums and other ad hoc adjustments to premium income.
There is a large proportion of premium written through the group syndicates via binders. Such premiums are uncertain at inception and the model used in the recognition and earning of such premiums is subject to judgement and estimation.
There is an increased risk of premium estimates being misstated as a result of the early close process which requires Beazley to estimate the premiums relating to the month of December and where necessary make adjustments at the period end.
Our procedures included:
— Retrospective analysis: Critically assessed the group’s past expertise in making premium estimates through comparison of estimates and actuals for prior years for a sample of binders. We also compared the group’s estimate of gross premiums written between the early close date and reporting date to actuals.
— Methodology assessment: Inspected the binder adjustment calculation and agreed that the methodology remains consistent and appropriate in the context of the timing of business written throughout the year.
— Independent reperformance: Recalculated, on a sample basis, the earning of premium and investigated any changes to earnings patterns.
Our results
— We found the resulting estimate of the valuation of estimated premium to be acceptable (2016 result: acceptable).
Parent: Recoverability of parent company’s investment in subsidiaries
($724.6m; 2016: $724.6m)
Refer to page 134 (Statement of accounting policies) and page 190 (financial disclosures).
Low risk, high value
The carrying amount of the parent company’s investments in subsidiaries represents 97% (2016: 98%) of the company’s total assets. Their recoverability is not at a high risk of significant misstatement or subject to significant judgement. However, due to their materiality in the context of the parent company financial statements, this is considered to be the area that had the greatest effect on our overall parent company audit.
Our procedures included:
— Tests of detail: Comparing the carrying amount of 100% of investments with the relevant subsidiaries’ financial statements/draft balance sheet to identify whether their net assets, being an approximation of their minimum recoverable amount, were in excess of their carrying amount and assessing whether those subsidiaries have historically been profit-making.
— Assessing subsidiary audits: Assessing the findings of the audit work performed by the relevant component auditors and whether these findings provide any indicators that the value of the subsidiaries may be impaired.
Our results
— We found the resulting estimate of the recoverability of the parent company’s investment in subsidiaries to be acceptable (2016 result: acceptable).
2. Key audit matters: our assessment of risks of material misstatement (cont.)
Governance
121

3. Our application of materiality and an overview of the scope of our audit
Materiality for the group financial statements as a whole was set at $20m (31 December 2016: $20m), determined with reference to a benchmark of group gross premiums written (of which it represents 1%; 31 December 2016: 1%). Gross premiums written was used as the benchmark as it is a more stable metric year on year than profit before tax. In addition, we applied materiality of $10m (31 December 2016: $10m) for UK balances other than insurance and reinsurance technical balances and investments, for which we believe misstatements of lesser amounts than materiality for the financial statements as a whole could be reasonably expected to influence the company’s members’ assessment of the financial performance of the group.
Materiality for the parent financial statements as a whole was set at $7m (31 December 2016: $7m), determined with reference to a benchmark of total assets (of which it represents 1%, 31 December 2016 1%). We have used total assets as the benchmark rather than profit before tax because the purpose of the entity is to act as the ultimate parent company of the group and hold investments in other group companies and not to generate profits.
We agreed to report to the Audit and Risk Committee any corrected or uncorrected identified misstatements exceeding $1m ($0.5m for non-technical) (31 December 2016: $1m ($0.5m for non-technical)) in addition to other audit misstatements below that threshold that we believe warranted reporting on qualitative grounds.
Of the group’s 33 (2016: 33) reporting components, we subjected 17 (2016: 18) to full scope audits for group purposes and 3 (2016: 3) to specified risk-focused audit procedures. These entities were not individually financially significant enough to require a full scopeaudit for group purposes, but did present specific individual risks that needed to be addressed.
The components within the scope of our work accounted for the percentages illustrated opposite. For the residual components, we performed analysis at an aggregated group level to re-examine our assessment that there were no significant risks of material misstatement within these.
The work on 3 of the 17 components (2016: 3 of the 18 components) was performed by component auditors and the rest, including the audit of the parent company, was performed by the group audit team. The group audit team instructed the component team as to the significant areas to be covered, including the relevant risks detailed above and the information to be reported back. The group audit team approved the component materialities, which ranged from $0.1m to $16m (31 December 2016: $0.1m to $18m), having regard to the mix of size and risk profile of the Group across the components. All other work, including the audit of the parent company, was performed by the group audit team.
.
$2 0mWhole financialstatements materiality(2016 : $20m)
$16mComponent materiality ($16 m)Range of materiality at 17 components ($0.1m-$16m) (2016 : $0.1m-$18m)
$1mMisstatements reported to the audit committee (2016 : $1m)
Gross written premiumGroup materiality
Gross written premium$2.3bn (2016: $2.1bn)
Group Materiality$20m (2016: $20m)
87
12
87
12
97
2
92
8
Group profit before tax
99%(2 016 99%)
100%(2 016 99%)
Group revenue
Group total assets Group total liabilities
89
8
89
8
97%(2 016 97%)
86
13
89
11
99%(2 016 99%)
Key: Full scope for group audit purposes 2017
Specified risk-focused audit procedures 2017
Full scope for group audit purposes 2016
Specified risk-focused audit procedures 2016
Residual components
In regards to the US component team (covering Beazley Holdings Inc., Beazley Services USA and Beazley Insurance Company Inc.) the interaction with the Group team included status update calls along with remote inspection of the component team’s audit files.
122

4. We have nothing to report on going concern
We are required to report to you if:
— we have anything material to add or draw attention to in relation to the directors’ statement in note 1 to the financial statements on the use of the going concern basis of accounting with no material uncertainties that may cast significant doubt over the Group and Company’s use of that basis for a period of at least twelve months from the date of approval of the financial statements; or
— the related statement under the Listing Rules set out on page 70 is materially inconsistent with our audit knowledge.
We have nothing to report in these respects.
5. We have nothing to report on the other information in the Annual Report
The directors are responsible for the other information presented in the Annual Report together with the financial statements. Our opinion on the financial statements does not cover the other information and, accordingly, we do not express an audit opinion or, except as explicitly stated below, any form of assurance conclusion thereon.
Our responsibility is to read the other information and, in doing so, consider whether, based on our financial statements audit work, the information therein is materially misstated or inconsistent with the financial statements or our audit knowledge. Based solely on that work we have not identified material misstatements in the other information.
Strategic report and directors’ report
Based solely on our work on the other information:
— we have not identified material misstatements in the strategic report and the directors’ report;
— in our opinion the information given in those reports for the financial year is consistent with the financial statements; and
— in our opinion those reports have been prepared in accordance with the Companies Act 2006.
Directors’ remuneration report
In our opinion the part of the Directors’ Remuneration Report to be audited has been properly prepared in accordance with the Companies Act 2006.
Disclosures of principal risks and longer-term viability
Based on the knowledge we acquired during our financial statements audit, we have nothing material to add or draw attention to in relation to:
— the directors’ confirmation within the viability statement on page 59 that they have carried out a robust assessment of the principal risks facing the Group, including those that would threaten its business model, future performance, solvency and liquidity;
— the key risks disclosures describing these risks and explaining how they are being managed and mitigated; and
— the directors’ explanation in the viability statement of how they have assessed the prospects of the Group, over what period they have done so and why they considered that period to be appropriate, and their statement as to whether they have a reasonable expectation that the Group will be able to continue in operation and meet its liabilities as they fall due over the period of their assessment, including any related disclosures drawing attention to any necessary qualifications or assumptions.
Under the Listing Rules we are required to review the viability statement. We have nothing to report in this respect.
Corporate governance disclosures
We are required to report to you if:
— we have identified material inconsistencies between the knowledge we acquired during our financial statements audit and the directors’ statement that they consider that the annual report and financial statements taken as a whole is fair, balanced and understandable and provides the information necessary for shareholders to assess the Group’s position and performance, business model and strategy; or
— the section of the annual report describing the work of the Audit Committee does not appropriately address matters communicated by us to the Audit Committee.
We are required to report to you if the Statement of corporate governance does not properly disclose a departure from the eleven provisions of the UK Corporate Governance Code specified by the Listing Rules for our review.
We have nothing to report in these respects.
Governance
123

6. We have nothing to report on the other matters on which we are required to report by exception
Under the Companies Act 2006, we are required to report to you if, in our opinion:
— adequate accounting records have not been kept by the parent Company, or returns adequate for our audit have not been received from branches not visited by us; or
— the parent Company financial statements and the part of the Directors’ Remuneration Report to be audited are not in agreement with the accounting records and returns; or
— certain disclosures of directors’ remuneration specified by law are not made; or
— we have not received all the information and explanations we require for our audit.
We have nothing to report in these respects.
7. Respective responsibilities
Directors’ responsibilities
As explained more fully in their statement set out on page 117, the directors are responsible for: the preparation of the financial statements including being satisfied that they give a true and fair view; such internal control as they determine is necessary to enable the preparation of financial statements that are free from material misstatement, whether due to fraud or error; assessing the Group and parent Company’s ability to continue as a going concern, disclosing, as applicable, matters related to going concern; and using the going concern basis of accounting unless they either intend to liquidate the Group or the parent Company or to cease operations, or have no realistic alternative but to do so.
Auditor’s responsibilities
Our objectives are to obtain reasonable assurance about whether the financial statements as a whole are free from material misstatement, whether due to fraud, other irregularities (see below), or error, and to issue our opinion in an auditor’s report. Reasonable assurance is a high level of assurance, but does not guarantee that an audit conducted in accordance with ISAs (UK) will always detect a material misstatement when it exists. Misstatements can arise from fraud, other irregularities or error and are considered material if, individually or in aggregate, they could reasonably be expected to influence the economic decisions of users taken on the basis of the financial statements. A fuller description of our responsibilities is provided on the FRC’s website at www.frc.org.uk/auditorsresponsibilities.
Irregularities – ability to detect
Our audit aimed to detect non-compliance with relevant laws and regulations (irregularities) that could have a material effect on the financial statements.
In planning and performing our audit, we considered the impact of laws and regulations in the specific areas of the UK listing rules, Companies Act and Prudential Regulatory Authority and Lloyd’s of London prudential regulation. We identified these areas through discussion with the directors and other management (as required by auditing standards), from our sector experience, and from inspection of the group’s regulatory and legal correspondence. In addition we had regard to laws and regulations in other areas including financial reporting, and company and taxation legislation.
We considered the extent of compliance with those laws and regulations that directly affect the financial statements, being the UK listing rules and the Companies Act, as part of our procedures on the related financial statement items. For the remaining laws and regulations, we made enquiries of directors and other management (as required by auditing standards), and inspected correspondence with regulatory authorities.
We communicated identified laws and regulations throughout our team and remained alert to any indications of non-compliance throughout the audit. This included communication from the group to component audit teams of relevant laws and regulations identified at group level, with a request to report on any indications of potential existence of irregularities in these areas, or other areas directly identified by the component team.
As with any audit, there remained a higher risk of non-detection of irregularities, as these may involve collusion, forgery, intentional omissions, misrepresentations, or the override of internal controls.
8. The purpose of our audit work and to whom we owe our responsibilities
This report is made solely to the Company’s members, as a body, in accordance with Chapter 3 of Part 16 of the Companies Act 2006. Our audit work has been undertaken so that we might state to the Company’s members those matters we are required to state to them in an auditor’s report and for no other purpose. To the fullest extent permitted by law, we do not accept or assume responsibility to anyone other than the Company and the Company’s members, as a body, for our audit work, for this report, or for the opinions we have formed.
Daniel Cazeaux (Senior Statutory Auditor) for and on behalf of KPMG LLP, Statutory Auditor Chartered Accountants 15 Canada SquareLondon, E14 5GL 7 February 2018
124

Financial statements
Financial statements
www.beazley.com Annual report 2017 Beazley 125
Financial statements
126 Consolidatedstatementofprofitorloss127 Statement of comprehensive income128 Statement of changes in equity130 Statementsoffinancialposition131 Statementsofcashflows132 Notestothefinancialstatements193 Glossary

www.beazley.com126 Beazley Annual report 2017
Consolidated statement of profit or lossfor the year ended 31 December 2017
Notes2017
$m2016
$m
Grosspremiumswritten 3 2,343.8 2,195.6Written premiums ceded to reinsurers (365.0) (341.6)Net premiums written 3 1,978.8 1,854.0
Change in gross provision for unearned premiums (118.4) (83.4)Reinsurer’s share of change in the provision for unearned premiums 9.0 (2.4)Change in net provision for unearned premiums (109.4) (85.8)
Net earned premiums 3 1,869.4 1,768.2
Net investment income 4 138.3 93.1Other income 5 35.5 32.7
173.8 125.8
Revenue 2,043.2 1,894.0
Insurance claims 1,388.0 1,027.3Insurance claims recoverable from reinsurers (312.3) (171.7)Net insurance claims 3 1,075.7 855.6
Expenses for the acquisition of insurance contracts 3 519.7 472.5Administrative expenses 3 254.7 247.8Foreign exchange loss 3 3.1 9.5Operating expenses 777.5 729.8
Expenses 3 1,853.2 1,585.4
Shareofprofit/(loss)inassociates 14 0.1 (0.2)
Results of operating activities 190.1 308.4
Finance costs 8 (22.1) (15.2)
Profit before income tax 168.0 293.2
Income tax expense 9 (38.0) (42.2)Profit for the year attributable to equity shareholders 130.0 251.0
Earnings per share (cents per share):Basic 10 25.0 48.6Diluted 10 24.4 47.3
Earnings per share (pence per share):Basic 10 19.5 35.5Diluted 10 19.0 34.5

Financial statements
www.beazley.com Annual report 2017 Beazley 127
Statement of comprehensive incomefor the year ended 31 December 2017
2017$m
2016$m
GroupProfit for the year attributable to equity shareholders 130.0 251.0Other comprehensive incomeItems that will never be reclassified to profit or loss:Loss on remeasurement of retirement benefit obligations (0.6) (6.1)
Items that may be reclassified subsequently to profit or loss:Foreign exchange translation differences 2.9 (10.1)Total other comprehensive income 2.3 (16.2)Total comprehensive income recognised 132.3 234.8
Statement of comprehensive incomefor the year ended 31 December 2017
2017$m
2016$m
CompanyProfit for the year attributable to equity shareholders 134.8 18.2
Total comprehensive income recognised 134.8 18.2

www.beazley.com128 Beazley Annual report 2017
Statement of changes in equityfor the year ended 31 December 2017
Notes
Sharecapital
$m
Merger reserve
$m
Foreigncurrency
translationreserve
$m
Otherreserves
$m
Retainedearnings
$mTotal
$m
GroupBalance at 1 January 2016 666.7 (628.5) (87.3) 6.7 1,483.8 1,441.4
Total comprehensive income recognised – – (10.1) – 244.9 234.8Dividends paid 11 – – – – (212.2) (212.2)Issue of shares 1 2.5 (2.3) – – – 0.2Capital reduction 2 (631.5) 630.8 0.7 – – –Equity settled share based payments 22 – – – 26.0 – 26.0Acquisitionofownsharesintrust 22 – – – (9.7) – (9.7)Tax on share option vestings 9 – – – – 2.1 2.1Transfer of shares to employees 22 – – – 0.4 0.7 1.1Balance at 31 December 2016 37.7 – (96.7) 23.4 1,519.3 1,483.7
Total comprehensive income recognised – – 2.9 – 129.4 132.3Dividends paid 11 – – – – (135.9) (135.9)Issue of shares 0.1 – – – – 0.1Equity settled share based payments 22 – – – 24.5 – 24.5Acquisitionofownsharesintrust 22 – – – (16.2) – (16.2)Tax on share option vestings 9 – – – 4.3 4.0 8.3Transfer of shares to employees 22 – – – (4.0) 6.1 2.1Balance at 31 December 2017 37.8 – (93.8) 32.0 1,522.9 1,498.9
1 Duringthefirsthalfof2016,1.9mnewordinaryshareswereissued,aswellas0.1mofpreferencesharespriortoaschemeofarrangement.Thepreferenceshareswereredeemedbythecompanyin2016.
2 Subsequenttoaschemeofarrangement,acapitalreductionwasexecutedinApril2016whichinvolvedareductioninthenominalvalueofthesharesinthenewparentfrom90pencepershareto5pencepershare.

Financial statements
www.beazley.com Annual report 2017 Beazley 129
Statement of changes in equity for the year ended 31 December 2017
Notes
Sharecapital
$m
Mergerreserve
$m
Foreigncurrency
translationreserve
$m
Otherreserves
$m
Retainedearnings
$mTotal
$m
CompanyBalance at 1 January 2016 – – – – – –
Total comprehensive income recognised – – – – 18.2 18.2Dividends paid 11 – – – – (23.9) (23.9)Issue of shares 1 669.2 55.4 – – – 724.6Capital reduction 2 (631.5) – 0.7 – 630.8 –Equity settled share based payments 22 – – – 22.5 – 22.5Acquisitionofownsharesintrust 22 – – – (4.6) – (4.6)Transfer of shares to employees 22 – – – 2.0 (1.8) 0.2Balance at 31 December 2016 37.7 55.4 0.7 19.9 623.3 737.0
Total comprehensive income recognised – – – – 134.8 134.8Dividends paid 11 – – – – (135.9) (135.9)Issue of shares 21 0.1 – – – – 0.1Equity settled share based payments 22 – – – 24.5 – 24.5Acquisitionofownsharesintrust 22 – – – (16.2) – (16.2)Transfer of shares to employees 22 – – – (4.0) 6.1 2.1Balance at 31 December 2017 37.8 55.4 0.7 24.2 628.3 746.4
1 On 13 April 2016, the company issued 523.3m ordinary shares at a nominal value of 90 pence per share.
2 Followingtheissuingoftheshares,acapitalreductionreducedthenominalvalueofthesharesfrom90pencepershareto5pencepershare.

www.beazley.com130 Beazley Annual report 2017
Statements of financial positionas at 31 December 2017
2017 2016
NotesGroup
$mCompany
$mGroup
$mCompany
$m
AssetsIntangible assets 12 133.5 – 96.6 –Plant and equipment 13 4.4 – 5.4 –Deferred tax asset 28 6.9 – 11.0 –Investment in subsidiaries 31 – 724.6 – 724.6Investment in associates 14 7.0 – 9.9 –Deferred acquisition costs 15 281.4 – 242.8 –Reinsurance assets 19, 24 1,231.1 – 1,082.1 –Financial assets at fair value 16, 17 4,449.6 – 4,195.4 –Insurance receivables 18 918.0 – 794.7 –Other receivables 68.6 21.0 46.4 13.0Current income tax asset 17.7 0.5 17.0 –Cash and cash equivalents 20 440.5 0.7 507.2 –Total assets 7,558.7 746.8 7,008.5 737.6
EquityShare capital 21 37.8 37.8 37.7 37.7Merger reserve – 55.4 – 55.4Foreign currency translation reserve (93.8) 0.7 (96.7) 0.7Other reserves 22 32.0 24.2 23.4 19.9Retained earnings 1,522.9 628.3 1,519.3 623.3Total equity 1,498.9 746.4 1,483.7 737.0 LiabilitiesInsurance liabilities 24 5,167.8 – 4,657.7 –Financial liabilities 16, 17, 25 367.3 – 363.8 –Retirement benefit liability 27 2.3 – 6.2 –Deferred tax liability 28 9.9 – 12.8 –Other payables 26 512.5 0.4 484.3 0.6Total liabilities 6,059.8 0.4 5,524.8 0.6Total equity and liabilities 7,558.7 746.8 7,008.5 737.6
The financial statements were approved by the board of directors on 7 February 2018 and were signed on its behalf by:
D HoltChairman
M L BrideFinance director
7 February 2018
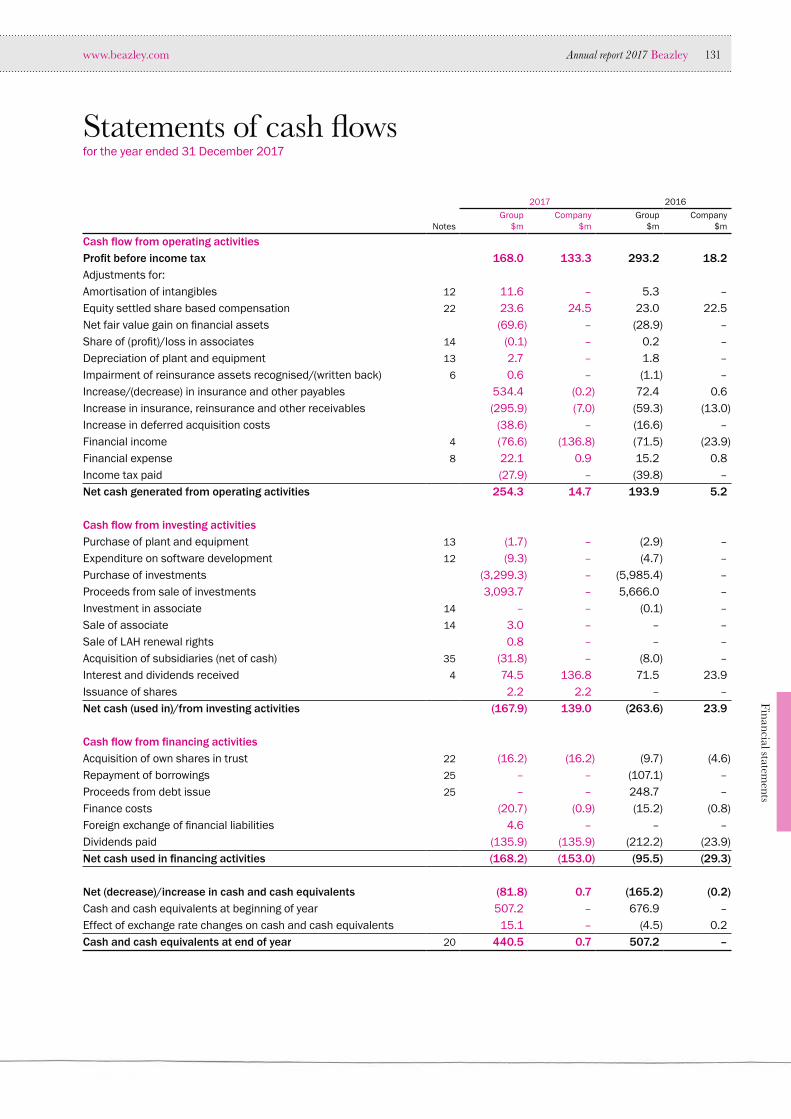
Financial statements
www.beazley.com Annual report 2017 Beazley 131
Statements of cash flowsfor the year ended 31 December 2017
2017 2016
NotesGroup
$mCompany
$mGroup
$mCompany
$m
Cash flow from operating activitiesProfit before income tax 168.0 133.3 293.2 18.2Adjustmentsfor:Amortisation of intangibles 12 11.6 – 5.3 –Equity settled share based compensation 22 23.6 24.5 23.0 22.5Netfairvaluegainonfinancialassets (69.6) – (28.9) –Shareof(profit)/lossinassociates 14 (0.1) – 0.2 –Depreciation of plant and equipment 13 2.7 – 1.8 –Impairmentofreinsuranceassetsrecognised/(writtenback) 6 0.6 – (1.1) –Increase/(decrease)ininsuranceandotherpayables 534.4 (0.2) 72.4 0.6Increase in insurance, reinsurance and other receivables (295.9) (7.0) (59.3) (13.0)Increase in deferred acquisition costs (38.6) – (16.6) –Financial income 4 (76.6) (136.8) (71.5) (23.9)Financial expense 8 22.1 0.9 15.2 0.8Income tax paid (27.9) – (39.8) –Net cash generated from operating activities 254.3 14.7 193.9 5.2
Cash flow from investing activitiesPurchase of plant and equipment 13 (1.7) – (2.9) –Expenditureonsoftwaredevelopment 12 (9.3) – (4.7) –Purchase of investments (3,299.3) – (5,985.4) –Proceeds from sale of investments 3,093.7 – 5,666.0 –Investment in associate 14 – – (0.1) –Sale of associate 14 3.0 – – –SaleofLAHrenewalrights 0.8 – – –Acquisition of subsidiaries (net of cash) 35 (31.8) – (8.0) –Interest and dividends received 4 74.5 136.8 71.5 23.9Issuance of shares 2.2 2.2 – –Net cash (used in)/from investing activities (167.9) 139.0 (263.6) 23.9
Cash flow from financing activitiesAcquisitionofownsharesintrust 22 (16.2) (16.2) (9.7) (4.6)Repaymentofborrowings 25 – – (107.1) –Proceeds from debt issue 25 – – 248.7 –Finance costs (20.7) (0.9) (15.2) (0.8)Foreignexchangeoffinancialliabilities 4.6 – – –Dividends paid (135.9) (135.9) (212.2) (23.9)Net cash used in financing activities (168.2) (153.0) (95.5) (29.3)
Net (decrease)/increase in cash and cash equivalents (81.8) 0.7 (165.2) (0.2)Cash and cash equivalents at beginning of year 507.2 – 676.9 –Effect of exchange rate changes on cash and cash equivalents 15.1 – (4.5) 0.2Cash and cash equivalents at end of year 20 440.5 0.7 507.2 –
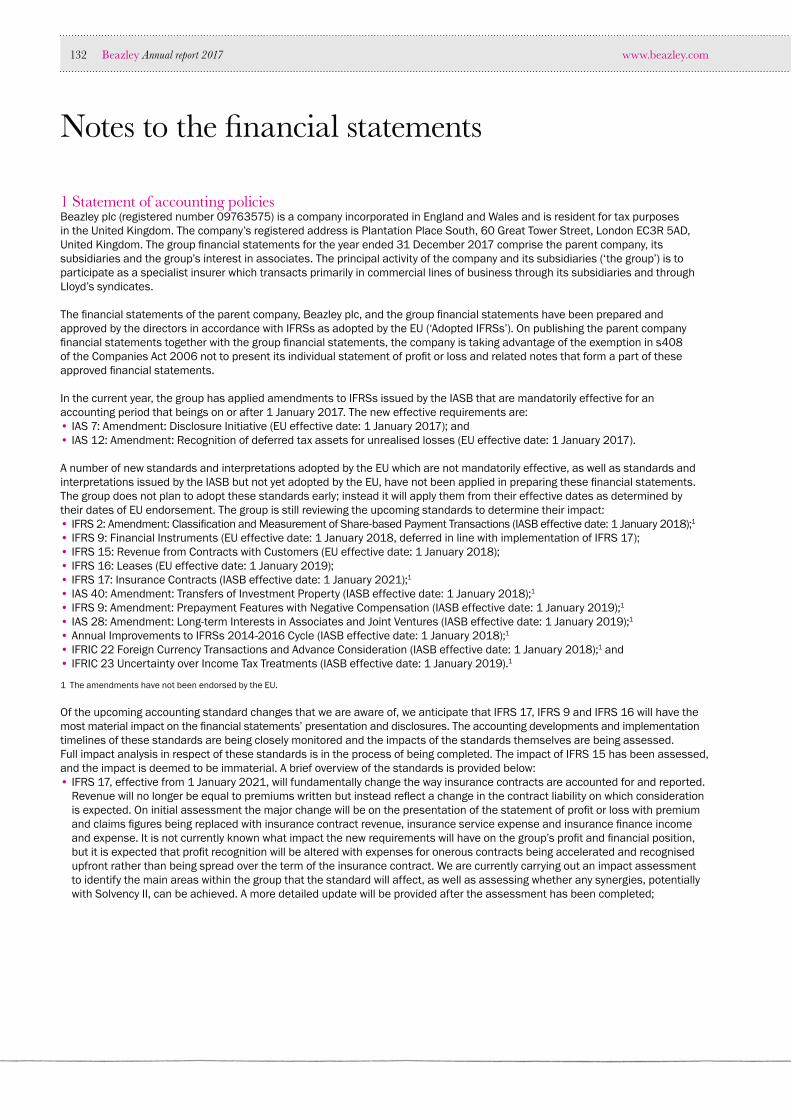
www.beazley.com132 Beazley Annual report 2017
Notes to the financial statements
1 Statement of accounting policiesBeazley plc (registered number 09763575) is a company incorporated in England and Wales and is resident for tax purposes in the United Kingdom. The company’s registered address is Plantation Place South, 60 Great Tower Street, London EC3R 5AD, United Kingdom. The group financial statements for the year ended 31 December 2017 comprise the parent company, its subsidiaries and the group’s interest in associates. The principal activity of the company and its subsidiaries (‘the group’) is to participate as a specialist insurer which transacts primarily in commercial lines of business through its subsidiaries and through Lloyd’s syndicates.
The financial statements of the parent company, Beazley plc, and the group financial statements have been prepared and approved by the directors in accordance with IFRSs as adopted by the EU (‘Adopted IFRSs’). On publishing the parent company financial statements together with the group financial statements, the company is taking advantage of the exemption in s408 of the Companies Act 2006 not to present its individual statement of profit or loss and related notes that form a part of these approved financial statements.
In the current year, the group has applied amendments to IFRSs issued by the IASB that are mandatorily effective for an accounting period that beings on or after 1 January 2017. The new effective requirements are:• IAS 7: Amendment: Disclosure Initiative (EU effective date: 1 January 2017); and• IAS 12: Amendment: Recognition of deferred tax assets for unrealised losses (EU effective date: 1 January 2017).
A number of new standards and interpretations adopted by the EU which are not mandatorily effective, as well as standards and interpretations issued by the IASB but not yet adopted by the EU, have not been applied in preparing these financial statements. The group does not plan to adopt these standards early; instead it will apply them from their effective dates as determined by their dates of EU endorsement. The group is still reviewing the upcoming standards to determine their impact:• IFRS 2: Amendment: Classification and Measurement of Share-based Payment Transactions (IASB effective date: 1 January 2018);1• IFRS 9: Financial Instruments (EU effective date: 1 January 2018, deferred in line with implementation of IFRS 17);• IFRS 15: Revenue from Contracts with Customers (EU effective date: 1 January 2018);• IFRS 16: Leases (EU effective date: 1 January 2019);• IFRS 17: Insurance Contracts (IASB effective date: 1 January 2021);1 • IAS 40: Amendment: Transfers of Investment Property (IASB effective date: 1 January 2018);1• IFRS 9: Amendment: Prepayment Features with Negative Compensation (IASB effective date: 1 January 2019);1• IAS 28: Amendment: Long-term Interests in Associates and Joint Ventures (IASB effective date: 1 January 2019);1• Annual Improvements to IFRSs 2014-2016 Cycle (IASB effective date: 1 January 2018);1• IFRIC 22 Foreign Currency Transactions and Advance Consideration (IASB effective date: 1 January 2018);1 and• IFRIC 23 Uncertainty over Income Tax Treatments (IASB effective date: 1 January 2019).1
1 The amendments have not been endorsed by the EU.
Of the upcoming accounting standard changes that we are aware of, we anticipate that IFRS 17, IFRS 9 and IFRS 16 will have the most material impact on the financial statements’ presentation and disclosures. The accounting developments and implementation timelines of these standards are being closely monitored and the impacts of the standards themselves are being assessed. Full impact analysis in respect of these standards is in the process of being completed. The impact of IFRS 15 has been assessed, and the impact is deemed to be immaterial. A brief overview of the standards is provided below:• IFRS 17, effective from 1 January 2021, will fundamentally change the way insurance contracts are accounted for and reported.
Revenue will no longer be equal to premiums written but instead reflect a change in the contract liability on which consideration is expected. On initial assessment the major change will be on the presentation of the statement of profit or loss with premium and claims figures being replaced with insurance contract revenue, insurance service expense and insurance finance income and expense. It is not currently known what impact the new requirements will have on the group’s profit and financial position, but it is expected that profit recognition will be altered with expenses for onerous contracts being accelerated and recognised upfront rather than being spread over the term of the insurance contract. We are currently carrying out an impact assessment to identify the main areas within the group that the standard will affect, as well as assessing whether any synergies, potentially with Solvency II, can be achieved. A more detailed update will be provided after the assessment has been completed;
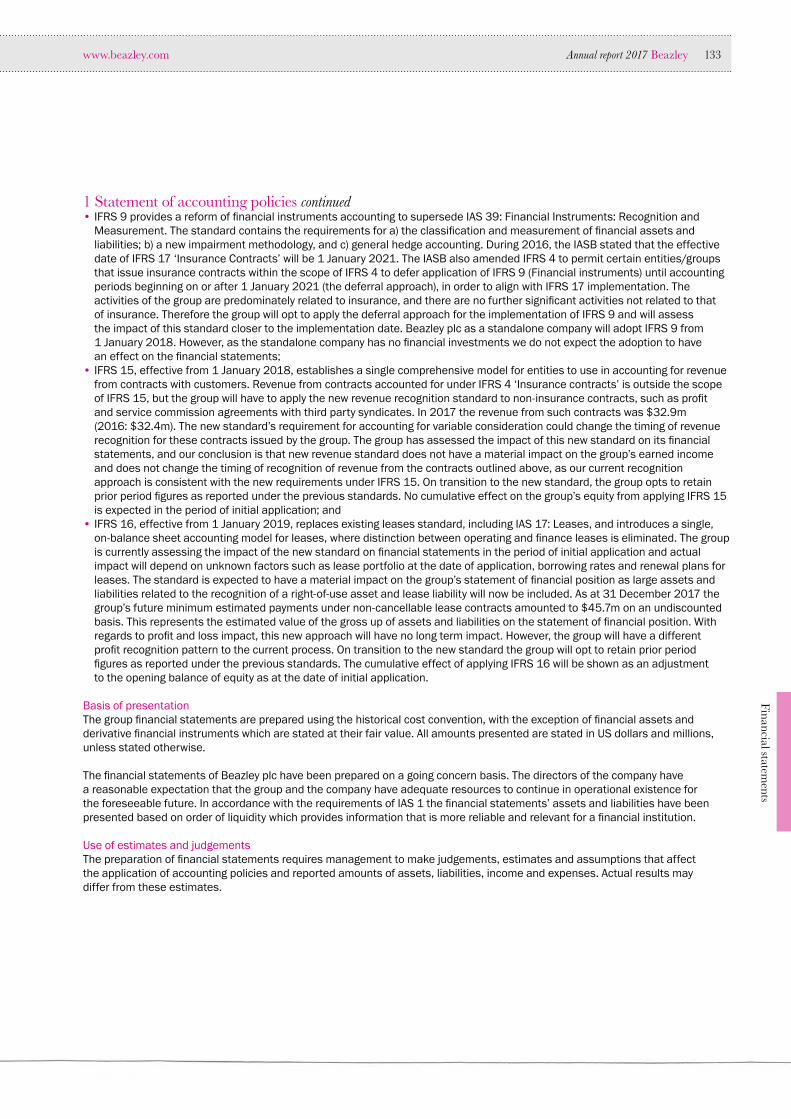
Financial statements
www.beazley.com Annual report 2017 Beazley 133
1 Statement of accounting policies continued• IFRS 9 provides a reform of financial instruments accounting to supersede IAS 39: Financial Instruments: Recognition and
Measurement. The standard contains the requirements for a) the classification and measurement of financial assets and liabilities; b) a new impairment methodology, and c) general hedge accounting. During 2016, the IASB stated that the effective date of IFRS 17 ‘Insurance Contracts’ will be 1 January 2021. The IASB also amended IFRS 4 to permit certain entities/groups that issue insurance contracts within the scope of IFRS 4 to defer application of IFRS 9 (Financial instruments) until accounting periods beginning on or after 1 January 2021 (the deferral approach), in order to align with IFRS 17 implementation. The activities of the group are predominately related to insurance, and there are no further significant activities not related to that of insurance. Therefore the group will opt to apply the deferral approach for the implementation of IFRS 9 and will assess the impact of this standard closer to the implementation date. Beazley plc as a standalone company will adopt IFRS 9 from 1 January 2018. However, as the standalone company has no financial investments we do not expect the adoption to have an effect on the financial statements;
• IFRS 15, effective from 1 January 2018, establishes a single comprehensive model for entities to use in accounting for revenue from contracts with customers. Revenue from contracts accounted for under IFRS 4 ‘Insurance contracts’ is outside the scope of IFRS 15, but the group will have to apply the new revenue recognition standard to non-insurance contracts, such as profit and service commission agreements with third party syndicates. In 2017 the revenue from such contracts was $32.9m (2016: $32.4m). The new standard’s requirement for accounting for variable consideration could change the timing of revenue recognition for these contracts issued by the group. The group has assessed the impact of this new standard on its financial statements, and our conclusion is that new revenue standard does not have a material impact on the group’s earned income and does not change the timing of recognition of revenue from the contracts outlined above, as our current recognition approach is consistent with the new requirements under IFRS 15. On transition to the new standard, the group opts to retain prior period figures as reported under the previous standards. No cumulative effect on the group’s equity from applying IFRS 15 is expected in the period of initial application; and
• IFRS 16, effective from 1 January 2019, replaces existing leases standard, including IAS 17: Leases, and introduces a single, on-balance sheet accounting model for leases, where distinction between operating and finance leases is eliminated. The group is currently assessing the impact of the new standard on financial statements in the period of initial application and actual impact will depend on unknown factors such as lease portfolio at the date of application, borrowing rates and renewal plans for leases. The standard is expected to have a material impact on the group’s statement of financial position as large assets and liabilities related to the recognition of a right-of-use asset and lease liability will now be included. As at 31 December 2017 the group’s future minimum estimated payments under non-cancellable lease contracts amounted to $45.7m on an undiscounted basis. This represents the estimated value of the gross up of assets and liabilities on the statement of financial position. With regards to profit and loss impact, this new approach will have no long term impact. However, the group will have a different profit recognition pattern to the current process. On transition to the new standard the group will opt to retain prior period figures as reported under the previous standards. The cumulative effect of applying IFRS 16 will be shown as an adjustment to the opening balance of equity as at the date of initial application.
Basis of presentationThe group financial statements are prepared using the historical cost convention, with the exception of financial assets and derivative financial instruments which are stated at their fair value. All amounts presented are stated in US dollars and millions, unless stated otherwise.
The financial statements of Beazley plc have been prepared on a going concern basis. The directors of the company have a reasonable expectation that the group and the company have adequate resources to continue in operational existence for the foreseeable future. In accordance with the requirements of IAS 1 the financial statements’ assets and liabilities have been presented based on order of liquidity which provides information that is more reliable and relevant for a financial institution.
Use of estimates and judgementsThe preparation of financial statements requires management to make judgements, estimates and assumptions that affect the application of accounting policies and reported amounts of assets, liabilities, income and expenses. Actual results may differ from these estimates.

www.beazley.com134 Beazley Annual report 2017
Notes to the financial statements continued
1 Statement of accounting policies continueda) EstimatesEstimates are reviewed on an ongoing basis. Revisions to accounting estimates are recognised in the period in which the estimate is revised and in any future periods affected.
The most critical estimate included within the group’s financial position is the estimate for insurance losses incurred but not reported, which is included within total insurance liabilities and reinsurance assets in the statement of financial position and note 24. This estimate is critical as it outlines the current liability for future expenses expected to be incurred in relation to claims. If this estimation was to prove inadequate then an exposure would arise in future years where a liability has not been provided for. The total estimate for insurance losses incurred but not reported gross of reinsurers’ share as at 31 December 2017 is $2,852.3m (2016: $2,567.4m). The total estimate for insurance losses incurred but not reported net of reinsurers’ share as at 31 December 2017 is $2,078.5m (2016: $1,915.3m) and is included within total insurance liabilities and reinsurance assets in the statement of financial position and note 24.
Another significant area of estimation is the group’s financial assets and liabilities. Information about estimation uncertainty related to the group’s financial assets and liabilities is described in this statement of accounting policies and note 16: financial assets and liabilities (valuations based on models and unobservable inputs).
Another key estimate contained within our close process is premium estimates.
b) JudgementsInformation about significant areas of critical judgements in applying accounting policies that have the most significant effect on the amounts recognised in the financial statements are described in this statement of accounting policies and specifically in the following notes:• note 1a: accounting treatment for the group’s interest in managed syndicates; and• note 12: intangible assets including goodwill (assumptions underlying recoverable amounts).
Consolidationa) Subsidiary undertakingsSubsidiary undertakings are entities controlled by the group. The group controls an entity when it is exposed to, or has rights to, variable returns from its involvement with the entity and has the ability to affect those returns through its power over the entity. In assessing control, the group takes into consideration potential voting rights that are currently exercisable. The acquisition date is the date on which control is transferred to the acquirer. The financial statements of subsidiaries are included in the consolidated financial statements from the date that control commences until the date that control ceases. Losses applicable to the non-controlling interests in a subsidiary are allocated to the non-controlling interests even if doing so causes the non-controlling interests to have a deficit balance.
The group has used the acquisition method of accounting for business combinations arising on the purchase of subsidiaries. Under this method, the cost of acquisition is measured as the fair value of assets given, shares issued or liabilities undertaken at the date of acquisition directly attributable to the acquisition. The excess of the cost of an acquisition over the net fair value of the identifiable assets, liabilities and contingent liabilities of the subsidiary acquired is recorded as goodwill. The accounting treatment of acquisition expenses per IFRS 3 (2008) has changed; however, as the group applied the revised standard prospectively to all business combinations from 1 January 2010 there is no impact on accounting for the acquisition of subsidiaries made in previous periods.
For all business combinations from 1 January 2010:(i) Transaction costs, other than those associated with the issue of debt or equity securities, that the group incurs in connection
with a business combination, are expensed as incurred;(ii) In addition, any consideration transferred does not include amounts related to the settlement of pre-existing relationships.
Such amounts are recognised in profit or loss; and(iii) Any contingent consideration is measured at fair value at the acquisition date.
Equity financial investments made by the parent company in subsidiary undertakings and associates are stated at cost in its separate financial statements and are reviewed for impairment when events or changes in circumstances indicate the carrying value may be impaired.

Financial statements
www.beazley.com Annual report 2017 Beazley 135
1 Statement of accounting policies continuedCertain group subsidiaries underwrite as corporate members of Lloyd’s on syndicates managed by Beazley Furlonge Limited. In view of the several and direct liability of underwriting members at Lloyd’s for the transactions of syndicates in which they participate, only attributable shares of transactions, assets and liabilities of those syndicates are included in the group financial statements. The group continues to conclude that it remains appropriate to consolidate its share of the result of these syndicates and accordingly, as the group is the sole provider of capacity on syndicates 2623, 3622 and 3623, these financial statements include 100% of the economic interest in these syndicates. For the other syndicates to which Beazley is appointed managing agent, being syndicates 623, 6107, and 6050, for which the capacity is provided entirely by third parties to the group, these financial statements reflect Beazley’s economic interest in the form of agency fees and profit commission to which they are entitled. Syndicate 5623 commenced underwriting on 1 January 2018 and therefore has no balances consolidated in these financial statements.
b) AssociatesAssociates are those entities over which the group has power to exert significant influence but which it does not control. Significant influence is generally presumed if the group has between 20% and 50% of voting rights.
Investments in associates are accounted for using the equity method of accounting. Under this method the investments are initially measured at cost and the group’s share of post-acquisition profits or losses is recognised in the statement of profit or loss. Therefore the cumulative post-acquisition movements in the associates’ net assets are adjusted against the cost of the investment.
When the group’s share of losses equals or exceeds the carrying amount of the associate, the carrying amount is reduced to nil and recognition for the losses is discontinued except to the extent that the group has incurred obligations in respect of the associate. Equity accounting is discontinued when the group no longer has significant influence over the investment.
c) Intercompany balances and transactionsAll intercompany transactions, balances and unrealised gains or losses on transactions between group companies are eliminated in the group financial statements. Transactions and balances between the group and associates are not eliminated.
Foreign currency translationa) Functional and presentational currencyItems included in the financial statements of the parent and the subsidiaries are measured using the currency of the primary economic environment in which the relevant entity operates (the ‘functional currency’). The group financial statements are presented in US dollars, being the functional and presentational currency of the parent and its main trading subsidiaries, as the majority of trading assets and insurance premiums are denominated in US dollars.
b) Transactions and balances Foreign currency transactions are translated into the functional currency using average exchange rates applicable to the period in which the transactions take place and where the group considers these to be a reasonable approximation of the transaction rate. Foreign exchange gains and losses resulting from the settlement of such transactions and from translation at the period end of monetary assets and liabilities denominated in foreign currencies are recognised in the statement of profit or loss. Non-monetary items recorded at historical cost in foreign currencies are translated using the exchange rate on the date of the initial transaction.
c) Foreign operationsThe results and financial position of the group companies that have a functional currency different from the group presentational currency are translated into the presentational currency as follows:• assets and liabilities are translated at the closing rate ruling at the statement of financial position date;• income and expenses for each statement of profit or loss are translated at average exchange rates for the reporting period
where this is determined to be a reasonable approximation of the actual transaction rates; and• all resulting exchange differences are recognised in other comprehensive income and as a separate component of equity.
On disposal of foreign operations, cumulative exchange differences previously recognised in other comprehensive income are recognised in the statement of profit or loss as part of the gain or loss on disposal.
Insurance contractsInsurance contracts (including inwards reinsurance contracts) are defined as those containing significant insurance risk. Insurance risk is considered significant if, and only if, an insured event could cause Beazley to pay significant additional benefits in any scenario, excluding scenarios that lack commercial substance. Such contracts remain insurance contracts until all rights and obligations are extinguished or expire.
www.beazley.com136 Beazley Annual report 2017
Notes to the financial statements continued
1 Statement of accounting policies continuedNet earned premiumsa) PremiumsGross premiums written represent premiums on business commencing in the financial year together with adjustments to premiums written in previous accounting periods and estimates for premiums from contracts entered into during the course of the year. Gross premiums written are stated before deduction of brokerage, taxes, duties levied on premiums and other deductions.
b) Unearned premiumsA provision for unearned premiums (gross of reinsurance) represents that part of the gross premiums written that it is estimated will be earned in the following financial periods. It is calculated using the daily pro-rata method, under which the premium is apportioned over the period of risk.
Deferred acquisition costs (DAC)Acquisition costs comprise brokerage, premium levy and staff-related costs (excluding performance related pay) of the underwriters acquiring new business and renewing existing contracts. The proportion of acquisition costs in respect of unearned premiums is deferred at the reporting date and recognised in later periods when the related premiums are earned.
ClaimsThese include the cost of claims and claims handling expenses paid during the period, together with the movements in provisions for outstanding claims, claims incurred but not reported (IBNR) and claims handling provisions. The provision for claims comprises amounts set aside for claims advised and IBNR, including claims handling expenses.
The IBNR amount is based on estimates calculated using widely accepted actuarial techniques which are reviewed quarterly by the group actuary and annually by Beazley’s independent syndicate reporting actuary. The techniques generally use projections, based on past experience of the development of claims over time, to form a view on the likely ultimate claims to be experienced.
For more recent underwriting years, regard is given to the variations in the business portfolio accepted and the underlying terms and conditions. Thus, the critical assumptions used when estimating provisions are that past experience is a reasonable predictor of likely future claims development and that the rating and business portfolio assumptions are a fair reflection of the likely level of ultimate claims to be incurred for the more recent years.
Liability adequacy testingAt each reporting date, liability adequacy tests are performed by segment to ensure the adequacy of the claims liabilities net of DAC and unearned premium reserves. In performing these tests, current best estimates of future contractual cash flows, claims handling and administration expenses, and investment income from the assets backing such liabilities are used. Any deficiency is immediately charged to the statement of profit or loss, initially by writing off DAC and subsequently by establishing a provision for losses arising from liability adequacy tests (‘unexpired risk provision’).
Ceded reinsurance These are contracts entered into by the group with reinsurers under which the group is compensated for losses on contracts issued by the group that meet the definition of an insurance contract. Insurance contracts entered into by the group under which the contract holder is another insurer (inwards reinsurance) are included within insurance contracts.
Any benefits to which the group is entitled under its reinsurance contracts held are recognised as reinsurance assets. These assets consist of balances due from reinsurers and include reinsurers’ share of provisions for claims. These balances are based on calculated amounts of outstanding claims and projections for IBNR, net of estimated irrecoverable amounts, having regard to the reinsurance programme in place for the class of business, the claims experience for the period and the current security rating of the reinsurer involved. Reinsurance liabilities are primarily premiums payable for reinsurance contracts and are recognised as an expense when due.
The group assesses its reinsurance assets for impairment. If there is objective evidence of impairment, then the carrying amount is reduced to its recoverable amount and the impairment loss is recognised in the statement of profit or loss.
RevenueRevenue consists of net earned premiums, net investment income and other income (made up of commissions received from Beazley service companies, profit commissions, managing agent’s fees and service fees). Profit commissions are recognised as profit is earned. Managing agent’s fees are recognised as the services are provided.
Dividends paidDividend distributions to the shareholders of the group are recognised in the period in which the dividends are paid, as a first interim dividend, second interim dividend or special dividend. The second and special dividends are approved by the group’s shareholders at the group’s annual general meeting.

Financial statements
www.beazley.com Annual report 2017 Beazley 137
1 Statement of accounting policies continuedPlant and equipmentAll plant and equipment is recorded at cost less accumulated depreciation and any impairment losses. Depreciation is calculated using the straight-line method to allocate the cost of the assets to their residual values over their estimated useful lives as follows:
Fixtures and fittings Three to ten yearsComputer equipment Three years
These assets’ residual values and useful lives are reviewed at each reporting date and adjusted if appropriate.
The carrying values of plant and equipment are reviewed for impairment when events or changes in circumstances indicate that the carrying value may be impaired. If any such condition exists, the recoverable amount of the asset is estimated in order to determine the extent of impairment and the difference is charged to the statement of profit or loss.
Intangible assetsa) GoodwillGoodwill represents the excess of the cost of an acquisition over the fair value of the group’s share of the fair value of the identifiable assets, liabilities and contingent liabilities of the acquired subsidiary at the date of acquisition. Goodwill is carried at cost less accumulated impairment losses.
Goodwill has an indefinite life and is annually tested for impairment. Goodwill is allocated to each cash-generating unit (being the group’s operating segments) for the purpose of impairment testing. Goodwill is impaired when the net carrying amount of the relevant cash-generating unit (CGU) exceeds its recoverable amount, being the higher of its value in use or fair value less costs to sell. Value in use is defined as the present value of the future cash flows expected to be derived from the CGU. On transition to IFRS at 1 January 2004, any goodwill previously amortised or written off was not reinstated.
In respect of equity accounted associates, the carrying amount of any goodwill is included in the carrying amount of the associate, and any impairment is allocated to the carrying amount of the associate as a whole.
b) Syndicate capacityThe syndicate capacity represents the cost of purchasing the group’s participation in the combined syndicates. The capacity is capitalised at cost in the statement of financial position. It has an indefinite useful life and is carried at cost less accumulated impairment. It is annually tested for impairment by reference to the expected future profit streams to be earned by those syndicates in which the group participates, namely 2623, 3622 and 3623, and provision is made for any impairment.
c) LicencesLicences have an indefinite useful life and are initially recorded at fair value. Licences are annually tested for impairment and provision is made for any impairment when the recoverable amount, being the higher of its value in use and fair value, is less than the carrying value.
d) IT development costsCosts that are directly associated with the development of identifiable and unique software products and that are anticipated to generate economic benefits exceeding costs beyond one year, are recognised as intangible assets. Costs include external consultants’ fees, certain qualifying internal staff costs and other costs incurred to develop software programs. These costs are amortised over their estimated useful life (three years) on a straight-line basis and subject to impairment testing annually. Other non-qualifying costs are expensed as incurred.
e) Renewal rightsRenewal rights comprise future profits relating to insurance contracts acquired and the expected renewal of those contracts. The costs directly attributable to acquire the renewal rights are recognised as intangible assets where they can be measured reliably and it is probable that they will be recovered by directly related future profits. These costs are subject to impairment testing annually and are amortised on a straight-line basis, based on the estimated useful life of the assets, which is estimated to be between five and ten years.
Financial instrumentsFinancial instruments are recognised in the statement of financial position at such time as the group becomes a party to the contractual provisions of the financial instrument. Purchases and sales of financial assets are recognised on the trade date, which is the date the group commits to purchase or sell the asset. A financial asset is derecognised when the contractual rights to receive cash flows from the financial assets expire, or where the financial assets have been transferred, together with substantially all the risks and rewards of ownership. Financial liabilities are derecognised if the group’s obligations specified in the contract expire, are discharged or are cancelled.
www.beazley.com138 Beazley Annual report 2017
Notes to the financial statements continued
1 Statement of accounting policies continueda) Financial assetsOn acquisition of a financial asset, the group is required to classify the asset into one of the following categories: financial assets at fair value through the statement of profit or loss, loans and receivables, assets held to maturity and assets available for sale. The group does not make use of the held to maturity and available for sale categories.
b) Financial assets at fair value through profit or lossExcept for derivative financial instruments and other financial assets listed in policies (f) and (g) below, all financial assets are designated as fair value through the statement of profit or loss upon initial recognition because they are managed and their performance is evaluated on a fair value basis. Information about these financial assets is provided internally on a fair value basis to the group’s key management. The group’s investment strategy is to invest and evaluate their performance with reference to their fair values.
c) Loans and receivablesLoans and receivables are non-derivative financial assets with fixed or determinable payments that are not quoted in an active market. Loans and receivables are carried at amortised cost less any impairment losses.
d) Fair value measurementFair value is the price at which an orderly transaction to sell an asset or to transfer a liability would take place between market participants at the measurement date.
When available, the group measures the fair value of an instrument using quoted prices in an active market for that instrument. A market is regarded as active if quoted prices are readily and regularly available as well as representing actual and regularly occurring market transactions on an arm’s length basis.
If a market for a financial instrument is not active, the group establishes fair value using a valuation technique. Valuation techniques include using recent orderly transactions between market participants (if available), reference to the current fair value of other instruments that are substantially the same, discounted cash flow analyses and option pricing models. The chosen valuation technique makes maximum use of market inputs, relies as little as possible on estimates specific to the group, incorporates all factors that market participants would consider in setting a price, and is consistent with accepted economic methodologies for pricing financial instruments. Inputs to valuation techniques reasonably represent market expectations and measures of the risk-return factors inherent in the financial instrument. The group calibrates valuation techniques and tests them for validity using prices from observable current market transactions in the same instrument or based on other available observable market data.
The best evidence of the fair value of a financial instrument at initial recognition is the transaction price, i.e. the fair value of the consideration given or received, unless the fair value of that instrument is evidenced by comparison with other observable current market transactions in the same instrument (i.e. without modification or repackaging) or based on a valuation technique whose variables include only data from observable markets. When the transaction price provides the best evidence of fair value at initial recognition, the financial instrument is initially measured at the transaction price and any difference between this price and the value initially obtained from a valuation model is subsequently recognised in profit or loss depending on the individual facts and circumstances of the transaction but before the valuation is supported wholly by observable market data or the transaction is closed out.
Assets and long positions are measured at a bid price; liabilities and short positions are measured at an asking price. These prices are monitored and deemed to approximate exit price. Where the group has positions with offsetting risks, mid-market prices are used to measure the offsetting risk positions and a bid or asking price adjustment is applied only to the net open position as appropriate. Fair values reflect the credit risk of the instrument and include adjustments to take account of the credit risk of the group entity and counterparty where appropriate. Fair value estimates obtained from models are adjusted for any other factors, such as liquidity risk or model uncertainties, to the extent that the group believes a third-party market participant would take them into account in pricing a transaction.
Upon initial recognition, attributable transaction costs relating to financial instruments at fair value through profit or loss are recognised in the statement of profit or loss when incurred. Financial assets at fair value through profit or loss are continually measured at fair value, and changes therein are recognised in the statement of profit or loss. Net changes in the fair value of financial assets at fair value through profit or loss exclude interest and dividend income, as these items are accounted for separately as set out on the next page.

Financial statements
www.beazley.com Annual report 2017 Beazley 139
1 Statement of accounting policies continuede) Hedge funds, equity funds and illiquid credit assetsThe group invests in a number of hedge funds, equity funds and illiquid credit assets for which there are no available quoted market prices. The valuation of these assets is based on fair value techniques (as described above). The fair value of our hedge fund portfolio is calculated by reference to the underlying net asset values (NAVs) of each of the individual funds. Consideration is also given to adjusting such NAV valuations for any restriction applied to distributions, the existence of side pocket provisions and the timing of the latest available valuations. At certain times, we will have uncalled unfunded commitments in relation to our illiquid credit assets. These uncalled unfunded commitments are actively monitored by the group and are disclosed in the notes to the financial statements. The additional investment into our illiquid credit asset portfolio is recognised on the date that this funding is provided by the group.
f) Insurance receivables and payables Insurance receivables and payables are recognised when due. These include amounts due to and from agents, brokers and insurance contract holders. Insurance receivables are classified as ‘loans and receivables’ as they are non-derivative financial assets with fixed or determinable payments that are not quoted on an active market. Insurance receivables are measured at amortised cost less any impairment losses. Insurance payables are stated at amortised cost.
g) Other receivablesOther receivables categorised as loans and receivables are carried at amortised cost less any impairment losses.
h) Investment incomeInvestment income consists of dividends, interest, realised and unrealised gains and losses and foreign exchange gains and losses on financial assets at fair value through the statement of profit or loss. Dividends on equity securities are recorded as revenue on the ex-dividend date. Interest is recognised on an effective rate basis for financial assets at fair value through the statement of profit or loss. The realised gains or losses on disposal of an investment are the difference between the proceeds and the original cost of the investment. Unrealised investment gains and losses represent the difference between the carrying value at the reporting date, and the carrying value at the previous period end or purchase value during the period.
i) BorrowingsBorrowings are initially recorded at fair value less transaction costs incurred. Subsequently borrowings are stated at amortised cost and interest is recognised in the statement of profit or loss over the period of the borrowings using the effective interest method.
Finance costs comprise interest, fees paid for the arrangement of debt and letter of credit facilities, and commissions charged for the utilisation of letters of credit. These costs are recognised in the statement of profit or loss using the effective interest method.
In addition, finance costs include gains on the early redemption of the group’s borrowings. These gains are recognised in the statement of profit or loss, being the difference between proceeds paid plus related costs and the carrying value of the borrowings redeemed.
j) Other payablesOther payables are stated at amortised cost determined according to the effective interest rate method.
k) Hedge accounting and derivative financial instrumentsDerivatives are initially recognised at fair value on the date on which a derivative contract is entered into and are subsequently remeasured at their fair value. The best evidence of fair value of a derivative at initial recognition is the transaction price. The method of recognising the resulting fair value gains or losses depends on whether the derivative is designated as a hedging instrument and, if so, the nature of the item being hedged. Fair values are obtained from quoted market prices in active markets, recent market transactions, and valuation techniques which include discounted cash flow models. All derivatives are carried as assets when fair value is positive and as liabilities when fair value is negative.
Derivative assets and liabilities are offset and the net amount reported in the statement of financial position when there is a legally enforceable right to set off the recognised amounts and the parties intend to settle on a net basis, or realise the assets and settle the liability simultaneously.
The group has not designated any derivatives as fair value hedges, cash flow hedges or net investment hedges and therefore all fair value movements are recorded through profit or loss.

www.beazley.com140 Beazley Annual report 2017
Notes to the financial statements continued
1 Statement of accounting policies continuedl) Impairment of financial assetsThe group considers evidence of impairment for financial assets measured at amortised cost at both a specific asset and a collective level. The group assesses at each reporting date whether there is objective evidence that a specific financial asset measured at amortised cost is impaired. A financial asset is impaired and impairment losses are incurred only if there is objective evidence of impairment as a result of one or more events that have occurred after the initial recognition of the assets and that event has an impact on the estimated cash flows of the financial asset that can be reliably estimated. Assets that are not individually significant are collectively assessed for impairment by grouping together assets with similar risk characteristics.
If there is objective evidence that impairment exists, the amount of the loss is measured as the difference between the asset’s carrying amount and the value of the estimated future cash flows discounted at the financial asset’s original effective interest rate. The amount of the loss is recognised in the statement of profit or loss.
In assessing collective impairment, the group uses historical trends of the probability of default, the timing of recoveries and the amount of loss incurred, adjusted for management’s judgement as to whether current economic and credit conditions are such that the actual losses are likely to be greater or lesser than those suggested by historical trends.
m) Cash and cash equivalentsCash and cash equivalents consist of cash held at bank, cash in hand, deposits held at call with banks, cash held in Lloyd’s trust accounts and other short term highly liquid investments that are readily convertible to known amounts of cash and which are subject to an insignificant risk of changes in value. These investments have less than three months maturity from the date of acquisition. Cash and cash equivalents are measured at fair value through the profit and loss account.
n) Unfunded commitment capitalUnfunded committed capital arising in relation to certain financial asset investments is not shown on the statement of financial position as unfunded committed capital represents a loan commitment that is scoped out of IAS 39.
LeasesLeases where a significant portion of the risks and rewards of ownership are retained by the lessor are classified as operating leases. Payments made by the group for operating leases are charged to the statement of profit or loss on a straight-line basis over the period of the lease.
Employee benefitsa) Pension obligationsThe group operates a defined benefit pension plan that is now closed to future service accruals. The scheme is generally funded by payments from the group, taking account of the recommendations of an independent qualified actuary. All employees now participate in defined contribution pension arrangements, to which the group contributes.
A defined benefit plan is a pension plan that defines an amount of pension benefit that an employee will receive on retirement, usually dependent on one or more factors like age, years of service and compensation. The pension costs are assessed using the projected unit credit method. Under this method the costs of providing pensions are charged to the statement of profit or loss so as to spread the regular costs over the service lives of employees in accordance with the advice of the qualified actuary, who values the plans annually. The net pension obligation is measured at the present value of the estimated future net cash flows and is stated net of plan assets.
Remeasurements of the net defined benefit liability, which comprise actuarial gains and losses, the return on plan assets (excluding interest) and the effect of the asset ceiling (if any, excluding interest), are recognised immediately in other comprehensive income.
The group also determines the net interest expense/(income) for the period on the net defined benefit liability/(asset) by applying the discount rate used to measure the defined benefit obligation at the beginning of the annual period to the net defined benefit liability/(asset) at the beginning of the annual period, taking into account any changes in the net defined benefit liability/(asset) during the period as a result of contributions and benefit payments. Consequently, the net interest on the defined benefit liability/(asset) comprises:• interest cost on the defined benefit obligation;• interest income on plan assets; and• interest on the effect of the asset ceiling.

Financial statements
www.beazley.com Annual report 2017 Beazley 141
1 Statement of accounting policies continuedNet interest expense/(income) is recognised in the statement of profit or loss.
Past service costs are recognised as an expense at the earlier of the date when a plan amendment or curtailment occurs and the date when an entity recognises any termination benefits.
For the defined contribution plan, the group pays contributions to a privately administered pension plan. Once the contributions have been paid, the group has no further obligations. The group’s contributions are charged to the statement of profit or loss in the period to which they relate.
b) Share based compensationThe group offers option plans over Beazley plc’s ordinary shares to certain employees, including the SAYE scheme.
The grant date fair value of share based payment awards granted to employees is recognised as an employee expense, with a corresponding increase in equity, over the period that the employees become unconditionally entitled to the awards. The amount recognised as an expense is adjusted to reflect the number of awards for which the related service and non-market performance conditions are expected to be met, such that the amount ultimately recognised as an expense is based on the number of awards that meet the related service and non-market performance conditions at the vesting date. For share based payment awards with non-vesting conditions, the grant date fair value of the share based payment is measured to reflect such conditions and there is no true-up for differences between expected and actual outcomes.
When the options are exercised and new shares are issued, the proceeds received, net of any transaction costs, are credited to share capital (nominal value) and retained earnings. When the options are exercised and the shares are granted from the employee share trust, the proceeds received, net of any transaction costs, are credited to retained earnings.
Income taxesIncome tax on the profit or loss for the period comprises current and deferred tax. Income tax is recognised in the statement of profit or loss except to the extent that it relates to items recognised in other comprehensive income or directly in equity, in which case it is recognised respectively in other comprehensive income or directly in equity.
Current tax is the expected tax payable on the taxable income for the year using tax rates enacted or substantively enacted at the year end reporting date and any adjustments to tax payable in respect of prior periods.
Deferred tax is provided, using the liability method, on temporary differences arising between the tax bases of assets and liabilities and their carrying amounts in the financial statements. The amount of deferred tax provided is based on the expected manner of realisation or settlement of the carrying amount of the assets and liabilities, using tax rates enacted or substantively enacted at the reporting date.
Deferred tax assets are recognised in the statement of financial position to the extent that it is probable that future taxable profit will be available against which the temporary differences can be utilised.
Earnings per shareBasic earnings per share are calculated by dividing profit after tax available to shareholders by the weighted average number of ordinary shares in issue during the period.
For diluted earnings per share, the weighted average number of ordinary shares in issue is adjusted to assume conversion of all dilutive potential ordinary shares such as share options granted to employees. Share options with performance conditions attaching to them have been excluded from the weighted average number of shares to the extent that these conditions have not been met at the reporting date.
The shares held in the employee share options plan (ESOP) and treasury shares are excluded from both the calculations, until such time as they vest unconditionally with the employees.
Provisions and contingenciesProvisions are recognised when the group has a present legal or constructive obligation as a result of a past event, it is probable that an outflow of resources or economic benefits will be required to settle the obligation, and a reliable estimate of the obligation can be made. Where the group expects a provision to be reimbursed, the reimbursement is recognised as a separate asset but only when the reimbursement is virtually certain.
Contingent liabilities are present obligations that are not recognised because it is not probable that an outflow of resources will be required to meet the liabilities or because the amount of the obligation cannot be measured with sufficient reliability.

www.beazley.com142 Beazley Annual report 2017
Notes to the financial statements continued
2 Risk managementThe group has identified the risks arising from its activities and has established policies and procedures to manage these items in accordance with its risk appetite. The group categorises its risks into eight areas: insurance, strategic, market, operational, credit, regulatory and legal, liquidity and group risk. The sections below outline the group’s risk appetite and explain how it defines and manages each category of risk.
The eight categories of risk have been considered in context of the company (Beazley plc). The following areas are applicable to the company: market, operational, regulatory and legal, and liquidity. The following disclosures cover the company to the extent that these areas are applicable.
The symbol † by a heading indicates that the information in that section has not been audited. 2.1 Insurance risk The group’s insurance business assumes the risk of loss from persons or organisations that are directly exposed to an underlying loss. Insurance risk arises from this risk transfer due to inherent uncertainties about the occurrence, amount and timing of insurance liabilities. The four key components of insurance risk are underwriting, reinsurance, claims management and reserving. Each element is considered below.
a) Underwriting riskUnderwriting risk comprises four elements that apply to all insurance products offered by the group:• cycle risk – the risk that business is written without full knowledge as to the (in)adequacy of rates, terms and conditions; • event risk – the risk that individual risk losses or catastrophes lead to claims that are higher than anticipated in plans and pricing;• pricing risk – the risk that the level of expected loss is understated in the pricing process; and• expense risk – the risk that the allowance for expenses and inflation in pricing is inadequate.
We manage and model these four elements in the following three categories: attritional claims, large claims and catastrophe events.
The group’s underwriting strategy is to seek a diverse and balanced portfolio of risks in order to limit the variability of outcomes. This is achieved by accepting a spread of business over time, segmented between different products, geographies and sizes.
The annual business plans for each underwriting team reflect the group’s underwriting strategy, and set out the classes of business, the territories and the industry sectors in which business is to be written. These plans are approved by the board and monitored by the underwriting committee.
Our underwriters calculate premiums for risks written based on a range of criteria tailored specifically to each individual risk. These factors include but are not limited to the financial exposure, loss history, risk characteristics, limits, deductibles, terms and conditions and acquisition expenses.
The group also recognises that insurance events are, by their nature, random, and the actual number and size of events during any one year may vary from those estimated using established statistical techniques.
To address this, the group sets out the exposure that it is prepared to accept in certain territories to a range of events such as natural catastrophes and specific scenarios which may result in large industry losses. This is monitored through regular calculation of realistic disaster scenarios (RDS). The aggregate position is monitored at the time of underwriting a risk, and reports are regularly produced to highlight the key aggregations to which the group is exposed.
The group uses a number of modelling tools to monitor its exposures against the agreed risk appetite set and to simulate catastrophe losses in order to measure the effectiveness of its reinsurance programmes. Stress and scenario tests are also run using these models. The range of scenarios considered includes natural catastrophe, cyber, marine, liability, political, terrorism and war events.
One of the largest types of event exposure relates to natural catastrophe events such as windstorm or earthquake. Where possible the group measures geographic accumulations and uses its knowledge of the business, historical loss behaviour and commercial catastrophe modelling software to assess the expected range of losses at different return periods. Upon application of the reinsurance coverage purchased, the key gross and net exposures are calculated on the basis of extreme events at a range of return periods.
The group’s high level catastrophe risk appetite is set by the board and the business plans of each team are determined within these parameters. The board may adjust these limits over time as conditions change. In 2017 the group operated to a catastrophe risk appetite for a probabilistic 1-in-250 years US event of $370.0m (2016: $412.0m) net of reinsurance. This represented a reduction in our catastrophe risk appetite of 10% compared to 2016.

Financial statements
www.beazley.com Annual report 2017 Beazley 143
2 Risk management continuedLloyd’s has also defined its own specific set of RDS events for which all syndicates with relevant exposures must report. Of these the three largest, net of reinsurance, events which could have impacted Beazley in 2016 and 2017 are:
Unaudited 2017
Lloyd’s prescribed natural catastrophe event (total incurred losses)
Modelled PML1 (before
reinsurance)$m
Modelled PML1 (afterreinsurance)
$m
San Francisco quake (2017: $78.0bn) 676.9 228.2Gulf of Mexico windstorm (2017: $112.0bn) 609.0 163.3Los Angeles quake (2017: $78.0bn) 637.3 218.5
Unaudited 2016
Lloyd’s prescribed natural catastrophe event (total incurred losses)
Modelled PML1 (before)
reinsurance)$m
Modelled PML1 (after)reinsurance)
$m
San Francisco quake (2016: $78.0bn) 647.1 219.0Gulf of Mexico windstorm (2016: $112.0bn) 622.8 215.3Los Angeles quake (2016: $78.0bn) 674.6 213.9
1 Probable market loss.
The net of reinsurance exposures for the San Francisco and Los Angeles quake scenarios have increased less than 5% during 2017. The Gulf of Mexico windstorm scenario net of reinsurance exposure has reduced by 24% due to less business being written in the Gulf of Mexico off-shore energy portfolio and additional reinsurance being purchased in the reinsurance division.
The net exposure of the group to each of these modelled events at a given point in time is a function of assumptions made about how and where the event occurs, its magnitude, the amount of business written that is exposed to each event and the reinsurance arrangements in place.
The group also has exposure to man-made claim aggregations, such as those arising from terrorism and data breach events. Beazley chooses to underwrite data breach insurance within the specialty lines division using our team of specialist underwriters, claims managers and data breach services managers. Other than for data breach, Beazley’s preference is to exclude cyber exposure where possible.
To manage the potential exposure, the board has established a risk budget for the aggregation of data breach related claims which is monitored by reference to the largest of nine realistic disaster scenarios that have been developed internally. These scenarios have been peer reviewed by an external technical expert and include the failure of a data aggregator, the failure of a shared hardware or software platform and the failure of a cloud provider. Whilst it is not possible to be precise, as there is sparse data on actual aggregated events, these severe scenarios are expected to be very infrequent. The largest realistic disaster scenario is currently lower than the exposure to the Lloyd’s prescribed natural catastrophe events listed above for the group as at 31 December 2017. However, the cost of these scenarios will increase as Beazley continues to grow its data breach product. The clash reinsurance programme that protects the specialty lines account would partially mitigate the cost of most, but not all, data breach catastrophes.
Beazley also reports on cyber exposure to Lloyd’s using the three largest internal realistic disaster scenarios and seven prescribed scenarios which include both data breach and property damage related cyber exposure. Given Beazley's risk profile, the quantum from the internal data breach scenarios is larger than any of the cyber property damage related scenarios.
To manage underwriting exposures, the group has developed limits of authority and business plans which are binding upon all staff authorised to underwrite and are specific to underwriters, classes of business and industry. In 2017, the maximum line that any one underwriter could commit the managed syndicates to was $100m. In most cases, maximum lines for classes of business were much lower than this.
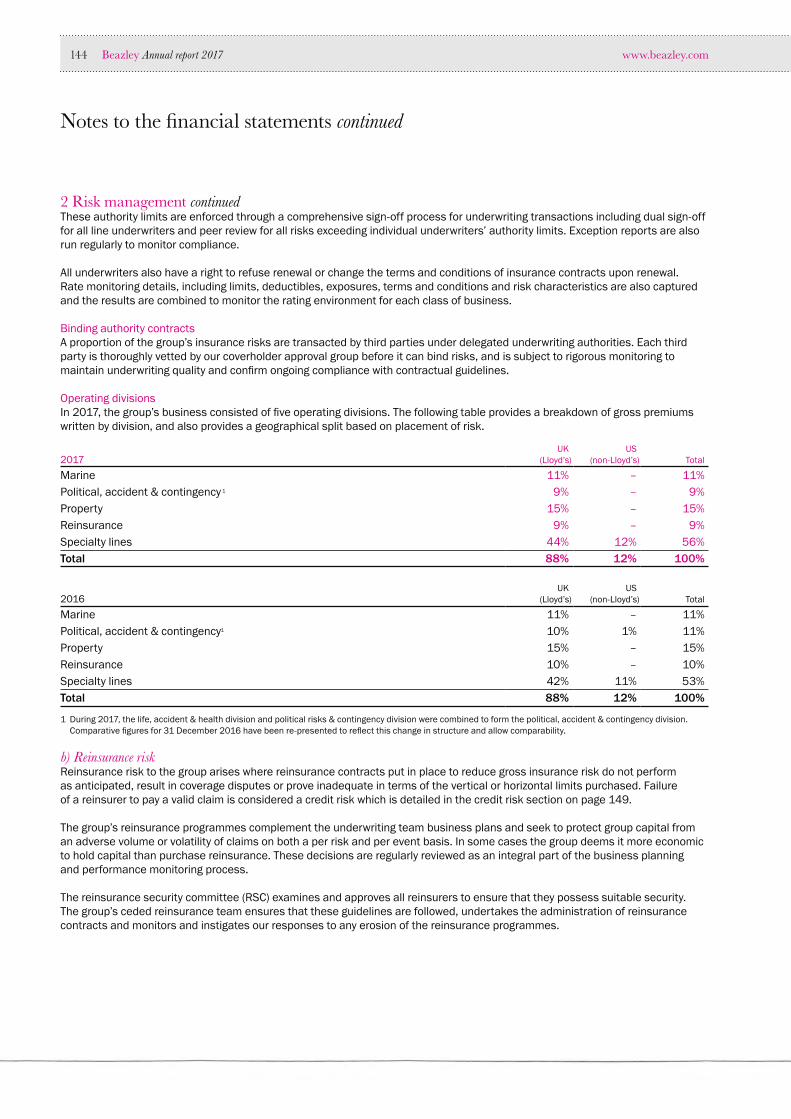
www.beazley.com144 Beazley Annual report 2017
Notes to the financial statements continued
2 Risk management continuedThese authority limits are enforced through a comprehensive sign-off process for underwriting transactions including dual sign-off for all line underwriters and peer review for all risks exceeding individual underwriters’ authority limits. Exception reports are also run regularly to monitor compliance.
All underwriters also have a right to refuse renewal or change the terms and conditions of insurance contracts upon renewal. Rate monitoring details, including limits, deductibles, exposures, terms and conditions and risk characteristics are also captured and the results are combined to monitor the rating environment for each class of business.
Binding authority contractsA proportion of the group’s insurance risks are transacted by third parties under delegated underwriting authorities. Each third party is thoroughly vetted by our coverholder approval group before it can bind risks, and is subject to rigorous monitoring to maintain underwriting quality and confirm ongoing compliance with contractual guidelines.
Operating divisionsIn 2017, the group’s business consisted of five operating divisions. The following table provides a breakdown of gross premiums written by division, and also provides a geographical split based on placement of risk.
2017UK
(Lloyd’s)US
(non-Lloyd’s) Total
Marine 11% – 11%Political, accident & contingency 1 9% – 9%Property 15% – 15%Reinsurance 9% – 9%Specialty lines 44% 12% 56%Total 88% 12% 100%
2016UK
(Lloyd’s)US
(non-Lloyd’s) Total
Marine 11% – 11%Political, accident & contingency1 10% 1% 11%Property 15% – 15%Reinsurance 10% – 10%Specialty lines 42% 11% 53%Total 88% 12% 100%
1 During 2017, the life, accident & health division and political risks & contingency division were combined to form the political, accident & contingency division. Comparative figures for 31 December 2016 have been re-presented to reflect this change in structure and allow comparability.
b) Reinsurance risk Reinsurance risk to the group arises where reinsurance contracts put in place to reduce gross insurance risk do not perform as anticipated, result in coverage disputes or prove inadequate in terms of the vertical or horizontal limits purchased. Failure of a reinsurer to pay a valid claim is considered a credit risk which is detailed in the credit risk section on page 149.
The group’s reinsurance programmes complement the underwriting team business plans and seek to protect group capital from an adverse volume or volatility of claims on both a per risk and per event basis. In some cases the group deems it more economic to hold capital than purchase reinsurance. These decisions are regularly reviewed as an integral part of the business planning and performance monitoring process.
The reinsurance security committee (RSC) examines and approves all reinsurers to ensure that they possess suitable security. The group’s ceded reinsurance team ensures that these guidelines are followed, undertakes the administration of reinsurance contracts and monitors and instigates our responses to any erosion of the reinsurance programmes.

Financial statements
www.beazley.com Annual report 2017 Beazley 145
2 Risk management continuedc) Claims management risk Claims management risk may arise within the group in the event of inaccurate or incomplete case reserves and claims settlements, poor service quality or excessive claims handling costs. These risks may damage the group brand and undermine its ability to win and retain business, or incur punitive damages. These risks can occur at any stage of the claims life cycle. The group’s claims teams are focused on delivering quality, reliability and speed of service to both internal and external clients. Their aim is to adjust and process claims in a fair, efficient and timely manner, in accordance with the policy’s terms and conditions, the regulatory environment, and the business’s broader interests. Case reserves are set for all known claims liabilities, including provisions for expenses, as soon as a reliable estimate can be made of the claims liability.
d) Reserving and ultimate reserves riskReserving and ultimate reserves risk occurs within the group where established insurance liabilities are insufficient through inaccurate forecasting, or where there is inadequate allowance for expenses and reinsurance bad debts in provisions.
To manage reserving and ultimate reserves risk, our actuarial team uses a range of recognised techniques to project gross premiums written, monitor claims development patterns and stress-test ultimate insurance liability balances. An external independent actuary also performs an annual review to produce a statement of actuarial opinion for reporting entities within the group.
The objective of the group’s reserving policy is to produce accurate and reliable estimates that are consistent over time and across classes of business. The estimates of gross premiums written and claims prepared by the actuarial department are used through a formal quarterly peer review process to independently test the integrity of the estimates produced by the underwriting teams for each class of business. These meetings are attended by senior management, senior underwriters, and actuarial, claims, and finance representatives.
2.2 Strategic risk †This is the risk that the group’s strategy is inappropriate or that the group is unable to implement its strategy. Where events supersede the group’s strategic plan this is escalated at the earliest opportunity through the group’s monitoring tools and governance structure.
Senior management performanceManagement stretch is the risk that business growth might result in an insufficient or overly complicated management team structure, thereby undermining accountability and control within the group. As the group expands its worldwide business in the UK, North America, Europe, South America and Asia, management stretch may make the identification, analysis and control of group risks more complex.
On a day-to-day basis, the group’s management structure encourages organisational flexibility and adaptability, while ensuring that activities are appropriately coordinated and controlled. By focusing on the needs of their customers and demonstrating both progressive and responsive abilities, staff, management and outsourced service providers are expected to excel in service and quality. Individuals and teams are also expected to transact their activities in an open and transparent way. These behavioural expectations reaffirm low group risk tolerance by aligning interests to ensure that routine activities, projects and other initiatives are implemented to benefit and protect resources of both local business segments and the group as a whole.
2.3 Market risk Market risk arises where the value of assets and liabilities or future cash flows changes as a result of movements in foreign exchange rates, interest rates and market prices. Efficient management of market risk is key to the investment of group assets. Appropriate levels of investment risk are determined by limiting the proportion of forecast group earnings which could be at risk from lower than expected investment returns, using a 1 in 10 confidence level as a practical measure of such risk. In 2017, this permitted variance from the forecast investment return was set at $126.0m (unaudited). For 2018, the permitted variance is likely to be moderately higher following the adoption of a new economic scenario generator (ESG) that currently callibrates the risk of any given portfolio at a higher level than the previous ESG primarily because it uses longer periods of historic data. Investment strategy is developed to be consistent with this limit and investment risk is monitored on an ongoing basis, using outputs from our internal model.
Changes in interest rates also impact the present values of estimated group liabilities, which are used for solvency and capital calculations. Our investment strategy reflects the nature of our liabilities, and the combined market risk of investment assets and estimated liabilities is monitored and managed within specified limits.

www.beazley.com146 Beazley Annual report 2017
Notes to the financial statements continued
2 Risk management continueda) Foreign exchange riskThe functional currency of Beazley plc and its main trading entities is US dollars and the presentational currency in which the group reports its consolidated results is US dollars. The effect of this on foreign exchange risk is that the group is mainly exposed to fluctuations in exchange rates for non-dollar denominated transactions and to net asset translation risk on non-dollar functional currency entities.
The group operates in four main currencies: US dollars, sterling, Canadian dollars and euros. Transactions in all currencies are converted to US dollars on initial recognition with any resulting monetary items being translated to the US dollar spot rate at the reporting date. If any foreign exchange risk arises it is actively managed as described below.
In 2017, the group managed its foreign exchange risk by periodically assessing its non-dollar exposures and hedging these to a tolerable level while targeting to have net assets that are predominantly denominated in US dollar. As part of this hedging strategy, exchange rate derivatives were used to rebalance currency exposure across the group. Details of foreign currency derivative contracts entered into with external parties are disclosed in note 17. On a forward looking basis an assessment is made of expected future exposure development and appropriate currency trades put in place to reduce risk.
The group’s underwriting capital is matched by currency to the principal underlying currencies of its written premiums. This helps to mitigate the risk that the group’s capital required to underwrite business is materially affected by any future movements in exchange rates.
The group also has foreign operations with functional currencies that are different from the group’s presentational currency. The effect of this on foreign exchange risk is that the group is exposed to fluctuations in exchange rates for US dollar denominated transactions and net assets arising in those foreign currency operations. It also gives rise to a currency translation exposure for the group to sterling, euro, Norwegian krone, Canadian dollars, Singapore dollars and Australian dollars on translation to the group’s presentational currency. These exposures are minimal and are not hedged.
The following table summarises the carrying value of total assets and total liabilities categorised by the group’s main currencies:
31 December 2017UK £
$mCAD $
$mEUR €
$mSubtotal
$mUS $
$mTotal
$m
Total assets 549.0 130.8 333.6 1,013.4 6,545.3 7,558.7Total liabilities (514.4) (110.0) (304.6) (929.0) (5,130.8) (6,059.8)Net assets 34.6 20.8 29.0 84.4 1,414.5 1,498.9
31 December 2016UK £
$mCAD $
$mEUR €
$mSubtotal
$mUS $
$mTotal
$m
Total assets 539.2 156.2 283.2 978.6 6,029.9 7,008.5Total liabilities (512.7) (166.2) (304.4) (983.3) (4,541.5) (5,524.8)Net assets 26.5 (10.0) (21.2) (4.7) 1,488.4 1,483.7
Sensitivity analysisFluctuations in the group’s trading currencies against the US dollar would result in a change to profit after tax and net asset value. The table below gives an indication of the impact on profit after tax and net assets of a percentage change in the relative strength of the US dollar against the value of sterling, the Canadian dollar and the euro, simultaneously. The analysis is based on information on net asset positions as at the balance sheet date.
Impact on profit after tax for the year ended Impact on net assets
Change in exchange rate of sterling, Canadian dollar and euro relative to US dollar2017
$m2016
$m2017
$m2016
$m
Dollar weakens 30% against other currencies 19.6 (1.2) 11.8 (9.5)Dollar weakens 20% against other currencies 13.0 (0.8) 7.9 (6.3)Dollar weakens 10% against other currencies 6.5 (0.4) 3.9 (3.2)Dollar strengthens 10% against other currencies (6.5) 0.4 (3.9) 3.2Dollar strengthens 20% against other currencies (13.0) 0.8 (7.9) 6.3Dollar strengthens 30% against other currencies (19.6) 1.2 (11.8) 9.5

Financial statements
www.beazley.com Annual report 2017 Beazley 147
2 Risk management continuedb) Interest rate riskSome of the group’s financial instruments, including cash and cash equivalents, certain financial assets at fair value and borrowings, are exposed to movements in market interest rates.
The group manages interest rate risk by primarily investing in short duration financial assets along with cash and cash equivalents. The investment committee monitors the duration of these assets on a regular basis.
The group also entered into bond futures contracts to manage the interest rate risk on bond portfolios.
The following table shows the modified duration at the reporting date of the financial instruments that are exposed to movements in market interest rates. Duration is a commonly used measure of volatility and we believe gives a better indication than maturity of the likely sensitivity of our portfolio to changes in interest rates.
Duration31 December 2017
<1 yr$m
1-2 yrs$m
2-3 yrs$m
3-4 yrs$m
4-5 yrs$m
5-10 yrs$m
>10 yrs$m
Total$m
Fixed and floating rate debt securities 1,447.4 851.7 571.1 366.3 382.0 96.2 – 3,714.7Cash and cash equivalents 440.5 – – – – – – 440.5Derivative financial instruments 8.8 – – – – – – 8.8Borrowings – (99.5) – – – (248.5) (18.0) (366.0)Total 1,896.7 752.2 571.1 366.3 382.0 (152.3) (18.0) 3,798.0
31 December 2016<1 yr
$m1-2 yrs
$m2-3 yrs
$m3-4 yrs
$m4-5 yrs
$m 5-10 yrs
$m>10 yrs
$mTotal
$m
Fixed and floating rate debt securities 1,505.2 562.5 688.0 467.5 286.2 108.0 – 3,617.4Cash and cash equivalents 507.2 – – – – – – 507.2Derivative financial instruments 12.2 – – – – – – 12.2Borrowings – – (94.7) – – (248.3) (18.0) (361.0)Total 2,024.6 562.5 593.3 467.5 286.2 (140.3) (18.0) 3,775.8
Borrowings consist of three items as at 31 December 2017. The first is $18.0m of a subordinated debt facility raised in 2004 which is unsecured. The subordinated notes are due in 2034 and have been callable at the group’s option since 2009. The second is $250.0m of subordinated tier 2 debt raised in November 2016. This debt is due in 2026 and has annual interest of 5.875% payable in May and November of each year. The third is a £75m sterling denominated 5.375% notes due in 2019 with interest payable in March and September each year.
Sensitivity analysisChanges in yields, with all other variables constant, would result in changes in the capital value of debt securities as well as subsequent interest receipts and payments. This would affect reported profits and net assets as indicated in the table below:
Impact on profit after income tax for the year Impact on net assets
2017$m
2016$m
2017$m
2016$m
Shift in yield (basis points)150 basis point increase (50.9) (56.0) (50.9) (56.0)100 basis point increase (33.9) (37.3) (33.9) (37.3)50 basis point increase (17.0) (18.7) (17.0) (18.7)50 basis point decrease 17.0 18.7 17.0 18.7100 basis point decrease 33.9 37.3 33.9 37.3

www.beazley.com148 Beazley Annual report 2017
Notes to the financial statements continued
2 Risk management continuedc) Price riskFinancial assets and derivatives that are recognised in the statement of financial position at their fair value are susceptible to losses due to adverse changes in prices. This is referred to as price risk.
Financial assets include fixed and floating rate debt securities, hedge funds, illiquid credit assets, equity investments and derivative financial assets. The price of debt securities is affected by interest rate risk, as described above, and also by issuer's credit risk. The sensitivity to price risk that relates to the group’s hedge fund, illiquid credit and equity investments is presented below.
Listed investments that are quoted in an active market are recognised in the statement of financial position at quoted bid price, which is deemed to be approximate exit price. If the market for the investment is not considered to be active, then the group establishes fair value using valuation techniques (refer to note 16). This includes comparison of orderly transactions between market participants, reference to current fair value of other investments that are substantially the same, discounted cash flow models and other valuation techniques that are commonly used by market participants.
Impact on profit after income tax for the year Impact on net assets
2017$m
2016$m
2017$m
2016$m
Change in fair value of hedge funds, equity funds and illiquid credit assets30% increase in fair value 168.6 145.3 168.6 145.320% increase in fair value 112.4 96.9 112.4 96.910% increase in fair value 56.2 48.4 56.2 48.410% decrease in fair value (56.2) (48.4) (56.2) (48.4)20% decrease in fair value (112.4) (96.9) (112.4) (96.9)30% decrease in fair value (168.6) (145.3) (168.6) (145.3)
d) Investment riskThe value of our investment portfolio is impacted by interest rate and market price risks, as described above. Managing the group’s exposures to these risks is an intrinsic part of our investment strategy.
Beazley use an Economic Scenario Generator (ESG) to simulate multiple simulations of financial conditions, to support stochastic analysis of market risk. Beazley use these outputs to assess the value at risk (VAR) of its investments, at different confidence levels, including ‘1 in 200’, which reflects Solvency II modelling requirements, and ‘1 in 10’, reflecting scenarios which are more likely to occur in practice. Risk is typically considered to a 12 month horizon. It is assessed for investments in isolation and also in conjunction with the present value of our liabilities, to help us monitor and manage market risk for solvency and capital purposes. By its nature, stochastic modelling does not provide a precise measure of risk: ESG outputs are regularly validated against actual market conditions, but Beazley also uses a number of other, qualitative, measures to support the monitoring and management of investment risk. These include stress testing and scenario analysis.
Beazley’s investment strategy is developed by reference to an investment risk budget, set annually by the board as part of the overall risk budgeting framework of the business. The Solvency II internal model is used to monitor compliance with the budget, which limits the amount by which our reported annual investment return may deviate from a predetermined target, at the 1 in 10 confidence level. In 2017, the permitted deviation was $126m. Additionally, a limit is specified for the net interest rate sensitivity of assets and liabilities combined and investments are managed to ensure that this limit is not exceeded.
2.4 Operational risk † Operational risk arises from the risk of losses due to inadequate or failed internal processes, people, systems, service providers or external events.
There are a number of business activities for which the group uses the services of a third-party company, such as investment management, data entry and credit control. These service providers are selected against rigorous criteria and formal service level agreements are in place, and regularly monitored and reviewed.

Financial statements
www.beazley.com Annual report 2017 Beazley 149
2 Risk management continuedThe group also recognises that it is necessary for people, systems and infrastructure to be available to support our operations. Therefore we have taken significant steps to mitigate the impact of business interruption which could follow a variety of events, including the loss of key individuals and facilities. We operate a formal disaster recovery plan which, in the event of an incident, allows the group to move critical operations to an alternative location within 24 hours.
The group actively manages operational risks and minimises them where appropriate. This is achieved by implementing and communicating guidelines to staff and other third parties. The group also regularly monitors the performance of its controls and adherence to these guidelines through the risk management reporting process.
Key components of the group’s operational control environment include:• modelling of operational risk exposure and scenario testing;• management review of activities;• documentation of policies and procedures;• preventative and detective controls within key processes;• contingency planning; and• other systems controls.
2.5 Credit riskCredit risk arises where counterparties fail to meet their financial obligations in full as they fall due. The primary sources of credit risk for the group are:• reinsurers – reinsurers may fail to pay valid claims against a reinsurance contract held by the group;• brokers and coverholders – counterparties fail to pass on premiums or claims collected or paid on behalf of the group; • investments – issuer default results in the group losing all or part of the value of a financial instrument or a derivative financial
instrument; or• cash and cash equivalents.
The group’s core business is to accept significant insurance risk and the appetite for other risks is low. This protects the group’s capital from erosion so that it can meet its insurance liabilities.
The group limits exposure to a single counterparty or a group of counterparties and analyses the geographical locations of exposures when assessing credit risk.
An approval system also exists for all new brokers, and broker performance is carefully monitored. Regular exception reports highlight trading with non-approved brokers, and the group’s credit control function frequently assesses the ageing and collectability of debtor balances. Any large, aged items are prioritised and where collection is outsourced incentives are in place to support these priorities.
The investment committee has established comprehensive guidelines for the group’s investment managers regarding the type, duration and quality of investments acceptable to the group. The performance of investment managers is regularly reviewed to confirm adherence to these guidelines.
The group has developed processes to formally examine all reinsurers before entering into new business arrangements. New reinsurers are approved by the reinsurance security committee (RSC), which also reviews arrangements with all existing reinsurers at least annually. Vulnerable or slow-paying reinsurers are examined more frequently.
To assist in the understanding of credit risks, A.M. Best, Moody’s and Standard & Poor’s (S&P) ratings are used. These ratings have been categorised below as used for Lloyd’s reporting:
A.M. Best Moody’s S&P
Tier 1 A++ to A- Aaa to A3 AAA to A-Tier 2 B++ to B- Baa1 to Ba3 BBB+ to BB-Tier 3 C++ to C- B1 to Caa B+ to CCCTier 4 D, E, F, S Ca to C R, (U,S) 3

www.beazley.com150 Beazley Annual report 2017
Notes to the financial statements continued
2 Risk management continuedThe following tables summarise the group’s concentrations of credit risk:
31 December 2017Tier 1
$mTier 2
$mTier 3
$mTier 4
$mUnrated
$mTotal
$m
Financial assets at fair value– fixed and floating rate debt securities 2,840.0 874.7 – – – 3,714.7– equity funds – – – – 168.3 168.3– hedge funds – – – – 377.4 377.4– illiquid credit assets – – – – 180.4 180.4– derivative financial instruments – – – – 8.8 8.8Insurance receivables – – – – 918.0 918.0Reinsurance assets 1,231.1 – – – – 1,231.1Other receivables 68.6 – – – – 68.6Cash and cash equivalents 440.5 – – – – 440.5Total 4,580.2 874.7 – – 1,652.9 7,107.8
31 December 2016Tier 1
$mTier 2
$mTier 3
$mTier 4
$mUnrated
$mTotal
$m
Financial assets at fair value– fixed and floating rate debt securities 2,687.3 928.2 1.9 – – 3,617.4– equity funds – – – – 116.3 116.3– hedge funds – – – – 317.1 317.1– illiquid credit assets – – – – 132.4 132.4– derivative financial instruments – – – – 12.2 12.2Insurance receivables – – – – 794.7 794.7Reinsurance assets 1,082.1 – – – – 1,082.1Other receivables 46.4 – – – – 46.4Cash and cash equivalents 507.2 – – – – 507.2Total 4,323.0 928.2 1.9 – 1,372.7 6,625.8
The largest counterparty exposure within tier 1 is $936.7m of US Treasuries (2016: $788.4m).
Financial investments falling within the unrated category comprise hedge funds, equity funds and illiquid credit assets for which there is no readily available market data to allow classification within the respective tiers. Additionally, insurance receivables are classified as unrated, due to premium debtors not being credit rated.
Insurance receivables and other receivables balances held by the group have not been impaired, based on all evidence available, and no impairment provision has been recognised in respect of these assets. Insurance receivables in respect of coverholder business are credit controlled by third-party managers. We monitor third party coverholders’ performance and their financial processes through the group’s coverholder management team. These assets are individually impaired after considering information such as the occurrence of significant changes in the counterparties’ financial position, patterns of historical payment information and disputes with counterparties.

Financial statements
www.beazley.com Annual report 2017 Beazley 151
2 Risk management continuedAn analysis of the overall credit risk exposure indicates that the group has reinsurance assets that are impaired at the reporting date. The total impairment in respect of the reinsurance assets, including reinsurer's share of outstanding claims, at 31 December 2017 was as follows:
Individualimpairment
$m
Collectiveimpairment
$mTotal
$m
Balance at 1 January 2016 2.9 10.8 13.7Impairment loss written back (0.5) (0.6) (1.1)Balance at 31 December 2016 2.4 10.2 12.6Impairment loss recognised 0.5 0.1 0.6Balance at 31 December 2017 2.9 10.3 13.2
The group has insurance receivables and reinsurance assets that are past due at the reporting date. An aged analysis of these is presented below:
31 December 2017
Up to 30 dayspast due
$m
30-60 dayspast due
$m
60-90 dayspast due
$m
Greater than90 days
past due$m
Total$m
Insurance receivables 57.5 13.7 5.3 18.9 95.4Reinsurance assets 20.4 2.9 0.5 5.2 29.0
31 December 2016
Up to 30 dayspast due
$m
30-60 dayspast due
$m
60-90 dayspast due
$m
Greater than90 days
past due$m
Total$m
Insurance receivables 31.9 7.9 2.3 11.2 53.3Reinsurance assets 0.1 3.9 0.1 4.2 8.3
The total impairment provision in the statement of financial position in respect of reinsurance assets past due (being reinsurance recoverables due on paid claims) by more than 30 days at 31 December 2017 was $3.1m (2016: $3.2m). This $3.1m provision in respect of overdue reinsurance recoverables is included within the total provision of $13.2m shown in the table at the top of the page.
The group believes that the unimpaired amounts that are past due more than 30 days are still collectable in full, based on historic payment behaviour and analyses of credit risk.
2.6 Regulatory and legal risk †Regulatory and legal risk is the risk arising from not complying with regulatory and legal requirements. The operations of the group are subject to legal and regulatory requirements within the jurisdictions in which it operates and the group’s compliance function is responsible for ensuring that these requirements are adhered to.
2.7 Liquidity riskLiquidity risk arises where cash may not be available to pay obligations when due at a reasonable cost. The group is exposed to daily calls on its available cash resources, principally from claims arising from its insurance business. In the majority of the cases, these claims are settled from the premiums received.
The group’s approach is to manage its liquidity position so that it can reasonably survive a significant individual or market loss event (details of the group’s exposure to realistic disaster scenarios (RDS) are provided on page 143). This means that the group maintains sufficient liquid assets, or assets that can be converted into liquid assets at short notice and without any significant capital loss, to meet expected cash flow requirements. These liquid funds are regularly monitored using cash flow forecasting to ensure that surplus funds are invested to achieve a higher rate of return. The group also makes use of loan facilities and borrowings, details of which can be found in note 25. Further information on the group’s capital resources is contained on pages 50 to 51.

www.beazley.com152 Beazley Annual report 2017
Notes to the financial statements continued
2 Risk management continuedThe following is an analysis by business segment of the estimated timing of the net cash flows based on the net claims liabilities1 balance held at 31 December:
31 December 2017
Within1 year
$m1-3 years
$m3-5 years
$m
Greater than5 years
$mTotal
$m
Weighted average term to settlement
(years)
Marine 100.6 89.3 26.7 20.4 237.0 2.0Political, accident & contingency 62.6 45.8 9.9 12.0 130.3 2.3Property 134.5 101.2 29.2 32.8 297.7 2.2Reinsurance 70.8 66.1 20.8 19.8 177.5 2.3Specialty lines 542.7 713.8 360.4 456.0 2,072.9 3.4Net claims liabilities 911.2 1,016.2 447.0 541.0 2,915.4
1 For a breakdown of net claims liabilities refer to note 24.
31 December 2016
Within1 year
$m1-3 years
$m3-5 years
$m
Greater than5 years
$mTotal
$m
Weighted average term to settlement
(years)
Marine 97.6 79.6 22.6 16.9 216.7 1.9Political, accident & contingency 65.6 40.5 8.2 6.0 120.3 1.7Property 99.0 75.9 19.3 13.4 207.6 1.8Reinsurance 61.2 53.5 17.1 15.4 147.2 2.2Specialty lines 412.1 675.2 403.2 480.7 1,971.2 3.5Net claims liabilities 735.5 924.7 470.4 532.4 2,663.0
The following table is an analysis of the net contractual cash flows based on all the liabilities held at 31 December:
31 December 2017Within1 year 1-3 years 3-5 years
Greater than5 years Total
Net claims liabilities 911.2 1,016.2 447.0 541.0 2,915.4Borrowings – 99.5 – 266.5 366.0Other payables 512.5 – – – 512.5
31 December 2016Within1 year 1-3 years 3-5 years
Greater than5 years Total
Net claims liabilities 735.5 924.7 470.4 532.4 2,663.0Borrowings – 94.7 – 266.3 361.0Other payables 482.9 1.4 – – 484.3
The group makes additional interest payments for borrowings. Further details are provided in notes 8 and 25.
The next two tables summarise the carrying amount at reporting date of financial instruments analysed by maturity date.
Maturity31 December 2017
<1 yr$m
1-2 yrs$m
2-3 yrs$m
3-4 yrs$m
4-5 yrs $m
5-10 yrs$m
>10 yrs$m
Total$m
Fixed and floating rate debt securities 926.5 967.1 653.0 511.9 454.3 201.9 – 3,714.7Derivative financial instruments 8.8 – – – – – – 8.8Cash and cash equivalents 440.5 – – – – – – 440.5Insurance receivables 918.0 – – – – – – 918.0Other receivables 68.6 – – – – – – 68.6Other payables (512.5) – – – – – – (512.5)Borrowings – (99.5) – – – (248.5) (18.0) (366.0)Total 1,849.9 867.6 653.0 511.9 454.3 (46.6) (18.0) 4,272.1

Financial statements
www.beazley.com Annual report 2017 Beazley 153
2 Risk management continued
31 December 2016<1 yr
$m1-2 yrs
$m2-3 yrs
$m3-4 yrs
$m4-5 yrs
$m5-10 yrs
$m>10 yrs
$mTotal
$m
Fixed and floating rate debt securities 925.0 695.6 816.8 522.4 485.2 172.4 – 3,617.4Derivative financial instruments 12.2 – – – – – – 12.2Cash and cash equivalents 507.2 – – – – – – 507.2Insurance receivables 794.7 – – – – – – 794.7Other receivables 46.4 – – – – – – 46.4Other payables (482.9) (1.4) – – – – – (484.3)Borrowings – – (94.7) – – (248.3) (18.0) (361.0)Total 1,802.6 694.2 722.1 522.4 485.2 (75.9) (18.0) 4,132.6
Borrowings consist of three items as at 31 December 2017. The first is $18m of a subordinated debt facility raised in 2004 which is unsecured. The subordinated notes are due in 2034 and have been callable at the group’s option since 2009. The second is $250m of subordinated tier 2 debt raised in November 2016. This debt is due in 2026 and has annual interest of 5.875% payable in May and November of each year. The third is a £75m sterling denominated 5.375% notes due in 2019 with interest payable in March and September each year.
Illiquid credit assets, hedge funds and equity funds are not included in the maturity profile because the basis of maturity profile can not be determined with any degree of certainty.
2.8 Group risk †Group risk occurs where business units fail to consider the impact of their activities on other parts of the group, as well as the risks arising from these activities. There are two main components of group risk which are explained below.
a) ContagionContagion risk is the risk arising from actions of one part of the group which could adversely affect any other part of the group. As the two largest components of the group, this is of particular relevance for actions in any of the US operations, which could adversely affect the UK operations, and vice versa. The group has limited appetite for contagion risk and minimises the impact of this occurring by operating with clear lines of communication across the group to ensure all group entities are well informed and working to common goals.
b) ReputationReputation risk is the risk of negative publicity as a result of the group’s contractual arrangements, customers, products, services and other activities. Key sources of reputation risk include operation of a Lloyd’s franchise, interaction with capital markets since the group’s IPO during 2002, and reliance upon the Beazley brand in North America, Europe, Asia, South America and Asia. The group’s preference is to minimise reputation risks but where it is not possible or beneficial to avoid them, we seek to minimise their frequency and severity by management through public relations and communication channels.
2.9 Capital managementThe group follows a risk-based approach to determine the amount of capital required to support its activities. Recognised stochastic modelling techniques are used to measure risk exposures, and capital to support business activities is allocated according to risk profile. Stress and scenario analysis is regularly performed and the results are documented and reconciled to the board’s risk appetite where necessary.
The group has several requirements for capital, including: • to support underwriting at Lloyd’s through the syndicates in which it participates, being 2623, 3623, 3622 and 5623. This
is based on the group’s own individual capital assessment. It may be provided in the form of either the group’s cash and investments or debt facilities;
• to support underwriting in Beazley Insurance Company, Inc. in the US; • to support underwriting inBeazley Insurance dac in Europe; and • to make acquisitions of insurance companies or MGAs whose strategic goals are aligned with our own.
The Internal Model Solvency Capital Requirement is a dedicated quantitative review of syndicate models and it sets outs to be a key input to the Lloyd’s Internal Model.

www.beazley.com154 Beazley Annual report 2017
Notes to the financial statements continued
2 Risk management continuedThe board’s strategy is to grow the dividend (excluding special dividend) by between 5% and 10% per year. Our capital management strategy is to carry some surplus capital to enable us to take advantage of growth opportunities which may arise. At 31 December 2017 we have surplus capital of 39% of ECR (unaudited, on a Solvency II basis). Following payment of the second interim dividend of 7.4p per share, the surplus reduces to 35% (unaudited) compared to our current target range of 15% to 25% of ECR.
2.10 Company risk The company is exposed to the same interest rate and liquidity risk exposure experienced on its mutual borrowings with the group. The group’s exposure can be seen in sections 2.3b and 2.7. The company also experiences operational, regulatory and legal risks as defined in section 2.4 and 2.6.
3 Segmental analysisa) Reporting segmentsSegment information is presented in respect of reportable segments. These are based on the group’s management and internal reporting structures and represent the level at which financial information is reported to the board, being the chief operating decision-maker as defined in IFRS 8.
The operating segments are based upon the different types of insurance risk underwritten by the group, as described below:
MarineThis segment underwrites a broad spectrum of marine classes including hull, energy, cargo and specie, piracy, satellite, aviation, kidnap & ransom and war risks.
Political, accident & contingencyDuring 2017, the life, accident & health division and political risks & contingency division were combined to form the political, accident & contingency division. This segment underwrites terrorism, political violence, expropriation and credit risks as well as contingency and risks associated with contract frustration. In addition, this segment underwrites life, health, personal accident, sports and income protection risks.
PropertyThe property segment underwrites commercial, high-value homeowners’ and construction and engineering property insurance on a worldwide basis.
ReinsuranceThis segment specialises in writing property catastrophe, property per risk, casualty clash, aggregate excess of loss and pro-rata business.
Specialty lines This segment underwrites professional liability, management liability and environmental liability, including architects and engineers, healthcare, cyber, lawyers, technology, media and business services, directors and officers and employment practices risks.
Segment results, assets and liabilities include items directly attributable to a segment as well as those that can be allocated on a reasonable basis. The reporting segments do not cross-sell business to each other. There are no individual policyholders who comprise greater than 10% of the group’s total gross premiums written.

Financial statements
www.beazley.com Annual report 2017 Beazley 155
3 Segmental analysis continuedb) Segment information
2017Marine
$m
Political,accident &
contingency1
$mProperty
$mReinsurance
$m
Specialty lines
$mTotal $m
Segment resultsGross premiums written 267.6 214.3 362.9 206.8 1,292.2 2,343.8Net premiums written 233.2 190.8 300.0 134.6 1,120.2 1,978.8
Net earned premiums 227.9 188.7 293.8 136.9 1,022.1 1,869.4Net investment income 12.7 6.7 14.1 9.4 95.4 138.3Other income 3.2 3.6 7.3 3.7 17.7 35.5Revenue 243.8 199.0 315.2 150.0 1,135.2 2,043.2
Net insurance claims 124.7 96.2 251.6 97.5 505.7 1,075.7Expenses for the acquisition of insurance contracts 68.9 67.2 95.3 32.9 255.4 519.7Administrative expenses 30.5 27.8 36.1 15.6 144.7 254.7Foreign exchange loss 0.4 0.3 0.5 0.2 1.7 3.1Expenses 224.5 191.5 383.5 146.2 907.5 1,853.2
Share of profit/(loss) of associates – 0.4 – – (0.3) 0.1
Segment result 19.3 7.9 (68.3) 3.8 227.4 190.1Finance costs (22.1)Profit before income tax 168.0
Income tax expense (38.0)
Profit for the year attributable to equity shareholders 130.0
Claims ratio 55% 51% 86% 71% 50% 58%Expense ratio 43% 50% 44% 36% 39% 41%Combined ratio 98% 101% 130% 107% 89% 99%
Segment assets and liabilitiesSegment assets 694.1 448.9 841.7 665.4 4,908.6 7,558.7Segment liabilities (574.2) (344.0) (676.8) (485.5) (3,979.3) (6,059.8)Net assets 119.9 104.9 164.9 179.9 929.3 1,498.9
Additional informationInvestment in associates2 – – – – 7.0 7.0Impairment of non-financial assets – – – – – –Capital expenditure 0.9 0.8 1.2 1.3 6.8 11.0Increase in intangibles – – – – 34.4 34.4Amortisation and depreciation (2.1) (0.4) (0.7) (0.7) (10.4) (14.3)Net cash flow (2.6) (2.3) (3.6) (3.9) (54.3) (66.7)
1 During 2017, the life, accident & health division and political risks & contingency division were combined to form the political, accident & contingency division. Comparative figures for 31 December 2016 have been re-presented to reflect this change in structure and allow comparability.
2 In July 2017 the group sold its share in associate, Equinox Global Limited, to Nexus Underwriting Management Limited.

www.beazley.com156 Beazley Annual report 2017
Notes to the financial statements continued
3 Segmental analysis continued
2016Marine
$m
Political, accident &
contingency 1$m
Property$m
Reinsurance$m
Specialty lines
$mTotal $m
Segment results Gross premiums written 247.4 245.3 329.7 213.4 1,159.8 2,195.6Net premiums written 220.7 215.6 277.1 141.2 999.4 1,854.0
Net earned premiums 223.2 221.1 287.0 138.4 898.5 1,768.2Net investment income 8.9 4.9 10.2 6.4 62.7 93.1Other income 3.8 2.9 6.4 6.2 13.4 32.7Revenue 235.9 228.9 303.6 151.0 974.6 1,894.0
Net insurance claims 98.9 99.7 115.3 40.2 501.5 855.6Expenses for the acquisition of insurance contracts 65.9 67.1 88.8 34.7 216.0 472.5Administrative expenses 35.5 33.4 46.6 14.5 117.8 247.8Foreign exchange loss 1.1 1.1 1.4 0.7 5.2 9.5Expenses 201.4 201.3 252.1 90.1 840.5 1,585.4
Share of loss of associates – – – – (0.2) (0.2)
Segment result 34.5 27.6 51.5 60.9 133.9 308.4Finance costs (15.2)Profit before income tax 293.2
Income tax expense (42.2)
Profit for the year attributable to equity shareholders 251.0
Claims ratio 44% 45% 40% 29% 56% 48%Expense ratio 46% 46% 47% 36% 37% 41%Combined ratio 90% 91% 87% 65% 93% 89%
Segment assets and liabilitiesSegment assets 610.5 455.0 773.5 595.4 4,574.1 7,008.5Segment liabilities (491.8) (351.1) (610.3) (417.4) (3,654.2) (5,524.8)Net assets 118.7 103.9 163.2 178.0 919.9 1,483.7
Additional informationInvestment in associates – 2.6 – – 7.3 9.9Impairment of non-financial assets – – – – – –Capital expenditure 1.2 0.7 1.3 0.8 3.2 7.2Increase in intangibles 8.0 – – – – 8.0Amortisation and depreciation (1.2) (0.7) (1.3) (0.8) (3.1) (7.1)Net cash flow (46.3) (20.6) (25.5) (18.9) (58.4) (169.7)
1 During 2017, the life, accident & health division and political risks & contingency division were combined to form the political, accident & contingency division. Comparative figures for 31 December 2016 have been re-presented to reflect this change in structure and allow comparability.

Financial statements
www.beazley.com Annual report 2017 Beazley 157
3 Segmental analysis continuedc) Information about geographical areasThe group’s operating segments are also managed geographically by placement of risk. UK earned premium in the analysis below represents all risks placed at Lloyd’s and US earned premium represents all risks placed at the group’s US insurance company, Beazley Insurance Company, Inc. An analysis of gross premiums written split geographically by placement of risk and by reportable segment is provided in note 2 on page 144.
2017$m
2016$m
Net earned premiumsUK (Lloyd’s) 1,807.8 1,697.5US (Non-Lloyd’s) 61.6 70.7
1,869.4 1,768.2
2017$m
2016$m
Segment assetsUK (Lloyd’s) 7,207.3 6,657.3US (Non-Lloyd’s) 351.4 351.2
7,558.7 7,008.5
Segment assets are allocated based on where the assets are located.2017
$m2016
$m
Capital expenditureNon-US 10.2 5.1US 0.8 2.1
11.0 7.2
4 Net investment income2017
$m2016
$m
Interest and dividends on financial investments at fair value through profit or loss 76.1 70.9Interest on cash and cash equivalents 0.5 0.6Net realised gain/(losses) on financial investments at fair value through profit or loss 23.1 (4.9)Net unrealised fair value gains on financial investments at fair value through profit or loss 46.5 33.8Investment income from financial investments 146.2 100.4Investment management expenses (7.9) (7.3)
138.3 93.1

www.beazley.com158 Beazley Annual report 2017
Notes to the financial statements continued
5 Other income2017
$m2016
$m
Commissions received by Beazley service companies 22.7 15.5Profit commissions from syndicates 623/6107 8.0 14.9Agency fees from 623 2.2 2.0Other income1 2.6 0.3
35.5 32.7
1 In May 2017 the group sold its Australian accident and health business, previously included in PAC segment, to Blend Insurance Solutions PTY Limited, a Sydney-based Lloyd’s service company. The current gain on the disposal of $0.4m is included in other income line of the consolidated statement of profit or loss. This figure represents the net of the amounts received from the transaction and an estimate of the most probable amount that is expected to be received in respect of contingent consideration.
6 Operating expenses2017
$m2016
$m
Operating expenses include:
Amounts receivable by the auditor and associates in respect of:– audit services for the group and subsidiaries 0.9 1.0– audit-related assurance services 0.7 0.3– taxation compliance services 0.1 –– other assurance services – 0.5– other non-audit services 0.6 0.4
2.3 2.2
Impairment loss recognised/(written back) on reinsurance assets 0.6 (1.1)
Operating leases 9.3 9.5
Other than the fees disclosed above, no other fees were paid to the company’s auditor.
7 Employee benefit expenses2017
$m2016
$m
Wages and salaries 142.4 134.6Short term incentive payments 70.2 77.8Social security 18.2 18.3Share based remuneration 21.1 23.0Pension costs 1 10.9 9.2
262.8 262.9Recharged to syndicate 623 (39.4) (38.5)
223.4 224.4
1 Pension costs refer to the contributions made under the defined contribution scheme. Further information on the defined benefit pension scheme can be found in note 27.

Financial statements
www.beazley.com Annual report 2017 Beazley 159
8 Finance costs2017
$m2016
$m
Interest expense 22.1 15.222.1 15.2
9 Income tax expense2017
$m2016
$m
Current tax expenseCurrent year 35.4 37.1Prior year adjustments (0.6) 2.1
34.8 39.2Deferred tax expenseOrigination and reversal of temporary differences (3.6) 2.1Impact of change in UK/US tax rates 5.3 (0.8)Prior year adjustments 1.5 1.7
3.2 3.0Income tax expense 38.0 42.2
Reconciliation of tax expense The weighted average of statutory tax rates applied to the profits earned in each country in which the group operates is 18.7% (2016: 14.9%), whereas the tax charged for the year 31 December 2017 as a percentage of profit before tax is 22.6% (2016: 14.4%). The increases compared to 2016 were due to a higher weighted average statutory tax rate and a reduction of approximately $5m in deferred tax assets (see below):
2017$m
2017%
2016$m
2016%
Profit before tax 168.0 293.2Tax calculated at the weighted average of statutory tax rates 31.4 18.7 43.6 14.9
Effects of:– non-deductible expenses 0.9 0.5 1.8 0.6– non-taxable gains on foreign exchange (0.5) (0.3) (5.6) (1.9)– tax relief on share based payments – current and future years – – (0.6) (0.2)– under provided in prior years 0.9 0.5 3.8 1.3– change in UK/US tax rates 1 5.3 3.2 (0.8) (0.3)Tax charge for the period 38.0 22.6 42.2 14.4
1 The Finance Act 2015, which provided for a reduction in the UK corporation tax rate to 19% effective from 1 April 2017 was substantively enacted on 26 October 2015. The Finance Act 2016, which provides for a reduction in the UK corporation tax rate to 17% effective from 1 April 2020 was substantively enacted on 6 September 2016. These rate reductions to 19% and 17% will reduce the group’s future current tax charge and have been reflected in the calculation of the deferred tax balance as at 31 December 2017.
A change in the effective corporation tax in the US from 35% to 21% was substantively enacted in December 2017. This resulted in a $5m reduction to the carrying value of the group’s US deferred tax asset at 31 December 2017.
As noted on page 47, the group has assessed the potential impact of the diverted profits tax (DPT) following the enactment of new legislation in April 2015 and is of the view that no liability arises. The ultimate outcome may differ and any profits that did fall within scope of DPT would potentially be taxed at a rate of 25% rather than 12.5% (the current rate of tax on corporate earnings in Ireland).

www.beazley.com160 Beazley Annual report 2017
Notes to the financial statements continued
10 Earnings per share2017 2016
Basic (cents) 25.0c 48.6cDiluted (cents) 24.4c 47.3c
Basic (pence) 19.5p 35.5pDiluted (pence) 19.0p 34.5p
BasicBasic earnings per share are calculated by dividing profit after tax of $130.0m (2016: $251.0m) by the weighted average number of shares in issue during the year of 520.5m (2016: 516.3m). The shares held in the Employee Share Options Plan (ESOP) of 3.8m (2016: 6.1m) have been excluded from the calculation, until such time as they vest unconditionally with the employees.
DilutedDiluted earnings per share are calculated by dividing profit after tax of $130.0m (2016: $251.0m) by the adjusted weighted average number of shares of 533.6m (2016: 531.0m). The adjusted weighted average number of shares assumes conversion of dilutive potential ordinary shares, being shares from the SAYE, retention and deferred share schemes. The shares held in the ESOP of 3.8m (2016: 6.1m) have been excluded from the calculation, until such time as they vest unconditionally with the employees.
11 Dividends per shareA second interim dividend of 7.4p per ordinary share (2016: 7.0p) will be payable on 28 March 2018 to Beazley plc shareholders registered at 5.00pm on 2 March 2018 in respect of the six months ended 31 December 2017. No special dividend was declared in 2017 (2016: 10.0p). The company expects the total amount to be paid in respect of the second interim to be approximately £38.6m. These financial statements do not provide for the second interim dividend as a liability.
Together with the interim dividend of 3.7p (2016: 3.5p) this gives a total dividend for the year of 11.1p (2016: 20.5p). The aforementioned interim dividend will be payable on 28 March 2018 to shareholders registered at 5.00pm on 2 March 2018.

Financial statements
www.beazley.com Annual report 2017 Beazley 161
12 Intangible assets
Goodwill$m
Syndicate capacity
$mLicences
$m
ITdevelopment
costs$m
Renewal rights
$mTotal
$m
CostBalance at 1 January 2016 72.0 10.7 9.3 63.2 17.0 172.2Other additions – – – 4.7 8.0 12.7Foreign exchange loss – – – (10.9) (0.4) (11.3)Balance at 31 December 2016 72.0 10.7 9.3 57.0 24.6 173.6
Balance at 1 January 2017 72.0 10.7 9.3 57.0 24.6 173.6Other additions – – – 9.3 34.4 43.7Foreign exchange gain – – – 4.8 2.0 6.8Balance at 31 December 2017 72.0 10.7 9.3 71.1 61.0 224.1
Amortisation and impairmentBalance at 1 January 2016 (10.0) – – (54.2) (17.0) (81.2)Amortisation for the year – – – (4.6) (0.7) (5.3)Foreign exchange gain – – – 9.4 0.1 9.5Balance at 31 December 2016 (10.0) – – (49.4) (17.6) (77.0)
Balance at 1 January 2017 (10.0) – – (49.4) (17.6) (77.0)Amortisation for the year – – – (3.5) (8.1) (11.6)Foreign exchange loss – – – (1.9) (0.1) (2.0)Balance at 31 December 2017 (10.0) – – (54.8) (25.8) (90.6)
Carrying amount31 December 2017 62.0 10.7 9.3 16.3 35.2 133.531 December 2016 62.0 10.7 9.3 7.6 7.0 96.6

www.beazley.com162 Beazley Annual report 2017
Notes to the financial statements continued
12 Intangible assets continuedImpairment testsGoodwill, syndicate capacity and US insurance authorisation licences are deemed to have indefinite life as they are expected to have value in use that does not erode or become obsolete over the course of time. Consequently, they are not amortised but annually tested for impairment. For the purpose of impairment testing, they are allocated to the group’s cash-generating units (CGUs) as follows:
2017Marine
$m
Political, accident &
contingency $m
Property$m
Reinsurance$m
Specialtylines
$mTotal
$m
Goodwill 2.3 29.6 24.9 0.8 4.4 62.0Capacity 1.6 1.0 2.5 0.8 4.8 10.7Licences – – 1.9 – 7.4 9.3Total 3.9 30.6 29.3 1.6 16.6 82.0
2016Marine
$m
Political, accident &
contingency $m
Property$m
Reinsurance$m
Specialtylines
$mTotal
$m
Goodwill 2.3 29.6 24.9 0.8 4.4 62.0Capacity 1.6 1.0 2.5 0.8 4.8 10.7Licences – – 1.9 – 7.4 9.3Total 3.9 30.6 29.3 1.6 16.6 82.0
Value in use is defined as the present value of the future cash flows expected to be derived from the CGU and represents recoverable amount for goodwill. It is estimated by discounting future cash flows sourced from financial budgets approved by management which cover specific estimates for a five year period. A terminal growth rate of 0% has been used to extrapolate projections beyond the covered five year period. The key assumptions used in the preparation of future cash flows are: premium growth rates, claims experience, retention rates and expected future market conditions.
A discount rate, based on weighted average cost of capital (WACC) of 6% (2016: 7%) has been applied to projected future cash flows. This has been calculated using independent measures of the risk-free rate of return and is indicative of the group’s risk profile relative to the market. The impairment test for Goodwill confirms that no impairment is required.
Significant changes in the economic and regulatory environment, such as US legislation and Brexit, could impact the amount of premiums written and investment income per each CGU. This could potentially have an impact on the carrying value of the CGU.
To test the segment’s sensitivity to variances from forecast profits, the discount rate has been flexed to 10% above and 5% below the central assumption. Within this range, the recovery of goodwill was stress tested and remains supportable across all CGUs. Headroom was calculated in respect of the value in use of all the group’s other intangible assets.
The group’s intangible asset relating to syndicate capacity is allocated across all CGUs. The fair value of syndicate capacity can be determined from the latest Lloyd’s of London capacity auctions. Based upon the latest market prices, management concludes that the fair value exceeds the carrying amount and as such no impairment is necessary.
US insurance authorisation licences represent the privilege to write insurance business in particular states in the US. Licences are allocated to the relevant CGU. There is no active market for licences, therefore value in use is deemed to be fair value. As described above, a WACC rate is applied to projected future cash flows sourced from management approved budgets. Key assumptions are the same as those outline above. Based upon all available evidence the results of the test indicate that no impairment is required.

Financial statements
www.beazley.com Annual report 2017 Beazley 163
13 Plant and equipmentCompany Group
Fixtures & fittings
$m
Fixtures & fittings
$m
Computer equipment
$mTotal
$m
CostBalance at 1 January 2016 – 20.7 9.8 30.5Additions – 2.4 0.5 2.9Write off – – (0.4) (0.4)Foreign exchange loss – (1.6) (0.7) (2.3)Balance at 31 December 2016 – 21.5 9.2 30.7
Balance at 1 January 2017 – 21.5 9.2 30.7Additions – 1.1 0.6 1.7Write off – (0.1) (2.2) (2.3)Foreign exchange gain – 0.4 – 0.4Balance at 31 December 2017 – 22.9 7.6 30.5
Accumulated depreciationBalance at 1 January 2016 – (17.7) (8.3) (26.0)Depreciation charge for the year – (1.0) (0.8) (1.8)Write off – – 0.4 0.4Foreign exchange gain – 1.4 0.7 2.1Balance at 31 December 2016 – (17.3) (8.0) (25.3)
Balance at 1 January 2017 – (17.3) (8.0) (25.3)Depreciation charge for the year – (1.8) (0.9) (2.7)Write off – 0.1 2.2 2.3Foreign exchange loss – (0.3) (0.1) (0.4)Balance at 31 December 2017 – (19.3) (6.8) (26.1)
Carrying amounts31 December 2017 – 3.6 0.8 4.431 December 2016 – 4.2 1.2 5.4
14 Investment in associatesAssociates are those entities over which the group has power to exert significant influence but which it does not control. Significant influence is generally presumed if the group has between 20% and 50% of voting rights.
Group2017
$m2016
$m
As at 1 January 9.9 10.0Investment in Equinox Global Limited – 0.1Sale of share in Equinox Global Limited (3.0) –Share of profit/(loss) after tax 0.1 (0.2)As at 31 December 7.0 9.9

www.beazley.com164 Beazley Annual report 2017
Notes to the financial statements continued
14 Investment in associates continuedThe group’s investment in associates consists of:
Country ofincorporation
% interest held
Carrying value$m
2017Falcon Money Management Holdings Limited (and subsidiaries) Malta 1 25% –Capson Corp., Inc. (and subsidiary) USA 2 31% 7.0
7.0
1 259 St. Paul Street, Valletta, Malta.
2 221 West 6th Street, Suite 301, Austin TX 78701, USA.
In July 2017 Beazley Investments Limited, part of the Beazley group, sold its share in Equinox Global Limited to Nexus Underwriting Management Limited. In return, Beazley Investments Limited received cash consideration of £2.1m. The sale included an additional consideration of £4.5m subject to meeting of earnings targets over the next four years. This £4.5m has not been recognised as management is of the opinion that reaching the earnings targets is not probable.
The aggregate financial information for all associates (100%) held as at 31 December 2017 is as follows: 2017
$m2016
$m
Assets 35.1 36.8Liabilities 21.2 22.4Equity 13.9 14.4Revenue 17.1 32.7Loss after tax (1.0) (0.7)Share of other comprehensive income – –Share of total comprehensive income (1.0) (0.7)
All of the investments in associates are unlisted and are equity accounted using available financial information as at 31 December 2017. Falcon Management Holdings Limited is an investment management company which also acts in an intermediary capacity.
15 Deferred acquisition costs 2017
$m2016
$m
Balance at 1 January 242.8 226.2Additions 558.3 489.1Amortisation charge (519.7) (472.5)Balance at 31 December 281.4 242.8

Financial statements
www.beazley.com Annual report 2017 Beazley 165
16 Financial assets and liabilities 2017
$m2016
$m
Financial assets at fair valueFixed and floating rate debt securities:– Government issued 1,345.4 1,180.0– Quasi-government 24.1 62.0– Supranational 21.1 19.5– Corporate bonds – Investment grade 2,179.7 2,158.0 – High yield 58.8 97.1– Senior secured loans 85.6 96.2– Asset backed securities – 4.6Total fixed and floating rate debt securities 3,714.7 3,617.4
Equity funds 168.3 116.3Hedge funds 377.4 317.1Illiquid credit assets 180.4 132.4Total capital growth assets 726.1 565.8Total financial investments at fair value through statement of profit or loss 4,440.8 4,183.2
Derivative financial assets 8.8 12.2Total financial assets at fair value 4,449.6 4,195.4
Quasi-government securities include securities which are issued by government agencies or entities supported by government guarantees. Supranational securities are issued by institutions sponsored by more than one sovereign issuer. Investment grade credit assets are any corporate bonds rated as BBB-/Baa3 or higher by one or more major rating agency, while the remainder of our corporate bonds are rated as high yield. Asset-backed securities are backed by financial assets, including mortgage, credit card and auto loan receivables. Equity funds are investment vehicles which are predominantly exposed to equity securities and are intended to give diversified exposure to global equity markets. Our illiquid credit assets are described in further detail below. The fair value of these assets at 31 December 2017 excludes an unfunded commitment of $63.0m (2016: $85.5m).
The amounts expected to mature within and after one year are:2017
$m2016
$m
Within one year 935.3 937.2After one year 2,788.2 2,692.4Total 3,723.5 3,629.6
Our capital growth assets have no defined maturity dates and have thus been excluded from the above maturity table. However, $153.1m (2016: $105.0m) of equity funds could be liquidated within two weeks and the balance within six months, $299.5m (2016: $303.8m) of hedge fund assets within six months and the remaining $77.9m (2016: $13.3m) of hedge fund assets within 18 months. Illiquid credit assets are not readily realisable and principal will be returned over the life of these assets, which may be up to ten years.
As noted on page 138 consideration is also given when valuing the hedge funds to any restriction applied to distributions, the existence of side pocket provisions and the timing of the latest valuations. The adjustment to the underlying net asset value of the funds as a result of these considerations was $nil at 31 December 2017 (2016: $nil).

www.beazley.com166 Beazley Annual report 2017
Notes to the financial statements continued
16 Financial assets and liabilities continued
Financial liabilities2017
$m2016
$m
Retail bond 99.5 94.7Subordinated debt 18.0 18.0Tier 2 subordinated debt (2026) 248.5 248.3Derivative financial liabilities 1.3 2.8Total financial liabilities 367.3 363.8
The amounts expected to mature before and after one year are:Within one year 1.3 2.8After one year 366.0 361.0
367.3 363.8
A breakdown of the group’s investment portfolio is provided on page 47.A breakdown of derivative financial instruments is disclosed in note 17.
The retail bond was issued in 2012. The subordinated debt was issued in 2004. Tier 2 subordinated debt was issued in 2016. Please refer to note 25 for further details of our borrowings and associated repayment terms.
The group has given a fixed and floating charge over certain of its investments and other assets to secure obligations to Lloyd’s in respect of its corporate member subsidiary. Further details are provided in note 32.
Valuation hierarchyThe table below summarises financial assets carried at fair value using a valuation hierarchy that reflects the significance of the inputs used in making the measurements. The fair value hierarchy has the following levels:
Level 1 – Valuations based on quoted prices in active markets for identical instruments. An active market is a market in which transactions for the instrument occur with sufficient frequency and volume on an ongoing basis such that quoted prices reflect prices at which an orderly transaction would take place between market participants at the measurement date. Included within level 1 are bonds and treasury bills of government and government agencies which are measured based on quoted prices in active markets.
Level 2 – Valuations based on quoted prices in markets that are not active, or based on pricing models for which significant inputs can be corroborated by observable market data (e.g. interest rates, exchange rates). Included within level 2 are government bonds and treasury bills which are not actively traded, corporate bonds, asset backed securities and mortgage-backed securities.
Level 3 – Valuations based on inputs that are unobservable or for which there is limited market activity against which to measure fair value.
The availability of financial data can vary for different financial assets and is affected by a wide variety of factors, including the type of financial instrument, whether it is new and not yet established in the marketplace, and other characteristics specific to each transaction. To the extent that valuation is based on models or inputs that are unobservable in the market, the determination of fair value requires more judgement. Accordingly the degree of judgement exercised by management in determining fair value is greatest for instruments classified in level 3. The group uses prices and inputs that are current as of the measurement date for valuation of these instruments.
If the inputs used to measure the fair value of an asset or a liability can be categorised in different levels of the fair value hierarchy, then the fair value measurement is categorised in its entirety in the same level of the fair value hierarchy as the lowest level input that is significant to the entire measurement.
The group has an established control framework and valuation policy with respect to the measurement of fair values.

Financial statements
www.beazley.com Annual report 2017 Beazley 167
16 Financial assets and liabilities continued Level 2 investmentsFor the group’s level 2 debt securities our fund administrator obtains the prices used in the valuation from independent pricing vendors such as Bloomberg, Standard and Poor’s, Reuters, Markit and International Data Corporation. The independent pricing vendors derive an evaluated price from observable market inputs. The market inputs include trade data, two-sided markets, institutional bids, comparable trades, dealer quotes, and other relevant market data. These inputs are verified in their pricing engines and calibrated with the pricing models to calculate spread to benchmarks, as well as other pricing assumptions such as Weighted Average life (WAL), Discount Margins (DM), default rates, and recovery and prepayment assumptions for mortgage securities. While such valuations are sensitive to estimates, it is believed that changing one or more of the assumptions to reasonably possible alternative assumptions would not change the fair value significantly.
The group records the unadjusted price provided and validates the price through various tolerance checks such as comparison with the investment custodians and the investment managers to assess the reasonableness and accuracy of the price to be used to value the security. In the rare case that the price fails the tolerance test, it is escalated and discussed internally. We would not override the price on a retrospective basis, but we would work with the administrator and pricing vendor to investigate the difference. This generally results in the vendor updating their inputs. We also review the valuation policy on a regular basis to ensure it is fit for purpose. No adjustments have been made to the prices obtained from the administrator at the current year end.
For our hedge funds and equity funds, the pricing and valuation of each fund is undertaken by administrators in accordance with each underlying fund’s valuation policy. For the equity funds, the individual fund prices are published on a daily, weekly or monthly basis via Bloomberg and other market data providers such as Reuters. For the hedge funds, the individual fund prices are communicated by the administrators to all investors via the monthly investor statements. The fair value of the hedge fund and equity fund portfolios are calculated by reference to the underlying net asset values of each of the individual funds.
Additional information is obtained from fund managers relating to the underlying assets within individual hedge funds. We identified that 67% (2016: 77%) of these underlying assets were level 1 and the remainder level 2. This enables us to categorise hedge funds as level 2.
Prior to any new hedge fund investment, extensive due diligence is undertaken on each fund to ensure that pricing and valuation are undertaken by the administrators and that each fund’s valuation policy is appropriate for the financial instruments the manager will be employing to execute the investment strategy. Fund liquidity terms are reviewed prior to the execution of any investment to ensure that there is no mismatch between the liquidity of the underlying fund assets and the liquidity terms offered to fund investors. As part of the monitoring process, underlying fund subscriptions and redemptions are assessed by reconciling the increase or decrease in fund assets with the investment performance in any given period.
Level 3 investmentsDuring 2017, the group’s investment committee approved additional allocations to an illiquid asset portfolio comprising investments in funds managed by third party managers (generally closed end limited partnerships or open ended funds). While the funds provide full transparency on their underlying investments, the investments themselves are in many cases private and unquoted, and are therefore classified as level 3 investments.
These inputs can be subjective and may include a discount rate applied to the investment based on market factors and expectations of future cash flows, the nature of the investment, local market conditions, trading values on public exchanges for comparable securities, current and projected operating performance relative to benchmarks, financial condition, and financing transactions subsequent to the acquisition of the investment.
We take the following steps to ensure accurate valuation of these level 3 assets. A substantial part of the preinvestment due diligence process is dedicated to a comprehensive review of each fund’s valuation policy and the internal controls of the manager. In addition to this, confirmation that the investment reaches a minimum set of standards relating to the independence of service providers, corporate governance, and transparency is sought prior to approval. Post investment, unaudited capital statements confirming the fair value of the limited partner interests are received and reviewed on a quarterly (or more frequent) basis. Audited financial statements are received on an annual basis, with the valuation of each transaction being confirmed.

www.beazley.com168 Beazley Annual report 2017
Notes to the financial statements continued
16 Financial assets and liabilities continuedThe following table shows the fair values of financial assets and financial liabilities, including their levels in the fair value hierarchy.
2017Level 1
$mLevel 2
$mLevel 3
$mTotal
$m
Financial assets measured at fair valueFixed and floating rate debt securities– Government issued 1,345.4 – – 1,345.4– Quasi-government 24.1 – – 24.1– Supranational 21.1 – – 21.1– Corporate bonds – Investment grade 15.2 2,164.5 – 2,179.7 – High yield – 58.8 – 58.8– Senior secured loans – 85.6 – 85.6Equity funds – 168.3 – 168.3Hedge funds – 377.4 – 377.4Illiquid credit assets – – 180.4 180.4Derivative financial assets 8.8 – – 8.8Total financial assets measured at fair value 1,414.6 2,854.6 180.4 4,449.6
Financial liabilities measured at fair valueDerivative financial liabilities 1.3 – – 1.3
Financial liabilities not measured at fair valueRetail bond – 104.1 – 104.1Tier 2 subordinated debt (2026) – 266.6 – 266.6Total financial liabilities not measured at fair value – 370.7 – 370.7
2016Level 1
$mLevel 2
$mLevel 3
$mTotal
$m
Financial assets measured at fair valueFixed and floating rate debt securities– Government issued 1,180.0 – – 1,180.0– Quasi-government 62.0 – – 62.0– Supranational 19.5 – – 19.5– Corporate bonds – Investment grade 45.0 2,113.0 – 2,158.0 – High yield – 97.1 – 97.1– Senior secured loans – 96.2 – 96.2– Asset backed securities – 4.6 – 4.6Equity funds – 116.3 – 116.3Hedge funds – 317.1 – 317.1Illiquid credit assets – 6.3 126.1 132.4Derivative financial assets 12.2 – – 12.2Total financial assets measured at fair value 1,318.7 2,750.6 126.1 4,195.4

Financial statements
www.beazley.com Annual report 2017 Beazley 169
16 Financial assets and liabilities continued
2016Level 1
$mLevel 2
$mLevel 3
$mTotal
$m
Financial liabilities measured at fair valueDerivative financial liabilities 2.8 – – 2.8
Financial liabilities not measured at fair valueRetail bond – 100.8 – 100.8Tier 2 subordinated debt (2026) – 253.3 – 253.3Total financial liabilities not measured at fair value – 354.1 – 354.1
The table above does not include financial assets and liabilities that are, in accordance with the group’s accounting policies, recorded at amortised cost, if the carrying amount of these financial assets and liabilities approximates their fair values at the reporting date. Cash and cash equivalents have not been included in the table above, however, the full amount of cash and cash equivalents would be classified under level 1 in both the current and prior year.
Transfers and level 3 investment reconciliationsThere were no transfers in either direction between level 1, level 2 and level 3 in either 2016 or 2017.
The table below shows a reconciliation from the opening balances to the closing balances of level 3 fair values.
2017$m
2016$m
As at 1 January 126.1 89.7Purchases 55.4 47.9Sales (21.1) (21.6)Total net gains recognised in profit or loss 20.0 10.1As at 31 December 180.4 126.1
Unconsolidated structured entitiesA structured entity is defined as an entity that has been designed so that voting or similar rights are not the dominant factor in deciding who controls the entity, such as when any voting rights relate to administrative tasks only, or when the relevant activities are directed by means of contractual arrangements.
As part of its standard investment activities the group holds fixed interest investments in high yield bond funds and asset backed securities, as well as capital growth investments in equity funds, hedge funds and illiquid credit assets which in accordance with IFRS 12 are classified as unconsolidated structured entities. The group does not sponsor any of the unconsolidated structured entities. The assets classified as unconsolidated structured entities are held at fair value on the statement of financial position.
As at 31 December the investments comprising the group’s unconsolidated structured entities are as follows:2017
$m2016
$m
High yield bond funds 58.8 97.1Asset backed securities – 4.6Equity funds 168.3 116.3Hedge funds 377.4 317.1Illiquid credit assets 180.4 132.4Investments through unconsolidated structured entities 784.9 667.5
Apart from a relatively small exposure to high yield bond funds and asset backed securities, our unconsolidated structured entity exposures fall within our capital growth assets. The capital growth assets are held in investee funds managed by asset managers who apply various investment strategies to accomplish their respective investment objectives. The group’s investments in investee funds are subject to the terms and conditions of the respective investee fund’s offering documentation and are susceptible to market price risk arising from uncertainties about future values of those investee funds. Investment decisions are made after extensive due diligence on the underlying fund, its strategy and the overall quality of the underlying fund’s manager and assets.

www.beazley.com170 Beazley Annual report 2017
Notes to the financial statements continued
16 Financial assets and liabilities continuedAll the investee funds in the investment portfolio are managed by portfolio managers who are compensated by the respective investee funds for their services. Such compensation generally consists of an asset-based fee and a performance-based incentive fee and is reflected in the valuation of the fund’s investment in each of the investee funds. The right to sell or request redemption of investments in high yield bond funds, asset backed securities, equity funds and hedge funds ranges in frequency from daily to semi-annually. The group did not sponsor any of the respective structured entities.
These investments are included in financial assets at fair value through profit or loss in the statement of financial position. The group’s maximum exposure to loss from its interests in investee funds is equal to the total fair value of its investments in investee funds and unfunded commitments. Once the group has disposed of its shares in an investee fund, it ceases to be exposed to any risk from that investee fund.
As described in note 2 to the financial statements, the group monitors and manages its currency exposures to net assets and financial assets held at fair value.
Currency exposuresThe currency exposures of our financial assets held at fair value are detailed below:
2017UK £
$mCAD $
$mEUR €
$mSubtotal
$mUS $
$mTotal
$m
Financial assets at fair valueFixed and floating rate debt securities 12.4 161.1 – 173.5 3,541.2 3,714.7Equity funds – – 39.9 39.9 128.4 168.3Hedge funds – – – – 377.4 377.4Illiquid credit assets – – 13.7 13.7 166.7 180.4Derivative financial assets – – – – 8.8 8.8Total 12.4 161.1 53.6 227.1 4,222.5 4,449.6
2016UK £
$mCAD $
$mEUR €
$mSubtotal
$mUS $
$mTotal
$m
Financial assets at fair valueFixed and floating rate debt securities 140.1 169.2 – 309.3 3,308.1 3,617.4Equity funds – – 29.7 29.7 86.6 116.3Hedge funds – – – – 317.1 317.1Illiquid credit assets – – 8.1 8.1 124.3 132.4Derivative financial assets – – – – 12.2 12.2Total 140.1 169.2 37.8 347.1 3,848.3 4,195.4
The above qualitative and quantitative disclosure along with the risk management discussions in note 2 enable more comprehensive evaluation of Beazley’s exposure to risks arising from financial instruments.

Financial statements
www.beazley.com Annual report 2017 Beazley 171
17 Derivative financial instruments In 2017 and 2016 the group entered into over-the-counter and exchange traded derivative contracts. The group had the right and the intention to settle each contract on a net basis.
The assets and liabilities of these contracts at 31 December are detailed below:2017 2016
Derivative financial instrument assets
Gross contract amount
$m
Market value of derivative
position$m
Gross contract amount
$m
Market value of derivative
position$m
Foreign exchange forward contracts 446.7 7.2 144.0 6.9Bond futures contract (341.4) 1.6 (843.4) 5.3
105.3 8.8 (699.4) 12.2
2017 2016
Derivative financial instrument liabilities
Gross contract amount
$m
Market value of derivative
position$m
Gross contract amount
$m
Market value of derivative
position$m
Foreign exchange forward contracts 361.7 1.3 278.6 2.8Bond futures contract – – – –
361.7 1.3 278.6 2.8
Foreign exchange forward contractsThe group entered into over-the-counter foreign exchange forward agreements in order to economically hedge the foreign currency exposure resulting from transactions and balances held in currencies that are different to the functional currency of the group.
Bond futures positionsThe group entered in bond futures transactions for the purpose of efficiently managing the term structure of its interest rate exposures. A negative gross contract amount represents a notional short position that generates positive fair value as interest rates rise.
18 Insurance receivables2017
$m2016
$m
Insurance receivables 918.0 794.7918.0 794.7
These are receivables within one year and relate to business transacted with brokers and intermediaries. All insurance receivables are classified as loans and receivables and their carrying values approximate fair value at the reporting date.
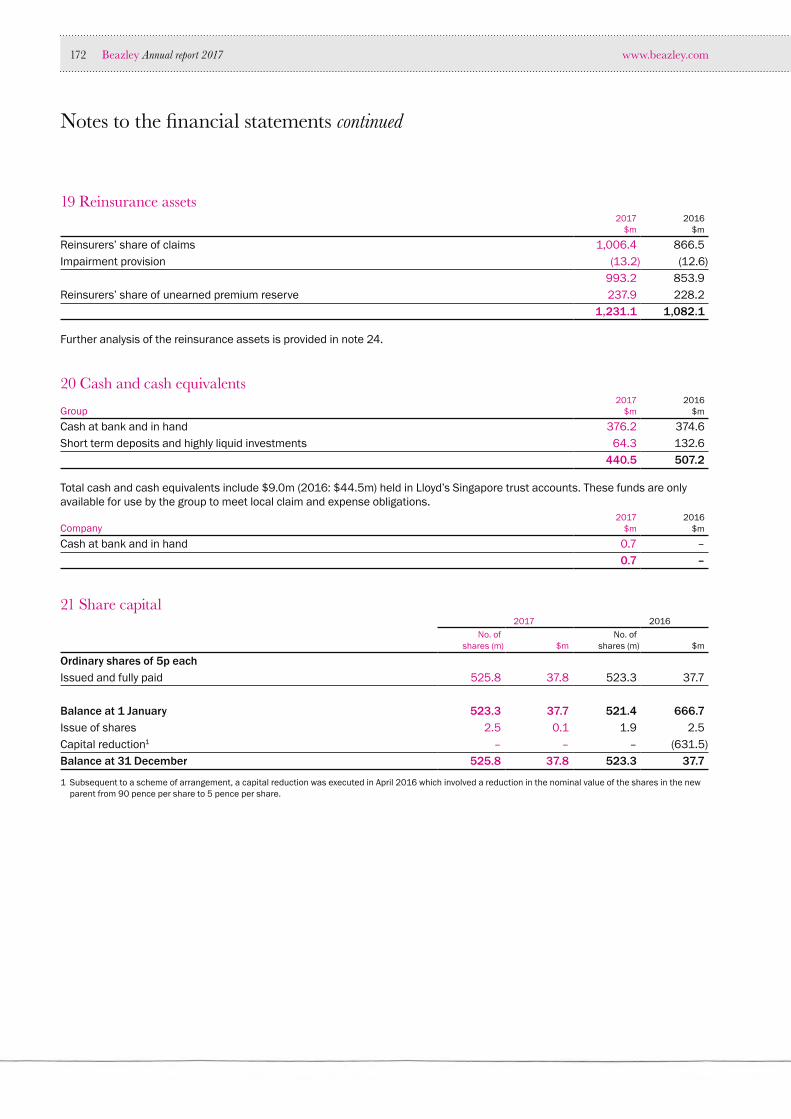
www.beazley.com172 Beazley Annual report 2017
Notes to the financial statements continued
19 Reinsurance assets2017
$m2016
$m
Reinsurers’ share of claims 1,006.4 866.5Impairment provision (13.2) (12.6)
993.2 853.9Reinsurers’ share of unearned premium reserve 237.9 228.2
1,231.1 1,082.1
Further analysis of the reinsurance assets is provided in note 24.
20 Cash and cash equivalents
Group2017
$m2016
$m
Cash at bank and in hand 376.2 374.6Short term deposits and highly liquid investments 64.3 132.6
440.5 507.2
Total cash and cash equivalents include $9.0m (2016: $44.5m) held in Lloyd’s Singapore trust accounts. These funds are only available for use by the group to meet local claim and expense obligations.
Company2017
$m2016
$m
Cash at bank and in hand 0.7 –0.7 –
21 Share capital2017 2016
No. of shares (m) $m
No. of shares (m) $m
Ordinary shares of 5p each
Issued and fully paid 525.8 37.8 523.3 37.7
Balance at 1 January 523.3 37.7 521.4 666.7Issue of shares 2.5 0.1 1.9 2.5Capital reduction1 – – – (631.5)Balance at 31 December 525.8 37.8 523.3 37.7
1 Subsequent to a scheme of arrangement, a capital reduction was executed in April 2016 which involved a reduction in the nominal value of the shares in the new parent from 90 pence per share to 5 pence per share.

Financial statements
www.beazley.com Annual report 2017 Beazley 173
22 Other reservesEmployee
share options reserve
$m
Employee share trust
reserve$m
Total$m
GroupBalance at 1 January 2016 36.5 (29.8) 6.7Share based payments 26.0 – 26.0Acquisition of own shares held in trust – (9.7) (9.7)Transfer of shares to employees (17.5) 17.9 0.4Balance at 31 December 2016 45.0 (21.6) 23.4
Share based payments 24.5 – 24.5Acquisition of own shares held in trust – (16.2) (16.2)Tax on share option vestings 4.3 – 4.3Transfer of shares to employees (24.4) 20.4 (4.0)Balance at 31 December 2017 49.4 (17.4) 32.0
Employee share options
reserve$m
Employee share trust
reserve$m
Total$m
CompanyBalance at 1 January 2016 – – –Share based payments 22.5 – 22.5Acquisition of own shares held in trust – (4.6) (4.6)Transfer of shares to employees (2.7) 4.7 2.0Balance at 31 December 2016 19.8 0.1 19.9
Share based payments 24.5 – 24.5Acquisition of own shares held in trust – (16.2) (16.2)Transfer of shares to employees (24.4) 20.4 (4.0)Balance at 31 December 2017 19.9 4.3 24.2
The merger reserve is now shown within the statement of changes in equity as a separate category and as such has been excluded from the other reserves note.
The employee share options reserve is held in accordance with IFRS 2: Share-based payment. For more information refer to note 23.2.
More information on the employee share trust reserve is included in note 23.

www.beazley.com174 Beazley Annual report 2017
Notes to the financial statements continued
23 Equity compensation plans23.1 Employee share trust
2017 2016Number (m) $m Number (m) $m
Costs debited to employee share trust reserveBalance at 1 January 6.1 21.6 9.7 29.8Additions 3.0 16.2 2.0 9.7Transfer of shares to employees (5.3) (20.4) (5.6) (17.9)Balance at 31 December 3.8 17.4 6.1 21.6
The shares are owned by the employee share trust to satisfy awards under the group’s deferred share plan, retention plan, marine share incentive plan (MSIP) and long term incentive plan (LTIP). These shares are purchased on the market and carried at cost.
On the third anniversary of an award the shares under the deferred share plan are transferred from the trust to the employee. Under the retention plan, on the third anniversary, and each year after that up to the sixth anniversary, 25.0% of the shares awarded are transferred to the employee.
The deferred share plan is recognised in the statement of profit or loss on a straight-line basis over a period of three years, while the retention share plan is recognised in the statement of profit or loss on a straight-line basis over a period of six years.
23.2 Employee share option plansThe group has a long term incentive plan (LTIP), marine share incentive plan (MSIP), deferred share plan, retention plan and SAYE plan that entitle employees to purchase shares in the group.
The terms and conditions of the grants are as follows:
Share option plan Grant dateNo. of options
(m) Vesting conditionsContractual life
of options
MSIP 04/04/2013 0.5 Five years’ service + ROE 10 yearsLTIP 17/02/2017
09/02/201610/02/201511/02/201413/02/2013
1.92.12.11.61.8
Five years’ service + NAV + minimum shareholding requirement
10 years
LTIP 17/02/201709/02/201610/02/2015
1.92.12.1
Three years’ service + NAV + minimum shareholding requirement
10 years
SAYE (UK) 13/04/201709/05/201607/05/2015
0.70.50.5
Three years’ service N/A
SAYE (US) 01/06/201701/06/2016
0.10.1
Two years’ service N/A
Total share options outstanding 18.0
Vesting conditionsIn summary the vesting conditions are defined as:• two years’ service – an employee has to remain in employment until the second anniversary from the grant date;• three years’ service – an employee has to remain in employment until the third anniversary from the grant date;• ROE – return on equity, based on the average marine divisional pre-tax return on equity (ROE) over the performance period; and• NAV – the NAV growth, after adjusting for the effect of dividends, is greater than the risk-free rate of return plus a premium per year.
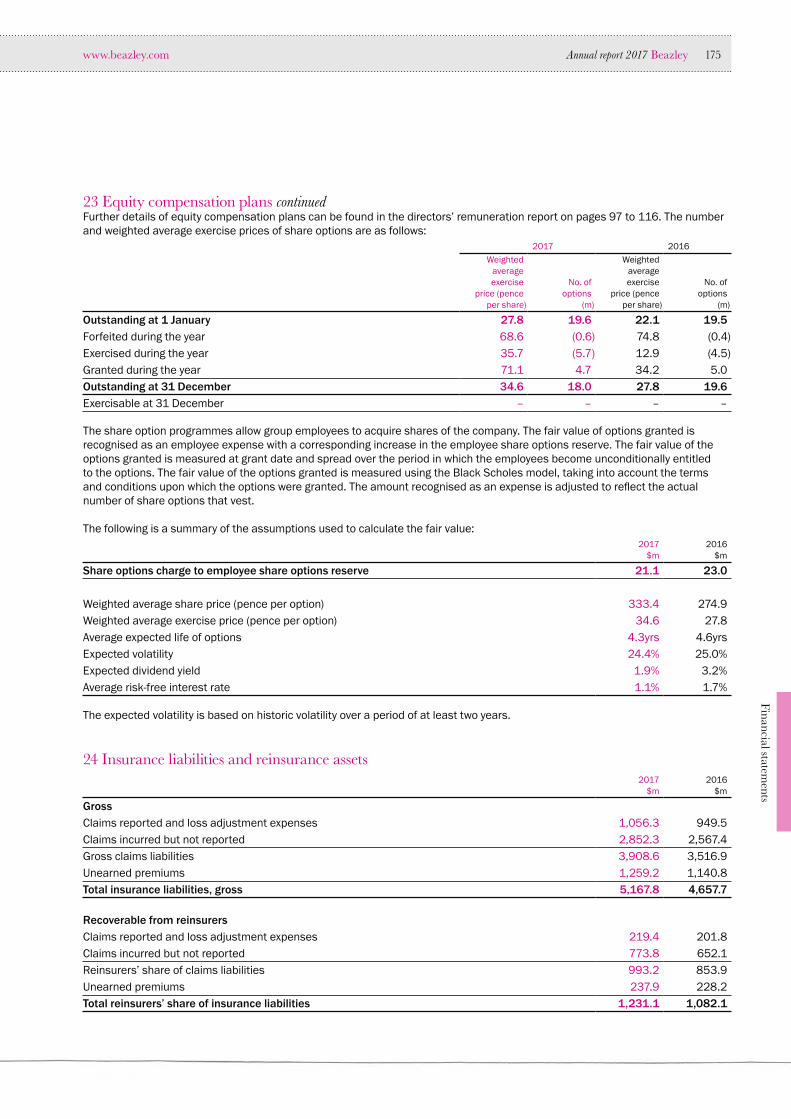
Financial statements
www.beazley.com Annual report 2017 Beazley 175
23 Equity compensation plans continuedFurther details of equity compensation plans can be found in the directors’ remuneration report on pages 97 to 116. The number and weighted average exercise prices of share options are as follows:
2017 2016Weighted
average exercise
price (pence per share)
No. of options
(m)
Weighted average exercise
price (pence per share)
No. of options
(m)
Outstanding at 1 January 27.8 19.6 22.1 19.5Forfeited during the year 68.6 (0.6) 74.8 (0.4)Exercised during the year 35.7 (5.7) 12.9 (4.5)Granted during the year 71.1 4.7 34.2 5.0Outstanding at 31 December 34.6 18.0 27.8 19.6Exercisable at 31 December – – – –
The share option programmes allow group employees to acquire shares of the company. The fair value of options granted is recognised as an employee expense with a corresponding increase in the employee share options reserve. The fair value of the options granted is measured at grant date and spread over the period in which the employees become unconditionally entitled to the options. The fair value of the options granted is measured using the Black Scholes model, taking into account the terms and conditions upon which the options were granted. The amount recognised as an expense is adjusted to reflect the actual number of share options that vest.
The following is a summary of the assumptions used to calculate the fair value:2017
$m2016
$m
Share options charge to employee share options reserve 21.1 23.0
Weighted average share price (pence per option) 333.4 274.9Weighted average exercise price (pence per option) 34.6 27.8Average expected life of options 4.3yrs 4.6yrsExpected volatility 24.4% 25.0%Expected dividend yield 1.9% 3.2%Average risk-free interest rate 1.1% 1.7%
The expected volatility is based on historic volatility over a period of at least two years.
24 Insurance liabilities and reinsurance assets2017
$m2016
$m
GrossClaims reported and loss adjustment expenses 1,056.3 949.5Claims incurred but not reported 2,852.3 2,567.4Gross claims liabilities 3,908.6 3,516.9Unearned premiums 1,259.2 1,140.8Total insurance liabilities, gross 5,167.8 4,657.7
Recoverable from reinsurersClaims reported and loss adjustment expenses 219.4 201.8Claims incurred but not reported 773.8 652.1Reinsurers’ share of claims liabilities 993.2 853.9Unearned premiums 237.9 228.2Total reinsurers’ share of insurance liabilities 1,231.1 1,082.1

www.beazley.com176 Beazley Annual report 2017
Notes to the financial statements continued
24 Insurance liabilities and reinsurance assets continued2017
$m2016
$m
NetClaims reported and loss adjustment expenses 836.9 747.7Claims incurred but not reported 2,078.5 1,915.3Net claims liabilities 2,915.4 2,663.0Unearned premiums 1,021.3 912.6Total insurance liabilities, net 3,936.7 3,575.6
The gross claims reported, the loss adjustment liabilities and the liabilities for claims incurred but not reported are net of recoveries from salvage and subrogation.
During the year the claims incurred but not reported (IBNR) estimate calculation was amended to bring our calculations in line with new guidance received from Lloyd’s. This change in estimation has no impact to profit and loss and a movement on the statement of financial position of $45.9m between insurance receivables and technical provisions, and $5.0m between insurance liabilities and reinsurance assets.
24.1 Movements in insurance liabilities and reinsurance assetsa) Claims and loss adjustment expenses
2017 2016Gross
$mReinsurance
$mNet$m
Gross$m
Reinsurance$m
Net$m
Claims reported and loss adjustment expenses 949.5 (201.8) 747.7 937.5 (210.3) 727.2Claims incurred but not reported 2,567.4 (652.1) 1,915.3 2,588.4 (658.1) 1,930.3Balance at 1 January 3,516.9 (853.9) 2,663.0 3,525.9 (868.4) 2,657.5
Claims paid (1,028.2) 179.1 (849.1) (989.5) 177.5 (812.0)
Increase in claims – Arising from current year claims 1,737.4 (457.8) 1,279.6 1,314.0 (277.7) 1,036.3– Arising from prior year claims (349.4) 145.5 (203.9) (286.4) 105.7 (180.7)Net exchange differences 31.9 (6.1) 25.8 (47.1) 9.0 (38.1)Balance at 31 December 3,908.6 (993.2) 2,915.4 3,516.9 (853.9) 2,663.0
Claims reported and loss adjustment expenses 1,056.3 (219.4) 836.9 949.5 (201.8) 747.7Claims incurred but not reported 2,852.3 (773.8) 2,078.5 2,567.4 (652.1) 1,915.3Balance at 31 December 3,908.6 (993.2) 2,915.4 3,516.9 (853.9) 2,663.0
b) Unearned premiums reserve2017 2016
Gross$m
Reinsurance$m
Net$m
Gross$m
Reinsurance$m
Net$m
Balance at 1 January 1,140.8 (228.2) 912.6 1,060.8 (231.3) 829.5Increase in the year 2,343.8 (375.4) 1,968.4 2,195.6 (348.5) 1,847.1Release in the year (2,225.4) 365.7 (1,859.7) (2,115.6) 351.6 (1,764.0)Balance at 31 December 1,259.2 (237.9) 1,021.3 1,140.8 (228.2) 912.6

Financial statements
www.beazley.com Annual report 2017 Beazley 177
24 Insurance liabilities and reinsurance assets continued24.2 Assumptions, changes in assumptions and claims reserve strength analysisa) Process used to decide on assumptionsThe peer review reserving processBeazley uses a quarterly dual track process to set its reserves:• the actuarial team uses several actuarial and statistical methods to estimate the ultimate premium and claims costs, with
the most appropriate methods selected depending on the nature of each class of business; and• the underwriting teams concurrently review the development of the incurred loss ratio over time, work with our claims
managers to set reserve estimates for identified claims and utilise their detailed understanding of both risks underwritten and the nature of the claims to establish an alternative estimate of ultimate claims cost, which is compared to the actuarially established figures.
A formal internal peer review process is then undertaken to determine the reserves held for accounting purposes which, in totality, are not lower than the actuarially established figure. The group also commissions an annual independent review to ensure that the reserves established are reasonable or within a reasonable range.
The group has a consistent reserving philosophy, with initial reserves being set to include risk margins which may be released over time as uncertainty reduces.
Actuarial assumptionsChain-ladder techniques are applied to premiums, paid claims and incurred claims (i.e. paid claims plus case estimates). The basic technique involves the analysis of historical claims development factors and the selection of estimated development factors based on historical patterns. The selected development factors are then applied to cumulative claims data for each underwriting year that is not yet fully developed to produce an estimated ultimate claims cost for each underwriting year.
Chain-ladder techniques are most appropriate for classes of business that have a relatively stable development pattern. Chain-ladder techniques are less suitable in cases in which the insurer does not have a developed claims history for a particular class of business or for underwriting years that are still at immature stages of development where there is a higher level of assumption volatility.
The Bornhuetter-Ferguson method uses a combination of a benchmark/market-based estimate and an estimate based on claims experience. The former is based on a measure of exposure such as premiums; the latter is based on the paid or incurred claims observed to date. The two estimates are combined using a formula that gives more weight to the experience-based estimate as time passes. This technique has been used in situations where developed claims experience was not available for the projection (e.g. recent underwriting years or new classes of business).
The expected loss ratio method uses a benchmark/market-based estimate applied to the expected premium and is used for classes with little or no relevant historical data.
The choice of selected results for each underwriting year of each class of business depends on an assessment of the technique that has been most appropriate to observed historical developments. In certain instances, this has meant that different techniques or combinations of techniques have been selected for individual underwriting years or groups of underwriting years within the same class of business. As such, there are many assumptions used to estimate general insurance liabilities.
We also review triangulations of the paid/outstanding claim ratios as a way of monitoring any changes in the strength of the outstanding claim estimates between underwriting years so that adjustments can be made to mitigate any subsequent over/(under)reserving. To date, this analysis indicates no systematic change to the outstanding claim strength across underwriting years.
Where significant large losses impact an underwriting year (e.g. the events of 11 September 2001, the hurricanes in 2004, 2005, 2008, 2012 and 2017 or the earthquakes in 2010, 2011 and 2017), the development is usually very different from the attritional losses. In these situations, the large loss total is extracted from the remainder of the data and analysed separately by the respective claims managers using exposure analysis of the policies in force in the areas affected.
Further assumptions are required to convert gross of reinsurance estimates of ultimate claims cost to a net of reinsurance level and to establish reserves for unallocated claims handling expenses and reinsurance bad debt.
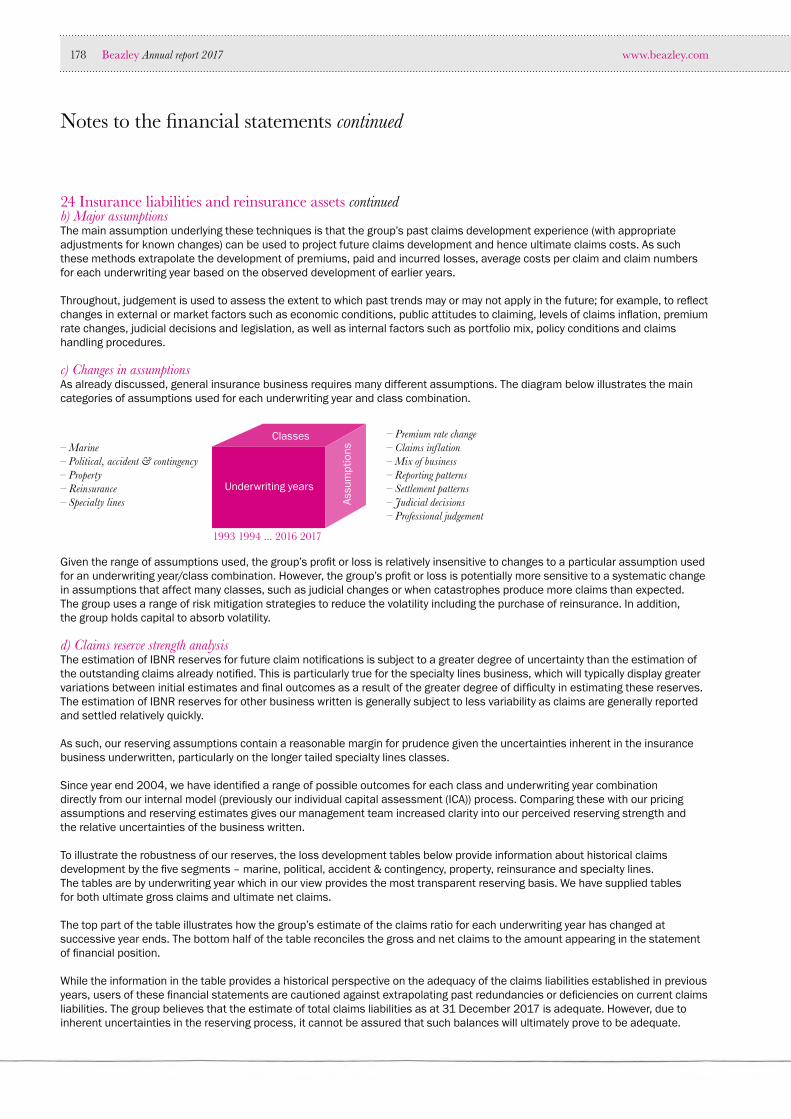
www.beazley.com178 Beazley Annual report 2017
Notes to the financial statements continued
24 Insurance liabilities and reinsurance assets continued b) Major assumptionsThe main assumption underlying these techniques is that the group’s past claims development experience (with appropriate adjustments for known changes) can be used to project future claims development and hence ultimate claims costs. As such these methods extrapolate the development of premiums, paid and incurred losses, average costs per claim and claim numbers for each underwriting year based on the observed development of earlier years.
Throughout, judgement is used to assess the extent to which past trends may or may not apply in the future; for example, to reflect changes in external or market factors such as economic conditions, public attitudes to claiming, levels of claims inflation, premium rate changes, judicial decisions and legislation, as well as internal factors such as portfolio mix, policy conditions and claims handling procedures.
c) Changes in assumptions As already discussed, general insurance business requires many different assumptions. The diagram below illustrates the main categories of assumptions used for each underwriting year and class combination.
– Premium rate change– Claims inflation– Mix of business– Reporting patterns– Settlement patterns– Judicial decisions– Professional judgement
– Marine– Political, accident & contingency– Property– Reinsurance– Specialty lines
Underwriting years
Classes
1993 1994 ... 2016 2017
Assu
mpt
ions
Given the range of assumptions used, the group’s profit or loss is relatively insensitive to changes to a particular assumption used for an underwriting year/class combination. However, the group’s profit or loss is potentially more sensitive to a systematic change in assumptions that affect many classes, such as judicial changes or when catastrophes produce more claims than expected. The group uses a range of risk mitigation strategies to reduce the volatility including the purchase of reinsurance. In addition, the group holds capital to absorb volatility.
d) Claims reserve strength analysisThe estimation of IBNR reserves for future claim notifications is subject to a greater degree of uncertainty than the estimation of the outstanding claims already notified. This is particularly true for the specialty lines business, which will typically display greater variations between initial estimates and final outcomes as a result of the greater degree of difficulty in estimating these reserves. The estimation of IBNR reserves for other business written is generally subject to less variability as claims are generally reported and settled relatively quickly.
As such, our reserving assumptions contain a reasonable margin for prudence given the uncertainties inherent in the insurance business underwritten, particularly on the longer tailed specialty lines classes.
Since year end 2004, we have identified a range of possible outcomes for each class and underwriting year combination directly from our internal model (previously our individual capital assessment (ICA)) process. Comparing these with our pricing assumptions and reserving estimates gives our management team increased clarity into our perceived reserving strength and the relative uncertainties of the business written.
To illustrate the robustness of our reserves, the loss development tables below provide information about historical claims development by the five segments – marine, political, accident & contingency, property, reinsurance and specialty lines. The tables are by underwriting year which in our view provides the most transparent reserving basis. We have supplied tables for both ultimate gross claims and ultimate net claims.
The top part of the table illustrates how the group’s estimate of the claims ratio for each underwriting year has changed at successive year ends. The bottom half of the table reconciles the gross and net claims to the amount appearing in the statement of financial position.
While the information in the table provides a historical perspective on the adequacy of the claims liabilities established in previous years, users of these financial statements are cautioned against extrapolating past redundancies or deficiencies on current claims liabilities. The group believes that the estimate of total claims liabilities as at 31 December 2017 is adequate. However, due to inherent uncertainties in the reserving process, it cannot be assured that such balances will ultimately prove to be adequate.

Financial statements
www.beazley.com Annual report 2017 Beazley 179
24 Insurance liabilities and reinsurance assets continued
Gross ultimate claims2007 ae
%2008
%2009
%2010
%2011
%2012
%2013
%2014
%2015
%2016
%2017
%
Marine12 months 69.3 54.5 50.5 54.7 55.9 56.6 57.6 56.7 59.5 68.024 months 65.5 51.0 49.7 47.4 46.3 52.0 46.9 54.0 70.236 months 59.3 44.3 44.0 39.1 34.7 44.5 47.2 47.448 months 63.2 40.7 42.3 33.8 32.1 42.8 46.760 months 62.8 40.5 40.4 35.4 31.4 42.272 months 59.1 48.8 40.2 31.8 30.684 months 55.4 47.9 42.2 31.096 months 54.7 49.2 40.8108 months 51.8 49.1120 months 58.5Political, accident & contingency12 months 57.4 58.3 57.7 57.5 60.0 59.2 59.3 59.8 61.3 58.024 months 71.1 43.4 44.8 44.4 54.4 49.7 51.2 58.8 54.336 months 75.3 38.1 39.0 44.3 51.4 45.2 46.9 56.948 months 88.9 33.9 32.6 39.5 49.1 44.3 50.260 months 73.5 29.5 31.6 37.8 46.0 46.372 months 62.3 25.1 30.4 35.7 45.384 months 58.9 25.3 29.5 35.296 months 59.6 25.3 29.7108 months 58.7 25.5120 months 57.9Property12 months 70.6 53.7 57.9 58.4 55.5 55.2 53.2 55.0 59.0 72.424 months 65.3 41.7 60.6 50.6 47.6 49.2 47.8 49.1 68.536 months 64.3 36.5 58.6 48.1 39.9 45.8 41.4 46.048 months 62.2 35.4 55.9 46.3 36.8 45.8 40.760 months 60.6 34.3 53.2 45.4 36.2 45.772 months 59.5 33.4 52.2 44.2 35.784 months 58.4 32.8 51.3 43.796 months 57.8 32.3 51.1108 months 57.5 32.2120 months 57.3
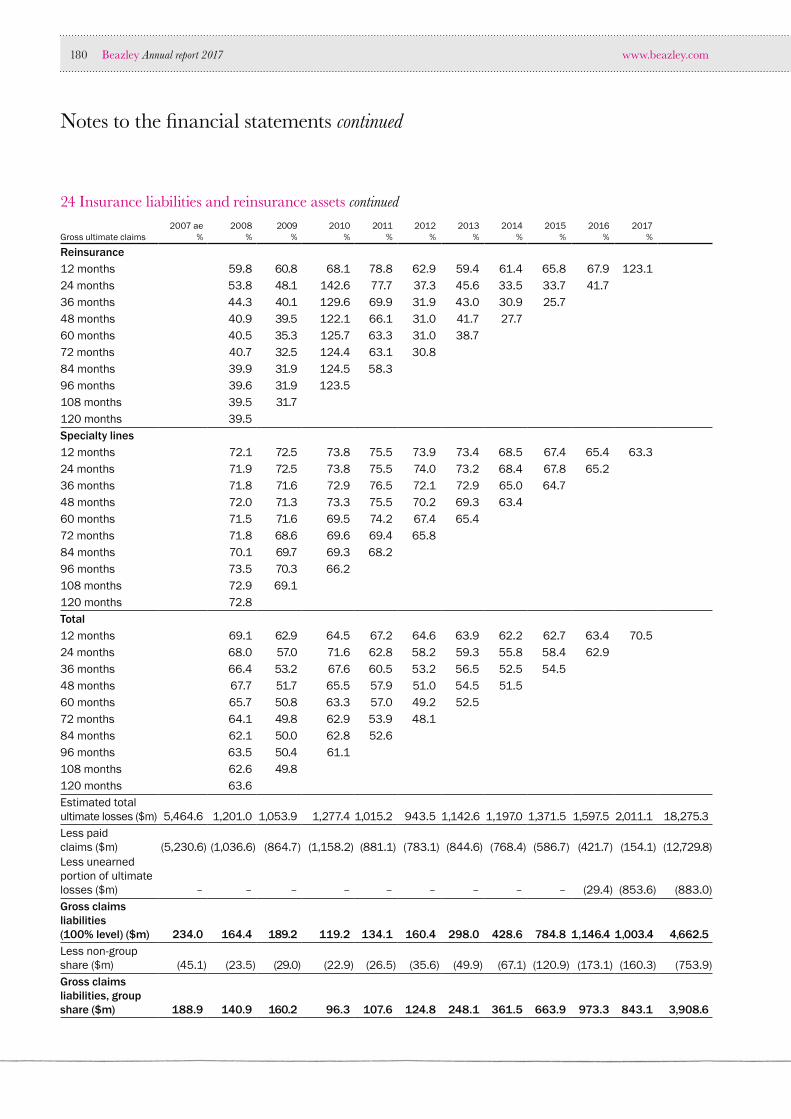
www.beazley.com180 Beazley Annual report 2017
Notes to the financial statements continued
Gross ultimate claims2007 ae
%2008
%2009
%2010
%2011
%2012
%2013
%2014
%2015
%2016
%2017
%
Reinsurance12 months 59.8 60.8 68.1 78.8 62.9 59.4 61.4 65.8 67.9 123.124 months 53.8 48.1 142.6 77.7 37.3 45.6 33.5 33.7 41.736 months 44.3 40.1 129.6 69.9 31.9 43.0 30.9 25.748 months 40.9 39.5 122.1 66.1 31.0 41.7 27.760 months 40.5 35.3 125.7 63.3 31.0 38.772 months 40.7 32.5 124.4 63.1 30.884 months 39.9 31.9 124.5 58.396 months 39.6 31.9 123.5108 months 39.5 31.7120 months 39.5Specialty lines12 months 72.1 72.5 73.8 75.5 73.9 73.4 68.5 67.4 65.4 63.324 months 71.9 72.5 73.8 75.5 74.0 73.2 68.4 67.8 65.236 months 71.8 71.6 72.9 76.5 72.1 72.9 65.0 64.748 months 72.0 71.3 73.3 75.5 70.2 69.3 63.460 months 71.5 71.6 69.5 74.2 67.4 65.472 months 71.8 68.6 69.6 69.4 65.884 months 70.1 69.7 69.3 68.296 months 73.5 70.3 66.2108 months 72.9 69.1120 months 72.8Total12 months 69.1 62.9 64.5 67.2 64.6 63.9 62.2 62.7 63.4 70.524 months 68.0 57.0 71.6 62.8 58.2 59.3 55.8 58.4 62.936 months 66.4 53.2 67.6 60.5 53.2 56.5 52.5 54.548 months 67.7 51.7 65.5 57.9 51.0 54.5 51.560 months 65.7 50.8 63.3 57.0 49.2 52.572 months 64.1 49.8 62.9 53.9 48.184 months 62.1 50.0 62.8 52.696 months 63.5 50.4 61.1108 months 62.6 49.8120 months 63.6Estimated total ultimate losses ($m) 5,464.6 1,201.0 1,053.9 1,277.4 1,015.2 943.5 1,142.6 1,197.0 1,371.5 1,597.5 2,011.1 18,275.3Less paid claims ($m) (5,230.6) (1,036.6) (864.7) (1,158.2) (881.1) (783.1) (844.6) (768.4) (586.7) (421.7) (154.1) (12,729.8)Less unearned portion of ultimate losses ($m) – – – – – – – – – (29.4) (853.6) (883.0)Gross claims liabilities (100% level) ($m) 234.0 164.4 189.2 119.2 134.1 160.4 298.0 428.6 784.8 1,146.4 1,003.4 4,662.5Less non-group share ($m) (45.1) (23.5) (29.0) (22.9) (26.5) (35.6) (49.9) (67.1) (120.9) (173.1) (160.3) (753.9)Gross claims liabilities, group share ($m) 188.9 140.9 160.2 96.3 107.6 124.8 248.1 361.5 663.9 973.3 843.1 3,908.6
24 Insurance liabilities and reinsurance assets continued

Financial statements
www.beazley.com Annual report 2017 Beazley 181
Net ultimate claims2007 ae
%2008
%2009
%2010
%2011
%2012
%2013
%2014
%2015
%2016
%2017
%
Marine 12 months 61.3 53.4 52.1 55.6 55.4 56.2 56.5 56.7 56.7 57.624 months 56.9 47.7 49.2 47.6 46.0 53.2 48.6 52.5 62.536 months 50.6 38.9 44.7 38.7 37.4 47.6 46.6 47.248 months 47.4 35.2 42.6 34.5 35.0 46.0 45.760 months 46.9 34.9 41.1 35.6 33.9 45.472 months 46.3 38.6 40.2 32.3 33.284 months 45.1 37.9 42.4 31.496 months 44.6 37.2 40.8108 months 45.0 37.0120 months 48.1Political, accident & contingency12 months 55.8 56.3 54.4 54.9 58.6 58.7 57.0 57.5 60.2 56.924 months 78.9 41.4 43.7 45.0 52.4 51.2 49.8 56.1 53.236 months 78.1 36.6 39.6 45.5 49.9 47.7 44.9 55.148 months 81.3 33.8 33.4 42.3 46.9 45.1 49.860 months 70.5 29.8 32.5 40.3 43.8 45.672 months 59.8 26.3 31.3 38.2 42.984 months 56.2 26.4 29.8 37.796 months 56.6 26.4 30.4108 months 56.2 26.6120 months 55.4Property12 months 67.0 53.4 58.8 60.3 58.6 56.7 54.5 55.0 57.7 76.324 months 66.8 47.5 65.2 57.7 53.0 56.3 51.2 50.3 69.636 months 64.7 43.9 65.8 53.7 46.0 52.3 44.3 46.948 months 63.6 41.7 59.8 50.4 41.3 50.2 42.960 months 62.5 41.1 57.7 49.1 40.7 49.972 months 61.1 39.8 56.7 48.0 40.284 months 60.4 39.3 56.2 47.796 months 59.4 39.0 55.9108 months 59.2 38.9120 months 59.0
24 Insurance liabilities and reinsurance assets continued

www.beazley.com182 Beazley Annual report 2017
Notes to the financial statements continued
Net ultimate claims2007 ae
%2008
%2009
%2010
%2011
%2012
%2013
%2014
%2015
%2016
%2017
%
Reinsurance12 months 68.4 55.5 76.8 89.3 67.0 57.4 58.7 61.4 61.2 105.724 months 60.6 52.7 126.8 87.9 45.1 52.2 37.2 34.1 38.936 months 50.5 46.9 117.6 80.5 38.8 48.7 33.4 24.248 months 48.3 46.1 111.7 74.9 37.4 47.4 30.660 months 47.7 41.3 120.8 72.7 37.4 43.872 months 48.0 38.0 115.9 72.6 37.084 months 46.8 37.2 116.0 67.396 months 46.5 37.2 115.4108 months 46.5 37.0120 months 46.5Specialty lines12 months 70.1 69.6 71.0 72.5 71.1 69.5 66.0 63.6 63.0 61.624 months 70.0 69.4 71.1 72.5 70.6 69.0 66.0 63.9 62.836 months 69.9 68.8 70.5 71.8 68.7 68.5 63.6 60.848 months 68.6 65.8 69.5 69.6 65.8 63.6 60.360 months 67.9 65.8 68.9 70.2 63.9 59.772 months 67.8 64.9 69.0 68.9 63.284 months 67.8 65.5 68.8 67.996 months 70.0 65.5 66.4108 months 69.8 64.7120 months 69.1Total12 months 66.7 60.6 64.2 67.0 64.0 62.3 60.6 60.1 60.9 66.224 months 67.0 56.5 68.6 63.6 58.3 60.2 56.0 56.5 61.036 months 64.5 52.9 66.3 60.2 53.7 57.4 52.5 52.848 months 63.4 50.4 63.2 57.1 50.7 54.3 50.960 months 61.8 49.4 63.1 56.8 49.3 52.272 months 60.6 48.7 62.1 55.2 48.684 months 59.8 48.6 62.1 54.096 months 60.6 48.4 60.8108 months 60.5 48.0120 months 60.6Estimated total ultimate losses ($m) 3,620.3 936.5 780.1 1,045.8 862.0 827.3 963.4 1,000.3 1,094.7 1,295.6 1,599.2 14,025.2Less paid claims ($m) (3,468.2) (831.6) (678.8) (947.6) (749.3) (682.8) (723.4) (661.0) (505.0) (388.3) (132.6) (9,768.6)Less unearned portion of ultimate losses ($m) – – – – – – – – – (24.1) (758.9) (783.0)Net claims liabilities (100% level) ($m) 152.1 104.9 101.3 98.2 112.7 144.5 240.0 339.3 589.7 883.2 707.7 3,473.6Less non-group share ($m) (28.7) (16.0) (16.8) (18.7) (20.8) (27.5) (39.9) (53.8) (91.5) (132.5) (112.0) (558.2)Net claims liabilities, group share ($m) 123.4 88.9 84.5 79.5 91.9 117.0 200.1 285.5 498.2 750.7 595.7 2,915.4
24 Insurance liabilities and reinsurance assets continued

Financial statements
www.beazley.com Annual report 2017 Beazley 183
24 Insurance liabilities and reinsurance assets continued Analysis of movements in loss development tablesWe have updated our loss development tables to show the ultimate loss ratios as at 31 December 2017 for each underwriting year.
MarineThere was deterioration in the energy book in 2008 in respect of a specific claim. The 2009 to 2015 underwriting years have delivered releases, but at lower levels than in recent years due to an increase in claim activity. The recent catastrophe events have led to the deterioration of the 2016 underwriting year, and resulted in the 2017 underwriting year opening higher than previous years.
Political, accident & contingencyThe increases on the 2013 and 2014 underwriting years follow deterioration on specific underlying claims within the political book. This has been offset by reductions on the 2015 and 2016 underwriting years, mainly from the terrorism account. The 2017 underwriting year has opened lower than 2016, where the life, accident & health book has reduced exposure to underperforming accounts.
PropertyThe 2015 and prior years have delivered releases, but at lower levels than in recent years due to an increase in claim activity. There was deterioration in the property book in 2016, where claims experience was worse than anticipated. The 2017 underwriting year has opened higher than previous years reflecting the impact of the recent catastrophe events.
ReinsuranceThe 2016 and prior underwriting years have seen material releases driven by reductions in reserves for catastrophe claims and the release of catastrophe margins. The 2017 underwriting year has opened higher than previous years reflecting the impact of the recent catastrophe events.
Specialty linesStrong reserve releases on prior years from the traditional specialty lines business have been supplemented by releases from the 2014 and 2015 underwriting years of the cyber business, where the risk has expired. The 2017 underwriting year has opened lower than previous years, reflecting the improved experience emerging within the more recent underwriting years, particularly on the cyber book.

www.beazley.com184 Beazley Annual report 2017
Notes to the financial statements continued
24 Insurance liabilities and reinsurance assets continued Claim releasesThe table below analyses our net claims between current year claims and adjustments to prior year net claims reserves. These have been broken down by segment and underwriting year. Beazley’s reserving policy is to maintain catastrophe reserve margins either until the end of the exposure period or until catastrophe events occur. Therefore margins have been released from prior year reserves where risks have expired during 2017.
The net of reinsurance estimates of ultimate claims costs on the 2016 and prior underwriting years have improved to $203.9m during 2017 (2016: $180.7m). This movement arose from a combination of better than expected claims experience coupled with small changes to the many assumptions resulting from the observed experience.
The movements shown on 2014 and earlier are absolute claim movements and are not impacted by any current year movements in premium on those underwriting years.
2017Marine
$m
Political, accident &
contingency $m
Property$m
Reinsurance$m
Specialtylines
$mTotal
$m
Current year 135.4 100.1 264.8 152.2 627.1 1,279.6Prior year– 2014 underwriting year and earlier (5.8) 5.8 (6.3) (16.1) (91.1) (113.5)– 2015 underwriting year (9.3) (3.5) (9.1) (12.6) (30.5) (65.0)– 2016 underwriting year 4.4 (6.2) 2.2 (26.0) 0.2 (25.4)
(10.7) (3.9) (13.2) (54.7) (121.4) (203.9)Net insurance claims 124.7 96.2 251.6 97.5 505.7 1,075.7
2016Marine
$m
Political, accident &
contingency $m
Property$m
Reinsurance$m
Specialtylines
$mTotal
$m
Current year 114.8 127.0 152.0 72.5 570.0 1,036.3Prior year– 2013 underwriting year and earlier (7.0) (17.7) (11.6) – (52.0) (88.3)– 2014 underwriting year (4.1) (9.0) (18.4) (4.2) (17.0) (52.7)– 2015 underwriting year (4.8) (0.5) (6.8) (28.1) 0.5 (39.7)
(15.9) (27.2) (36.8) (32.3) (68.5) (180.7)Net insurance claims 98.9 99.8 115.2 40.2 501.5 855.6

Financial statements
www.beazley.com Annual report 2017 Beazley 185
25 BorrowingsThe carrying amount and fair values of the non-current borrowings are as follows:
Carrying value
Subordinated debt
$m
Tier 2subordinated
debt$m
Retail bond
$mTotal
$m
Balance at 1 January 2017 18.0 248.3 94.7 361.0Interest expensed 0.9 14.7 5.1 20.7Interest paid (0.9) (14.7) (5.1) (20.7)Amortisation of capitalised borrowing costs – 0.2 0.2 0.4Foreign exchange loss – – 4.6 4.6Balance at 31 December 2017 18.0 248.5 99.5 366.0
Fair value
Subordinated debt
$m
Tier 2 subordinated
debt$m
Retail bond
$mTotal
$m
Balance at 1 January 2017 18.0 253.3 100.8 372.1Change in fair value – 13.3 3.3 16.6Balance at 31 December 2017 18.0 266.6 104.1 388.7
The fair values of the subordinated debt, the tier 2 subordinated debt and the retail bond are based on quoted market prices.
In November 2004, the group issued subordinated debt of $18m to JPMorgan Chase Bank, N.A., JPMorgan. The loan is unsecured and interest is payable at the USD London interbank offered rate (LIBOR) plus a margin of 3.65% per annum. The subordinated notes are due in November 2034 and have been callable at the group’s option since 2009.
In September 2012, the group issued £75m of sterling denominated 5.375% notes due 2019. Interest at a fixed rate of 5.375% is payable in March and September each year.
In November 2016, the group issued $250m of subordinated tier 2 notes due in 2026. Annual interest, at a fixed rate of 5.875%, is payable in May and November each year.
In addition to these borrowings we operate a syndicated short term banking facility, managed through Lloyds Banking Group plc. In July 2017 we renewed our syndicated short term banking facility led by Lloyds Banking Group plc. The facility provides potential borrowings up to $225m. The agreement is based on a commitment fee of 0.385% per annum and any amounts drawn are charged at a margin of 1.1% per annum. The cash element of the facility will last for three years, expiring on 31 July 2019, whilst letters of credit issued under the facility can be used to provide support for the 2017, 2018 and 2019 underwriting years. The facility is currently unutilised.
26 Other payables
Group2017
$m2016
$m
Reinsurance premiums payable 182.8 177.8Accrued expenses including staff bonuses 165.7 148.0Other payables 100.1 100.4Deferred consideration payable on acquisition of MGAs 0.3 1.4Due to syndicate 6107 52.2 47.0Due to syndicate 6050 11.4 9.7
512.5 484.3
Company2017
$m2016
$m
Other payables 0.4 0.60.4 0.6
All other payables are payable within one year of the reporting date. The carrying value approximates fair values.

www.beazley.com186 Beazley Annual report 2017
Notes to the financial statements continued
27 Retirement benefit obligations2017
$m2016
$m
Present value of funded obligations 55.9 48.2Fair value of plan assets (53.6) (42.0)Retirement benefit liability in the statement of financial position 2.3 6.2
Amounts recognised in the statement of profit or lossInterest cost 1.4 1.4Expected return on plan assets (1.3) (1.4)
0.1 –
Beazley Furlonge Limited operates a defined benefit pension scheme (‘the Beazley Furlonge Limited Pension Scheme’). The scheme provides the following benefits:• an annual pension payable to the member from his or her normal pension age (60th birthday) of generally 1/60th of final
pensionable salary for each year of pensionable service up to 31 March 2006;• a spouse’s pension of 2/3rds of the member’s pension payable on the member’s death after retirement;• a lump sum of four times current pensionable salary for death in service at the date of death; and• a pension of 2/3rds of the member’s prospective pension at the date of death, payable to the spouse until their death.
This pension is related to salary at the date of death.
The scheme is administered by a trust that is legally separated from the group. The trustees consist of both employee and employer representatives and an independent chairman, all of whom are governed by the scheme rules.
The scheme exposes the group to additional actuarial, interest rate and market risk.
Contributions to the scheme are determined by a qualified actuary using the projected unit credit method as set out in the scheme rules and the most recent valuation was at 31 December 2017. According to the Schedule of Contributions, the group expects to contribute approximately $1.3m in each of the next two years.
2017$m
2016$m
Movement in present value of funded obligations recognised in the statement of financial positionBalance at 1 January 48.2 43.1Interest cost 1.4 1.4Actuarial gains 4.2 10.9Benefits paid (0.4) (0.3)Foreign exchange gain/(loss) 2.5 (6.9)Balance at 31 December 55.9 48.2
Movement in fair value of plan assets recognised in the statement of financial positionBalance at 1 January 42.0 42.4Expected return on plan assets 1.3 1.4Actuarial gains 4.2 3.7Employer contributions 4.4 1.6Benefits paid (0.4) (0.3)Foreign exchange gain/(loss) 2.1 (6.8)Balance at 31 December 53.6 42.0
Plan assets are comprised as follows:Equities 34.5 27.7Bonds 8.6 8.0Cash 3.4 –UCITS funds 7.1 6.3Total 53.6 42.0

Financial statements
www.beazley.com Annual report 2017 Beazley 187
27 Retirement benefit obligations continuedThe actual gain on plan assets was $5.5m (2016: $5.1m).
2017$m
2016$m
Principal actuarial assumptionsDiscount rate 2.4% 2.8%Inflation rate 3.4% 3.5%Expected return on plan assets 2.4% 2.8%Future salary increases 3.4% 3.5%Future pensions increases 3.3% 3.0%Life expectancy for members aged 60 at 31 December 90 years 90 yearsLife expectancy for members aged 40 at 31 December 93 years 92 years
At 31 December 2017, the weighted-average duration of the defined benefit obligation was 9.7 years (2016: 10.7 years).
Sensitivity analysesChanges in the relevant actuarial assumptions would result in a change in the value of the funded obligation as shown below:
31 December 2017Increase
$mDecrease
$m
Discount rate (0.5% decrease) 7.7 –Inflation rate (0.3% decrease) – (1.1)Future salary changes (0.5% decrease) – (0.7)Life expectancy (1 year increase) 2.0 –
31 December 2016Increase
$mDecrease
$m
Discount rate (0.5% decrease) 6.9 –Inflation rate (0.3% decrease) – (3.9)Future salary changes (0.5% decrease) – (0.3)Life expectancy (1 year increase) 1.4 –
28 Deferred tax2017
$m2016
$m
Deferred tax asset 6.9 11.0Deferred tax liability (9.9) (12.8)
(3.0) (1.8)
The movement in the net deferred income tax is as follows:Balance at 1 January (1.8) 1.1Income tax charge (3.2) (3.0)Amounts recorded through equity 2.2 1.5Foreign exchange translation differences (0.2) (1.4)Balance at 31 December (3.0) (1.8)
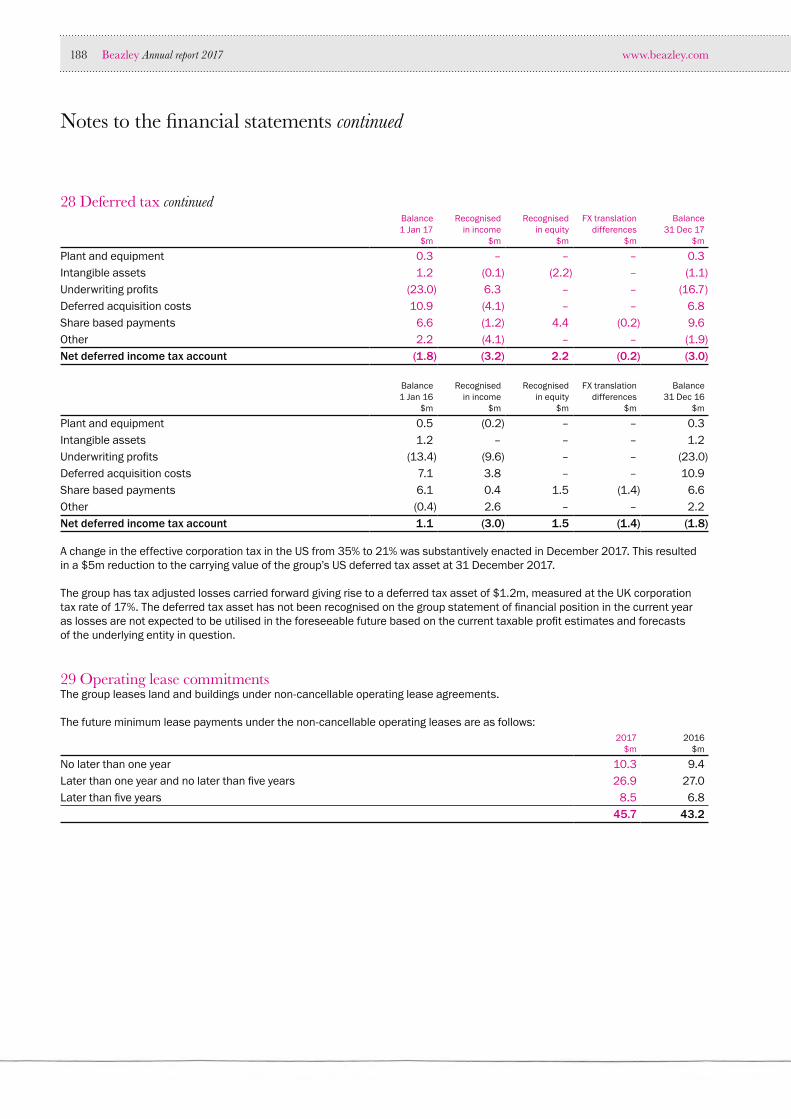
www.beazley.com188 Beazley Annual report 2017
Notes to the financial statements continued
28 Deferred tax continuedBalance1 Jan 17
$m
Recognised in income
$m
Recognised in equity
$m
FX translationdifferences
$m
Balance 31 Dec 17
$m
Plant and equipment 0.3 – – – 0.3Intangible assets 1.2 (0.1) (2.2) – (1.1)Underwriting profits (23.0) 6.3 – – (16.7)Deferred acquisition costs 10.9 (4.1) – – 6.8Share based payments 6.6 (1.2) 4.4 (0.2) 9.6Other 2.2 (4.1) – – (1.9)Net deferred income tax account (1.8) (3.2) 2.2 (0.2) (3.0)
Balance1 Jan 16
$m
Recognised in income
$m
Recognised in equity
$m
FX translationdifferences
$m
Balance 31 Dec 16
$m
Plant and equipment 0.5 (0.2) – – 0.3Intangible assets 1.2 – – – 1.2Underwriting profits (13.4) (9.6) – – (23.0)Deferred acquisition costs 7.1 3.8 – – 10.9Share based payments 6.1 0.4 1.5 (1.4) 6.6Other (0.4) 2.6 – – 2.2Net deferred income tax account 1.1 (3.0) 1.5 (1.4) (1.8)
A change in the effective corporation tax in the US from 35% to 21% was substantively enacted in December 2017. This resulted in a $5m reduction to the carrying value of the group’s US deferred tax asset at 31 December 2017.
The group has tax adjusted losses carried forward giving rise to a deferred tax asset of $1.2m, measured at the UK corporation tax rate of 17%. The deferred tax asset has not been recognised on the group statement of financial position in the current year as losses are not expected to be utilised in the foreseeable future based on the current taxable profit estimates and forecasts of the underlying entity in question.
29 Operating lease commitments The group leases land and buildings under non-cancellable operating lease agreements.
The future minimum lease payments under the non-cancellable operating leases are as follows:2017
$m2016
$m
No later than one year 10.3 9.4Later than one year and no later than five years 26.9 27.0Later than five years 8.5 6.8
45.7 43.2

Financial statements
www.beazley.com Annual report 2017 Beazley 189
30 Related party transactionsThe group and company have related party relationships with syndicates 623, 6107, 6050, its subsidiaries, associates and its directors.
30.1 Syndicates 623, 6107 and 6050The group received management fees and profit commissions for providing a range of management services to syndicates 623, 6107 and 6050, which are all managed by the group. In addition, the group ceded portions or all of a group of insurance policies to both syndicates 6107 and 6050. The participants on syndicates 623, 6107 and 6050 are solely third party capital.
Details of transactions entered into and the balances with these syndicates are as follows:2017
$m2016
$m
Written premium ceded to syndicates 66.1 57.3Other income received from syndicates 35.7 33.1Services provided 38.6 38.6
Balances due:Due from syndicate 623 30.6 4.7Due to syndicate 6107 (52.2) (47.0)Due to syndicate 6050 (11.4) (9.7)
30.2 Key management compensation2017
$m2016
$m
Salaries and other short term benefits 16.4 21.0Post-employment benefits 0.6 0.6Share based remuneration 9.8 12.7
26.8 34.3
Key management include executive and non-executive directors and other senior management.
The total number of Beazley plc ordinary shares held by key management was 8.1m. Apart from the transactions listed in the table above, there were no further related party transactions involving key management or a close member of their family. Further details of directors’ shareholdings and remuneration can be found in the directors’ remuneration report on pages 97 to 116.
30.3 Other related party transactionsAt 31 December 2017, the group had purchased services from the associate of $2.5m (2016: $2.5m) throughout the year. All transactions with the associate and subsidiaries are priced on an arm’s length basis. In 2017 the group sold its share in Equinox thus ceasing Equinox being a related party. Equinox repaid a loan of £1.5m and the interest accrued thereon up to the date of completion.

www.beazley.com190 Beazley Annual report 2017
Notes to the financial statements continued
31 Parent company and subsidiary undertakingsBeazley plc, a company incorporated in England and Wales and resident for tax purposes in the United Kingdom, is the ultimate parent and the ultimate controlling party within the group.
The following is a list of all the subsidiaries in the group as at 31 December 2017:
Country ofincorporation
Ownershipinterest Nature of business
Functionalcurrency
Beazley plc direct investment in
subsidiary ($m)
Beazley Ireland Holdings plc Jersey 100% Intermediate holding company USD 724.6Beazley Group Limited England 100% Intermediate holding company USDBeazley Furlonge Holdings Limited England 100% Intermediate holding company USDBeazley Furlonge Limited England 100% Lloyd’s underwriting agents GBPBeazley Investments Limited England 100% Investment company USDBeazley Underwriting Limited England 100% Underwriting at Lloyd’s USDBeazley Management Limited England 100% Intermediate management company GBPBeazley Staff Underwriting Limited England 100% Underwriting at Lloyd’s USDBeazley Solutions Limited England 100% Insurance services GBPBeazley Underwriting Services Limited England 100% Insurance services GBPBeazley DAS Limited1 England 100% Dividend access scheme GBPBeazley Corporate Member (No.2) Limited England 100% Underwriting at Lloyd’s USDBeazley Corporate Member (No.3) Limited England 100% Underwriting at Lloyd’s USDBeazley Corporate Member (No.4) Limited2 England 100% Underwriting at Lloyd’s USDBeazley Corporate Member (No.6) Limited England 100% Underwriting at Lloyd’s USDBeazley Leviathan Limited England 100% Underwriting at Lloyd’s GBPBeazley Canada Limited Canada 100% Insurance services CADBeazley Insurance dac Ireland 100% Insurance and reinsurance company USDBeazley Underwriting Pty Ltd Australia 100% Insurance services AUDBeazley USA Services, Inc.* USA 100% Insurance services USDBeazley Holdings, Inc.* USA 100% Holding company USDBeazley Group (USA) General Partnership** USA 100% General partnership USDBeazley Insurance Company, Inc.*** USA 100% Underwriting admitted lines USDLodestone Securities LLC**** USA 100% Consultancy services USDBeazley Limited Hong Kong 100% Insurance services HKDBeazley Middle East Limited3 UAE 100% Insurance services USDBeazley Pte. Limited Singapore 100% Underwriting at Lloyd’s SGD
724.6
1 Beazley DAS Limited is in the process of liquidation.2 Beazley Corporate Member (No.4) Limited was sold in January 2018.3 Beazley Middle East Limited was formally liquidated on 3 January 2018. * Please see page 191 for registered address.

Financial statements
www.beazley.com Annual report 2017 Beazley 191
31 Parent company and subsidiary undertakings continuedThe following is a list of group registered office locations:
Address City Postcode CountryUnited Kingdom and Continental Europe60 Great Tower Street London EC3R 5AD England2 Northwood Avenue Dublin D09 X5N9 Ireland22 Grenville Street Saint Helier JE4 8PX JerseyNorth America1209 Orange Street* Wilmington, Delaware 19801 USA2711 Centerville Road Suite 400** Wilmington, Delaware 19808 USA30 Batterson Park Road*** Farmington, Connecticut 06032 USA160 Greentree Drive, Suite 101**** Dover, Delaware 19904 USA55 University Avenue, Suite 550 Toronto, Ontario M5J 2HJ CanadaAsia138 Market Street, 03-04 Capita Green Singapore 048946 Singapore36/F., Tower Two, Times Square, 1 Matheson Street Causeway Bay – Hong KongAustraliaLevel 20, 133 Castlereagh Street Sydney NSW 2000 Australia
32 ContingenciesFunds at Lloyd’sThe following amounts are controlled by Lloyd’s to secure underwriting commitments:
Underwritingyear
2018£m
Underwritingyear
2017£m
Underwritingyear
2016 £m
Debt securities and other fixed income securities 733.2 656.9 447.6
The funds are held in trust and can be used to meet claims liabilities should syndicates’ members fail to meet their claims liabilities. The funds can only be used to meet claim liabilities of the relevant member.
These balances are included within financial assets at fair value on the statement of financial position.
33 Foreign exchange ratesThe group used the following exchange rates to translate foreign currency assets, liabilities, income and expenses into US dollars, being the group’s presentational currency:
2017 2016Average Year end spot Average Year end spot
Pound sterling 0.78 0.75 0.73 0.79Canadian dollar 1.30 1.29 1.34 1.31Euro 0.89 0.85 0.91 0.94

www.beazley.com192 Beazley Annual report 2017
Notes to the financial statements continued
34 Subsequent eventsThere are no other events that are material to the operations of the group that have occurred since the reporting date.
35 Business combinationsAcquisition of business portfolioIn January 2017 Beazley Furlonge Holdings Limited, an intermediate holding company within the group, set up a direct 100% subsidiary, 1104980 BC Limited, in Canada. The principal activity of 1104980 BC Limited was to act as an intermediate holding company within the group. This subsidiary acquired 100% of the share capital of a Canadian coverholder, Creechurch International Underwriters Limited (now Beazley Canada Limited), on 3 February 2017. In June 2017 1104980 BC Limited and Beazley Canada Limited amalgamated under the name of Beazley Canada Limited.
The acquisition secured a strategic platform for specialty lines and Beazley’s expansion in Canada. It also allowed us to write more business through increased line size and launching new specialist products through the acquiree’s distribution channels. The acquisition was achieved in one stage. The total amount of consideration paid was $33.8m. Total amount of consideration represents cash and no contingent consideration was offered. No material costs related to the acquisition were incurred by the group.
The acquisition had the following effect on the group’s assets and liabilities:
Net assets acquired
Carrying valueat acquisition
$m
Fair value adjustment
$m
Fair value on completion
$m
Intangible assets – renewal rights – 34.4 34.4Fixed assets 0.1 – 0.1Cash and cash equivalents 2.6 – 2.6Other receivables 0.3 – 0.3Other payables (1.0) – (1.0)Deferred tax liability – (2.6) (2.6)Value of net assets acquired 2.0 31.8 33.8Intangible assets – goodwill –Consideration paid 33.8
As per the recognition principle, we have identified separate intangible assets. These intangibles meet the separability criterion and represent renewal rights which comprise future profits relating to insurance contracts acquired and the expected renewal of those contracts. The fair value of renewal rights of $31.8m was derived from the profits (net of tax) expected to be earned from these contracts over a five year period, discounted using a weighted average cost of capital of 10.4%. Renewal rights are being amortised over a five year period, starting from February 2017. A related deferred tax liability has been recognised. No further fair value adjustments were made in relation to other assets and liabilities acquired.
The effect of the acquisition on the group’s revenue was $3.0m ($3.4m if the acquisition happened on 1 January 2017) and the effect on the group’s consolidated statement of profit or loss in the current period was a profit of $2.4m ($2.6m if the acquisition happened on 1 January 2017).

Financial statements
www.beazley.com Annual report 2017 Beazley 193
Glossary
Aggregates/aggregationsAccumulations of insurance loss exposures which result from underwriting multiple risks that are exposed to common causes of loss.
Aggregate excess of lossThe reinsurer indemnifies an insurance company (the reinsured) for an aggregate (or cumulative) amount of losses in excess of a specified aggregate amount.
Alternative performance measures (APMs)The group uses APMs to help explain its financial performance and position. These measures, such as combined ratio, expense ratio, claims ratio and investment return, are not defined under IFRS. The group is of the view that the use of these measures enhances the usefulness of the financial statements. Definitions of key APMs are included within the glossary.
A.M. BestA.M. Best is a worldwide insurance-rating and information agency whose ratings are recognised as an ideal benchmark for assessing the financial strength of insurance related organisations, following a rigorous quantitative and qualitative analysis of a company’s statement of financial position strength, operating performance and business profile.
Binding authorityA contracted agreement between a managing agent and a coverholder under which the coverholder is authorised to enter into contracts of insurance for the account of the members of the syndicate concerned, subject to specified terms and conditions.
CapacityThis is the maximum amount of premiums that can be accepted by a syndicate. Capacity also refers to the amount of insurance coverage allocated to a particular policyholder or in the marketplace in general.
Capital growth assetsThese are assets that do not pay a regular income and target an increase in value over the long term. They will typically have a higher risk and volatility than that of the core portfolio. Currently these are the hedge funds, equity funds and illiquid credit assets.
Catastrophe reinsuranceA form of excess of loss reinsurance which, subject to a specified limit, indemnifies the reinsured company for the amount of loss in excess of a specified retention with respect to an accumulation of losses resulting from a catastrophic event or series of events.
ClaimsDemand by an insured for indemnity under an insurance contract.
Claims ratioRatio, in percentage terms, of net insurance claims to net earned premiums. The calculation is performed excluding the impact of foreign exchange. In 2017, this ratio was 58% (2016: 48%). This represented total claims of $1,075.7m (2016: $855.6m) divided by net earned premiums of $1,869.4m (2016: $1,768.2m).
Combined ratioRatio, in percentage terms, of the sum of net insurance claims, expenses for acquisition of insurance contracts and administrative expenses to net earned premiums. This is also the sum of the expense ratio and the claims ratio. The calculation is performed excluding the impact of foreign exchange. In 2017, this ratio was 99% (2016: 89%). This represents the sum of net insurance claims of $1,075.7m (2016: $855.6m), expenses for acquisition of insurance contracts of $519.7m (2016: $472.5m) and administrative expenses of $254.7m (2016: $247.8m) to net earned premiums of $1,869.4m (2016: $1,768.2m). This is also the sum of the expense ratio 41% (2016: 41%) and the claims ratio 58% (2016: 48%).
CoverholderA firm either in the United Kingdom or overseas authorised by a managing agent under the terms of a binding authority to enter into contracts of insurance in the name of the members of the syndicate concerned, subject to certain written terms and conditions. A Lloyd’s broker can act as a coverholder.
Deferred acquisition costs (DAC)Costs incurred for the acquisition or the renewal of insurance policies (e.g. brokerage, premium levy and staff related costs) which are capitalised and amortised over the term of the contracts.
Earnings per share (EPS) – basic/dilutedRatio, in pence and cents, calculated by dividing the consolidated profit after tax by the weighted average number of ordinary shares issued, excluding shares owned by the group. For calculating diluted earnings per share the number of shares and profit or loss for the year is adjusted for certain dilutive potential ordinary shares such as share options granted to employees.
Economic Capital Requirement (ECR)The capital required by a syndicate’s members to support their underwriting. Calculated as the uSCR ‘uplifted’ by 35% to ensure capital is in place to support Lloyd’s ratings and financial strength.

www.beazley.com194 Beazley Annual report 2017
Glossary continued
Excess per risk reinsuranceA form of excess of loss reinsurance which, subject to a specified limit, indemnifies the reinsured company against the amount of loss in excess of a specified retention with respect to each risk involved in each loss.
Expense ratioRatio, in percentage terms, of the sum of expenses for acquisition of insurance contracts and administrative expenses to net earned premiums. The calculation is performed excluding the impact of foreign exchange on non-monetary items. In 2017, the expense ratio was 41% (2016: 41%). This represents the sum of expenses for acquisition of insurance contracts of $519.7m (2016: $472.5m) and administrative expenses of $254.7m (2016: $247.8m) to earned premiums of $1,869.4m (2016: $1,768.2m).
Facultative reinsuranceA reinsurance risk that is placed by means of a separately negotiated contract as opposed to one that is ceded under a reinsurance treaty.
Gross premiums writtenAmounts payable by the insured, excluding any taxes or duties levied on the premium, including any brokerage and commission deducted by intermediaries.
Hard market An insurance market where prevalent prices are high, with restrictive terms and conditions offered by insurers.
Horizontal limitsReinsurance coverage limits for multiple events.
Incurred but not reported (IBNR)These are anticipated or likely claims that may result from an insured event although no claims have been reported so far.
International Accounting Standards Board (IASB)An independent accounting body responsible for developing IFRS (see below).
International Accounting Standards (IAS)/International Financial Reporting Standards (IFRS)Standards formulated by the IASB with the intention of achieving internationally comparable financial statements. Since 2002, the standards adopted by the IASB have been referred to as International Financial Reporting Standards (IFRS). Until existing standards are renamed, they continue to be referred to as International Accounting Standards (IAS).
Investment returnRatio, in percentage terms, calculated by dividing the net investment income by the average financial assets at fair value, including cash. In 2017, this was calculated as net investment income of $138.3m (2016: $93.1m) divided by average financial assets at fair value, including cash, of $4,796.4m (2016: $4,610.9m).
Lead underwriterThe underwriter of a syndicate who is responsible for setting the terms of an insurance or reinsurance contract that is subscribed by more than one syndicate and who generally has primary responsibility for handling any claims arising under such a contract.
LineThe proportion of an insurance or reinsurance risk that is accepted by an underwriter or which an underwriter is willing to accept.
Managing agentA company that is permitted by Lloyd’s to manage the underwriting of a syndicate.
Managing general agent (MGA)An insurance intermediary acting as an agent on behalf of an insurer.
Medium tailA type of insurance where the claims may be made a few years after the period of insurance has expired.
Net assets per shareRatio, in pence and cents, calculated by dividing the net assets (total equity) by the number of shares issued.
Net premiums written Net premiums written is equal to gross premiums written less outward reinsurance premiums written.
Private enterpriseThe private enterprise team offers specialised professional and general liability coverage supported by a high service proposition, focusing on meeting the needs of small businesses with assets up to $35.0m and up to 500 employees.
Provision for outstanding claimsProvision for claims that have already been incurred at the reporting date but have either not yet been reported or not yet been fully settled.

Financial statements
www.beazley.com Annual report 2017 Beazley 195
RateThe premium expressed as a percentage of the sum insured or limit of indemnity.
Rate changeThe percentage change in premium income we are charging relative to the level of risk on renewals.
Reinsurance special purpose syndicateA special purpose syndicate (SPS) created to operate as a reinsurance ‘sidecar’ to Beazley’s treaty account, capitalising on Beazley’s position in the treaty reinsurance market.
Reinsurance to close (RITC)A reinsurance which closes a year of account by transferring the responsibility for discharging all the liabilities that attach to that year of account (and any year of account closed into that year), plus the right to buy any income due to the closing year of account, into an open year of account in return for a premium.
Retention limitsLimits imposed upon underwriters for retention of exposures by the group after the application of reinsurance programmes.
Retrocessional reinsuranceThe reinsurance of the reinsurance account. It serves to ‘lay off’ risk.
Return on equity (ROE)Ratio, in percentage terms, calculated by dividing the consolidated profit after tax by the average daily total equity. In 2017, this was calculated as profit after tax of $130.0m (2016: $251.0m) divided by average equity of $1,429.5m (2016: $1,381.6m).
RiskThis term may refer to:a) the possibility of some event occurring which causes injury
or loss;b) the subject matter of an insurance or reinsurance contract; orc) an insured peril.
Short tail A type of insurance where claims are usually made during the term of the policy or shortly after the policy has expired. Property insurance is an example of short tail business.
Sidecar special purpose syndicateSpecialty reinsurance company designed to provide additional capacity to a specific insurance company. It operates by purchasing a portion or all of a group of insurance policies, typically cat exposures. These companies have become quite prominent in the aftermath of Hurricane Katrina as a vehicle to add risk-bearing capacity, and for investors to participate in the potential profits resulting from sharp price increases.
Soft marketAn insurance market where prevalent prices are low, and terms and conditions offered by insurers are less restrictive.
Solvency Capital Requirement on an ultimate basis (uSCR)The capital requirement under Solvency II calculated by Beazley’s internal model which captures the risk in respect of the planned underwriting for the prospective year of account in full covering ultimate adverse development and all exposures.
Surplus lines insurerAn insurer that underwrites surplus lines insurance in the USA. Lloyd’s underwriters are surplus lines insurers in all jurisdictions of the USA except Kentucky and the US Virgin Islands.
Total shareholder return (TSR)The increase in the share price plus the value of any first and second dividends paid and proposed during the year.
Treaty reinsuranceA reinsurance contract under which the reinsurer agrees to offer and to accept all risks of certain size within a defined class.
Unearned premiums reserveThe portion of premium income in the business year that is attributable to periods after the reporting date in the underwriting provisions.

Beazley online annual report and accounts 2017
www.reports.beazley.com/2017

If you have finished reading this report and no longer wish to keep it, please pass it on to other interested readers, return it to Beazley or recycle it. Thank you.
Designed and produced by: Instinctif Partners www.creative.instinctif.com

beautifully designed insurance
Beazley plcPlantation Place South60 Great Tower Street LondonEC3R 5ADUnited Kingdom
Phone: +44 (0)20 7667 0623Fax: +44 (0)20 7674 7100
Registered number: 09763575
www.beazley.com
Moments of truth