Embed Size (px)
Citation preview
Moment Capacity and Deflection Behaviour of
Pultruded FRP Composite Sheet Piles
J ayasiri Shanmugam
Department of Civil Engineering and Applied Mechanics
McGill University, Montreal, Canada
October 2004
A thesis submitted to McGill University in partial fulfi1ment of the requirements of the
degree of Master of Engineering
© Jayasiri Shanmugam 2004

1+1 Library and Archives Canada
Bibliothèque et Archives Canada
Published Heritage Branch
Direction du Patrimoine de l'édition
395 Wellington Street Ottawa ON K1A ON4 Canada
395, rue Wellington Ottawa ON K1A ON4 Canada
NOTICE: The author has granted a nonexclusive license allowing Library and Archives Canada to reproduce, publish, archive, preserve, conserve, communicate to the public by telecommunication or on the Internet, loan, distribute and sell th es es worldwide, for commercial or noncommercial purposes, in microform, paper, electronic and/or any other formats.
The author retains copyright ownership and moral rights in this thesis. Neither the thesis nor substantial extracts from it may be printed or otherwise reproduced without the author's permission.
ln compliance with the Canadian Privacy Act some supporting forms may have been removed from this thesis.
While these forms may be included in the document page count, their removal does not represent any loss of content from the thesis.
• •• Canada
AVIS:
Your file Votre référence ISBN: 0-494-06582-6 Our file Notre référence ISBN: 0-494-06582-6
L'auteur a accordé une licence non exclusive permettant à la Bibliothèque et Archives Canada de reproduire, publier, archiver, sauvegarder, conserver, transmettre au public par télécommunication ou par l'Internet, prêter, distribuer et vendre des thèses partout dans le monde, à des fins commerciales ou autres, sur support microforme, papier, électronique et/ou autres formats.
L'auteur conserve la propriété du droit d'auteur et des droits moraux qui protège cette thèse. Ni la thèse ni des extraits substantiels de celle-ci ne doivent être imprimés ou autrement reproduits sans son autorisation.
Conformément à la loi canadienne sur la protection de la vie privée, quelques formulaires secondaires ont été enlevés de cette thèse.
Bien que ces formulaires aient inclus dans la pagination, il n'y aura aucun contenu manquant.
Abstract
The structural behaviour of FRP-composite (E-glass/polyester) sheet pile panels
subjected to unif01Il1 pressure load was investigated. Single, connected and concrete
fiUed 2.13 m panels were tested to failure with the objective of determining their moment
capacity and failure mechanism. As the uniform load test procedure utilized in this study
allowed for the prevention of premature local crushing behaviour within the span, the
average moment capacity obtained in this study was more than double that found in prior
studies of FRP sheet pile panels, averaging 11.15 kN.m in single panel tests and 9.32
kN.m in connected panel tests. Single panels exhibited little difference in moment
capacity whether tested in the upright or inverted orientation and there was no apparent
reduction in capacity when a single panel was subjected to repeated load cycles. Failure
of both single and connected panels was generally attributable to local buckling and
invariably occurred at a deflection of about 50mm, indicating that deflection limits may
govem design. No joint failure was observed in connected panels.
Load deflection behaviour of these panels was compared with theoretical
predictions using Timoshenko's beam theory. Panel behaviour correlated weIl with the
theoretical prediction in the lower load ranges but nonlinear load-deflection behaviour
was observed at higher loads, attributable to a reduction in stiffness resulting from
geometric shape change of the panel. An empirical model was formulated to describe the
stiffness reduction with increasing load, which proved effective in predicting the
deflection behaviour of both single and connected panels. Furthermore, the stiffness
1
reduction model was successfully validated against load deflection behaviour observed in
similar FRP sheet pile panels in prior studies.
In order to test whether the structural performance of FRP panels could be
enhanced using concrete backfill, two panels were filled with fly-ash concrete and
attached with shear studs to achieve composite action. These hybrid panels exhibited
significantly increased moment capacity, over three times greater than the ultimate
moment capacity of unfilled FRP panels. Rowever, the backfilled panels exhibited an
increase in stiffness of only 24% over unfilled panels. Failure of the hybrid panels was
due to bearing failure of the FRP composite at the bolted regions, followed by separation
of the concrete fill from the FRP panel, which was also initiated at a deflection of about
5 Omm. Rence, the backfilling ofFRP panels with concrete represents an effective means
of increasing their structural capacity.
11
Résumé
Cette étude visait à caractériser le comportement structural de panneaux de
palplanche en plastiques renforcés de fibre (PRF) chargés sous pression uniforme. Des
panneaux simples, reliés et rembourrés de béton étaient testés jusqu'à rupture, dans le but
de déterminer leur capacité de moment et mécanisme de rupture. Grâce a la procédure
d'essai de chargement uniforme employée, des fissures localisées dans l'envergure
peuvent être évitées et la capacité de moment obtenue était doublée par rapport aux
études précédentes, la moyenne étant de Il.15 kN.m pour les essais de panneaux simples,
et de 9.32 kN.m pour les essais de panneaux reliés. L'orientation des panneaux simples
avait peu d'effet sur leur capacité de moment et aucune réduction en capacité de moment
était notée quand un panneau simple était soumis a des cycles de chargement répètes. La
rupture des panneaux simples et reliés était généralement attribuable au flambement
localisé qui était invariablement initialisé sous a une flèche d'environ 50mm, suggérant
que la flèche pourrait être un paramètre important en design. Aucune rupture était
observée aux joints des panneaux reliées.
Le comportement en flexion sous chargement de ces panneaux a été comparé aux
prédictions théoriques en utilisant la théorie des poutres de Timoshenko. Le
comportement des panneaux se comparait bien avec les prédictions théoriques aux
niveaux de chargement plus bas, mais un comportement non linéaire de flexion sous
chargement a été observé a des niveaux de chargement plus élevés, attribuable à une
réduction de la rigidité qui résultait d'un changement de forme géométrique. Un modèle
111
empirique a été fonnulé pour décrire la réduction de rigidité sous chargement, qui a pu
prédire efficacement le comportement en flexion des panneaux simples et reliées. En
plus, le modèle de réduction de rigidité a été validé avec les observations d'études
précédentes du comportement de flexion sous chargement de panneaux PRF similaires.
Afin de vérifier si le comportement structural de panneaux PRF pourrait être
augmenté en employant le remblayage de béton, deux panneaux ont étés remplis de béton
de cendres volantes, qui était attaché avec boulons de cisaillement. Ces panneaux
hybrides avaient une capacité de moment beaucoup plus élevée, plus de trois fois celle
des panneaux non remplis. Cependant, la rigidité des panneaux remplis de béton était
augmentée de seulement 24% relativement aux panneaux non remplis. La rupture des
panneaux hybrides était attribuable au cisaillage du PRF aux articulations, suivi par la
séparation du béton du panneau PRF. La ruine des panneaux remplis était aussi initiée à
une flèche d'approximativement 50 mm, comme les panneaux non remplis. Ces résultats
indiquent que le remblayage de panneaux PRF avec béton est un moyen efficace pour
augmenter leur capacité structurale.
IV

Acknowledgement
1 would like to first and foremost acknowledge Professor Yixin Shao for his
guidance, constructive advice and valuable help throughout this project.
1 would also like to thank John Bartzack, Ron Sheppard and Marek Przykorski,
the laboratory technicians with the Department of Civil Engineering at McGill
University, for their assistance in constructing the testing apparatus, and Jason Chun Kit
Hui for assisting in the testing of connected and hybrid panels.
As well, the financial support oflBP Corporation is greatly appreciated.
1 also wish to thank my parents, brothers and sisters for their support and
encouragement. Last but not least 1 would like to extend my deepest gratitude to Maria
for her patience and invaluable support throughout this project.
v

Table of Contents
Abstract................ ............................... ....................................... ..... 1
Résumé.......................................................................................................................... 111
Acknowledgements....................................................................................................... v
Table of Contents.......................................................................................................... VI
List of Syrnbols........................................... .................................................................. IX
List of Figures............................................................................................................... Xl
List of Tables.......................... .................................................................. .................... XV11
Chapter 1 - Introduction....................... ........... .......................................................... 1
1.1 Sheet pile walls in waterfront applications............ ...... .......... ........ ................. 1
1.2 Fibre Reinforced Polyrner (FRP) composites. .... ............... ........ .................... 3
1.3 Design of FRP composite panels........................ .................. ........ .................. 5
1.4 Objectives....................................................................................................... 9
1.5 Organisation ofthesis. .................................................................................... 10
Chapter 2 - Literature Review................................. ....... .......... ........ .......... .............. Il
2.1 Testing methods for FRP composite shapes................................................... Il
2.2 Past research on FRP sheet pile panels. ......................................................... 14
2.3 Concrete-FRP hybrid beams........................................................................... 17
2.4 Design of anchored sheet pile walls. .. ..................................... ...... ................. 19
VI

Chapter 3 - Experimental Program ......................................................................... 23
3.1
3.2
3.3
Description of FRP sheet pile panels ............................................................ ..
Overview of experimental procedure ........................................................... ..
Experimental setup ........................................................................................ .
3.3.1 Test frame ....................................................................................... ..
3.3.2
3.3.3
3.3.4
3.3.1.1 Test frame modifications for each panel configuration.
Uniform load application using airbag ........................................... ..
End supports .................................................................................... .
Instrumentation ................................................................................ .
23
24
26
26
29
30
31
33
3.4 Single panel tests........... ................................................................................. 34
3.5 Connected panel tests................... .................................................................. 36
3.6 FRP-concrete hybrid panels............................................................................ 38
3.7 Validation of simple support..................... ..... ......... ........ ............... ................ 42
Chapter 4 - Theoretical Framework ..... ...................... ............ ............. ........ ............ 43
4.1 Timoshenko's beam theory. ........................................................................... 43
4.2 Moment capacity predictions from pressure at failure. .... ..... ..... .................... 45
4.3 Bending stiffness ca1culations ofhybrid beams. ............................................ 45
Chapter 5 - Results and Discussion ................................................................ ...... .... 46
5.1 Single panel tests.................................. .......................................................... 46
5.1.1 Monotonically loaded upright single panel tests. ............................. 46
5.1.2 Cyc1ically loaded upright single panel test....................................... 49
5.1.3 Failure mechanism of upright single panels.......... .......... ........ ......... 51
Vll
5.2 Inverted single panel tests............................................................................... 54
5.2.1 Failure mechanism ofinverted single panels.................................... 58
5.3 Connected panel tests.................. ................................................................... 60
5.4
5.3.1 Failure mechanism of connected panels........................................... 68
Hybrid concrete-FRP single panel tests ........................................................ .
5.4.1 Failure mechanism ofhybrid beam H-l.. ........................................ .
71
78
5.4.2 Failure mechanism ofhybrid beam H-2........................................... 81
Chapter 6 - Nonlinear Analysis ofFRP Composite Sheet Piles............................. 85
6.1 Stiffness reduction due to shape change......................................................... 85
6.1.1
6.1.2
Empirical formulation of stiffness reduction ................................... .
Verification of stiffness reduction model. ...................................... ..
6.1.2.1
6.1.2.2
6.1.2.3
Connected panels subject to uniform pressure .............. .
Connected panels subject to four-point bending ........... .
Single panels subjected to four-point bending on
87
92
92
94
multiple span lengths......................................... ............ 95
6.2 Investigation of other possible causes ofnon-linearity................................... 96
6.3 Determination of neutral axis position of connected panels from
strain measurements.................. ..................................................................... 97
6.4 Prediction of moment capacity using the flexural formula............................. 100
6.5 Implications for design ofFRP sheet pile walls............................................. 101
Chapter 7 - Conclusion.................... .......................................................................... 103
References................................................................................. ................................... 106
Vlll

List of symbols
D embedment depth
8 total deflection
8b deflection due to bending
8E experimental deflection
8max maximum deflection
8R reduced deflection
8s deflection due to shear
8r theoretical deflection
E elastic modulus
El flexural stiffness
Eh theoretical (initial) flexural stiffness
EIR reduced flexural stiffness
G shear modulus
1 moment of inertia
h initial moment of inertia
IR reduced moment of inertia
F.S. factor of safety
kA shear area
kAG shear stiffness
IX

L span length
M moment
Mmax moment capacity
S section modulus
cry yield stress
q(x) distributed load
qmax maximum applied uniform load
x
List of Figures
Chapter 1 - Introduction
Figure 1.1
Figure 1.2
Figure 1.3
Fiberglass composite sheet pile wall (Source: IBP Corporation, 2000).. 2
Cross-sectional arrangement of fibre reinforcements in a typical sheet
pile panel investigated in this study (Source: IBP Corporation, 2000)... 4
The pultrusion process......... ........................................ .......... ......... ......... 5
Chapter 2 - Literature Review
Figure 2.1
Figure 2.2
Anchored sheet pile wall (Source: Broms, 2004).................................... 20
Changing soil pressure distribution and deflection behavior of a
typical anchored sheet pile with increasing embedment depth (Source:
Tsinker, 1997). ........................................................................................ 21
Chapter 3 - Experimental Program
Figure 3.1
Figure 3.2
Figure 3.3
Figure 3.4
Cross-sectional view of the FRP composite sheet piles used in this
study ......................................................................................................... 24
Test configurations of single, connected and hybrid panels.................... 25
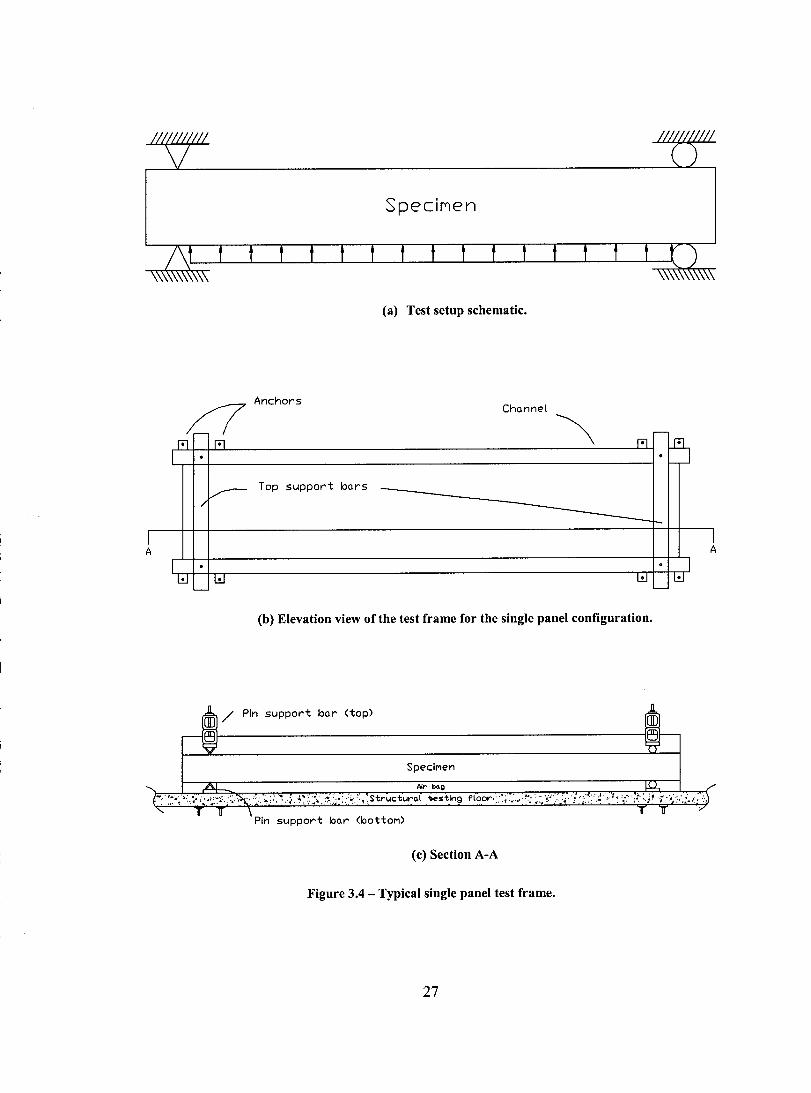
Test frame used for testing of single FRP sheet pile panels.... ................ 26
Typical single panel test frame. (a) Test setup schematic (b) Elevation
view of the test frame for the single panel configuration (c) Section
A-A ......................................................................................................... 27
Xl
Figure 3.5 (a) HSS sections used to anchor channels to the structural testing floor
and web stiffeners near the reaction point. (b) Connection ofbottom
support bar to the channels............................ ................... ............ ........... 28
Figure 3.6 Top support bars, with the pin supports displayed on the left and the
roller supports on the right. (a) Single (b) Connected ............................ 29
Figure 3.7 Pressure transducer placed in parallel with dial gauge..... ....................... 31
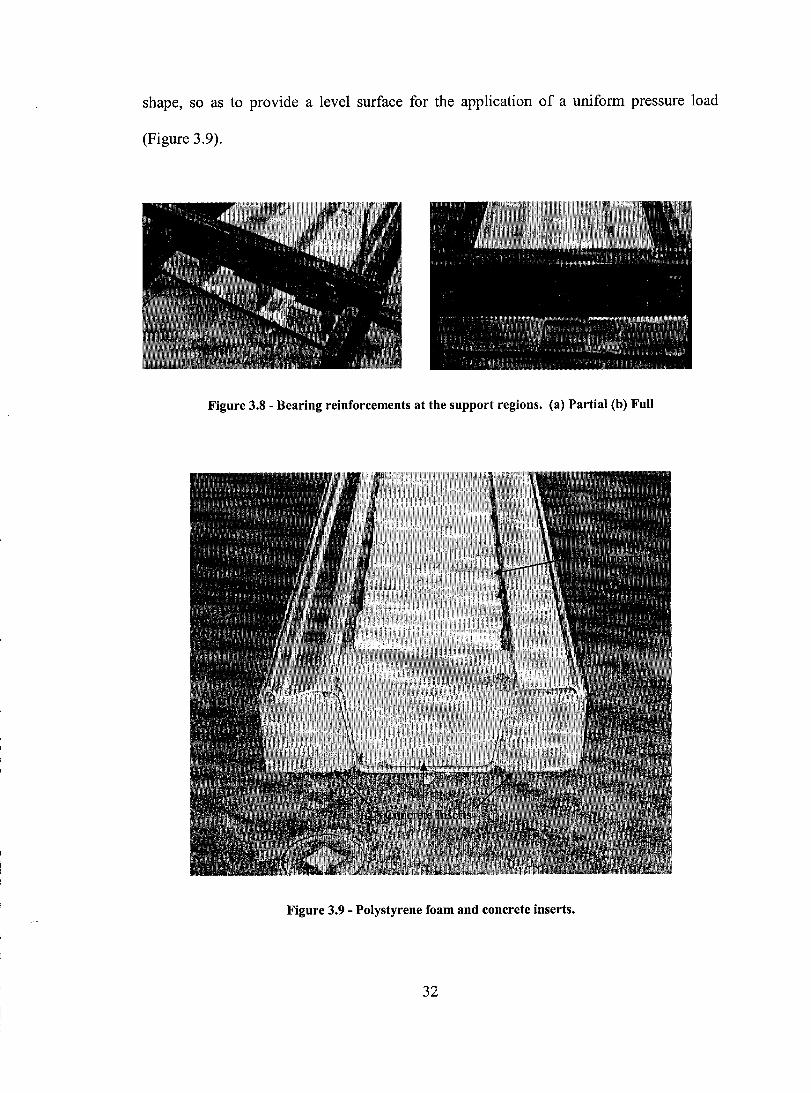
Figure 3.8 Bearing reinforcements at the support regions. (a) Partial (b) Full........ 32
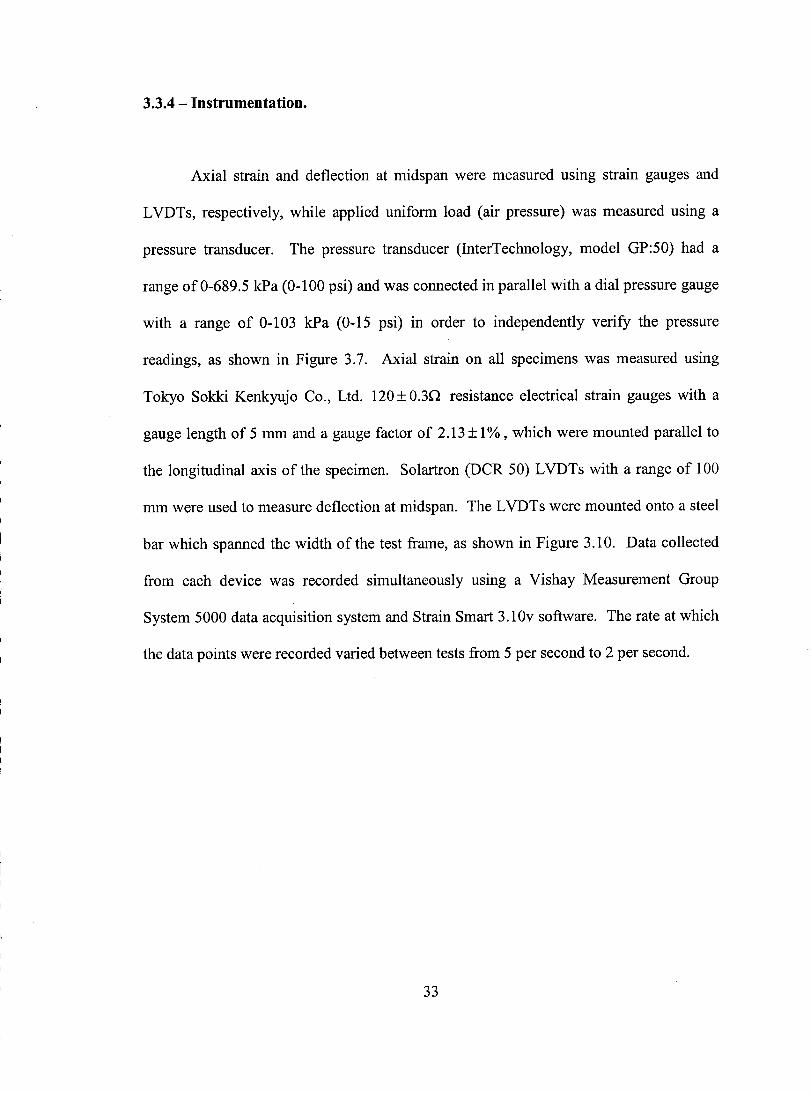
Figure 3.9 Polystyrene foam and concrete inserts. ................................................... 32
Figure 3.10 Typical connected panel test setup and LVDT mount. ........................... 34
Figure 3.11 Cross section view of the single panel test setup with foam inserts. (a)
Upright (b) Inverted................................................................................. 35
Figure 3.12 Instrumentation of single panels. (a) Upright (b) Inverted .................... 36
Figure 3.13 Instrumentation of connected panel tests at mid-span. (a) C-1 (b) C-2
(c) C-3 (d) C-4. ........................................................................................ 37
Figure 3.14 Cross-sectional view of a concrete-filled FRP hybrid panel. .................. 39
Figure 3.15 Spacing ofshear studs in concrete-filled FRP hybrid panels. (a) Hl (b)
H2 ............................................................................................................ 40
Figure 3.16 Instrumentation ofFRP-concrete hybrid panels. (a) H-1 (b) H-2 ........... 41
Figure 3.17 Longitudinal strain vs. load. .................................................................... 42
XlI
Chapter 5 - Results and Discussion
Figure 5.1
Figure 5.2
Figure 5.3
Figure 5.4
Figure 5.5
Figure 5.6
Figure 5.7
Figure 5.8
Longitudinal strains in the main, eye and pin flanges of monotonically
loaded upright single panels.................................................................... 47
Load deflection plot for monotonically loaded upright single panels..... 48
Longitudinal strains in the main, eye and pin flanges of cyc1ically
loaded specimen B-5. .............................................................................. 50
Load deflection plot for cyc1ically loaded specimen B-5........................ 51
Out-of-plane displacement of a single panel upon failure....................... 52
Typical failure of compression flanges on upright single panels. (a)
Pin flange (b) Bye flange......................................................................... 53
Typical failure damage on a single panel, shown after unloading........... 53
Longitudinal strains in the main, eye and pin flanges of inverted single
panels ....................................................................................................... 55
Figure 5.9 Comparison of strain behaviour oftypical upright and inverted panels.. 56
Figure 5.10 Load deflection plot for inverted single panels. ...................................... 57
Figure 5.11 Load deflection plot for the main, eye and pin flanges of inverted
single panels. ........................................................................................... 57
Figure 5.12 Typical failure ofinverted panels, showing buckling of the main
flange ....................................................................................................... 59
Figure 5.13 Local buckling ofinverted panels, with separation of the main flange
from the main webs......................... .......... ....... ................ .................... ... 60
X111
Figure 5.14 Longitudinal strains throughout the cross-section of the center panel
of connected panel test C-2. .................................................................... 61
Figure 5.15 Longitudinal strains throughout the cross-section of the panel 1 of
connected panel test C-2.......................................................................... 62
Figure 5.16 Longitudinal strains throughout the cross-section of Panel 3 of
connected panel test C-2 .......................................................................... 62
Figure 5.17 Longitudinal strains throughout the cross-section of the center panel
of connected panel test C-3. .................................................................... 63
Figure 5.18 Longitudinal strains throughout the cross-section of the center panel
of connected panel test C-4.................................... ............... .................. 63
Figure 5.19 Comparison ofload deflection behaviour ofC-1, C-2, C-3, and C-4 at
the center paneL....................................................................................... 64
Figure 5.20 Relative movement ofthe pin and eye flange with respect to the main
flange in C-3............................................................................................ 65
Figure 5.21 Transverse strain distribution of panels 1,2 and 3 oftest C-2. ............... 66
Figure 5.22 Transverse deflection behaviour of panels 1,2 and 3 oftest C-2............ 67
Figure 5.23 Typical failure of a connected panel arrangement................................... 69
Figure 5.24 Detail of connected panel failure............................................................. 69
Figure 5.25 Bearing failure in the support region of test C-4..................................... 70
Figure 5.26 Load strain behaviour of specimen H-l.. ................................................. 72
Figure 5.27 Load strain behaviour ofH-2a................................................................. 73
XIV
Figure 5.28 Tensile strain plots ofH-l and H-2a ........................................................ 73
Figure 5.29 Compressive strain behaviour ofH-1 and H-2a. ..................................... 74
Figure 5.30 Load deflection plot for H-l.................................................................... 75
Figure 5.31 Load deflection plot for H-2a. ................................................................. 75
Figure 5.32 Load deflection behaviour ofthe main flanges ofH-1 and H-2a............ 77
Figure 5.33 Failure ofH-1, showing separation of concrete from the FRP beam in
the end regions. ....................................................................................... 79
Figure 5.34 Detail offailure ofH-1 at the end region. ............................................... 80
Figure 5.35 Elongation ofboIt holes ofH-1 at the end region. .................................. 80
Figure 5.36 Failure ofthe pin si de ofH-2b................................................................. 82
Figure 5.37 Detail of the failure region on the pin si de ofH-2b................................. 83
Figure 5.38 Longitudinal tearing failure at the eye side ofH-2b................................ 83
Figure 5.39 Bearing failure of the main flange at the main shear stud region ofH-
2b ............................................................................................................. 84
Figure 5.40 Elongation of the boit holes following failure ofH-2b. .......................... 84
Chapter 6 - Nonlinear Analysis
Figure 6.1 Difference between theoretical and experimental deflection of single
panels ....................................................................................................... 89
Figure 6.2 Progressive reduction in stiffness with increasing moment, as
described by Equation 7.6. ..... ................ ......... ..... ........ ..... ..... ................. 90
xv

Figure 6.3
Figure 6.4
Figure 6.5
Figure 6.6
Figure 6.7
Figure 6.8
Comparison of experimental results for single panels with theoretical
predictions using constant (Eh) and reduced stiffuess (EIR).................. 92
Deflection of connected panels compared with theoretical predictions
using constant (Eh) and reduced stiffuess (EIR).................................... 93
Load deflection behaviour ofupright twin connected panels (panels 1
and 2) observed by Bdeir (2002), compared with theoretical
predictions using constant (Eh) and reduced stiffuess (EIR).................. 94
Load deflection behaviour of single panels ofvarying length, as
observed by Giroux (1999), compared with theoretical predictions
using constant (Eh) and reduced stiffness (EIR). ................................... 95
Strain behaviour through the cross-sectional depth with increasing
load for the main flange and webs on the pin (a) and eye (b) sides of
panel C-2. ................................................................................................ 98
Shift in neutral axis from mid height with increasing pressure............... 99
XVI

Table 2.1
Table 5.1
Table 5.2
Table 5.3
Table 5.4
Table 5.5
Table 6.1
List of Tables
Results of prior studies on FRP composite sheet piles..... .................... 16
Results of monotonically loaded upright single panel tests.................. 49
Results ofinverted single panel tests. ................................................... 58
Results of connected panel tests.. .............................. ... ......................... 68
Stiffness results of concrete-FRP hybrid panel tests............................. 77
Pressure, moment and deflection results of concrete-FRP hybrid
panel tests.............................................................................................. 78
Comparison of the moment capacity of connected panels predicted
using strain measurements and applied pressure................................... 101
XVll
CHAPTERI
INTRODUCTION
1.1 - Sheet pile walls in waterfront applications.
Sheet pile walls perform an essential function in waterfront and coastal
environments by retaining soil and preventing erosion. These structures are usually
constructed of interlocking panels driven vertically into the waterbed to form a retaining
wall. Finding appropriate materials for use in severe waterfront and marine environments
has proved challenging. Traditionally, timber, concrete and steel have been used in the
construction of sheet pile walls; however, each of these building materials is inherently
inappropriate. For example, timber is often plagued by marine borers and the toxic
chemicals employed in the pressure treatment of timber pose environmental problems.
Steel sheet pilings, as weIl as the steel reinforcements within concrete piles, are
susceptible to corrosion in marine environments and concrete is subject to degradation
from periodic freeze-thaw cycles in cold climates. Consequently, the deterioration of
timber, steel and concrete pilings entails enormous restoration costs and it is estimated
that in the United States alone, repair and restoration of wood, concrete and steel pilings
in waterfront environments costs billions of dollars annuaIly. (Lampo et al, 1998)
1
These durability issues have led researchers to investigate alternative materials
that are more suitable for use in harsh waterfront environments. Over the past thirty
years, composites have been amongst the dominant emerging construction materials,
finding their way into a growing number of fields and applications. The increasing
popularity of composites is fuelled primarily by their attractive qualities such as light
weight, corrosion resistance, high strength-to-weight ratio, and low environmental
toxicity (Lampo et al., 1998). In addition, while the initial costs of composite materials
may be higher than traditional materials, their durability and low maintenance
requirements translate into lower life-cycle costs for composites in the long fUll (lskanker
et al., 1998). Thanks to these favourable qualities, composites have shown the potential
to complement conventional construction materials such as wood, steel and reinforced
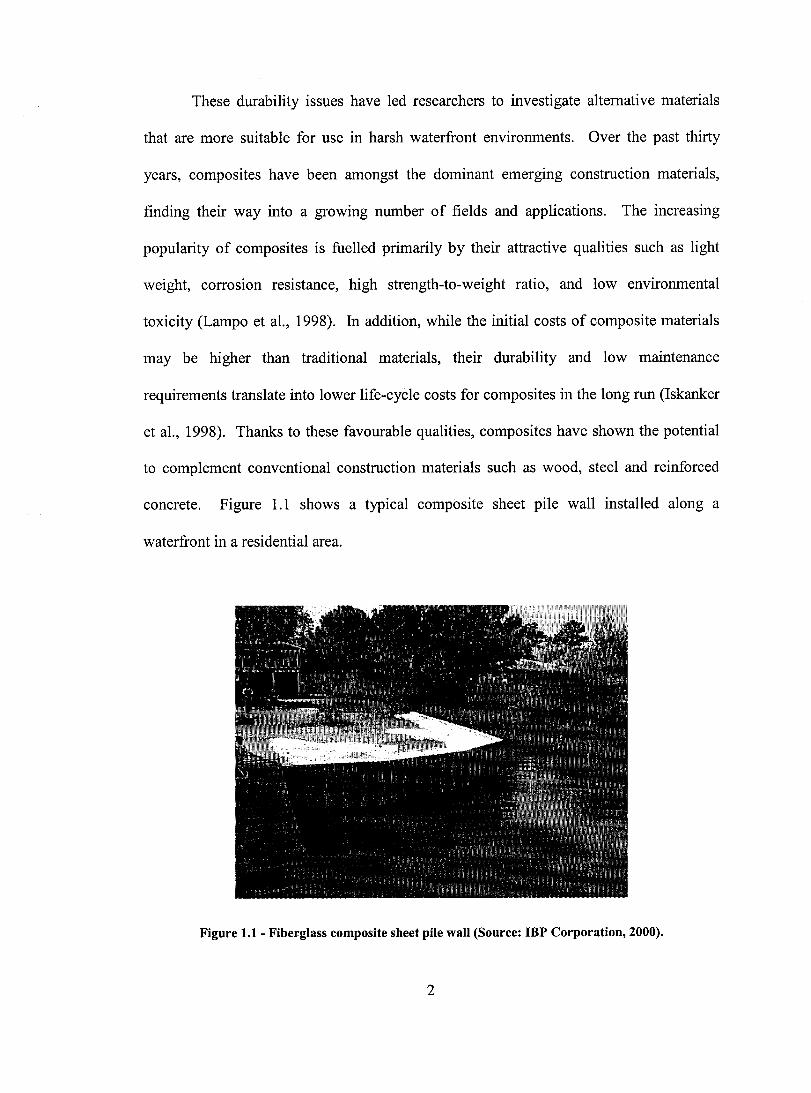
concrete. Figure 1.1 shows a typical composite sheet pile wall installed along a
waterfront in a residential area.
Figure 1.1 - Fiberglass composite sheet pile wall (Source: IBP Corporation, 2000).
2

1.2 - Fibre Reinforced Polymer (FRP) composites.
Composite materials are formed when two or more materials are combined in
order to produce a new product with properties superior to those of the individual
constituents. Fibre reinforced polymer (FRP) composites are composed of fibres
embedded in a polymeric matrix. The fibres act as the principalload-carrying members,
while the matrix helps bind fibres together, thus acting as a load-transferring medium
between fibres while also protecting the fibres from adverse environmental conditions
and mechanical abrasion. The combination of high-strength, high-stiffuess structural
fibres along with low-cost, light weight, environmentally resistant polymers results in
composite materials with enhanced mechanical properties and durability (Bakis et al.,
2002).
FRP sections used in construction are generally thin-walled, consist of E-glass
fibres embedded in polyester or vinyl ester matrices, and are manufactured by the
pultrusion process (Qiao et al, 1999a). Although various types of reinforcing fibres for
composites are available on the market, the most commonly used are glass, carbon and
aramid fibres. A fibre may be chosen based on its cost, as well as desired mechanical
properties and its performance when subjected to certain environmental conditions
(Barbero, 1999). Reinforcing fibres can be incorporated into the matrix in various forms,
inc1uding continuous, chopped and woven. Figure 1.2 shows the cross-sectional
distribution of the various types of fibre forms incorporated in a typical sheet pile panel
involved in this study. Depending on the application, fibre content can be varied in
3
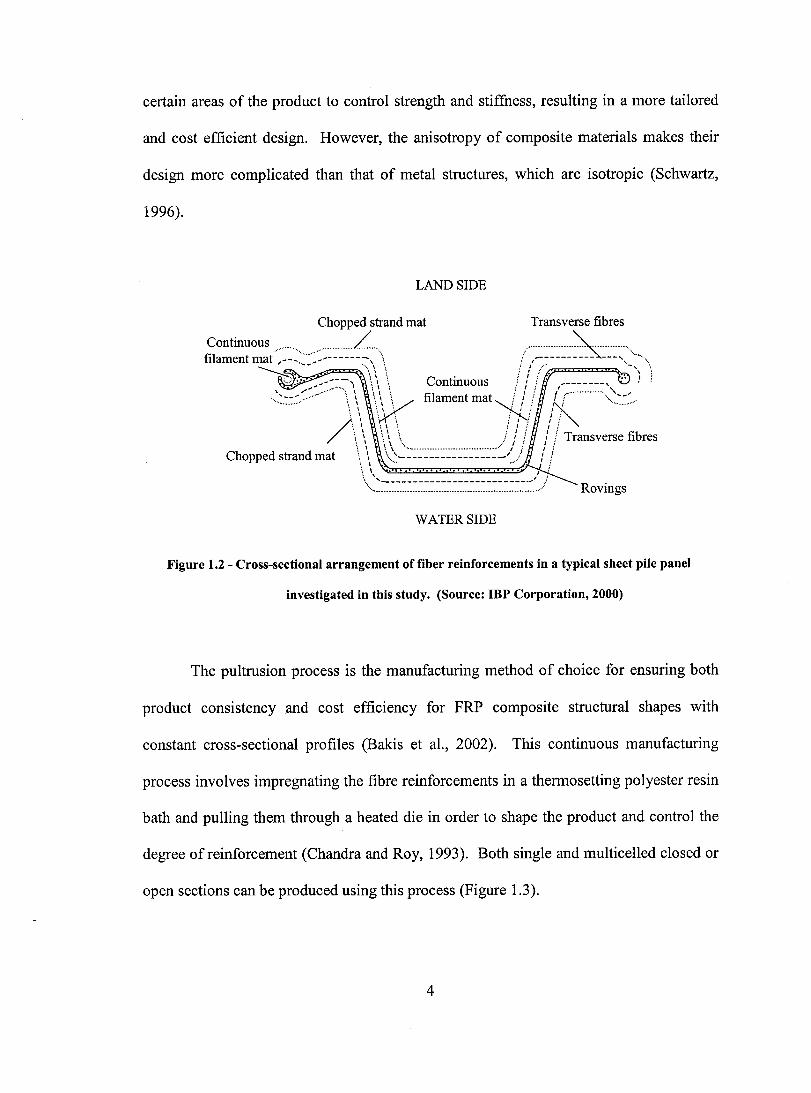
certain areas of the product to control strength and stiffness, resulting in a more tailored
and cost efficient design. However, the anisotropy of composite materials makes their
design more complicated than that of metal structures, which are isotropie (Schwartz,
1996).
LANDSIDE
WATERSIDE
Figure 1.2 - Cross-section al arrangement of fiber reinforcements in a typical sheet pile panel
investigated in this study. (Source: IBP Corporation, 2000)
The pultrusion process is the manufacturing method of choice for ensuring both
product consistency and cost efficiency for FRP composite structural shapes with
constant cross-sectional profiles (Bakis et al., 2002). This continuous manufacturing
process involves impregnating the fibre reinforcements in a thermosetting polyester resin
bath and pulling them through a heated die in order to shape the product and control the
degree ofreinforcement (Chandra and Roy, 1993). Both single and multicelled c10sed or
open sections can be produced using this process (Figure 1.3).
4

Fibre reinforcement
Heated die Pull rolls Saw
Figure 1.3 - The pultrusion process.
1.3 - Design of FRP composite panels.
The complex nature of FRP composite materials requires that the following key
characteristics be considered in structural design, according to Qiao et al. (1999):
(1) The low elastic tensile modulus of fibreglass composites may lead to relatively
large deflection.
(2) The relatively low shear modulus of composites may cause considerable shear
defonnation.
(3) Critical global and local buckling may result from the thin-walled structure and/or
large slendemess ratio of component panels.
(4) Relatively low compressive and shear strengths of composites may lead to
material failure.
Open, thin-walled FRP sections such as the composite sheet piles investigated in
this study (Figure 1.2) can exhibit complex behaviour due to their anisotropic nature and
the fact that they can undergo considerable shape change upon loading. Geometry
5
change of FRP shapes can result in obvious changes in stiffness, while changes In
material constituents may only cause minor variations (Qiao et al, 2000).
The distinct structural behaviour of pultruded composite materials requires that
their design be govemed by deflection and moment capacity. As such, flexural stiffness
(El) and shear stiffness (kAG) of the section are crucial to design and can be determined
by means of 3-point or 4-point flexural tests using the multiple span approach (Sims,
1987; Bank, 1989; Mottram, 1991, 1993; Musial et al., 2001; Giroux and Shao, 2003).
Since the selection of structural shapes is primarily based on the allowable moment to be
carried by the section, awareness of the section's moment capacity (Mmax) is essential in
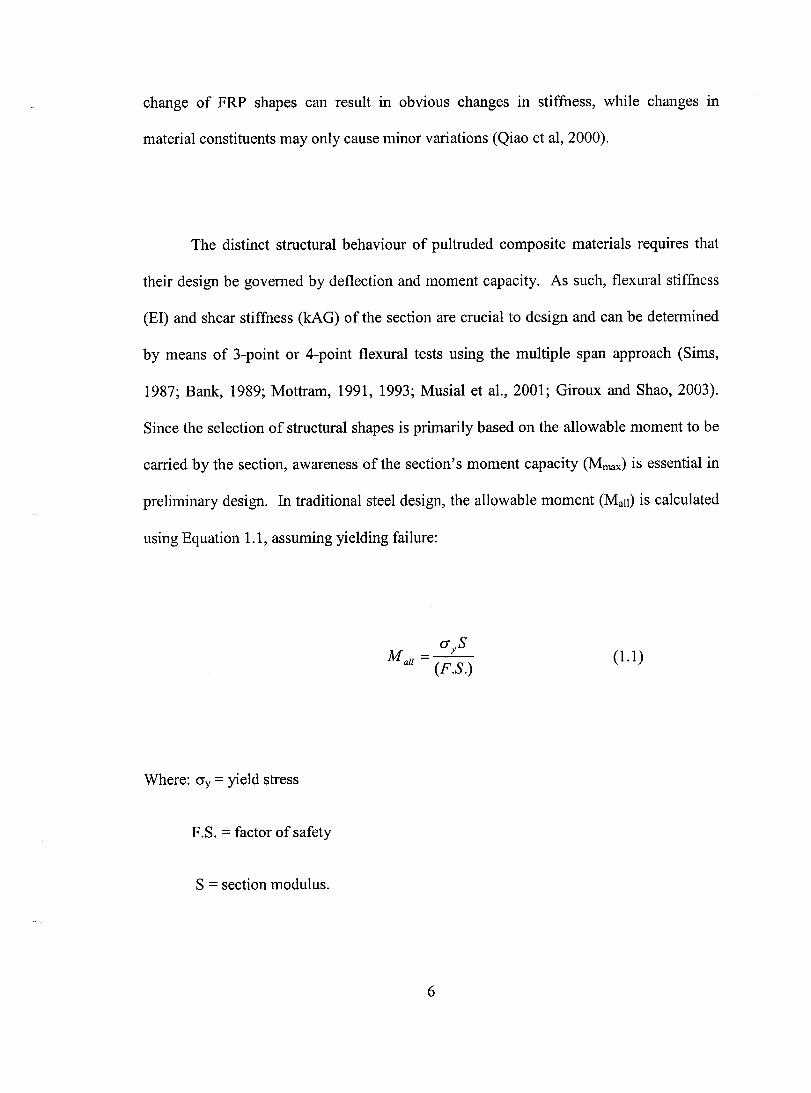
preliminary design. In traditional steel design, the allowable moment (Mali) is ca1culated
using Equation 1.1, assuming yielding failure:
(1.1)
Where: cry = yield stress
F.S. = factor of safety
S = section modulus.
6

Currently, most manufacturers of composite sections follow steel design
paradigms in employing Equation 1.1 to estimate the allowable moment capacity of their
puItruded sections, substituting the ultimate tensile strength of composites, along with a
fairly large factor of safety, for yield stress (cry). However, this approach inherently
assumes tensile failure of the material, which is incorrect since FRF composite sections
are generally govemed by deflection and buckling limitations, rather than by strength
limitations (Eurocomp Design Code and Handbook, 1996), rather, as opposed to steel,
which is usually characterized by plastic yielding. Therefore, the use of tensile strength
in Equation 1 overestimates the allowable moment of composite sections and can resuIt in
unsafe design. Therefore, it is necessary to experimentally determine moment capacity
for any available structural FRF composite shapes.
Unlike flexural and shear stiffness, which are usually considered section
constants, the maximum moment of a composite structural shape at failure depends upon
the test conditions, as these affect failure mode. Most previous studies have employed
three- and four-point bending tests to determine the maximum bending moment of FRF
composite I-beams and box-beams, which are typically used as structural beams and in
deck applications. In past tests aimed at determining moment capacity, composite sheet
piles tested to failure under four-point bending conditions underwent crushing and local
buckling failures at the load points (Giroux, 2000). These types of failure are not
representative of the sheet piles under service conditions, since they are usually subject to
linearly distributed earth and hydraulic pressure, and would not be expected to experience
such concentrated crushing. Therefore, concentrated load tests (three- or four-point
7
bending) are inadequate for determining the maximum moment capacity of composite
sheet piles.
In the present study, a uniformly distributed pressure testing method was
developed in order to determine the moment capacity and deflection behaviour of
pultruded FRP sheet piles in the absence of confounding effects from premature crushing
at the load points. Uniform pressure tests provide a much closer laboratory simulation of
the linearly distributed earth pressure load which is assumed under service conditions.
This thesis will present the findings of tests conducted on single, connected and concrete
filled FRP sheet pile panels, will evaluate and compare the load carrying capacity and
deflection behaviour of each panel type, and will subsequently discuss the applications of
these findings to FRP composite retaining wall design.
8

1.4 - Objectives.
The primary objective of this study was to examine the structural behaviour of single,
connected and concrete-hybrid FRF composite sheet pile panels subjected to uniform
pressure load, specifically directed at:
1) Establishment of moment capacity.
2) Identification of failure mode.
3) Investigation of joint behaviour in connected panels.
4) Determination of an empirical relationship describing the flexural stiffness
reduction (El) due to geometry change with increasing load.
5) Comparison of the behaviour of single and connected panel arrangements,
particularly in order to determine whether the behaviour of connected panels can
be predicted based on single panel tests.
6) Establish whether the performance of FRF-composite sheet pile panels can be
enhanced using concrete backfill.
9
1.5 - Organisation ofthesis.
Chapter 1 has outlined the potential advantages of FRP composite materials for
waterfront retaining wall applications. This chapter has also introduced the basic
princip les ofFRP composite manufacture, as weIl as the objectives ofthis study.
Chapter 2 is an overview of past research which has been conducted on FRP composite
shapes and introduces the design ofFRP sheet pile panels and anchored sheet pile walls.
Chapter 3 describes the experimental pro gram which was followed in order to
investigate the behaviour of single, connected and concrete-filled FRP sheet pile panels.
Chapter 4 discusses the theoretical framework which was necessary to analyse the
structural behaviour of aIl panel arrangements.
Chapter 5 presents the results of the experimental investigation as weIl as an analysis
and comparison of the findings of each panel configuration.
Chapter 6 is a theoretical investigation of the nonlinear behaviour observed in the sheet
pile panels.
Chapter 7 summarizes the conclusions of the present research.
10
CHAPTER2
LITERATURE REVIEW
2.1 - Testing methods for FRP composite shapes.
FRP composite products exhibit complex structural behaviour which can be
difficult to analyse, even knowing the section profile and reinforcement details (Bank et
al., 1995; Qiao et al, 1999, 2000). Reliable testing methods are therefore essential in
order to establish the section properties of composite products and allow for their usage
in structural applications. In particular, the flexural (El) and shear stiffuess (kAG) and
moment capacity (Mmax) are amongst the most important parameters in the design of
composite structures.
Analytical methods have been proposed in order to determine the flexural (El)
and shear stiffuess (kAG) of FRP composite sections using classical laminate theory
(Barbero, 1991a). Although pultruded composites are not truly laminates, the variation in
fibre structure through the thickness of the sections is thought to justify the use of
laminate methods (Barbero et al., 1991b). However, uncertainty exists with regard to the
accuracy of stiffuess parameters obtained using analytical methods for pultruded
composite sections, thus full-sc ale testing is usually employed to validate analytical
11

predictions (Bank et al., 1995). In addition, Bank (1989a) found that flexural and tensile
coupon tests were not representative of full-scale flexural behaviour. Therefore, full
scale laboratory tests are necessary in order to reliably establish the section properties of
FRP composite profiles, the most popular of which are three- and four-point bending
tests, due to their simplicity.
Flexural and shear stiffuess of FRP composite sections are generally determined
using three- or four-point bending tests. Two methods are commonly used, one involving
deflections of multiple span lengths (Sims, 1987; Bank, 1989b; Mottram, 1991, 1993;
Musial et al., 2001; Giroux and Shao, 2002), while the second uses measured strain data
(Nagaraj et al, 1997; Costa, 1999; Bdeir, 2001; Howard, 2002). The multiple span length
method makes use of Timoshenko's beam theory, along with measured experimental
deflections, to simultaneously determine El and kAG. This procedure has been found to
be reliable in predicting flexural stiffness (El) but often results in a large variation in
shear stiffuess (kAG) (Roberts and AI-Ubaidi, 2002; Giroux and Shao, 2002). On the
other hand, the strain gauge method relies on experimental strain measurements, which
may be affected by interfacial slip (Nagarag et al., 1997), local material properties or
membrane effects. In addition, this method is only capable of predicting flexural
stiffuess, but the low shear stiffness of composite sections relative to their flexural
stiffuess may result in significant shear deformations which should be accounted for
(Sotiropoulos et al., 1994; Nagaraj et al., 1997; Roberts and AI-Ubaidi, 2002).
12
Flexural and shear stiffness detemlined from both three- and four-point bending
tests on FRP composite shapes within the linear proportional limit tend to show good
agreement, suggesting that test results are representative of true section properties, rather
than an artefact of the test setup. However, in failure tests, these setups typically induce
crushing or bearing failure at the load points, necessitating the provision of reinforcement
in those regions (Sotiropoulos et al., 1994; Zureick et al, 1995; Lee et al., 1995; Bank et
al., 1996; Giroux and Shao, 2002). As the load points are located at critical regions
within the tested span, the presence of reinforcements may influence the section
properties and failure mode of the specimen.
Given the occurrence of crushing failures at the load points in the previous
concentrated load tests, an important advance made in this research was to develop a
uniform load testing method in order to establish the actual moment capacity of FRP
composite sheet pile panels, free of the confounding effects of such local crushing
failures. This would allow for a more realistic determination of moment capacity given
the actual mode of failure, which is critical to the design of sheet pile walls using these
panels. Uniform pressure tests have been previously used to evaluate the load carrying
capacity of various structural components, including cold-formed steel roofing
members(Bryan and Davies, 1984), reinforced concrete members (Adaszkiewicz, 1977;
Kemp, 1971) and sandwich panels (Roberts et al., 2002).
Composite sections are frequently subject to local buckling failures due to their
relatively thin-walled nature and low modulus (Qiao et al., 1999, 2001; Barbero, 2000).
13

This subject has been mostly overlooked, as it involves the study of anisotropic plates
under a range of load and boundary conditions, which can be quite complex. To date,
only a handful ofresearchers (Barbero and Raftoyiannis, 1993; Qiao et al., 2001; Kollar,
2003) have attempted to derive explicit expressions which could be used in practical
analysis. Most recently, Kollar (2003) analysed local buckling phenomena in open and
c10sed thin-walled FRP beams and columns and proposed a series of expressions to
predict local buckling behaviour in box-, 1-, C-, Z- and L-member subjected to axial or
bending loads.
2.2 - Past research on FRP sheet pile panels.
Currently, only a handful of published works exist concemmg the structural
behaviour of FRP composite sheet pile sections. The earliest of these studies was
conducted by the US Army Corps of Engineers Construction Productivity Advancement
Research (CPAR) Program (Lampo et al., 1998), investigating the performance of
various composite piling systems, inc1uding FRP composite sheet piles. The main
objective of the CP AR pro gram was to develop and test new high-performance polymer
piling systems, inc1uding the formulation of material standards, specifications and design
guidelines. Initial screening tests examining flexural stiffness (El) were conducted using
four-point bending tests on three different sheet pile sections. However, none of the
tested samples satisfied the minimum flexural stiffness (El) requirement of 9.19 x 10⁴
kN.m2/m. In an effort to increase flexural stiffness, individual panels were connected,
creating a honeycomb profile in order to increase the moment of inertia (1). The new
14
built-up profile with and without concrete infill was tested, showing a significant increase
in stiffness of 2.3 and 8.6 times, respectively, meeting minimum El requirements but still
failing to match the performance ofPZ-27 steel sheet piling (El = 5.18 x 10⁴ kN.m2/m).
Moment capacity of sheet piles manufactured by International Grating Composites, found
from 3- and 4-point bending tests, was reported to be 4.37 kN.m.
Giroux and Shao (2003) investigated similar FRP composite sheet pile panels,
with the objective of determining flexural (El) and shear stiffness (kAG) simultaneously,
based on Timoshenko's beam theory. Three- and four-point bending tests on six different
spans were conducted in order to obtain flexural and shear stiffness from the transverse
deformation of the piles within the linear proportionallimit. The experimentally obtained
flexural and shear stiffness values were found to differ by 5.4% and 13.0%, respectively,
between the three and four-point tests. The large discrepancy in shear stiffness was
thought to be attributable to the first order assumption of Timoshenko's beam theory. An
effort was also made to predict the stiffness parameters analytically based on the
characteristics of the reinforcement layers. The analytically predicted El differed by
2.4% and kAG by 7.3% from the experimental average. Failure tests were also
conducted with a four-point test setup to evaluate the maximum bending moment at
failure. Tests were performed on six different span lengths from 0.91 m to 6.1 m and
maximum moment was found to be 5.08 kN.m. Failure was due to local crushing
induced by high concentrated loads at the load points. (Shao, Y., 2004, personal
communication).
15

Bdeir (2001) researched the same FRP composite sheet pile panels in order to
develop a deflection based design approach and to characterize the flexural and shear
stiffness. Four-point bending tests were conducted within the linear proportionallimit on
twin connected panel configurations of Il different span lengths and the El and kAG
were determined using both mid- and quarter-point deflections, using a method similar to
that of Giroux and Shao (2003). The El predicted from mid and quarter point deflections
deviated by 2.3% while the kAG differed by 1.5%. Comparing these results with those
obtained by Giroux and Shao (2003), it was apparent that there was little variation in
behaviour due to the connected nature of the panel (see Table 2.1). Tests conducted on a
6.1 m span were characterised by excessive deflection up to L/46, where it was found that
the tensile strain developed in the sheet pile section was only 15% of the ultimate tensile
strain at failure obtained from coupon tests. These results suggest that tensile failure of
the section is unlikely, and that deflection limits may be of greater concem for composite
sheet piles. Maximum moment at a deflection of L/46 was found to be 5.2 kN.m (Shao,
Y., 2004, personal communication).
The structural properties of FRP sheet piles found in the tests of Giroux and Shao
(2003) and Bdeir (2001) are summarized in Table 2.1.
Table 2.1 - Results of prior studies on FRP composite sheet piles.
Study El kAG Mmax
(kN.m2) (kN) (kN.m)
Giroux and Shao, 2003 206.5 814 5.08
Bdeir, 2001 203.3 615 5.20
16
2.3 - Concrete-FRP hybrid beams.
Due to the thin-walled nature and low modulus of FRP composite shapes, they do
not exhibit tremendous stiffness and moment capacity relative to steel. Rence, a hybrid
design concept has been introduced in view of producing superior mechanical properties,
making use of concrete in conjunction with pultruded FRP composite shapes; the
princip le being to effectively complement the high tensile strength of FRP composites
with the high compressive resistance of concrete.
The idea of a hybrid concrete-FRP composite beam was first proposed by Rillman
and Murray (1990), who were interested in reducing the dead load in steel-frame
buildings. They proposed lightweight decks built with a combination of FRP sections
and concrete, which were over 50% lighter than comparable concrete decks.
Kavlicoglu et al. (2001) tested a hybrid concrete-graphite/epoxy girder under two
point loading conditions. An epoxy adhesive and steel stirrups were used to provide
shear connection between the concrete and composite girder. This study found that the
steel stirrups were effective at resisting horizontal shear forces and effectively contributed
to the load carrying capacity of the hybrid system following bond failure and slippage of
the concrete and composite elements. Finite element analysis and theoretical modelling
were both found to be effective in predicting the behaviour of the cross-section under
static loads.
17
Bayasi and Kaiser (2003) examined the flexural behaviour of carbon fibre epoxy
sections filled with plain or reinforced concrete, with the two elements connected by
shear studs. The specimens with steel-reinforced concrete were found to resist higher
loads than sections filled with plain concrete. Eight specimens were tested under four
point bending load, and were found to undergo premature failure of the inner shear studs
due to uneven load distribution. The authors suggested that a larger number of shear
studs were necessary to enhance composite action and prevent bearing failure and
consequent buckling of the carbon fibre epoxy section. Results showed that only a
fraction of the tensile strength of the carbon-fibre laminate was utilized upon failure, and
thus, the authors suggested either an increase in the number of shear studs or a better
shear transfer mechanism.
Nordin and Taljsten (2003) investigated the behaviour of glass-fibre composite 1-
beams which were strengthened with carbon fibres on the bottom flange, while a concrete
block was placed above the top flange. The concept behind this hybrid system was to
utilize the high stiffuess of carbon fibres and the high compressive strength of concrete,
along with an FRF composite beam to resist shear forces. Three arrangements of carbon
fibre reinforced I-beams were tested in this study; the first and second were bonded to the
concrete block with either mechanical anchors or epoxy adhesive, while the final
specimen was tested without concrete. These tests showed that it is possible to achieve
good composite action in the hybrid system. However, the FRF I-sections suffered from
lateral instabilities, necessitating the use of wood blocks as stiffeners over the supports.
The authors concluded that concrete in the compressive zone was essential for achieving
18

optimal stiffness and that the performance of FRP beams could be improved by
incorporating double webs.
Kitane et al (2004) tested a scale model of a concrete-FRP hybrid bridge
superstructure under static and fatigue conditions. These tests demonstrated that a
concrete-FRP hybrid structure was capable of meeting AASHTO live load deflection
recommendations with no significant stiffness degradation due to fatigue. Simple beam
analysis proved effective at predicting static behaviour of the hybrid bridge superstructure
under design load. However, more sophisticated analytical tools, such as finite element
analysis, are needed to predict hybrid section behaviour up to failure.
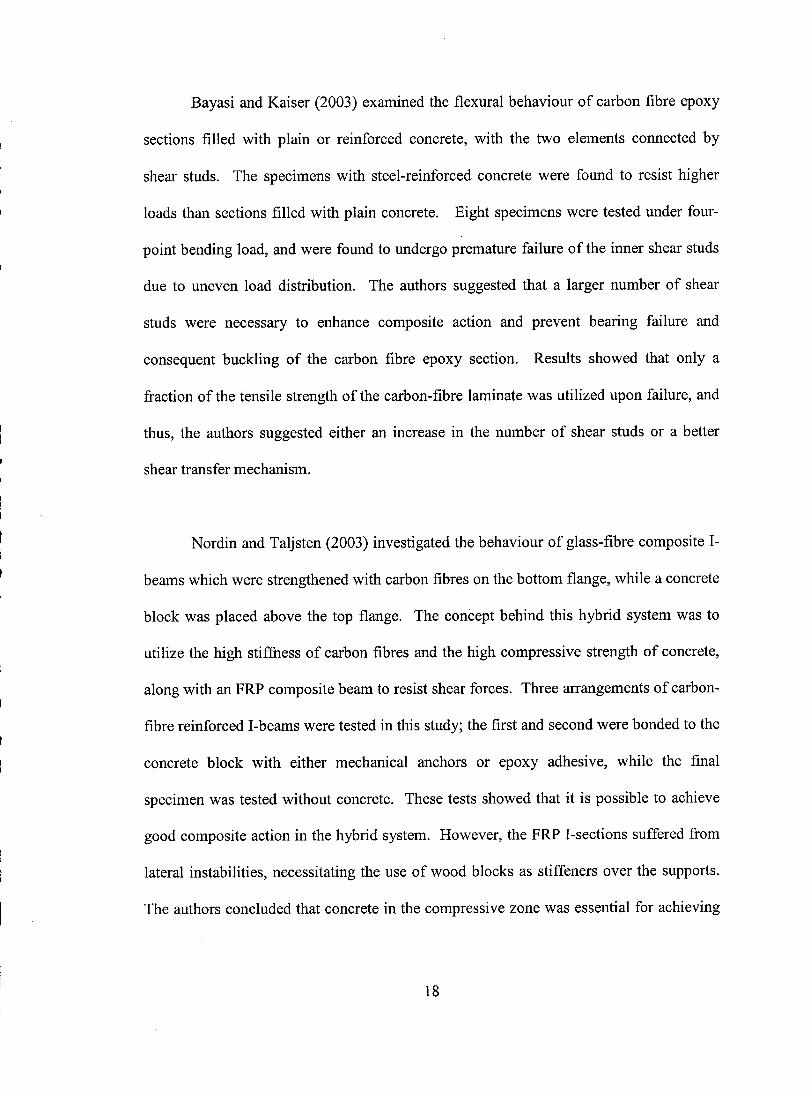
2.4 - Design of anchored sheet pile walls.
The design of retaining walls requires that two sets of ca1culations be performed,
the first to determine the forces which need to be resisted under design conditions, and
the second to ascertain the structural capacity of the wall itself to resist the applied forces.
Anchored sheet pile walls are constructed of connected panels driven into the soil,
and are supported by soil passive pressure on the front of the embedded portion of the
wall and by a wale beam on the upper end. The wale beam is itself supported by anchors
driven into the retained soil (Figure 2.1).
19
Wol-e J bea,.,..,
: ..
... '. .
. . ~ ~.
Ancho,.... rad
Figure 2.1 - Allchored sheet pile wall (Source: Broms, 2004).
Sheet pile walls, including the FRP composite variety, are commonly designed
using the Free Barth Support Method or the Fixed Barth Support Method. As the
interaction of the structure and soil is quite complex, these approaches are in fact
simplified (Bowles, 1996), but have been used to successfully design retaining walls for
many decades (Leonards, 1962). Figure 2.2 depicts the changing soil pressure
distribution and deflection behaviour of a typical anchored sheet pile with increasing
embedment depth (D).
20

c ...
(a) (b)
Figure 2.2 - Changing soil pressure distribution and deflection behavior of a typical anchored sheet
pile with increasing embedment depth (Source: Tsinker, 1997).
The Free Earth Support Method is based on the assumption that a sheet pile is
driven just deep enough such that the pile is stable against lateral displacements and the
shear strength of the soil is mobilised throughout the entire depth of embedment, as
shown in Figure 2.2a. The Fixed Earth Support Method is used when the pile is
embedded deeply enough in comparison with the height above dredge level that the
passive pressure in front of the wall is no longer fully mobilised (Figure 2.2b). As both
of these methods assume that active stress conditions are fully developed behind the wall,
the active stress distribution is calculated fairly accurately using Coulomb's or
Boussinesq's theories (Azizi, 2000). The Free Earth Method generally results In
minimum penetration but maximum bending moment and anchor force. Conversely, the
Fixed Earth Method results in maximum penetration and minimum bending moment and
anchor force (Tsinker, 1997). Details of both of these methods can be found in any
introductory foundation analysis text (ie. Azizi, 2000; Tsinker, 1997; Bowles, 1996).
21

Experimental studies have found the Free Earth Support Method to be
conservative, resulting in overdesign and uneconomical structures. Tschebotarioff
(1948), Rowe (1952) and Lasebnik (1961) found that the flexibility ofsheet piles enabled
the earth pressure behind the wall to redistribute, reducing bending moment and anchor
forces dramatically (Rowe,1952; Tsinker, 1997). As well, they found that the active
pressure exerted on flexible walls is 25-30% smaller than that acting on rigid walls, and
that the triangular passive pressure distribution obtained by Coulomb's theory is only
valid for rigid piles driven into loose sand. Conversely, the maximum bending moment
and anchor force of sheet piles in dense soil is largely dependent upon the yielding
capacity of the anchor. Rence, Rowe (1952) developed moment reduction coefficients
which can be used to reduce the calculated maximum moment exerted upon a flexible
sheet pile wall, which depend on wall geometry, wall flexibility and foundation soil
characteristics (AS CE, 1996). An in-depth review of pressure redistribution of flexible
piles can be found in Tsinker (1997). As composite sheet pile walls are even more
flexible than steel pilings, Rowe's moment reduction approach can potentially be taken
advantage of in the design of composite retaining walls.
As evidenced by the literature reVlew, very few studies have focused on
determining the ultimate capacity and deflection behaviour of FRP composite sheet piles,
in spite of the fact that they are already being used in structural applications. The current
research therefore attempts to correct this critical informational deficit in order to allow
for more effective use ofFRP composite sheet piles in civil engineering projects.
22
CHAPTER3
EXPERIMENTAL PRO GRAM
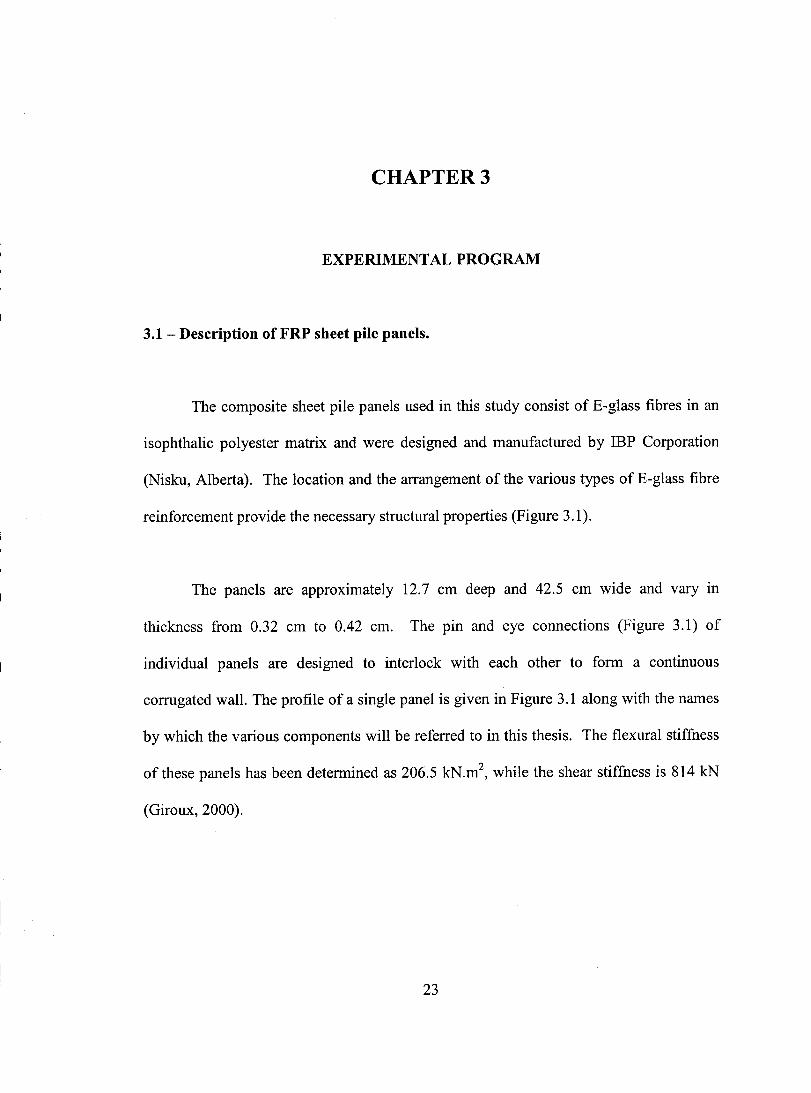
3.1 - Description of FRP sheet pile panels.
The composite sheet pile panels used in this study consist of E-glass fibres in an
isophthalic polyester matrix and were designed and manufactured by IBP Corporation
(Nisku, Alberta). The location and the arrangement of the various types of E-glass fibre
reinforcement provide the necessary structural properties (Figure 3.1).
The panels are approximately 12.7 cm deep and 42.5 cm wide and vary in
thickness from 0.32 cm to 0.42 cm. The pin and eye connections (Figure 3.1) of
individual panels are designed to interlock with each other to form a continuous
corrugated wall. The profile of a single panel is given in Figure 3.1 along with the names
by which the various components will be referred to in this thesis. The flexural stiffness
of these panels has been determined as 206.5 kN.m2, while the shear stiffness is 814 kN
(Giroux, 2000).
23

Eye web
~ Eye/
Eye flange /
/MainWebS
Pin flang e Pin web
" / 0====~ -Pin
Main flange /
Figure 3.1 - Cross-sectional view of the FRP composite sheet piles used in this study.
3.2 - Overview of experimental procedure.
The experimental investigation of FRP composite sheet pile panels consisted of four
major parts:
1) Structural performance under uniform pressure load.
2) Identification ofthe failure mechanism.
3) Determination ofmoment capacity.
4) Testing of concrete composite hybrid beam.
A special testing apparatus was constructed in order to exert a uniformly
distributed load on single, connected and FRP-concrete hybrid sheet pile panels through
the inflation of an airbag. Structural testing was performed on seven single panels, four
sets of connected panels, and two concrete filled panels; all having a span of 2.13 m (7ft)
and simply supported boundary conditions. The single panel test was conducted in two
different orientations, designated as upright or inverted, as shown in Figure 3.2. The
24
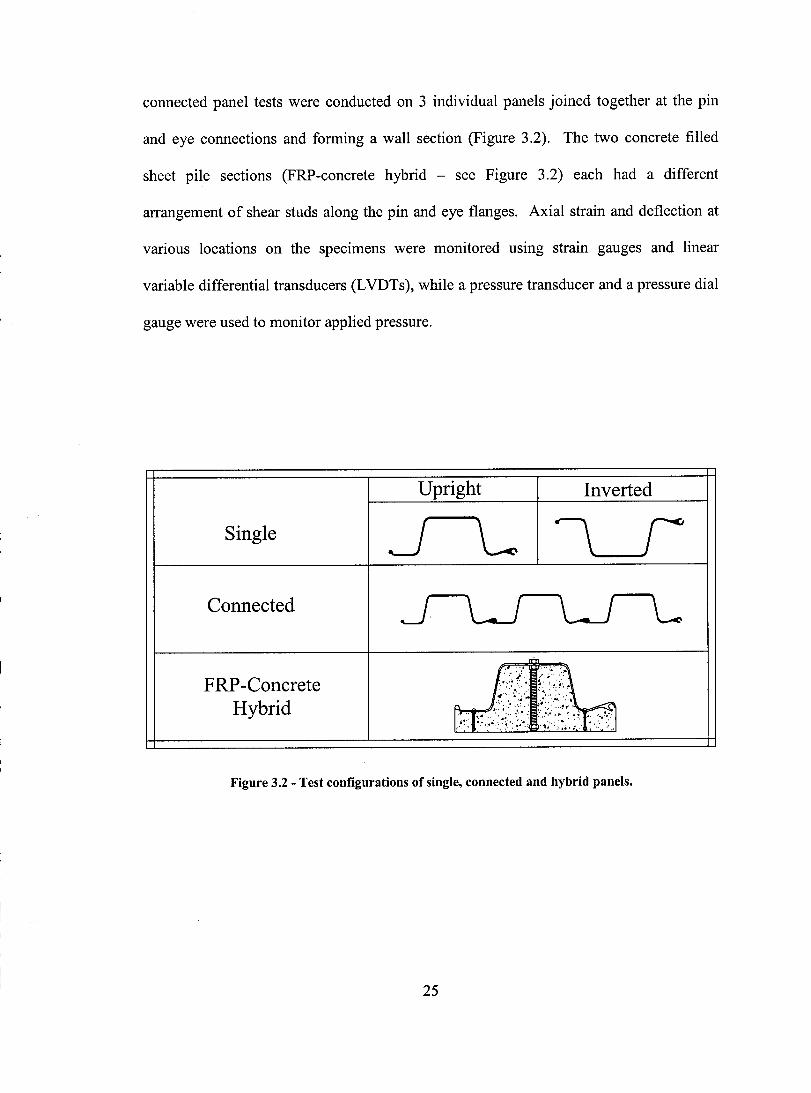
connected panel tests were conducted on 3 individual panels joined together at the pin
and eye connections and fonning a wall section (Figure 3.2). The two concrete filled
sheet pile sections (FRP-concrete hybrid - see Figure 3.2) each had a different
arrangement of shear studs along the pin and eye flanges. Axial strain and deflection at
various locations on the specimens were monitored using strain gauges and linear
variable differential transducers (LVDTs), while a pressure transducer and a pressure dial
gauge were used to monitor applied pressure.
Single
Connected
FRP -Concrete Hybrid
Upright
LI
lnverted
LI
Figure 3.2 - Test configurations of single, connected and hybrid panels.
25

3.3 - Experimental setup.
3.3.1 - Test frame.
AlI destructive testing of sheet pile panels under uniform load was carried out in
the Jamieson Structural Laboratory of McGill University, Canada. The loading apparatus
consisted of a specially constructed test frame (Figure 3.3) which was anchored firmly to
the strong testing floor of the laboratory. A schematic of the test setup is shown in Figure
3.4.
Figure 3.3 - Test frame used for testing of single FRP sheet pile panels.
26
SpeciMen
(a) Test setup schematic.
~ Anchors Channel
fOl fOl fOl r-
~ 1 . . /~
Top support bars _ -------r-
l 1 A
1 . . 1
w w w w '-- -
(b) Elevation view of the test frame for the single panel configuration.
Pin support bar (top)
SpeciMen
Pin support bar (bottOM)
(c) Section A-A
Figure 3.4 - Typical single panel test frame.
27
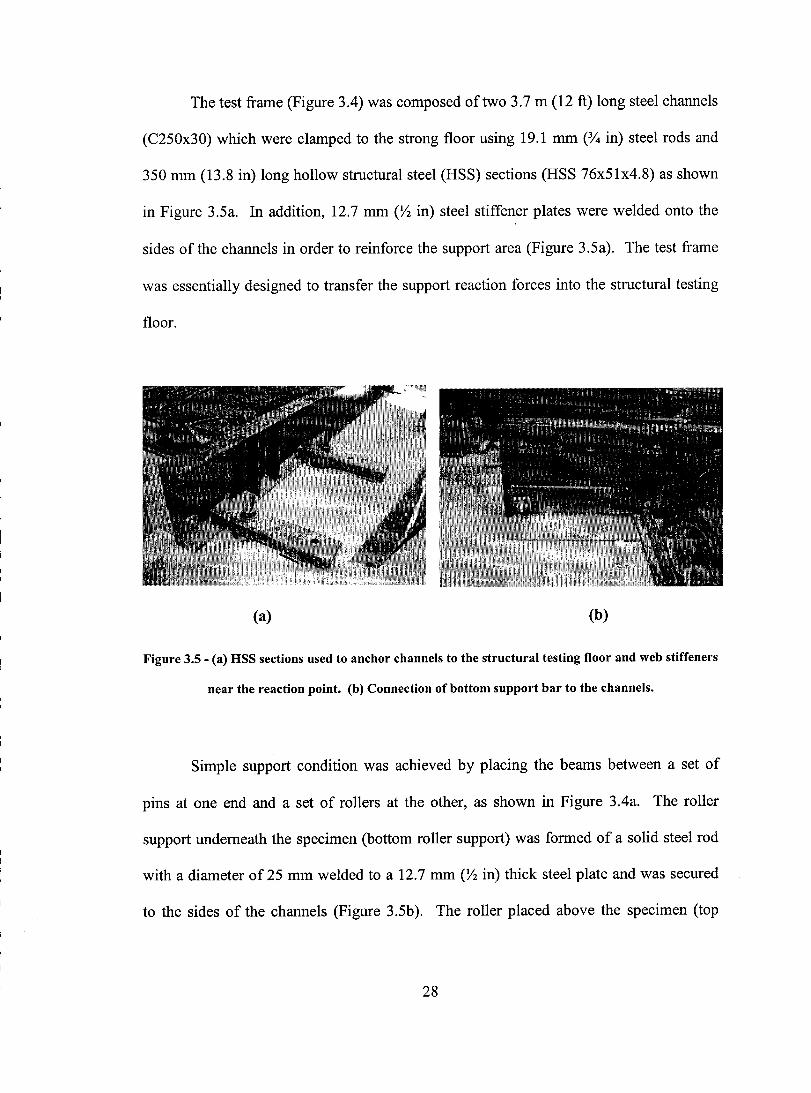
The test frame (Figure 3.4) was composed oftwo 3.7 m (12 ft) long steel channels
(C250x30) which were c1amped to the strong floor using 19.1 mm (% in) steel rods and
350 mm (13.8 in) long hollow structural steel (HSS) sections (HSS 76x51x4.8) as shown
in Figure 3.5a. In addition, 12.7 mm (Y2 in) steel stiffener plates were welded onto the
sides of the channels in order to reinforce the support area (Figure 3.5a). The test frame
was essentially designed to transfer the support reaction forces into the structural testing
floor.
(a) (b)
Figure 3.5 - (a) HSS sections used to anchor channels to the structural testing floor and web stiffeners
near the reaction point. (b) Connection ofbottom support bar to the channels.
Simple support condition was achieved by placing the beams between a set of
pins at one end and a set of rollers at the other, as shown in Figure 3.4a. The roller
support undemeath the specimen (bottom roller support) was formed of a solid steel rod
with a diameter of 25 mm welded to a 12.7 mm (Y2 in) thick steel plate and was secured
to the sides of the channels (Figure 3.5b). The roller placed above the specimen (top
28
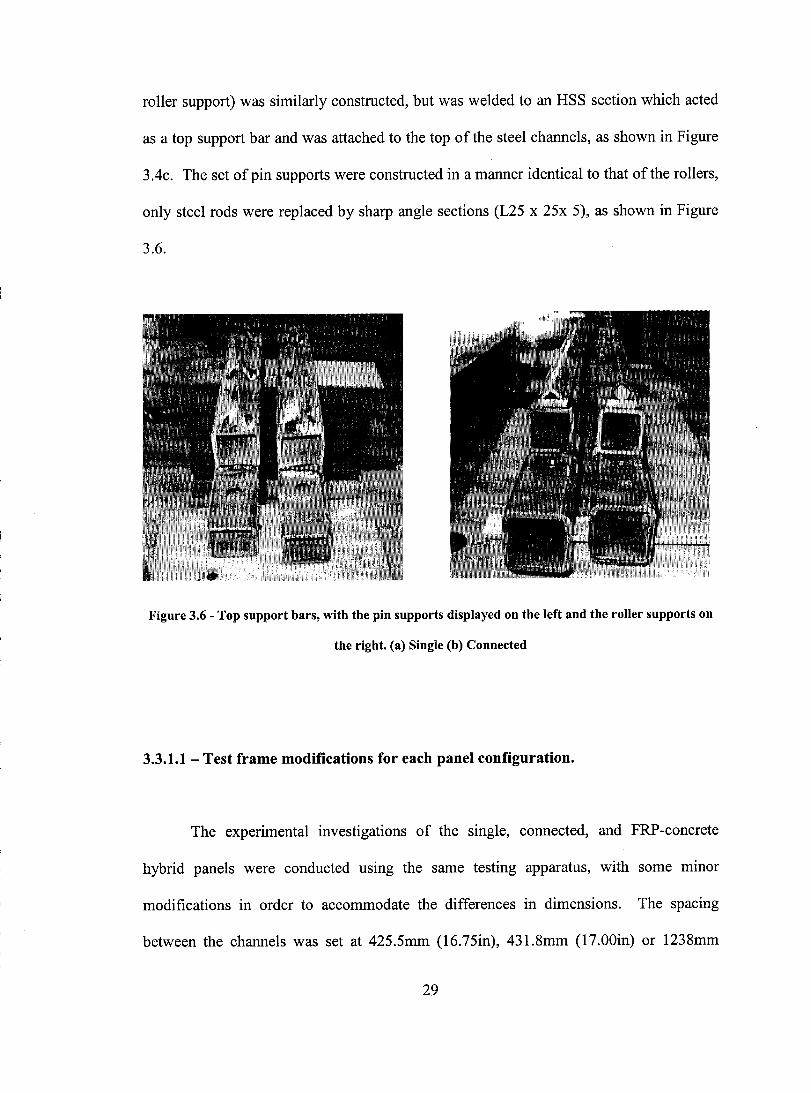
roUer support) was similarly constructed, but was welded to an HSS section which acted
as a top support bar and was attached to the top of the steel channels, as shown in Figure
3.4c. The set of pin supports were constructed in a manner identical to that of the roUers,
only steel rods were replaced by sharp angle sections (L25 x 25x 5), as shown in Figure
3.6.
Figure 3.6 - Top support bars, with the pin supports displayed on the left and the roUer supports on
the right. (a) Single (b) Connected
3.3.1.1 - Test frame modifications for each panel configuration.
The experimental investigations of the single, connected, and FRP-concrete
hybrid panels were conducted using the same testing apparatus, with sorne mmor
modifications in order to accommodate the differences in dimensions. The spacing
between the channels was set at 425.5mm (16.75in), 431.8mm (17.00in) or 1238mm
29
(48.74in) in order to accommodate the width of the single, FRP-concrete hybrid and
connected panels, respectively. Spacing slightly larger than the actual panel dimension
was used in order to minimize the interaction of the panels with the confining channels.
For both the single panels and FRP-concrete hybrid beams 700mm long (HSS
76x76x6.4) top and bottom support bars were used, however, for the connected panels,
1500mm support bars were used, simulating the simple support condition in a similar
manner to the single panel test (Figure 3.6b).
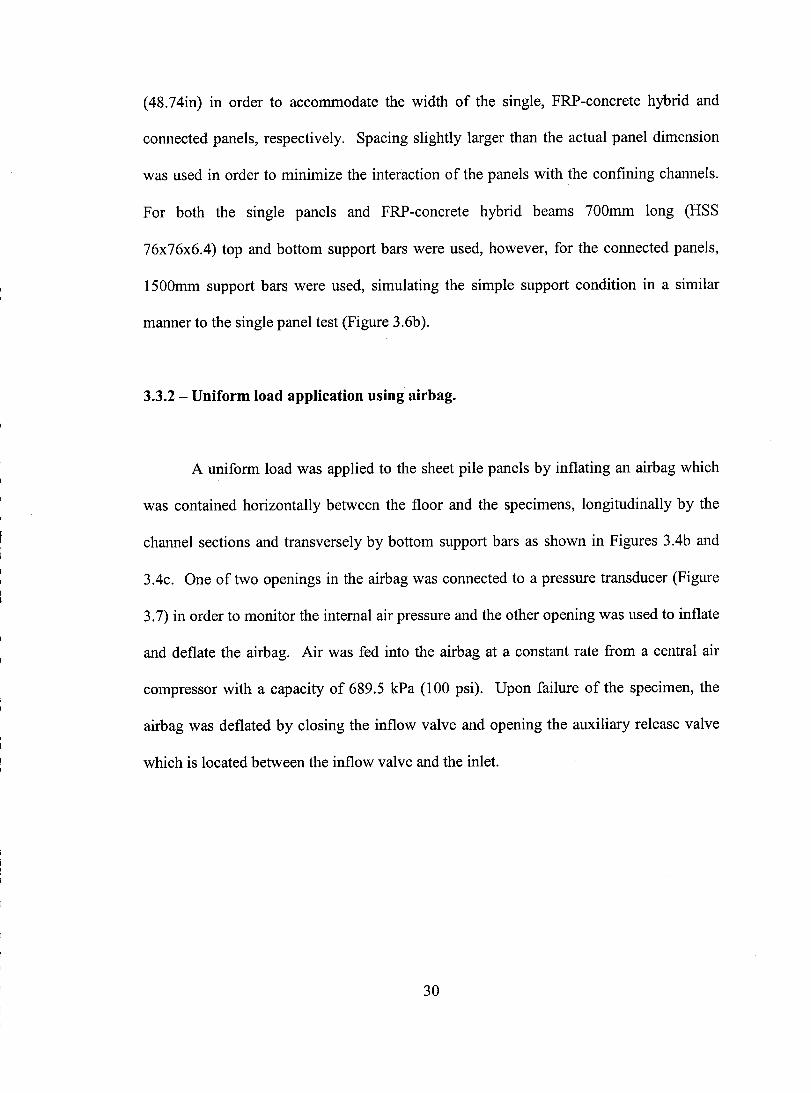
3.3.2 - Uniform load application using airbag.
A uniform load was applied to the sheet pile panels by inflating an airbag which
was contained horizontally between the floor and the specimens, longitudinally by the
channel sections and transversely by bottom support bars as shown in Figures 3.4b and
3.4c. One of two openings in the airbag was connected to a pressure transducer (Figure
3.7) in order to monitor the internaI air pressure and the other opening was used to inflate
and deflate the airbag. Air was fed into the airbag at a constant rate from a central air
compressor with a capacity of 689.5 kPa (100 psi). Upon failure of the specimen, the
airbag was deflated by c10sing the inflow valve and opening the auxiliary release valve
which is located between the inflow valve and the inlet.
30
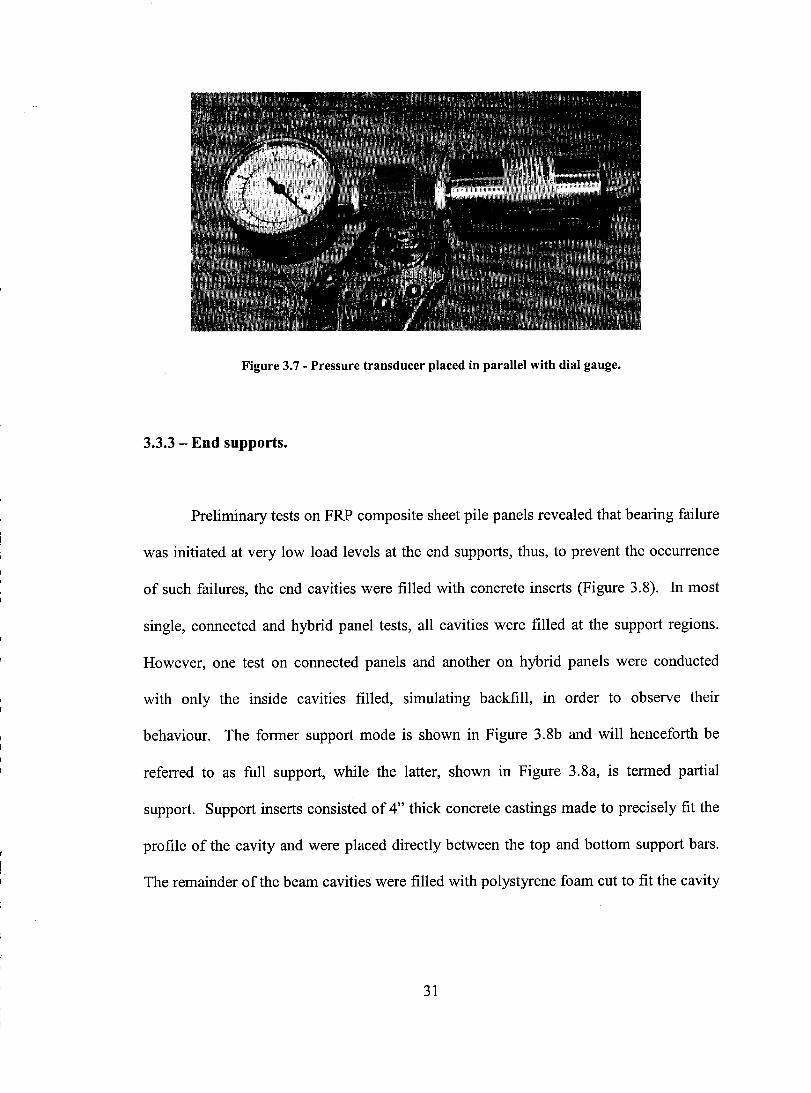
Figure 3.7 - Pressure transducer placed in parallel with dial gauge.
3.3.3 - End supports.
Preliminary tests on FRP composite sheet pile panels revealed that bearing failure
was initiated at very low load levels at the end supports, thus, to prevent the occurrence
of such failures, the end cavities were filled with concrete inserts (Figure 3.8). In most
single, connected and hybrid panel tests, aIl cavities were filled at the support regions.
However, one test on connected panels and another on hybrid panels were conducted
with only the inside cavities filled, simulating backfill, in order to observe their
behaviour. The former support mode is shown in Figure 3.8b and will henceforth be
referred to as full support, while the latter, shown in Figure 3.8a, is termed partial
support. Support inserts consisted of 4" thick concrete castings made to precisely fit the
profile of the cavity and were placed directly between the top and bottom support bars.
The remainder of the beam cavities were filled with polystyrene foam cut to fit the cavity
31
shape, so as to provide a level surface for the application of a uniform pressure load
(Figure 3.9).
Figure 3.8 - Bearing reinforcements at the support regions. (a) Partial (b) Full
Figure 3.9 - Polystyrene foam and concrete inserts.
32
3.3.4 - Instrumentation.
Axial strain and deflection at midspan were measured using strain gauges and
LVDTs, respectively, while applied uniform load (air pressure) was measured using a
pressure transducer. The pressure transducer (InterTechnology, model GP:50) had a
range of 0-689.5 kPa (0-100 psi) and was connected in parallel with a dial pressure gauge
with a range of 0-103 kPa (0-15 psi) in order to independently verify the pressure
readings, as shown in Figure 3.7. Axial strain on aIl specimens was measured using
Tokyo Sokki Kenkyujo Co., Ltd. 120 ± 0.3Q resistance electrical strain gauges with a
gauge length of 5 mm and a gauge factor of 2.13 ± 1 % , which were mounted parallel to
the longitudinal axis of the specimen. Solartron (DCR 50) L VDTs with a range of 100
mm were used to measure deflection at midspan. The L VDTs were mounted onto a steel
bar which spanned the width of the test frame, as shown in Figure 3.10. Data collected
from each device was recorded simultaneously using a Vishay Measurement Group
System 5000 data acquisition system and Strain Smart 3.10v software. The rate at which
the data points were recorded varied between tests from 5 per second to 2 per second.
33
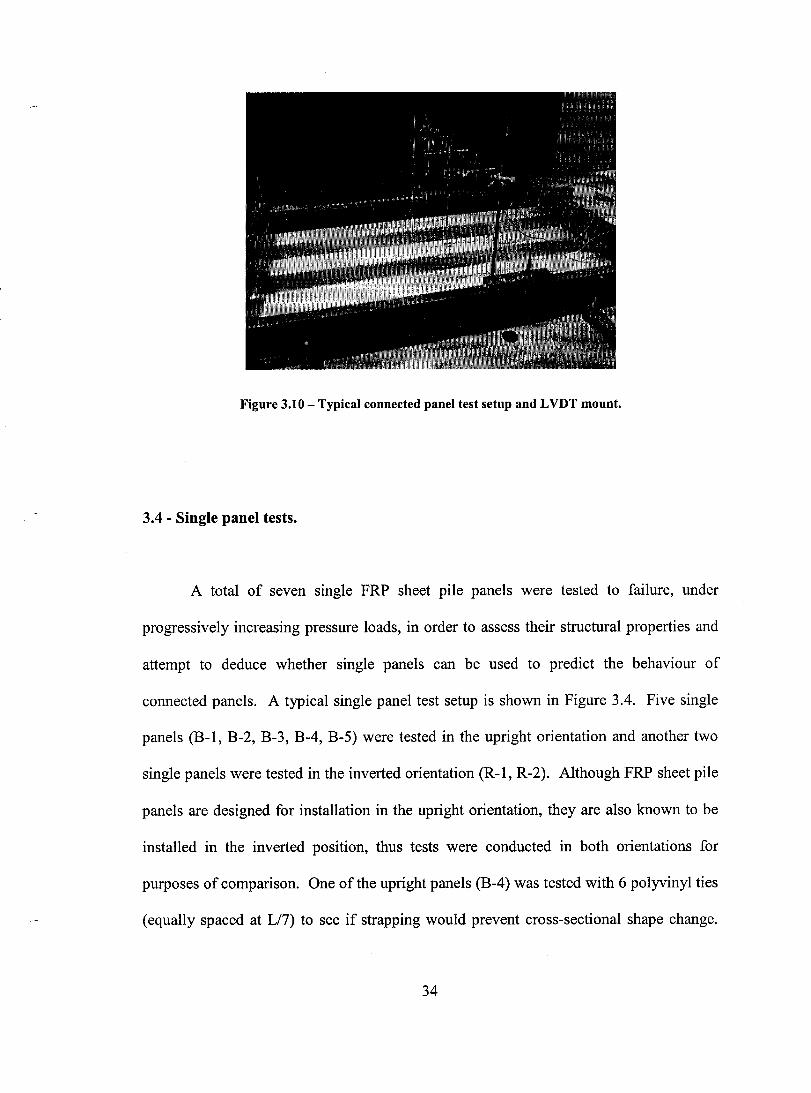
Figure 3.10 - Typical connected panel test setup and L VDT mount.
3.4 - Single panel tests.
A total of seven single FRP sheet pile panels were tested to failure, under
progressively increasing pressure loads, in order to assess their structural properties and
attempt to deduce whether single panels can be used to predict the behaviour of
connected panels. A typical single panel test setup is shown in Figure 3.4. Five single
panels (B-l, B-2, B-3, B-4, B-5) were tested in the upright orientation and another two
single panels were tested in the inverted orientation (R-l, R-2). Although FRP sheet pile
panels are designed for installation in the upright orientation, they are also known to be
installed in the inverted position, thus tests were conducted in both orientations for
purposes of comparison. One of the upright panels (B-4) was tested with 6 polyvinyl ties
(equally spaced at LI7) to see if strapping would prevent cross-sectional shape change.
34
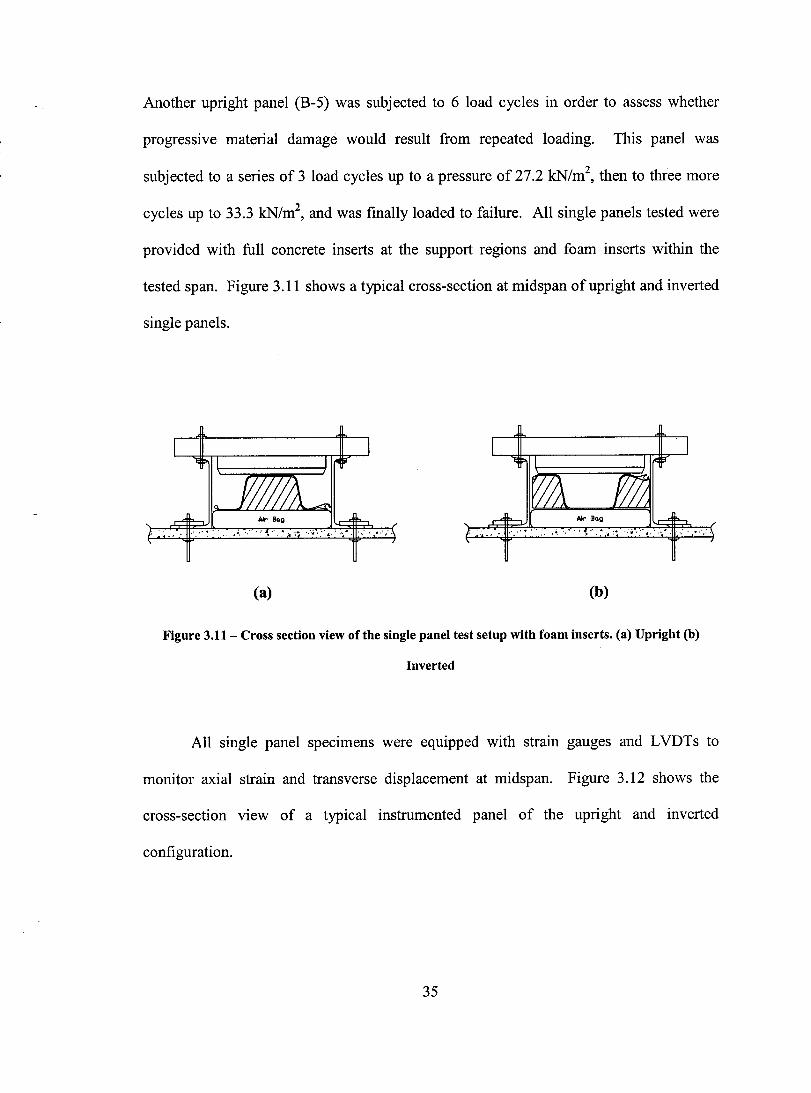
Another upright panel (B-5) was subjected to 6 load cycles in order to assess whether
progressive material damage would result from repeated loading. This panel was
subjected to a series of 3 load cycles up to a pressure of 27.2 kN/m2, then to three more
cycles up to 33.3 kN/m2, and was finally loaded to failure. AlI single panels tested were
provided with full concrete inserts at the support regions and foam inserts within the
tested span. Figure 3.11 shows a typical cross-section at midspan ofupright and inverted
single panels.
(a) (b)
Figure 3.11- Cross section view of the single panel test setup with foam inserts. (a) Upright (b)
Inverted
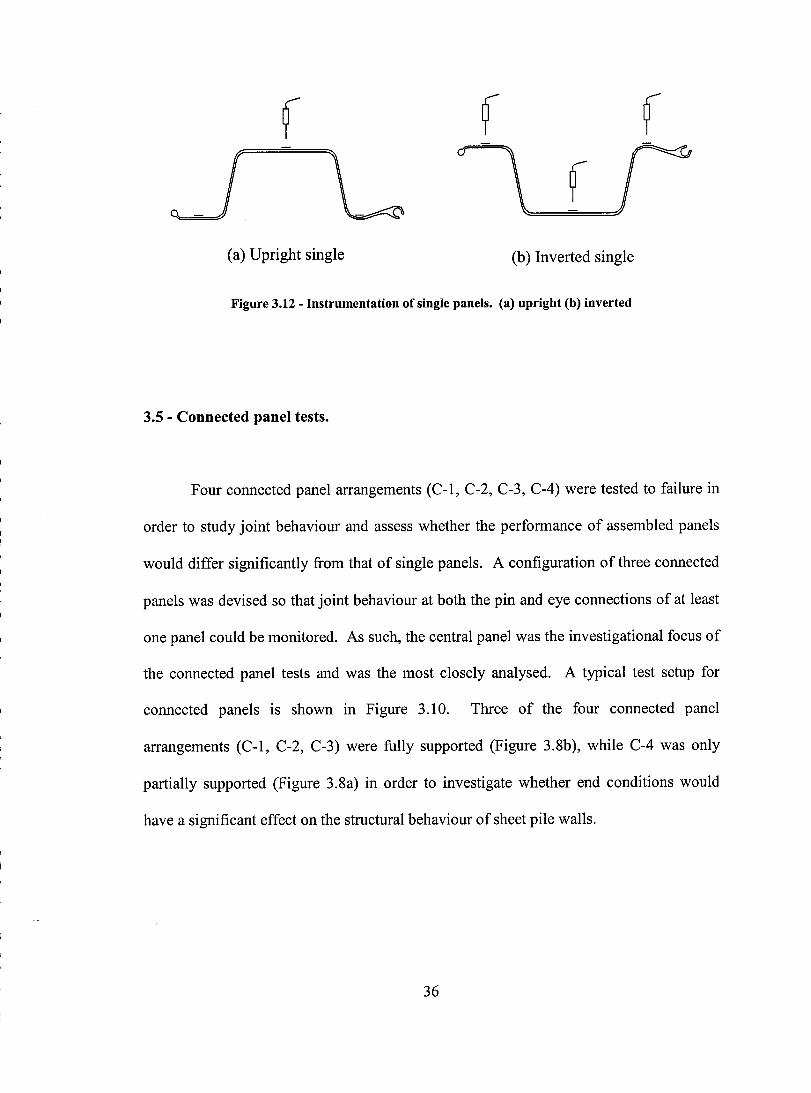
AU single panel specImens were equipped with strain gauges and L VDTs to
monitor axial strain and transverse displacement at midspan. Figure 3.12 shows the
cross-section view of a typical instrumented panel of the upright and inverted
configuration.
35
f f f / L
d
\ r f 0.
(a) Upright single (b) Inverted single
Figure 3.12 - Instrumentation of single panels. (a) upright (b) inverted
3.5 - Connected panel tests.
Four connected panel arrangements (C-l, C-2, C-3, C-4) were tested to failure in
order to study joint behaviour and assess whether the performance of assembled panels
would differ significantly from that of single panels. A configuration of three connected
panels was devised so that joint behaviour at both the pin and eye connections of at least
one panel could be monitored. As such, the central panel was the investigational focus of
the connected panel tests and was the most c10sely analysed. A typical test setup for
connected panels is shown in Figure 3.10. Three of the four connected panel
arrangements (C-l, C-2, C-3) were fully supported (Figure 3.8b), while C-4 was only
partially supported (Figure 3.8a) in order to investigate whether end conditions would
have a significant effect on the structural behaviour of sheet pile walls.
36

f f J Panel 1 Panel 3 L a
(a) C-l
f f f a J U L
(b) C-2
f a J L
(c) C-3
f f f
~ L LVDT
Stra.in gua.ge
(d) C-4
Figure 3.13 - Instrumentation of connected panel tests at mid-span. (a) C-l (b) C-2 (c) C-3 (d) C-4
37
The instrumentation of the connected panels at mid section is depicted in Figure
3.13. Specimen C-1 was only equipped with LVDTs to measure transverse displacement
of the main flange of panels 1, 2 and 3. Specimens C-2 and C-4 had identical LVDT
configurations to C-1, but were also equipped with strain gauges at midsection, and C-2
had sorne additional strain gauges in the center of the main webs. The strain gauge
configuration of C-3 was similar to that of C-2, however, an additional strain gauge was
placed on the pin flange to better monitor strain variation due to lateral spreading.
Furthermore, panels 1 and 3 of C-3 were not instrumented, as it was decided that all
measurements of C-3 should be focused on the middle panel. L VDTs for C-3 were
placed on the pin, main, and eye flanges of the middle panel (2) to monitor the transverse
movement of the pin and eye flanges relative to the main flange.
3.6 - FRP-concrete hybrid panels.
Two FRP-concrete hybrid panels (H-1 and H-2) with a length of2.13m (7ft) were
tested to failure. Fly ash concrete with a compressive strength of 16.5MPa was used to
backfill the sheet pile to a thickness of 50.8mm (2in) above the pin and eye flanges as
shown in Figure 3.14. The mix proportion for a 1m3 volume of fly ash concrete is as
follows: cement (150 kg): fly ash (100 kg): fine aggregate-sand (900 kg) course
aggregate-1I4" gravel (1100 kg): water (27.7 kg). Carriage bolts (3/8 in x 2 in) were
secured to the pin and eye flanges through ho les drilled in their centres. These acted as
shear studs promoting composite action between the concrete and FRP-panel. Specimens
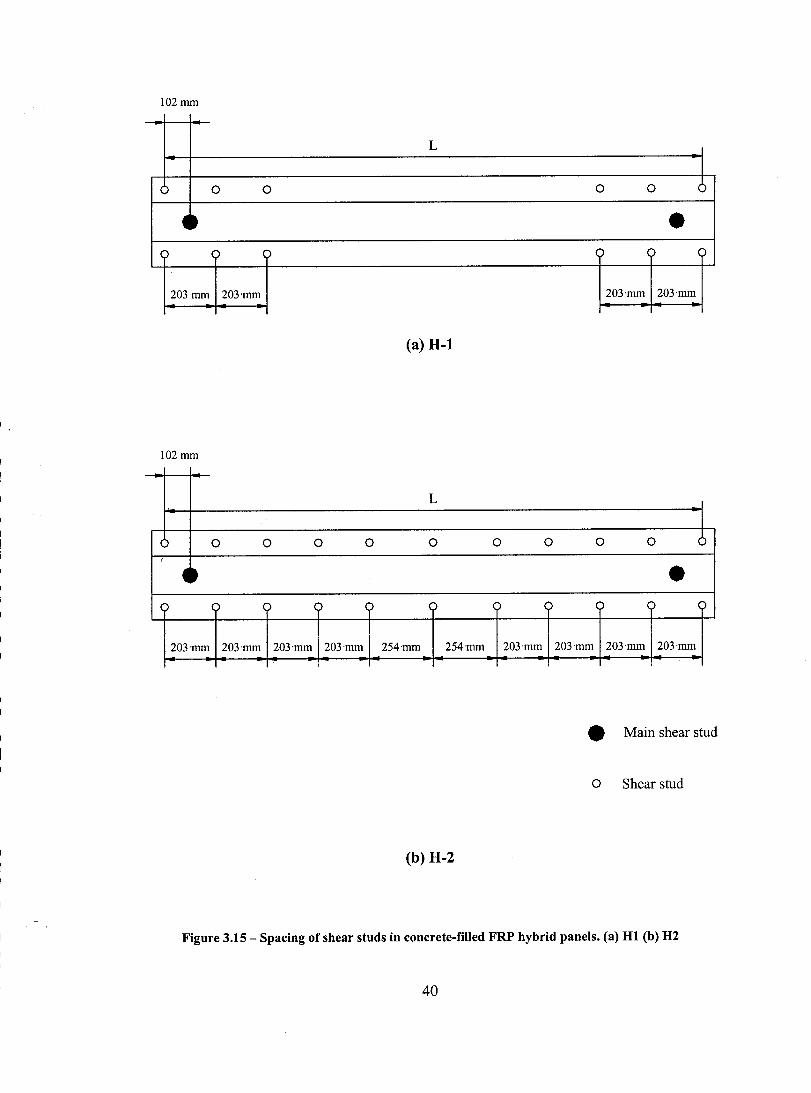
H-1 and H-2 had a total of 14 and 24 studs, respectively, which spanned the beams
38

beginning directly under the support region. For H -1, the studs were concentrated near
the end regions, while the studs for H-2 were spread throughout its length, with the
spacing for both beams outlined in Figure 3.15. In addition, two main shear connectors
per beam were placed 50.8mm (2in) away from the support at both ends. Main shear
connectors consisted of threaded rods (% in x 7 in) fastened through a hole drilled in the
main flange and secured by nuts on the bottom and top of the flange as depicted in Figure
3.14.
.' ..
ê 00 ci
::~: ~~~Y2~·· ~ Shearstud
~~----~---_. __ ._----------------_. __ ._------_. __ ._-------------------~.~~.~~.~~-~
Figure 3.14 - Cross-sectional view of a concrete-filled FRP hybrid panel.
39
102 mm
L
( 0 0 0 0 (
t. • <) 0 <) q <) <)
203·mm 203·mm 203·mm 203·mm
(a) H-l
102 mm
L 1
( 0 0 0 0 0 0 0 0 0 0
t. • <) <) q ( ( ( ( ) q q <)
203·mm 203·mm 203·mm 203 mm 254·mm 254·mm 203·mm 203·mm 203·mm 203·mm
• Main shear stud
o Shear stud
(b) H-2
Figure 3.15 - Spacing of shear studs in concrete-filled FRP hybrid panels. (a) Hl (b) H2
40

The hybrid cross-section developed in this study was equipped with L VDTs and
strain gauges to monitor the transverse deflections and axial strains, respectively, of the
pin, eye and main flanges and the main webs ofthe FRP section, as shown in Figure 3.16.
(a) H-l (b) H-2
Figure 3.16 - Instrumentation of FRP-concrete hybrid panels. (a) H-l (b) H-2
No fillers were provided in the end regions of panel H -1, since the inside cavity
was filled with concrete. However, as sorne failure was observed in the end regions ofH-
1, specimen H-2 was fully supported at end region.
41
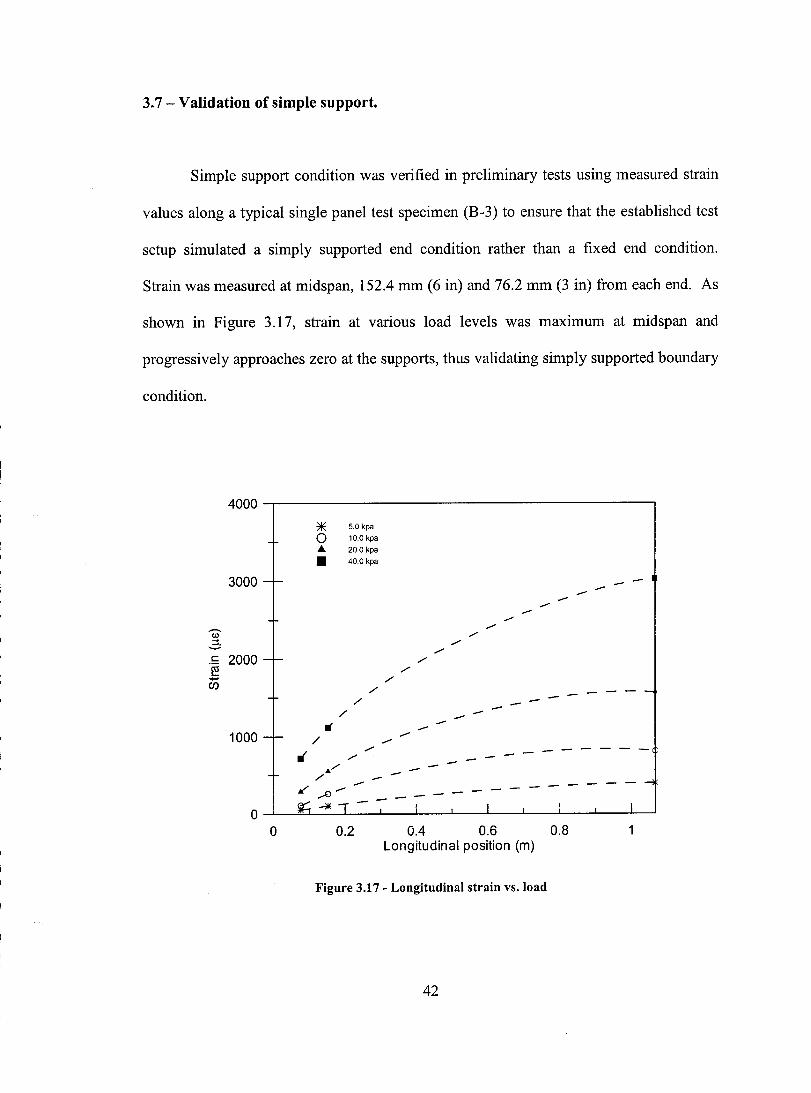
3.7 - Validation of simple support.
Simple support condition was verified in preliminary tests using measured strain
values along a typical single panel test specimen (B-3) to ensure that the established test
setup simulated a simply supported end condition rather than a fixed end condition.
Strain was measured at midspan, 152.4 mm (6 in) and 76.2 mm (3 in) from each end. As
shown in Figure 3.17, strain at various load levels was maximum at midspan and
progressively approaches zero at the supports, thus validating simply supported boundary
condition.
4000-r--------------------------------------~
3000 -r-
.S 2000-f-
1000 -f-ri
o
* 5.0kpa o 10.0kpa
... 20.0 kpa
• 40.0 kpa
,/
,/
,/
• /
/' /'
0.2
----/'
/' /'
/' ,,-
,,-/'
-------------.....-.....--- ------
0.4 0.6 0.8 Longitudinal position (m)
Figure 3.17 - Longitudinal strain vs. load
42
CHAPTER4
THEORETICAL FRAMEWORK
4.1 - Timoshenko's beam theory.
Composite beams typically undergo deflections resulting from bending and shear
deformation, which is generally accounted for in design using Timoshenko's beam
theory. This theory can be thought of as an advance over c1assical beam theory (Euler
Bernoulli) as it accounts for shear deflection (Timoshenko, 1968). Total deflection (8) of
a beam can be predicted in the linear elastic range by superimposing the separately
calculated effects ofbending and shear (Timoshenko, 1968):
(4.1)
Deflection due to bending (ôb ) and shear (ôs ) stresses is governed by the bending
stiffuess (El) and shear stiffuess (kAG) respectively. Generally, shear deformations of
metallic beams are neglected as the shear modulus is high (G ~ El 2.5), however,
composite beams undergo significant shear deformation due to their low modulus (about
E/IO or less), which should be accounted for in design (Barbero, 1999). The governing
43
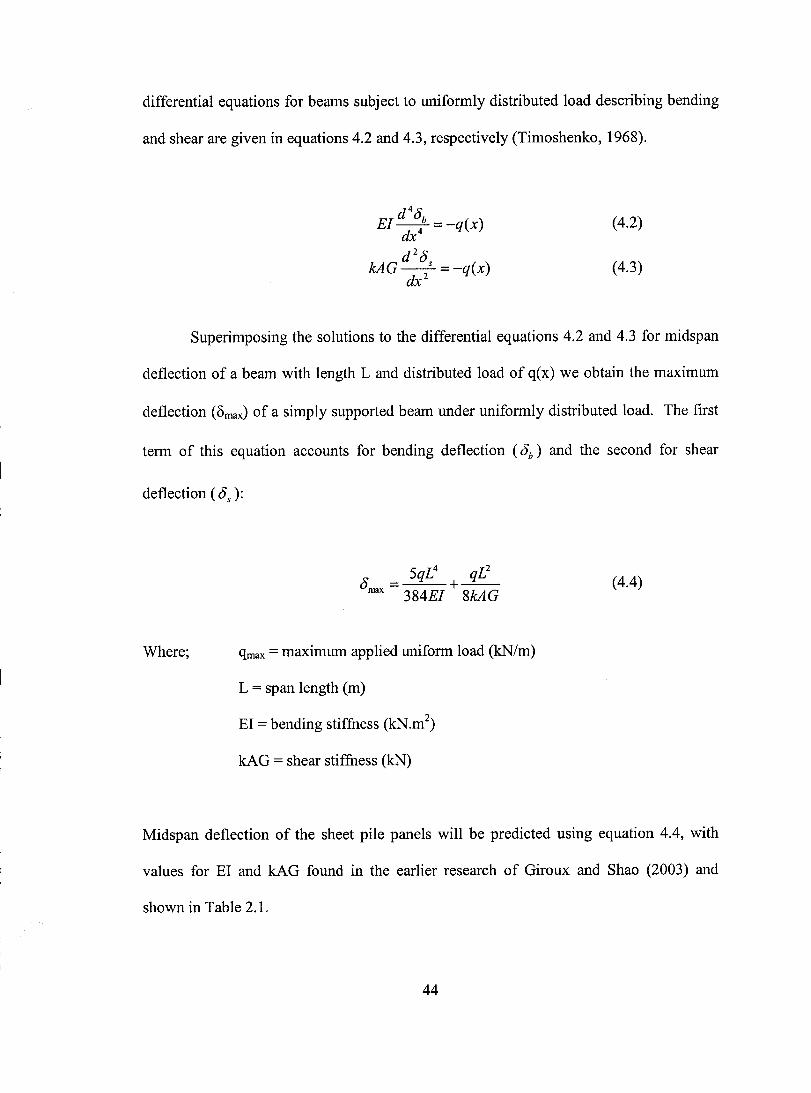
differential equations for beams subject to uniformly distributed load describing bending
and shear are given in equations 4.2 and 4.3, respectively (Timoshenko, 1968).
(4.2)
(4.3)
Superimposing the solutions to the differential equations 4.2 and 4.3 for midspan
deflection of a beam with length Land distributed load of q(x) we ob tain the maximum
deflection (8max) of a simply supported beam under uniformly distributed load. The first
term of this equation accounts for bending deflection (5b ) and the second for shear
deflection (5. ):
Where;
5qL4 qL2
5 = +-max 384EI 8kAG
qmax = maximum applied uniform load (kN/m)
L = span length (m)
El = bending stiffuess (kN.m2)
kAG = shear stiffness (kN)
(4.4)
Midspan deflection of the sheet pile panels will be predicted using equation 4.4, with
values for El and kAG found in the earlier research of Giroux and Shao (2003) and
shown in Table 2.1.
44
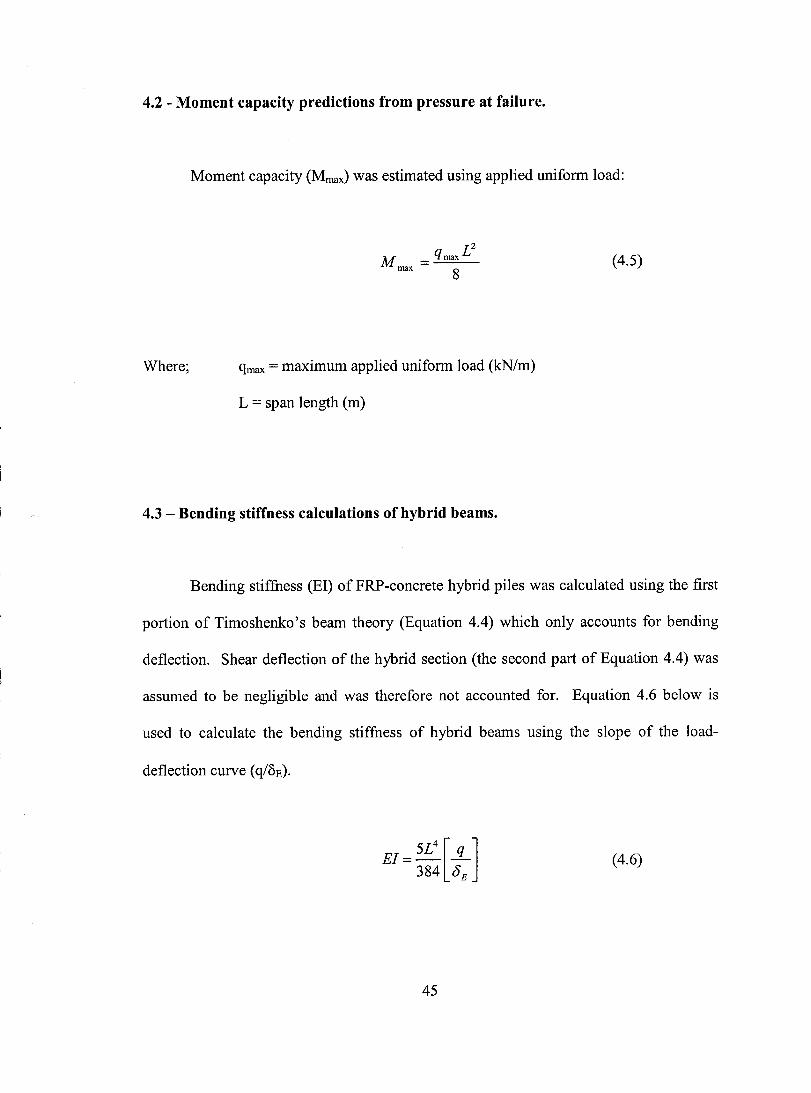
4.2 - Moment capacity predictions from pressure at failure.
Moment capacity (Mmax) was estimated using applied uniform load:
(4.5)
Where; qmax = maximum applied uniform load (kN/m)
L = span length (m)
4.3 - Bending stiffness calculations of hybrid beams.
Bending stiffness (El) of FRP-concrete hybrid piles was calculated using the first
portion of Timoshenko's beam theory (Equation 4.4) which only accounts for bending
deflection. Shear deflection of the hybrid section (the second part of Equation 4.4) was
assumed to be negligible and was therefore not accounted for. Equation 4.6 below is
used to calculate the bending stiffness of hybrid beams using the slope of the load-
deflection curve (q/OE).
El = 5L4 [L]
384 0E
45
(4.6)
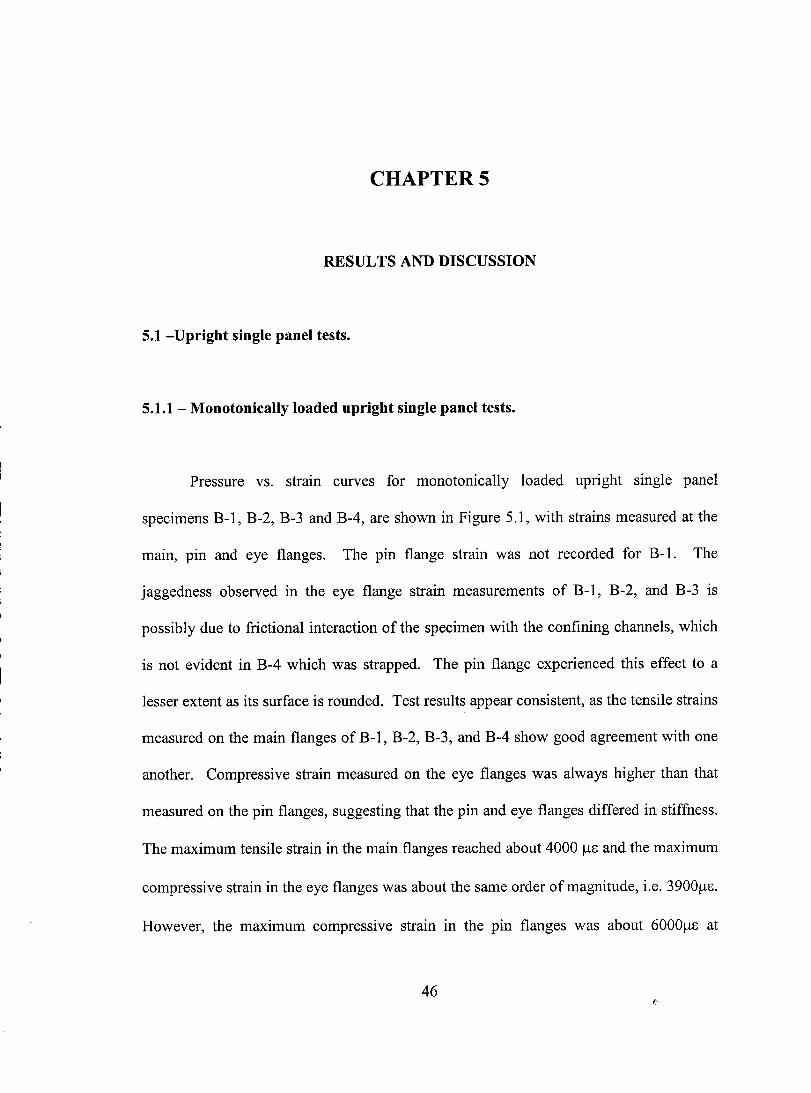
CHAPTER5
RESULTS AND DISCUSSION
5.1 -Upright single panel tests.
5.1.1 - Monotonically loaded upright single panel tests.
Pressure vs. strain curves for monotonically loaded upright single panel
specimens B-l, B-2, B-3 and B-4, are shown in Figure 5.1, with strains measured at the
main, pin and eye flanges. The pin flange strain was not recorded for B-l. The
jaggedness observed in the eye flange strain measurements of B-l, B-2, and B-3 is
possibly due to frictional interaction of the specimen with the confining channels, which
is not evident in B-4 which was strapped. The pin flange experienced this effect to a
lesser extent as its surface is rounded. Test results appear consistent, as the tensile strains
measured on the main flanges ofB-l, B-2, B-3, and B-4 show good agreement with one
another. Compressive strain measured on the eye flanges was always higher than that
measured on the pin flanges, suggesting that the pin and eye flanges differed in stiffness.
The maximum tensile strain in the main flanges reached about 4000 /-lE and the maximum
compressive strain in the eye flanges was about the same order of magnitude, i.e. 3900/-l8.
However, the maximum compressive strain in the pin flanges was about 6000/-lE at
46
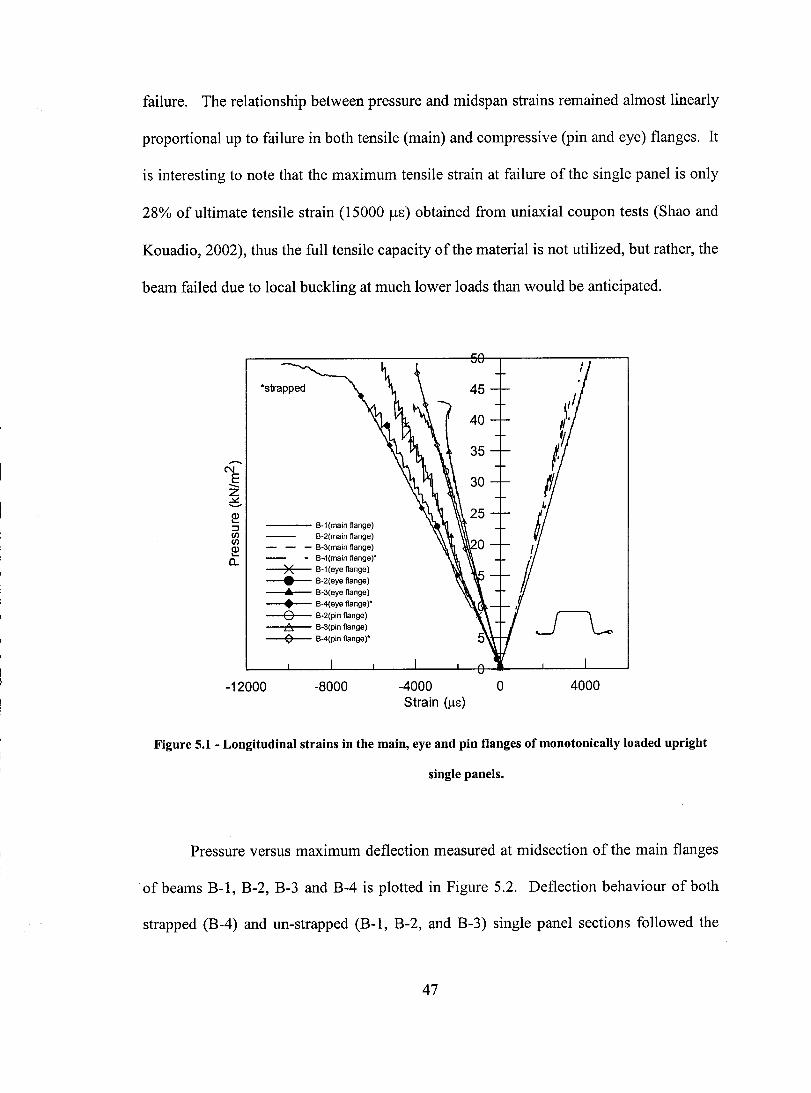
failure. The relationship between pressure and midspan strains remained almost linearly
proportional up to failure in both tensile (main) and compressive (pin and eye) flanges. It
is interesting to note that the maximum tensile strain at failure of the single panel is only
28% ofultimate tensile strain (15000 )lE) obtained from uniaxial coupon tests (Shao and
Kouadio, 2002), thus the full tensile capacity of the material is not utilized, but rather, the
beam failed due to local buckling at much lower loads than would be anticipated.
*strapped
-12000
--- B-1(main flange) B-2(main flange)
- B-3(main flange) - B-4(main flange)'
)( B-1(eyeflange)
• B-2(eye flange)
.. B-3( eye flange)
• B-4( eye flange)'
o B-2(pin flange)
:6 B-3(pin flange)
o B-4(pin flange)'
-8000 -4000 Strain (ilE)
o 4000
Figure 5.1 - Longitudinal strains in the main, eye and pin flanges of monotonically loaded upright
single panels.
Pressure versus maximum deflection measured at midsection of the main flanges
of beams B-1, B-2, B-3 and B-4 is plotted in Figure 5.2. Deflection behaviour of both
strapped (B-4) and un-strapped (B-1, B-2, and B-3) single panel sections followed the
47

same trend, indicating that strapping of the section did not alter the section behaviour. A
theoretical prediction of load deflection behaviour was calculated using Timoshenko's
beam theory (Equation 4.4), which accounts for both bending and shear deformation,
using the flexural stiffness (El = 206 kN.m2) and shear stiffness (kAG = 814 kN)
obtained in previous research (Giroux and Shao, 2001). The experimental deflection was
found to be weIl correlated with the theoretical prediction up to about 10 kN/m2•
However, non-linear behaviour was observed in the higher load ranges, suggesting a
reduction in stiffness of the panel. This reduction in stiffness is most likely attribut able to
geometric shape change of the panels during loading, which will be further analysed in
Chapter 6.
50 ·strapped
45
40
35 -.
1: 30 --Z ..Jo<: .........
~ 25 ::l !Il !Il 20 ~ a..
15 ~E B-1(rnain flange)
• B-2(rnain flange)
10 ... B-3(rnain flange) • B-4(rnain flange)"
5 Theory
0 0 10 20 30 40 50 60
Deflection (mm)
Figure 5.2 - Load deflection plot for monotonically loaded upright single panels.
48

Table 5.1 summarizes the results of monotonically loaded upright single panel
tests B-1, B-2, B-3 and B-4. The theoretical prediction ofmaximum deflection calculated
using equation 4.4 differed considerably from the experimental observations for aIl
panels, with differences ranging from about 25-37%. AlI of the beams failed in
approximately the same load range (42.6 - 49.5 kN/m2), with an average pressure and
moment at failure of 46.1 kN/m2 and 11.2 kN.m, respectively.
Table 5.1 - Results of monotonically loaded upright single panel tests.
Maximum Maximum Maximum Deflection Specimen Pressure Moment Experimental Theory Difference
(kN/m2) (kN.m) (mm) (mm) (%)
B-1 49.4 12.0 58.0 42.3 37.2 B-2 42.6 10.3 45.5 36.4 24.9 B-3 43.0 10.4 46.4 36.7 26.2 B-4 49.2 11.9 55.8 42.1 32.6
5.1.2 - Cyclically loaded upright single panel test.
B-5 was cyclically loaded 6 times, and then to failure, under uniform pressure
load. Prior to failure, the specimen B-5 was subjected to 3 cycles up to 62% (27.2
kN/m2), and subsequently to 3 more cycles up to 76% (33.3 kN/m2
) of the ultimate
capacity of 43.8 kN/m2• Sample B-5 also exhibited a linear load-strain relationship
(Figure 5.3) similar to monotonically loaded specimens B-1, B-2, B-3, and B-4. Main
and pin flange strains followed the same path upon loading and unloading, while the eye
flange strain was observed to follow a different unloading path, as shown in Figure 5.3.
49
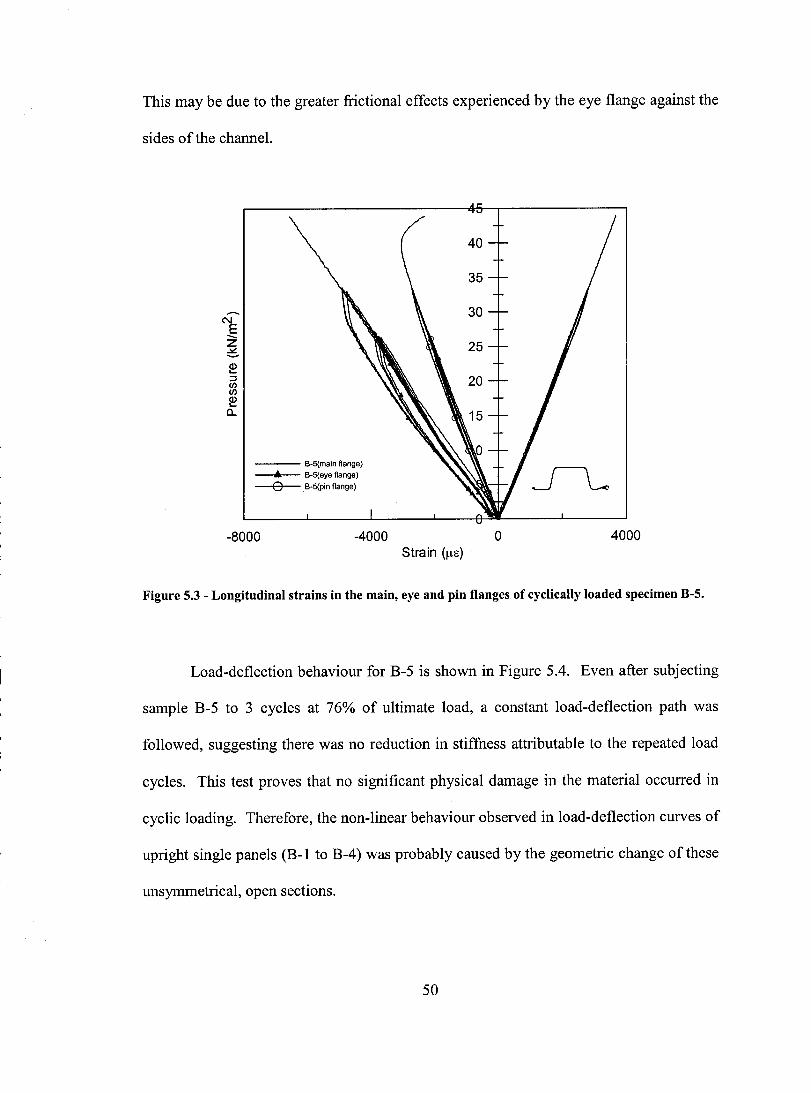
This may be due to the greater frictional effects experienced by the eye flange against the
sides of the channel.
40
35
....- 30 C\I
E -. z 25 ~
!!! :J 20 III III
!!! c..
--- B-5(main flange) ... B-5(eye flange)
o B-5(pin tlange)
-8000 -4000 o 4000 Strain (1-11::)
Figure 5.3 - Longitudinal strains in the main, eye and pin flanges of cyclically loaded specimen B-5.
Load-deflection behaviour for B-5 is shown in Figure 5.4. Even after subjecting
sample B-5 to 3 cycles at 76% of ultimate load, a constant load-deflection path was
followed, suggesting there was no reduction in stiffness attributable to the repeated load
cycles. This test proves that no significant physical damage in the material occurred in
cyclic loading. Therefore, the non-linear behaviour observed in load-deflection curves of
upright single panels (B-l to B-4) was probably caused by the geometric change ofthese
unsymmetrical, open sections.
50

The maximum pressure exerted on B-5 at failure was 43.8 kN/m2, and maximum
moment was 10.6 kN.m, which lie within the range observed in panels B-l to B-4,
differing by only about 5% from the average values of monotonically loaded single
panels.
45
40
35
C\I 30
E --z 25 e, ~ :::1 20 CI) CI)
~ c.. 15
10 --- B-5(main flange)
5
0 0 10 20 30 40 50 60
Deflection (mm)
Figure 5.4 - Load deflection plot for cyclically loaded specimen B-5.
5.1.3 - Failure mechanism of upright single panels.
AU single panel specimens (B-l to B-5) were observed to fail in the same manner,
suddenly and accompanied by an explosive noise. Upon failure, the specimen was
observed to undergo a large out of plane displacement as shown in Figure 5.5; this
phenomenon was also observed in tests of Creative Pultrusion's SuperLoc panel, as
51

reported in their design manual (Creative Pultrusion, 2002). In the present study, failure
of the specimens was always localized to either the pin or eye flanges and adjacent web
near midspan, while the rest of the beam appeared undamaged. The side at which the
failure occurred was apparently random, and most of the material damage was observed
at the junction of the main web and pinleye flange (Figure 5.7), where the highest strains
were recorded. It appears that failure was due to excessive deflection, which initiated
main web crippling, followed by buckling of the pin flange (Figure 5.6a) or longitudinal
failure of the eye flange (Figure 5.6b). AlI upright single panels were to fail upon
reaching a deflection in the range of 45 - 58 mm. Buckling of the pin flange was not
reflected in the strain measurements, since it was initiated instantaneously upon crippling
of the web, but buckling could be observed visualIy, as seen in Figure 5.6b. Following
removal of the load after failure the specimen retumed to its original shape.
Figure 5.5 - Out-of-plane displacement of a single panel upon failure.
52

Figure 5.6 - Typical failure of compression flanges on upright single panels. (a) Pin flange (b) Eye flange
Figure 5.7 - Typical failure damage on a single panel, shown after unloading.
53

5.2 - Inverted single panel tests.
Although FRP composite sheet pile panels are designed for installation in the
upright orientation, they are also known to be installed in the inverted position (see
Figure 3.2). Hence, two inverted panels were tested (R-1 and R-2) to observe whether
their structural behaviour would differ significantly from that of upright panels. Figure
5.8 displays the pressure versus strain curves for the two inverted panel tests. In this
configuration, pin and eye flanges were in tension and the main flange in compression.
The load-strain behaviour of the tension flanges (pin and eye) of R-1 and R-2 followed
different paths, with the tensile strain being larger in the eye flange than in the pin
flanges, similarly to the upright panel tests where both pin and eye flanges were subjected
to compression (see Figures 5.1 and 5.3). Notably, buckling was initiated in the
compressive main flange at a load of about 23.0 kN/m2 (Figure 5.8). The decrease in
compressive strain with increasing load in the main flange was indicative of the initiation
of local buckling of the compressive main flange. The buckling of the main flange under
compression was followed by separation of the main flange from the main webs,
initiating failure, as shown in Figure 5.13.
54
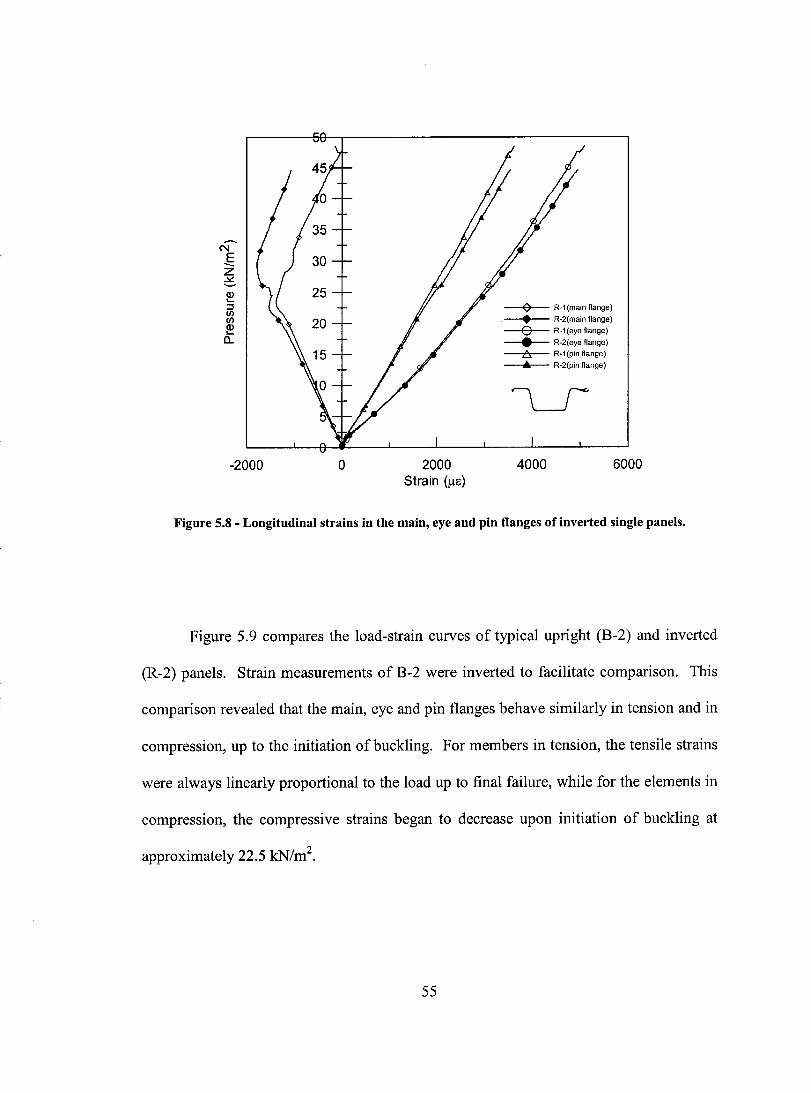
........ C\I E 30 --z C-O) 25 ... :::1 en en 20 0) .... a.
-2000 o 2000 Strain (/JE)
0 • 0 • b ...
4000
R-1 (main ftange)
R-2(main ftange)
R-1 (eye Ilange)
R-2(eye Ilange)
R-1 (pin ftange)
R-2(pin ftange)
6000
Figure 5.8 - Longitudinal strains in the main, eye and pin flanges of inverted single panels.
Figure 5.9 compares the load-strain curves of typical upright (B-2) and inverted
(R-2) panels. Strain measurements of B-2 were inverted to facilitate comparison. This
comparison revealed that the main, eye and pin flanges behave similarly in tension and in
compression, up to the initiation ofbuckling. For members in tension, the tensile strains
were always linearly proportional to the load up to final failure, while for the elements in
compression, the compressive strains began to decrease upon initiation of buckling at
approximately 22.5 kN/m2•
55
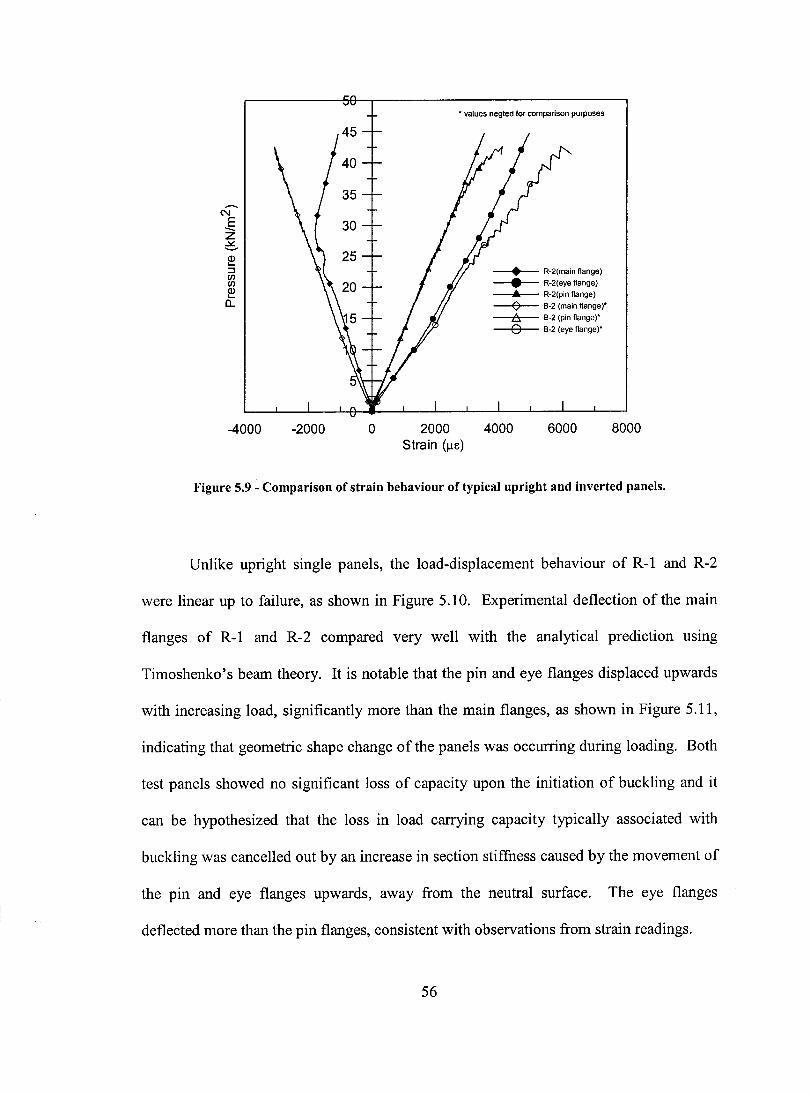
35 ---C'\I E 30 --z ::::. Q) 25 .... :J CI) CI)
~ CL
-4000 -2000 o
, values negted tor comparison purposes
2000 Strain (ilE)
• • ... 0 6: 0
4000
R-2(main tlange)
R-2(eye ftange)
R-2(pin ftange)
8-2 (main ftange)'
8-2 (pin ftange)'
8-2 (eye ftange)'
6000 8000
Figure 5.9 - Comparison of strain behaviour of typical upright and inverted panels.
Unlike upright single panels, the load-displacement behaviour of R-l and R-2
were linear up to failure, as shown in Figure 5.10. Experimental deflection of the main
flanges of R-l and R-2 compared very well with the analytical prediction using
Timoshenko's beam theory. It is notable that the pin and eye flanges displaced upwards
with increasing load, significantly more than the main flanges, as shown in Figure 5.11,
indicating that geometric shape change of the panels was occurring during loading. Both
test panels showed no significant loss of capacity upon the initiation of buckling and it
can be hypothesized that the loss in load carrying capacity typically associated with
buckling was cancelled out by an increase in section stiffness caused by the movement of
the pin and eye flanges upwards, away from the neutral surface. The eye flanges
deflected more than the pin flanges, consistent with observations from strain readings.
56

50
45
40
35 ........
N
..ê 30 z ::::.. Q) 25 '-::l (/) (/) 20 Q) '-c..
15
10
5
0 0 5 10
• R-l(rnainflange)
o R-2(rnain flange) ---Theory
15 20 25 30 Deflection (mm)
35 40
Figure 5.10 - Load deflection plot for inverted single panels.
50
45
40
35 ........
N
..ê 30 z ::::.. Q) 25 '-::l (/) (/) 20 ~ c..
• R-l(main flange)
... R-l(eye lIange)
15 o R-l(pinflange)
o R-2 (main lIange)
• R-2 (pin lIange)
10 A R-2 (eye lIange)
5
0 0 10 20 30 40 50 60 70
Deflection (mm)
45
80
Figure 5.11 - Load deflection plot for the main, eye and pin flanges of inverted single panels.
57
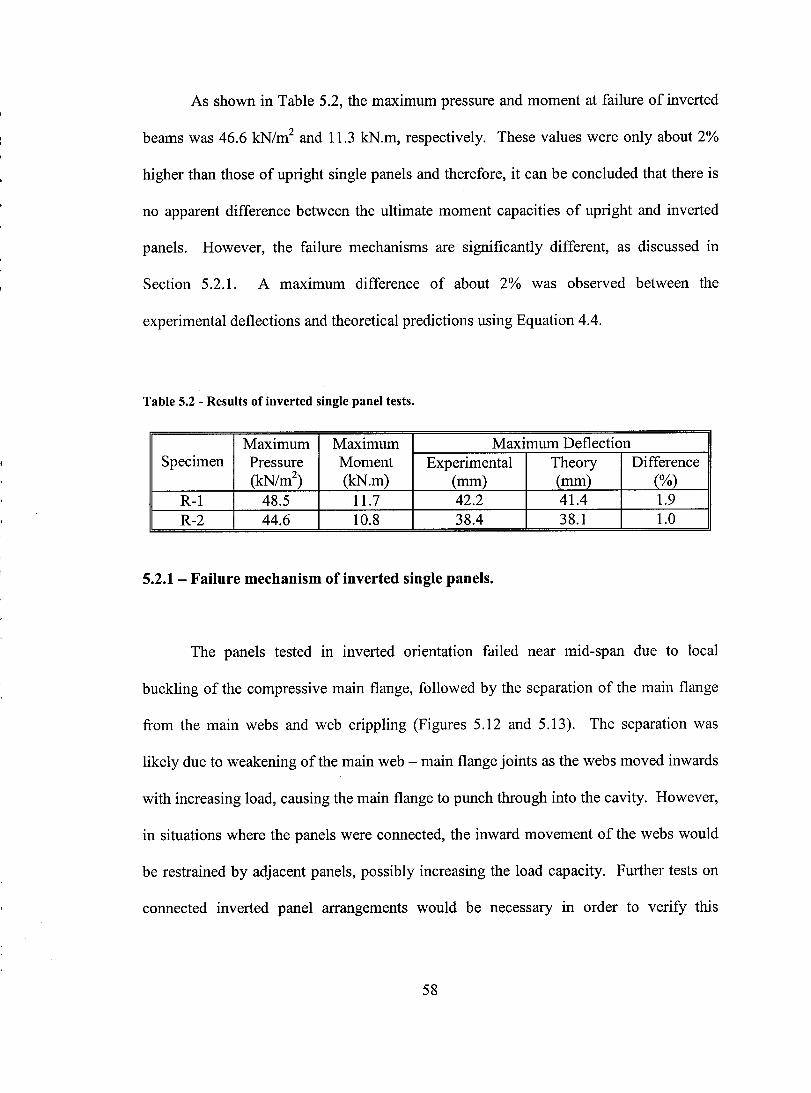
As shown in Table 5.2, the maximum pressure and moment at failure of inverted
beams was 46.6 kN/m2 and Il.3 kN.m, respectively. These values were only about 2%
higher than those of upright single panels and therefore, it can be conc1uded that there is
no apparent difference between the ultimate moment capacities of upright and inverted
panels. However, the failure mechanisms are significantly different, as discussed in
Section 5.2.1. A maximum difference of about 2% was observed between the
experimental deflections and theoretical predictions using Equation 4.4.
Table 5.2 - Results of inverted single panel tests.
Maximum Maximum Maximum Deflection Specimen Pressure Moment Experimental Theory Difference
(kN/m2) (kN.m) (mm) (mm) (%)
R-1 48.5 11.7 42.2 41.4 1.9 R-2 44.6 10.8 38.4 38.1 1.0
5.2.1 - Failure mechanism of inverted single panels.
The panels tested in inverted orientation failed near mid-span due to local
buckling of the compressive main flange, followed by the separation of the main flange
from the main webs and web crippling (Figures 5.12 and 5.13). The separation was
likely due to weakening of the main web - main flange joints as the webs moved inwards
with increasing load, causing the main flange to punch through into the cavity. However,
in situations where the panels were connected, the inward movement of the webs would
be restrained by adjacent panels, possibly increasing the load capacity. Further tests on
connected inverted panel arrangements would be necessary in order to verify this
58

hypothesis. As observed in the strain measurements, local buckling of the main flange
was initiated around 23 kN/m2• This mode of failure was significantly different from that
observed in the upright single panel tests (Section 5.1.3), since strain data reflects the
failure in this case, while failure was never apparent from strain measurements in the
upright panel tests.
Test results indicate that inverted panels undergo less deflection than upright
panels at any given load level. While the maximum moment of inverted panels at failure
was about the same as that ofupright panels, the deflection was 21.5% lower, suggesting
that the inverted orientation may have the potential for superior performance. However,
further tests on connected panel configurations are necessary to more realistically
ascertain the behaviour of inverted panels under service conditions.
Figure 5.12 - Typical failure of inverted panels, showing buckling of the main flange.
59
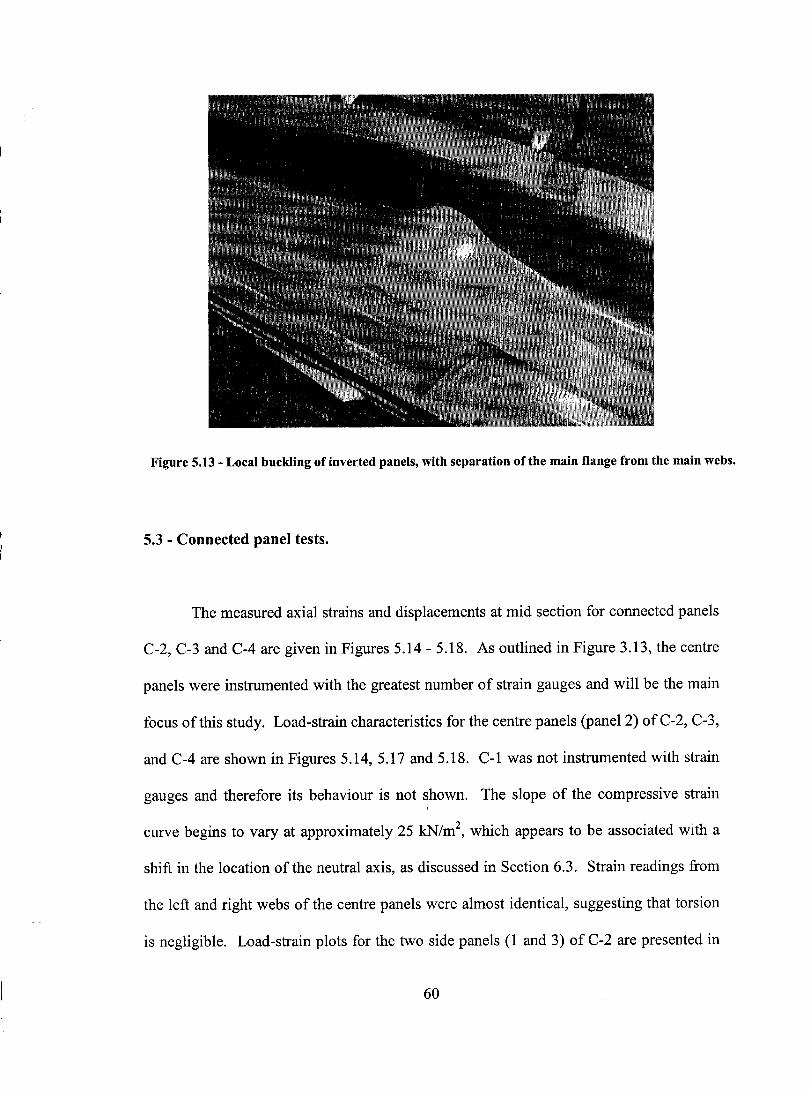
Figure 5.13 - Local buckling of inverted panels, with separation of the main flange from the main webs.
5.3 - Connected panel tests.
The measured axial strains and displacements at mid section for connected panels
C-2, C-3 and C-4 are given in Figures 5.14 - 5.18. As outlined in Figure 3.13, the centre
panels were instrumented with the greatest number of strain gauges and will be the main
focus ofthis study. Load-strain characteristics for the centre panels (panel 2) ofC-2, C-3,
and C-4 are shown in Figures 5.14, 5.17 and 5.18. C-1 was not instrumented with strain
gauges and therefore its behaviour is not shown. The slope of the compressive strain
curve begins to vary at approximate1y 25 kN/m2, which appears to be associated with a
shift in the location of the neutral axis, as discussed in Section 6.3. Strain readings from
the left and right webs of the centre panels were almost identical, suggesting that torsion
is negligible. Load-strain plots for the two side panels (1 and 3) of C-2 are presented in
60
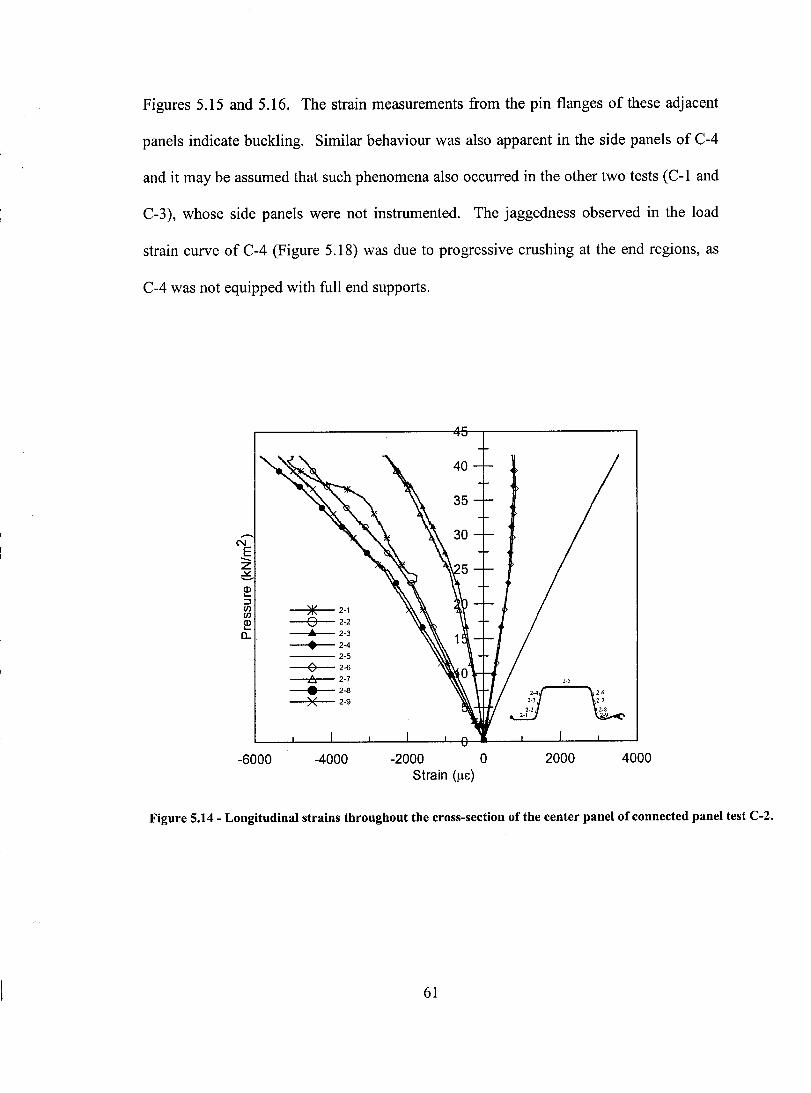
Figures 5.15 and 5.16. The strain measurements from the pin flanges of these adjacent
panels indicate buckling. Similar behaviour was also apparent in the side panels of C-4
and it may be assumed that such phenomena also occurred in the other two tests (C-l and
C-3), whose side panels were not instrumented. The jaggedness observed in the load
strain curve of C-4 (Figure 5.18) was due to progressive crushing at the end regions, as
C-4 was not equipped with full end supports.
40
35
-N E -z ~
~ :::J en * 2·1 en ~ e 2·2
0.. ... 2·3
• 2-4 2·5
~ 2·6
és. 2·7
• 2-8 )( 2·9
-6000 -4000 -2000 0 2000 4000 Strain (!-le)
Figure 5.14 - Longitudinal strains throughout the cross-section of the center panel of connected panel test C-2.
61
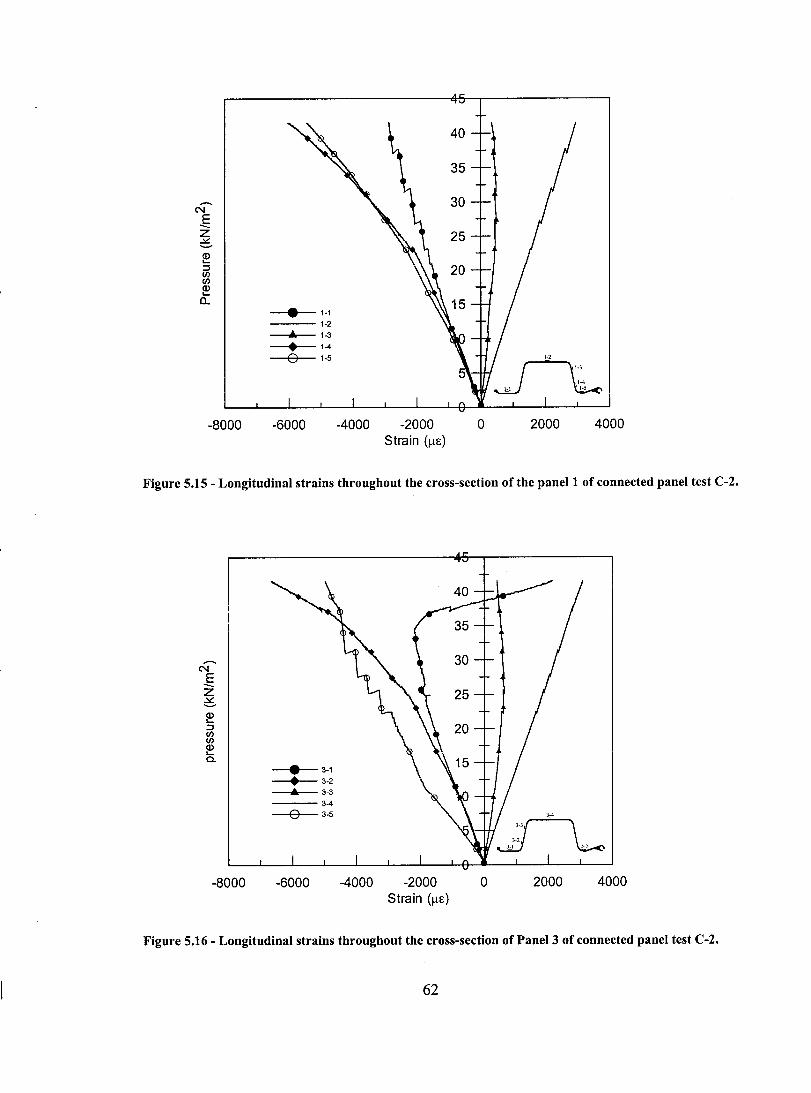
-8000 -6000 -4000 -2000 Strain (/-lE)
o 2000 4000
Figure 5.15 - Longitudinal strains throughout the cross-section of the panel 1 of connected panel test C-2 .
....... N E Z ~ ...... ~ ::J CI) CI)
~ c..
-8000 -6000 -4000 -2000 Strain (/-lE)
o 2000 4000
Figure 5.16 - Longitudinal strains throughout the cross-section of Panel 3 of connected panel test C-2.
62
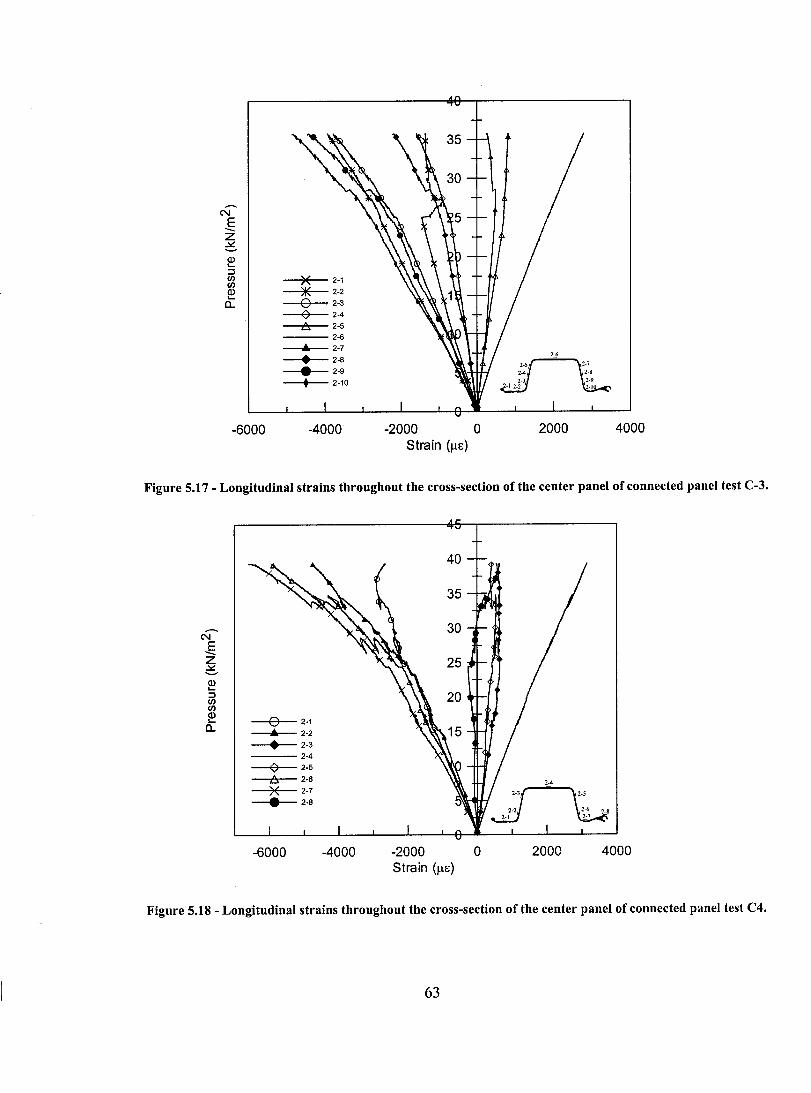
)( 2-1
)i( 2-2
0 2-3
0 2-4
A 2-5
2-6 ... 2-7
• 2-8
• 2-9
• 2-10
-6000 -4000 -2000 0 2000 4000 Strain (fu:)
Figure 5.17 - Longitudinal strains throughout the cross-section of the center panel of connected panel test C-3.
0 2-1 ... 2-2
• 2-3
2-4
0 2-5
A 2-6
~( 2-7
• 2-8
-6000 -4000 -2000 0 2000 4000 Strain (/-LE)
Figure 5.18 - Longitudinal strains throughout the cross-section of the center panel of connected panel test C4.
63
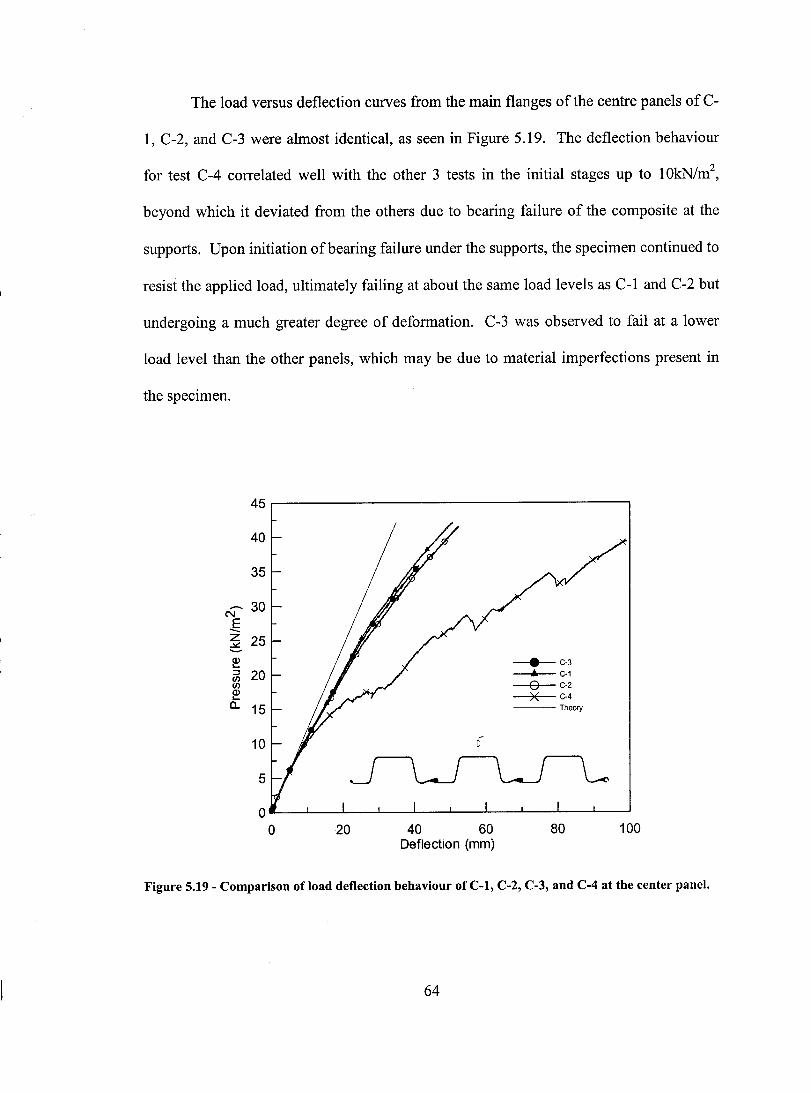
The load versus deflection curves from the main flanges of the centre panels of C-
1, C-2, and C-3 were almost identical, as seen in Figure 5.19. The deflection behaviour
for test C-4 correlated well with the other 3 tests in the initial stages up to 1 OkN/m2,
beyond which it deviated from the others due to bearing failure of the composite at the
supports. Upon initiation ofbearing failure under the supports, the specimen continued to
resist the applied load, ultimately failing at about the same load levels as C-l and C-2 but
undergoing a much greater degree of deformation. C-3 was observed to fail at a lower
load level than the other panels, which may be due to material imperfections present in
the specimen.
45
40
35
........ 30 C'\I E --z 25 ==-~ • C-3 ::::J 20 en en Q) .... a. 15
... C-1
0 C-2 )( C-4
Theory
10
5
0 0 20 40 60 80 100
Deflection (mm)
Figure 5.19 - Comparison of load detlection behaviour of C-l, C-2, C-3, and C-4 at the center panel.
64

The midspan load deflection curves of aIl three flanges (main, pin and eye) of the
centre panel of test C-3 are given in Figure 5.20. The pin and eye flanges exhibited larger
displacements than the main flange, indicating that the centre panel cross-section
underwent a geometric shape change.
40
35
30
-NE 25 --z ~ '-'
~ 20 :::l en en
... mainflange
o eyeflange
• pinflange
~ 15 c.. ---Theory
10
5
0 0 10 20 30 40 50 60
Deflection (mm)
Figure 5.20 - Relative movement of the pin and eye flange with respect to the main flange in C-3.
Although the applied load was transversely and longitudinally uniform, strain and
deflection measurements from the main flanges of the three panels seem to indicate that
transverse distribution of load is uniform only up to 3psi and somewhat non-uniform
afterwards (Figures 5.21 and 5.22). This phenomenon is likely due to boundary
conditions, as the middle specimen is simply supported at the ends but is connected
65

longitudinally to the two si de panels through pin and eye connections. In addition, the
two si de panels interacted with the confining channels, possibly affecting their behaviour.
5000-r--------------------------------------~ * 3.5kN/m' o 6.9kN/m' ... 13.9kN/m'
• 20.7kN/m'
4000 -1- + 27.6 kN/m'
W 3000-1-,E; .!: ~
Ci) 2000 -f--
1000 --
<> 34.5 kN/m' /:::,. 41.4 kN/m'
./
-----~---- -.
---<)------- - --t- - - _
O~------~----~------~------~------~----~
o 120
Figure 5.21 - Transverse strain distribution of panels 1,2 and 3 of test C-2.
66
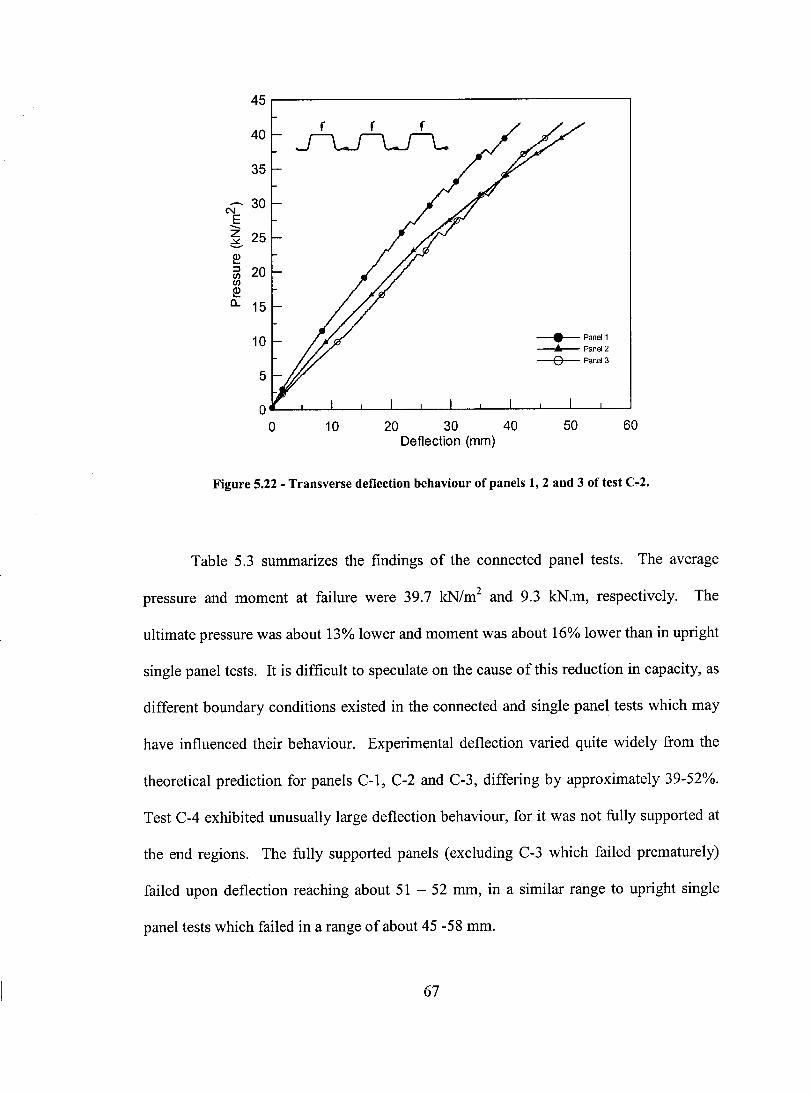
45
40 f f f
~ 35
- 30 C\I E -.. z 25 6 ~ ::J 20 CI) CI)
~ a. 15
10 • Panel 1 ... Panel 2
o Panel 3
5
0 0 10 20 30 40 50 60
Deflection (mm)
Figure 5.22 - Transverse deflection behaviour of panels 1,2 and 3 of test C-2.
Table 5.3 summarizes the findings of the connected panel tests. The average
pressure and moment at failure were 39.7 kN/m2 and 9.3 kN.m, respectively. The
ultimate pressure was about 13% lower and moment was about 16% lower than in upright
single panel tests. It is difficult to speculate on the cause of this reduction in capacity, as
different boundary conditions existed in the connected and single panel tests which may
have influenced their behaviour. Experimental deflection varied quite widely from the
theoretical prediction for panels C-l, C-2 and C-3, differing by approximately 39-52%.
Test C-4 exhibited unusually large deflection behaviour, for it was not fully supported at
the end regions. The fully supported panels (exc1uding C-3 which failed prematurely)
failed upon deflection reaching about 51 - 52 mm, in a similar range to upright single
panel tests which failed in a range of about 45 -58 mm.
67
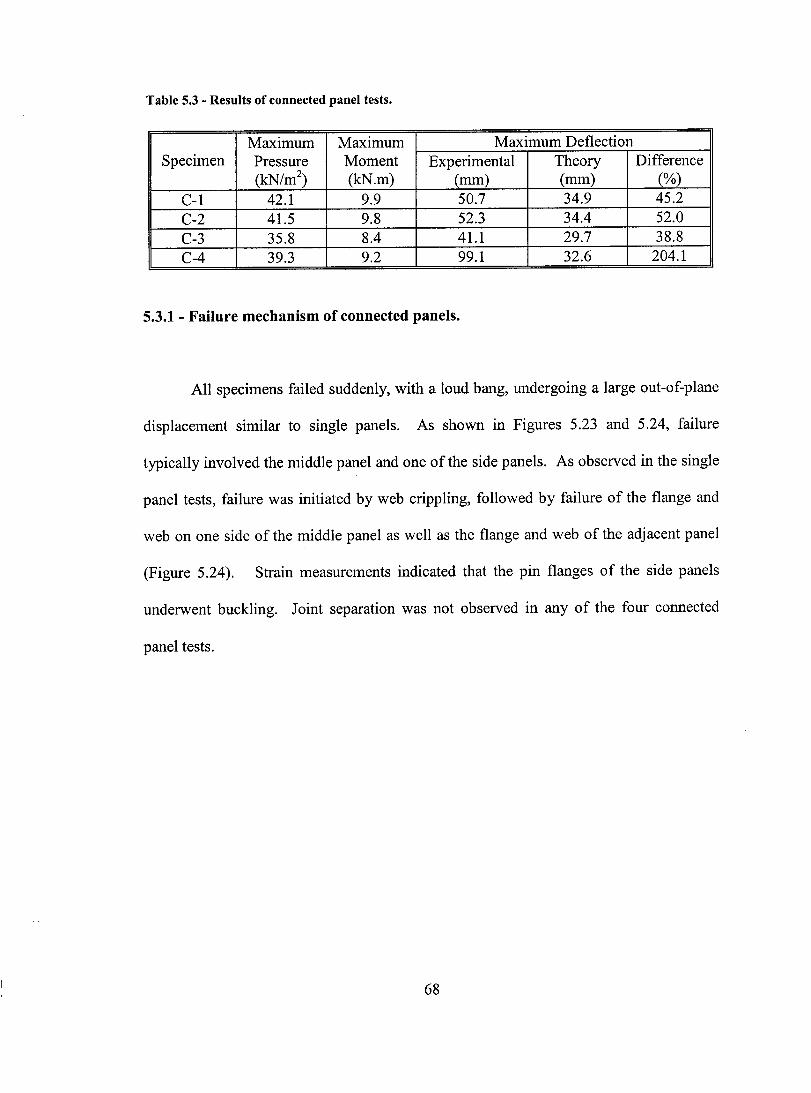
Table 5.3 - Results of connected panel tests.
Maximum Maximum Maximum Deflection Specimen Pressure Moment Experimental Theory Difference
(kN/m2) (kN.m) (mm) (mm) (%)
C-l 42.1 9.9 50.7 34.9 45.2 C-2 41.5 9.8 52.3 34.4 52.0 C-3 35.8 8.4 41.1 29.7 38.8 C-4 39.3 9.2 99.1 32.6 204.1
5.3.1 - Failure mechanism of connected panels.
AIl specimens failed suddenly, with a loud bang, undergoing a large out-of-plane
displacement similar to single panels. As shown in Figures 5.23 and 5.24, failure
typicaIly involved the middle panel and one of the si de panels. As observed in the single
panel tests, failure was initiated by web crippling, foIlowed by failure of the flange and
web on one side of the middle panel as weIl as the flange and web of the adjacent panel
(Figure 5.24). Strain measurements indicated that the pin flanges of the side panels
underwent buckling. Joint separation was not observed in any of the four connected
panel tests.
68
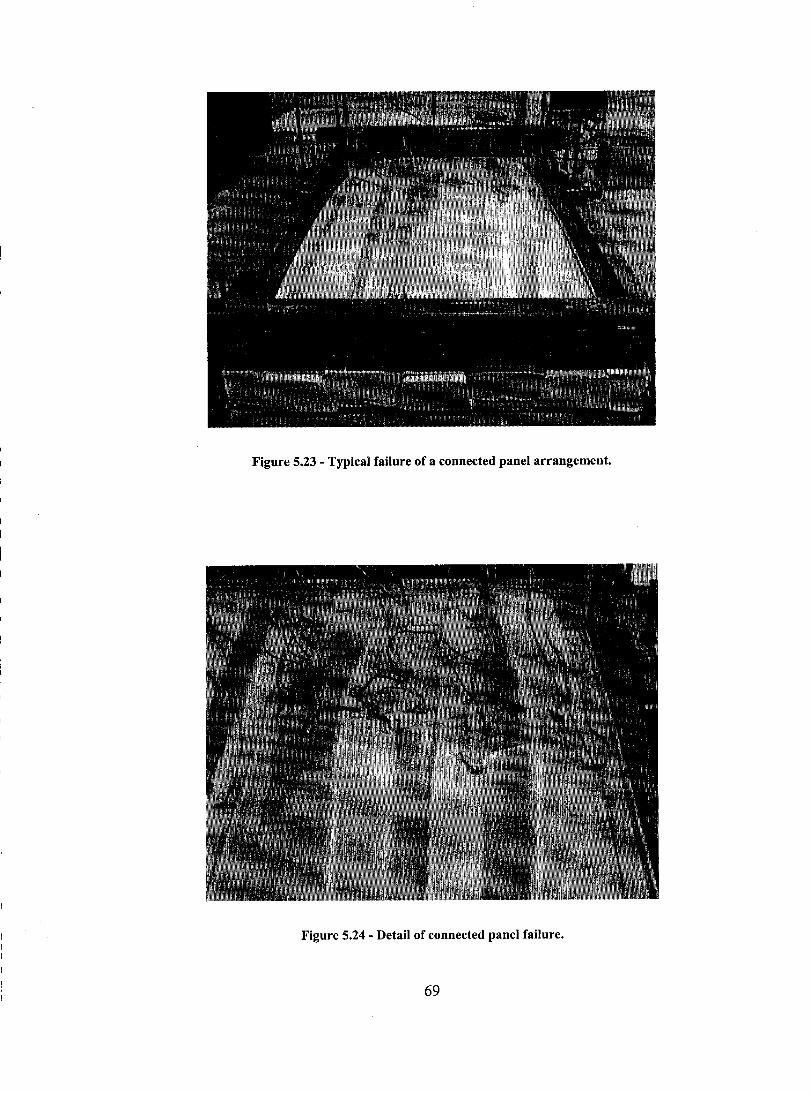
Figure 5.23 - Typical failure of a connected panel arrangement.
Figure 5.24 - Detail of connected panel failure.
69

Specimen C-4 was only partially reinforced against bearing failure.
Consequently, C-4 underwent progressive crushing at the support region upon loading
(Figure 5.25), due to the high concentrated load exerted by the support. Specimen C-4
eventually failed in a similar manner to C-l, C-2 and C-3, and at about the same load
level, but experienced a much larger deflection, almost double that of the fully reinforced
connected panels. In seawall applications, wales (support bars) much wider than the pin
and roller supports employed in this experiment are typically used, therefore the load at
which bearing failure is initiated can be expected to be much higher. The findings ofthis
study suggest that bearing failures can be mitigated by filling the cavity just under the
support region as shown in Figure 3.8b, that is, just under the wales in seawall
applications.
Figure 5.25 - Bearing failure in the support region of test C-4.
70
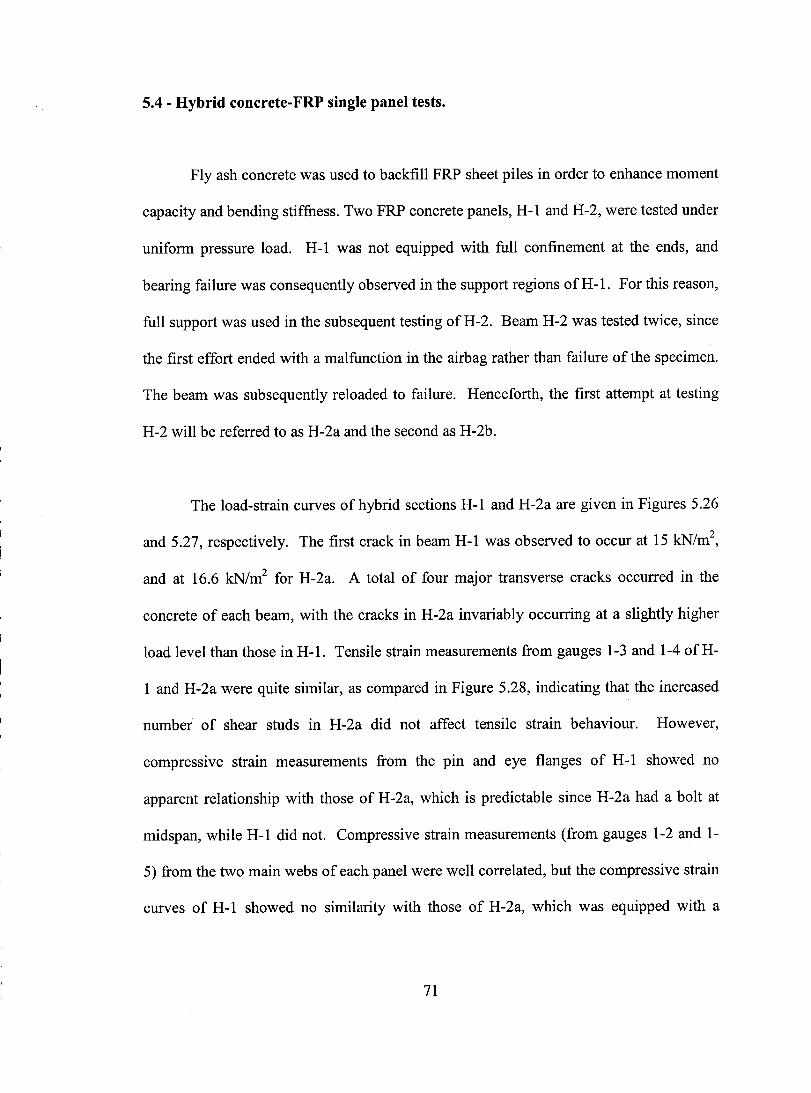
5.4 - Hybrid concrete-FRP single panel tests.
Fly ash concrete was used to backfill FRP sheet piles in order to enhance moment
capacity and bending stiffuess. Two FRP concrete panels, H-l and H-2, were tested under
uniform pressure load. H-l was not equipped with full confinement at the ends, and
bearing failure was consequently observed in the support regions ofH-l. For this reason,
full support was used in the subsequent testing ofH-2. Bearn H-2 was tested twice, since
the first effort ended with a malfunction in the airbag rather than failure of the specimen.
The beam was subsequently reloaded to failure. Henceforth, the first attempt at testing
H-2 will be referred to as H-2a and the second as H-2b.
The load-strain curves ofhybrid sections H-l and H-2a are given in Figures 5.26
and 5.27, respectively. The first crack in beam H-l was observed to occur at 15 kN/m2,
and at 16.6 kN/m2 for H-2a. A total of four major transverse cracks occurred in the
concrete of each beam, with the cracks in H-2a invariably occurring at a slightly higher
load level than those in H-l. Tensile strain measurements from gauges 1-3 and 1-4 ofH-
1 and H-2a were quite similar, as compared in Figure 5.28, indicating that the increased
number of shear studs in H-2a did not affect tensile strain behaviour. However,
compressive strain measurements from the pin and eye flanges of H-l showed no
apparent relationship with those of H-2a, which is predictable since H-2a had a boIt at
midspan, while H-l did not. Compressive strain measurements (from gauges 1-2 and 1-
5) from the two main webs of each panel were well correlated, but the compressive strain
curves of H-l showed no similarity with those of H-2a, which was equipped with a
71

greater number of shear studs as shown in Figure 5.29. Notably, for the major part of the
test (27.6 - 103.4 kN/m2), compressive strain measurements in the main webs (gauges 1-2
and 1-5) of H-2a remained fairly constant at about 100 ilE, indicating that the neutral
plane of the beam was in very close proximity to the gauge position, and hardly displaced
from that position, implying that stiffness remained nearly constant in that region. On the
other hand, the main web strain measurements (gauges 1-2 and 1-5) of H-l exhibited a
very different pattern, varying almost linearly from about 13.8 - 68.9 kN/m2• However,
no conclusion about the displacement of the neutral axis of H-l can be made since no
effort was made to effectively join the FRP beam with the concrete at midsection. (Refer
to stud arrangements in Figure 3.15).
-N E --z ~ -~ ::J III III
~ 3rd crack 0..
• 1-1 ... 1-2
t:J: 1-3
e 1-4
~E 1-5
• 1-6
-4000 -2000 o 2000 4000 6000 Strain (ilE)
Figure 5.26 - Load strain behaviour of specimen H-l.
72
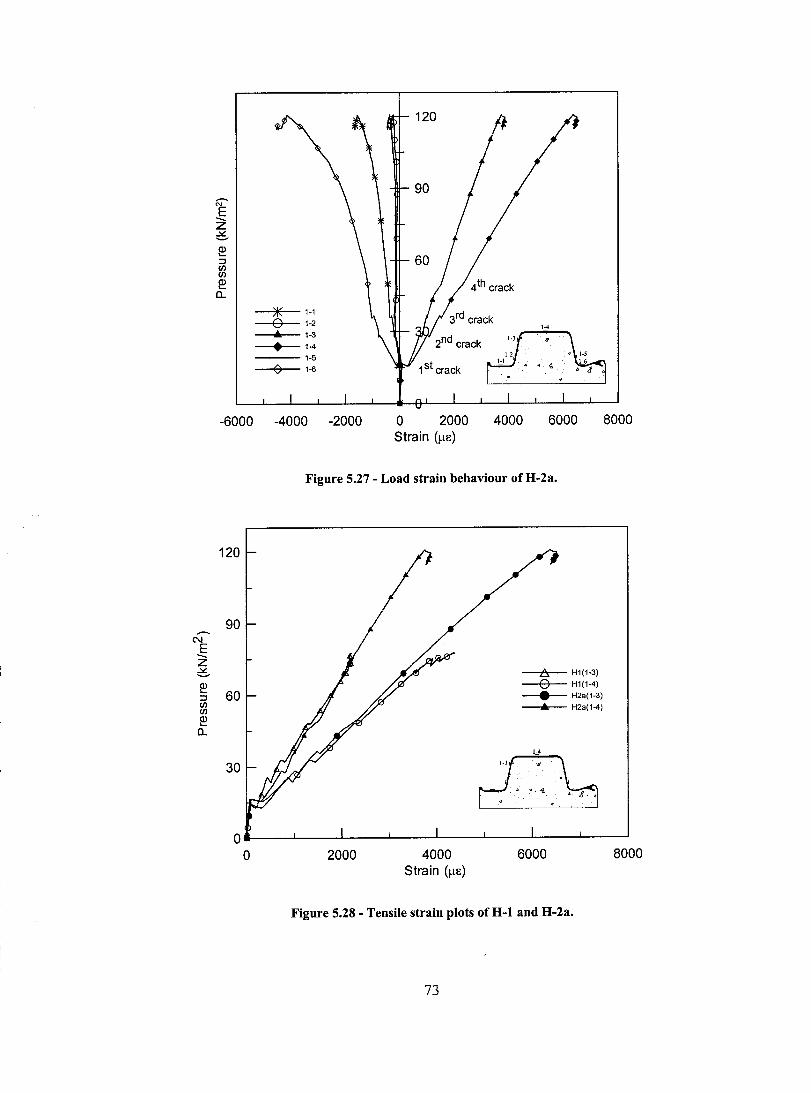
..-.. N
E --z e. ~ ::J en en ~ 0..
120
f --Z .:.: -
-'*)1(- 1-1
-~Of--1-2 - ...... -1-3
- •• -1-4 ---1-5 -eO-1-6
-6000 -4000 -2000 o 2000 4000 6000 8000 Strain (Ile)
Figure 5.27 - Load strain behaviour ofH-2a.
120
90
es H1(1-3)
0 H1(1-4)
60 • H2a(1-3) ... H2a(1-4)
30
O~--~--~-_L-_~--~-_L-_~----~
o 2000 4000 Strain (Ile)
6000
Figure 5.28 - Tensile strain plots ofH-l and H-2a.
73
8000
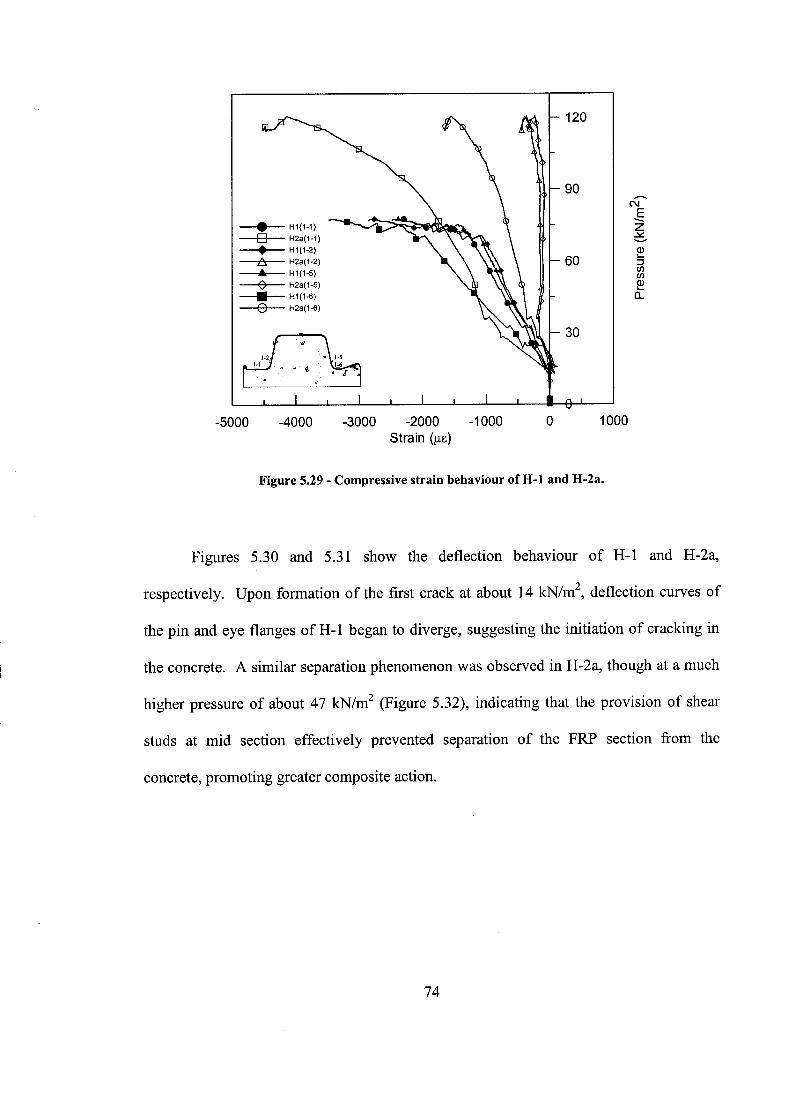
-5000
• H1{1-1)
D H2a{1-1)
• H1{1-2)
6 H2a{1-2) ... H1{1-5)
0 H2a(1-5)
• H1(1-6)
0 H2a(1-6)
-4000 -3000 -2000 Strain ()lE)
-1000 o
120
90
60
30
1000
Figure 5.29 - Compressive strain behaviour of H-l and H-2a.
-N E --Z
==-Q) '-::J CIl CIl Q) '-a.
Figures 530 and 531 show the deflection behaviour of H-l and H-2a,
respectively_ Upon formation of the first crack at about 14 kN/m2, deflection curves of
the pin and eye flanges of H -1 began to diverge, suggesting the initiation of cracking in
the concrete_ A similar separation phenomenon was observed in H-2a, though at a much
higher pressure of about 47 kN/m2 (Figure 5_32), indicating that the provision of shear
studs at mid section effectively prevented separation of the FRP section from the
concrete, promoting greater composite action.
74
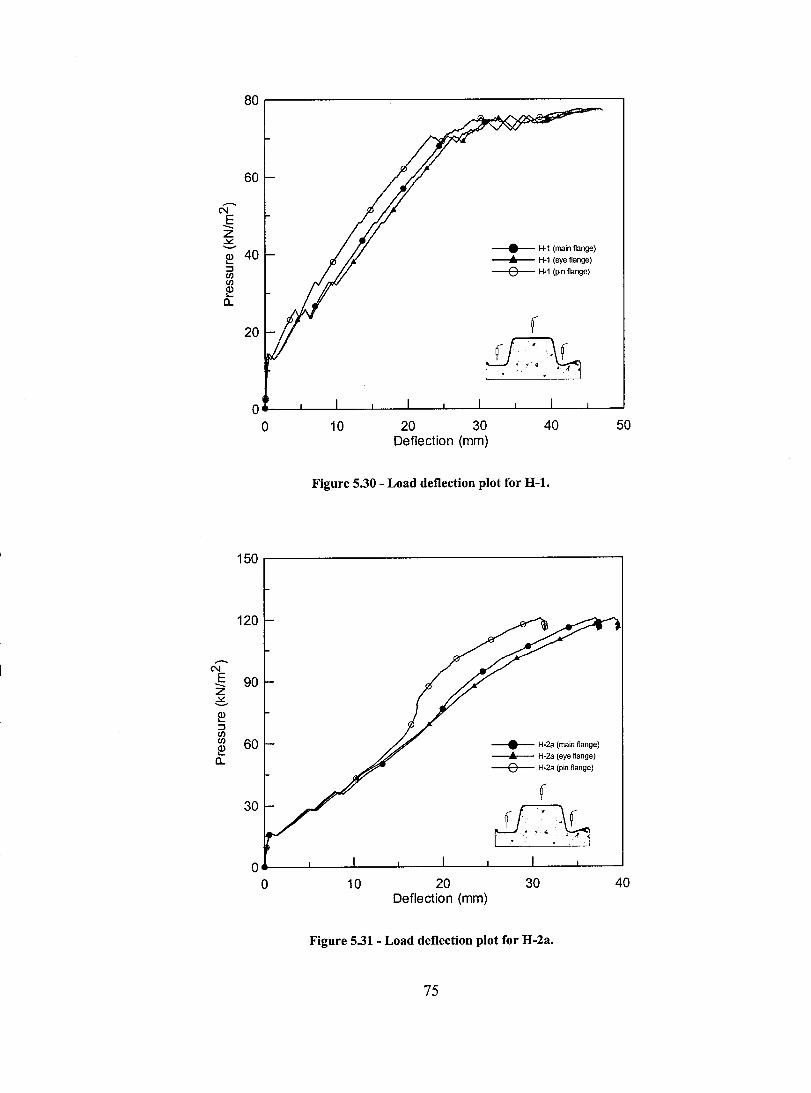
80r-------------------------------------~
60
-N E --z C ~ 40 • H-l (main flange)
... H-l (eye flange) :::l en o H-l (pin flange) en Q) .... c..
20 f ~.·.,·.f ..
4 ., 41. • J! 4 .. .
o~--~--~--~--~--~--~--~--~--~--~
o 10 20 30 40 50 Deflection (mm)
Figure 5.30 - Load deflection plot for H-l.
150r-------------------------------------,
120
-N E --z e.. ~ :::l en en ~ c..
90
60 • H-2a (main flange) ... H-2a (eye flange) o H-2a (pin Ilange)
30
O~--~----~--~~---L----~--~----~--~
o 10 20 Deflection (mm)
30
Figure 5.31 - Load deflection plot for H-2a.
75
40
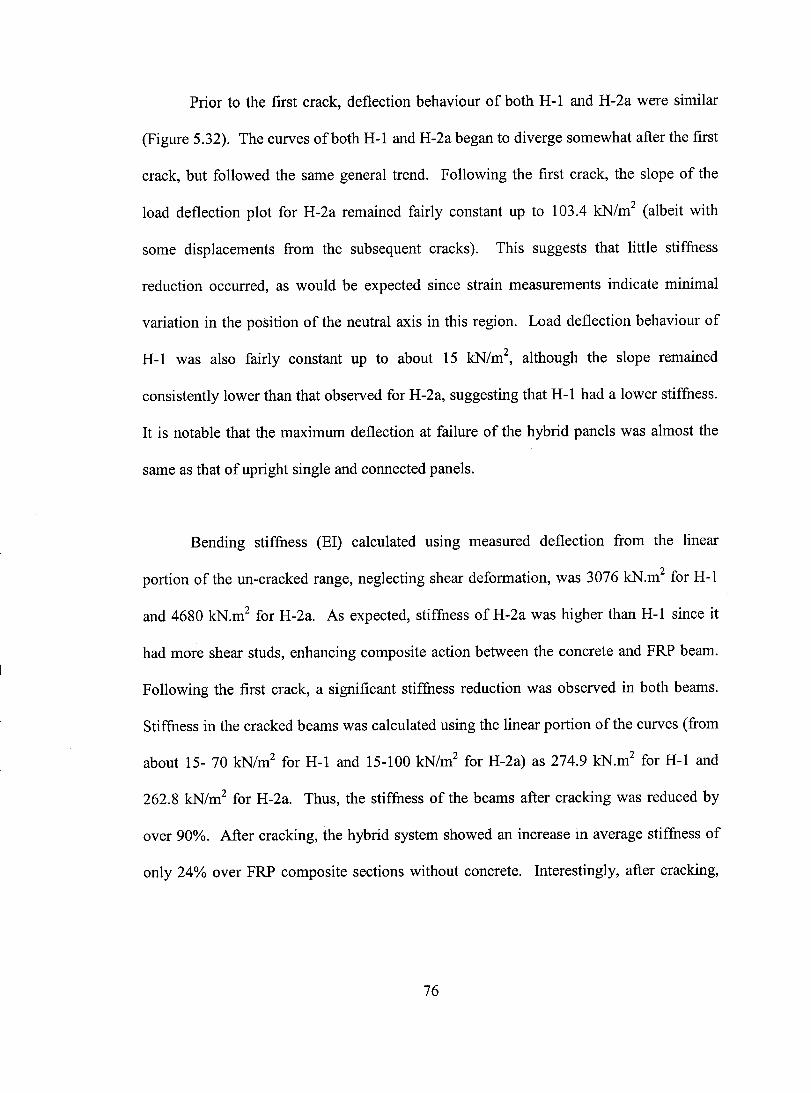
Prior to the first crack, deflection behaviour of both H-l and H-2a were similar
(Figure 5.32). The curves ofboth H-1 and H-2a began to diverge somewhat after the first
crack, but followed the same general trend. Following the first crack, the slope of the
load deflection plot for H-2a remained fairly constant up to 103.4 kN/m2 (albeit with
sorne displacements from the subsequent cracks). This suggests that little stiffness
reduction occurred, as would be expected since strain measurements indicate minimal
variation in the position of the neutral axis in this region. Load deflection behaviour of
H-1 was also fairly constant up to about 15 kN/m2, although the slope remained
consistently lower than that observed for H-2a, suggesting that H-1 had a lower stiffness.
It is notable that the maximum deflection at failure of the hybrid panels was almost the
same as that of upright single and connected panels.
Bending stiffness (El) calculated using measured deflection from the linear
portion of the un-cracked range, neglecting shear deformation, was 3076 kN.m2 for H-I
and 4680 kN.m2 for H-2a. As expected, stiffness of H-2a was higher than H-I since it
had more shear studs, enhancing composite action between the concrete and FRP beam.
Following the first crack, a significant stiffness reduction was observed in both beams.
Stiffness in the cracked beams was calculated using the linear portion ofthe curves (from
about 15- 70 kN/m2 for H-1 and 15-100 kN/m2 for H-2a) as 274.9 kN.m2 for H-1 and
262.8 kN/m2 for H-2a. Thus, the stiffness of the beams after cracking was reduced by
over 90%. After cracking, the hybrid system showed an increase in average stiffness of
only 24% over FRP composite sections without concrete. Interestingly, after cracking,
76
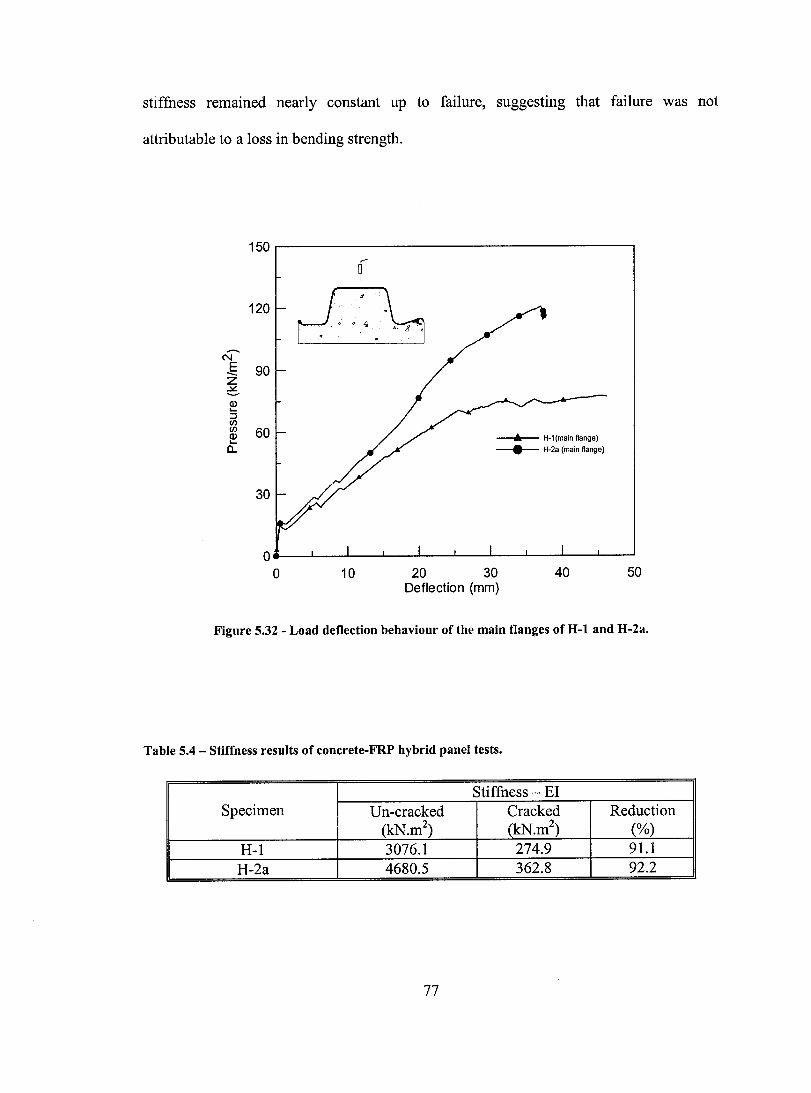
stiffness remained nearly constant up to failure, suggesting that failure was not
attributable to a 10ss in bending strength.
150
f 120
....... N E 90 --z C ~ :::l rn rn 60 ~ H-l(main ftange) c.. H-2a (main ftange)
30
o 10 20 30 40 50 Deflection (mm)
Figure 5.32 - Load detlection behaviour of the main tlanges of H-l and H-2a.
Table 5.4 - Stiffness resuIts of concrete-FRP hybrid panel tests.
Stiffuess - El Specimen Un-cracked Cracked Reduction
(kN.m2) (kN.m2
) (%) H-1 3076.1 274.9 91.1 H-2a 4680.5 362.8 92.2
77

After loading H-2a to 85% of ultimate capacity, it had to be unloaded due to a
malfunction of the airbag. H-2b was subsequently reloaded, and failed at a load of 136.2
kN/m2, 15% higher than that obtained in the first attempt (H-2a).
The maximum moment of specimens H-1 and H-2b was 19.1 kN.m and 33.5
kN.m respectively. H-1 and H-2b showed an increase in maximum moment capacity of
73% and 203%, respectively, when compared with upright single panel tests. However,
only a small increase in stiffness was observed in concrete filled panels. Table 5.5
summarizes the results ofhybrid panel tests.
Table 5.5 - Pressure, moment and deflection results of concrete-FRP hybrid panel tests.
Specimen Maximum Maximum Maximum
Pressure (kN/m2) Moment (kN.m) Deflection (mm)
H-1 77.6 19.1 46.1 H-2b 136.2 33.5 51.0
5.4.1 - Failure mechanism of hybrid beam H-l.
Failure ofbeam H-1 is depicted in Figures 5.33 and 5.34. Failure was caused by
separation of the FRP composite section from the concrete, as the bolts were tom through
and out of the FRP composite (Figure 5.34) followed by progressive crushing of the
composite beam under the support region. This crushing behaviour is also evident in the
load deflection curve (Figure 5.32) where, after the load reached about 69.0 kN/m2, there
was a drastic increase in deflection with only a minimal increase in load. Although the
bolts of H-1 tore through the FRP composite section at failure, sorne elongation of the
78
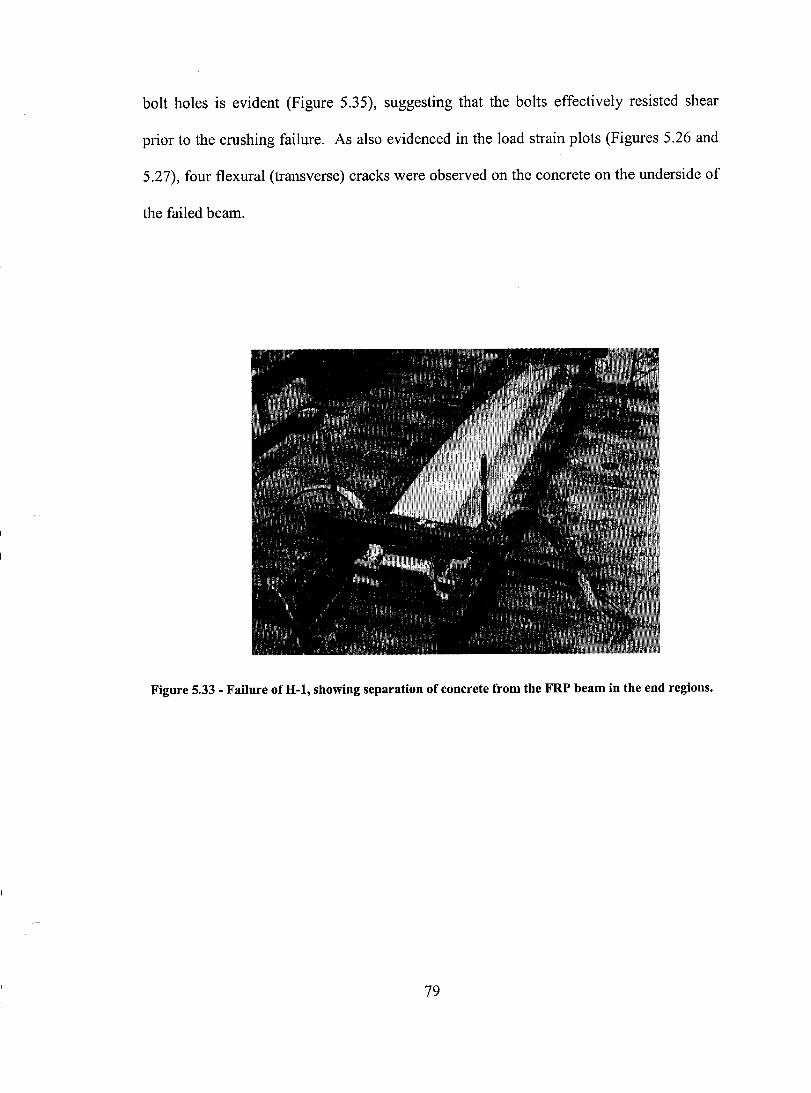
boIt holes is evident (Figure 5.35), suggesting that the boIts effectively resisted shear
prior to the crushing failure. As also evidenced in the load strain plots (Figures 5.26 and
5.27), four flexural (transverse) cracks were observed on the concrete on the underside of
the failed beam.
Figure 5.33 - Failure ofB-l, showing separation of concrete from the FRP beam in the end regions.
79

Figure 5.34 - Detail offailure ofH-l at the end region.
Figure 5.35 - Elongation of boit holes ofH-l at the end region.
80
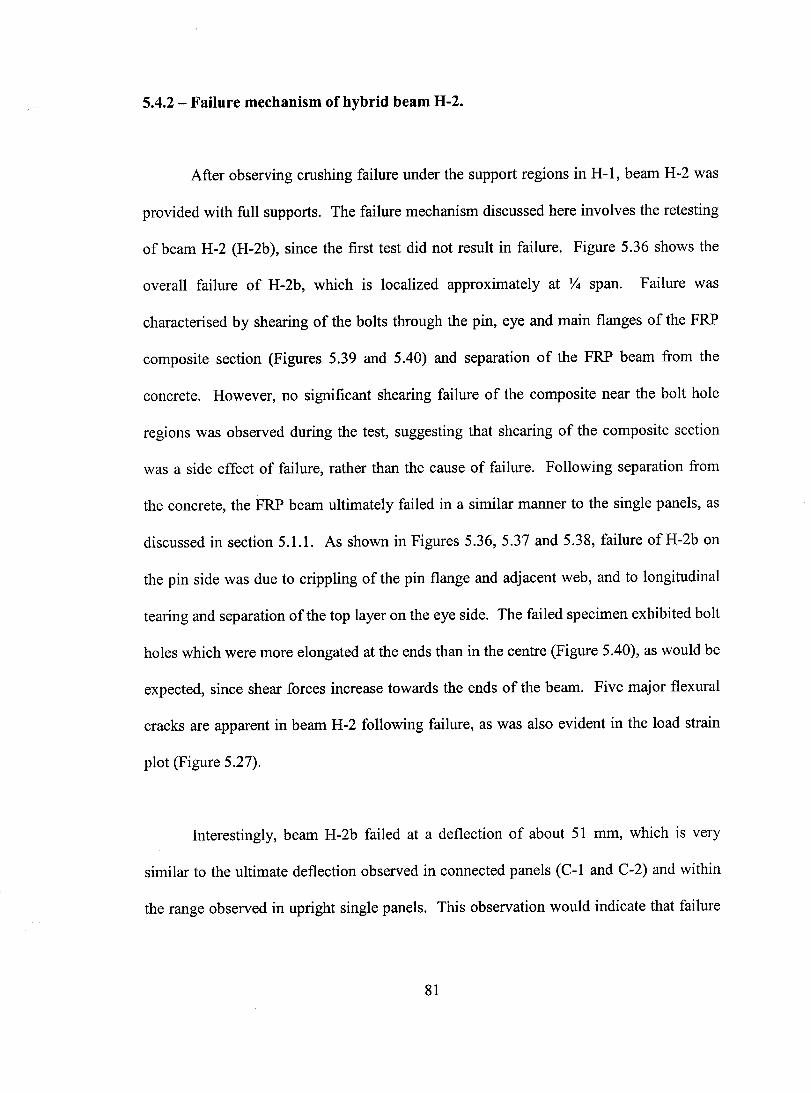
5.4.2 - Failure mechanism of hybrid beam H-2.
After observing crushing failure under the support regions in H-l, beam H-2 was
provided with full supports. The failure mechanism discussed here involves the retesting
of beam H-2 (H-2b), since the first test did not result in failure. Figure 5.36 shows the
overall failure of H-2b, which is localized approximately at Y4 span. Failure was
characterised by shearing of the bolts through the pin, eye and main flanges of the FRP
composite section (Figures 5.39 and 5.40) and separation of the FRP beam from the
concrete. However, no significant shearing failure of the composite near the boIt hole
regions was observed during the test, suggesting that shearing of the composite section
was a si de effect of failure, rather than the cause of failure. Following separation from
the concrete, the FRP beam uItimately failed in a similar manner to the single panels, as
discussed in section 5.1.1. As shown in Figures 5.36, 5.37 and 5.38, failure of H-2b on
the pin side was due to crippling of the pin flange and adjacent web, and to longitudinal
tearing and separation of the top layer on the eye side. The failed specimen exhibited boIt
holes which were more elongated at the ends than in the centre (Figure 5.40), as would be
expected, since shear forces increase towards the ends of the beam. Five major flexural
cracks are apparent in beam H-2 following failure, as was also evident in the load strain
plot (Figure 5.27).
Interestingly, beam H-2b failed at a deflection of about 51 mm, which is very
similar to the ultimate deflection observed in connected panels (C-l and C-2) and within
the range observed in upright single panels. This observation would indicate that failure
81

of FRP composite panels is dependent upon reaching a particular deflection limit, rather
than maximum tensile capacity of the material. In this study of 2.13m beams, it appears
that local failure was initiated at a deflection of about 50 mm, at which point bifurcation
may have occurred, compromising the ability of the beam to resist flexural forces. In the
case of beam H-2b, applied loads would then be transferred into the system as shear
forces, resulting in the observed bearing failure of the composite at the bolts regions
(Figures 5.39 and 5.40).
Figure 5.36 - Failure of the pin side of H-2b.
82

Figure 5.37 - Detail of the failure region on the pin side of H-2b.
Figure 5.38 - Longitudinal tearing failure at the eye side of H-2b.
83
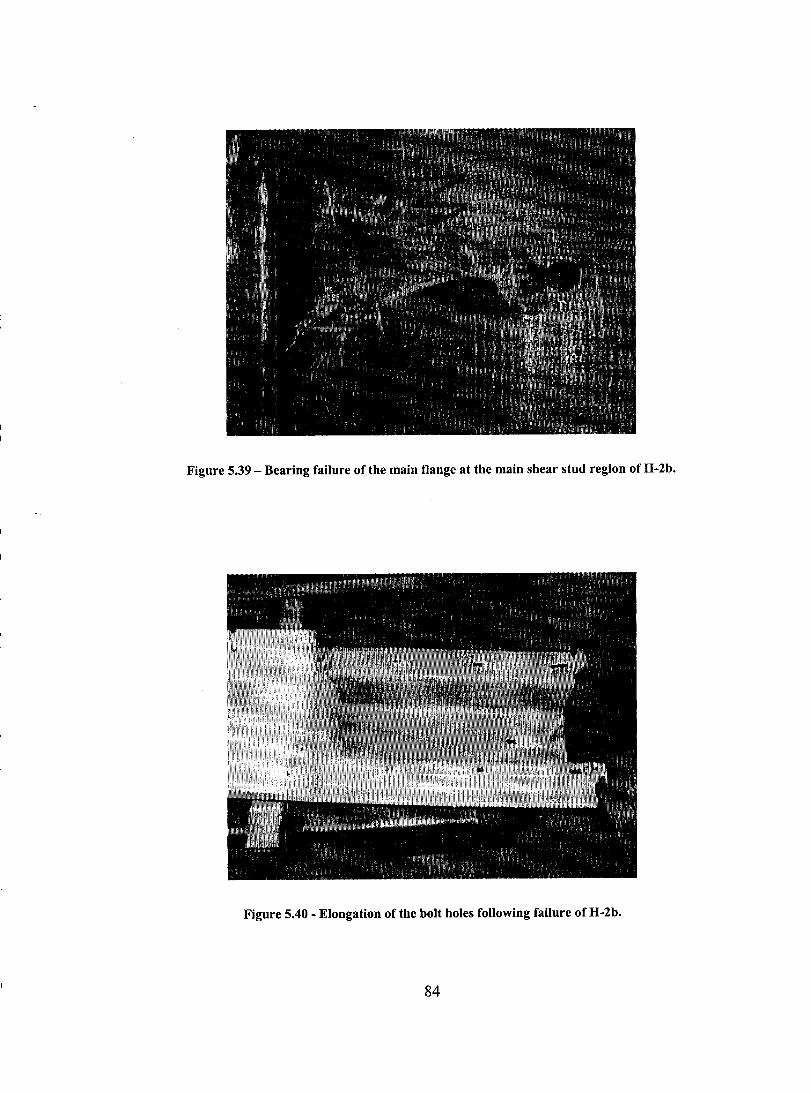
Figure 5.39 - Bearing failure of the main tlange at the main shear stud region of H-2b.
Figure 5.40 - Elongation of the boit holes following failure of H-2b.
84
CHAPTER6
NONLINEAR ANALYSIS OF FRP COMPOSITE SHEET PILES
6.1 - Stiffness reduction due to shape change.
Nonlinear pressure-deflection behaviour was observed in both single and
connected upright composite sheet piles (Figures 5.2 and 5.19). Experimental pressure
deflection curves agreed with the linear theoretical prediction from Timoshenko' s beam
theory only up to about 10 kN/m2, after which the composite sheet piles deviated
significantly from the linear prediction. This non-linear response could be attributed to
physical damage or geometric shape change of the panels (see also section 6.2). The
possibility of physical damage could be ruled out following the cyc1ic load test (B-5)
where after subjecting specimen B-5 to cyc1ic loading up to 76% of ultimate capacity, it
exhibited perfectly linear elastic strain behaviour, suggesting no deterioration of material
properties (Figure 5.3). Renee, it can be assumed that no material degradation would
have occurred in monotonie tests. In addition, the loading-unloading curves of test B-5
followed nearly the same path with no apparent hysteresis (Figure 5.4). It can therefore
be assumed that the nonlinear response of composite sheet piles is due to cross-sectional
shape change, attributable to the open-section thin-walled design.
85

The progressive change in cross-sectional geometry of the panels with increasing
load caused a reduction in bending stiffness (El), resulting in the nonlinear pressure
deflection relationship observed in both single (Figure 5.2) and connected panels (Figure
5.19). It was observed that the reduction in stiffness of the panels was associated with the
movement of the pin and eye flanges towards the neutral surface with increasing load,
providing evidence that progressive cross-sectional shape change was occurring. Qiao
(2000) also suggested that composites may experience a significant reduction in stiffness
resulting from elastic geometry change. It may be expected that a change in bending
stiffness (El) wou Id result from alterations in cross-sectional geometry, as the second
moment of area would be reduced. However, it is assumed in this study that any changes
in shear stiffness (kAG) are minimal, as the total cross-sectional area remains constant.
The bending and shear stiffness parameters (Table 2.1) used in this analysis were
determined from the previous research of Giroux and Shao (2002). Since these tests were
conducted only up to the linear elastic limit, the bending stiffness (El) and shear stiffness
(kAG) would only effectively represent behaviour in the early stages.
As expected, early load deflection behaviour observed in this study compares weIl
with the analytical prediction obtained using the aforementioned bending and shear
stiffness parameters (Figures 5.2 and 5.19). It will therefore be assumed that these
parameters represent the initial characteristics of the cross-sections tested, since very little
geometry change would have occurred in these low load ranges and they match the
analytical prediction which isbased on their original shape. However, non-linear load-
86
deflection behaviour is observed in the later stages, resulting in significant deviation from
the theoretical prediction. In light of this observation, an effort was made to formulate an
empirical relationship in order to predict the overall load-deflection behaviour of FRF
sheet pile panels, accounting for the stiffness reduction which accompanies geometry
change with increasing load. The reduction in bending stiffness (El) will be modelled as
a function of applied moment (M) making the empirical formulation applicable in
different structural applications using these sheet pile panels.
6.1.1 - Empirical formulation of stiffness reduction.
To model the load deflection behaviour of composite sheet piles, accounting for
stiffness reduction, the following assumptions were made:
1) Bending stiffness reduction was caused mainly by cross-sectional shape change,
thus elastic moduli (E) would remain constant up to failure, and second moment
of area would decrease from initial (h) to final (IR).
2) The effect of shear area (kA) change on total deflection was negligible.
The reduced bending stiffness (EIR) was obtained by comparing the analytical
prediction based on Timoshenko's beam theory with experimental data. The difference
in deflection associated with the cross-sectional change can be obtained by subtracting
the theoretical deflection, br (Equation 6.1) from the experimental deflection, b E
(Equation 6.2). These equations are drawn directly from Timoshenko's beam theory
87
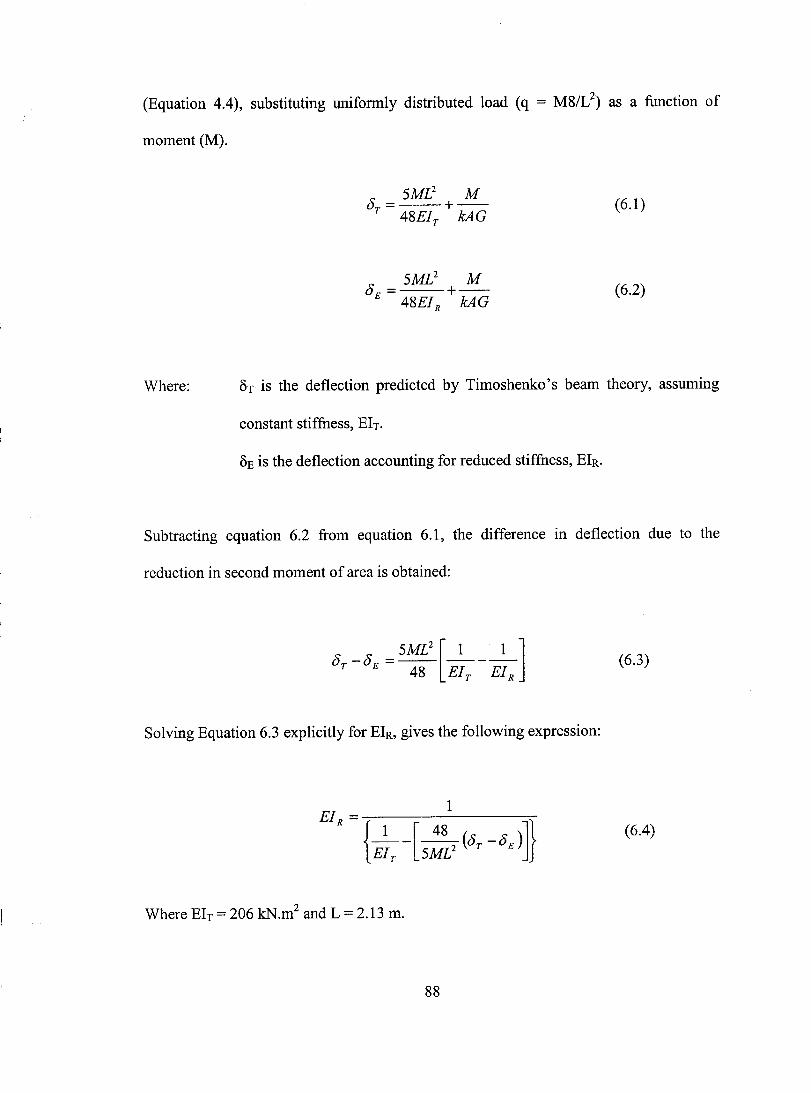
(Equation 4.4), substituting uniformly distributed load (q = M8/L2) as a function of
moment CM).
8 = 5ML2 +~
T 48ElT
kAG
8 = 5ML2 +~
E 48ElR
kAG
(6.1)
(6.2)
Where: ch is the deflection predicted by Timoshenko 's beam theory, assuming
constant stiffness, Eh.
DE is the deflection accounting for reduced stiffness, EIR.
Subtracting equation 6.2 from equation 6.1, the difference in deflection due to the
reduction in second moment of area is obtained:
8 -8 - 5ML2
[_1 ___ 1_] T E - 48 El T El R
(6.3)
Solving Equation 6.3 explicitly for EIR' gives the following expression:
(6.4)
Where Eh = 206 kN.m2 and L = 2.13 m.
88
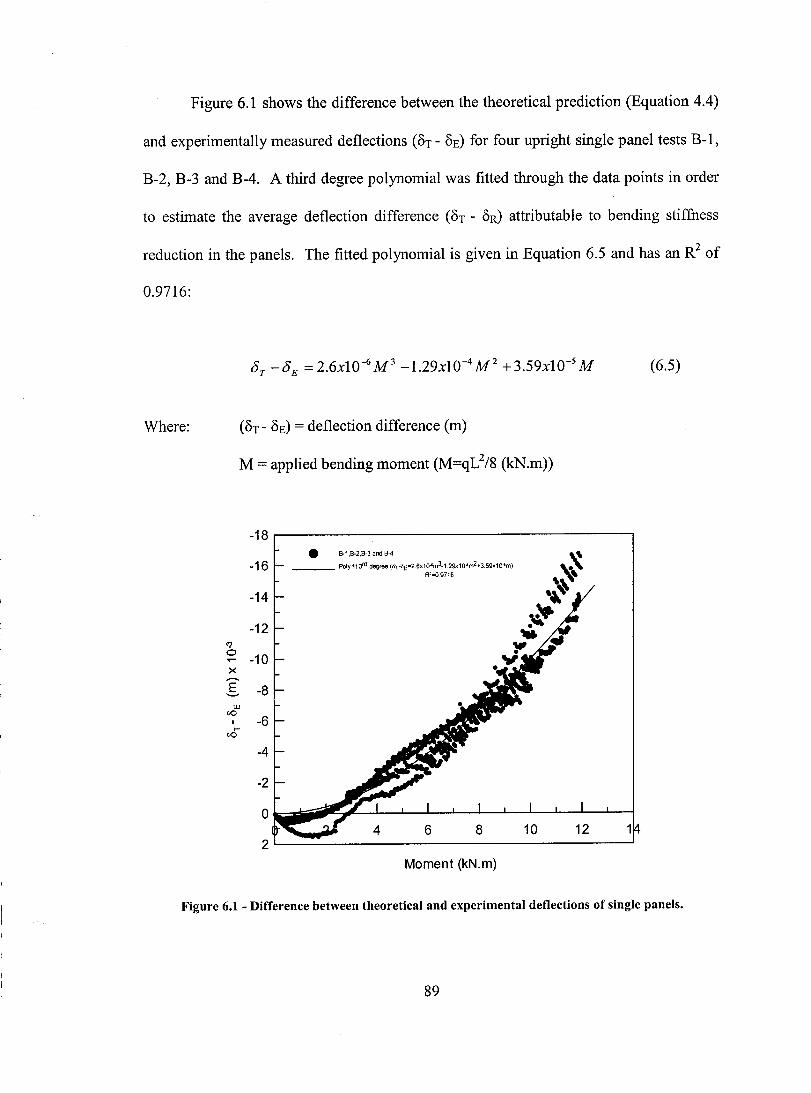
Figure 6.1 shows the difference between the theoretical prediction (Equation 4.4)
and experimentally measured deflections (OT - OE) for four upright single panel tests B-1,
B-2, B-3 and B-4. A third degree polynomial was fitted through the data points in order
to estimate the average deflection difference (OT - OR) attributable to bending stiffness
reduction in the panels. The fitted polynomial is given in Equation 6.5 and has an R2 of
0.9716:
Where:
'? 0
x ....... .s
w 00
1 1-
00
(OT - OE) = deflection difference (m)
M = applied bending moment (M=qL2/8 (kN.m»
-18
-16
-14
-12
-10
-8
-6
-4
-2
0
2
• 8-1,8-2,8-3 and 8-4
__ Poly fil3rd degree (Sr-SE=2.6x10.<im3.1 29x10-4m2+3 59x1Q-6m)
R2=O.9716
Moment (kN_m)
Figure 6.1 - Difference between theoretical and experimental detlections of single panels.
89
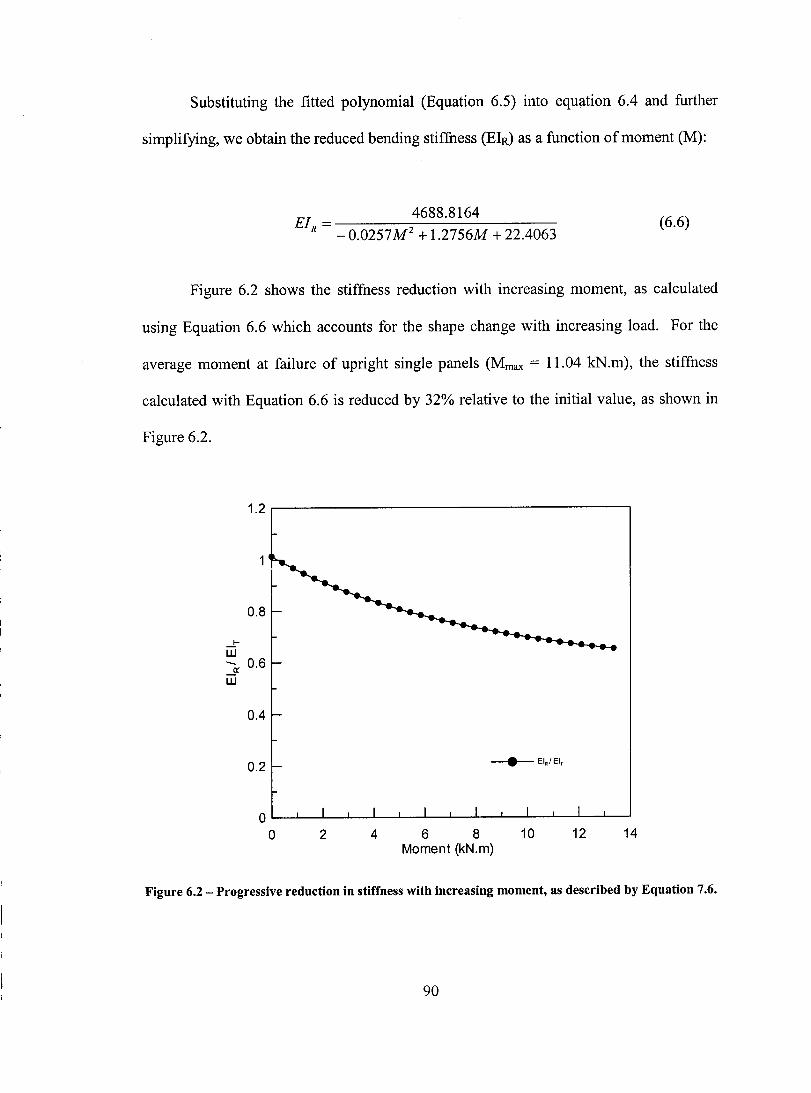
Substituting the fitted polynomial (Equation 6.5) into equation 6.4 and further
simplifying, we obtain the reduced bending stiffness (EIR) as a function of moment (M):
El = 4688.8164 R _ 0.0257 M 2 + 1.2756M + 22.4063
(6.6)
Figure 6.2 shows the stiffness reduction with increasing moment, as ca1culated
using Equation 6.6 which accounts for the shape change with increasing load. For the
average moment at failure of upright single panels (Mmax = Il.04 kN.m), the stiffness
ca1culated with Equation 6.6 is reduced by 32% relative to the initial value, as shown in
Figure 6.2.
1.2,...---------------------,
.....tW
0.8
""è.: 0.6 Lü
0.4
0.2 • EIR/EIT
o~~~-~~-~~-~~~-~~-~~~
o 2 468 Moment (kN.m)
10 12 14
Figure 6.2 - Progressive reduction in stiffness with increasing moment, as described by Equation 7.6.
90
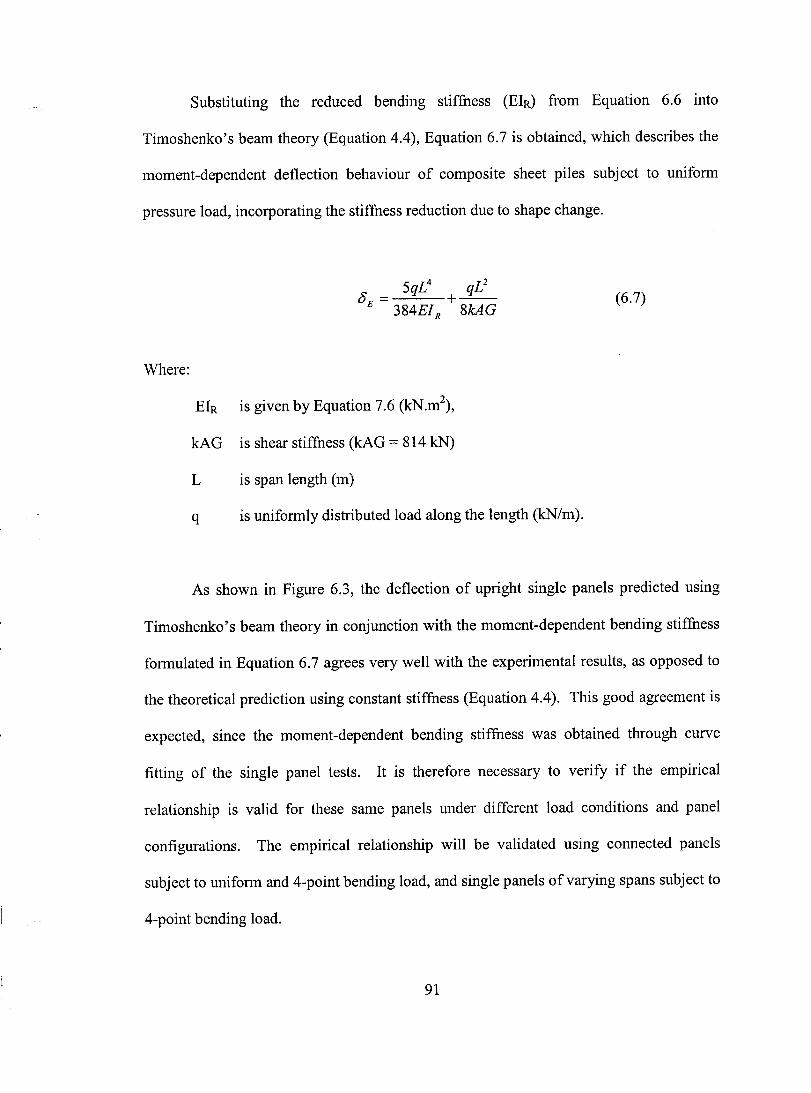
Substituting the reduced bending stiffness (BIR) from Equation 6.6 into
Timoshenko's beam theory (Equation 4.4), Equation 6.7 is obtained, which describes the
moment-dependent deflection behaviour of composite sheet piles subject to uniform
pressure load, incorporating the stiffness reduction due to shape change.
5qL4 qL2
8 = +--E 384EI
R 8kAG
(6.7)
Where:
EIR is given by Equation 7.6 (kN.m2),
kAG is shear stiffness (kAG = 814 kN)
L is span length (m)
q is uniformly distributed load along the length (kN/m).
As shown in Figure 6.3, the deflection of upright single panels predicted using
Timoshenko's beam theory in conjunction with the moment-dependent bending stiffness
formulated in Equation 6.7 agrees very weIl with the experimental results, as opposed to
the theoretical prediction using constant stiffness (Equation 4.4). This good agreement is
expected, since the moment-dependent bending stiffness was obtained through curve
fitting of the single panel tests. It is therefore necessary to verify if the empirical
relationship is valid for these same panels under different load conditions and panel
configurations. The empirical relationship will be validated using connected panels
subject to uniform and 4-point bending load, and single panels ofvarying spans subject to
4-point bending load.
91

50 /
/
45 /
40 / /
/
35 /
/ N / E 30 / -Z / e. @ 25 / :J / CIl
/ CIl 20 @ /. a.. 15 ~E B-1(rnain ftange)
• B-2(rnain ftange)
10 ... B-3(rnain ftange)
• B4(rnain flange) - Theory (El,)
5 Modified theory (El,)
0 0 10 20 30 40 50 60
Deflection (mm)
Figure 6.3 - Comparison of experimental results for single panels with theoretical predictions using
constant (EIT) and reduced stiffness (EIR).
6.1.2 - Verification of stiffness reduction model.
6.1.2.1 - Connected panels subject to uniform pressure.
Figure 6.4 compares the predicted deflection behaviour of connected panels
subjected to uniform pressure with experimental data using Equation 6.7. Shape change
was also observed in the connected panels, and Equation 6.7 proved to be more effective
in predicting their behaviour than Equation 4.4 using constant El. The predicted
deflection tended to be lower than the experimental deflection, and deviated more widely
92
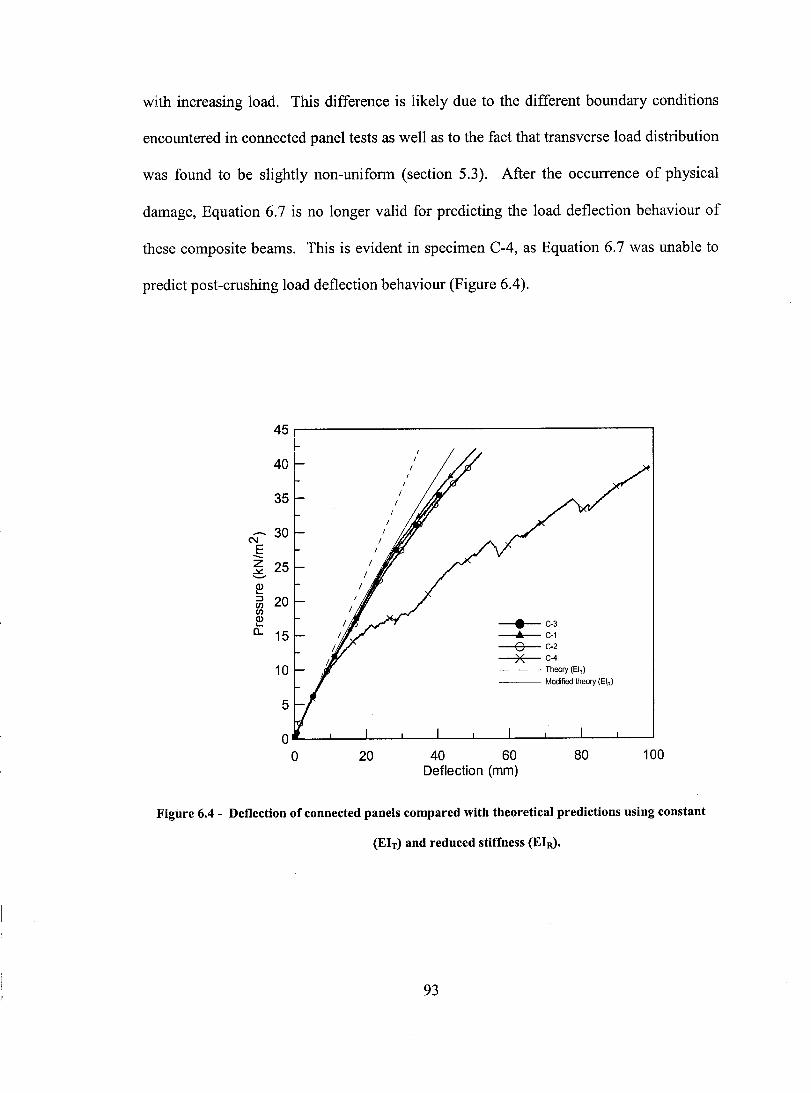
with increasing load. This difference is likely due to the different boundary conditions
encountered in connected panel tests as well as to the fact that transverse load distribution
was found to be slightly non-uniform (section 5.3). After the occurrence of physical
damage, Equation 6.7 is no longer valid for predicting the load deflection behaviour of
these composite beams. This is evident in specimen C-4, as Equation 6.7 was unable to
predict post-crushing load deflection behaviour (Figure 6.4).
45
40
35
- 30 C\I E ""-z 25 :::. ID ..... :::l 20 !Il !Il
~ 0.. 15
10
5
0 0
1
20
1 1
1
1
1 1
• C-3 ... C-1 o C-2 )( C-4
- Theory (El,)
--- Modified tIleory (EIR)
40 60 80 Deflection (mm)
100
Figure 6.4 - Deflection of connected panels compared with theoretical predictions using constant
(Eh) and reduced stiffness (EIR).
93
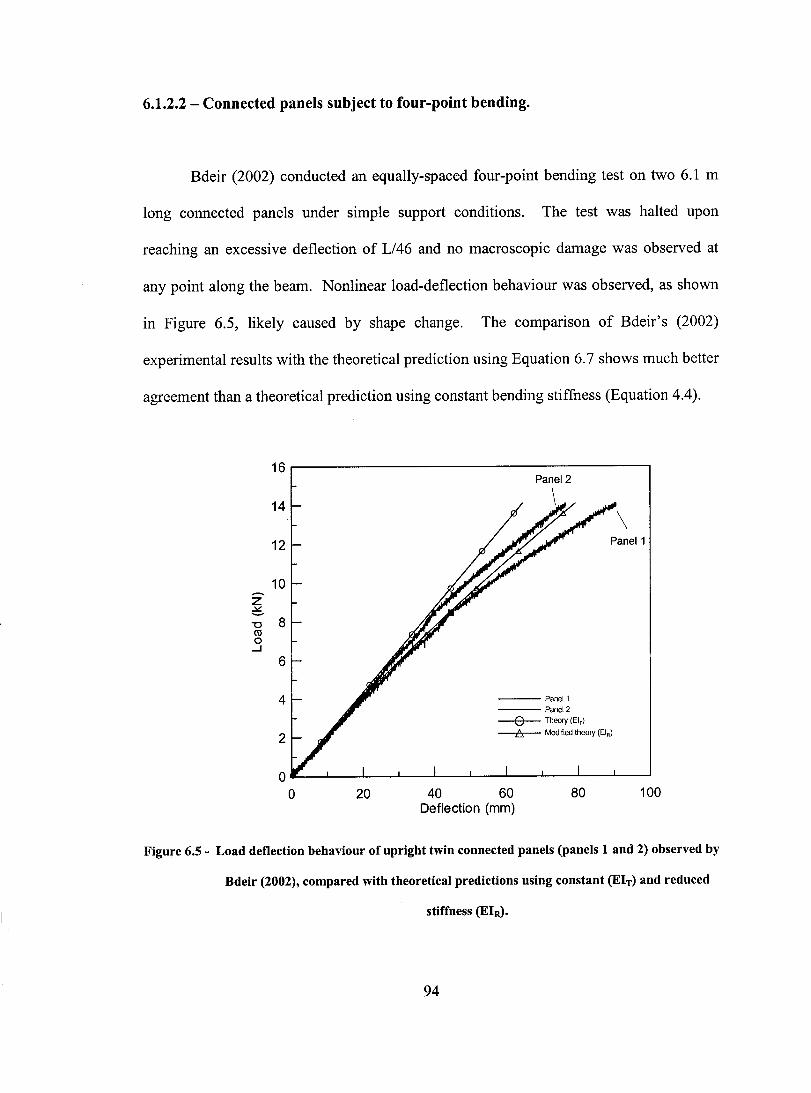
6.1.2.2 - Connected panels subject to four-point bending.
Bdeir (2002) conducted an equally-spaced four-point bending test on two 6.1 m
long connected panels under simple support conditions. The test was halted upon
reaching an excessive deflection of L/46 and no macroscopic damage was observed at
any point along the beam. Nonlinear load-deflection behaviour was observed, as shown
in Figure 6.5, likely caused by shape change. The comparison of Bdeir's (2002)
experimental results with the theoretical prediction using Equation 6.7 shows much better
agreement than a theoretical prediction using constant bending stiffness (Equation 4.4).
16 Panel 2
14 \
12 Panel 1
10 ....... z e.. "0 8 CIl 0
....J
6
4 ---PaneI1 --- Panel 2 o Theory (El,)
2 A Modified theory (EIR)
0 0 20 40 60 80 100
Deflection (mm)
Figure 6.5 - Load deflection behaviour of upright twin connected panels (panels 1 and 2) observed by
Bdeir (2002), compared with theoretical predictions using constant (Eh) and reduced
stiffness (EI~.
94
6.1.2.3 - Single panels subjected to four-point bending on multiple span lengths.
Validation was also conducted against the results of Giroux (1999) who tested
upright single panels with spans varying from 0.91 - 6.1 m under 4-point bending.
Again, these results were found to agree much more c10sely with the deflection predicted
by Equation 6.7 than that predicted by Equation 4.4, as shown in Figure 6.6. However,
once bearing failure was initiated at the load points, the stiffness reduction model was no
longer able to predict deflection behaviour, as it was not formulated to account for
material damage.
20r-------------------------------------~
16
--- 12 z ..:.:: '-'
"0 co o
...J 8
4
0.91 m
4.6m
----- Experimental o Theory (EIT )
es Modified theory (EIR )
6.1 m
o~--~--~--~--~--~--~--~--~--~~
o 40 80 120 160 200 Deflection (mm)
Figure 6.6 - Load deflection behaviour of single panels of varying length, as observed by Giroux
(1999), compared with theoretical predictions using constant (EIT) and reduced stiffness
95
AH of the successful verifications described above indicate that the stiffness
reduction model derived from single panel tests under uniform load can be used to predict
the load-deflection behaviour of FRP composite sheet pile panels, accounting for cross
sectional geometry change, over a range of loading conditions and in various structural
applications.
6.2 - Investigation of other possible causes of non-linearity.
Non-linearity in deflection behaviour could also potentiaHy be caused by a non
linear stress-strain relationship of the material, progressive material damage or unequal
tension-compression moduli. Material non-linearity can be ruled out as load-strain
behaviour of the single panels was observed to be linear up to failure (Figure 5.1). As
observed in the cyclic tests, even after subjecting the samples to severalload cycles at a
significantly high load (76% of ultimate load - see section 5.1), no reduction in stiffness
was observed, suggesting that no significant material damage was occurring during the
load cycles within that range. As the results of the upright and inverted single panel tests
indicate, aU members (main, pin and eye flanges) underwent similar behaviour whether
subjected to tension or compression (Figure 5.9), suggesting that there is no apparent
difference in tension and compression moduli.
96
6.3 - Determination of neutral axis position of connected panels from strain
measurements.
FRP composite structural sections are generally anisotropie, therefore the
modulus may vary throughout the cross-section depending on the amount of
reinforcement provided at a given location. For symmetrical structural sections, such as
1- and box-sections, one can assume that the centroid is located about the geometric
centre, provided the fibre reinforcement is symmetrical. For the open sections
investigated here, stiffness was found to reduce with increasing moment, therefore the
neutral plane must also be displacing. In light of this observation, an effort was made to
experimentally determine the neutral axis position with increasing moment for the
connected panel tests (which had been equipped with more gauges), using strain
measurements collected throughout the cross section. Measurements from the centre
panel were used, exc1uding strain values from the pin and eye flanges which were
influenced by out-of-plane bending. In this analysis, the effect of shear deformation on
the bending strain within the web region is assumed to be minimal. Figure 6.7 shows the
strain distribution through the cross-sectional depth of a typical connected panel (C-2)
with increasing load. Strain measurements were taken from the main flanges and webs at
either side (pin and eye).
97
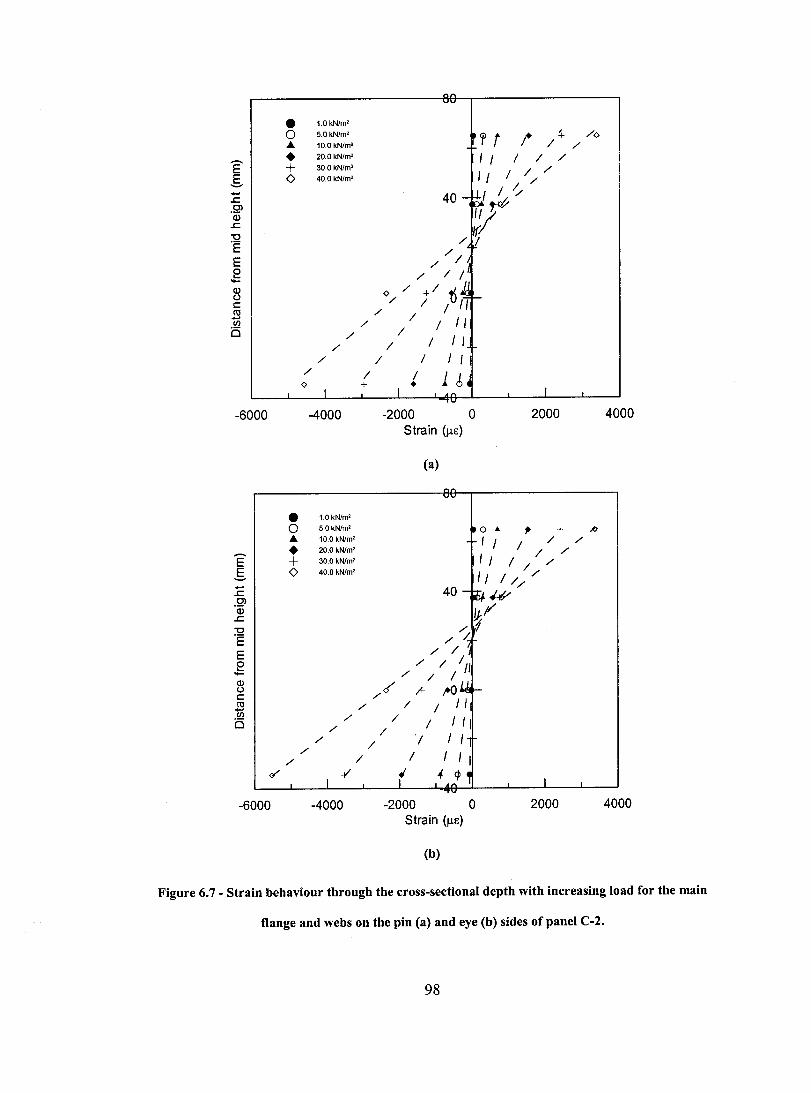
nn vv
• 1.0 kNlm'
0 5.0 kN/m' , T t l ~ /0 ... 10.0 kNlm' 1 / • 20.0 kN/m' 1 1 1 1 / Ê + 30.0 kNlm'
1 / S <> 40.0kN/m' 1 1 1 / - 40 - ifJ./~ L:. .!2l '1 Q) L:.
"0 /1- ~ ·E
/ E / 1 ~ e / 1 I~ - o / +1 t·4 Q) u
/ 1 if 1-e: CIl / 1 - / Il 1 1/ CIl
i5 / / 1 1 1 ,
/ 1 1 1 , 1 / 1 1 1 ~H 0 + • 1 1 '" 1
rv
-6000 -4000 -2000 0 2000 4000 Strain (/lE)
(a)
vv
• 1.0kN/m'
0 5.0 kN/m' ~ 0 • , + ~ ... 10.0 kNlm' 1 1 / / • 20.0 kNlm' 1 / Ê , 1 1 + 30.0 kNlm' 1 1 / S <> 40.0 kN/m'
Il 1 1/ / - 40 -L:. ~.# .!2l Q) Jk;/ L:.
"0 '/ "{
·E /
E / /
e / 1 1" - / 1 1 ~ <f' ;+ ,.oU .-e: / CIl / 1 1 1/ ëiî i5 / 1 1 1 , 1
/ 1 /
1 1 1 , /
1 1 , 1 / 1 Q/'
1 ..( t 4 cp ~
1 '" rv
-6000 -4000 -2000 0 2000 4000 Strain (/lE)
(b)
Figure 6.7 - Strain behaviour through the cross-sectional depth with increasing load for the main
flange and webs on the pin (a) and eye (b) sides of panel C-2.
98
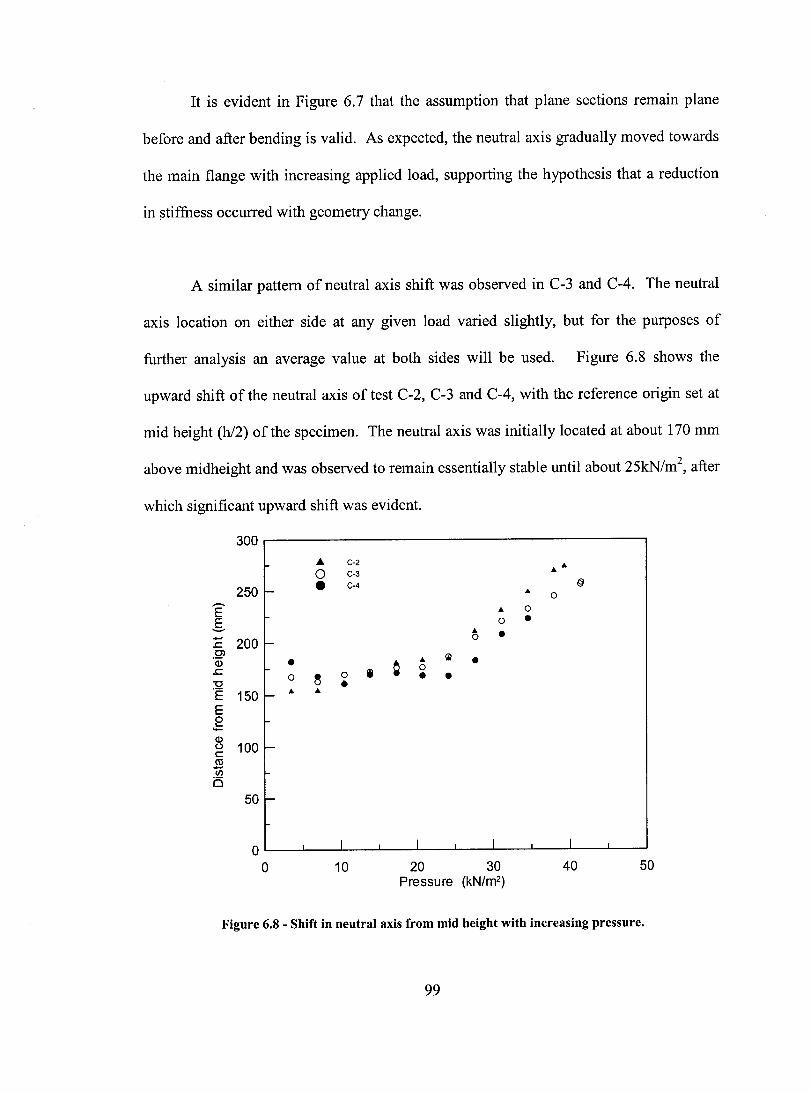
It is evident in Figure 6.7 that the assumption that plane sections remain plane
before and after bending is valid. As expected, the neutral axis gradually moved towards
the main flange with increasing applied load, supporting the hypothesis that a reduction
in stiffness occurred with geometry change.
A similar pattern of neutral axis shift was observed in C-3 and C-4. The neutral
axis location on either side at any given load varied slightly, but for the purposes of
further analysis an average value at both sides will be used. Figure 6.8 shows the
upward shift of the neutral axis of test C-2, C-3 and C-4, with the reference origin set at
mid height (h/2) of the specimen. The neutral axis was initially located at about 170 mm
above midheight and was observed to remain essentially stable until about 25kN/m2, after
which significant upward shi ft was evident.
300 ... C-2 ...... 0 C-3
250 • C-4 (:j r- ...
0 - 0 E ... E 0 • --- ... • - 200 0 .c. f-.Ql ... li) • Q) • Q .c. i
0 0 ~ 0 • • '0 • 'Ë 150 f- ... ...
E e -Q) u 100 -c:: co -en 0
50 -
0 1 l 1 1
0 10 20 30 40 50 Pressure (kN/m2)
Figure 6.8 - Shift in neutral axis from mid height with increasing pressure.
99
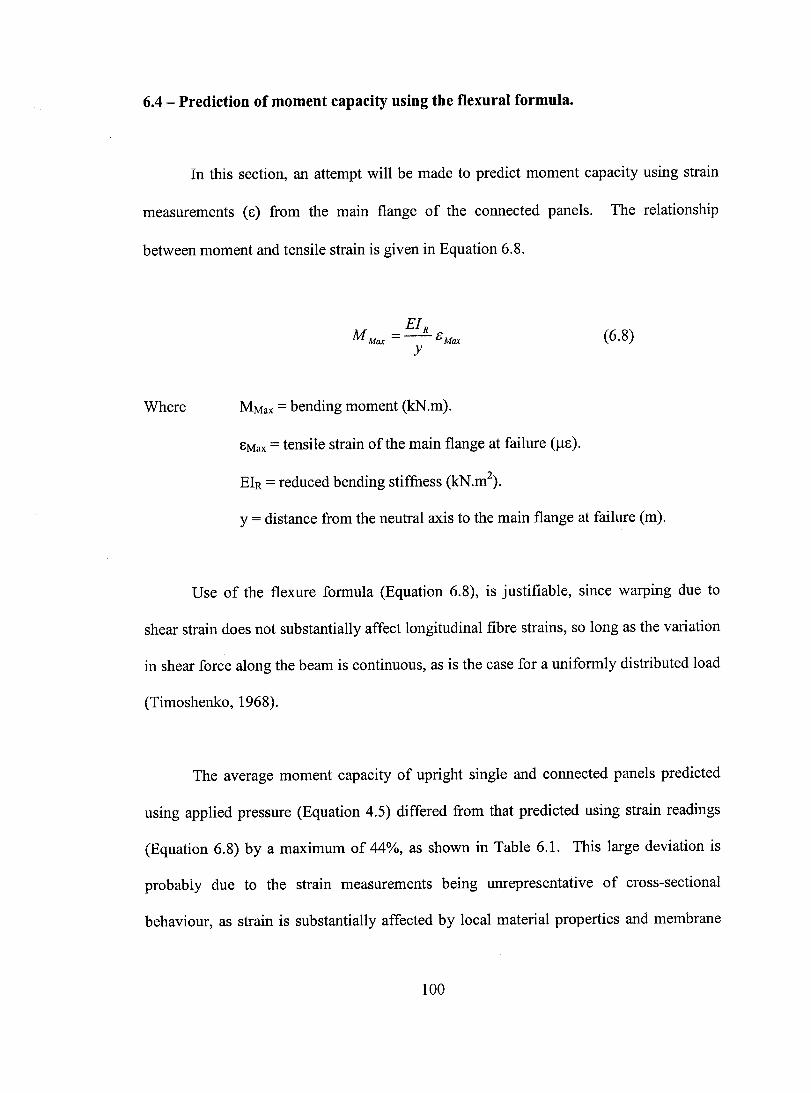
6.4 - Prediction of moment capacity using the flexural formula.
In this section, an attempt will be made to predict moment capacity using strain
measurements (8) from the main flange of the connected panels. The relationship
between moment and tensile strain is given in Equation 6.8.
Where
EIR MMax =--8Max
y
MMax = bending moment (kN.m).
8Max = tensile strain of the main flange at failure (J.l8).
EIR = reduced bending stiffuess (kN.m2).
(6.8)
y = distance from the neutral axis to the main flange at failure (m).
Use of the flexure formula (Equation 6.8), is justifiable, since warping due to
shear strain does not substantially affect longitudinal fibre strains, so long as the variation
in shear force along the beam is continuo us, as is the case for a uniformly distributed load
(Timoshenko, 1968).
The average moment capacity of upright single and connected panels predicted
using applied pressure (Equation 4.5) differed from that predicted using strain readings
(Equation 6.8) by a maximum of 44%, as shown in Table 6.1. This large deviation is
probably due to the strain measurements being unrepresentative of cross-sectional
behaviour, as strain is substantially affected by local material properties and membrane
100

effects. It can therefore be hypothesized that, for open sections such as the one studied
here, the prediction of structural behaviour using deflection and applied pressure is more
suitable, while strain measurements should preferably be used for the analysis of
localized phenomena.
Table 6.1 - Comparison of the moment capacity of connected panels predicted using strain
measurements and applied pressure.
Max moment Max moment Specimen (kN.m) (kN.m) Difference (%)
(Equation 5.5) (Equation 7.8)
C-2 9.76 14.06 44.1
C-3 8.40 10.51 25.1
C-4 9.23 12.28 33.0
6.5 - Implications for design of FRP sheet pile walls.
The low modulus and thin-walled shape of FRP sheet pile panels makes them
susceptible to excessive deflection, which may therefore be a limiting parameter in
design. Hence, it is vital to predict the deflection of an FRP sheet pile wall as accurately
as possible under design load.
The forrnulated empirical stiffness reduction model (Equation 6.7) can facilitate
the design of FRP composite sheet pile walls, as it provides a more accurate prediction of
deflection under applied loads. Maximum moment induced on the structure by the
surrounding earth and hydrostatic pressure must first be deterrnined using the free- or
101

fixed-earth support methods. The reduced bending stiffness (EIR) can subsequently be
predicted using the formulated empirical equation (Equation 6.6), from which deflection
can be calculated using Timoshenko's beam theory (Equation 6.7), accounting for
bending and shear deformation.
102
CHAPTER7
CONCLUSION
The uniform load test procedure utilized in this study allowed for more accurate
determination of moment capacity in FRP composite sheet pile panels, as local crushing
behaviour within the span was avoided. Rence, the average moment capacity obtained in
this study was more than double that found in earlier studies. As composite materials are
quite sensitive to concentrated loads, this uniform load testing method is more
appropriate than three and four point bending tests for investigating the structural
behaviour of composite shapes.
Moment capacity obtained from cyclic upright panel tests was found to lie within
the range of values found in monotonic upright panel tests, and differed from the average
of monotonic tests by only about 5%. The behaviour of the cyclically tested panel
suggested that no noticeable reduction in capacity occurred due to material damage
induced by the repeated load cycles within 76% ofultimate capacity. As well, the failure
modes observed in both monotonic and cyclic tests were nearly identical. Ultimate
moment capacity found in inverted single panel tests was also not significantly different
from average upright panels, however, a completely different failure mode was observed.
The web crippling failure observed in upright single panel tests was sudden, and could
103
not be anticipated based on deflection or strain measurements, while the main flange
buckling which occurred in inverted panels is evident in strain gauge measurements.
The ultimate moment capacity observed in connected panel tests was 16% lower
than that found in single panel tests. This may possibly be due to the fact that connected
panels experienced different boundary conditions than single panels, affecting their
behaviour, or to a potential unevenness in transverse pressure distribution. Failure of
connected panels generally involved the middle panel and one of the adjacent panels, and
the nature of the failure is essentially similar to that observed in upright single panel tests.
Interestingly, no joint failure was observed in any of the connected panel tests.
The backfilling of FRP panels with concrete resulted in significantly increased
moment capacity, over three times greater than the ultimate moment capacity of FRP
panels alone. However, the backfilled panels exhibited an increase in stiffness of only
24% over unfilled panels. It can therefore be conc1uded that concrete backfilling of FRP
panels successfully increased their structural capacity and could represent an effective
means of strengthening retaining walls. Hybrid panels were observed to fail due the
shearing failure of the composite at the bolted regions, followed by separation of the
concrete fill from the FRP panel. Therefore, the capacity of FRP panels cou Id potentially
be increased even further by providing more shear studs, which would promote more
effective composite action.
Load deflection behaviour of upright and inverted single panels correlated well
with the theoretical predictions of Timoshenko's beam theory in the lower load ranges,
104
beyond which nonlinear deflection behaviour was observed. Based on experimental
results, it was apparent that the nonlinear deflection behaviour was attributable to a
reduction in stiffness which resulted from a geometric shape change of the panel. An
empirical model was formulated to describe the stiffness reduction with increasing load,
which proved effective in predicting the deflection behaviour of single and connected
panels. Furthermore, the stiffness reduction model was successfully validated against
deflection behaviour of similar FRP sheet pile panels observed in prior studies.
An attempt made to predict moment capacity using strain measurements at failure
differed greatly from moment capacity predicted from applied pressure, most likely due
to the sensitivity of strain to local behaviour and the local variations in material properties
which are an attribute of composite materials.
Concrete fillers placed in the support regions of tested beams proved to mitigate
crushing at the support regions which would otherwise be observed at relatively low load
levels. The load carrying capacity of the tested panels was not affected by crushing at the
supports, but a significant increase in deflection was observed in panels which were only
partially supported. It is therefore recommended that fillers be placed in the anchor
regions of FRP composite sheet pile walls in order to prevent the initiation of premature
crushing in the support regions.
105
References
Adaszkiewicz, M. L. (1977). Behaviour of Continuous Reinforced Concrete Beams
Under Uniform Loads. M.S Thesis, Department of Civil Engineering and Applied
Mechanics, McGill University, Montreal, Canada.
American Society of Civil Engineers (AS CE) (1996). Design ofSheet Pile Walls.
Technical Engineering and Design Guides Adapted from the US Army Corps of
Engineers, no. 15. ASCE Press.
Azizi, F. (2000). Applied Analyses in Geotechnics. E & FN Spon, New York, New
York. pp. 609-614.
Bakis, c.E., Bank, L.c., Brown, L.V., Cosenza, E., Davalos, J. F., Lesko, J. J., Machida,
A., Rizkalla, H. S. and Triantafillou, T. C. (2002). Fiber-Reinforced Polymer
Composites for Construction - State-of-the-Art Review. Journal of Composites for
Construction, 6 (2), 73-87.
Bank, L. C., Gentry, T. R. and Nadipelli, M. (1996). Local Buckling ofPultruded FRP
Beams - Analysis and Design. Journal of Reinforced Plastics and Composites, 15(3),
283-294.
Bank, L.C., Yin, J, and Nadipelli, M., (1995). Local buckling ofpultruded beams
nonlinearity, anisotropy and inhomogeneity. Construction and Building Materials, 9(6),
325-331.
Bank, L.e. (1989a). Properties ofpultruded fibre reinforces plastic structural members.
Transp. Res rec., Transportation Resource Board, Washington, D.C., 117-124.
106

Bank, L.C. (1989b). Flexural and Shear Moduli of Full-Section Fibre-Reinforced Plastic
(FRP) Pultruded Beams. Journal ofTesting and Evaluation, 17(1),40-45.
Barbero, E. J. (1999). Introduction to Composite Materials Design. Taylor & Francis,
Philadelphia. pp. 15-34.
Barbero, EJ., Raftoyiannis, I.G. (1993). Local Buckling ofFRP Beams and Columns.
Journal of Materials in Civil Engineering, 5(3), 339-355.
Barbero, (1991a). Pultruded structural shapes: stress analysis and failure prediction.
Proc., Spec. Conf on Advanced Comp. in Civ. Engrg. Struct., ASCE, New York, N.Y.,
194-204.
Barbero, E. 1., Fu, S. H., and Raftoyiannis, 1. (1991b). Ultimate Bending Strength of
Composite Beams. Journal ofMaterials in Civil Engineering, 3(4), 292-306.
Bayasi, Z. and Kaiser, H. (2003). Flexural Behavior of Composite Concrete Slabs Using
Carbon Fiber Laminate Decks. AC! Materials Journal, 100(4),274-279.
Bdeir, Z. (2001). Deflection-Based Design of Fiber Glass Polymer (FRP) Composite
Sheet Pile Wall in Sandy Soil. M.S Thesis, Department of Civil Engineering and
Applied Mechanics, McGill University, Montreal, Canada.
Bowles, J. E. (1996). Foundation Analysis and Design, 5th Edition. McGraw-Hill, New
York. pp 725-728.
Broms, G. G. (2004). Foundation Engineering.
http://www.geoforum.comlknowledge/textslbroms/viewpage.asp?ID=259
107

Bryan, E. R. and Davies, J. M. (1984). Design ofProfiled Steel Sheeting and Decking.
in: Behaviour of Thin-Walled Structures. Rhodes, J. and Spence, J. (eds). Elsevier
Applied Science Publishers, New York, NY. Pp 143-164.
Creative Pultrusions (2002). SuperLoc Composite Sheet Pile System Design Manual.
Volume l, November 1, 2002. available at: www.creativepultrusions.com
Charndra, M. and Roy, S. K. (1993). Plastic Technology Handbook. 2nd ed. Marcel
Dekker, Inc, New York. pp. 201-202.
Costa, F. J. A. (1999). Experimental Characterization of the Mechanical and Structural
Properties of Fiber Reinforced Polymerie Bridge Deck Components. Ph.D Dessertation,
School of Civil and Environmental Engineering, Georgia Institute of Technology,
Atlanta, USA.
Eurocomp Design Code and Handbook: Structural Design of Polymer Composites
(1996). E. Clarke (ed), Spon, London, UK: 751.
Giroux, C., and Shao, y. (2003). Flexural and Shear Rigidity of Composite Sheet Piles.
Journal of Composites for Construction, 7(4), 348-355.
Giroux, C. (2000). Analysis of the Flexural behavior of a Fiberglass Composite Seawall.
M.S Thesis, Department of Civil Engineering and Applied Mechanics, McGill
University, Montreal, Canada.
108
Hillman, J.R. and Murray, T.M. (1990). Innovative floor systems for steel framed
buildings. Mixed Structures, Including New Materials; Proc., IABSE Symp.,
International Association for Bridge and Structural Engineering, Zurich, Switzerland,
60, 672-675.
Howard, 1. (2002). Development of Lightweight FRP Bridge Deck Design and
Evaluations. M.S Thesis, Department of Civil and Environmental Engineering, West
Virginia University, Morgantown, USA.
Iskander, M. G. and Hassan, M. (1998). State of the Practice Review in FRP Composite
Piling. Journal of Composites for Construction, 2(3), 116-120.
Kavlicoglu, B.M., Gordaninejad, F., Saiidi, M. and Jiang, Y. (2001). Analysis and
Testing of GraphitelEpoxy-Concrete Bridge Girders under Static Loading. Proceeding of
Conference on Retrofit and Repair of Bridges, London, England.
Kemp, G. J. (1971). Simply Supported, Two Way Prestressed Concrete Slabs Under
Uniform Load M.S Thesis, Department of Civil Engineering and Applied Mechanics,
McGill University, Montreal, Canada.
Kim, D. -H. (1995). Composite Structures for Civil and Architectural Engineering. E &
FN Spon, London. pp. 3-5.
Kitane, Y., Aref, A.J. and Lee, G.C. (2004). Static and Fatigue Testing of Hybrid Fiber
Reinforced Polymer-Concrete Bridge Superstructure. Journal of Composites for
Construction, 8(2), 182-190.
109
Kollar, L. P. (2003). Local Buckling of Fiber Reinforced Plastic Composite Structural
Members with Open and Closed Cross Sections. Journal of Structural Engineering,
129(11),1503-1513.
Lampo, R., T. Nosker, D. Bamo, J. Busel, A. Maher, P. Dutta and R. Odello, (1998).
Development and Demonstration of FRP Composite Fender, Loadbearing, and Sheet
Piling Systems. Technical Report. 98/123, US Army Corps of Engineers Construction
Engineering Research Laboratory, 98/123, September.
Lee, J., Hollaway, L., Thome, A., and Head, P. (1995). The structural characteristic of a
polymer composite cellular box beam in bending. Construction and Building Materials,
9(6),333-340.
Leonards, G. A. (1962). Foundation Engineering. McGraw-Hill Book Company, New
York. pp445-446.
Mottram, J.T. (1991). Structural properties ofpultruded E-glass fiber-reinforced
polymeric I-beam. Proc. 6th Int. Conf Composite Structures, I.H. Marshall (ed), Elsevier
Science, Oxford, U.K., p 1-27.
Mottram, J.T. (1993). Short- and long-term structural properties ofpultruded beam
assemblies fabricated using adhesive bonding. Composite Structures, 25, 387-395.
Musial, W.D., Boume, B., Hughes, S.D., Zuteck, M.D. (2001). Four-point Bending
Strength Testing ofPultruded Fiberglass Wind Turbine Blade Sections. National
110

Renewable Energy Laboratory. AWEA Windpower 2001 Conference, Washington, D.C.
NRELlCP-500-30565. Available at: http://www.doe.gov/bridge
Nagaraj, V., and GangaRao, H. V. S. (1997). Static Behavior ofPultruded GFRP Beams.
Journal of Composites for Construction, 1(3), 120-129.
Nordin, H. and Taljsten, B. (2003). Testing ofhybrid FRP composite beams in bending.
Composites, Part B. IN PRESS
Qiao, P., Davalos, J. F., Barbero, E. J., and Troutman, D. (1999). Equations facilitate
composite designs. Modern Plastic Mag., 76(11), 77-80.
Qiao, P., Davalos, J. F., and Brown, B. (2000). A systematic analysis and design
approach for single-span FRP deck/stringer bridges. Composites: Part B, 31, 593-609.
Qiao, P., Davalos, J.F. and Wang, J. (2001). Local Buckling of Composite FRP Shapes
by Discrete Plate Analysis. Journal of Structural Engineering, 127(3), 245-255.
Roberts, J.C., Boyle, M.P., Wienhold, P.D. and White, G.J. (2002). Buckling, collapse
and failure ofFRP sandwich panels. Composites, Part B., 33, 315-324.
Roberts, T. M., and AI-Ubaidi, H. (2002). Flexural and Torsional Properties ofPultruded
Fiber Reinforced Plastic I-Profiles. Journal of Composites for Construction, 6(1), 28-34.
III
Rowe, P. W., (1952). Anchored Sheet-Pile Walls. Proceedings of the Institution of Civil
Engineering, London, Vol. 1.
Schwartz, M. M. (1996). Composite Materials: Properties, Nondestructive Testing, and
Repair. Prentice Hall, New Jersey. pp. 7.
Shao, Y., and Kouadio, S. (2002). Durability of Fiberglass Composite Sheet Piles in
Water. Journal of Composites for Construction, 6(4), 208-287.
Sims, G. D., Johnson, A. F., and Hill, R. D. (1987). Mechanical and Structural Properties
ofa GRP Pultruded Section. Composite Structures, 8, 173-187.
Sotiropoulos, S. N., GangaRao, H. V. S., and Mongi, A. N. K. (1994). Theoretical and
Experimental Evaluation ofFRP Components and Systems, 120(2),464-485.
Tsinker, G. P. (1997). Handbook of Port and Harbor Engineering: Geotechnical and
Structural Aspects. Chapman & Hall, New York, N.Y. pp
Zureick, A., Kahn, L. F., and Bandy, B. J. (1995). Tests on Deep I-Shape Pultruded
Beams. Journal of Reinforced Plastics and Composites, 14(4),378-389.
112


![First Evaluation on Structural Behavior of All FRP Bolted ... · PDF filebeam-column connection [4]. ... “Further tests on beam -to column connections for pultruded frames: Web –](https://img.pdfslide.us/doc/110x75/5ab0a74f7f8b9a00728b5326/first-evaluation-on-structural-behavior-of-all-frp-bolted-connection-4-.jpg)