Embed Size (px)
Citation preview
Journal of Experimental Marine Biology and Ecology 442 (2013) 10–21
Contents lists available at SciVerse ScienceDirect
Journal of Experimental Marine Biology and Ecology
j ourna l homepage: www.e lsev ie r .com/ locate / jembe
Molting, growth, and energetics of newly-settled blue king crab: Effects oftemperature and comparisons with red king crab
Allan W. Stoner a,⁎, Louise A. Copeman b, Michele L. Ottmar a
a Fisheries Behavioral Ecology Program, Alaska Fisheries Science Center, National Marine Fisheries Service, National Oceanic and Atmospheric Administration, 2030 S., Marine Science Dr.,Newport, OR 97365, USAb Cooperative Institute for Marine Resources Studies, Oregon State University, Hatfield Marine Science Center, 2030 S., Marine Science Dr., Newport, OR 97365, USA
⁎ Corresponding author. Tel.: +1 541 867 0165; fax:E-mail address: [email protected] (A.W. Stone
0022-0981/$ – see front matter. Published by Elsevier Bhttp://dx.doi.org/10.1016/j.jembe.2013.02.002
a b s t r a c t
a r t i c l e i n f oArticle history:Received 11 January 2013Received in revised form 1 February 2013Accepted 2 February 2013Available online xxxx
Keywords:BioenergeticsCultureFatty acidGrowthLipidParalithodes platypusTemperature
Populations of blue king crab (BKC) (Paralithodes platypus Brandt, 1850) have declined in Alaskan watersover recent decades, and substantial effort is being made to rehabilitate the once important fishery with re-leases of hatchery-reared juveniles. However, little is known about the species' first year of post-settlementlife. This study was conducted to evaluate how temperature mediates growth and energy allocation begin-ning with the first benthic instar (stage C1). Juvenile BKC were reared in four temperatures (1.5 to 12 °C)for a period of 60 days in low-density populations (150 crabs m−2) and 120 days in individual cultures.Growth rate increased rapidly up to 8 °C, and then leveled off. At 60 days, most of the crabs in 1.5 °Cremained at stage C1, most in 4.5 °C were C2, and most in 8 °C were C3, while those in 12 °C were highlyvariable and ranged from C2 to C5. Growth records for individuals revealed an inverse exponential relation-ship between water temperature and intermolt period (up to 8 °C). A small decrease in molt increment at12 °C resulted in crabs 6% smaller than those at 8 °C. Total lipid content increased with temperature in C2BKC, but the response was variable and not significant in later stages. The proportion of storage class lipids(triacylglycerols) increased with an increase in temperature and polar lipids decreased. Concentrations ofessential fatty acids were relatively constant over all temperature treatments, indicating that temperatureand growth rate did not affect the biochemical condition of juvenile BKC. Survival rates of BKC (>95%)were similar across temperatures and were much higher than rates observed for red king crab (RKC)(Paralithodes camchaticus Tilesius 1815) (65–72%) in identical experiments. Growth rates of the two specieswere nearly identical up to 8 °C, but RKC grew faster than BKC at temperatures greater than 8 °C, with moremolts resulting in larger individuals. Fatty acid (FA) signatures supported the lipid class data and showed thatBKC had higher proportions of FA associated with energy storage while RKC had higher proportions of poly-unsaturated FAs associated with membranes. These results indicate that BKC are the hardier species, and itshows little sign of cannibalism in culture (unlike RKC), but RKC grow faster at high temperature and areless vulnerable to warming climate. These data help to model temperature-dependent recruitment processesin the field and assist in the design of diets and hatchery conditions for production of seed stocks intended forfield release.
Published by Elsevier B.V.
1. Introduction
Multi-decadal shifts in oceanographic conditions are well studied inthe Gulf of Alaska and the Bering Sea (Hollowed et al., 2001; Hunt et al.,2002; Peterson and Schwing, 2003), and these shifts can cause impor-tant changes in the distribution and abundance of both marine fishesand invertebrates (Anderson and Piatt, 1999; Hollowed et al., 2012;Perry et al., 2005). Longer-term trends in sea surface warming andloss of sea ice have also been documented in Alaska (Grebmeier et al.,2006; Sigler et al., 2011; Stabeno et al., 2007), and the potential impacts
+1 541 867 0136.r).
.V.
on economically important species are large (Logerwell et al., 2011;Orensanz et al., 2004). Both positive and negative impacts on fisheriesare possible under the scenario of changing climate because of thecomplexity of changes in temperature, water chemistry, primaryproductivity, and shifts in species ranges and food web structure(Ainsworth et al., 2011). Temperature has a fundamental and domi-nant role in the behavior, physiology, growth, and survival of ectother-mic animals living in high latitudes and these direct effects are thefocus of this study.
King crabs represent some of the most valuable fishery resourcesharvested from the cold waters of Alaska (Orensanz et al., 1998; Otto,1989), and two species comprise most of the catch, red king crab(RKC) (Paralithodes camtschaticus Tilesius, 1815) and blue king crab
1 Reference to a trade name does not imply endorsement by the National MarineFisheries Service, NOAA.
11A.W. Stoner et al. / Journal of Experimental Marine Biology and Ecology 442 (2013) 10–21
(BKC) (Paralithodes platypus Brandt, 1850). BKC has been secondary toRKC in value; the largest populations of BKC are more northerly andmay be more sensitive to warming conditions in the Bering Sea thanRKC. Details on the distribution and fishing histories for BKC are pro-vided by others (Herter et al., 2011; Stevens et al., 2008a). Briefly,BKC live in isolated populations in the Bering Sea, Gulf of Alaska, south-east Alaska, and in the western Pacific Ocean near Japan and Russia. Inthe United States, the vast majority of BKC have been landed fromfishing grounds near St. Matthew Island and the Pribilof Islands witha peak catch (value=$12 million) occurring in 1997. However, catchrates in these areas showed signs of decline in the 1980s, and thepopulations decreased precipitously in the 1990s (Stevens, 2006).The collapse of king crab fisheries in Alaska has been attributed toboth over-harvest and unfavorable environmental conditions forrecruitment (Dew, 2010; Dew and McConnaughey, 2005; Orensanz etal., 1998). After long closures of the BKC fishery, some stocks arerebuilding, and short-term openings and annual catch limits (400–800 MT y−1) have been re-established at St. Matthew Island since2009. The fishery for BKC remains closed in all other areas of Alaska.
We have relatively good understanding of fecundity, embryonicdevelopment, and hatching in BKC (Herter et al., 2011; Stevens etal., 2008a,b), and the larvae have been cultured in Alaskan laborato-ries since 2004 (Persselin, 2006). Despite the fact that BKC are beingcultured with the primary intent of restoring wild populationsthrough releases of hatchery-reared juveniles, relatively little isknown about their first few years of post-settlement life (seeArmstrong et al., 1985; Tapella et al., 2009), particularly with respectto how temperature affects survival, growth, and energy allocation.Consequently, this study was designed in the context of two broadthemes — understanding how growth and survival of early juvenileBKC may be affected by warming trends in Alaska, and determininghow temperature might be used in developing the best possiblemethods for culturing crabs in a hatchery setting.
Temperature is generally believed to be the most important ex-trinsic factor affecting growth in crustaceans (Hartnoll, 1982, 2001).The largest impact of temperature is on intermolt period, (i.e., the du-ration between two successive molts), and there are many examplesof decreasing intermolt period with increasing temperature. Temper-ature can also influence the molt increment (i.e., the change in sizethat occurs between one instar and the next). Effects of temperatureon molt increment are variable, with many crustaceans showing novariation over a wide range of temperature (reviewed by Hartnoll,1982), although RKC demonstrated a small increase in molt incre-ment with increasing temperature (Stoner et al., 2010a).
Lipids and fatty acids (FAs) are vital to developing marineorganisms as they provide a dense source of energy (kcal·g−1) andare important structural components of membranes (Copeman andParrish, 2003; Sargent, 1989). Prior work with RKC juveniles hasshown that triacylglycerols (TAGs) are the major lipid storage class(Stoner et al., 2010a), in agreement with other studies on crustaceanlarvae and juveniles (Nates and McKenney, 2000). Further, Copemanet al. (2012) found that TAG levels in RKC cycled within an inter-moltperiod, with rapid accumulation shown seven days following a molt.Other major lipid classes in crabs include sterols (STs) and phospho-lipids (PLs), which form important building blocks of cellular mem-branes. Relative improvements in both larval and juvenile conditionin marine crustaceans, such as American lobster (Homarus americanumH. Milne Edwards, 1837) and RKC (Copeman et al., 2012) have beenattributed to elevated total lipid, TAG per dry weight, and TAG/ST ratios(Fraser, 1989).
The importance of dietary polyunsaturated fatty acids (PUFAs) tothe culture of juvenile crustaceans has been investigated for crabs(Zmora et al., 2005), lobster (Limbourn and Nichols, 2009) and shrimp(Lavens and Sorgeloos, 2000). Crustaceans generally require PUFAssuch as docosahexaenoic acid (DHA, 22:6n−3), eicosapentaenoic acid(EPA, 20:5n−3), and arachidonic acid (AA, 20:4n−6) at minimum
dietary levels because they cannot be formed de novo from shorterchain dietary precursors (Merican and Shim, 1996). Cultured RKC fedon enriched Artemia have lower proportions of essential PUFAs (DHA,EPA, AA) than those collected from the wild (Copeman et al., 2012)and it is thought that nutritional deficiencies play a role in elevatedmortality during the early life history stages of crabs reared in hatcher-ies (Daly et al., 2009). The effects of temperature and dietary FAs onjuvenile crab vitality are likely interactive. Previous studies show thathigh levels of essential PUFAs are retained in marine organisms atlow temperatures (Dunstan et al., 1999; Hall et al., 2000, 2002) withelevated PUFAs in cellular membranes being important for thermaladaptation.
This study was designed to evaluate the role of water temperatureon survival, molting frequency, growth, and lipid storage in the earliestbenthic stages of BKC. Four temperatures were tested (1.5° to 12 °C),spanning the normal range of distribution encountered by newly-settled BKC in the field. Lipid and FA analyses were made at eachcrab molt stage to explore the effects of temperature and ontogenyon crab condition and energy allocation. The results of these experi-ments are relevant to both aquaculture and changing climate condi-tions in Alaska, and are compared with somewhat different growthdynamics observed in RKC.
2. Methods
2.1. Experimental animals
Blue king crabs for this study were supplied by the Alutiiq PrideShellfish Hatchery in Seward, Alaska. Nineteen ovigerous femaleBKC were collected with baited pots set near St. Matthew Island,Alaska, in November and December 2011, air transported to Seward,and maintained at the hatchery on chopped herring and squid untiltheir larvae were released in March 2012. Larvae released from atleast three females were mixed randomly and reared in three 190 ltanks until the glaucothoe stage was achieved, fed daily with Artemianauplii enriched with DC DHA Selco enrichment media.1 Glaucothoewere reared in 65 l cylindrical tanks until they molted to the firstbenthic crab stage (C1).
The juvenile crabs (4±1 days post-settlement) were shipped ininsulated containers of seawater (4–5 °C) to the Hatfield MarineScience Center (Newport, Oregon) on 22 May 2012. Upon arrival thecrabs were sorted for uniform size representing the C1 stage (~2 mmcarapace width), with high mobility and in premium condition. Indi-viduals meeting these criteria were dispersed immediately to theexperimental tank apparatus (see below), all set at 6 °C. An additionalsubset of 25 crabs meeting the same criteria were set aside formeasurement.
Beginning the next day temperatures were adjusted by 2 °C perday to the target temperatures of 1.5, 4.5, 8 and 12 °C and designtemperatures were achieved within 5 days. For the duration of theacclimation and experimental periods all of the crabs were fed dailyon a diet of Cyclop-Eeze and Otohime pelletized food (size B), insur-ing that fresh food was always present. Uneaten food was removedand replenished weekly. Earlier studies (Daly et al., 2009; Stoner etal., 2010a) have shown that this diet provides for high growth ratesin juvenile RKC.
2.2. Experimental apparatus and culture procedures
Methodology described by Stoner et al. (2010a), was followed forthe BKC temperature experiments. The crabs were cultured in two dif-ferent systems. In the first, populations of 40 C1 stage crabs were heldin rectangular polyethylene tanks (42 cm wide, 63 cm long, 30 cm
12 A.W. Stoner et al. / Journal of Experimental Marine Biology and Ecology 442 (2013) 10–21
deep) for a density of 150 crabs m−2 of tank bottom area. Each tankwas supplied with a continuous flow (35 ml s−1) of sand-filtered sea-water. Two loose bundles of BioFil filter material (~1 l each) and twoloose bundles of black polypropylene gill netting material (1.5 l each)in each tank provided refuge for molting crabs. Four replicate tankswere set up for each of the three coldest temperatures (1.5, 4.5, and8 °C), and three replicates for 12 °C. In the second system, crabs wereheld individually in each of the experimental temperatures so thatmolting schedules could be observed directly and to remove any effectsof cannibalism on growth and survival. Individual cells weremesh-sided columns (3.0 mm mesh, 10 cm diam., 17.5 cm high)with a bottom of black plastic glued into place. The size of our holdingcompartments is well above size ranges known to inhibit growth andsurvival for recently settled RKC (Swiney et al., in press). A separateliner with 0.5 mm nylon mesh was used to retain the small crabs.Sets of mesh cells were set into polyethylene tanks identical to thoseused for the population treatments. The tanks were equipped with afloor of plastic latticework beneath which a manifold of PVC plumbingprovided a continuous upwelling flow of temperature-conditionedseawater to the cells which stood upright on the false floor with10 cm of the cells below thewater line. Temperature and oxygen levelsinside the cells were always equivalent to the levels in the surroundingwater bath. Two tanks of individual cells (14 per tank) were designatedfor each temperature treatment. The cells were systematically movedwithin each tank on a weekly basis to minimize any location effects.
The population tanks were surveyed for survivors 30 days and60 days after temperatures reached target levels. On each of thesedates the crabs were counted and measured for carapace width(CW). The individual cultures were examined daily for the occurrenceof molting, and each crab was measured 4 to 7 days following a molt.While the population-based trials were terminated at 60 days, thegrowth experiment with individuals was continued an additional60 days to achieve molts to stage C2 in the coldest treatment.
Digital photographs of crabs were taken to obtain accurate mea-sures of carapace width. Photographs of live crabs were capturedwith a dissecting microscope equipped with a calibrated digital cam-era and Image Pro software. The primary measurement taken wascarapace width without lateral spines (CW) as defined by Epelbaumet al. (2006) and following the earlier study with RKC (Stoner et al.,2010a). Live crabs were held in a small Petri dish surrounded byseawater ice to maintain the experimental temperature during themeasurement. Mean CW at the beginning of the experiment was1.96 mm (SD=0.08 mm).
2.3. Crab weights and chemical analyses
BKC cultured individually were sampled for weight, total lipids,lipid classes and FAs at the mid-molt period of C2 (all temperatures),C3 (4.5, 8 and 12 °C) and C4 (8 and 12 °C). Timing for sampling eachindividual was determined on the basis of the preceding intermolt pe-riod. This provided standardization for differences in lipid compositionthat occur over the molt cycle (Copeman et al., 2012). Two individualswere pooled for the C2 stage in order to obtain sufficient materialfor lipid class and FA analyses (>200 μg), while individual crabs wereanalyzed for later molt stages. Four lipid samples were taken fromeach temperature treatment at each of the above listed samplingperiods.
Lipids were extracted in chloroform/methanol according to Parrish(1987) using a modified Folch procedure (Folch et al., 1957). Lipidclasses were determined using thin layer chromatography with flameionization detection (TLC/FID) with aMARK V Iatroscan (Iatron Labora-tories, Inc., Tokyo, Japan) as described by MacFarlane and Norton(1999). Three μl of crab extracts were spotted on duplicate silica gelcoated Chromarods. Lipids were then focused in acetone and separatedinto steryl or wax esters, triacyclglycerols (TAGs), free fatty acids,sterols (STs), and polar lipids (PLs) in a one-stage 45-min development
bath of 246:54:0.020 hexane:diethyl ether:formic acid. Prior to theselection of this method, five crab samples were developed using athree-phase development system (Copeman et al., 2012; Parrish,1987). The one-stage development system was chosen because 95%of the lipids were found to be TAGs, STs, or PLs. Data peaks were inte-grated using Peak Simple software (ver. 3.67, SRI Inc.) and the signaldetected in millivolts was quantified using external lipid standardscurves for each lipid class (Sigma, St. Louis, MO, USA). Lipid classeswere expressed both in relative (mg g−1 dry weight) and absoluteamounts (μg animal−1).
Total lipid was analyzed for fatty acid (FA) composition usingthe same samples. Fatty acid methyl esters (FAME) were preparedby transesterification with 14% BF3 in methanol at 85 °C for90 min (Morrison and Smith, 1964). FAMEs were analyzed on anHP 7890 GC FID equipped with an autosampler and a DB wax+GC column (Agilent Technologies, Inc., U.S.A.). The column was30 m in length, with an internal diameter of 0.25 μm. The columntemperature began at 65 °C and held this temperature for 0.5 min.Temperature was increased to 195 °C (40 °C min−1), held for15 min then increased again (2 °C min−1) to a final temperature of220 °C. Final temperature was held for 1 min. The carrier gas was hy-drogen, flowing at a rate of 2 ml·min−1. Injector temperature was setat 250 °C and the detector temperature was constant at 250 °C. Peakswere identified using retention times based upon standards pur-chased from Supelco (37 component FAME, BAME, PUFA 1, PUFA 3).Nu-Check Prep GLC 487 quantitative FA mixed standard was used todevelop correction factors for individual FAs. Chromatograms were in-tegrated using Chem Station (version A.01.02, Agilent).
Dry weight (DWT) measurements on individual crabs were madeto the nearest 1.0 μg using a microbalance (Sartorius R16OP). Crabswere first rinsed in 3% ammonium formate solution to remove excesssalt before being transferred to 5.0-cm2 pre-weighed aluminum foilsand an oven set at 70 °C for 48 h. Foils were removed from theoven, stored in a desiccator, and reweighed within 1 h. Ash weightswere measured similarly after drying in a muffle furnace for 12 h at450 °C.
2.4. Analysis
Survival, growth, and other basic metrics observed in this studywere analyzed with standard methods of analysis of variancefollowed by Fisher's LSD test for multiple comparisons. Appropriatetransformations of the data were made as necessary followingLevene's test for homogeneity of variance. Linear and non-linear rela-tionships between temperature and growth were analyzed usingSystat 13 and curves were plotted with SigmaPlot 12.
Principal component analysis (PCA) was used to simplify multivari-ate FA data by transforming correlated variables into a set of un-correlated principal components (Minitab, version 15; Meglen, 1992).This technique was employed using seven highly discriminatory FAvariables from juvenile BKC and RKC (Stoner et al., 2010a). The firsttwo principal components (PC1, PC2) accounted for 83% of the varianceamong samples, which allowed a display of themajor trends within thedata set without significant loss of the total original variation. PCA lipidloading coefficients are defined as the correlation coefficients betweenthe original lipid variables and the PCA axis. PCA scores are defined asthe position of the original variables along the new PCA axis (Meglen,1992). Lipid variables were chosen based on biological significanceand the degree of variance explained by a given lipid class or FA.
3. Results
3.1. Overall crab survival and growth
Blue king crab survivals were very high, over 90%, in all of the treat-ments over the 60-daymonitoring period. The effect of temperature on
Temperature (oC)
0 2 4 6 8 10 12 14
Gro
wth
rat
e (m
m/d
)
0.000
0.005
0.010
0.015
0.020
0.025
PopulationsIndividuals
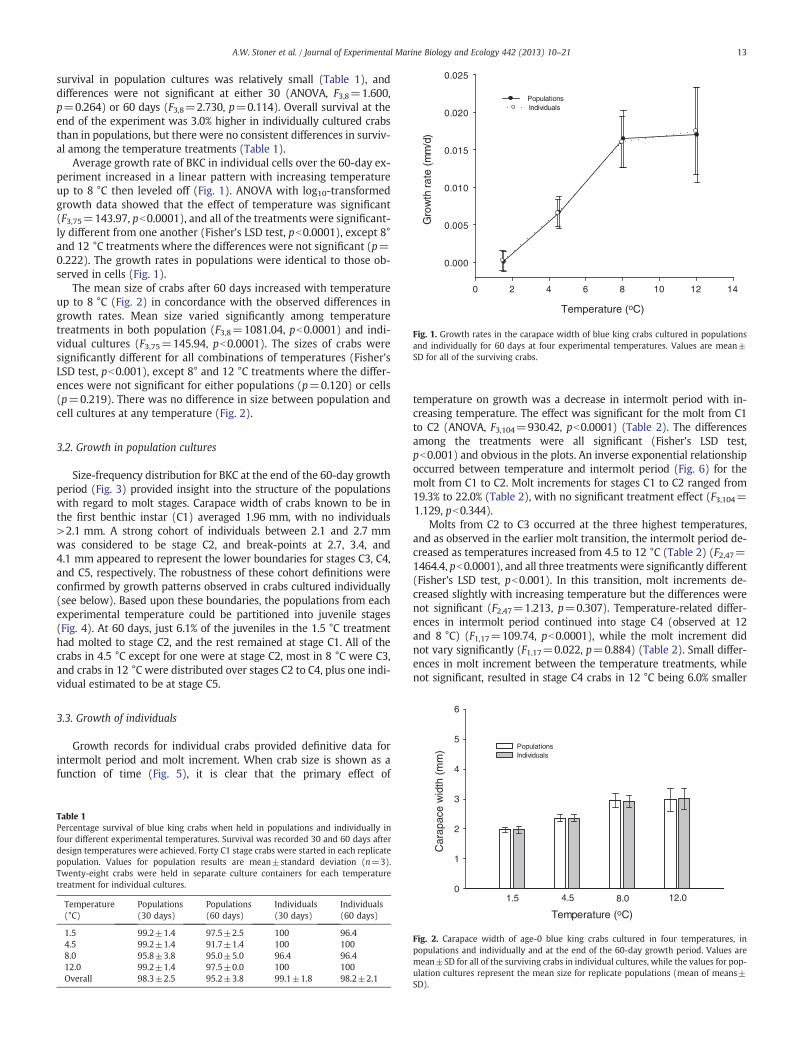
Fig. 1. Growth rates in the carapace width of blue king crabs cultured in populationsand individually for 60 days at four experimental temperatures. Values are mean±SD for all of the surviving crabs.
(m
m)
4
5
6
PopulationsIndividuals
13A.W. Stoner et al. / Journal of Experimental Marine Biology and Ecology 442 (2013) 10–21
survival in population cultures was relatively small (Table 1), anddifferences were not significant at either 30 (ANOVA, F3,8=1.600,p=0.264) or 60 days (F3,8=2.730, p=0.114). Overall survival at theend of the experiment was 3.0% higher in individually cultured crabsthan in populations, but there were no consistent differences in surviv-al among the temperature treatments (Table 1).
Average growth rate of BKC in individual cells over the 60-day ex-periment increased in a linear pattern with increasing temperatureup to 8 °C then leveled off (Fig. 1). ANOVA with log10-transformedgrowth data showed that the effect of temperature was significant(F3,75=143.97, pb0.0001), and all of the treatments were significant-ly different from one another (Fisher's LSD test, pb0.0001), except 8°and 12 °C treatments where the differences were not significant (p=0.222). The growth rates in populations were identical to those ob-served in cells (Fig. 1).
The mean size of crabs after 60 days increased with temperatureup to 8 °C (Fig. 2) in concordance with the observed differences ingrowth rates. Mean size varied significantly among temperaturetreatments in both population (F3,8=1081.04, pb0.0001) and indi-vidual cultures (F3,75=145.94, pb0.0001). The sizes of crabs weresignificantly different for all combinations of temperatures (Fisher'sLSD test, pb0.001), except 8° and 12 °C treatments where the differ-ences were not significant for either populations (p=0.120) or cells(p=0.219). There was no difference in size between population andcell cultures at any temperature (Fig. 2).
3.2. Growth in population cultures
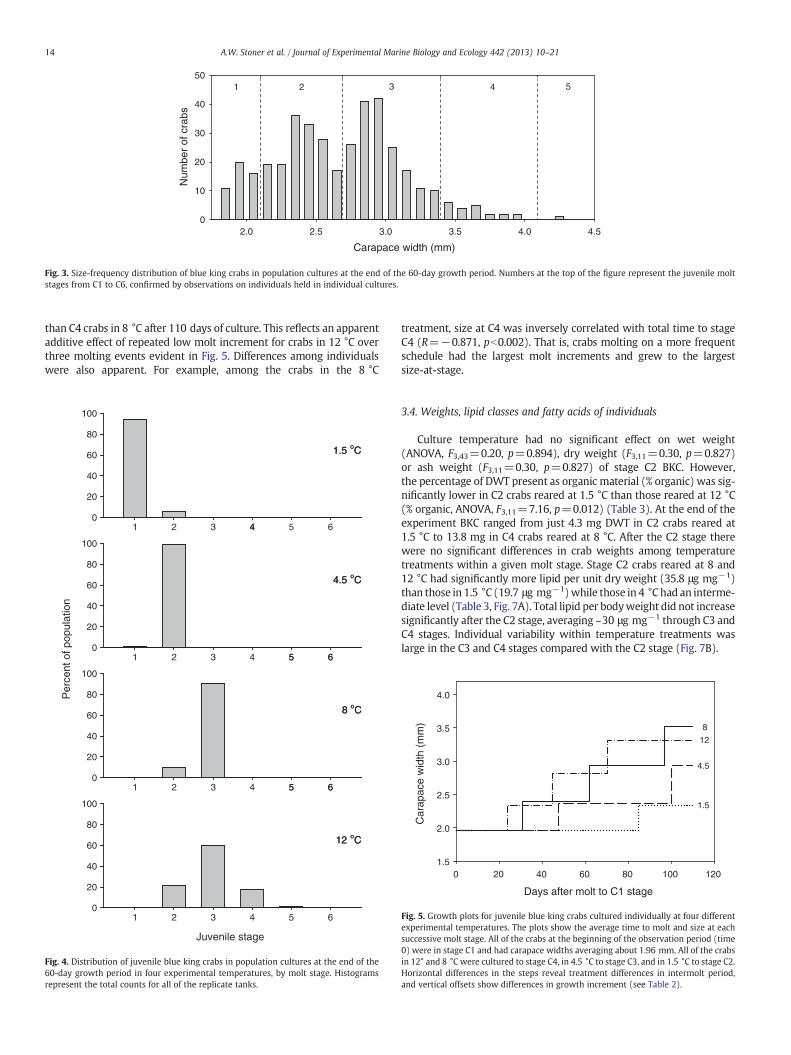
Size-frequency distribution for BKC at the end of the 60-day growthperiod (Fig. 3) provided insight into the structure of the populationswith regard to molt stages. Carapace width of crabs known to be inthe first benthic instar (C1) averaged 1.96 mm, with no individuals>2.1 mm. A strong cohort of individuals between 2.1 and 2.7 mmwas considered to be stage C2, and break-points at 2.7, 3.4, and4.1 mm appeared to represent the lower boundaries for stages C3, C4,and C5, respectively. The robustness of these cohort definitions wereconfirmed by growth patterns observed in crabs cultured individually(see below). Based upon these boundaries, the populations from eachexperimental temperature could be partitioned into juvenile stages(Fig. 4). At 60 days, just 6.1% of the juveniles in the 1.5 °C treatmenthad molted to stage C2, and the rest remained at stage C1. All of thecrabs in 4.5 °C except for one were at stage C2, most in 8 °C were C3,and crabs in 12 °C were distributed over stages C2 to C4, plus one indi-vidual estimated to be at stage C5.
3.3. Growth of individuals
Growth records for individual crabs provided definitive data forintermolt period and molt increment. When crab size is shown as afunction of time (Fig. 5), it is clear that the primary effect of
Table 1Percentage survival of blue king crabs when held in populations and individually infour different experimental temperatures. Survival was recorded 30 and 60 days afterdesign temperatures were achieved. Forty C1 stage crabs were started in each replicatepopulation. Values for population results are mean±standard deviation (n=3).Twenty-eight crabs were held in separate culture containers for each temperaturetreatment for individual cultures.
Temperature(°C)
Populations(30 days)
Populations(60 days)
Individuals(30 days)
Individuals(60 days)
1.5 99.2±1.4 97.5±2.5 100 96.44.5 99.2±1.4 91.7±1.4 100 1008.0 95.8±3.8 95.0±5.0 96.4 96.412.0 99.2±1.4 97.5±0.0 100 100Overall 98.3±2.5 95.2±3.8 99.1±1.8 98.2±2.1
temperature on growth was a decrease in intermolt period with in-creasing temperature. The effect was significant for the molt from C1to C2 (ANOVA, F3,104=930.42, pb0.0001) (Table 2). The differencesamong the treatments were all significant (Fisher's LSD test,pb0.001) and obvious in the plots. An inverse exponential relationshipoccurred between temperature and intermolt period (Fig. 6) for themolt from C1 to C2. Molt increments for stages C1 to C2 ranged from19.3% to 22.0% (Table 2), with no significant treatment effect (F3,104=1.129, pb0.344).
Molts from C2 to C3 occurred at the three highest temperatures,and as observed in the earlier molt transition, the intermolt period de-creased as temperatures increased from 4.5 to 12 °C (Table 2) (F2,47=1464.4, pb0.0001), and all three treatments were significantly different(Fisher's LSD test, pb0.001). In this transition, molt increments de-creased slightly with increasing temperature but the differences werenot significant (F2,47=1.213, p=0.307). Temperature-related differ-ences in intermolt period continued into stage C4 (observed at 12and 8 °C) (F1,17=109.74, pb0.0001), while the molt increment didnot vary significantly (F1,17=0.022, p=0.884) (Table 2). Small differ-ences in molt increment between the temperature treatments, whilenot significant, resulted in stage C4 crabs in 12 °C being 6.0% smaller
Temperature (oC)
Car
apac
e w
idth
0
1
2
3
1.5 4.5 8.0 12.0
Fig. 2. Carapace width of age-0 blue king crabs cultured in four temperatures, inpopulations and individually and at the end of the 60-day growth period. Values aremean±SD for all of the surviving crabs in individual cultures, while the values for pop-ulation cultures represent the mean size for replicate populations (mean of means±SD).
Carapace width (mm)
2.0 2.5 3.0 3.5 4.0 4.5
Num
ber
of c
rabs
0
10
20
30
40
501 2 3 4 5
Fig. 3. Size-frequency distribution of blue king crabs in population cultures at the end of the 60-day growth period. Numbers at the top of the figure represent the juvenile moltstages from C1 to C6, confirmed by observations on individuals held in individual cultures.
14 A.W. Stoner et al. / Journal of Experimental Marine Biology and Ecology 442 (2013) 10–21
than C4 crabs in 8 °C after 110 days of culture. This reflects an apparentadditive effect of repeated low molt increment for crabs in 12 °C overthree molting events evident in Fig. 5. Differences among individualswere also apparent. For example, among the crabs in the 8 °C
1.5 oC
1 2 3 4 5 6
4.5 oC
1 2 3 4 5 6
12 oC
8 oC
1 2 3 4 5 6
1.5 oC
40
20
40
60
80
100
4.5 oC
5 60
20
40
60
80
100
12 oC
Juvenile stage
1 2 3 4 5 6
Per
cent
of p
opul
atio
n
0
20
40
60
80
100
8 oC
5 60
20
40
60
80
100
Fig. 4. Distribution of juvenile blue king crabs in population cultures at the end of the60-day growth period in four experimental temperatures, by molt stage. Histogramsrepresent the total counts for all of the replicate tanks.
treatment, size at C4 was inversely correlated with total time to stageC4 (R=−0.871, pb0.002). That is, crabs molting on a more frequentschedule had the largest molt increments and grew to the largestsize-at-stage.
3.4. Weights, lipid classes and fatty acids of individuals
Culture temperature had no significant effect on wet weight(ANOVA, F3,43=0.20, p=0.894), dry weight (F3,11=0.30, p=0.827)or ash weight (F3,11=0.30, p=0.827) of stage C2 BKC. However,the percentage of DWT present as organic material (% organic) was sig-nificantly lower in C2 crabs reared at 1.5 °C than those reared at 12 °C(% organic, ANOVA, F3,11=7.16, p=0.012) (Table 3). At the end of theexperiment BKC ranged from just 4.3 mg DWT in C2 crabs reared at1.5 °C to 13.8 mg in C4 crabs reared at 8 °C. After the C2 stage therewere no significant differences in crab weights among temperaturetreatments within a given molt stage. Stage C2 crabs reared at 8 and12 °C had significantly more lipid per unit dry weight (35.8 μg mg−1)than those in 1.5 °C (19.7 μg mg−1)while those in 4 °Chad an interme-diate level (Table 3, Fig. 7A). Total lipid per bodyweight did not increasesignificantly after the C2 stage, averaging ~30 μg mg−1 through C3 andC4 stages. Individual variability within temperature treatments waslarge in the C3 and C4 stages compared with the C2 stage (Fig. 7B).
Days after molt to C1 stage
0 20 40 60 80 100 120
Car
apac
e w
idth
(m
m)
1.5
2.0
2.5
3.0
3.5
4.0
12
1.5
8
4.5
Fig. 5. Growth plots for juvenile blue king crabs cultured individually at four differentexperimental temperatures. The plots show the average time to molt and size at eachsuccessive molt stage. All of the crabs at the beginning of the observation period (time0) were in stage C1 and had carapace widths averaging about 1.96 mm. All of the crabsin 12° and 8 °C were cultured to stage C4, in 4.5 °C to stage C3, and in 1.5 °C to stage C2.Horizontal differences in the steps reveal treatment differences in intermolt period,and vertical offsets show differences in growth increment (see Table 2).
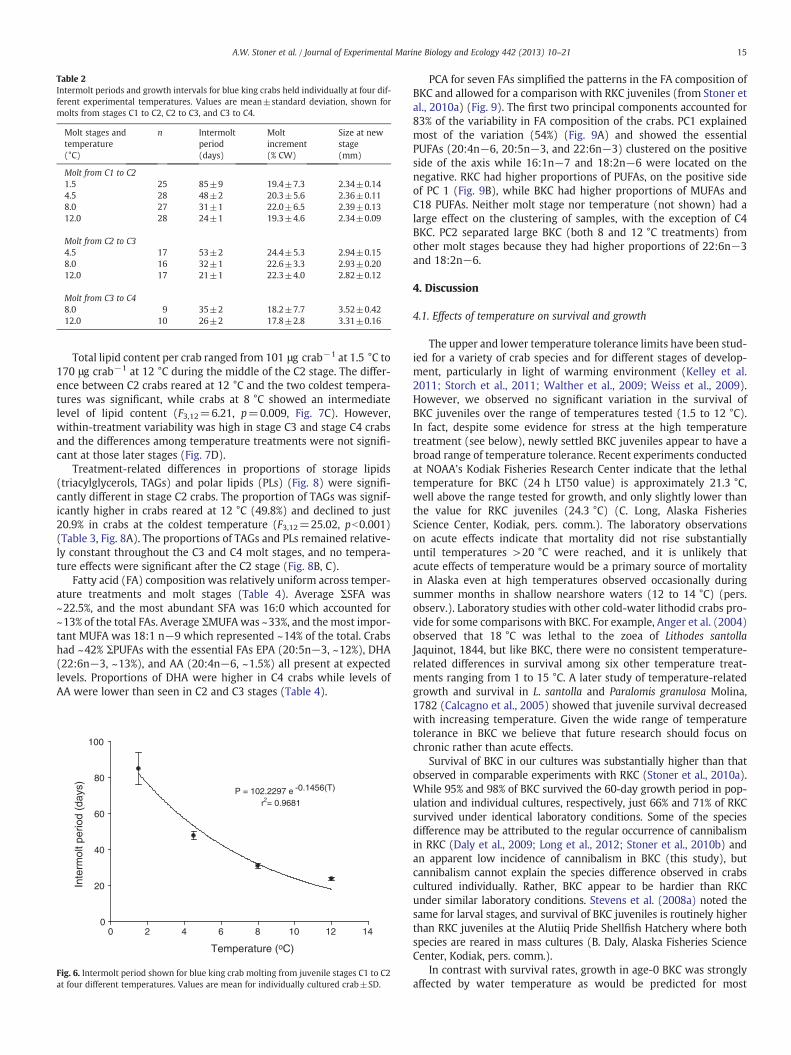
Table 2Intermolt periods and growth intervals for blue king crabs held individually at four dif-ferent experimental temperatures. Values are mean±standard deviation, shown formolts from stages C1 to C2, C2 to C3, and C3 to C4.
Molt stages andtemperature(°C)
n Intermoltperiod(days)
Moltincrement(% CW)
Size at newstage(mm)
Molt from C1 to C21.5 25 85±9 19.4±7.3 2.34±0.144.5 28 48±2 20.3±5.6 2.36±0.118.0 27 31±1 22.0±6.5 2.39±0.1312.0 28 24±1 19.3±4.6 2.34±0.09
Molt from C2 to C34.5 17 53±2 24.4±5.3 2.94±0.158.0 16 32±1 22.6±3.3 2.93±0.2012.0 17 21±1 22.3±4.0 2.82±0.12
Molt from C3 to C48.0 9 35±2 18.2±7.7 3.52±0.4212.0 10 26±2 17.8±2.8 3.31±0.16
15A.W. Stoner et al. / Journal of Experimental Marine Biology and Ecology 442 (2013) 10–21
Total lipid content per crab ranged from 101 μg crab−1 at 1.5 °C to170 μg crab−1 at 12 °C during the middle of the C2 stage. The differ-ence between C2 crabs reared at 12 °C and the two coldest tempera-tures was significant, while crabs at 8 °C showed an intermediatelevel of lipid content (F3,12=6.21, p=0.009, Fig. 7C). However,within-treatment variability was high in stage C3 and stage C4 crabsand the differences among temperature treatments were not signifi-cant at those later stages (Fig. 7D).
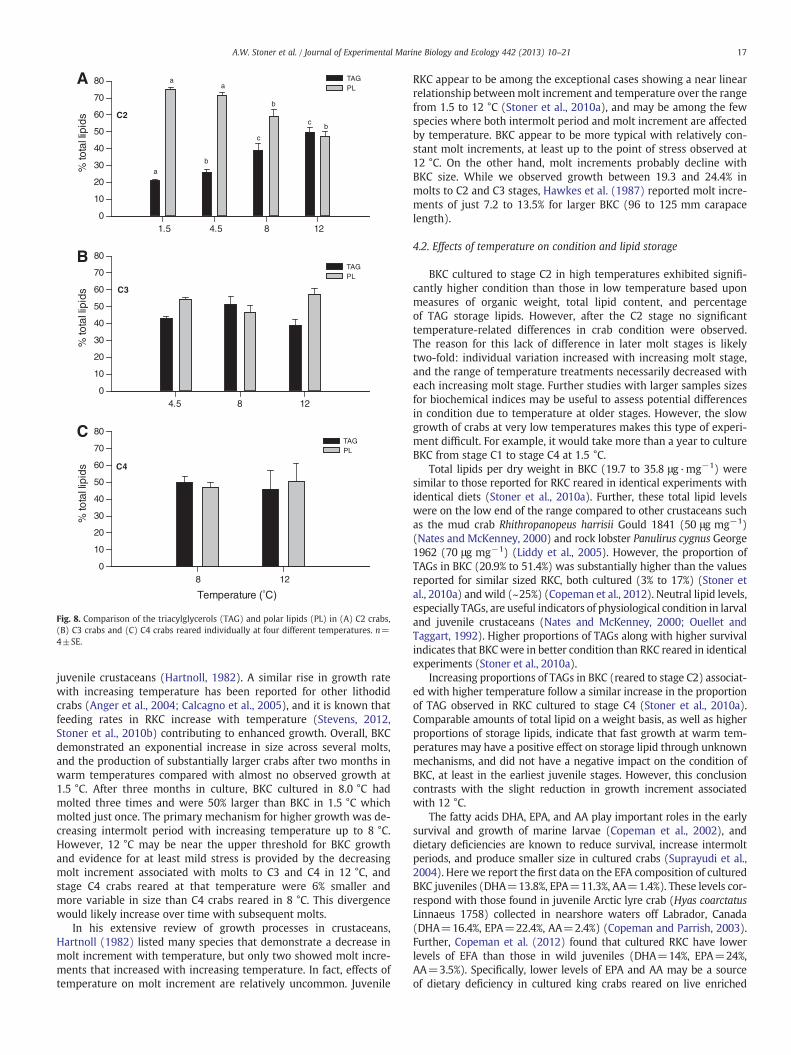
Treatment-related differences in proportions of storage lipids(triacylglycerols, TAGs) and polar lipids (PLs) (Fig. 8) were signifi-cantly different in stage C2 crabs. The proportion of TAGs was signif-icantly higher in crabs reared at 12 °C (49.8%) and declined to just20.9% in crabs at the coldest temperature (F3,12=25.02, pb0.001)(Table 3, Fig. 8A). The proportions of TAGs and PLs remained relative-ly constant throughout the C3 and C4 molt stages, and no tempera-ture effects were significant after the C2 stage (Fig. 8B, C).
Fatty acid (FA) composition was relatively uniform across temper-ature treatments and molt stages (Table 4). Average ΣSFA was~22.5%, and the most abundant SFA was 16:0 which accounted for~13% of the total FAs. Average ΣMUFAwas ~33%, and the most impor-tant MUFA was 18:1 n−9 which represented ~14% of the total. Crabshad ~42% ΣPUFAs with the essential FAs EPA (20:5n−3, ~12%), DHA(22:6n−3, ~13%), and AA (20:4n−6, ~1.5%) all present at expectedlevels. Proportions of DHA were higher in C4 crabs while levels ofAA were lower than seen in C2 and C3 stages (Table 4).
Temperature (oC)
0 2 4 6 8 10 12 14
Inte
rmol
t per
iod
(day
s)
0
20
40
60
80
100
P = 102.2297 e -0.1456(T)
r2 = 0.9681
Fig. 6. Intermolt period shown for blue king crab molting from juvenile stages C1 to C2at four different temperatures. Values are mean for individually cultured crab±SD.
PCA for seven FAs simplified the patterns in the FA composition ofBKC and allowed for a comparison with RKC juveniles (from Stoner etal., 2010a) (Fig. 9). The first two principal components accounted for83% of the variability in FA composition of the crabs. PC1 explainedmost of the variation (54%) (Fig. 9A) and showed the essentialPUFAs (20:4n−6, 20:5n−3, and 22:6n−3) clustered on the positiveside of the axis while 16:1n−7 and 18:2n−6 were located on thenegative. RKC had higher proportions of PUFAs, on the positive sideof PC 1 (Fig. 9B), while BKC had higher proportions of MUFAs andC18 PUFAs. Neither molt stage nor temperature (not shown) had alarge effect on the clustering of samples, with the exception of C4BKC. PC2 separated large BKC (both 8 and 12 °C treatments) fromother molt stages because they had higher proportions of 22:6n−3and 18:2n−6.
4. Discussion
4.1. Effects of temperature on survival and growth
The upper and lower temperature tolerance limits have been stud-ied for a variety of crab species and for different stages of develop-ment, particularly in light of warming environment (Kelley et al.2011; Storch et al., 2011; Walther et al., 2009; Weiss et al., 2009).However, we observed no significant variation in the survival ofBKC juveniles over the range of temperatures tested (1.5 to 12 °C).In fact, despite some evidence for stress at the high temperaturetreatment (see below), newly settled BKC juveniles appear to have abroad range of temperature tolerance. Recent experiments conductedat NOAA's Kodiak Fisheries Research Center indicate that the lethaltemperature for BKC (24 h LT50 value) is approximately 21.3 °C,well above the range tested for growth, and only slightly lower thanthe value for RKC juveniles (24.3 °C) (C. Long, Alaska FisheriesScience Center, Kodiak, pers. comm.). The laboratory observationson acute effects indicate that mortality did not rise substantiallyuntil temperatures >20 °C were reached, and it is unlikely thatacute effects of temperature would be a primary source of mortalityin Alaska even at high temperatures observed occasionally duringsummer months in shallow nearshore waters (12 to 14 °C) (pers.observ.). Laboratory studies with other cold-water lithodid crabs pro-vide for some comparisons with BKC. For example, Anger et al. (2004)observed that 18 °C was lethal to the zoea of Lithodes santollaJaquinot, 1844, but like BKC, there were no consistent temperature-related differences in survival among six other temperature treat-ments ranging from 1 to 15 °C. A later study of temperature-relatedgrowth and survival in L. santolla and Paralomis granulosa Molina,1782 (Calcagno et al., 2005) showed that juvenile survival decreasedwith increasing temperature. Given the wide range of temperaturetolerance in BKC we believe that future research should focus onchronic rather than acute effects.
Survival of BKC in our cultures was substantially higher than thatobserved in comparable experiments with RKC (Stoner et al., 2010a).While 95% and 98% of BKC survived the 60-day growth period in pop-ulation and individual cultures, respectively, just 66% and 71% of RKCsurvived under identical laboratory conditions. Some of the speciesdifference may be attributed to the regular occurrence of cannibalismin RKC (Daly et al., 2009; Long et al., 2012; Stoner et al., 2010b) andan apparent low incidence of cannibalism in BKC (this study), butcannibalism cannot explain the species difference observed in crabscultured individually. Rather, BKC appear to be hardier than RKCunder similar laboratory conditions. Stevens et al. (2008a) noted thesame for larval stages, and survival of BKC juveniles is routinely higherthan RKC juveniles at the Alutiiq Pride Shellfish Hatchery where bothspecies are reared in mass cultures (B. Daly, Alaska Fisheries ScienceCenter, Kodiak, pers. comm.).
In contrast with survival rates, growth in age-0 BKC was stronglyaffected by water temperature as would be predicted for most
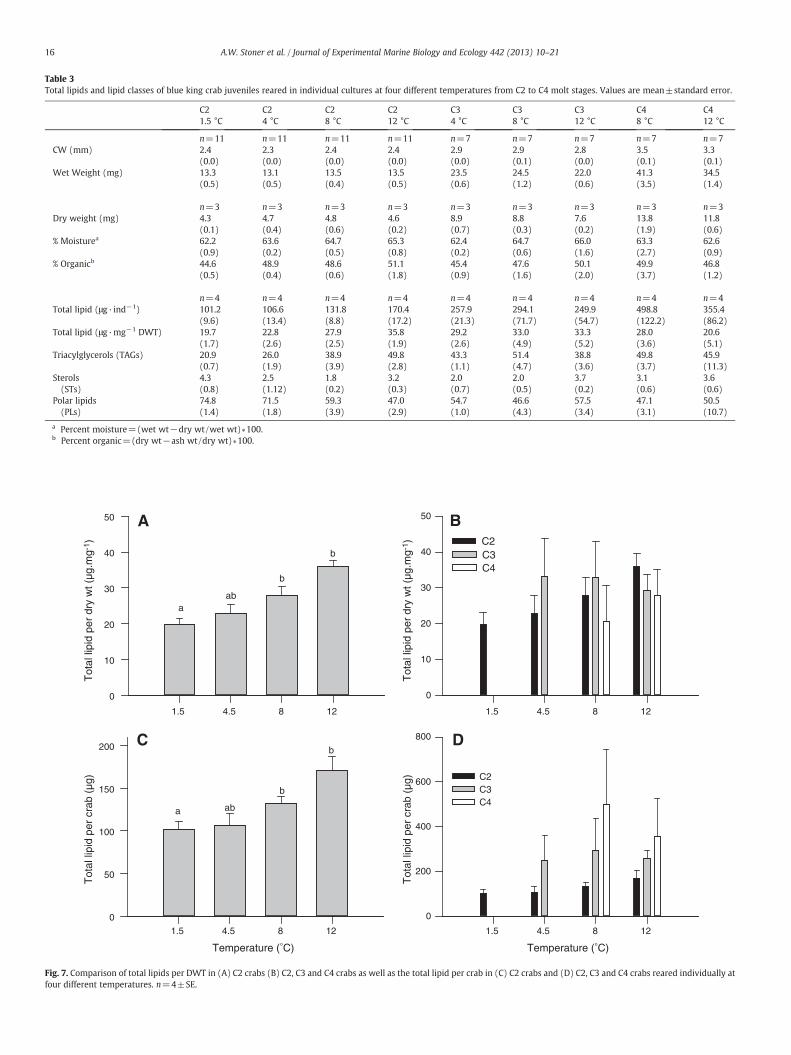
Table 3Total lipids and lipid classes of blue king crab juveniles reared in individual cultures at four different temperatures from C2 to C4 molt stages. Values are mean±standard error.
C21.5 °C
C24 °C
C28 °C
C212 °C
C34 °C
C38 °C
C312 °C
C48 °C
C412 °C
n=11 n=11 n=11 n=11 n=7 n=7 n=7 n=7 n=7CW (mm) 2.4
(0.0)2.3(0.0)
2.4(0.0)
2.4(0.0)
2.9(0.0)
2.9(0.1)
2.8(0.0)
3.5(0.1)
3.3(0.1)
Wet Weight (mg) 13.3(0.5)
13.1(0.5)
13.5(0.4)
13.5(0.5)
23.5(0.6)
24.5(1.2)
22.0(0.6)
41.3(3.5)
34.5(1.4)
n=3 n=3 n=3 n=3 n=3 n=3 n=3 n=3 n=3Dry weight (mg) 4.3
(0.1)4.7(0.4)
4.8(0.6)
4.6(0.2)
8.9(0.7)
8.8(0.3)
7.6(0.2)
13.8(1.9)
11.8(0.6)
% Moisturea 62.2(0.9)
63.6(0.2)
64.7(0.5)
65.3(0.8)
62.4(0.2)
64.7(0.6)
66.0(1.6)
63.3(2.7)
62.6(0.9)
% Organicb 44.6(0.5)
48.9(0.4)
48.6(0.6)
51.1(1.8)
45.4(0.9)
47.6(1.6)
50.1(2.0)
49.9(3.7)
46.8(1.2)
n=4 n=4 n=4 n=4 n=4 n=4 n=4 n=4 n=4Total lipid (μg·ind−1) 101.2
(9.6)106.6(13.4)
131.8(8.8)
170.4(17.2)
257.9(21.3)
294.1(71.7)
249.9(54.7)
498.8(122.2)
355.4(86.2)
Total lipid (μg·mg−1 DWT) 19.7(1.7)
22.8(2.6)
27.9(2.5)
35.8(1.9)
29.2(2.6)
33.0(4.9)
33.3(5.2)
28.0(3.6)
20.6(5.1)
Triacylglycerols (TAGs) 20.9(0.7)
26.0(1.9)
38.9(3.9)
49.8(2.8)
43.3(1.1)
51.4(4.7)
38.8(3.6)
49.8(3.7)
45.9(11.3)
Sterols(STs)
4.3(0.8)
2.5(1.12)
1.8(0.2)
3.2(0.3)
2.0(0.7)
2.0(0.5)
3.7(0.2)
3.1(0.6)
3.6(0.6)
Polar lipids(PLs)
74.8(1.4)
71.5(1.8)
59.3(3.9)
47.0(2.9)
54.7(1.0)
46.6(4.3)
57.5(3.4)
47.1(3.1)
50.5(10.7)
a Percent moisture=(wet wt−dry wt/wet wt)∗100.b Percent organic=(dry wt−ash wt/dry wt)∗100.
1.5 4.5 8 12
Tot
al li
pid
per
dry
wt (
µg.m
g-1 )
0
10
20
30
40
50
Temperature (°C)
1.5 4.5 8 12
Tot
al li
pid
per
crab
(µg
)
0
50
100
150
200 b
b
a ab
b
b
aba
1.5 4.5 8 12
Tot
al li
pid
per
dry
wt (
µg.m
g-1 )
0
10
20
30
40
50
Temperature (°C)
1.5 4.5 8 12
Tot
al li
pid
per
crab
(µg
)
0
200
400
600
800
C2C3C4
A
C D
BC2C3C4
Fig. 7. Comparison of total lipids per DWT in (A) C2 crabs (B) C2, C3 and C4 crabs as well as the total lipid per crab in (C) C2 crabs and (D) C2, C3 and C4 crabs reared individually atfour different temperatures. n=4±SE.
16 A.W. Stoner et al. / Journal of Experimental Marine Biology and Ecology 442 (2013) 10–21
A
1.5 4.5 8 12
% to
tal l
ipid
s
0
10
20
30
40
50
60
70
80 TAG PL
B
4.5 8 12
% to
tal l
ipid
s
0
10
20
30
40
50
60
70
80TAG PL
C
Temperature (°C)
8 12
% to
tal l
ipid
s
0
10
20
30
40
50
60
70
80TAGPL
aa
b
b
a
b
c
c
C2
C3
C4
Fig. 8. Comparison of the triacylglycerols (TAG) and polar lipids (PL) in (A) C2 crabs,(B) C3 crabs and (C) C4 crabs reared individually at four different temperatures. n=4±SE.
17A.W. Stoner et al. / Journal of Experimental Marine Biology and Ecology 442 (2013) 10–21
juvenile crustaceans (Hartnoll, 1982). A similar rise in growth ratewith increasing temperature has been reported for other lithodidcrabs (Anger et al., 2004; Calcagno et al., 2005), and it is known thatfeeding rates in RKC increase with temperature (Stevens, 2012,Stoner et al., 2010b) contributing to enhanced growth. Overall, BKCdemonstrated an exponential increase in size across several molts,and the production of substantially larger crabs after two months inwarm temperatures compared with almost no observed growth at1.5 °C. After three months in culture, BKC cultured in 8.0 °C hadmolted three times and were 50% larger than BKC in 1.5 °C whichmolted just once. The primary mechanism for higher growth was de-creasing intermolt period with increasing temperature up to 8 °C.However, 12 °C may be near the upper threshold for BKC growthand evidence for at least mild stress is provided by the decreasingmolt increment associated with molts to C3 and C4 in 12 °C, andstage C4 crabs reared at that temperature were 6% smaller andmore variable in size than C4 crabs reared in 8 °C. This divergencewould likely increase over time with subsequent molts.
In his extensive review of growth processes in crustaceans,Hartnoll (1982) listed many species that demonstrate a decrease inmolt increment with temperature, but only two showed molt incre-ments that increased with increasing temperature. In fact, effects oftemperature on molt increment are relatively uncommon. Juvenile
RKC appear to be among the exceptional cases showing a near linearrelationship betweenmolt increment and temperature over the rangefrom 1.5 to 12 °C (Stoner et al., 2010a), and may be among the fewspecies where both intermolt period and molt increment are affectedby temperature. BKC appear to be more typical with relatively con-stant molt increments, at least up to the point of stress observed at12 °C. On the other hand, molt increments probably decline withBKC size. While we observed growth between 19.3 and 24.4% inmolts to C2 and C3 stages, Hawkes et al. (1987) reported molt incre-ments of just 7.2 to 13.5% for larger BKC (96 to 125 mm carapacelength).
4.2. Effects of temperature on condition and lipid storage
BKC cultured to stage C2 in high temperatures exhibited signifi-cantly higher condition than those in low temperature based uponmeasures of organic weight, total lipid content, and percentageof TAG storage lipids. However, after the C2 stage no significanttemperature-related differences in crab condition were observed.The reason for this lack of difference in later molt stages is likelytwo-fold: individual variation increased with increasing molt stage,and the range of temperature treatments necessarily decreased witheach increasing molt stage. Further studies with larger samples sizesfor biochemical indices may be useful to assess potential differencesin condition due to temperature at older stages. However, the slowgrowth of crabs at very low temperatures makes this type of experi-ment difficult. For example, it would take more than a year to cultureBKC from stage C1 to stage C4 at 1.5 °C.
Total lipids per dry weight in BKC (19.7 to 35.8 μg·mg−1) weresimilar to those reported for RKC reared in identical experiments withidentical diets (Stoner et al., 2010a). Further, these total lipid levelswere on the low end of the range compared to other crustaceans suchas the mud crab Rhithropanopeus harrisii Gould 1841 (50 μg mg−1)(Nates and McKenney, 2000) and rock lobster Panulirus cygnus George1962 (70 μg mg−1) (Liddy et al., 2005). However, the proportion ofTAGs in BKC (20.9% to 51.4%) was substantially higher than the valuesreported for similar sized RKC, both cultured (3% to 17%) (Stoner etal., 2010a) and wild (~25%) (Copeman et al., 2012). Neutral lipid levels,especially TAGs, are useful indicators of physiological condition in larvaland juvenile crustaceans (Nates and McKenney, 2000; Ouellet andTaggart, 1992). Higher proportions of TAGs along with higher survivalindicates that BKCwere in better condition than RKC reared in identicalexperiments (Stoner et al., 2010a).
Increasing proportions of TAGs in BKC (reared to stage C2) associat-ed with higher temperature follow a similar increase in the proportionof TAG observed in RKC cultured to stage C4 (Stoner et al., 2010a).Comparable amounts of total lipid on a weight basis, as well as higherproportions of storage lipids, indicate that fast growth at warm tem-peratures may have a positive effect on storage lipid through unknownmechanisms, and did not have a negative impact on the condition ofBKC, at least in the earliest juvenile stages. However, this conclusioncontrasts with the slight reduction in growth increment associatedwith 12 °C.
The fatty acids DHA, EPA, and AA play important roles in the earlysurvival and growth of marine larvae (Copeman et al., 2002), anddietary deficiencies are known to reduce survival, increase intermoltperiods, and produce smaller size in cultured crabs (Suprayudi et al.,2004). Here we report the first data on the EFA composition of culturedBKC juveniles (DHA=13.8%, EPA=11.3%, AA=1.4%). These levels cor-respond with those found in juvenile Arctic lyre crab (Hyas coarctatusLinnaeus 1758) collected in nearshore waters off Labrador, Canada(DHA=16.4%, EPA=22.4%, AA=2.4%) (Copeman and Parrish, 2003).Further, Copeman et al. (2012) found that cultured RKC have lowerlevels of EFA than those in wild juveniles (DHA=14%, EPA=24%,AA=3.5%). Specifically, lower levels of EPA and AA may be a sourceof dietary deficiency in cultured king crabs reared on live enriched
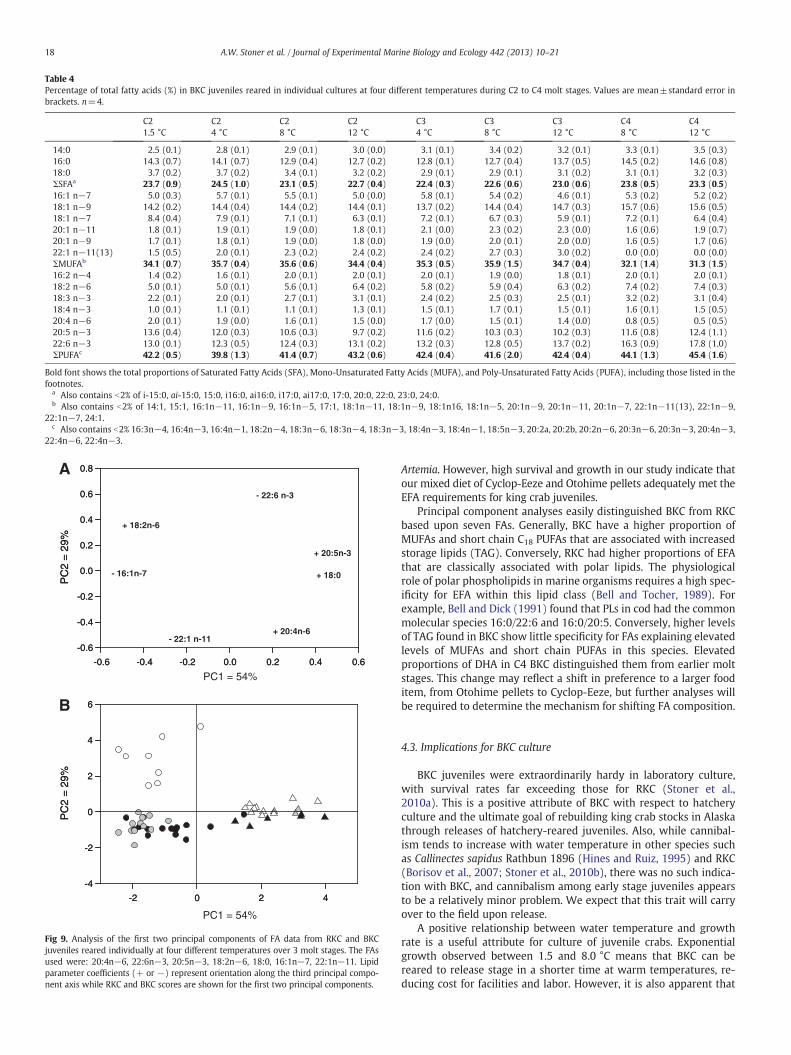
Table 4Percentage of total fatty acids (%) in BKC juveniles reared in individual cultures at four different temperatures during C2 to C4 molt stages. Values are mean±standard error inbrackets. n=4.
C21.5 °C
C24 °C
C28 °C
C212 °C
C34 °C
C38 °C
C312 °C
C48 °C
C412 °C
14:0 2.5 (0.1) 2.8 (0.1) 2.9 (0.1) 3.0 (0.0) 3.1 (0.1) 3.4 (0.2) 3.2 (0.1) 3.3 (0.1) 3.5 (0.3)16:0 14.3 (0.7) 14.1 (0.7) 12.9 (0.4) 12.7 (0.2) 12.8 (0.1) 12.7 (0.4) 13.7 (0.5) 14.5 (0.2) 14.6 (0.8)18:0 3.7 (0.2) 3.7 (0.2) 3.4 (0.1) 3.2 (0.2) 2.9 (0.1) 2.9 (0.1) 3.1 (0.2) 3.1 (0.1) 3.2 (0.3)ΣSFAa 23.7 (0.9) 24.5 (1.0) 23.1 (0.5) 22.7 (0.4) 22.4 (0.3) 22.6 (0.6) 23.0 (0.6) 23.8 (0.5) 23.3 (0.5)16:1 n−7 5.0 (0.3) 5.7 (0.1) 5.5 (0.1) 5.0 (0.0) 5.8 (0.1) 5.4 (0.2) 4.6 (0.1) 5.3 (0.2) 5.2 (0.2)18:1 n−9 14.2 (0.2) 14.4 (0.4) 14.4 (0.2) 14.4 (0.1) 13.7 (0.2) 14.4 (0.4) 14.7 (0.3) 15.7 (0.6) 15.6 (0.5)18:1 n−7 8.4 (0.4) 7.9 (0.1) 7.1 (0.1) 6.3 (0.1) 7.2 (0.1) 6.7 (0.3) 5.9 (0.1) 7.2 (0.1) 6.4 (0.4)20:1 n−11 1.8 (0.1) 1.9 (0.1) 1.9 (0.0) 1.8 (0.1) 2.1 (0.0) 2.3 (0.2) 2.3 (0.0) 1.6 (0.6) 1.9 (0.7)20:1 n−9 1.7 (0.1) 1.8 (0.1) 1.9 (0.0) 1.8 (0.0) 1.9 (0.0) 2.0 (0.1) 2.0 (0.0) 1.6 (0.5) 1.7 (0.6)22:1 n−11(13) 1.5 (0.5) 2.0 (0.1) 2.3 (0.2) 2.4 (0.2) 2.4 (0.2) 2.7 (0.3) 3.0 (0.2) 0.0 (0.0) 0.0 (0.0)ΣMUFAb 34.1 (0.7) 35.7 (0.4) 35.6 (0.6) 34.4 (0.4) 35.3 (0.5) 35.9 (1.5) 34.7 (0.4) 32.1 (1.4) 31.3 (1.5)16:2 n−4 1.4 (0.2) 1.6 (0.1) 2.0 (0.1) 2.0 (0.1) 2.0 (0.1) 1.9 (0.0) 1.8 (0.1) 2.0 (0.1) 2.0 (0.1)18:2 n−6 5.0 (0.1) 5.0 (0.1) 5.6 (0.1) 6.4 (0.2) 5.8 (0.2) 5.9 (0.4) 6.3 (0.2) 7.4 (0.2) 7.4 (0.3)18:3 n−3 2.2 (0.1) 2.0 (0.1) 2.7 (0.1) 3.1 (0.1) 2.4 (0.2) 2.5 (0.3) 2.5 (0.1) 3.2 (0.2) 3.1 (0.4)18:4 n−3 1.0 (0.1) 1.1 (0.1) 1.1 (0.1) 1.3 (0.1) 1.5 (0.1) 1.7 (0.1) 1.5 (0.1) 1.6 (0.1) 1.5 (0.5)20:4 n−6 2.0 (0.1) 1.9 (0.0) 1.6 (0.1) 1.5 (0.0) 1.7 (0.0) 1.5 (0.1) 1.4 (0.0) 0.8 (0.5) 0.5 (0.5)20:5 n−3 13.6 (0.4) 12.0 (0.3) 10.6 (0.3) 9.7 (0.2) 11.6 (0.2) 10.3 (0.3) 10.2 (0.3) 11.6 (0.8) 12.4 (1.1)22:6 n−3 13.0 (0.1) 12.3 (0.5) 12.4 (0.3) 13.1 (0.2) 13.2 (0.3) 12.8 (0.5) 13.7 (0.2) 16.3 (0.9) 17.8 (1.0)ΣPUFAc 42.2 (0.5) 39.8 (1.3) 41.4 (0.7) 43.2 (0.6) 42.4 (0.4) 41.6 (2.0) 42.4 (0.4) 44.1 (1.3) 45.4 (1.6)
Bold font shows the total proportions of Saturated Fatty Acids (SFA), Mono-Unsaturated Fatty Acids (MUFA), and Poly-Unsaturated Fatty Acids (PUFA), including those listed in thefootnotes.
a Also contains b2% of i-15:0, ai-15:0, 15:0, i16:0, ai16:0, i17:0, ai17:0, 17:0, 20:0, 22:0, 23:0, 24:0.b Also contains b2% of 14:1, 15:1, 16:1n−11, 16:1n−9, 16:1n−5, 17:1, 18:1n−11, 18:1n−9, 18:1n16, 18:1n−5, 20:1n−9, 20:1n−11, 20:1n−7, 22:1n−11(13), 22:1n−9,
22:1n−7, 24:1.c Also contains b2% 16:3n−4, 16:4n−3, 16:4n−1, 18:2n−4, 18:3n−6, 18:3n−4, 18:3n−3, 18:4n−3, 18:4n−1, 18:5n−3, 20:2a, 20:2b, 20:2n−6, 20:3n−6, 20:3n−3, 20:4n−3,
22:4n−6, 22:4n−3.
PC1 = 54%-0.6 -0.4 -0.2 0.0 0.2 0.4 0.6
PC
2 =
29%
-0.6
-0.4
-0.2
0.0
0.2
0.4
0.6
0.8
- 16:1n-7 + 18:0
+ 18:2n-6
+ 20:4n-6
+ 20:5n-3
- 22:1 n-11
- 22:6 n-3
-2 0 2 4
PC
2 =
29%
-4
-2
0
2
4
6
A
B
-0.6 -0.4 -0.2 0.0 0.2 0.4 0.6
PC
2 =
29%
-0.6
-0.4
-0.2
0.0
0.2
0.4
0.6
0.8
- 16:1n-7 + 18:0
+ 18:2n-6
+ 20:4n-6
+ 20:5n-3
- 22:1 n-11
- 22:6 n-3
-2 0 2 4
PC
2 =
29%
-4
-2
0
2
4
6
A
B
PC1 = 54%
Fig 9. Analysis of the first two principal components of FA data from RKC and BKCjuveniles reared individually at four different temperatures over 3 molt stages. The FAsused were: 20:4n−6, 22:6n−3, 20:5n−3, 18:2n−6, 18:0, 16:1n−7, 22:1n−11. Lipidparameter coefficients (+ or −) represent orientation along the third principal compo-nent axis while RKC and BKC scores are shown for the first two principal components.
18 A.W. Stoner et al. / Journal of Experimental Marine Biology and Ecology 442 (2013) 10–21
Artemia. However, high survival and growth in our study indicate thatour mixed diet of Cyclop-Eeze and Otohime pellets adequately met theEFA requirements for king crab juveniles.
Principal component analyses easily distinguished BKC from RKCbased upon seven FAs. Generally, BKC have a higher proportion ofMUFAs and short chain C18 PUFAs that are associated with increasedstorage lipids (TAG). Conversely, RKC had higher proportions of EFAthat are classically associated with polar lipids. The physiologicalrole of polar phospholipids in marine organisms requires a high spec-ificity for EFA within this lipid class (Bell and Tocher, 1989). Forexample, Bell and Dick (1991) found that PLs in cod had the commonmolecular species 16:0/22:6 and 16:0/20:5. Conversely, higher levelsof TAG found in BKC show little specificity for FAs explaining elevatedlevels of MUFAs and short chain PUFAs in this species. Elevatedproportions of DHA in C4 BKC distinguished them from earlier moltstages. This change may reflect a shift in preference to a larger fooditem, from Otohime pellets to Cyclop-Eeze, but further analyses willbe required to determine the mechanism for shifting FA composition.
4.3. Implications for BKC culture
BKC juveniles were extraordinarily hardy in laboratory culture,with survival rates far exceeding those for RKC (Stoner et al.,2010a). This is a positive attribute of BKC with respect to hatcheryculture and the ultimate goal of rebuilding king crab stocks in Alaskathrough releases of hatchery-reared juveniles. Also, while cannibal-ism tends to increase with water temperature in other species suchas Callinectes sapidus Rathbun 1896 (Hines and Ruiz, 1995) and RKC(Borisov et al., 2007; Stoner et al., 2010b), there was no such indica-tion with BKC, and cannibalism among early stage juveniles appearsto be a relatively minor problem. We expect that this trait will carryover to the field upon release.
A positive relationship between water temperature and growthrate is a useful attribute for culture of juvenile crabs. Exponentialgrowth observed between 1.5 and 8.0 °C means that BKC can bereared to release stage in a shorter time at warm temperatures, re-ducing cost for facilities and labor. However, it is also apparent that
19A.W. Stoner et al. / Journal of Experimental Marine Biology and Ecology 442 (2013) 10–21
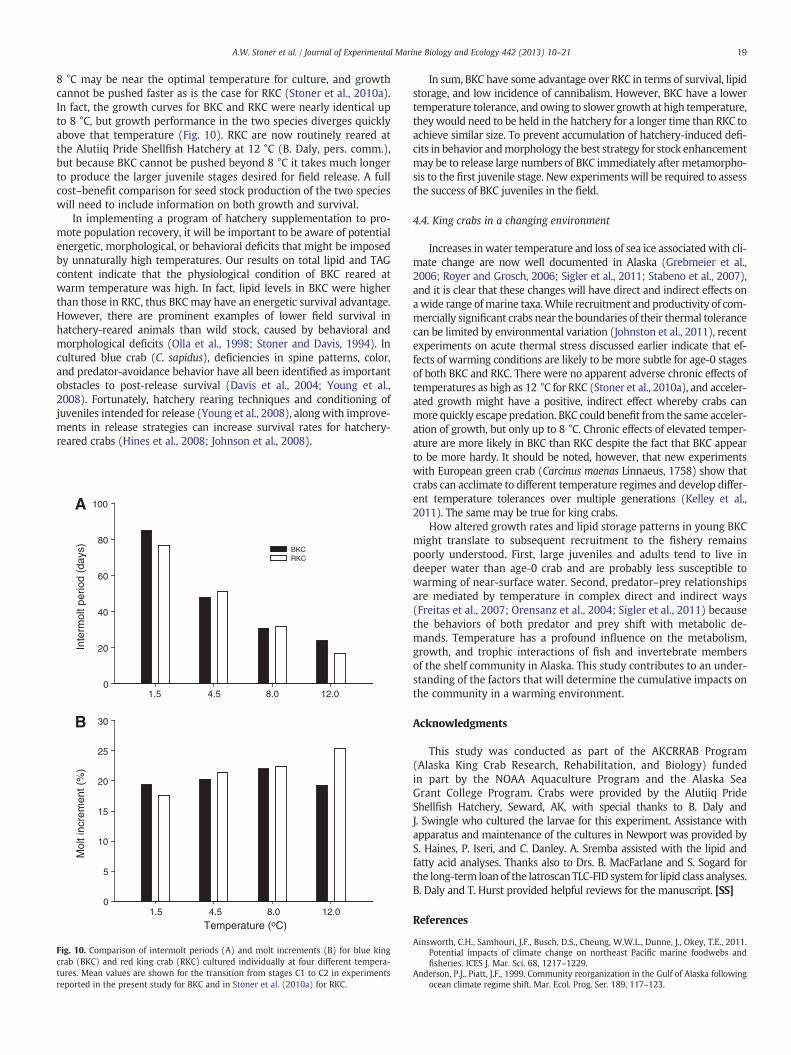
8 °C may be near the optimal temperature for culture, and growthcannot be pushed faster as is the case for RKC (Stoner et al., 2010a).In fact, the growth curves for BKC and RKC were nearly identical upto 8 °C, but growth performance in the two species diverges quicklyabove that temperature (Fig. 10). RKC are now routinely reared atthe Alutiiq Pride Shellfish Hatchery at 12 °C (B. Daly, pers. comm.),but because BKC cannot be pushed beyond 8 °C it takes much longerto produce the larger juvenile stages desired for field release. A fullcost–benefit comparison for seed stock production of the two specieswill need to include information on both growth and survival.
In implementing a program of hatchery supplementation to pro-mote population recovery, it will be important to be aware of potentialenergetic, morphological, or behavioral deficits that might be imposedby unnaturally high temperatures. Our results on total lipid and TAGcontent indicate that the physiological condition of BKC reared atwarm temperature was high. In fact, lipid levels in BKC were higherthan those in RKC, thus BKC may have an energetic survival advantage.However, there are prominent examples of lower field survival inhatchery-reared animals than wild stock, caused by behavioral andmorphological deficits (Olla et al., 1998; Stoner and Davis, 1994). Incultured blue crab (C. sapidus), deficiencies in spine patterns, color,and predator-avoidance behavior have all been identified as importantobstacles to post-release survival (Davis et al., 2004; Young et al.,2008). Fortunately, hatchery rearing techniques and conditioning ofjuveniles intended for release (Young et al., 2008), alongwith improve-ments in release strategies can increase survival rates for hatchery-reared crabs (Hines et al., 2008; Johnson et al., 2008).
Inte
rmol
t per
iod
(day
s)
0
20
40
60
80
100A
Temperature (oC)
Mol
t inc
rem
ent (
%)
0
5
10
15
20
25
30B
1.5 4.5 8.0 12.0
1.5 4.5 8.0 12.0
BKCRKC
Fig. 10. Comparison of intermolt periods (A) and molt increments (B) for blue kingcrab (BKC) and red king crab (RKC) cultured individually at four different tempera-tures. Mean values are shown for the transition from stages C1 to C2 in experimentsreported in the present study for BKC and in Stoner et al. (2010a) for RKC.
In sum, BKC have some advantage over RKC in terms of survival, lipidstorage, and low incidence of cannibalism. However, BKC have a lowertemperature tolerance, and owing to slower growth at high temperature,theywould need to be held in the hatchery for a longer time than RKC toachieve similar size. To prevent accumulation of hatchery-induced defi-cits in behavior andmorphology the best strategy for stock enhancementmay be to release large numbers of BKC immediately after metamorpho-sis to the first juvenile stage. New experiments will be required to assessthe success of BKC juveniles in the field.
4.4. King crabs in a changing environment
Increases inwater temperature and loss of sea ice associatedwith cli-mate change are now well documented in Alaska (Grebmeier et al.,2006; Royer and Grosch, 2006; Sigler et al., 2011; Stabeno et al., 2007),and it is clear that these changes will have direct and indirect effects onawide range ofmarine taxa.While recruitment and productivity of com-mercially significant crabs near the boundaries of their thermal tolerancecan be limited by environmental variation (Johnston et al., 2011), recentexperiments on acute thermal stress discussed earlier indicate that ef-fects of warming conditions are likely to be more subtle for age-0 stagesof both BKC and RKC. There were no apparent adverse chronic effects oftemperatures as high as 12 °C for RKC (Stoner et al., 2010a), and acceler-ated growth might have a positive, indirect effect whereby crabs canmore quickly escape predation. BKC could benefit from the same acceler-ation of growth, but only up to 8 °C. Chronic effects of elevated temper-ature are more likely in BKC than RKC despite the fact that BKC appearto be more hardy. It should be noted, however, that new experimentswith European green crab (Carcinus maenas Linnaeus, 1758) show thatcrabs can acclimate to different temperature regimes and develop differ-ent temperature tolerances over multiple generations (Kelley et al.,2011). The same may be true for king crabs.
How altered growth rates and lipid storage patterns in young BKCmight translate to subsequent recruitment to the fishery remainspoorly understood. First, large juveniles and adults tend to live indeeper water than age-0 crab and are probably less susceptible towarming of near-surface water. Second, predator–prey relationshipsare mediated by temperature in complex direct and indirect ways(Freitas et al., 2007; Orensanz et al., 2004; Sigler et al., 2011) becausethe behaviors of both predator and prey shift with metabolic de-mands. Temperature has a profound influence on the metabolism,growth, and trophic interactions of fish and invertebrate membersof the shelf community in Alaska. This study contributes to an under-standing of the factors that will determine the cumulative impacts onthe community in a warming environment.
Acknowledgments
This study was conducted as part of the AKCRRAB Program(Alaska King Crab Research, Rehabilitation, and Biology) fundedin part by the NOAA Aquaculture Program and the Alaska SeaGrant College Program. Crabs were provided by the Alutiiq PrideShellfish Hatchery, Seward, AK, with special thanks to B. Daly andJ. Swingle who cultured the larvae for this experiment. Assistance withapparatus and maintenance of the cultures in Newport was provided byS. Haines, P. Iseri, and C. Danley. A. Sremba assisted with the lipid andfatty acid analyses. Thanks also to Drs. B. MacFarlane and S. Sogard forthe long-term loan of the Iatroscan TLC-FID system for lipid class analyses.B. Daly and T. Hurst provided helpful reviews for the manuscript. [SS]
References
Ainsworth, C.H., Samhouri, J.F., Busch, D.S., Cheung, W.W.L., Dunne, J., Okey, T.E., 2011.Potential impacts of climate change on northeast Pacific marine foodwebs andfisheries. ICES J. Mar. Sci. 68, 1217–1229.
Anderson, P.J., Piatt, J.F., 1999. Community reorganization in the Gulf of Alaska followingocean climate regime shift. Mar. Ecol. Prog. Ser. 189, 117–123.
20 A.W. Stoner et al. / Journal of Experimental Marine Biology and Ecology 442 (2013) 10–21
Anger, K., Lovrich, G.A., Thatje, S., Calcagno, J.A., 2004. Larval and early juvenile devel-opment of Lithodes santolla (Molina, 1782) (Decapoda: Anomura: Lithodidae)reared at different temperatures in the laboratory. J. Exp. Mar. Biol. Ecol. 306,217–230.
Armstrong, D.A., Armstrong, J.L., Palacios, R., Williams, G., Jensen, G.C., 1985. Early lifehistory of juvenile blue king crab, Paralithodes platypus, around the Pribilof Islands.Proceedings of the International King Crab Symposium. University of Alaska SeaGrant, Anchorage, AK, USA, pp. 211–230.
Bell, M.V., Dick, J.R., 1991. Molecular species composition of the major glycerophospholipidsfrom the muscle, liver, retina and brain of cod (Gadus morhua). Lipids 26, 565–573.
Bell, M.V., Tocher, D.R., 1989. Molecular species composition of the majorphosphoglycerides in brain and retina from trout: occurrence of high levels ofdi-(n−3) polyunsaturated fatty acid species. Biochem. J. 264, 909–914.
Borisov, R.R., Epelbaum, A.B., Kryakhova, N.V., Tertitskaya, A.G., Kovatheva, N.P., 2007.Cannibalistic behavior in red king crabs reared under artificial conditions. Russ.J. Mar. Biol. 33, 227–231.
Calcagno, J.A., Lovrich, G.A., Thatje, S., Nettelmann, U., Anger, K., 2005. First year growthin the lithodids Lithodes santolla and Paralomis granulosa reared at differenttemperatures. J. Sea Res. 54, 221–230.
Copeman, L.A., Parrish, C.C., Brown, J.A., Harel, M., 2002. Effects of docosahexaenoic,eicosapentaenoic, and arachidonic acids on the early growth, survival, lipidcomposition and pigmentation of yellowtail flounder (Limanda ferruginea): a livefood enrichment experiment. Aquaculture 210, 285–304.
Copeman, L.A., Parrish, C.C., 2003. Marine lipids in a cold coastal ecosystem: GilbertBay, Labrador. Mar. Biol. 143, 1213–1227.
Copeman, L.A., Stoner, A.W., Ottmar, M.L., Daly, B., Parrish, C.C., Eckert, G.L., 2012. Totallipid, lipid classes, and fatty acids of newly settled red king crab (Paralithodescamtschaticus): comparison of hatchery-cultured and wild crabs. J. Shellfish. Ecol.Res. 31, 153–165.
Daly, B., Swingle, J.S., Eckert, G.L., 2009. Effects of diet, stocking density, and substrateon survival and growth of hatchery-reared red king crab (Paralithodescamtschaticus) juveniles in Alaska, USA. Aquaculture 293, 68–73.
Davis, J.L.D., Young-Williams, A.C., Aguilar, R., Carswell, B.L., Goodison, M.R., Hines, A.H.,Kramer, M.A., Zohar, Y., Zmora, O., 2004. Differences between hatchery-raised andwild blue crabs: implications for stock enhancement potential. Trans. Am. Fish. Soc.133, 1–14.
Dew, C.B., 2010. Historical perspective on habitat essential to Bristol Bay red king crab.In: Kruse, G.H., Eckert, G.L., Foy, R.J., Lipcius, R.N., Sainte-Marie, B., Stram, D.L.,Woodby, D. (Eds.), Biology and Management of Exploited Crab Populationsunder Climate Change: Alaska Sea Grant College Program, University of AlaskaFairbanks, Alaska. Rept. No. AK-SG-10-01, pp. 377–402.
Dew, C.B., McConnaughey, R.A., 2005. Did trawling on the brood stock contribute to thecollapse of Alaska's king crab? Ecol. Appl. 15, 919–941.
Dunstan, G.A., Olley, J., Ratkowsky, D.A., 1999. Major environmental and biologicalfactors influencing the fatty acid composition of seafood from Indo-Pacific toAntarctic waters. Recent Results Dev. Lipid Res. 3, 63–86.
Epelbaum, A.B., Borisov, R.R., Kovatcheva, N.P., 2006. Early development of the redking crab Paralithodes camtschaticus from the Barents Sea reared under labo-ratory conditions: morphology and behaviour. J. Mar. Biol. Assoc. U. K. 86,317–333.
Folch, J., Lees, M., Sloane, S.G., 1957. A simple method for the isolation and purificationof total lipids from animal tissues. J. Biol. Chem. 22, 497–509.
Fraser, A.J., 1989. Triacylglycerol content as a condition index for fish, bivalve, andcrustacean larvae. Can. J. Fish. Aquat. Sci. 46, 1868–1873.
Freitas, V., Campos, J., Fonds, M., Van der Veer, H.W., 2007. Potential impact of temper-ature change on epibenthic predator–bivalve prey interactions in temperateestuaries. J. Therm. Biol. 32, 328–340.
Grebmeier, J.M., Overland, J.E., Moore, S.E., Farley, E.V., Carmack, E.C., Cooper, L.W.,Frey, K.E., Helle, J.H., McLaughlin, F.A., McNutt, S.L., 2006. A major shift in thenorthern Bering Sea. Science 311, 1461–1464.
Hall, J.M., Parrish, C.C., Thompson, R.J., 2000. Importance of unsaturated fattyacids in regulating bivalve and finfish membrane fluidity in response to changesin environmental temperature. In: Shahidi, F. (Ed.), Seafood in Health andNutrition. Science Technical Publishing, St. John's, Newfoundland, Canada, pp.435–448.
Hall, J.M., Parrish, C.C., Thompson, R.J., 2002. Eicosapentaenoic acid regulates scallop(Placopecten magellanicus) membrane fluidity in response to cold. Biol. Bull. 202,201–203.
Hartnoll, R.G., 1982. Growth. In: Ebele, L.B. (Ed.), The Biology of Crustacea, Vol. 2:Embryology, Morphology, and Genetics. Academic Press, New York, pp. 111–196.
Hartnoll, R.G., 2001. Growth in crustacea — twenty years on. Hydrobiologia 449,111–122.
Hawkes, C.R., Meyers, T.R., Shirley, T.C., 1987. Growth of Alaskan blue king crabs,Paralithodes platypus (Brandt), parasitized by the rhizocephalan Briarosaccuscallosus Boschma. Crustaceana 52, 78–84.
Herter, H., Daly, B., Swingle, J.S., Lean, C., 2011. Morphometrics, fecundity, and hatchtiming of blue king crabs (Paralithodes platypus) from the Bering Strait, Alaska,USA. J. Crustac. Biol. 31, 304–312.
Hines, A.H., Ruiz, G.M., 1995. Temporal variation in juvenile blue crab mortality: near-shore shallows and cannibalism in Chesapeake Bay. Bull. Mar. Sci. 57, 884–901.
Hines, A.H., Johnson, E.G., Young, A.C., Aguilar, R., Kramer, M.A., Goodison, M., Zmora,O., Zohar, Y., 2008. Release strategies for estuarine species with complex migratorylife cycles: stock enhancement of Chesapeake blue crabs (Callinectes sapidus). Rev.Fish. Sci. 16, 175–185.
Hollowed, A.B., Hare, S.R., Wooster, W.S., 2001. Pacific Basin climate variability andpatterns of Northeast Pacific marine fish production. Prog. Oceanogr. 49, 257–282.
Hollowed, A.B., Barbeaux, S.J., Cokelet, E.D., Farley, E., Kotwicki, S., Ressler, P.H., Spital,C., Wilson, C.D., 2012. Effects of climate variations on pelagic ocean habitats andtheir role in structuring forage fish distributions in the Bering Sea. Deep-Sea Res.II Top. Stud. Oceanogr. 65–70, 230–250.
Hunt, G.L., Stabeno, P., Walters, G., Sinclair, E., Brodeur, R.D., Napp, J.M., Bond, N.A., 2002.Climate change and control of the southeastern Bering Sea pelagic ecosystem. DeepSea Res. II Topical Stud. Oceanogr. 49, 5821–5853.
Johnson, E.G., Hines, A.H., Kramer, M.A., Young, A.C., 2008. Importance of season andsize of release to stocking success for the blue crab in Chesapeake Bay. Rev. Fish.Sci. 16, 243–253.
Johnston, D., Harris, D., Caputi, N., Thomson, A., 2011. Decline of a blue swimmer crab(Portunus pelagicus) in Western Australia: history, contributing factors and futuremanagement strategy. Fish. Res. 109, 119–130.
Kelley, A.L., de Rivera, C.E., Buckley, B.A., 2011. Intraspecific variation in thermotoleranceand morphology of the invasive European green crab, Carcinus maenas, on the westcoast of North America. J. Exp. Mar. Biol. Ecol. 409, 70–78.
Lavens, P., Sorgeloos, P., 2000. Experiences on importance of diet for shrimp postlarvalquality. Aquaculture 191, 169–176.
Liddy, G.C., Kolkovski, S., Nelson, M.M., Nichols, P.D., Phillips, B.F., Maguire, G.B., 2005.The effect of PUFA enriched Artemia on growth, survival and lipid composition ofwestern rock lobster, Panulirus cygnus, phyllosoma. Aquac. Nutr. 11, 375–384.
Limbourn, A.J., Nichols, P.D., 2009. Lipid, fatty acid and protein content of late larval toearly juvenile stages of the western rock lobster, Panulirus cygnus. Comp. Biochem.Physiol. B 152, 292–298.
Logerwell, E., Rand, K., Weingartner, T.J., 2011. Oceanographic characteristics of thehabitat of benthic fish and invertebrates in the Beaufort Sea. Polar Biol. 34,1783–1796.
Long, W.C., Popp, J., Swiney, K.M., VanSant, S.B., 2012. Cannibalism in red king crab,Paralithodes camtschaticus (Tilesius, 1815): effects of habitat type and predatordensity on predator functional response. J. Exp. Mar. Biol. Ecol. 422, 101–106.
MacFarlane, R.B., Norton, E.C., 1999. Nutritional dynamics during embryonic develop-ment in the viviparous genus Sebastes and their application to the assessment ofreproductive success. Fish. Bull. 97, 273–281.
Meglen, R.R., 1992. Examining large databases: a chemometric approach using principalcomponent analysis. Mar. Chem. 39, 217–237.
Merican, Z.O., Shim, K.F., 1996. Qualitative requirements of essential fatty acids forjuvenile, Penaeus monodon. Aquaculture 147, 275–291.
Morrison, W.R., Smith, L.M., 1964. Preparation of fatty acid methyl esters anddimethylacetals from lipids with boron fluoride methanol. J. Lipid Res. 5, 600–608.
Nates, S.G., McKenney Jr., C.L., 2000. Growth, lipid class and fatty acid composition injuvenile mud crabs (Rhithropanopeus harrisii) following larval exposure toFenoxycarb, insect juvenile hormone analog. Comp. Biochem. Physiol. C 127,317–325.
Olla, B.L., Davis, M.W., Ryer, C.H., 1998. Understanding how the hatchery environmentrepresses or promotes the development of behavioral survival skills. Bull. Mar. Sci.62, 531–550.
Orensanz, J.M.L., Armstrong, J., Armstrong, D., Hilborn, R., 1998. Crustacean resourcesare vulnerable to serial depletion — the multifaceted decline of crab and shrimpfisheries in the greater Gulf of Alaska. Rev. Fish Biol. Fish. 8, 117–176.
Orensanz, J., Ernst, B., Armstrong, D.A., Stabeno, P., Livingston, P., 2004. Contraction ofthe geographic range of distribution of snow crab (Chionoecetes opilio) in the east-ern Bering Sea: an environmental ratchet? Calif. Coop. Ocean. Fish. Invest. Rept. 45,65–79.
Otto, R.S., 1989. An overview of eastern Bering Sea king and Tanner crab fisheries. In:Melteff, B. (Ed.), Proceedings of the International Symposium on King and TannerCrabs: University of Alaska Sea Grant College Program, Anchorage, Alaska. Rept.No. AK-90-SG-04, pp. 9–26.
Ouellet, P., Taggart, C.T., 1992. Lipid condition and survival in shrimp (Pandalusborealis) larvae. Can. J. Fish. Aquat. Sci. 49, 368–378.
Parrish, C.C., 1987. Separation of aquatic lipid classes by chromarod thin-layer chroma-tography with measurement by Iatroscan flame ionization detection. Can. J. Fish.Aquat. Sci. 44, 722–731.
Perry, A.L., Low, P.J., Ellis, J.R., Reynolds, J.D., 2005. Climate change and distributionshifts in marine fishes. Science 308, 1912–1915.
Persselin, S., 2006. Cultivation of king crab larvae at the Kodiak Fisheries ResearchCenter, Kodiak, Alaska. In: Stevens, B.G. (Ed.), Alaska Crab Stock Enhancementand Rehabilitation: Workshop Proceedings: Alaska Sea Grant College Program,University of Alaska Fairbanks, Alaska. Rept. No. AK-SG-06-04, pp. 9–13.
Peterson, W.T., Schwing, F.B., 2003. A new climate regime in Northeast Pacific ecosys-tems. Geophys. Res. Lett. 30 (17), 1896.
Royer, T.C., Grosch, C.E., 2006. Ocean warming and freshening in the northern Gulf ofAlaska. Geophys. Res. Lett. 33 (16), L16605.
Sargent, J.R., 1989. The lipids. In: Halver, J.E. (Ed.), Fish Nutrition. Academic Press, SanDiego, pp. 153–218.
Sigler, M.F., Renner, M., Danielson, S.L., Eisner, L.B., Lauth, R.R., Kuletz, K.J., Logerwell,E.A., Hunt, G.L., 2011. Fluxes, fins, and feathers: relationships among the BeringChukchi, and Beaufort Seas in a time of climate change. Oceanography 24 (3),250–265.
Stabeno, P.J., Bond, N.A., Salo, S.A., 2007. On the recent warming of the southeasternBering Sea shelf. Deep Sea Res. II Topical Stud. Oceanogr. 54, 2599–2618.
Stevens, B.G., 2006. Timing and duration of larval hatching for blue king crabParalithodes platypus Brandt, 1850 held in the laboratory. J. Crust. Biol. 26,495–502.
Stevens, B.G., 2012. Feeding rate of juvenile red king crabs, Paralithodes camtschaticus,in the laboratory: effects of temperature, size, molting, and feeding frequency.Polar Biol. 35, 1791–1799.
21A.W. Stoner et al. / Journal of Experimental Marine Biology and Ecology 442 (2013) 10–21
Stevens, B.G., Persselin, S., Matweyou, J., 2008a. Survival of blue king crab Paralithodesplatypus Brandt, 1850, larvae in cultivation: effects of diet, temperature and rearingdensity. Aquac. Res. 39, 390–397.
Stevens, B.G., Swiney, K.M., Buck, C.L., 2008b. Thermal effects on embryo developmentand hatching for blue king crab Paralithodes platypus held in the laboratory, and amethod for predicting dates of hatching. J. Shellfish. Res. 27, 1255–1263.
Storch, D., Fernández, M., Navarrete, S.A., Pörtner, H.O., 2011. Thermal tolerance oflarval stages of the Chilean kelp crab Taliepus dentatus. Mar. Ecol. Prog. Ser. 429,157–167.
Stoner, A.W., Davis, M., 1994. Experimental outplanting of juvenile queen conch,Strombus gigas: comparison of wild and hatchery-reared stocks. Fish. Bull. U.S.92, 390–411.
Stoner, A.W., Ottmar, M.L., Copeman, L.A., 2010a. Temperature effects on the molting,growth, and lipid composition of newly-settled red king crab, Paralithodescamtschaticus. J. Exp. Mar. Biol. Ecol. 393, 138–147.
Stoner, A.W., Ottmar, M., Haines, S., 2010b. Temperature and habitat complexity mediatecannibalism in red king crab: observations on activity, feeding, and prey defensemechanisms. J. Shellfish. Res. 29, 1005–1012.
Suprayudi, M.A., Takeuchi, T., Hamasaki, K., 2004. Essential fatty acids for larval mudcrab Scylla serrata: implications of lack of the ability to bioconvert C18 unsaturatedfatty acids to highly unsaturated fatty acids. Aquaculture 231, 403–416.
Swiney, K.M., Long, W.C., Persselin, S.L., in press. The effects of holding space onjuvenile red king crab (Paralithodes camtschaticus) growth and survival. Aquacult.Res. http://dx.doi.org/10.1111/j.1365-2109.2012.03105.x.
Tapella, F., Romero, M.C., Stevens, B.G., Buck, C.L., 2009. Substrate preferences and re-distribution of blue king crab Paralithodes platypus glaucothoe and first crab onnatural substrates in the laboratory. J. Exp. Mar. Biol. Ecol. 372, 31–35.
Walther, K., Sartoris, F.J., Bock, C., Portner, H.O., 2009. Impact of anthropogenic oceanacidification on thermal tolerance of the spider crab Hyas araneus. Biogeosciences6, 2207–2215.
Weiss, M., Thatje, S., Heilmayer, O., Anger, K., Brey, T., Keller, M., 2009. Influence of tem-perature on the larval development of the edible crab, Cancer pagurus. J. Mar. Biol.Assoc. U.K. 89, 753–759.
Young, A.C., Johnson, E.G., Davis, J.L.D., Hines, A.H., Zmora, O., Zohar, Y., 2008. Dohatchery-reared blue crabs differ from wild crabs, and does it matter? Rev. Fish.Sci. 16, 254–261.
Zmora, O., Findiesen, A., Stubblefield, J., Frenkel, V., Zohar, Y., 2005. Large-scale juvenileproduction of the blue crab, Callinectes sapidus. Aquaculture 224, 129–139.