Embed Size (px)
Citation preview
1
Molson Coors Equity Evaluation
Nathan Dormann [email protected]
Josh Lantz [email protected]
Jacqueline Otieno [email protected]
David Haley [email protected]
Ravi Patel [email protected]
2
Molson Coors Brewing Company Equity Evaluation
Table of Contents
Executive Summary 1 Molson Coors Firm Overview 3 Industry Structure and Profitability Overview 5 Accounting Analysis 13
Financial Statement Ratio Analysis 23 Forecasting 31 Valuation Analysis 34 Valuation Results 40 Appendices 42 References 53

3
Investment Recommendation: Overvalued, HOLD 11/01/2006
Ticker Symbol TAP S&P 500 Price 71.4
52 Week Range 60.45-74.10 Market Cap 6.24B Shares Outstanding 86,280,000 Divedend Yield 1.28% Average Book Value 6.8 ROE 2.50% ROA 1.10%
EPS Forecast 2005 2006 2007 2008 1.7 3.29 3.68(e) 3.82(e) Intrinsic Valuations Actual Price $71 Residual Income $62 AEG $61 LRRI $69 Beta 1 R2 0.1
4
Executive Summary
Molson Coors has been brewing the finest quality beers for people around
the world for almost two centuries now. It is no wonder that Molson Coors is the
third largest brewer in the United States and fifth largest brewer in the world. By
producing the finest quality beers Molson Coors has created a loyal and
dedicated customer base. Only recently did Coors merge with Molson to create
one of the largest and oldest brewing companies in the world. But Coors has
been expanding their market share through acquisitions and internal growth for
years before the merger. Molson Coors competes in an industry with few true
competitors, with Anheuser Busch and Miller being the only real challengers to
Molson Coors market share. The threat of new competitors is low because of
several barriers to entry, including economy of scale which keeps many of the
smaller breweries from challenging the larger power houses. Molson Coors
business strategy has been to sell the best quality ingredients at low affordable
prices. Molson Coors also includes many promotions and advertisements to
attract new customers and to insure old customers remain loyal. By owning most
of their own packaging facilities Molson Coors is able to offer lower prices while
making sure their products are bottled at a higher quality than their competition.
The accounting practices of Molson Coors are fairly conservative. Their
accounting disclosure is very transparent, making it easier for investors to
decipher the financial situation of the company. Molson Coors accounting is more
transparent and conservative than its industry competitors, which says a lot for a
industry that is highly regulated. Molson Coors is not afraid to disclose negative
information about the firm; they just make sure to let investors know how they
plan to rectify the problem.
The financial information of Molson Coors shows that the company has
been increasing sales in a rapid manner as of recent years. This has to do with
the large growth of the company. While an increase in sales is good, it has

5
translated into only a smaller increase in gross profit. This is because in order to
sustain their large growth rate Molson Coors has had to sacrifice liquidity and
take on a lot more debt. The effect of this is Molson Coors has a lower current
ratio, has more accounts receivable, and is less efficient in turning sales into
cash. The company is well aware of their liquidity and plans to slow growth in
future periods and work on becoming more liquid and paying off debt. While the
company has taken on a lot of debt to pay for the acquisitions they have done a
fairly good job of balancing their debt to equity ratio. Molson Coors financial
strategy to grow through acquisition and effect advertisement has been a
success. It is now up to the managers of Molson Coors to balance the new level
of growth.
Through our own analysis we have found Molson Coors value to be
slightly overvalued. The price we found through the use of valuation models
shows Molson Coors to be slightly below the current market price. We value
Molson Coors to be a strong HOLD security. Even though almost all are models
have shown that its stock should be cheaper than the current market rate, it is
important to understand that many of the financials are distorted due to the
merger and previous acquisitions. We have faith in the competency of the
management to continue to create value for Molson Coors shareholders.
Molson Coors Firm Overview
Adolph Coors came to the United States in 1868 to follow a dream of
starting his own brewing company. The dream is now a reality as Molson Coors
is one of the third largest brewing companies in the United States and the fifth
largest brewing company in the world. The Company was established in 1880
with an annual output of 3,500 barrels, and just ten years later an annual out
put of 17,600 barrels. Molson Coors’s operates primarily in the alcohol
beverage industry dealing mainly in beers and malt liquors.
6
Molson Coors’s main competitors are Miller and Anheuser-Busch. So in
order to stay a float in the business their strategy are as follows:
A) In the US. Their main focus is to re-establish consistent growth trends for
Coors light.
B) In Canada, continue to drive accelerated growth for Coors light and rebuild
momentum behind the Molson Canadian brand
C) In Europe, focus is on core larger brands.
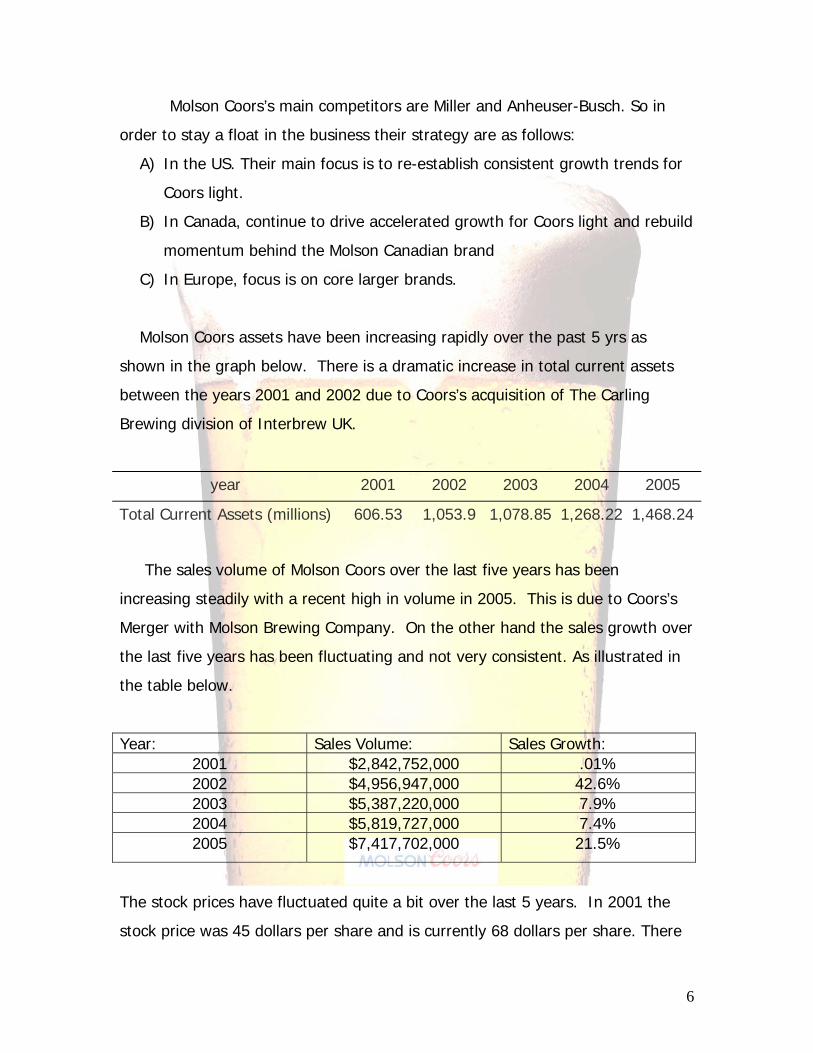
Molson Coors assets have been increasing rapidly over the past 5 yrs as
shown in the graph below. There is a dramatic increase in total current assets
between the years 2001 and 2002 due to Coors’s acquisition of The Carling
Brewing division of Interbrew UK.
year 2001 2002 2003 2004 2005
Total Current Assets (millions) 606.53 1,053.9 1,078.85 1,268.22 1,468.24
The sales volume of Molson Coors over the last five years has been
increasing steadily with a recent high in volume in 2005. This is due to Coors’s
Merger with Molson Brewing Company. On the other hand the sales growth over
the last five years has been fluctuating and not very consistent. As illustrated in
the table below.
Year: Sales Volume: Sales Growth: 2001 $2,842,752,000 .01% 2002 $4,956,947,000 42.6% 2003 $5,387,220,000 7.9% 2004 $5,819,727,000 7.4% 2005 $7,417,702,000 21.5%
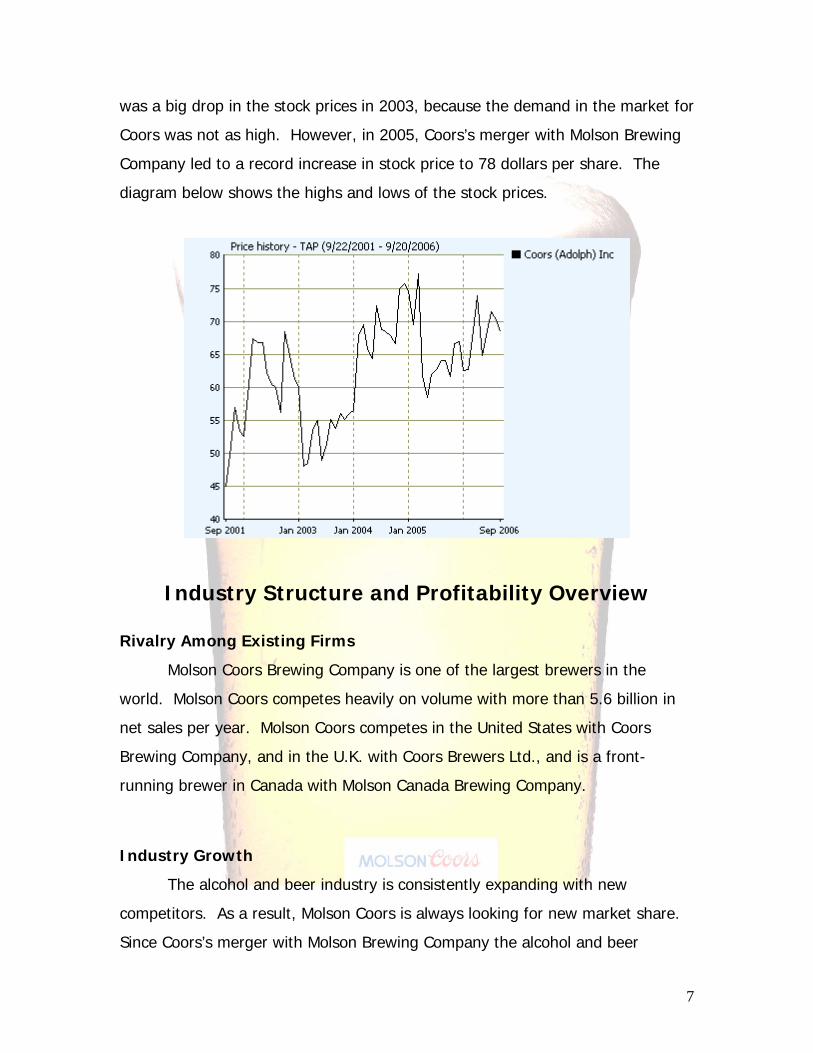
The stock prices have fluctuated quite a bit over the last 5 years. In 2001 the
stock price was 45 dollars per share and is currently 68 dollars per share. There
7
was a big drop in the stock prices in 2003, because the demand in the market for
Coors was not as high. However, in 2005, Coors’s merger with Molson Brewing
Company led to a record increase in stock price to 78 dollars per share. The
diagram below shows the highs and lows of the stock prices.
Industry Structure and Profitability Overview
Rivalry Among Existing Firms
Molson Coors Brewing Company is one of the largest brewers in the
world. Molson Coors competes heavily on volume with more than 5.6 billion in
net sales per year. Molson Coors competes in the United States with Coors
Brewing Company, and in the U.K. with Coors Brewers Ltd., and is a front-
running brewer in Canada with Molson Canada Brewing Company.
Industry Growth
The alcohol and beer industry is consistently expanding with new
competitors. As a result, Molson Coors is always looking for new market share.
Since Coors’s merger with Molson Brewing Company the alcohol and beer
8
industry has reached $200 billion dollars in worth. This market is ever-expanding
and highly competitive. In order to compete, it is extremely important that
Molson Coors seize as much market share as possible. Differentiation and
market concentration are among some of the techniques used by Molson Coors
in order to remain one of the main players in a highly competitive market. The
larger the share of the market Molson Coors is able to acquire the easier it will
be to keep costs low.
Concentration and Balance of Competitors
Molson Coors Brewing Company, after merging with the Canadian
company Molson, is now the fifth largest brewing company by volume,
competing with such brands as Anheuser- Busch, Scottish & Newcastle UK Ltd.,
Inbev UK Ltd., and Carlsberg UK Ltd.. While there are only about 10 major
players in the world, Molson Coors holds about 42% percent of the market share
in Canada and 11% percent of the market share in the United States, (ranking
them #3 in the U.S.).
Degree of Differentiation Differentiation is a competitive strategy used by Molson Coors in order to
set them apart from other similar competitors. Molson Coors not only offers a
wide variety of beer and malt liquor, but they also differentiate themselves by
using only quality raw materials, and premium packaging, helping them provide
services and product at lowest price possible. Below is a list of all Molson Coors
Brewing Company’s products.

9
Top Brewers Ranked by Volume In the United States
Company Name Ticker Symbol Sales (31 Gal
Barrels)
Percentage of
Major Market
Anheuser-Busch
Inc.
BUD
101,800,000
62%
Miller Brewing Co.
SBMRY.PK
London Stock
Exchange
39,660,000
24%
Coors Brewing Co.
TAP
22,688,000
14%
Learning Economies
The alcohol and beer industry within which Molson Coors Brewing
Company competes includes only a few large players. Since there are only a
small number of large competitors combating for as much market share as
possible, the learning curve seems to be quite steep in the beer industry.
Because of this fact, the competition for market share is far more aggressive and
competitive; pressure for larger market share is greatly increasing.

10
Excess Capacity and Exit Barriers At the time, excess capacity and exit barriers do not impose a problem to
any players in the industry. This is due to the past and current high demand for
beer as well as a low degree of specialization. These factors make exit barriers
low.
Threat of New Entrants
Scale Economies
Economies of scale is a major factor to consider when entering this
industry. A large economy of scale works to the advantage of Molson Coors by
helping them stay a large competitor in the market. It also makes new entry
into the market expensive and very difficult for companies who often have
inferior resources.
First Mover Advantage
Although Adolph Coors Company and Molson Inc. were recently merged in
February 2005, both are two of the oldest brewing companies ever formed;
(Adolph Coors founded in 1873 and Molson in 1786), helping them set industry
standards and keep supplier and customer loyalty.
Channels of Distribution and Relationships
Molson Coors’ channel of distribution is well established and maintained
due to their market position and reputation. Customer loyalty and international
name recognition help Coors keep already established channels of distribution,
while also helping them keep distributing prices down.

11
Legal Barriers
The alcohol business in the U.S. is highly regulated by federal, state and
local governments. They govern and overlook much of the operations such as,
brewing, marketing, sales, environmental issues, distributor relationships, and
transportation. Various permits must also be maintained in order to operate
within certain boundaries. These government entities also control the tax rate
faced by Coors and their competitors, which are quite high. (Federal tax is
currently $18 dollars a barrel and State excise taxes vary by state).
Threat of Substitute Products
While Molson Coors’ main objective is the brewing and selling of beer
product, they also reach out and cover many other different types of industries.
Starting in November 2001, Molson Coors partnered up with the Ernest and Julio
Gallo Winery Company, this was the first time Coors has ever teamed up with a
winery company internationally, and this offered Coors the benefit of being able
to sell a wide array of table wines, beverage wines, and distilled spirits. This
significantly decreases the chances of consumers making a switch to substitute
products.
Relative Price and Performance
One of the main priorities of Molson Coors is that they offer a premium
quality product at the most affordable price possible. Molson Coors wide variety
of products allows them to sell premium quality at an affordable price. Molson
Coors contains ownership of popular product brands such as Coors Original and
Coors Light, Keystone, Zima, Aspen Edge, Blue Moon, and Killians. Coors also
offers a wide variety of different Ale’s and Lager. Covering a large spectrum of
beer and other beverages allow Coors to not only compete at a very high
performance, but it also allows Coors the ability to offer their products at

12
reasonably affordable prices. Having premium quality with low pricing is a virtue
that most companies in the industry can’t afford.
Buyers Willingness to Switch
Many of Coors’ customers are repeat customers due to loyalty and Coors
ability to give the consumer what they want. Molson Coors advertising and
promotions along with their great taste and good pricing keeps most customers
coming back for more. Much of the buyers’ willingness to switch is based on
personal taste preference and pricing which Molson Coors puts a premium on.
Bargaining Power in Input and Output Markets
Switching Costs
Switching costs are relatively not high when it comes to this industry. The
networks needed to distribute and package are already well solidified. Many of
the products produced by Coors and other Companies are somewhat similar,
causing switching costs to be low.
Price Sensitivity

13
Switching costs and prices sensitivity go hand and hand when it comes to
consumers choosing which brand of beer to buy. Since other products are
somewhat similar, it is possible that many consumers will switch from one brand
to another based on difference in price.
Relative Bargaining Power of Consumer
One of the strongholds that Molson Coors contains is their bargaining
power that they have achieved over the years. While there are many different
types of beer on the market, Coors’ reputation and longevity of business gives
them the bargaining power over their consumer. As long as they are able to keep
prices reasonable there is no reason for their loyal customers to switch. While
other products are quite similar, much of the bargaining power and willingness to
stay or switch brands lies in the hands of the consumer.
Relative Bargaining Power of Suppliers
While advertisements and the reputation of the company make up most of
the supplier bargaining power, much of the bargaining power lies in the hands of
the consumer to make a decision on their purchases whether that is based on
price or taste preference.
Value Chain Analysis
One of the main reasons why Coors has such great success lies in the
manufacturing department. On January 22, 1959, Bill Coors and his brewing
company introduced the first two-piece aluminum beverage can. Coors now
owns and is a partner in operating the nation’s largest aluminum can
manufacturing plant which is located in Golden, Colorado. In April 2005, Coors
came out with the first 8-ounce serving of beer ever produced. With the new
can also came the wide-mouth opening for easier drinking. Also in April 2005,
Coors introduced the Coors Light 18-pack plastic bottle cooler box which is the
first ice-ready plastic bottle package. The plastic bottles allowed consumers to

14
take beer where glass insn’t allowed. In 1993 Coors introduced ZIMA, the first
flavored malt beverage available to the public. There are also many unique
products that Coors has to offer. Extra Gold Lager is full-flavored lager that is
available in select markets. They also have a seasonal brew called Winterfest is
available during the holiday season and also pumpkin flavored ale sold only in
the autumn. Coors also offers a nonalcoholic beverage, which appeals to the
large group of people who don’t consume alcohol. Coors offers 15 different
brands and many varieties of beverages such as lagers, ales and flavored malt
beverages. Coors has brewing companies in five international countries including
China, the biggest beer-consuming country in the world. By expanding the
operations throughout the world, along with improving quality and decreasing
costs Coors should be able to stay competitive for years to come.
Competitive Advantage
Molson Coors brewing company executes several different strategies in
order to differentiate their product line from the competition. They are known
across the world for offering a wide variety of products of the utmost quality. A
diverse assortment of lagers, ales, and flavored malt beverages has helped them
to become the third largest brewery in the United States and the fifth largest in
the world. In order to maintain this significant share in the market segment
Coors has created fifteen unique brands that have grown to define the
company’s high standards of excellence. These standards have earned Coors a
reputation for brewing the finest quality beers with the highest quality
ingredients. Coors is also aiming to produce their products at a lower cost
without sacrificing their quality and image. They have done this by attempting
to better optimize business processes. Costs have been lowered by shortening
their business cycle, eliminating process complexities, and encouraging better
employee performance. Because of the size of Coors Company, it is possible for
them to efficiently out produce most of their competitors; in fact, just three
United States breweries, Coors being one of them, are responsible for seventy

15
eight percent or the market share. It is extremely important that Coors is able to
make more profit on each item sold then most of their competitors. This allows
for Coors to spend more money on advertisements and product innovations
which has created significant company growth and market share. Also, Coors
financial strategy has been to expand their operations by purchasing and
merging with other companies. In 2002, Coors Brewing Company purchased
assets from Bass Brewers located in the U.K. This allowed for Coors to compete
on a national scale. The acquisition increased the company’s sales volume by
forty percent. In addition, Coors merged with Molson in 2005 to create a
company that was able to produce more efficiently. Coors-Molson is now one of
the world’s largest and most successful brewing companies.
Accounting Analysis
When doing the accounting analysis of Molson Coors, we used the
qualitative and quantitative methods to determine the quality and reliability of
the accounting practices that are implemented at Molson Coors. When evaluating
Molson Coors with the qualitative method of accounting analysis, we determined
its credibility using these five steps: 1. Identify Key Accounting Policies, 2. Assess
Degree of Potential Accounting Flexibility, 3. Evaluate Actual Accounting
Strategy, 4. Evaluate the Quality of Disclosure, and 5. Identify Potential “Red
Flags”. In the course of our evaluation of Molson Coors’ accounting analysis, we
did not find it necessary to modify any information presented. Based on the
information taken from various financial statements and the corresponding
footnotes provided, we do not feel that Molson Coors has inadequate accounting
practices or misleading information presented in the financial statements.
16
Step One: Identify Key Accounting Policies
The accounting policies of Molson Coors are of utmost importance to the
success of the company. Estimates are required to be made for the preparation
of the consolidated financial statements in regards to accounts such as assets,
liabilities, revenues, and expenses. Managers are given a degree of flexibility in
the type of accounting policies they want to implement. Although there are many
different styles of accounting they all show the financial situation of a company,
and play a vital role to the company’s success.
Key Accounting Policies
Molson Coors was able to become the fifth largest brewer in the world
through product differentiation and low cost producing and pricing. In order to
maintain there competitive advantage Molson Coors has followed these
accounting guidelines.
Revenue Recognition
Molson Coors makes billions of dollars in sales throughout a given fiscal
year. Many of the sales are accounted for in foreign markets which Coors has
ventured. When the revenue is recognized is very important to how the company
looks financially. Molson Coors typically recognizes revenue when “the significant
risks and rewards of ownership are transferred to the customer or distributor”.
This usually occurs at the time of shipment to a distributor or at the time of
delivery to a retail customer, in the case that Molson Coors is the distributing
company. This allows for revenues to be quickly accounted for making Molson
Coors operations more efficient. To compensate for damaged products or lost
17
goods Molson Coors keeps a reserve account which estimates the amount that
Coors might have to expense.
Allowance for Doubtful Accounts
Molson Coors allows many of the sales it makes to go on credit. In order
to stay competitive in the industry it is essential that some of the larger, highly
trusted distributors and retailers be allowed to purchase inventory on credit. In
order to account for some of the accounts not being paid Molson Coors estimates
a reserve account to help negate the risk. It is important that Molson Coors not
have too many accounts on credit, so that it doesn’t damage its liquidity. Having
free cash flows is essential for Molson Coors to maintain its low cost strategy.
Pension and Postretirement Benefits
Molson Coors has implemented defined benefit plans for the majority of
their employees in the United States, Canada and the United Kingdom.
Postretirement welfare plans have also been implanted in the United States and
Canada to provide for medical benefits and life insurance for retirees. The
accounting policies used by Molson Coors in regards to pension and
postretirement benefit plans conform with Statement of Financial Accounting
Standards No. 87, “Employers’ Accounting for Pensions” (SFAS No.87) and
Statement of Financial Accounting Standards No. 106, “Employers’ Accounting
for Postretirement Benefits Other than Pensions” (SFAS No.106). These
statements require management to make assumptions in relation to long-term
rate of return on plan assets, discount rates used to measure future obligations
and expenses, salary increases, inflation, and health care expense trend rates.
These standards and policies implemented by Molson Coors are highly critical in
relation to their accounting because they are highly susceptible to change from
period to period, depending on market conditions.

18
Goodwill and Other Intangible Assets
Molson Coors performs evaluation of goodwill and other intangibles
annually. Intangible assets are required to be evaluated to identify the possibility
of impairment, estimated future cash flows to be generated by such assets, and
the rate that is to be used to discount the cash flows. Recently, the allocation of
Goodwill has become a very important policy for Molson Coors in regards to the
merger between Molson and Coors. The now joint entity of Molson Coors has
allocated approximately $1.1 billion of goodwill from the merger. This amount of
goodwill was allocated to realize expected synergy savings that will result from
the merger. Allocation of goodwill puts pressure on firms in the US market to
achieve these synergy savings to avoid impairment on goodwill. This style of
accounting makes for larger future long term assets.
Inventories
Molson Coors states inventories at the lower of cost or market. Cost is
determined by the last in, first out (LIFO) method for inventories in the United
States. However, cost is determined by the first in, first out (FIFO) method in the
United Kingdom and Canada. The shelf lives of inventories are assessed regularly
and inventories are reserved when it becomes likely that the product will not be
sold by the specifications relating to the freshness of the product. It is important
that Molson Coors maintain a high inventory turnover because of the risk of
spoilage. By being able to convert inventory into sales more quickly Molson Coors
will be better able to lower their product cost.
Income Tax Assumptions
Molson Coors accounts for income taxes in accordance with Statement of
Financial Accounting Standards No. 109, “Accounting for Income Taxes” (SFAS
No. 109). However, there are several uncertainties and estimates that must be
taken into consideration when determining worldwide provision of income taxes.
The rate at which Molson Coors pays on taxes throughout the global market

19
affects many of the accounting policies it chooses in the specific areas it
operates. There decision to use the (LIFO) inventory method in the United States
and the (FIFO) method in Europe probably has to do with income taxes.
Step Two: Assess Degree of Potential Accounting Flexibility
Molson Coors has a considerable amount of flexibility when choosing their
key accounting policies. There are many accounting policies that Molson Coors
use in regards to their accounting style. Molson Coors uses the LIFO method in
the United States and the FIFO method in the United Kingdom and Canada. This
method is implemented because Molson Coors wants to cut cost, in order to
lower their prices. It is important that Molson Coors stay cost competitive with
industry leader Anheuser Busch. By changing inventory accounting Molson Coors
can manipulate the amount of taxes it incurs. Another way Molson Coors has
flexibility is in the way they allocate goodwill. When Molson and Coors merged
they allocated approximately $1.1 billion of goodwill from the merger. This
amount of goodwill was allocated to realize expected synergy savings from the
merger. Allocation of goodwill puts pressure on firms in the US market to achieve
these synergy savings to avoid impairment on goodwill. Because Molson Coors
has a history of acquisitions it this accounting decision is extremely important to
how Molson Coors financials appear. By allowing their acquisitions to be
accounted for as goodwill the future value of their assets will be significantly
higher, because they will not have to account for the amortization on the asset.
They will however check regularly for any impairment to the asset. Another
accounting policy Molson Coors has control over is their payment on debt. In
most cases the shorter the loan the lower the interest rate. Molson Coors is able
to influence how much interest the pay on debt by how quickly they pay their
debt off. It is very possible for managers to influence important ratios such as
working capital by allocating short term debt into long term debt. The amount of

20
interest paid on the long term debt will be significantly higher then what is paid
in the short term. By having less short term debt Molson Coors could improve
their credit rating and financial position, but end up paying more in the long run.
This will be important to watch with Molson Coors because of the merger. In
order to acquire Molson, Coors took on a large amount of short term debt, if
Molson Coors is unable to pay off this debt it may allocate it to longer term more
expense debt.
Step Three: Evaluation of Actual Accounting Strategy
The accounting strategy of Molson Coors Brewing Company attempts to
present the company’s financial condition in a very transparent manner rather
than conceal their financial situation from the public. Molson Coors wants the
public to be able to look at the company and get a clear view of where the
company stands. With the exception of years in which large acquisitions take
place, Molson Coors financials are transparent. For the most part Molson Coors
accounting is fairly conservative, any estimates made in the financial statements
are done so using the management’s best judgment. Also, any approximation
and uncertainty is fully divulged to the public. The results of their operations and
cash flows presented in the financial statements for Molson Coors are prepared
on a continuous basis, and strictly abide with accounting principles generally
accepted in the United States of America. They are continuously adapting to new
and better accounting methods in order to more efficiently disclose the
company’s financial information and position in the market. Coors is far more
transparent then the rest of the industry. Its financials are much easier to
decipher than its main competitors Anheuser Busch and Miller. Many of the
accounting practices of Molson Coors and Anheuser Busch are very similar
because of GAAP regulations. Regulations on advertisement and media make

21
sure that costs are expensed as they occur. These guidelines make sure that this
expense is not manipulated. This helps keep Molson Coors conservative due to a
large part of their revenue going to advertising expense.
Step Four: Quality of Disclosure
Molson Coors displays adequate information for analysts and investors to
assess the company’s growth. Their income statements and balance sheets are
available in a four year range, thus making it easy to assess the company’s
profitability at a glance.
Molson Coors reveals reports showing their failures in certain areas and
what action they are taking to correct the problem. Unlike some of the industry
competitors Molson Coors is not afraid to reveal negatives of the company.
Molson Coors just makes sure they tell investors what they are doing to fix the
problem. As an example, in the third quarter of 2006, marketing, general and
administrative expenses rose by 0.4 percent. To make up for that loss they are
implementing merger-related synergies and cost cutting programs across the
company, and achieved approximately $27 million in synergies.
Because Molson Coors has international branches of their company it is
important that they disclose the success factors and obstacles they face in those
different markets that they compete in. Canada sales increased by 3.5 percent
due to improved weather and extensive price promotions. The U.S market had
low overhead and manufacturing cost, but also suffered high energy cost and
high packaging material costs. In the Europe market sales went down by nearly
24.2 percent from the previous year, due to extensive price discounting. The
European market is currently impacted negatively by the ongoing adverse mix,
which affects the sales of highly flavored alcoholic beverages, thus the low sales.
Business is not always the same from one country to another, because
there are laws, taxes, and restrictions that affect the business either positively or

22
negatively. Molson Coors discuss all these factors in order to let investors know
what to expect while doing business in those markets and how Molson Coors
plans to manage those markets as a whole. In Europe, part of the low sales is
because of the increasing distribution costs due to the working time legislation
for drivers. The high increase in the Canada market was accelerated because the
Canadian dollar appreciated by 8 percent year over year versus the U.S dollar,
thus boosting the Canada operating results by almost 10 million that quarter. By
competing on a global scale Molson Coors is subject to all these changes, they
make sure to report all the information and changes that they are making to
account for the uncertain global environment.
Quantitative Measures
Sales Manipulation Diagnostics
Sales Manipulation 2001 2002 2003 2004 2005Net Sales/Net A/R 22.34 5.35 5.33 5.17 6.64Net Sales/Inventory 21.10 20.45 19.09 18.34 17.50
Molson Coors has been decreasing its liquidity in the more recent years as
its accounts receivable and inventory have increased in proportion to net sales.
This shows that Molson Coors has had to account for an increase in assets due
to their acquisitions. The accounting that is done for these measures seems to be
fairly consistent in that there are not many large drastic changes in the numbers.
In terms of the industry standard Molson Coors has had an overload on Accounts
Receivable as seen in the chart below. This however is due to the merger and
acquisitions not poor accounting practices. Molson Coors Net Sales to Inventory
ratio is on par with the rest of the industry.

23
Core Expense Manipulation Diagnostics
Core Expense Manipulation 2001 2002 2003 2004 2005Declining Asset Turnover 4.01 3.58 3.71 3.40 3.75Changes in CFFO/OI 1.28 0.87 1.72 1.43 1.00Changes in CFFO/NOA -4.54 -14.39 -13.31 4.83 -5.05
The negative and low numbers in the cash flow diagnostics are something to be
worried about. Molson Coors has had to use a lot of their free cash flows to
account for such large growth. Having less free cash flows makes it more difficult
to deal with unsuspected changes.
Step Five: Identify Potential “Red Flags”
Companies often take advantage of potential accounting flexibility by
overstating revenues and decreasing expense accounts. The method of
identifying these misstatements is by running the sales manipulation diagnostics
and core manipulation diagnostics such as the quantitative measures presented
Sales Manipulation
0.00
5.00
10.00
15.00
20.00
25.00
2001 2002 2003 2004 2005
Net
Sal
es/A
/R
TAPBUD
24
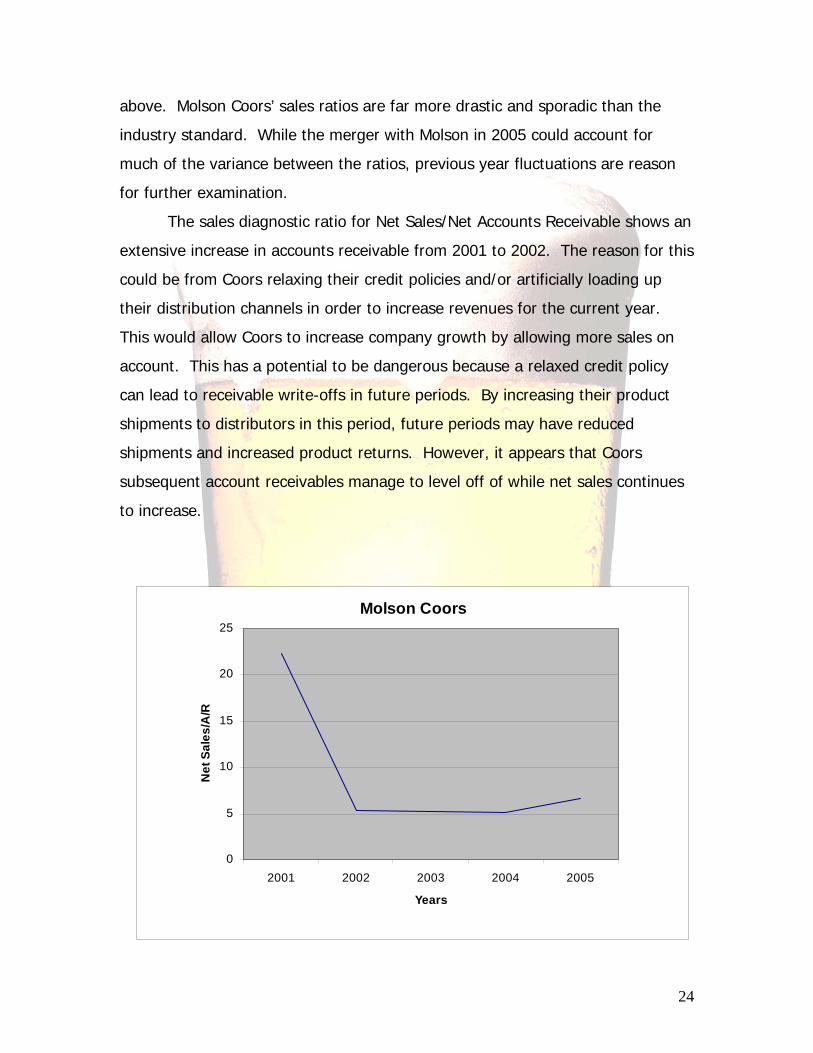
above. Molson Coors’ sales ratios are far more drastic and sporadic than the
industry standard. While the merger with Molson in 2005 could account for
much of the variance between the ratios, previous year fluctuations are reason
for further examination. The sales diagnostic ratio for Net Sales/Net Accounts Receivable shows an
extensive increase in accounts receivable from 2001 to 2002. The reason for this
could be from Coors relaxing their credit policies and/or artificially loading up
their distribution channels in order to increase revenues for the current year.
This would allow Coors to increase company growth by allowing more sales on
account. This has a potential to be dangerous because a relaxed credit policy
can lead to receivable write-offs in future periods. By increasing their product
shipments to distributors in this period, future periods may have reduced
shipments and increased product returns. However, it appears that Coors
subsequent account receivables manage to level off of while net sales continues
to increase.
Molson Coors
0
5
10
15
20
25
2001 2002 2003 2004 2005
Years
Net
Sal
es/A
/R

25
Step Six: Undo Accounting Distortions
Based on the information that we have compiled according to Molson
Coors’ accounting data, we have determined that there is no misleading
information presented in the quality of disclosure. The statements of income,
balance sheet, and cash flows all provide adequate footnotes and supplemental
information which accurately portrays the company’s financial status. As a result
of the lack of accounting distortions and misstatements we have concluded that
there is no need for any further accounting modifications.
Financial Statement Ratio Analysis
The main objective of this analysis is to examine Molson Coors’ financial
ratios and to forecast the next 10 years of Molson’s financial statements. With
these ratios we can see the overall standing of our company in the brewing
industry. The tables below allow us to view the companies’ liquidity, profitability,
and capital structure so that we are able to value this firm more accurately.
Liquidity Analysis
Liquidity Analysis 2001 2002 2003 2004 2005
Current Ratio (CA/CL) 1.17 0.92 0.95 1.08 0.66
Quick Asset Ratio 0.78 0.59 0.56 0.69 0.33
Accounts Rec. T/O 29.93 7.98 8.72 8.41 10.71
Days Sales Outstanding 12.20 45.74 41.86 43.40 34.08
Inventory Turnover 13.36 13.07 12.35 11.68 10.51
Inventory Days 27.32 27.93 29.55 31.25 34.73 Working Capital
(Sales/WC) 31.95 N/A N/A 63.73 N/A
26
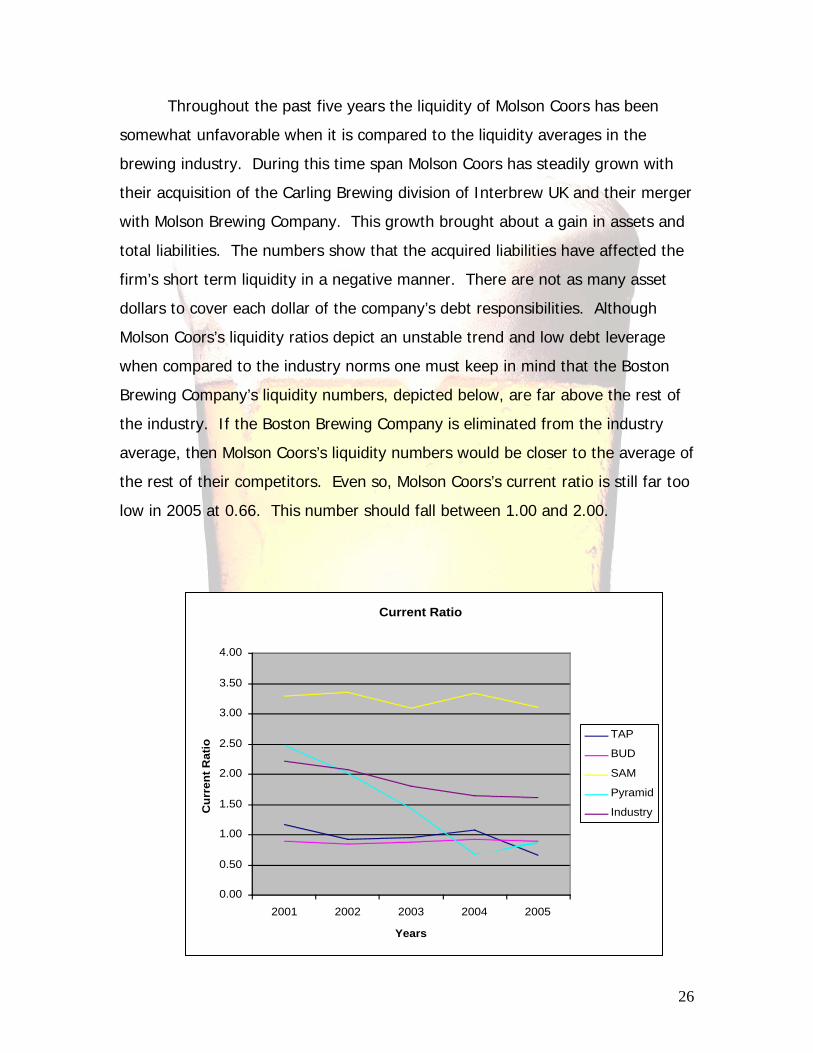
Throughout the past five years the liquidity of Molson Coors has been
somewhat unfavorable when it is compared to the liquidity averages in the
brewing industry. During this time span Molson Coors has steadily grown with
their acquisition of the Carling Brewing division of Interbrew UK and their merger
with Molson Brewing Company. This growth brought about a gain in assets and
total liabilities. The numbers show that the acquired liabilities have affected the
firm’s short term liquidity in a negative manner. There are not as many asset
dollars to cover each dollar of the company’s debt responsibilities. Although
Molson Coors’s liquidity ratios depict an unstable trend and low debt leverage
when compared to the industry norms one must keep in mind that the Boston
Brewing Company’s liquidity numbers, depicted below, are far above the rest of
the industry. If the Boston Brewing Company is eliminated from the industry
average, then Molson Coors’s liquidity numbers would be closer to the average of
the rest of their competitors. Even so, Molson Coors’s current ratio is still far too
low in 2005 at 0.66. This number should fall between 1.00 and 2.00.
Current Ratio
0.00
0.50
1.00
1.50
2.00
2.50
3.00
3.50
4.00
2001 2002 2003 2004 2005
Years
Cur
rent
Rat
io
TAP
BUD
SAM
Pyramid
Industry
27
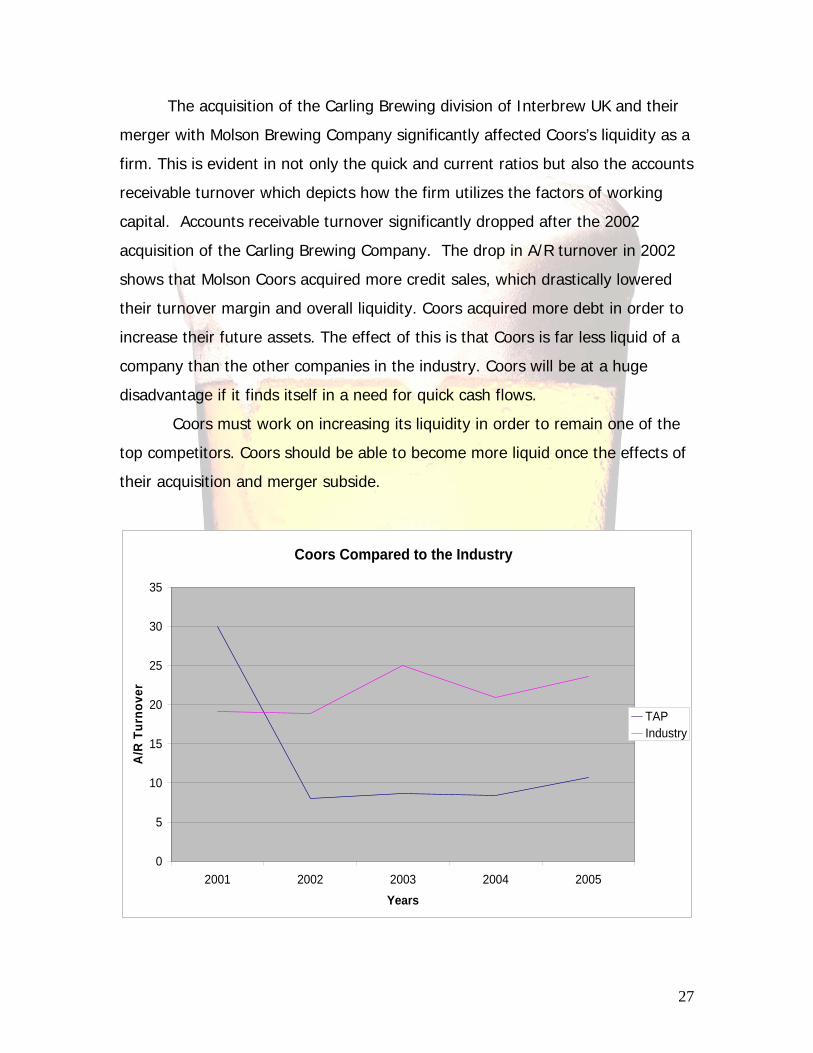
The acquisition of the Carling Brewing division of Interbrew UK and their
merger with Molson Brewing Company significantly affected Coors’s liquidity as a
firm. This is evident in not only the quick and current ratios but also the accounts
receivable turnover which depicts how the firm utilizes the factors of working
capital. Accounts receivable turnover significantly dropped after the 2002
acquisition of the Carling Brewing Company. The drop in A/R turnover in 2002
shows that Molson Coors acquired more credit sales, which drastically lowered
their turnover margin and overall liquidity. Coors acquired more debt in order to
increase their future assets. The effect of this is that Coors is far less liquid of a
company than the other companies in the industry. Coors will be at a huge
disadvantage if it finds itself in a need for quick cash flows.
Coors must work on increasing its liquidity in order to remain one of the
top competitors. Coors should be able to become more liquid once the effects of
their acquisition and merger subside.
Coors Compared to the Industry
0
5
10
15
20
25
30
35
2001 2002 2003 2004 2005Years
A/R
Tur
nove
r
TAPIndustry

28
Profitability Analysis The gross profit margin has made a slight increase from recent years to
2005, but incurred a decrease from years 2001 to 2004. The reason for the
slight decrease from 2001 to 2004 could be from increased pricing pressure from
increasing competition and/or a weakened economy after 9/11/01. Increasing
cost of goods sold compared to competitors such as Anheuser-Busch, could also
be a factor in the decreasing gross profit margin.
Gross Profit Margin Percentage
0
0.1
0.2
0.3
0.4
0.5
0.6
2001 2002 2003 2004 2005
Years
Gro
ss P
rofit
Mar
gin
TAPBUDSAMPMOIndustry
While the gross profit margin dropped from 2001 to 2004 and a slight increase in
2005, the large increase of cost of goods sold from 2001 to 2002 was about
39%, with another large increase in cost of goods sold from 2004 to 2005 of
about 83%. Along with the increasing cost of goods sold, Coors has had a large
increase in sales between 2001 and 2005. However, the large percentage of
cost of goods sold still lowers their overall gross profit, below their main
competitor Anheuser-Busch. While gross profit margin has increased slightly
from 2004 to 2005, Coors operating expense has decreased steadily over the
29
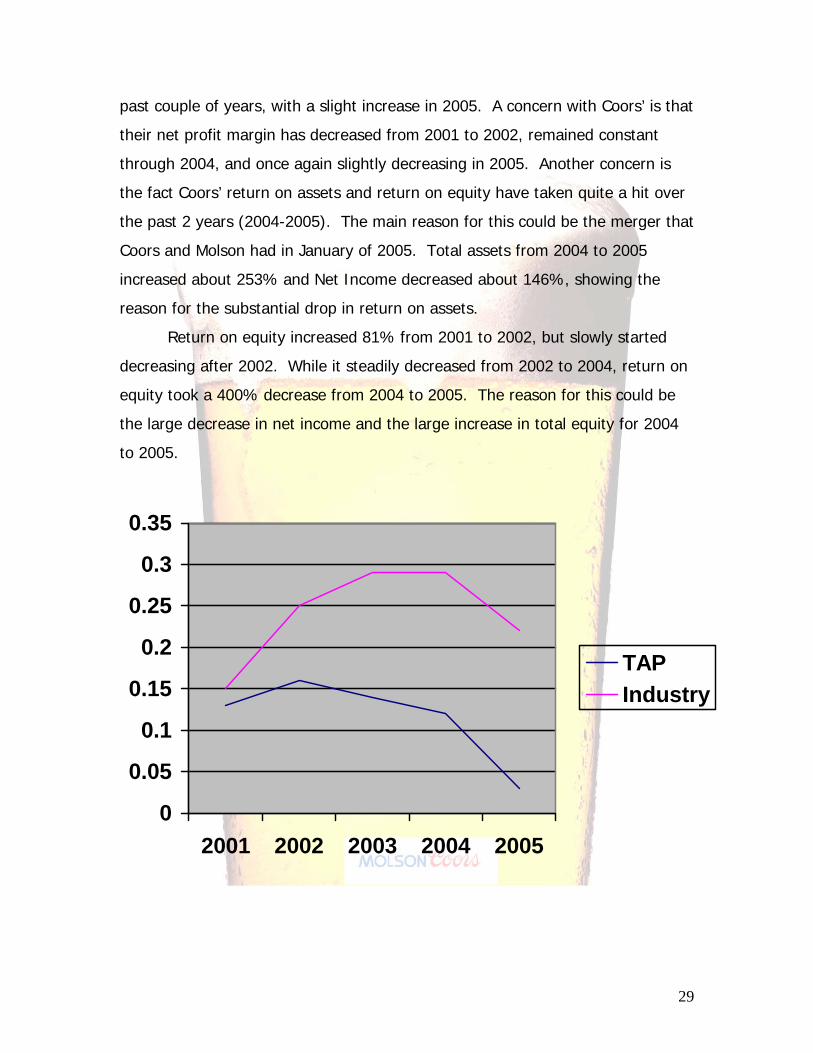
past couple of years, with a slight increase in 2005. A concern with Coors’ is that
their net profit margin has decreased from 2001 to 2002, remained constant
through 2004, and once again slightly decreasing in 2005. Another concern is
the fact Coors’ return on assets and return on equity have taken quite a hit over
the past 2 years (2004-2005). The main reason for this could be the merger that
Coors and Molson had in January of 2005. Total assets from 2004 to 2005
increased about 253% and Net Income decreased about 146%, showing the
reason for the substantial drop in return on assets.
Return on equity increased 81% from 2001 to 2002, but slowly started
decreasing after 2002. While it steadily decreased from 2002 to 2004, return on
equity took a 400% decrease from 2004 to 2005. The reason for this could be
the large decrease in net income and the large increase in total equity for 2004
to 2005.
0
0.05
0.1
0.15
0.2
0.25
0.3
0.35
2001 2002 2003 2004 2005
TAPIndustry

30
While it is alarming for return on equity to decrease that rapidly, the substantial
increase in total equity and decrease in net income can conclusively be
associated with the acquisition and merger in 2005. With the merger, the
company nearly doubled in size, which caused total equity to shoot through the
roof with and increase of 300%. A substantial decrease in operating efficiency
and increase in cost of goods sold is most likely the reason for the decrease in
net income. Anheuser-Busch, who had a steady increase in the return on equity
from 2001 to 2004, also incurred a decrease of ROE of 65%. The reason for this
could very well be the effect of 9/11/05, which also played a role the decrease of
Coors’ ROE. Compared to its competitors in the industry, Coors’ ROE is not really
up to “par” but remember to take into consideration the acquisition and merger
of 2005, and look for ROE to steadily increase starting in 2006.
Capital Structure Analysis
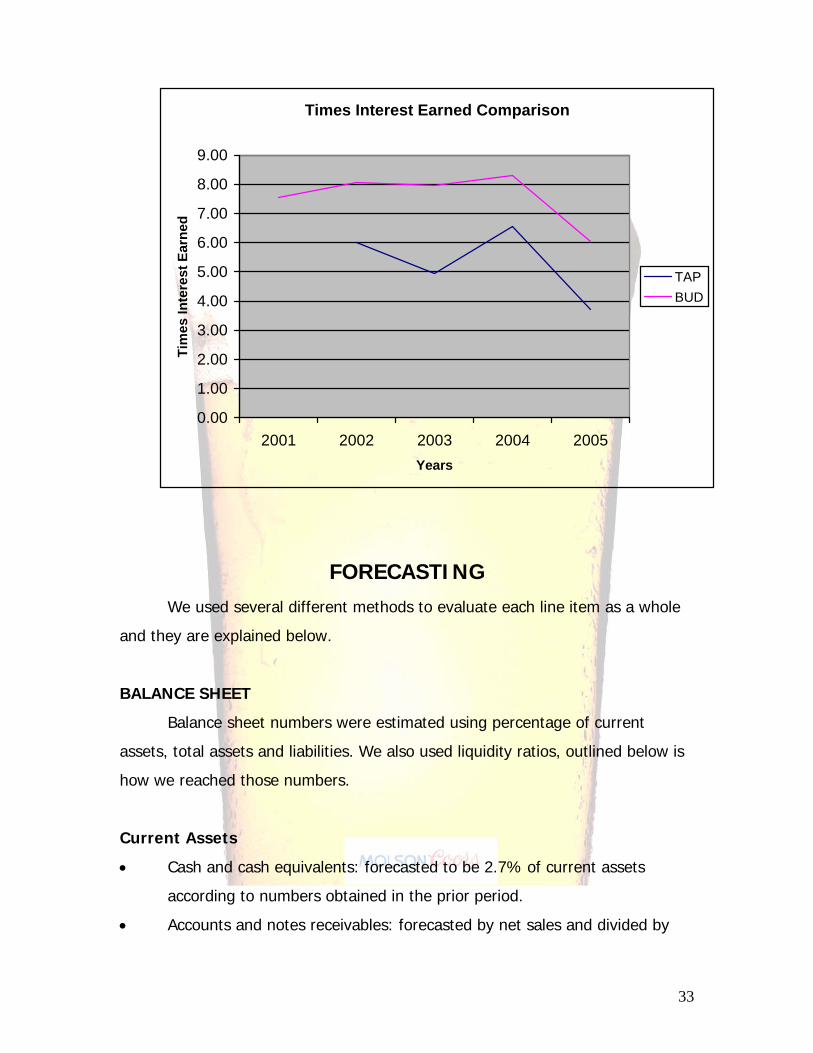
Capital Structure Analysis 2001 2002 2003 2004 2005 Debt to Equity Ratio 0.83 3.38 2.51 1.91 1.22 Times Interest Earned N/A 6.00 4.96 6.55 3.72 Debt Service Margin N/A N/A 24.82 39.99 30.16 Analysis of Molson-Coors Capital Structure shows inconsistent results. Coors
starts out with a very low debt to equity ratio in 2001. Coors was using a large
amount of equity financing as compared to debt in 2001. In 2002 the debt to
equity ratio increases with Coors having nearly four times the amount of debt

31
financing than equity financing. This is due in part to the acquisition of the
Carling Brewing division. Having a higher debt to equity ratio is not always bad,
while it makes for an increase in credit risk and higher interest expense, having
more debt also allows for acquisitions of assets that can help the companies
overall net income grow. By acquiring Carling Brewery, Coors took on more debt
in order to achieve the acquisition, the larger amount of debt to equity actually
helped increase Coors Net Income. The Times Interest Earned Ratio shows that
Coors was able to generate six times as much income before interest and taxes
then interest expense in 2002. This shows for every dollar that Coors acquires in
debt financing it is earning six times the amount in operating income. Having a
higher amount of debt to equity financing increases the company’s Return on
Equity. A higher Return on Equity increases value for the shareholder. After 2002
Coors debt to equity ratio begins to normalize back to 1. This is not because
Coors has acquired less debt but instead because it has had a large increase in
equity financing. This means Coors is relying on funds from shareholders to
finance many of their activities. This gives Coors a lower credit risk and a more
financial stable company. From 2003 to 2004 Coors also is able to finance their
debt more efficiently with cash flows from their operations. This is shown with
the increasing Debt to Service Margin numbers. In 2005 the debt to equity
margin continues to decrease closer to one, but Coors’ Times Interest Earned
also decreases by nearly 50%, their Debt Service Margin also decreases. This is
not a good sign for the company and these negative ratios are reflected by the
large decrease in Net Income, Return on Assets, and Return on Equity. Drop offs
in the companies financial may be due to the merger that took place in February
2005. These numbers will most likely get turned around once the company has
settled from the merger. Therefore 2005 is a very tough year to get an accurate
view of Molson-Coors financials.
When comparing Coors to the rest of the Industry their debt to equity
ratio is consistent with the industry, with the Ratio starting out higher and then
stabilizing around 1.

32
Debt To Equity Ratio
0.00
1.00
2.00
3.00
4.00
5.00
6.00
2001 2002 2003 2004 2005
Years
Deb
t/Equ
ity
TAPBUDSAMPMOIndustry
Anheuser Busch has a much larger Debt to Equity ratio than the rest of
the industry. Anheuser Busch is able to finance most of their company with debt
because of their great credit rating. Investors trust in Anheuser Busch to pay
back the debt that they borrow. This is reflected by the fact that Anheuser Bush
does not have any cash from operating activities going towards Note Payable.
Their ability to sustain such a high debt to equity ratio is also reflected in their
Times Interest Earned ratio. Anheuser Busch is able to earn a much more
operating income compared to their interest expense than Coors. This means
that Coors is at a huge disadvantage, Anheuser is able to acquire more debt with
less credit risk and make more of a profit off that debt.
33
FORECASTING We used several different methods to evaluate each line item as a whole
and they are explained below.
BALANCE SHEET
Balance sheet numbers were estimated using percentage of current
assets, total assets and liabilities. We also used liquidity ratios, outlined below is
how we reached those numbers.
Current Assets
• Cash and cash equivalents: forecasted to be 2.7% of current assets
according to numbers obtained in the prior period.
• Accounts and notes receivables: forecasted by net sales and divided by
Times Interest Earned Comparison
0.00
1.00
2.00
3.00
4.00
5.00
6.00
7.00
8.00
9.00
2001 2002 2003 2004 2005Years
Tim
es In
tere
st E
arne
d
TAPBUD
34
the prior year’s accounts receivables turnover liquidity ratio.
• Inventory: forecasted numbers obtained by dividing the cost of goods sold
by the inventory turnover liquidity ratio.
• Maintenance and operating supplies: calculated at 2% of the total assets
• Deferred taxes: were forecasted at 40% of the prior year’s income tax
expense.
Fixed Assets
• Properties: properties are 20% of the total fixed assets
• Goodwill: is 24% of total assets
Current liabilities
• Accounts payable: were 6% of the total liabilities
• Accrued salaries and vacations: an average of past 5 years
• Accrued excise tax: calculated by the 5.2 % of net sales of the prior years
• Accrued expenses and other liabilities: were 3.4 % of total liabilities
• Accrued portions of long-term debt: were forecasted by assumptions
because of fluctuations over the past 5 years
Long-term Liabilities
• Deferred pension and post retirement: were 13% of total liabilities
• Retained earnings: calculated retained earnings plus net income minus
dividends paid.
• Class A and B common stock: calculated by a 5 year average from 2001 -
2005
INCOME STATEMENT
The income statements were mainly based on the growth of sales over
the last five years. Sustainable growth was low at 0.01 because of the merger in

35
2005. Also because of the merger Molson Coors paid out a high amount of
dividends so dividends per share was high, however earnings per share were
low. The other forecast were done as follows:
• Net sales: were forecasted by finding average growth rate of 6.78% times
the previous year’s net sales. This growth rate does not take into include
2 outliers in 2002 and 2005.
• Cost of goods sold: were calculated by the cost of goods percentage only
• Marketing, general and administrative expenses: forecasts were calculated
by finding the growth rate of the market, general and administrative
expenses. This percentage also disregards the 2 outliers in 2002 and
2005.
• Interest Income: was calculated by finding an average of the past 5 years.
• Interest expense: was calculated by an average of the past years
excluding an outlier in 2001.
• Income tax expense: is also an average of the last 5 years.
CASH FLOWS
• Depreciation and Amortization: were calculated by 0.17* properties form
the balance sheet. 0.17 is calculated by depreciation and amortization/
properties
• Loss/ Gain of properties and intangibles: is an average starting with 2001-
2005
• Receivables: forecasted by subtracting accounts receivables that are
forecasted for the next year.
• Payables: calculated by subtracting accounts receivable in the current year
from accounts receivable that are forecasted from the next year.
• Inventories: are forecasted by subtracting next years forecasted
inventories on the balance sheet from the current year’s inventories.

36
• Additions to properties and intangibles: are calculated by an average of
the years 2001 - 2005.
• Proceeds from sales or properties: calculated by an average of the years
2001-2005.
• Dividends paid: are forecasted with a 19% dividends payout rate. This
payout rate was calculated as an average from years 2001-2004 as a
result of an outlier in the 2005.
Valuation Analysis
This section’s purpose is to determine the true value of Molson-Coors.
There are many different methods of valuation used to determine the true value
of Molson-Coors and they are all important. Most of the valuation models rely on
data from the forecasted information in the previous section. It is critically
important that these forecasted values are estimated accurately because our
intrinsic value Molson-Coors is derived from the forecasts. By analyzing the
different methods we will be able to determine whether or not Molson-Coors is
fairly valued, under valued, or over valued. These methods include comparables
method, discounted dividends, discounted free cash flows, discounted residual
income, abnormal earnings growth, and the long residual income perpetuity.
Using all these models allows for the factors of forecasted values to be
considered. Having several different models allows for compensation of an
individual model’s deficiency. The results from these models will be compared
with Molson-Coors current stock price, as well as with its Molson Coors
competition.
Comparables Valuation
In determining the method of comparables we found that many of the
companies had ratios that were well below or above the industry standard. It is

37
unfair to value Molson-Coors against many of the smaller companies that do not
hold near the market share that Coors does. We felt that using Anheuser Busch
and Sam Adams in order to evaluate the industry average would give a more
accurate analysis of the information. We made sure to exclude Molson Coors
from the industry average.
Comparables P/E P/B D/P P/S TAP 41.76 1.04 0.18 1.11BUD 20.29 11.09 0.02 2.47SAM 86.75 5.76 N/A 2.07Industry Average 53.00 8.40 0.02 2.27Value 41.76 8.762 59.28 28.11
The D/P ratio gave the closest estimate to the real share price. We where unable
to include Sam Adams into the D/P valuation because they didn’t pay dividends
in the valuation year. The P/B ratio was by far the worst method in valuing
Molson Coors $8.76 is no where near the current share price. Overall method of
comparables is not a good way to value a firm, because it is hard to get a large
enough sample size to get an accurate industry average. Also the numbers used
in some of calculations do not always exist.
Cost of Equity
In order to compute the evaluation models it was important that we
calculate our WACC and Cost of Equity. The most commonly used to way to find
the cost of equity is the Capital Asset Pricing Model. In order to determine the
cost of equity it was essential that we find our companies Beta. We calculated
Molson-Coors Beta to be 1.031 which was very close to what the 1.00 Beta that
the market had Molson-Coors listed at. This Beta estimate shows that Molson-
Coors fluctuates very symmetrically with the S&P 500. In order to determine the
cost of equity we also had to calculate the Market Risk Premium and the Risk
Free Rate of Return. These calculations are shown in Appendix … We then

38
determined our cost of equity to be 5.17% which seemed very favorable and on
par with industry leader Anheuser Busch.
WACC and Cost of Debt
Now that our cost of equity was determined we had to find our Cost of
Debt in order to determine the WACC. We calculated Molson-Coors Cost of Debt
by determining the percentages at which debt was allocated and estimating an
effective interest rate for each level of debt. Through this evaluation we
determined Molson-Coors Cost of Debt 5.17%. We were then able to calculate
that our WACC of capital was .04. These number valuations are necessary in
order to use in the valuation models to accurately evaluate our company.
Sensitivity Analysis
All of the models that we implement are evaluated using the cost of equity
and WACC of capital that we computed. The models also assume a zero percent
growth rate initially. Sensitivity analysis aims to analyze how different
fluctuations in Cost of Equity, WACC, and growth rate affect our firm’s values.
When doing the sensitivity analysis we noticed that there are very few
combinations of growth rates and cost of capital that give us a price close to the
current market price.
Discounted Dividends
The discounted dividends model attempts to value a firm by finding the
value of forecasted dividends. After taking into account our cost of equity, we
found the firms value to be $26.29 which is significantly under the current
market price of $71.00. This is one of the worst models for analyzing our
company. The low value could be because of the lack of large increase in
dividends in future years. The model is also shows an off price because it is
known to be one of the least accurate valuations. Looking at the sensitivity

39
analysis it is easy to see that only the best cost of equity and growth rate give us
an evaluation remotely close to the market value.
Sensitivity Analysis g - 0.02 0.03 0.04
Ke 0.06 26.29 35.27 44.76 65.39 0.10 14.66 16.31 17.49 19.07 0.15 9.58 10.04 10.32 10.66 0.20 7.08 7.25 7.35 7.46 0.25 5.60 5.68 5.72 5.76
Discounted Free Cash Flows
This method estimates the company’s value by using forecasted free cash
flows and the WACC that we computed. On this model we decided to use a 1%
growth rate on the terminal value perpetuity because we felt that free cash
would continue to grow but at a very slow rate. After looking at the figures it
appears that this model doesn’t give us an accurate evaluation either. It appears
that this model has our firm significantly undervalued with a price at $155.13.
This could be from the increase of our cash flow from operations relative to our
cash flow from investment. Looking at the sensitivity only high WACC give
valuations close to he current market price. A WACC of capital of nearly 9% is
needed for a $71 value.
Sensitivity Analysis g 0 0.01 0.02 0.03
WACC 0.05 155.13 187.61 241.74 350.01 0.06 123.48 143.55 173.66 223.84 0.07 100.95 114.25 132.87 160.80 0.08 84.12 93.38 105.72 123.01 0.09 71.08 77.77 86.37 97.84 0.1 60.69 65.66 71.88 79.88

40
Residual Income
The Residual Income model which uses future book value of equity and
required rate of return to determine present value was fairly accurate in
evaluating our company. As long our cost of equity stays at what we estimated it
to be the firm’s value is $62.12 and with a 1.5%growth rate the firm is equal to
the market value. Sensitivity analysis shows that fluctuations in the cost of equity
would lead to drastic changes in the value of the company.
Sensitivity Analysis g 0 0.009 0.015 0.02
Ke 0.04 83.64 95.32 107.78 123.87 0.057 62.12 66.69 70.84 75.31 0.07 51.73 54.35 56.58 58.85 0.08 45.66 47.48 48.97 50.44 0.09 40.71 42.01 43.05 44.05
Abnormal Earning Growth Model
The AEG model uses earnings per share and dividends per share to value
the company. The mode uses reinvested dividends and forecasted earnings to
get a present value. Using our computed cost of equity we found the company to
be valued at $61.24 fairly close to the market rate. Lowering the cost of equity to
3% will give a value equal to the market. This model is by far the least sensitive
in valuing our company. The model gives reasonably close estimates with every
given cost of equity and growth rate.

41
Sensitivity Analysis g 0 0.02 0.03 0.04
Ke 0.01 77.36 78.94 79.73 80.52 0.03 69.67 71.08 71.78 72.49 0.057 61.24 62.46 63.06 63.67 0.07 57.83 58.97 59.54 60.11 0.09 53.27 54.31 54.83 55.34
Long Run Residual Income
This model evaluates the company by taking the perpetuity out of a
formula derived from residual income model. Because of this the model is very
closely linked with the residual income model. Using our computed estimate of
cost of equity this model gives us a value of $68.81 which is very close to the
market value of $71. This model is very sensitive to changes in the growth rate,
with larger growth rates resulting in negative values.
Sensitivity Analysis g 0 0.02 0.04 0.06 0.0908
0.04 68.81 117.8 N/A N/A N/A0.057 48.29 63.68 115.27 N/A N/A
0.07 39.32 47.12 65.32 156.32 N/A0.08 34.41 39.27 48.99 78.16 N/A0.09 30.58 33.66 39.19 52.11 N/A
Credit Risk Analysis
In order to determine the credit risk of Molson Coors we used the Altman
Z score calculation, a method commonly used by bankers. The Z score is a
computation using weighted financial ratios to determine how efficient a
42
company can pay back debt. The higher the Z score the better and more likely
banks are to give out loans. We found that Molson Coors Z score is 2.1 which is
considered fairly risky; this is because Molson Coors has acquired a lot of short
term debt in order to pay for their recent merger. We feel that bankers will have
faith in Molson Coors and will continue to loan out money at fair rates, while not
down grading their bonds.
Valuation Results After looking at all the model evaluation it seems that the Long Run
Residual Income model gives the best estimate and Free Cash Flows gives the
worst. Long Run Residual Income is also extremely sensitive to growth rate, and
Free Cash Flows is sensitive to WACC. The AEG model is the least sensitive to
changes in growth rate and cost of equity. When trying to value our company we
feel that it was best to throw out the outlining models, the Discount Dividends
and Free Cash Flow models. After removing those inaccurate outliers we found
that our company should be valued at $64.06 which makes Molson Coors slightly
overvalued compared to its current market price of $71.00. We feel that the
models we have produced are accurate in the conclusion that Molson Coors is
slightly undervalued, but not so much to make us recommend that Molson Coors
shares be sold.

43
Appendix 1
2001 2002 2003 2004 2005 2006 2007 2008 2009 2010 2011 2012 2013 2014 2015
CONSOLIDATED STATEMENTS OF CASHFLOWS(In Thousands)
Cash flows from operating activities
Net Income $122,964 $161,653 $174,657 $196,736 $134,944 $327,777 $343,951 $360,535 $377,502 $394,824 $412,463 $430,376 $448,512 $466,808 $485,197
Depreciation and amortization $121,091 $230,299 $236,821 $265,921 $392,814 $408,039 $424,793 $442,235 $460,393 $479,297 $498,977 $519,465 $540,794 $562,999 $586,115
amortization of debt insurance $6,790 $2,456 $34,843
loss (gain) of properties and intangibles ($30,467) ($9,816) ($4,580) ($15,027) $11,416 ($9,695) ($5,540) ($4,685) ($4,706) ($2,642) ($5,454) ($4,606) ($4,419) ($4,365) ($4,297)
Deferred income tax ($19,176) ($2,819) $53,497 $6,215 ($23,049)
(gain) loss on FX fluctuations $294 $2,576 $1,252 ($5,740) ($9,266)
Net of tax $3,676
Equity in net earnings of unconsolidated affiliates ($43,630) ($54,958) ($65,542) ($59,653) ($37)
Distributions from unconsolidated affiliates $39,453 $66,616 $70,900 $72,754 $8,612
Minotiry interest earnings $16,218 $14,491
Tax benefit from equity compensation plans $412 $8,398 $6,688
Receivables $9,499 ($254,425) $31,067 ($35,671) $9,071 $143,571 ($37,250) ($39,777) ($42,476) ($45,358) ($48,435) ($51,721) ($55,230) ($58,976) ($62,978)
Payables ($27,544) $83,493 $97,761 $4,575 $16,724 $15,288 $15,915 $16,569 $17,249 $17,957 $18,695 $19,462 $20,261 $21,093 $21,959
Inventory ($5,199) $39,210 ($5,549) ($3,441) $47,233 ($21,269) ($22,795) ($24,341) ($25,993) ($27,756) ($29,639) ($31,650) ($33,797) ($36,090) ($38,538)
Accrued expenses and other liabilities ($50,703) $24,386 ($285,808)
Other $23,562 $792 ($17,955) $21,781 ($17,955)
Operating cash flows of discountinued operations $62,563
NET CASH PROVIDED BY OPERATING ACTIVITIES $193,396 $258,545 $528,828 $499,908 $422,275 $863,710 $719,074 $750,534 $781,970 $816,322 $846,607 $881,327 $916,122 $951,469 $987,459
CASH FLOWS FROM INVESTING ACTIVITIES
Additions to properties and intangibles ($1,545) ($7,295) ($240,458) ($211,530) ($406,045) ($173,375) ($173,375) ($173,375) ($173,375) ($173,375) ($173,375) ($173,375) ($173,375) ($173,375) ($173,375)
Proceeds from sales or properties $63,529 $27,357 $16,404 $72,063 $42,450 $44,361 $44,361 $44,361 $44,361 $44,361 $44,361 $44,361 $44,361 $44,361 $44,361
Cash recognized on merger with molson $73,540
cash expended for merger-related costs ($20,382)
acquisition of subsidiaries , net of cash required ($1,587,800) ($16,561)
Trade loan repayments from customer $51,863 $54,048 $42,460
Trade loan advanced to customer ($36,553) ($25,961) ($25,369)
cash received from pension settlement with UK subsidiary $25,836
cash recognized on initial consolidation of joint ventures $20,840
Investment in molson USA, LLC ($65,000) ($2,750) ($5,240) ($2,744)
Other $9,414 ($7,561) ($630) $16
Investing cash flows of discountinued operatona ($2,817)
NET CASH USED IN INVESTING ACTIVITIES ($196,749) ($1,584,338) ($214,614) ($67,448) ($312,708) ($129,014) ($129,014) ($129,014) ($129,014) ($129,014) ($129,014) ($129,014) ($129,014) ($129,014) ($129,014)
CASH FLOWS FROM FINANCING ACTIVITIES
Issuances of stock under equity compensation plans $10,701 $15,645 $2,491 $66,764 $55,229
Dividends paid ($29,510) ($29,669) ($29,820) ($30,535) ($109,960) ($61,414.43) ($64,444.99) ($67,552.16) ($70,731.34) ($73,976.87) ($77,281.88) ($80,638.18) ($84,036.11) ($87,464.34) ($90,909.70)
dividends paid to minority interest ($7,218) ($10,569)
Proceeds from issuance of long-term debt $2,391,934 $1,037,814
payments on long-term and capital lease ($1,587,300) ($462,547) ($114,629) ($584,056)
Proceeds from short-term borrowings ($880,770) ($188,718) ($1,887,558)
Net payments on proceeds from commercial paper $249,645 ($250,000) $165,795
net proceeds from revolving credit facilities $151,273
settlement on debt-related derivatives ($11,285)
Debt issuance costs ($10,074) ($11,457)
change in overdraft balances and other $51,551 ($27,783) ($32,992) $8,715 $8,159
financing cash flows of discontinued operations ($42,846)
NET CASH USED IN FINANCING ACTIVITIES ($38,844) $1,291,668 ($357,393) ($335,664) ($188,775) ($61,414.43) ($64,444.99) ($67,552.16) ($70,731.34) ($73,976.87) ($77,281.88) ($80,638.18) ($84,036.11) ($87,464.34) ($90,909.70)
CASH AND CASH EQUIVALENTS
net (decrease) increase in cash equivalents ($42,197) ($34,125) ($43,179) $96,796 ($79,208)
effect of exchange rate changeson cash ($431) $16,159 $3,452 $6,777 ($4,392)
balance at beginning of year $119,761 $77,133 $59,167 $19,440 $123,013 $39,413 $41,031 $42,716 $44,470 $46,296 $48,197 $50,176 $52,236 $54,381 $56,614
BALANCE AT END OF YEAR $77,133 $59,167 $19,440 $123,013 $39,413 $41,031 $42,716 $44,470 $46,296 $48,197 $50,176 $52,236 $54,381 $56,614 $58,938
Divident Payout -0.24 -0.18 -0.17 -0.16 -0.8148565 -0.19d/a 17.04%
Actual Financial Statements Forecast Financial Statements
44
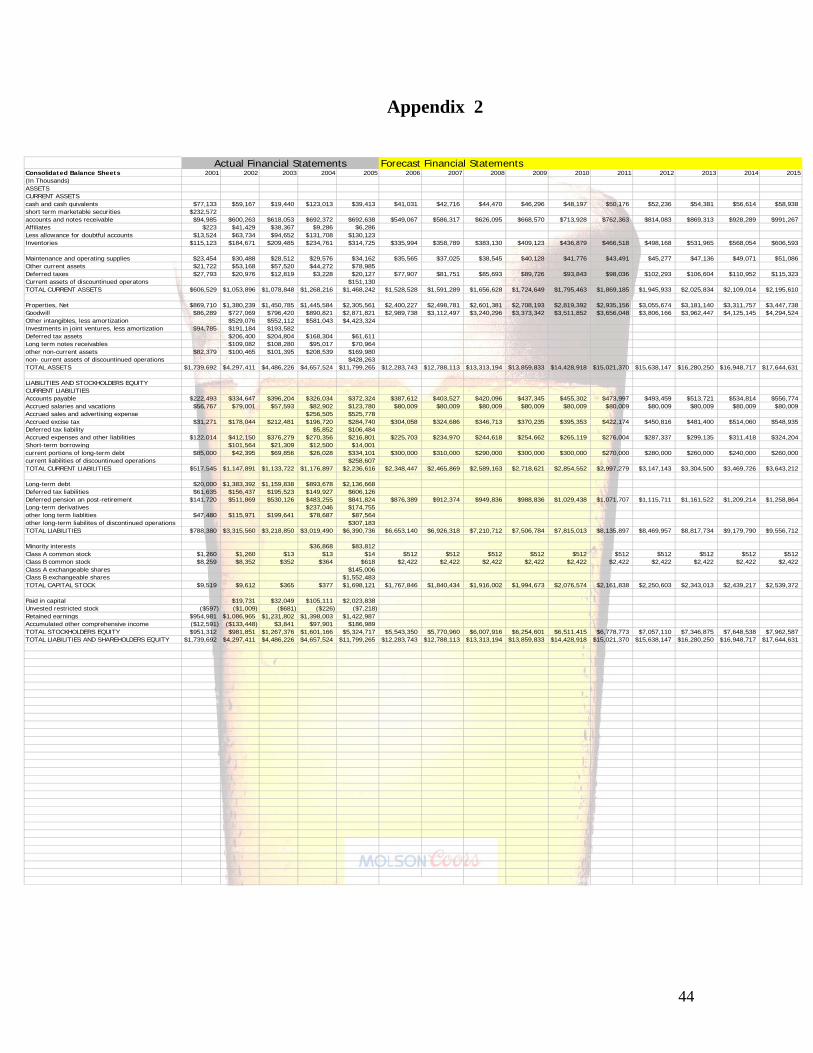
Appendix 2
������������������������Consolidated Balance Sheets 2001 2002 2003 2004 2005 2006 2007 2008 2009 2010 2011 2012 2013 2014 2015(In Thousands)ASSETSCURRENT ASSETScash and cash quivalents $77,133 $59,167 $19,440 $123,013 $39,413 $41,031 $42,716 $44,470 $46,296 $48,197 $50,176 $52,236 $54,381 $56,614 $58,938short term marketable securities $232,572accounts and notes receivable $94,985 $600,263 $618,053 $692,372 $692,638 $549,067 $586,317 $626,095 $668,570 $713,928 $762,363 $814,083 $869,313 $928,289 $991,267Affiliates $223 $41,429 $38,367 $9,286 $6,286Less allowance for doubtful accounts $13,524 $63,734 $94,652 $131,708 $130,123Inventories $115,123 $184,671 $209,485 $234,761 $314,725 $335,994 $358,789 $383,130 $409,123 $436,879 $466,518 $498,168 $531,965 $568,054 $606,593
Maintenance and operating supplies $23,454 $30,488 $28,512 $29,576 $34,162 $35,565 $37,025 $38,545 $40,128 $41,776 $43,491 $45,277 $47,136 $49,071 $51,086Other current assets $21,722 $53,168 $57,520 $44,272 $78,985Deferred taxes $27,793 $20,976 $12,819 $3,228 $20,127 $77,907 $81,751 $85,693 $89,726 $93,843 $98,036 $102,293 $106,604 $110,952 $115,323Current assets of discountinued operatons $151,130TOTAL CURRENT ASSETS $606,529 $1,053,896 $1,078,848 $1,268,216 $1,468,242 $1,528,528 $1,591,289 $1,656,628 $1,724,649 $1,795,463 $1,869,185 $1,945,933 $2,025,834 $2,109,014 $2,195,610
Properties, Net $869,710 $1,380,239 $1,450,785 $1,445,584 $2,305,561 $2,400,227 $2,498,781 $2,601,381 $2,708,193 $2,819,392 $2,935,156 $3,055,674 $3,181,140 $3,311,757 $3,447,738Goodwill $86,289 $727,069 $796,420 $890,821 $2,871,821 $2,989,738 $3,112,497 $3,240,296 $3,373,342 $3,511,852 $3,656,048 $3,806,166 $3,962,447 $4,125,145 $4,294,524Other intangibles, less amortization $529,076 $552,112 $581,043 $4,423,324Investments in joint ventures, less amortization $94,785 $191,184 $193,582Deferred tax assets $206,400 $204,804 $168,304 $61,611Long term notes receivables $109,082 $108,280 $95,017 $70,964other non-current assets $82,379 $100,465 $101,395 $208,539 $169,980non- current assets of discountinued operations $428,263TOTAL ASSETS $1,739,692 $4,297,411 $4,486,226 $4,657,524 $11,799,265 $12,283,743 $12,788,113 $13,313,194 $13,859,833 $14,428,918 $15,021,370 $15,638,147 $16,280,250 $16,948,717 $17,644,631
LIABILITIES AND STOCKHOLDERS EQUITYCURRENT LIABILITIESAccounts payable $222,493 $334,647 $396,204 $326,034 $372,324 $387,612 $403,527 $420,096 $437,345 $455,302 $473,997 $493,459 $513,721 $534,814 $556,774Accrued salaries and vacations $56,767 $79,001 $57,593 $82,902 $123,780 $80,009 $80,009 $80,009 $80,009 $80,009 $80,009 $80,009 $80,009 $80,009 $80,009Accrued sales and advertising expense $256,505 $525,778Accrued excise tax $31,271 $178,044 $212,481 $196,720 $284,740 $304,058 $324,686 $346,713 $370,235 $395,353 $422,174 $450,816 $481,400 $514,060 $548,935Deferred tax liability $5,852 $106,484Accrued expenses and other liabilities $122,014 $412,150 $376,279 $270,356 $216,801 $225,703 $234,970 $244,618 $254,662 $265,119 $276,004 $287,337 $299,135 $311,418 $324,204Short-term borrowing $101,564 $21,309 $12,500 $14,001current portions of long-term debt $85,000 $42,395 $69,856 $26,028 $334,101 $300,000 $310,000 $290,000 $300,000 $300,000 $270,000 $280,000 $260,000 $240,000 $260,000current liabilities of discountinued operations $258,607TOTAL CURRENT LIABILITIES $517,545 $1,147,891 $1,133,722 $1,176,897 $2,236,616 $2,348,447 $2,465,869 $2,589,163 $2,718,621 $2,854,552 $2,997,279 $3,147,143 $3,304,500 $3,469,726 $3,643,212
Long-term debt $20,000 $1,383,392 $1,159,838 $893,678 $2,136,668Deferred tax liabilities $61,635 $156,437 $195,523 $149,927 $606,126Deferred pension an post-retirement $141,720 $511,869 $530,126 $483,255 $841,824 $876,389 $912,374 $949,836 $988,836 $1,029,438 $1,071,707 $1,115,711 $1,161,522 $1,209,214 $1,258,864Long-term derivatives $237,046 $174,755other long term liablities $47,480 $115,971 $199,641 $78,687 $87,564other long-term liabilites of discontinued operations $307,183TOTAL LIABILITIES $788,380 $3,315,560 $3,218,850 $3,019,490 $6,390,736 $6,653,140 $6,926,318 $7,210,712 $7,506,784 $7,815,013 $8,135,897 $8,469,957 $8,817,734 $9,179,790 $9,556,712
Minority interests $36,868 $83,812Class A common stock $1,260 $1,260 $13 $13 $14 $512 $512 $512 $512 $512 $512 $512 $512 $512 $512Class B common stock $8,259 $8,352 $352 $364 $618 $2,422 $2,422 $2,422 $2,422 $2,422 $2,422 $2,422 $2,422 $2,422 $2,422Class A exchangeable shares $145,006Class B exchangeable shares $1,552,483TOTAL CAPITAL STOCK $9,519 $9,612 $365 $377 $1,698,121 $1,767,846 $1,840,434 $1,916,002 $1,994,673 $2,076,574 $2,161,838 $2,250,603 $2,343,013 $2,439,217 $2,539,372
Paid in capital $19,731 $32,049 $105,111 $2,023,838Unvested restricted stock ($597) ($1,009) ($681) ($226) ($7,218)Retained earnings $954,981 $1,086,965 $1,231,802 $1,398,003 $1,422,987Accumulated other comprehensive income ($12,591) ($133,448) $3,841 $97,901 $186,989TOTAL STOCKHOLDERS EQUITY $951,312 $981,851 $1,267,376 $1,601,166 $5,324,717 $5,543,350 $5,770,960 $6,007,916 $6,254,601 $6,511,415 $6,778,773 $7,057,110 $7,346,875 $7,648,538 $7,962,587TOTAL LIABILITIES AND SHAREHOLDERS EQUITY $1,739,692 $4,297,411 $4,486,226 $4,657,524 $11,799,265 $12,283,743 $12,788,113 $13,313,194 $13,859,833 $14,428,918 $15,021,370 $15,638,147 $16,280,250 $16,948,717 $17,644,631
Total Liabilities = 54.16%SE = 45.13%
Current Liabilities % of Liabilities = 105.00%
Total Assets 3.98% 147.02% 4.39% 3.82% 153.34% 4.06%
Avg minus two outliers = 0 4% 104%
Actual Financial Statements Forecast Financial Statements
����
45
Appendix 3
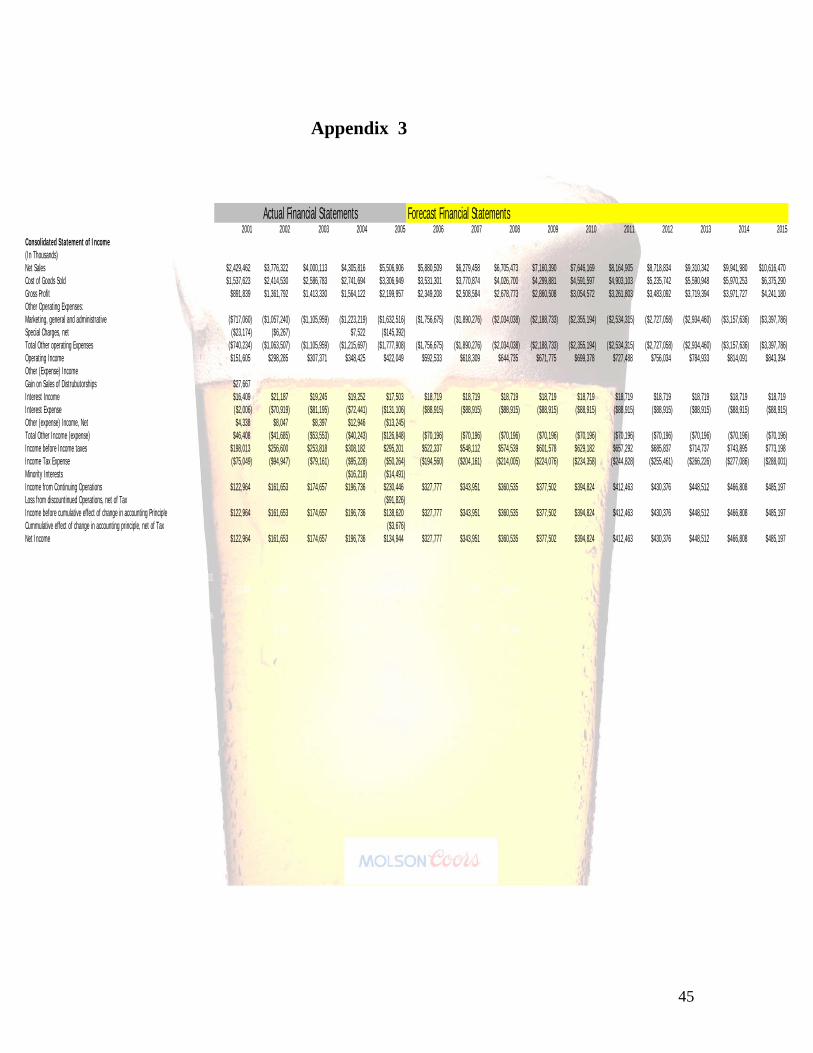
2001 2002 2003 2004 2005 2006 2007 2008 2009 2010 2011 2012 2013 2014 2015Consolidated Statement of Income(In Thousands)Net Sales $2,429,462 $3,776,322 $4,000,113 $4,305,816 $5,506,906 $5,880,509 $6,279,458 $6,705,473 $7,160,390 $7,646,169 $8,164,905 $8,718,834 $9,310,342 $9,941,980 $10,616,470Cost of Goods Sold $1,537,623 $2,414,530 $2,586,783 $2,741,694 $3,306,949 $3,531,301 $3,770,874 $4,026,700 $4,299,881 $4,591,597 $4,903,103 $5,235,742 $5,590,948 $5,970,253 $6,375,290Gross Profit $891,839 $1,361,792 $1,413,330 $1,564,122 $2,199,957 $2,349,208 $2,508,584 $2,678,773 $2,860,508 $3,054,572 $3,261,803 $3,483,092 $3,719,394 $3,971,727 $4,241,180Other Operating Expenses:Marketing, general and administrative ($717,060) ($1,057,240) ($1,105,959) ($1,223,219) ($1,632,516) ($1,756,675) ($1,890,276) ($2,034,038) ($2,188,733) ($2,355,194) ($2,534,315) ($2,727,058) ($2,934,460) ($3,157,636) ($3,397,786)Special Charges, net ($23,174) ($6,267) $7,522 ($145,392)Total Other operating Expenses ($740,234) ($1,063,507) ($1,105,959) ($1,215,697) ($1,777,908) ($1,756,675) ($1,890,276) ($2,034,038) ($2,188,733) ($2,355,194) ($2,534,315) ($2,727,058) ($2,934,460) ($3,157,636) ($3,397,786)Operating Income $151,605 $298,285 $307,371 $348,425 $422,049 $592,533 $618,309 $644,735 $671,775 $699,378 $727,488 $756,034 $784,933 $814,091 $843,394Other (Expense) IncomeGain on Sales of Distrubutorships $27,667Interest Income $16,409 $21,187 $19,245 $19,252 $17,503 $18,719 $18,719 $18,719 $18,719 $18,719 $18,719 $18,719 $18,719 $18,719 $18,719Interest Expense ($2,006) ($70,919) ($81,195) ($72,441) ($131,106) ($88,915) ($88,915) ($88,915) ($88,915) ($88,915) ($88,915) ($88,915) ($88,915) ($88,915) ($88,915)Other (expense) Income, Net $4,338 $8,047 $8,397 $12,946 ($13,245)Total Other Income (expense) $46,408 ($41,685) ($53,553) ($40,243) ($126,848) ($70,196) ($70,196) ($70,196) ($70,196) ($70,196) ($70,196) ($70,196) ($70,196) ($70,196) ($70,196)Income before Income taxes $198,013 $256,600 $253,818 $308,182 $295,201 $522,337 $548,112 $574,539 $601,578 $629,182 $657,292 $685,837 $714,737 $743,895 $773,198Income Tax Expense ($75,049) ($94,947) ($79,161) ($95,228) ($50,264) ($194,560) ($204,161) ($214,005) ($224,076) ($234,358) ($244,828) ($255,461) ($266,226) ($277,086) ($288,001)Minority Interests ($16,218) ($14,491)Income from Continuing Operations $122,964 $161,653 $174,657 $196,736 $230,446 $327,777 $343,951 $360,535 $377,502 $394,824 $412,463 $430,376 $448,512 $466,808 $485,197Loss from discountinued Operations, net of Tax ($91,826)Income before cumulative effect of change in accounting Principle $122,964 $161,653 $174,657 $196,736 $138,620 $327,777 $343,951 $360,535 $377,502 $394,824 $412,463 $430,376 $448,512 $466,808 $485,197Cummulative effect of change in accounting principle, net of Tax ($3,676)Net Income $122,964 $161,653 $174,657 $196,736 $134,944 $327,777 $343,951 $360,535 $377,502 $394,824 $412,463 $430,376 $448,512 $466,808 $485,197
Sustainable Growth Rate = 0.01Sales Growth Rate = 55.44% 5.93% 7.64% 27.89% Average Growth Rate = 6.78% 106.78%
Cost of Goods Sold Percentage Of Sales Plus Growth = 60%Marketing, general and administrative Growth Rate = 47.44% 4.61% 10.60% 33.46% avg = 7.61% 107.61%Average Interest Income = $18,719Average Interest Expense without outlier = ($88,915)Provision for income tax Avg = -37.25%
Actual Financial Statements Forecast Financial Statements
46
���������������������������� Appendix 4������������������
2001 2002 2003 2004 2005 2006 2007 2008 2009 2010 2011 2012 2013 2014 2015Common Size Income StatementNet Sales 100% 100% 100% 100% 100% 100% 100% 100% 100% 100% 100% 100% 100% 100% 100%Cost of Goods Sold 63.29% 63.94% 64.67% 63.67% 60.05% 60.05% 60.05% 60.05% 60.05% 60.05% 60.05% 60.05% 60.05% 60.05% 60.05%Gross Profit 36.71% 36.06% 35.33% 36.33% 39.95% 39.95% 39.95% 39.95% 39.95% 39.95% 39.95% 39.95% 39.95% 39.95% 39.95%Other Operating Expenses:Marketing, general and administrative 30.00% 28.00% 28.00% 28.00% 30.00% 30.00% 30.00% 30.00% 31.00% 31.00% 31.00% 31.00% 32.00% 32.00% 32.00%Special Charges, net 1.00% -0.17% 0.00% 0.17% 3.00%Total Other operating Expenses 30.00% 28.00% 28.00% 28.00% 32.00% 30.00% 30.00% 30.00% 31.00% 31.00% 31.00% 31.00% 32.00% 32.00% 32.00%Operating Income 6.24% 7.90% 7.68% 8.09% 7.66% 10.08% 9.85% 9.62% 9.38% 9.15% 8.91% 8.67% 8.43% 8.19% 7.94%Other (Expense) IncomeGain on Sales of Distrubutorships 1.14%Interest Income 0.68% 0.56% 0.48% 0.45% 0.32% 0.32% 0.30% 0.28% 0.26% 0.24% 0.23% 0.21% 0.20% 0.19% 0.18%Interest Expense 8.00% 1.88% 2.03% 1.68% 2.38% 1.51% 1.42% 1.33% 1.24% 1.16% 1.09% 1.02% 96.00% 89.00% 84.00%Other (expense) Income, Net 0.18% 0.21% 0.21% 0.30% 24.00%Total Other Income (expense) 1.91% 1.10% 1.34% 0.93% 2.30% 1.19% 1.12% 1.05% 0.98% 0.92% 0.86% 0.81% 0.75% 0.71% 0.66%Income before Income taxes 8.15% 6.79% 6.35% 7.16% 5.36% 8.88% 8.73% 8.57% 8.40% 8.23% 8.05% 7.87% 7.68% 7.48% 7.28%Income Tax Expense 3.09% 2.51% 1.98% 2.21% 0.91% 3.31% 3.25% 3.19% 3.13% 3.07% 3.00% 2.93% 2.86% 2.79% 2.71%Minority Interests 0.38% 0.26%Income from Continuing Operations 5.06% 4.28% 4.37% 4.57% 4.18% 5.57% 5.48% 5.38% 5.27% 5.16% 5.05% 4.94% 4.82% 4.70% 4.57%Loss from discountinued Operations, net of Tax 1.67%Income before cumulative effect of change in accounting Principle 5.06% 4.28% 4.37% 4.57% 2.52% 5.57% 5.48% 5.38% 5.27% 5.16% 5.05% 4.94% 4.82% 4.70% 4.57%Cummulative effect of change in accounting principle, net of Tax 0.07%Net Income 5.06% 4.28% 4.37% 4.57% 2.45% 5.57% 5.48% 5.38% 5.27% 5.16% 5.05% 4.94% 4.82% 4.70% 4.57%Sustainable Growth Rate = 0.01Sales Growth Rate = 0.00% 0.00% 0.00% 0.00% Average Growth R 0.00% 100.00%
Cost of Goods Sold Percentage Of Sales Plus Growth = 60%Marketing, general and administrative Growth Rate = -6.67% 0.00% 0.00% 7.14% avg = 0.00% 100.00%Average Interest Income = $0Average Interest Expense without outlier = $0Provision for income tax Avg = 37.25%
Actual Financial Statements Forecast Financial Statements

47
Appendix 5
Common Size Balance Sheet 2001 2002 2003 2004 2005 2006 2007 2008 2009 2010 2011 2012 2013 2014 2015ASSETSCURRENT ASSETScash and cash quivalents 12.72% 5.61% 1.80% 9.70% 2.68% 2.68% 2.68% 2.68% 2.68% 2.68% 2.68% 2.68% 2.68% 2.68% 2.68%short term marketable securities 13.37%accounts and notes receivable 5.46% 13.97% 13.78% 14.87% 5.87% 4.47% 4.58% 4.70% 4.82% 4.95% 5.08% 5.21% 5.34% 5.48% 5.62%Affiliates 0.01% 0.96% 0.86% 0.20% 0.05%Less allowance for doubtful accounts 0.78% 1.48% 2.11% 2.83% 1.10%Inventories 6.62% 4.30% 4.67% 5.04% 2.67% 2.74% 2.81% 2.88% 2.95% 3.03% 3.11% 3.19% 3.27% 3.35% 3.44%
Maintenance and operating supplies 1.35% 0.71% 0.64% 0.64% 0.29% 0.29% 0.29% 0.29% 0.29% 0.29% 0.29% 0.29% 0.29% 0.29% 0.29%Other current assets 1.25% 1.24% 1.28% 0.95% 0.67% 0.00% 0.00% 0.00% 0.00%Deferred taxes 1.60% 0.49% 0.29% 0.07% 0.17% 0.63% 0.64% 0.64% 0.65% 0.65% 0.65% 0.65% 0.65% 0.65% 0.65%Current assets of discountinued operatons 1.28%TOTAL CURRENT ASSETS 34.86% 24.52% 24.05% 27.23% 12.44% 12.44% 12.44% 12.44% 12.44% 12.44% 12.44% 12.44% 12.44% 12.44% 12.44%
Properties, Net 49.99% 32.12% 32.34% 31.04% 19.54% 19.54% 19.54% 19.54% 19.54% 19.54% 19.54% 19.54% 19.54% 19.54% 19.54%Goodwill 4.96% 16.92% 17.75% 19.13% 24.34% 24.34% 24.34% 24.34% 24.34% 24.34% 24.34% 24.34% 24.34% 24.34% 24.34%Other intangibles, less amortization 12.31% 12.31% 12.48% 37.49%Investments in joint ventures, less amortization 5.45% 4.45% 4.32%Deferred tax assets 4.80% 4.57% 3.61% 0.52%Long term notes receivables 2.54% 2.41% 2.04% 0.60%other non-current assets 4.74% 2.34% 2.26% 4.48% 1.44%non- current assets of discountinued operations 3.63%TOTAL ASSETS 100.00% 100.00% 100.00% 100.00% 100.00% 100.00% 100.00% 100.00% 100.00% 100.00% 100.00% 100.00% 100.00% 100.00% 100.00%
LIABILITIES AND STOCKHOLDERS EQUITYCURRENT LIABILITIESAccounts payable 12.79% 7.79% 8.83% 7.00% 3.16% 3.16% 3.16% 3.16% 3.16% 3.16% 3.16% 3.16% 3.16% 3.16% 3.16%Accrued salaries and vacations 3.26% 1.84% 1.28% 1.78% 1.05% 0.65% 0.63% 0.60% 0.58% 0.55% 0.53% 0.51% 0.49% 0.47% 0.45%Accrued sales and advertising expense 5.51% 4.46%Accrued excise tax 1.80% 4.14% 4.74% 4.22% 2.41% 2.48% 2.54% 2.60% 2.67% 2.74% 2.81% 2.88% 2.96% 3.03% 3.11%Deferred tax liability 0.13% 0.90%Accrued expenses and other liabilities 7.01% 9.59% 8.39% 5.80% 1.84% 1.84% 1.84% 1.84% 1.84% 1.84% 1.84% 1.84% 1.84% 1.84% 1.84%Short-term borrowing 2.36% 0.47% 0.27% 0.12%current portions of long-term debt 4.89% 0.99% 1.56% 0.56% 2.83% 2.44% 2.42% 2.18% 2.16% 2.08% 1.80% 1.79% 1.60% 1.42% 1.47%current liabilities of discountinued operations 2.19%TOTAL CURRENT LIABILITIES 29.75% 26.71% 25.27% 25.27% 18.96% 19.12% 19.28% 19.45% 19.62% 19.78% 19.95% 20.12% 20.30% 20.47% 54.16%
Long-term debt 1.15% 32.19% 25.85% 19.19% 18.11%Deferred tax liabilities 3.54% 3.64% 4.36% 3.22% 5.14%Deferred pension an post-retirement 8.15% 11.91% 11.82% 10.38% 7.13% 7.13% 7.13% 7.13% 7.13% 7.13% 7.13% 7.13% 7.13% 7.13% 7.13%Long-term derivatives 5.09% 1.48%other long term liablities 2.73% 2.70% 4.45% 1.69% 0.74%other long-term liabilites of discontinued operations 2.60%TOTAL LIABILITIES 45.32% 77.15% 71.75% 64.83% 54.16% 54.16% 54.16% 54.16% 54.16% 54.16% 54.16% 54.16% 54.16% 54.16% 54.16%
Minority interests 0.79% 0.71%Class A common stock 0.07% 0.03% 0.00% 0.00% 0.00% 0.00% 0.00% 0.00% 0.00% 0.00% 0.00% 0.00% 0.00% 0.00% 0.00%Class B commo stock 0.47% 0.19% 0.01% 0.01% 0.01% 0.02% 0.02% 0.02% 0.02% 0.02% 0.02% 0.02% 0.01% 0.01% 0.01%Class A exchangeable shares 1.23%Class B exchangeable shares 13.16%TOTAL CAPITAL STOCK 0.55% 0.22% 0.01% 0.01% 14.39% 14.39% 14.39% 14.39% 14.39% 14.39% 14.39% 14.39% 14.39% 14.39% 14.39%
Paid in capital 0.46% 0.71% 2.26% 17.15%Unvested restricted stock 0.03% 0.02% 0.02% 0.00% 0.06%Retained earnings 54.89% 25.29% 27.46% 30.02% 12.06%Accumulated other comprehensive income 0.72% 3.11% 0.09% 2.10% 1.58%TOTAL STOCKHOLDERS EQUITY 54.68% 22.85% 28.25% 34.38% 45.13% 45.13% 45.13% 45.13% 45.13% 45.13% 45.13% 45.13% 45.13% 45.13% 45.13%TOTAL LIABILITIES AND SHAREHOLDERS EQUITY 100.00% 100.00% 100.00% 100.00% 100.00% 100.00% 100.00% 100.00% 100.00% 100.00% 100.00% 100.00% 100.00% 100.00% 100.00%
Total Liabilities = 54.16%SE = 45.13%
Current Liabilities % of Liabilities = 135.00%
Total Assets -100.00% 0.00% 0.00% 0.00% 0.00% -33.33%
Avg minus two outliers 0 0% 100%
Actual Financial Statements Forecast Financial Statements

48
Appendix 6
Common Size Balance Sheet 2001 2002 2003 2004 2005 2006 2007 2008 2009 2010 2011 2012 2013 2014 2015ASSETSCURRENT ASSETScash and cash quivalents 12.72% 5.61% 1.80% 9.70% 2.68% 2.68% 2.68% 2.68% 2.68% 2.68% 2.68% 2.68% 2.68% 2.68% 2.68%short term marketable securities 13.37%accounts and notes receivable 5.46% 13.97% 13.78% 14.87% 5.87% 4.47% 4.58% 4.70% 4.82% 4.95% 5.08% 5.21% 5.34% 5.48% 5.62%Affiliates 0.01% 0.96% 0.86% 0.20% 0.05%Less allowance for doubtful accounts 0.78% 1.48% 2.11% 2.83% 1.10%Inventories 6.62% 4.30% 4.67% 5.04% 2.67% 2.74% 2.81% 2.88% 2.95% 3.03% 3.11% 3.19% 3.27% 3.35% 3.44%
Maintenance and operating supplies 1.35% 0.71% 0.64% 0.64% 0.29% 0.29% 0.29% 0.29% 0.29% 0.29% 0.29% 0.29% 0.29% 0.29% 0.29%Other current assets 1.25% 1.24% 1.28% 0.95% 0.67% 0.00% 0.00% 0.00% 0.00%Deferred taxes 1.60% 0.49% 0.29% 0.07% 0.17% 0.63% 0.64% 0.64% 0.65% 0.65% 0.65% 0.65% 0.65% 0.65% 0.65%Current assets of discountinued operatons 1.28%TOTAL CURRENT ASSETS 34.86% 24.52% 24.05% 27.23% 12.44% 12.44% 12.44% 12.44% 12.44% 12.44% 12.44% 12.44% 12.44% 12.44% 12.44%
Properties, Net 49.99% 32.12% 32.34% 31.04% 19.54% 19.54% 19.54% 19.54% 19.54% 19.54% 19.54% 19.54% 19.54% 19.54% 19.54%Goodwill 4.96% 16.92% 17.75% 19.13% 24.34% 24.34% 24.34% 24.34% 24.34% 24.34% 24.34% 24.34% 24.34% 24.34% 24.34%Other intangibles, less amortization 12.31% 12.31% 12.48% 37.49%Investments in joint ventures, less amortization 5.45% 4.45% 4.32%Deferred tax assets 4.80% 4.57% 3.61% 0.52%Long term notes receivables 2.54% 2.41% 2.04% 0.60%other non-current assets 4.74% 2.34% 2.26% 4.48% 1.44%non- current assets of discountinued operations 3.63%TOTAL ASSETS 100.00% 100.00% 100.00% 100.00% 100.00% 100.00% 100.00% 100.00% 100.00% 100.00% 100.00% 100.00% 100.00% 100.00% 100.00%
LIABILITIES AND STOCKHOLDERS EQUITYCURRENT LIABILITIESAccounts payable 12.79% 7.79% 8.83% 7.00% 3.16% 3.16% 3.16% 3.16% 3.16% 3.16% 3.16% 3.16% 3.16% 3.16% 3.16%Accrued salaries and vacations 3.26% 1.84% 1.28% 1.78% 1.05% 0.65% 0.63% 0.60% 0.58% 0.55% 0.53% 0.51% 0.49% 0.47% 0.45%Accrued sales and advertising expense 5.51% 4.46%Accrued excise tax 1.80% 4.14% 4.74% 4.22% 2.41% 2.48% 2.54% 2.60% 2.67% 2.74% 2.81% 2.88% 2.96% 3.03% 3.11%Deferred tax liability 0.13% 0.90%Accrued expenses and other liabilities 7.01% 9.59% 8.39% 5.80% 1.84% 1.84% 1.84% 1.84% 1.84% 1.84% 1.84% 1.84% 1.84% 1.84% 1.84%Short-term borrowing 2.36% 0.47% 0.27% 0.12%current portions of long-term debt 4.89% 0.99% 1.56% 0.56% 2.83% 2.44% 2.42% 2.18% 2.16% 2.08% 1.80% 1.79% 1.60% 1.42% 1.47%current liabilities of discountinued operations 2.19%TOTAL CURRENT LIABILITIES 29.75% 26.71% 25.27% 25.27% 18.96% 19.12% 19.28% 19.45% 19.62% 19.78% 19.95% 20.12% 20.30% 20.47% 54.16%
Long-term debt 1.15% 32.19% 25.85% 19.19% 18.11%Deferred tax liabilities 3.54% 3.64% 4.36% 3.22% 5.14%Deferred pension an post-retirement 8.15% 11.91% 11.82% 10.38% 7.13% 7.13% 7.13% 7.13% 7.13% 7.13% 7.13% 7.13% 7.13% 7.13% 7.13%Long-term derivatives 5.09% 1.48%other long term liablities 2.73% 2.70% 4.45% 1.69% 0.74%other long-term liabilites of discontinued operations 2.60%TOTAL LIABILITIES 45.32% 77.15% 71.75% 64.83% 54.16% 54.16% 54.16% 54.16% 54.16% 54.16% 54.16% 54.16% 54.16% 54.16% 54.16%
Minority interests 0.79% 0.71%Class A common stock 0.07% 0.03% 0.00% 0.00% 0.00% 0.00% 0.00% 0.00% 0.00% 0.00% 0.00% 0.00% 0.00% 0.00% 0.00%Class B commo stock 0.47% 0.19% 0.01% 0.01% 0.01% 0.02% 0.02% 0.02% 0.02% 0.02% 0.02% 0.02% 0.01% 0.01% 0.01%Class A exchangeable shares 1.23%Class B exchangeable shares 13.16%TOTAL CAPITAL STOCK 0.55% 0.22% 0.01% 0.01% 14.39% 14.39% 14.39% 14.39% 14.39% 14.39% 14.39% 14.39% 14.39% 14.39% 14.39%
Paid in capital 0.46% 0.71% 2.26% 17.15%Unvested restricted stock 0.03% 0.02% 0.02% 0.00% 0.06%Retained earnings 54.89% 25.29% 27.46% 30.02% 12.06%Accumulated other comprehensive income 0.72% 3.11% 0.09% 2.10% 1.58%TOTAL STOCKHOLDERS EQUITY 54.68% 22.85% 28.25% 34.38% 45.13% 45.13% 45.13% 45.13% 45.13% 45.13% 45.13% 45.13% 45.13% 45.13% 45.13%TOTAL LIABILITIES AND SHAREHOLDERS EQUITY 100.00% 100.00% 100.00% 100.00% 100.00% 100.00% 100.00% 100.00% 100.00% 100.00% 100.00% 100.00% 100.00% 100.00% 100.00%
Total Liabilities = 54.16%SE = 45.13%
Current Liabilities % of Liabilities = 135.00%
Total Assets -100.00% 0.00% 0.00% 0.00% 0.00% -33.33%
Avg minus two outliers 0 0% 100%
Actual Financial Statements Forecast Financial Statements

49
Discounted Free Cash Flows
Terminal
2005 2006 2007 2008 2009 2010 2011 2012 2013 2014 2015
Cash Flow from Operations 864 719 751 782 816 847 881 916 951 987
Cash Provided (Used) by Investing Activities (129) (129) (129) (129) (129) (129) (129) (129) (129) (129)
Free Cash Flow (to firm) 735 590 622 653 687 718 752 787 822 822
discount rate (5% WACC) 0.952 0.907 0.864 0.823 0.784 0.746 0.711 0.677 0.645
Present Value of Free Cash Flows 699.7 535.1 536.9 537.1 538.3 535.8 534.4 532.7 529.87
Total Present Value of Annual Cash Flows 4,450 Continuing (Terminal) Value (assume no growth) 16440
Present Value of Continuing (Terminal) Value 11,127
Value of the Firm (end of 1987) 15,577
Book Value of Debt and Preferred Stock $2,290
Value of Equity (end of 1987) 13,287
Estimated Value per Share 155.13
Actual Price per share $71.00
wacc 0.05
G 0
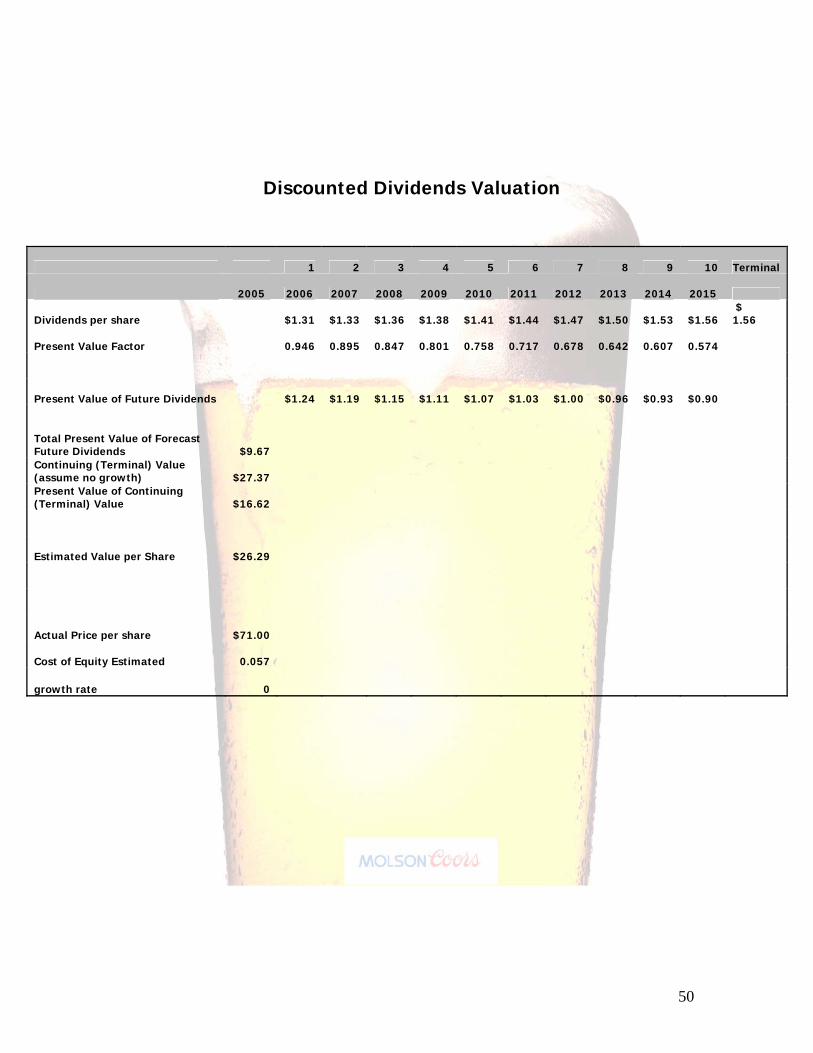
50
Discounted Dividends Valuation
1 2 3 4 5 6 7 8 9 10 Terminal
2005 2006 2007 2008 2009 2010 2011 2012 2013 2014 2015
Dividends per share $1.31 $1.33 $1.36 $1.38 $1.41 $1.44 $1.47 $1.50 $1.53 $1.56 $ 1.56
Present Value Factor 0.946 0.895 0.847 0.801 0.758 0.717 0.678 0.642 0.607 0.574
Present Value of Future Dividends $1.24 $1.19 $1.15 $1.11 $1.07 $1.03 $1.00 $0.96 $0.93 $0.90
Total Present Value of Forecast Future Dividends $9.67 Continuing (Terminal) Value (assume no growth) $27.37 Present Value of Continuing (Terminal) Value $16.62
Estimated Value per Share $26.29
Actual Price per share $71.00
Cost of Equity Estimated 0.057
growth rate 0
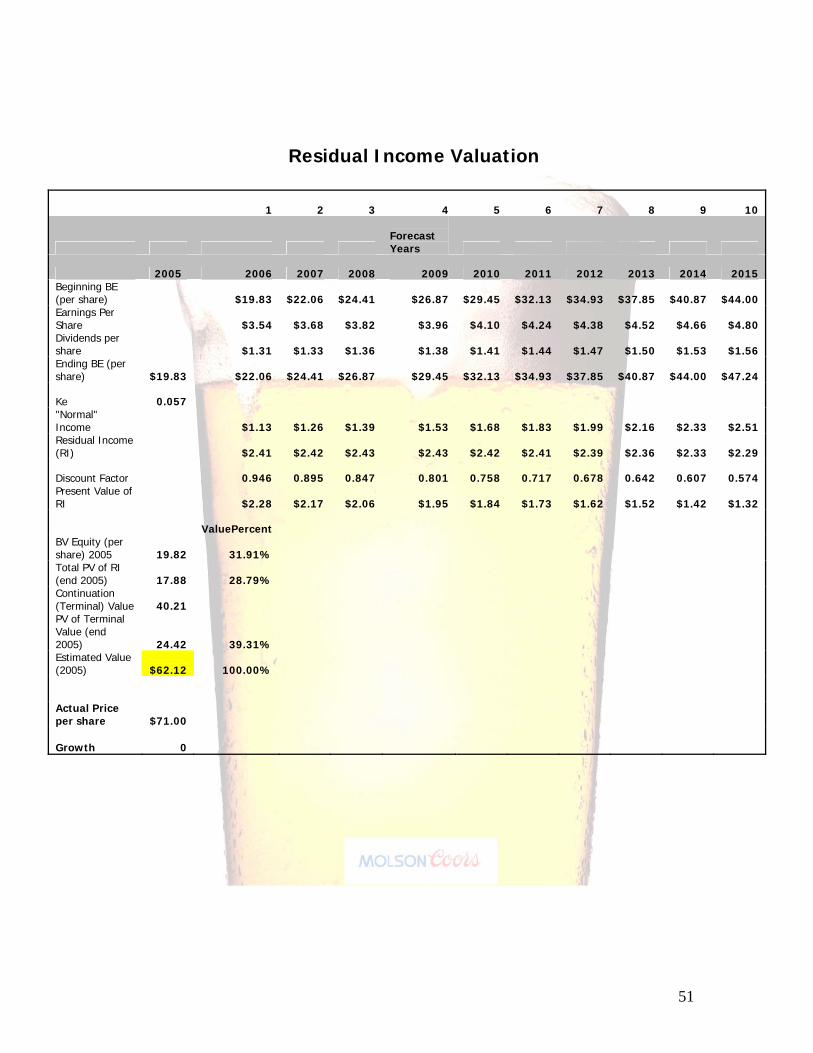
51
Residual Income Valuation
1 2 3 4 5 6 7 8 9 10
Forecast Years
2005 2006 2007 2008 2009 2010 2011 2012 2013 2014 2015Beginning BE (per share) $19.83 $22.06 $24.41 $26.87 $29.45 $32.13 $34.93 $37.85 $40.87 $44.00Earnings Per Share $3.54 $3.68 $3.82 $3.96 $4.10 $4.24 $4.38 $4.52 $4.66 $4.80Dividends per share $1.31 $1.33 $1.36 $1.38 $1.41 $1.44 $1.47 $1.50 $1.53 $1.56Ending BE (per share) $19.83 $22.06 $24.41 $26.87 $29.45 $32.13 $34.93 $37.85 $40.87 $44.00 $47.24
Ke 0.057 "Normal" Income $1.13 $1.26 $1.39 $1.53 $1.68 $1.83 $1.99 $2.16 $2.33 $2.51 Residual Income (RI) $2.41 $2.42 $2.43 $2.43 $2.42 $2.41 $2.39 $2.36 $2.33 $2.29
Discount Factor 0.946 0.895 0.847 0.801 0.758 0.717 0.678 0.642 0.607 0.574 Present Value of RI $2.28 $2.17 $2.06 $1.95 $1.84 $1.73 $1.62 $1.52 $1.42 $1.32
ValuePercent BV Equity (per share) 2005 19.82 31.91% Total PV of RI (end 2005) 17.88 28.79% Continuation (Terminal) Value 40.21 PV of Terminal Value (end 2005) 24.42 39.31% Estimated Value (2005) $62.12 100.00%
Actual Price per share $71.00
Growth 0
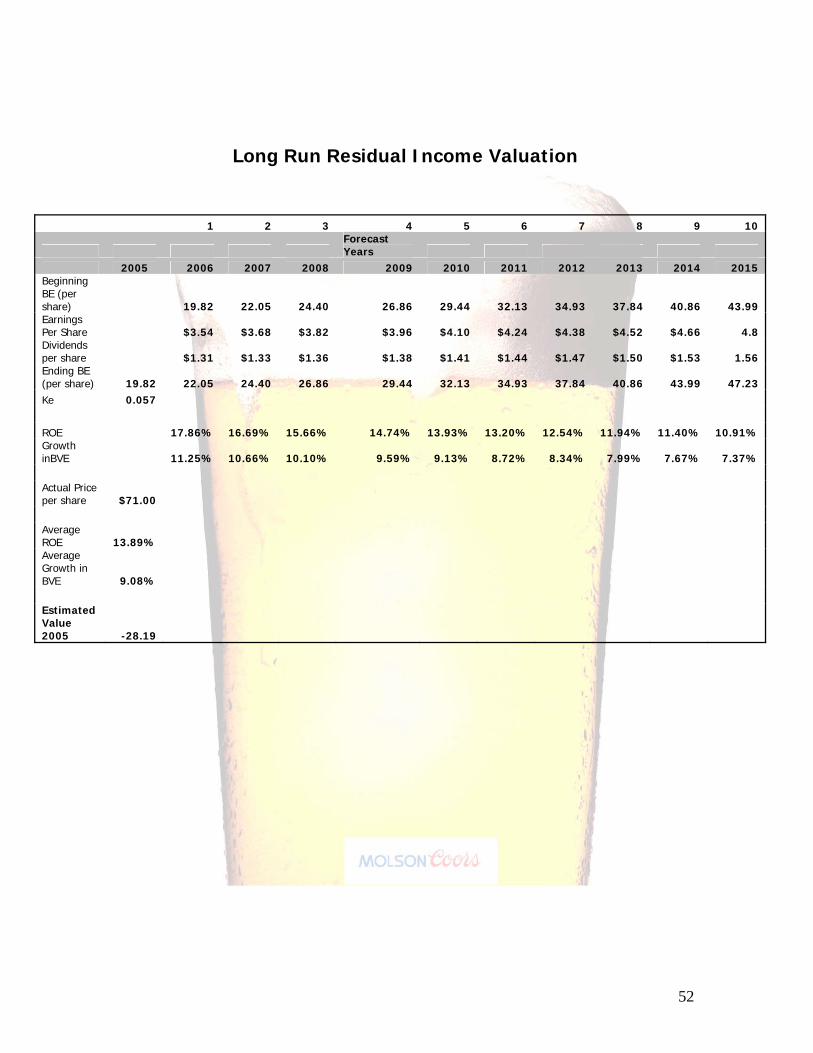
52
Long Run Residual Income Valuation
1 2 3 4 5 6 7 8 9 10
Forecast Years
2005 2006 2007 2008 2009 2010 2011 2012 2013 2014 2015Beginning BE (per share) 19.82 22.05 24.40 26.86 29.44 32.13 34.93 37.84 40.86 43.99Earnings Per Share $3.54 $3.68 $3.82 $3.96 $4.10 $4.24 $4.38 $4.52 $4.66 4.8Dividends per share $1.31 $1.33 $1.36 $1.38 $1.41 $1.44 $1.47 $1.50 $1.53 1.56Ending BE (per share) 19.82 22.05 24.40 26.86 29.44 32.13 34.93 37.84 40.86 43.99 47.23Ke 0.057 ROE 17.86% 16.69% 15.66% 14.74% 13.93% 13.20% 12.54% 11.94% 11.40% 10.91%Growth inBVE 11.25% 10.66% 10.10% 9.59% 9.13% 8.72% 8.34% 7.99% 7.67% 7.37% Actual Price per share $71.00 Average ROE 13.89% Average Growth in BVE 9.08% Estimated Value 2005 -28.19

53
Abnormal Earnings Growth Valuation
1 2 3 4 5 6 7 8 9
Forecast Years
2005 2006 2007 2008 2009 2010 2011 2012 2013 2014 2015
EPS $3.54 $3.68 $3.82 $3.96 $4.10 $4.24 $4.38 $4.52 $4.66 $4.80
DPS $1.31 $1.33 $1.36 $1.38 $1.41 $1.44 $1.47 $1.50 $1.53 $1.56DPS invested at 5.7% (Drip) $0.07 $0.08 $0.08 $0.08 $0.08 $0.08 $0.08 $0.09 $0.09
Cum-Dividend Earnings $3.75 $3.90 $4.04 $4.18 $4.32 $4.46 $4.60 $4.75 $4.89
Normal Earnings $3.74 $3.89 $4.04 $4.19 $4.33 $4.48 $4.63 $4.78 $4.93 Abnormal Earning Growth (AEG) $0.01 $0.01 ($0.00) ($0.01) ($0.01) ($0.02) ($0.03) ($0.03) ($0.04)
PV Factor 0.946 0.895 0.847 0.801 0.758 0.717 0.678 0.642 0.607
PV of AEG $0.01 $0.01 ($0.00) ($0.01) ($0.01) ($0.01) ($0.02) ($0.02) ($0.02)
Core EPS $3.54
Total PV of AEG ($0.07) Continuing (Terminal) Value $0.04
PV of Terminal Value $0.02
Total PV of AEG ($0.05) Total Average EPS Perp (t+1) $3.49 Capitalization Rate (perpetuity) 0.057
Value Per Share end of 2005 $61.24
Ke 0.057
g 0.00
Actual Price per share $71.00

54
References United States. Securities and Exchange Commission. Edgar Database. http://sec.gov/edgar/searchedgar/webusers.htm The Boston Beer Company Website http://www.bostonbeer.com Yahoo Finance. Yahoo Financial Database and Information http://finance.yahoo.com Molson Coors Company Website http://molsoncoors.com