Embed Size (px)
Citation preview

Molson Coors Brewing Company
March 2007

Leo KielyChief Executive Officer
Molson Coors Brewing Company

3
Forward Looking Statements
This presentation includes "forward-looking statements" within the meaning of the federal securities laws, commonly identified by such terms as “looking ahead,”“anticipates,” “estimates” and other terms with similar meaning. It also includes financial information, of which, as of the date of this presentation, the Company’s independent auditors have not completed their audit. Subsequent events may occur or additional information may arise that could have an effect on the final year-end financial information. Although the Company believes that the assumptions upon which the financial information and its forward-looking statements are based are reasonable, it can give no assurance that these assumptions will prove to be correct. Important factors that could cause actual results to differ materially from the Company's projections and expectations are disclosed in the Company’s filings with the Securities and Exchange Commission. These factors include, among others, changes in consumer preferences and product trends; price discounting by major competitors; and increases in cost generally. All forward-looking statements in this presentation are expressly qualified by such cautionary statements and by reference to the underlying assumptions. We do not undertake to publicly update forward-looking statements, whether as a result of new information, future events or otherwise.

4
Agenda
• Leo Kiely, Chief Executive Officer• Kevin Boyce, CEO, Molson Canada• Frits van Paasschen, CEO, Coors Brewing Company • Peter Swinburn, CEO, Coors Brewers Limited • Tim Wolf, Global CFO• Q&A

5
Molson Coors – 2006 Financial Highlights
Significant accomplishments – a solid “Year 2”
• Solid top-line momentum and profit growth despite competitive and cost challenges
• Finished year with even stronger brands and positive pricing
• Exceeded cost saving targets• Double-digit earnings growth• Surpassed cash generation goals

6
Molson Coors – Building On Our Momentum
We will continue to strengthen our base:
#1 Be great brand builders#2 Continue strengthening our financial foundation#3 Build our global capabilities#4 Create a winning and inspired culture

7
Building Great Brands by Doing Great Beer
Great, drinkable, refreshing beer is key to building great Molson Coors brands
• Doing great beer is at the heart of brand building• Focus on excelling in all areas of our business• Establish equities that resonate with consumers –
innovation keeps our brand fun, relevant, top-of-mind• Grow Coors Light into a truly global brand
Doing these things well will allow us to become aTop-Performing Global Brewer

8
Building Great Brands…and Making Money
Building brands and reducing costs are critical to making money and generating cash
• Make money – build brands and grow the top line• Save money – generate more cash to fuel growth• Spend money – invest to further strengthen brands and
capabilities
Doing these things well will allow us to become aTop-Performing Global Brewer

Kevin BoycePresident and Chief Executive Officer
Molson Canada

10
Canadian Beer MarketKey Trends
• Strong industry growth – Industry has typically grown at 1% per year– In 2006, industry growth was 2%
• Continued segment shifts– Value, Super Premium and Premium Light segments growing– Premium segment in decline
• Increased complexity – Significant proliferation of pack sizes and price points
• Increased LTO activity by all brewers – Labatt led the way with a rise in summer time activity, to which we
responded in Q4 • Continued strong profitability
– Pricing pressure has been making bottom line growth more challenging, but market remains very profitable

11
Looking Back, 2006 Was A Great Year (I)Significant Bottom Line Growth
377483
$0
$200
$400
$600
2005 2006
Canada Pretax Income
+28.1%
(US$ millions)

12
Looking Back, 2006 Was A Great Year (II)Second Consecutive Year of Volume Growth
• Strategic brands growing at more than twice the rate of the industry
• Double-digit growth on Coors Light (second consecutive year)
• Double-digit growth on Rickard’s and Creemore• Continued share gains on our 3 large partner
brands – Heineken, Corona, MGD Clear• Still some work to do on Molson Equity brands
– Although 2006 did see an Improvement in the Molson Canadian performance trend

13
Looking Forward to 2007 and BeyondContinuing to Focus on Our Five Strategic Thrusts
Build a Consumer Preferred Portfolio
Become a Customer Preferred Supplier
Build a Passion for Growth Culture
Attack Costs to Reinvest for Growth
Strengthen the Business Environment
Canada’s favourite brewer,
winning with inspired
employees who are passionate about building brands that are
the heart and soul of every drinks
occasion.
Vision
14
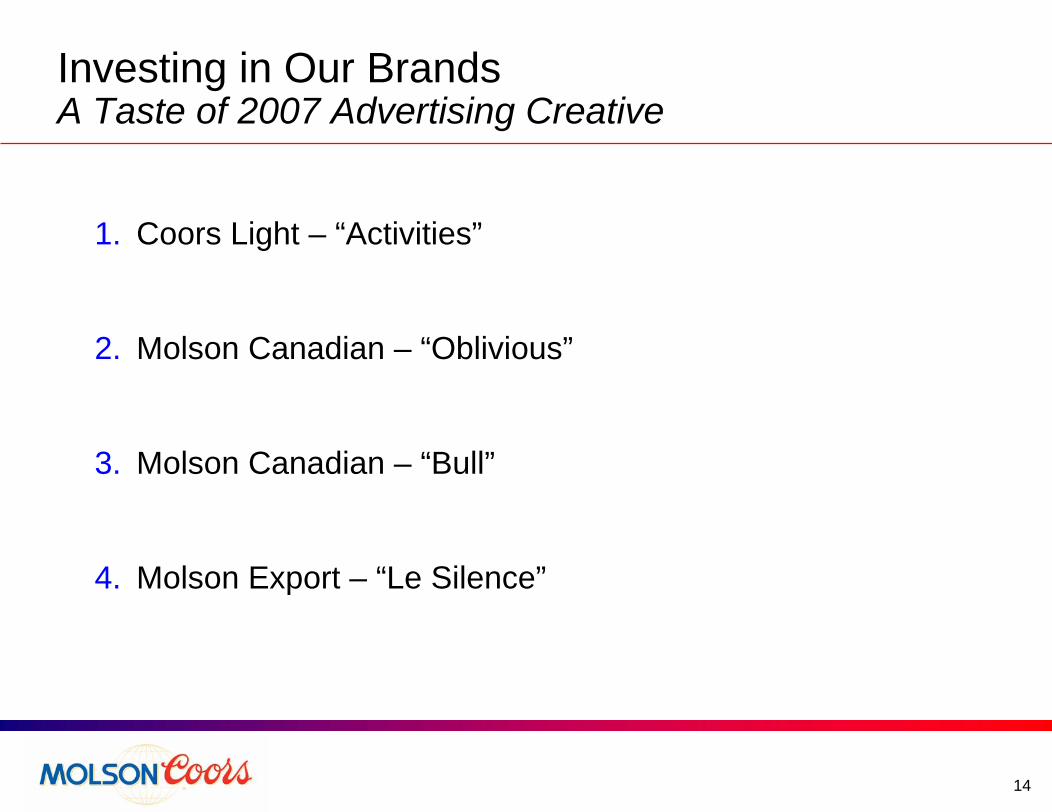
Investing in Our BrandsA Taste of 2007 Advertising Creative
1. Coors Light – “Activities”
2. Molson Canadian – “Oblivious”
3. Molson Canadian – “Bull”
4. Molson Export – “Le Silence”


16
Investing in Our BrandsKey 2007 Innovations
Sub Zero Phase II rollout
Coors Light Cold Certified Can Coors Light Ice Can Pack
Rickard`s White Premium Home Draught

17
Investing in Our BrandsInnovative Programming – Molson Canadian Rocks RevealedConcept:– Guess the band, win tickets– Sign up on website to text in to receive clues on your
mobile phone– Promoted in music-centric media only – online, radio, wild
postings, street teams and urban weeklies– Winners receive tickets on their cell phones – first time
anyone has used mobile ticketing in North America Calgary: MobileVancouver: Hot Hot Heat Toronto – Billy Talent
A First – Mobile Ticketing

18
Top 3 Priorities for 20071. Attacking “non-consumer visible” costs
• Targeting non-working dollars• Reducing G&A spend• Recent headcount reduction (announced in Jan 2007)
2. Investing in our brands and growing share• Increasing overall commercial spend• Launch of Rickard’s White nationwide after a successful test in Quebec• Expansion of Creemore into new markets• Maintaining strategic brand growth• Improving trend on Molson Equity• New efforts to slow decline of non-strategic brands
3. Focusing on our people• Continue to focus on the “basics” that drive employee engagement• Train, empower and inspire our employees to bring our business to the
next level

Frits van PaasschenPresident and CEO
Coors Brewing Company

20
Key Actions and Initiatives• Clear brand positioning and benefits• Innovation• Distributor alignment• Key Accounts• Local market focus• Disciplined execution
U.S. Sales-to-Retail
Growth(% vs PY)
CBC and Coors Light Momentum Continues
Q1'05 Q2'05 Q3'05 Q4'05 Q1'06 Q2'06 Q3'06 Q4'06
CBC
Coors Light

21
Product Disciplined Execution
Consumer Connection
Clear“Ownable”
Brand Positioning
• Product Quality • Listening to Consumers• Insightful Innovation• Inspiring Communication
• Planning/Accountability• Resource Allocation• Measuring Success
Key Success Factors for Building Brands

22
Brand Positioning:
“Refreshment as Cold as the Rockies”How it comes to life:
Coors Light

23
• Top Consumer Concern:“Cans make the beer taste metallic”
• 88% of consumers believe cans are not lined
• Cans represent 57% of Coors Light U.S. volume
Coors Light: Consumer Connection

24
Coors Light: Consumer Connection
• Introduce blue to the can liner• Frost Brew Liner name highlights both liner and brand
positioning• Focused “360 degree” communication
– Point of sale– Primary and secondary packaging– ‘Mega’ promotion during peak– TV commercial
The Frost Brew Liner Program

25
Coors Light: Consumer Connection


27
Source: ACNielsen – Grocery“Pre” is 14 weeks ending 4/1/06“Post” is 38 weeks ending 12/23/06
Coors Light 12 oz Cans
% PointShare
Change
-0.4
0.5
Pre-FBL
Post-FBL
Coors Light: Disciplined Execution

28
Keystone LightBrand Positioning:
“Smooth tasting, affordable beer”How it comes to life:

29
Volume Growth
2005 2006
Marginal Gross Profit Change
Keystone Light: Disciplined Execution
• Expand distribution in key channels
• Align pricing to compete effectively in segment
• Return to TV and radio• Turn-key distributor
programming
• Expand distribution in key channels
• Align pricing to compete effectively in segment
• Return to TV and radio• Turn-key distributor
programming
Business StrategiesBusiness Strategies
2005 2006

30
Blue MoonBrand Positioning:
“The slightly unusual, yet accessible craft beer”How it comes to life:

31
Blue Moon: Disciplined Execution
• Disciplined execution in target markets
• Focused expansion, on-premise then off-premise
• “Word-of-mouth”marketing
• Disciplined execution in target markets
• Focused expansion, on-premise then off-premise
• “Word-of-mouth”marketing
Brand Building StrategyBrand Building StrategyBrand 2005
Rank
Sam Adams Boston Lager
1
2
7
Sierra Nevada Pale Ale
Blue Moon Belgian White Ale
2006 Rank
1
2
3
Source: ACNielsen Grocery/Drug/Liquor/ExpandedConvenienceTotal Craft/Micro Segment

32
New York
Philadelphia
Dallas
Chicago
Los Angeles
Florida
7-11
Wal*Mart
Kroger
Disciplined Execution: Accountability
EBIT GrowthShare Growth

33
Disciplined Execution: Pricing
$9.21$9.20
$17.89
$15.55
$12.32
$9.05 $9.08
$17.96
$15.52
$12.25
$8.89$8.95
$17.57
$15.09
$12.12
18PK CN 24PK CN 30PK CN 12PK CN 12PK LNNR
Coors Light Bud Light Miller Lite
$9.21$9.20
$17.89
$15.55
$12.32
$9.05 $9.08
$17.96
$15.52
$12.25
$8.89$8.95
$17.57
$15.09
$12.12
18PK CN 24PK CN 30PK CN 12PK CN 12PK LNNR
Coors Light Bud Light Miller Lite
Source: AC Nielsen Total U.S. Grocery 52 Weeks Ending 12/30/2006 Average Price/Unit
Premium Light Brands Average Price - Total U.S. Grocery

34
Disciplined Execution: Pricing
$0.57
$0.47
$0.63
$0.30$0.27
$0.49
$0.36
$0.61
$0.21$0.16
$0.38
$0.25
$0.42
$0.11$0.17
18PK CN 24PK CN 30PK CN 12PK CN 12PK LNNR
Coors Light Bud Light Miller Lite
$0.57
$0.47
$0.63
$0.30$0.27
$0.49
$0.36
$0.61
$0.21$0.16
$0.38
$0.25
$0.42
$0.11$0.17
18PK CN 24PK CN 30PK CN 12PK CN 12PK LNNR
Coors Light Bud Light Miller Lite
Premium Light Brands Average Price Change - Total U.S. Grocery
2006 vs. 2005
Source: AC Nielsen Total U.S. Grocery; 52 Weeks Ending 12/30/2006 Average Price/Unit vs. 52 Weeks Ending 12/31/05 Average Price/Unit

35
'04 '05 '06
• Decentralize P&L accountability
• Lead “above market”pricing
• Improve price promotion decision support
• Decentralize P&L accountability
• Lead “above market”pricing
• Improve price promotion decision support
P&LImpact
($Millions)
Net Pricing(Gross Revenue Less Price Discounts)
Improving Price RealizationImproving Price Realization
Pricing Discipline is Critical to CBC Success

36
Strong Brands Drive Growth
Source: ACNielsen Total Grocery/Drug/ExpandedConvenience2005 volumes for 52 weeks ending 12/31/052006 volumes for 52 weeks ending 12/30/06Major Imports = Corona/Modelo + HeinekenOther Major Domestics = AB + SABMiller + Pabst
Brewer U.S. Share Change(% ’06 vs. ’05)
+0.8
-1.0
+0.1 +0.1
MajorImports
AllOther
CBC
Other MajorDomestics

37
• Memphis closure 6 months ahead of schedule
• Shenandoah first brew March 1st
• Exceed merger synergy target
• Improve 3-tier profitability– Temperature Controlled
Warehousing– Shelf-life date extension– Pallets
• Memphis closure 6 months ahead of schedule
• Shenandoah first brew March 1st
• Exceed merger synergy target
• Improve 3-tier profitability– Temperature Controlled
Warehousing– Shelf-life date extension– Pallets
Top Initiatives and SynergiesTop Initiatives and Synergies
Offsetting Inflation
2004 2005
83 % 75 %
+ 1.5 %+ 0.7 %
2006
Inflation Offset
48 %
Net COGS Change
+ 4.1 %

38
1. Grow through brand strength
2. Go to market with discipline
3. Build export markets
4. Relentlessly improve3-tier profitability
5. Commit to corporate and social responsibility
Pretax income growth
Grow volume faster than the market
Business Strategies
Building Great Beer Brands
Results
Continued Focus on Our Five Business Strategies


Peter SwinburnChief Executive OfficerCoors Brewers Limited

41
2006 Summary – Acceptable Earnings Growth Driven By Cost Management
• Pretax income of £44 million was up almost 20% on last year (slightly higher without week 53)
• Volume was down 1% (exc wk 53)• Price per barrel was down 6%• COGS per barrel was down 5%• Overheads were down 13%• We outperformed in the On-
Premise (+0.5%) and underperformed in the Off-Premise (-0.2%)
• We generated more than £70 million in cash
• Ignoring special items, Pretaxincome was up 9% on last year (local currency)
• Off-Premise volumes were impacted by our approach to pricing
• Pricing declines slowed as we moved through the year and Carling showed an increase for Q4
• We did an excellent job of managing costs and saved more than £20 million after inflation
• We invested heavily in brand building and innovation

42
2006 Summary – We Delivered What We Promised
• Continue to win in lager• Optimise profit
AND• Focus on costs
• We gained lager share• Rejected unprofitable Off-Premise
volume• Optimised profit• Exceeded all expectations on costs
We said we would We delivered
WHILE• Building for the future
• We began the roll out of the Cold Beer Stations with 13,000 On-Premise points
• Reviewed our existing portfolio• Filled our NPD pipeline• Launched C2• Increased investment in Asia

43
2006 Summary – We Gained Share, Rejected Unprofitable Deals and Optimised Profit
26.5%25.9%
25.2%24.8%
23.7%23.0% 22.8%
24.2%
25.3%
14.4%14.7%15.0%
14%
16%
18%
20%
22%
24%
26%
28%
Nov
-04
Dec
-04
Jan-
05
Feb-
05
Mar
-05
Apr-0
5
May
-05
Jun-
05
Jul-0
5
Aug
-05
Sep-
05
Oct
-05
Nov
-05
Dec
-05
Jan-
06
Feb-
06
Mar
-06
Apr-0
6
May
-06
Jun-
06
Jul-0
6
Aug
-06
Sep-
06
Oct
-06
Nov
-06
MA
T V
olum
e S
hare
(%)
Coors Lager S&N UK Lager Inbev Lager Carlsberg UK Lager
Dec 04 Nov 05vs vs
Dec 05 Nov 06
+0.3pp +0.6pp
+0.9pp +1.1pp
(1.0pp) (1.4pp)
(0.4pp) (0.3pp)
MAT Volume Share of lager - GB
SOURCE: A C Nielsen Total TradeMAT Nov 06
44
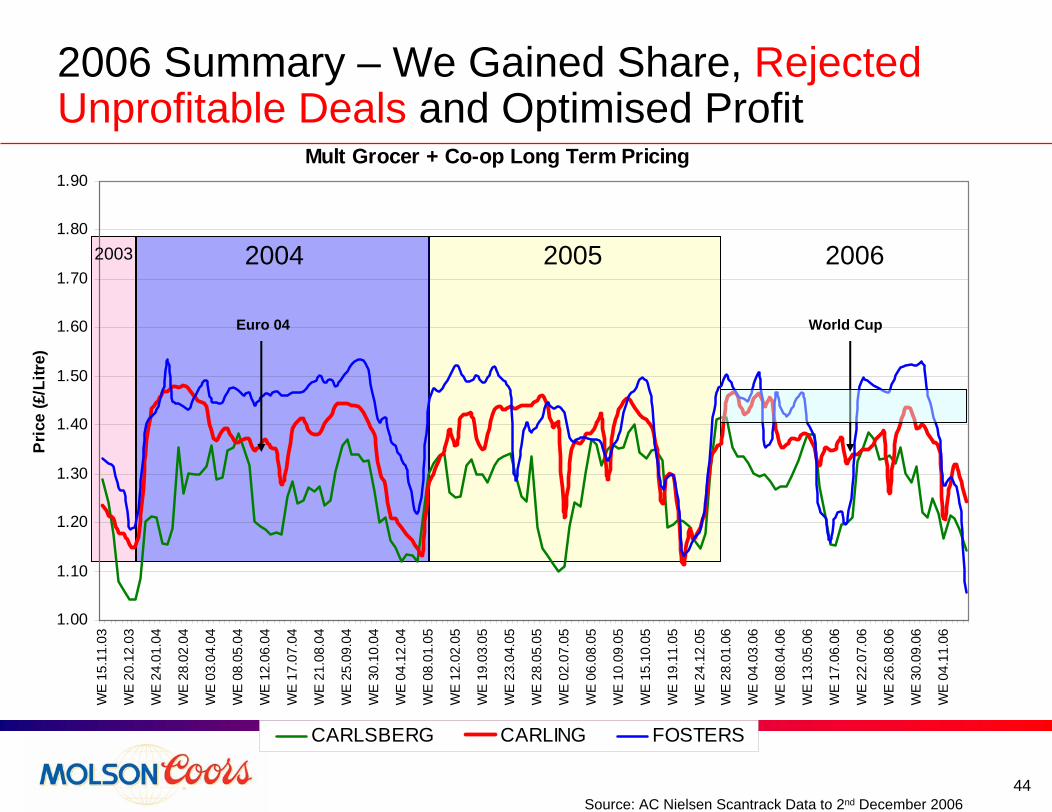
2006 Summary – We Gained Share, Rejected Unprofitable Deals and Optimised Profit
Mult Grocer + Co-op Long Term Pricing
1.00
1.10
1.20
1.30
1.40
1.50
1.60
1.70
1.80
1.90
WE
15.1
1.03
WE
20.1
2.03
WE
24.0
1.04
WE
28.0
2.04
WE
03.0
4.04
WE
08.0
5.04
WE
12.0
6.04
WE
17.0
7.04
WE
21.0
8.04
WE
25.0
9.04
WE
30.1
0.04
WE
04.1
2.04
WE
08.0
1.05
WE
12.0
2.05
WE
19.0
3.05
WE
23.0
4.05
WE
28.0
5.05
WE
02.0
7.05
WE
06.0
8.05
WE
10.0
9.05
WE
15.1
0.05
WE
19.1
1.05
WE
24.1
2.05
WE
28.0
1.06
WE
04.0
3.06
WE
08.0
4.06
WE
13.0
5.06
WE
17.0
6.06
WE
22.0
7.06
WE
26.0
8.06
WE
30.0
9.06
WE
04.1
1.06
Pric
e (£
/Litr
e)
CARLSBERG CARLING FOSTERS
20062004 20052003
World CupEuro 04
Source: AC Nielsen Scantrack Data to 2nd December 2006
45
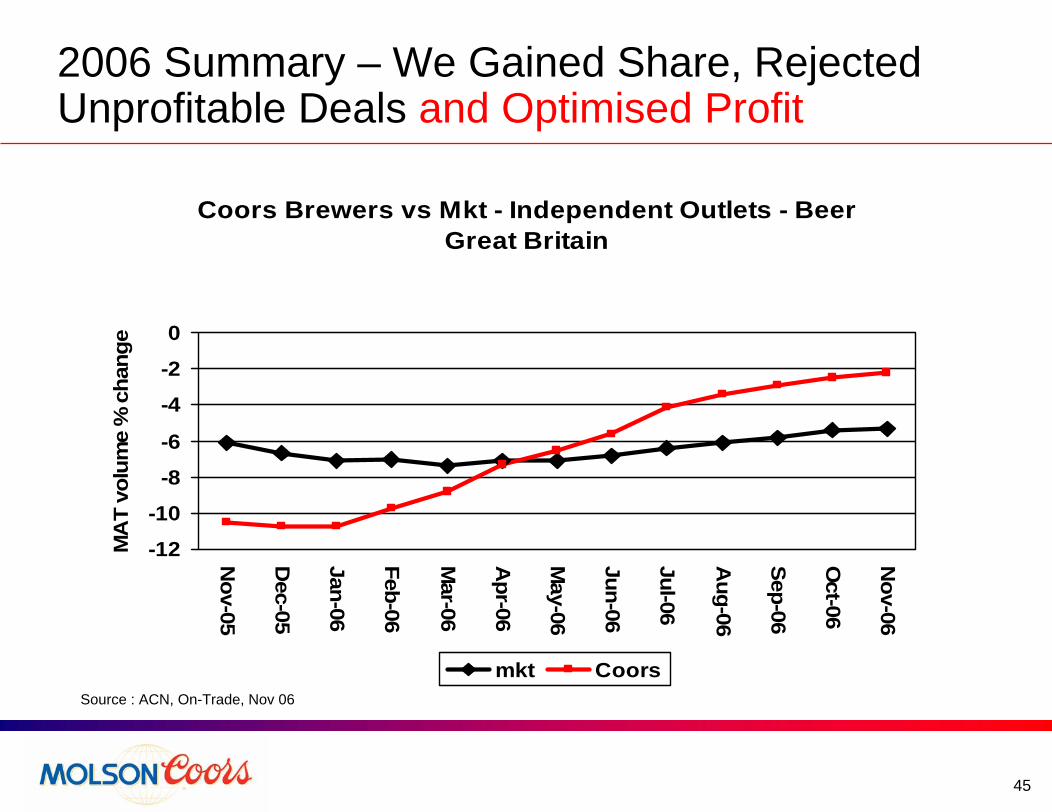
2006 Summary – We Gained Share, Rejected Unprofitable Deals and Optimised Profit
Coors Brewers vs Mkt - Independent Outlets - BeerGreat Britain
-12
-10
-8
-6
-4
-2
0
Nov-05
Dec-05
Jan-06
Feb-06
Mar-06
Apr-06
May-06
Jun-06
Jul-06
Aug-06
Sep-06
Oct-06
Nov-06
MA
T vo
lum
e %
cha
nge
mkt CoorsSource : ACN, On-Trade, Nov 06

46
2007 Platform
Market Dynamics
• Volume decline
• Pricing pressure
• Retailer power
• Inflationary pressure
• Smoking ban
2006 Tactical Response
• Win in lager
• Optimise profit
• Build for future
• Cost management
2007 & BeyondStrategic Platform• Build great brands
– Portfolio Management
– Innovation
• Cost management

47
Market Dynamics - UK Beer Market Volume Has Resumed its Downward Trend in the Last Two Years
32,000
34,000
36,000
38,000
40,000
42,000
80 81 82 83 84 85 86 87 88 89 90 91 92 93 94 95 96 97 98 99 00 '01 '02 '03 '04 '05 '06
000'
s br
ls
UK total trade beer volume consumption ‘000 UK barrels
Smoking ban will accelerate decline inOn Premise and growth in Off Premise
Overall impact estimated @ 2% of volume
SOURCE: Coors Insight based on BBPA data

48
Market Dynamics – Pricing Pressure from Retail Power and Competitive Set
-10
-8
-6
-4
-2
0
2
1st Qtr 2nd Qtr 3rd Qtr 4th Qtr
CarlingOwned Brands
• Trend shows a slowing rate of decline
CBL 2005/06 pricing by quarter

49
2007 Platform – Build Great BrandsPortfolio Management
• Carling - New creativeInvestment in propertiesC2 halo effect
• Coors Light - New productIncreased investment
• Grolsch - Re-based volumeRate of sale up 4-5%Green Light District – local campaign
• Sol - Building on 2006 success
• Cold Stations - 50,000 extra unitsPortfolio impact3% rate of sale increase


51
Carling ‘Belong’ Posters

52
Carling ‘Belong’ Posters

53
Carling ‘Belong’ Posters

54
2007 Platform – Build Great BrandsPortfolio Management
• Carling - All key measures up since campaign startBrand my friends rate +14%Recommend to others +25%
• Coors Light - New productIncreased investment
• Grolsch - Re-based volumeRate of sale up 4-5%Green Light District - local campaign
• Sol - Building on 2006 success
• Cold Stations - 50,000 extra unitsPortfolio impact3% rate of sale increase

55
2007 Platform – Build Great BrandsInnovation
• C2 - New categoryInnovation of year 2006Up-dateAdvertising
• Carling - Expanding Carling familyPremier Proven acceptability
Research 90% recognition
• Zatec/Palm/ - Import expansionKasteel Cru High margin On Premise
• Plug & Play - New channel development
• Freezer Friendly - Cold platformBottle
Our NPD pipeline
has never been so
full, with rollouts
planned up to the
end of 2008.

56
C2 Billboard

57
C2 Billboard

58
2007 Platform – Build Great BrandsInnovation
• C2 - New categoryInnovation of year 2006Up-dateAdvertising
• Carling - Expanding Carling familyPremier Proven acceptability
Research 90% recognition
• Zatec/Palm/ - Import expansionKasteel Cru High margin On Premise
• Plug & Play - New channel development
• Freezer Friendly - Cold platformBottle
Our NPD pipeline
has never been so
full, with rollouts
planned up to the
end of 2008.
59
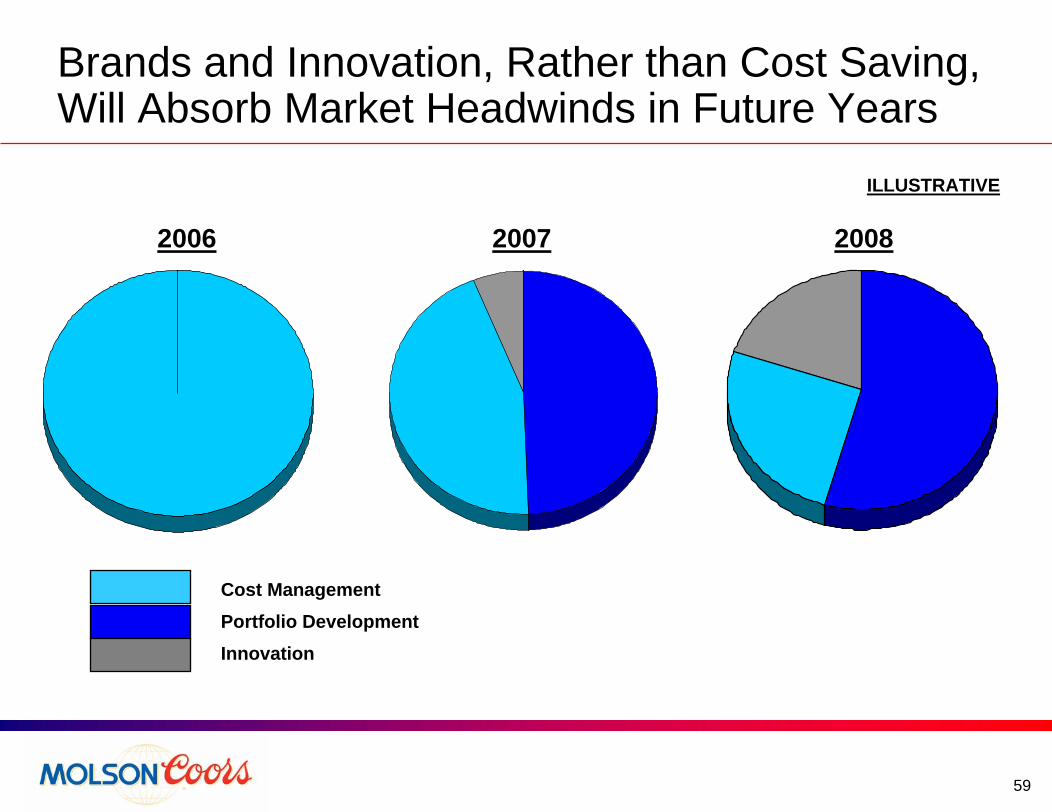
Brands and Innovation, Rather than Cost Saving, Will Absorb Market Headwinds in Future Years
ILLUSTRATIVE
Cost ManagementPortfolio DevelopmentInnovation
2006 2007 2008

Tim WolfGlobal CFO
Molson Coors Brewing Company

61
2006 Financial Headlines
• Progress in critical financial value drivers, positive earnings and cash momentum
• Closing out synergies, faster and above target • Increasing our momentum on cost reductions with
next generation cost opportunities: $250 million, 2007-09
• Exceeded cash, debt-reduction targets; disciplined cash use to drive value/returns

62
2006 Achievements Strengthen Foundation
• Tighter disciplines, management of cash/capital – Generated $448 million of cash for debt repayment– Sold $145 million of non-strategic assets: resources for growth – Improved working capital
• Improved funded status of pensions• Accelerated earnings close process by 3 weeks • Exceeded targets for synergies, other cost reductions:
– $104 million total, including $66 million of merger synergies
• Developed next generation cost programs: $250 million over 3 years

63
Revised Annual Cost SavingsUS$millions
2005 2006 2007 Total
Brewery & Logistics Network 10 21 32 63
Procurement 15 26 21+ 62+
General & Admin/Overheads 28 15 1 44
Information Technology 6 4 2+ 12+
Total 59 66 55-60 180-185
... AND at an accelerated pace, with nearly 70% of the savings ... AND at an accelerated pace, with nearly 70% of the savings realized in the first two yearsrealized in the first two years
Revised Accelerated Timeline
Merger Synergies in Home Stretch, Expected to Exceed Original $175 million Target.....

64
Annual Cost SavingsUS$millions
2007 2008 2009 Total
Global Supply Chain 50 60 65 175
Overheads, G&A 16 17 15 48
Concept Stage Ideas -- -- 27 27
Total 66 77 107 250
Total 43% larger than merger synergiesTotal 43% larger than merger synergies
Next Generation Cost Initiatives Total $250 million Over 3 years

65
Global OpportunitiesGlobal Standardization
• Actively exploring several areas – cans, bottles, adjunct, etc.
• Example of early success: crowns
• Lower cost – innovation sharing
$10M +
CBCSecondary Packaging
Alternatives• Lower cost, new creative design
possibilities• Actively exploring: Shrink wrap,
alternative board substrate
$5M - $10M
MolsonSecondary Packaging
Alternative• Lower cost, new creative design
possibilities• Actively exploring: From corrugated
to lower cost boxboard
$5M - $8M
CBLPrimary Packaging
Standardization• Savings in both material and
manufacturing efficiency• Implementing: From multiple to
single bottle profile
Up to $3M
Pursuing Breakthrough Procurement Initiatives

66
Brewing Operator
Packaging Operator
Maintenance Technician
Supervisor
Other
Multi-Skill,Empowered Technicians
One of WCM Initiatives – Technician Concept
WCM offers $50+ million of cost reductions in: • Lower energy usage• Waste reduction• Manufacturing efficiency • Improved service level
Raising Manufacturing Performance to World Class Levels

67
CBC
Golden Valley Optimization
Molson
Montreal Warehouse Automation
CBL
Optimization of Warehouse Work
Practices
$10M - $15M
$3M - $5M
Being implemented• Leverage valley wide logistics in Golden• Provides automation• Productivity improvements remove
constraints in Golden packaging
Being explored• Full pallet automation at Plant
Warehouse and Distribution center• Warehouse management systems
upgrade to enable automation
Implemented• Automation assessment led to labor
renegotiation • New work practices implemented • Market pay rate negotiated• Savings comparable to automation
achieved
$3M - $5M
Global
Internal and External
Benchmark and Opportunity Assessment
Leveraging Logistics

68
Canada Restructuring
Global Systems and Processes
Corporate Center Spending Reduction
Align functions globally
Standardize, streamline processes
Automate
Reduce costs, improve service
globally
$40-50M
Three Key Streams to Deliver Efficiency in G&A

69
Financial Strategies Drive Additional Profit
• Net interest expense $30-40 million lower by 2008– Debt repayment, company structure, financing
strategies
• Company structure: – Normalized effective tax rate 7% pts. lower than pre-
merger
Exploring additional opportunitiesExploring additional opportunities

70
2-Year Post-Merger Cash and Debt Recap
• MCBC opening net debt YE 2004PF* $2,676
Less: 2005 cash generation
Less: Brazil Kaiser debt**
Less: 2006 cash generation
(62)
(448)
Plus: FX impact (18)
• Equals: YE2006 net debt** $1,853
(295)
* Pro forma for the merger, including financing, tax, excess pension, and non-owned JV debt.
** Brazil debt and cash are reported in discontinued operations for historical periods.
(US$ millions)
TwoTwo--year cash flow of $743 million drives debt reductionyear cash flow of $743 million drives debt reduction

71
Cash Generation: Continuing Priority
• Major driver of shareholder value• Independent of need for debt reduction
– Continuing working-capital discipline– Continued focus on monetizing non-core assets– Disciplined capital expenditure
Objective Objective –– cash performance additive to base cash performance additive to base earningsearnings--driven returnsdriven returns

72
Base operating income (2006)* ~$0.66B
Depreciation & Amortization*
Non-cash stock compensation 0.03
Capital expenditures** (0.30)
Working capital/monetization 0.05
Tax and Interest (0.22)
Free Cash Flow (excl. profit growth) $0.60B
In 2007, other significant factors:
Excess pension contributions ($175M)
0.38
Working capital timing ($50M)
2007 free cash goal: $350+ million2007 free cash goal: $350+ million******
Cash Model – Example Normative Year
* Excluding special charges of $77.4 million in 2006. ** Excluding JV self-funded capital and resolution of UK keg supply.
*** Free Cash Flow, defined as Cash from Operating Activities, less Capital Spending, plus proceeds from Asset Sales (before dividend payments and option exercise proceeds).

73
Example Uses of Cash
Capital Structure• Selective debt
repayment• Modest share
repurchases• Dividends• Pension contributions
Base Growth• Market place
innovation• Tactical brand
investments• In-market new brands• Incremental capital
expenditure
Strategic/transformational• In-market opportunities• Select new
geographies• Infrastructure
Focus: Disciplined allocation of cashFocus: Disciplined allocation of cash

74
Summary: Winning in 2007
• Build on our momentum established in 2006• Close out merger synergies above target• Increase the momentum on costs with next-
generation initiatives • Generate substantial cash• Invest cash in growth opportunities with discipline
and focus on value creation for our shareholders
Driving financial performance and shareholder valueDriving financial performance and shareholder value

Leo KielyChief Executive Officer
Molson Coors Brewing Company

76
Molson Coors – Strategic Themes
1) Investing in our brands -- growing our business and making money.
2) Focusing on the fundamentals -- growing the top-line, reduce costs, improve productivity, strengthen our financial foundation.
3) Increasing global capabilities -- positioning ourselves to take advantage of opportunities that build our brands and grow our business.

77
Molson Coors – Building on Our Momentum
• Our brand growth strategies and cost-reduction efforts are strengthening our capabilities and financial performance
• We finished 2006 with even stronger brands, positive pricing, above target cost savings and cash generation
• The fundamentals and underlying strength of our company are strong
We can build on our momentum and progress toward becoming a
Top-Performing Global Brewer

Q&A
79