Embed Size (px)
Citation preview

Moles, Mass, and Volume Worksheet
As you work through the steps in the lab procedures, record your experimental values and theresults on this worksheet.
Table A: Popcorn Kernels Counted in 30 Seconds
Trial # 1 2 3 4 Average
# of kernels counted in 30 s
Table B: Mass of Popcorn and Marbles
Mass of empty beaker g
Mass of beaker and 12 popcorn kernels g
Mass of 12 popcorn kernels g
Mass of one popcorn kernels g/kernel
Mass of beaker and 12 marbles g
Mass of 12 marbles g
Mass of one marble g/kernel
c© 2011 Advanced Instructional Systems, Inc. and North Carolina State University 1

Table C: Volumes of Water and Marbles
Mass of 50 mL graduated cylinder g
Volume of water mL
Mass of cylinder and water g
Mass of water g
Density of water (mass/volume) g/mL
Initial volume of water in 100 mL graduated cylinder mL
Volume of water and 12 marbles in cylinder mL
Volume of 12 marbles mL
Mass of 12 marbles (From Part B) g
Density of the marbles (mass/volume) g/mL
c© 2011 Advanced Instructional Systems, Inc. and North Carolina State University 2

Flame Tests Worksheet
As you work through the steps in the lab procedures, record your experimental values and theresults on this worksheet.
Table A: Flame tests results of known and unknown salt solutions
Compound Color of Flame Ion Responsible for Flame Color
barium chloride, BaCl2
barium nitrate, Ba(NO3)2
calcium chloride, CaCl2
calcium nitrate, Ca(NO3)2
copper(II) chloride, CuCl2
copper(II) nitrate, Cu(NO3)2
lithium chloride, LiCl
lithium nitrate, LiNO3
potassium chloride, KCl
potassium nitrate, KNO3
sodium chloride, NaCl
sodium nitrate, NaNO3
strontium chloride, SrCl2
strontium nitrate, Sr(NO3)2
unknown#
unknown#
c© 2011 Advanced Instructional Systems, Inc. and North Carolina State University 3
Question 1: Which ion emitted the higher energy photons in the visible region: Cu2+ or Sr2+?Explain your answer.
Question 2: Which ion emitted photons with the longer wavelength in the visible region: Li+ orNa+? Explain your answer.
Question 3: Which ion emitted the lower frequency photons in the visible region: Ba2+ or K+?Explain your answer.
Question 4: The brilliant red color in fireworks is often due to the emission of red light from Sr2+.If the primary wavelength is 650 nm, what is the frequency of this light?
Question 5: From the data collected and the information gained in lecture, would the anion havea dramatic effect on the color of the light emitted? Explain your answer.
c© 2011 Advanced Instructional Systems, Inc. and North Carolina State University 4

Solutions and Spectroscopy Worksheet
As you work through the steps in the lab procedures, record your experimental values and theresults on this worksheet.
Part A: Determination of the Concentration of a Copper(II) Ion Solution
Complete the following table.
Data Table A: Calibration Curve of Cu2+ Solutions and Unknown
Stock Cu2+ solution concentration M
Solution#
TargetVolumeof Cu2+,
mL
ActualVolumeof Cu2+,
mL
TargetVolumeof H2O,
mL
ActualVolumeof H2O,
mL
[Cu2+], M(calculated)
Absorbanceat ∼620 nm(measured
to 3 sf)
1 1.20 4.80
2 2.40 3.60
3 3.60 2.40
4 4.80 1.20
Equation of Trendline (to three significant figures):y = x +
R2 =(to three significant figures)
Unknown #Absorbance at 620(measured) [Cu2+] (calculated) M
What is the concentration of Cu2+ in the solution that you prepared? Show your calculationsneatly.
c© 2011 Advanced Instructional Systems, Inc. and North Carolina State University 5

Would you predict the absorbance of Solution 2 to be greater or less than that of Solution 1?
Why?
What is the concentration of Cu2+ in your unknown solution? Show your calculation neatly onyour worksheet. Record this concentration in Data Table A. (Hint: Use the absorbance of theunknown and the trendline to solve for the Cu2+ concentration.)
Part B: Preparation of a Copper(II) ion Solution from Solid CuSO4 · 5 H2O
You desire to make a copper(II) solution at the same concentration as the unknown you justdetermined in Part A. How many grams of CuSO4 · 5 H2O are required to make 25.00 mL of thissolution?
Show your calculations neatly. Record the result as the target mass in Data Table B.
Data Table B: Preparation of a Cu2+ Solution from solid CuSO4 · 5 H2O
Target [Cu2+]from Part A,
M
Target MassCuSO4 · 5 H2O,
g
Actual MassCuSO4 · 5 H2O,
g
Absorbance ofCu2+ solution
at 620 nm
[Cu2+]calculated fromabsorbance, M
c© 2011 Advanced Instructional Systems, Inc. and North Carolina State University 6

Would you predict the absorbance of your solution made from solid to be greater than or less thanthat of the unknown solution?
Why?
Part C: Preparation of a Copper(II) Ion Solution by Dilution of a Stock CuSO4
Solution
You desire to make a copper(II) solution at the same concentration as the unknown you determinedin Part A. How many mL of the copper(II) stock solution are required to make 25.00 mL of thissolution?
Show your calculations neatly on your worksheet. Record the result as the target volume in DataTable C.
Table C: Preparation of a Cu2+ Solution from stock Cu2+ solution
Stock Cu2+ solution concentration M
Target [Cu2+]from Part A,
M
Target VolumeCu2+ solution,
mL
Actual VolumeCu2+ solution,
mL
Absorbance ofCu2+ solution
at 620 nm
[Cu2+]calculated fromabsorbance, M
c© 2011 Advanced Instructional Systems, Inc. and North Carolina State University 7

Would you predict the absorbance of your solution made from a dilution to be greater than or lessthan that of the unknown solution?
Why?
c© 2011 Advanced Instructional Systems, Inc. and North Carolina State University 8

Solubility Rules Worksheet
As you work through the steps in the lab procedures, record your experimental values and theresults on this worksheet.
Table A: Investigating Trends in Solubility
NH1+4 K1+ Ca2+ Sr2+ Mg2+ Al3+ Fe3+ Zn2+
Cl1−
ClO1−4
OH1−
CO2−3
SO2−4
PO3−4
Additional Observations:
Question 1: In general, are compounds containing ammonium ions or ions from Group 1 on thePeriodic Table soluble or insoluble?
c© 2011 Advanced Instructional Systems, Inc. and North Carolina State University 9

Question 2: What exceptions did you find to the Group 1 rule?
Question 3: Are compounds containing an ion with either a +1 or a -1 charge soluble or insoluble?
Question 4: What exceptions did you find to the charge rule?
Question 5: In general, are compounds containing the carbonate anion soluble or insoluble?
Question 6: What exceptions did you find to the carbonate ion rule?
Question 7: In general, are compounds containing the sulfate anion soluble or insoluble?
Question 8: What exceptions did you find to the sulfate ion rule?
c© 2011 Advanced Instructional Systems, Inc. and North Carolina State University 10

Question 9: In general, are compounds containing the phosphate anion soluble or insoluble?
Question 10: What exceptions did you find to the phosphate ion rule?
Question 11: Considering the general rules you found for Group 1 ions and phosphate ion, whichrule takes precedence?
Question 12: State a general rule that relates the solubility of an ionic compound with the chargeson the ions of which it is composed.
Question 13: In your Data Table A, write the chemical formula for any compound that precipi-tated. Pay attention to charges on the ions; the number of positive charges in the formula shouldequal the number of negative charges.
Question 14: Write balanced net ionic equations for reactions that produced a precipitate con-taining magnesium ion, (Mg2+).
c© 2011 Advanced Instructional Systems, Inc. and North Carolina State University 11
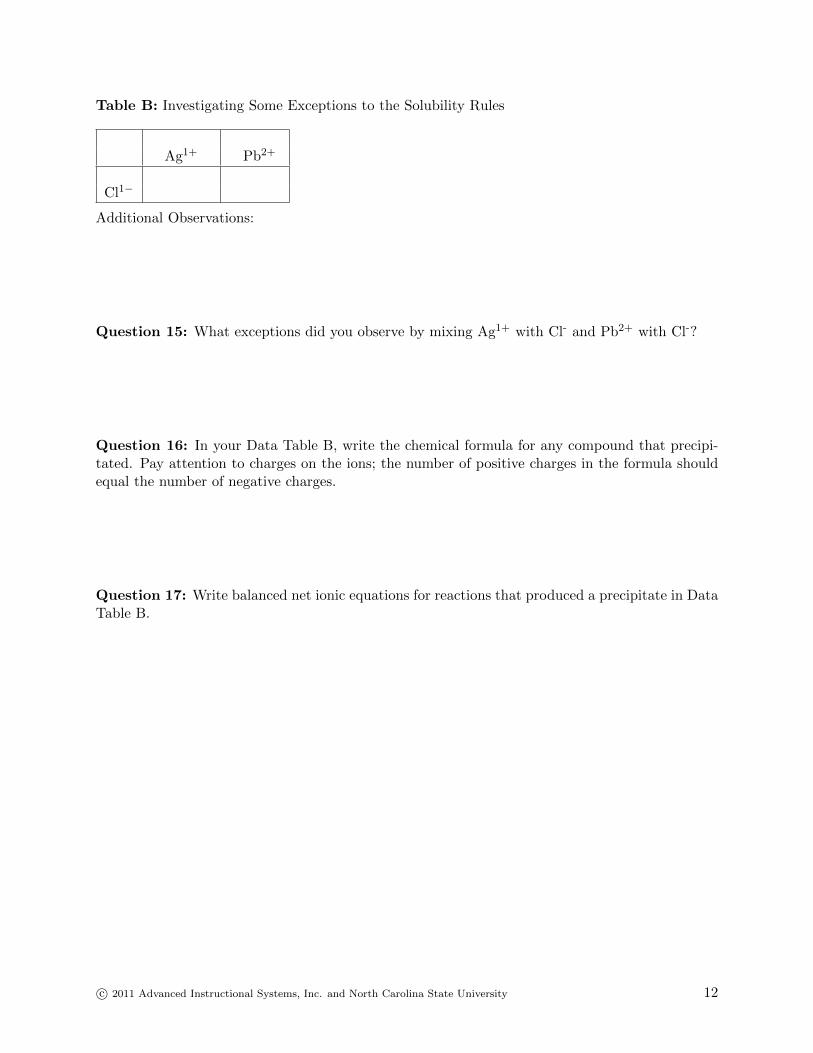
Table B: Investigating Some Exceptions to the Solubility Rules
Ag1+ Pb2+
Cl1−
Additional Observations:
Question 15: What exceptions did you observe by mixing Ag1+ with Cl- and Pb2+ with Cl-?
Question 16: In your Data Table B, write the chemical formula for any compound that precipi-tated. Pay attention to charges on the ions; the number of positive charges in the formula shouldequal the number of negative charges.
Question 17: Write balanced net ionic equations for reactions that produced a precipitate in DataTable B.
c© 2011 Advanced Instructional Systems, Inc. and North Carolina State University 12

Qualitative Analysis Worksheet
As you work through the steps in the lab procedures, record your experimental values and theresults on this worksheet.
Table A: Confirmatory Tests for Individual Ions*
Ion Part Solution Results of adding KI solution*
Ag1+ A Well plate solution
Ag1+ B solution from HCl
Ag1+ B solution from hot water
Ag1+ B solution from ammonia
Hg2+2 A Well plate solution
Hg2+2 B Solution from HCl
Hg2+2 B Solution from hot water
Hg2+2 B Solution from ammonia
Pb2+ A Well plate solution
Pb2+ B Solution from HCl
Pb2+ B Solution from hot water
Pb2+ B Solution from ammonia
*If there was a precipitate, rather than a clear solution, fill in this space with NA.
c© 2011 Advanced Instructional Systems, Inc. and North Carolina State University 13

Table B: Solubility of Individual Ions
Ag1+ Hg2+2 Pb2+
Soluble in HCl
Soluble in hot water
Soluble in ammonia
Question 1: Which ions, if any, can you separate by their solubility in HCl?
Question 2: Which ions, if any, can you separate by their solubility in hot water?
Question 3: Which ions, if any, can you separate by their solubility in NH3?
Question 4: How do your results from the confirmatory tests in Part A compare with the confir-matory tests performed on the solutions from individual ions in Part B? Can the observations beused to determine which ions are present in solution?
c© 2011 Advanced Instructional Systems, Inc. and North Carolina State University 14

Question 5: Complete the flow chart below for the known solutions. It will serve as a referenceas you test your separation scheme. At each branch in the flow chart, you should list the ions thatexist as solid compounds on the left, under the label “insoluble.” List ions that exist in solutionon the right, under the label “soluble.” There should be from zero to three entries on each line.At the end, the ions should be separated and each of the three ions should be present at differentplaces on the flow chart.
Figure 1: Flow Chart for Separation of Mixture of Ag+, Hg22+, Pb2+. Each “soluble” branch
should be tested with KI to confirm the presence of an ion.
Table C1: Solubility of a Mixture of Ag+, Hg22+, Pb2+
Mixture of Ag1+, Hg2+2 , Pb2+
Soluble in HCl
Soluble in hot water
Soluble in ammonia
c© 2011 Advanced Instructional Systems, Inc. and North Carolina State University 15

Table C2: Confirmatory Tests for Ions in Mixture of Ag+, Hg22+, Pb2+
Solution Results of adding KI solution
Supernatant from HCl addition
Supernatant from hot water
Supernatant from ammonia
Question 6: Based on your confirmatory tests, describe where the soluble ions ended up. Werethey where your flow chart predicted?
Table D1: Solubility of Unknown Mixture #
Unknown Mixture
Soluble in HCl
Soluble in hot water
Soluble in ammonia
Table D2: Confirmatory Tests for Ions in Unknown Mixture
Solution Results of adding KI solution
Supernatant from HCl addition
Supernatant from hot water
Supernatant from ammonia
Question 7: Unknown # contained the following ions: .
c© 2011 Advanced Instructional Systems, Inc. and North Carolina State University 16

Molecular Geometry Worksheet
As you work through the steps in the lab procedures, record your experimental values and theresults on this worksheet.
Table A: Exploring Simple Structures
MoleculesBond Bond Orders Bond Angles Hybridization on MolecularLengths (A) (◦) Central Atom Shape
N2ONN: NN:NO: NO:
SO2SO: SO:SO: SO:
CH2OCO: CO:CH: CH:CH: CH:
H2OOH: OH:OH: OH:
NH3
NH: NH:NH: NH:NH: NH:
CH4
CH: CH:CH: CH:CH: CH:CH: CH:
Question A1: For each of the six molecules, how did your Lewis structures compare to themolecular models and the models on the computer? Were they the same or different? Explain.
Question A2: For each of the six molecules, was your Lewis structure a good and accuraterepresentation of the molecule’s actual shape? Explain why or why not.
c© 2011 Advanced Instructional Systems, Inc. and North Carolina State University 17

Question A3: Did the model set and computer models help you identify the molecular shapebetter than the Lewis structures? Do you think models are helpful with 3D visualization?
Question A4: Did you have any other interesting observations? Please elaborate.
Table B: Bond Order vs Bond Length
MoleculesBond Lengths Bond Orders Hybridization(A) on Carbons
C2H6 CC: CC:
C2H4 CC: CC:
C2H2 CC: CC:
Question B1: What conclusions can you draw about bond order and bond length?
Question B2: Looking back at your data in Part A, are all single bonds the same length? Basedon these observations, can you make a generalization about the length of all single bonds comparedto double bonds or all double bonds compared to triple bonds? What general rule can you make?
Question B3: Did you have any other interesting observations? Please elaborate.
c© 2011 Advanced Instructional Systems, Inc. and North Carolina State University 18

Table C: Resonance Structures
MoleculesBond Lengths Bond Orders Bond Angles HybridizationLengths (A) (◦)
C6H6
CC: CC: CCC: C’s:CC: CC:CC: CC:CC: CC:CC: CC:CC: CC:
CO2−3
CO: CO: OCO: C:CO: CO:CO: CO:
SCN1− CS: CS: SCN: C:CN: CN:
Question C1: Which of the three molecules had resonance structures that were equal? Whichdid not? Explain.
Question C2: How can you confirm that the resonance structures are equal for a molecule?Explain.
Question C3: If there was a molecule with unequal resonance structures, which structure is thebest according to the computer modeling? Can you tell which structure the computer is displaying?How? Do your observations agree with what you have learned about formal charge?
Question C4: Did you have any other interesting observations? Please elaborate.
c© 2011 Advanced Instructional Systems, Inc. and North Carolina State University 19

Solid State Modeling Worksheet
As you work through the steps in the lab procedures, record your experimental values and theresults on this worksheet.
Question A1: Looking from above, how much of the atom is inside the shaded region?
Question A2: The corner of a cubic unit cell such as this one is defined by the center (nucleus) ofthe atom at the corner. How much of this atom is above the nucleus and inside the shaded region(inside the unit cell)?
Question A3: How many total atoms are inside the unit cell (defined by the centers of the eightspheres)?
Question A4: Using a ruler, measure the length of a side of your unit cell in cm. (Remember,the unit cell is defined by the nuclei of the atoms!) What is the volume of your unit cell?
Question A5: We will define “atom density” for our unit cells as the number of spheres that canpack into a cubic centimeter. What is the “atom density” (spheres/cm3) for your simple cubic cell?
c© 2011 Advanced Instructional Systems, Inc. and North Carolina State University 20

Question A6: Noting as before that the corner of the unit cell is defined by the nucleus of thisatom, how much of this atom is inside the unit cell?
Question A7: Focus on the layer 2 atom. How much of this atom is inside the unit cell?
Question A8: How many total atoms are inside the unit cell?
Question A9: Using a ruler, measure the length of a side for this unit cell. What is the volume(in cm3) of this unit cell?
Question A10: What is the “atom density” (spheres/cm3) for your body centered cubic cell?
Question A11:
a. Comparing this structure (body centered cubic) to the last structure (simple cubic), whichone appears to have less void volume?
b. Compare your observation to your calculated “atom densities” for these two structures. Doyour calculations confirm your observation?
c© 2011 Advanced Instructional Systems, Inc. and North Carolina State University 21

Question A12: Focus on a layer 2 atom. How much of this atom is inside the unit cell?
Question A13: How many total atoms are inside the unit cell?
Question A14: Using a ruler, measure the length of a side of this unit cell. What is the volume(in cm3) of this unit cell?
Question A15: What is the “atom density” (in spheres/cm3) for your face centered cell?
Question A16:
a. Comparing this structure (face centered cubic) to the last structure (body centered cubic),which one appears to have less void volume?
b. Compare your observation to your calculated “atom densities” for these two structures. Doyour calculations confirm your observation?
Question A17: Comparing the “atom densities” of all three cubic unit cells, rank them in packingefficiency, with the most efficiently packed cell listed first.
c© 2011 Advanced Instructional Systems, Inc. and North Carolina State University 22

Question B1: Focus on only the colorless spheres. What type of cubic structure do they appearto be arranged in?
Question B2: Focus on only the blue spheres. What type of cubic structure do they appear tobe arranged in? (You may need to build another set of layers 2 and to see this.)
Question B3:
a. How many colorless spheres are inside the unit cell?
b. How many blue spheres are inside the unit cell?
c. What is the ratio of colorless to blue spheres in the unit cell?
d. What is the chemical formula for sodium chloride?
e. Do your results in part c reflect the correct stoichiometry in sodium chloride?
f. Based on your knowledge of trends in ionic radii, which spheres represent sodium ions andwhich represent chloride ions?
Question B4:
a. Focus on the central, colorless sphere of layer 1’. How many blue spheres are in contact withit? (You may need to build another set of layers 2 and to see this.) This is its coordinationnumber.
c© 2011 Advanced Instructional Systems, Inc. and North Carolina State University 23
b. Focus on the central, blue sphere of layer . How many colorless spheres are in contact withit?
Question B5: Focus on only the colorless spheres. What type of cubic structure do they appearto be arranged in?
Question B6:
a. How many colorless spheres are inside the unit cell?
b. How many green spheres are inside the unit cell?
c. What is the ratio of colorless to green spheres in the unit cell?
d. What is the chemical formula for cesium chloride?
e. Do your results in part c reflect the correct stoichiometry in cesium chloride?
f. Based on your knowledge of trends in ionic radii, which spheres represent cesium ions andwhich represent chloride ions?
Question B7: Focus only on the cube made by the 8 green spheres.
a. What type of cubic structure do the green spheres appear to be arranged in?
b. What is the ratio of colorless to green spheres?
c© 2011 Advanced Instructional Systems, Inc. and North Carolina State University 24

Question B8: Using a ruler, compare the length of the side of a cube with colorless spheres onthe corners to one with green spheres.
a. Do they have the same volume?
b. Are these both acceptable unit cells for cesium chloride? Why or why not?
Question B9:
a. Focus on one of the green spheres in layer . How many colorless spheres are in contact withit?
b. Focus on the colorless sphere at the center of the green cornered cube. How many greenspheres are in contact with it?
Question B10:
a. Focus on only the colorless spheres. What type of cubic structure do they appear to bearranged in?
b. Focus on only the green spheres. What type of cubic structure do they appear to be arrangedin?
Question B11: Putting the two ions together in this arrangement gives the “fluorite” structure.The name is derived from the mineral fluorite, which contains calcium fluoride.
a. How many colorless spheres are inside the unit cell?
b. How many green spheres are inside the unit cell?
c. What is the ratio of colorless to green spheres in a unit cell?
c© 2011 Advanced Instructional Systems, Inc. and North Carolina State University 25

d. What is the chemical formula of calcium fluoride?
e. Do your results in part c reflect the correct stoichiometry in calcium fluoride?
f. Which spheres represent calcium ions and which represent fluoride ions?
c© 2011 Advanced Instructional Systems, Inc. and North Carolina State University 26

Freezing Point Depression Worksheet
As you work through the steps in the lab procedures, record your experimental values and theresults on this worksheet.
Complete the following tables and answer the questions below. (All masses must be reportedto three decimal places and all temperatures must be reported to one decimal place.)
Data Table A: Measuring the Freezing Point of Stearic Acid
Mass of 30 mL beaker g
Mass of 30 mL beaker plus stearic acid g
Mass of stearic acid g
Measured freezing point of stearic acid (first trial) ◦C
Measured freezing point of stearic acid (second trial) ◦C
Average measured freezing point to stearic acid ◦C
c© 2011 Advanced Instructional Systems, Inc. and North Carolina State University 27

Data Table B: Freezing Point Depression by a Solute, Lauric Acid
First Solution Second Solution
Mass of 30 mL beaker (from Part A) — —
Mass of 30 mL beaker and contents g g
Mass of 30 mL beaker plus stearic and lauric acids g g
Total mass of lauric acid g g
Colligative molality (mc) of the solution (Yourstearic acid mass from Table A is not accurate.Please use your original beaker tare and thenecessary data from Table B.)
m m
Predicted ∆Tf (Assume that kf is known totwo significant figures, 4.5◦C/m.)
◦C ◦C
Theoretical freezing point of the solution (Tocalculate, use the last entry for your aver-age freezing point from Data Table A to the0.1◦C.)
◦C ◦C
Measured freezing point of the solution ◦C ◦C
In Part B, for the first solution made by adding lauric acid, did you expect the freezing point to beat a higher or lower temperature than that of the pure solvent stearic acid?
Using your measured amounts of stearic acid and lauric acid for the first addition, calculate thecolligative molality (mc) of the resulting solution, the freezing point depression (∆Tf ) this molalityshould cause and the theoretical freezing point of the solution. Enter your results in Data TableB.
c© 2011 Advanced Instructional Systems, Inc. and North Carolina State University 28

In Part B, for the first solution made by adding lauric acid, how did your measured freezing pointcompare to your theoretical freezing point?
In Part B, for the first solution made by adding lauric acid, calculate the % difference. The equationfor percent difference is:
% difference = ((theoretical value − actual value) × 100%)/theoretical value.
A percent difference can be positive or negative.
% difference =
In Part B, for the second solution made by adding lauric acid, did you expect the freezing point tobe at a higher or lower temperature than that of the pure solvent stearic acid?
Using your measured amounts of stearic acid and lauric acid for the second addition, calculate thecolligative molality (mc) of the resulting solution, the freezing point depression (∆Tf) this molalityshould cause, and the theoretical freezing point of the solution. Enter your results in Data TableB.
c© 2011 Advanced Instructional Systems, Inc. and North Carolina State University 29

In Part B, for the second solution made by adding lauric acid, how did your measured freezingpoint compare to your theoretical freezing point?
In Part B, for the second solution made by adding lauric acid, calculate the % difference. Theequation for percent difference is:
% difference = ((theoretical value − actual value) × 100%)/theoretical value.
A percent difference can be positive or negative.
% difference =
c© 2011 Advanced Instructional Systems, Inc. and North Carolina State University 30

Equilibrium and Le Chatelier’s Principle PreLab Worksheet
As you work through the steps in the lab procedures, record your experimental values and theresults on this worksheet.
Table A: Observations for the Equilibrium: Fe3+ + SCN− FeSCN2+
Well # Stress Applied Observations Upon Applying Stress
1 None; control for comparison
2 Add 0.10 M Fe(NO3)3
3 Add 0.05 M NaSCN
4 Add 1.0 M AgNO3
5 Add 1.0 M NaNO3
Question 1: When Fe(NO3)3 was added to the system,
a. Which ion in the equilibrium system caused the “stress”?
b. Which way did the equilibrium shift?
c. What happened to the concentration of SCN−?
d. What happened to the concentration of FeSCN2+?
Question 2: When NaSCN was added to the system,
a. Which ion in the equilibrium system caused the “stress”?
b. Which way did the equilibrium shift?
c© 2011 Advanced Instructional Systems, Inc. and North Carolina State University 31

c. What happened to the concentration of Fe3+?
d. What happened to the concentration of FeSCN2+?
Question 3: When AgNO3 was added to the system, it caused the precipitation of solid AgSCN.
a. Which ion in the equilibrium had its concentration changed by addition of AgNO3?
b. Did the concentration of that ion increase or decrease?
c. When AgNO3 was added, which way did the equilibrium shift?
Question 4: When you added NaNO3, did anything happen? Can you explain this result?
Table B: Observations for the Equilibrium: CoCl2−4 + 6 H2O Co(H2O)2+6 + 4 Cl−
Exp’t Stress Applied Observations Upon Applying Stress
Well 1A Add 12 M HCl
Well 1B Add water
Well 2A Add 12 M HCl
Well 2B Add 1.0 M AgNO3
Beaker 1 Heat Solution
Beaker 2 Cool Solution
c© 2011 Advanced Instructional Systems, Inc. and North Carolina State University 32
Question 5: Adding HCl has the effect of adding Cl- ions to the system. When Cl- was added tothe system,
a. Which way did the equilibrium shift?
b. What happened to the concentration of CoCl2−4 ?
c. What happened to the concentration of Co(H2O)2+6 ?
Question 6: When water was added to the system,
a. Which way did the equilibrium shift?
b. What happened to the concentration of CoCl2−4 ?
c. What happened to the concentration of Co(H2O)2+6 ?
Question 7: When you added AgNO3, it caused the precipitation of solid AgCl.
a. Which ion in the equilibrium had its concentration changed by addition of AgNO3?
b. Did the concentration of that ion increase or decrease?
c. When AgNO3 was added, which way did the equilibrium shift?
Question 8: State a general rule concerning a system at equilibrium when more of one of thecomponents is added.
c© 2011 Advanced Instructional Systems, Inc. and North Carolina State University 33
Question 9: State a general rule concerning a system at equilibrium when one of the componentsis removed.
Question 10: For the CoCl2−4 + 6 H2O Co(H2O)2+6 + 4 Cl− Equilibrium
a. Which way did the equilibrium shift upon heating?
b. Which way did the equilibrium shift upon cooling?
c. A general rule concerning temperature changes to equilibrium systems is that the input ofenergy (raising the temperature) shifts the equilibrium to the higher energy side of the equilibrium.Based on your observations, which side of the equilibrium is the higher energy side?
d. Is the reaction, CoCl2−4 + 6 H2O Co(H2O)2+6 + 4 Cl− endothermic or exothermic?
c© 2011 Advanced Instructional Systems, Inc. and North Carolina State University 34

Titrations Worksheet
As you work through the steps in the lab procedures, record your experimental values and theresults on this worksheet.
Table A1: Titration of Vinegar
Trial 1 Trial 2 Trial 3
Mass of Flask g g g
Volume of Vinegar mL mL mL
Mass of Flask + Vinegar g g g
Mass of Vinegar g g g
Concentration of NaOH M NA NA
Initial Buret Reading mL mL mL
Final Buret Reading mL mL mL
Volume of Titrant Added mL mL mL
Question 1: Calculate the number of millimoles of NaOH required to reach the endpoint for eachtrial. Show one calculation completely. What is the average? Record the values in Data Table A2.
Question 2: How many millimoles of acetic acid are in each vinegar sample? Show one calculationcompletely. What is the average? Record the values in Data Table A2.
c© 2011 Advanced Instructional Systems, Inc. and North Carolina State University 35

Question 3: What is the mass of acetic acid in each vinegar sample? Show one calculationcompletely. What is the average? Record the values in Data Table A2.
Question 4: What is the molarity of acetic acid in each vinegar sample? Show one calculationcompletely. What is the average? Record the values in Data Table A2.
Question 5: What is the mass % of acetic acid in each vinegar sample? Show one calculationcompletely. What is the average? Record the values in Data Table A2.
Table A2: Calculation Results for Titration of Vinegar
Trial 1 Trial 2 Trial 3 Average
mmol of NaOH
mmol of HC2H3O2
Mass of HC2H3O2 g g g g
Molarity of HC2H3O2 in Vinegar M M M M
Mass % of HC2H3O2 in Vinegar
c© 2011 Advanced Instructional Systems, Inc. and North Carolina State University 36
Acid-Base Studies Worksheet
As you work through the steps in the lab procedures, record your experimental values and theresults on this worksheet.
Table A: pH Measurements of Some Common Acid and Base Solutions.
Solution # Solution pH
1 0.10 M HCl
2 0.010 M HCl
3 0.0010 M HCl
4 0.10 M HC2H3O2
5 0.10 M NaOH
6 0.010 M NaOH
7 0.10 M NH3
Question 1: Based on your observations in Data Table A, classify each of the following as a strongacid, strong base, weak acid or weak base.
a. HCl
b. HC2H3O2
c. NaOH
d. NH3
Question 2:
a. What happened to the pH when the 0.10 M HCl was diluted to 0.010 M?
b. What happened to the pH when the 0.10 M NaOH was diluted to 0.010 M?
c© 2011 Advanced Instructional Systems, Inc. and North Carolina State University 37

c. State a general rule about what happens to the pH of acidic or basic solutions when they arediluted with pure water.
Table B: Acidity and Basicity of Some Household Chemicals
Substance pH Acid, Base, or Neutral
Vinegar
Bleach
Vitamin C
Lemon Juice
Baking Soda
Dishwasher Detergent
Carbonated Water
Baking Powder
Ammmonia
Question 3:
a. List all of the household chemicals that you found to be acidic.
b. List all of the household chemicals that you found to be basic.
c. List all of the household chemicals that you found to be neutral.
c© 2011 Advanced Instructional Systems, Inc. and North Carolina State University 38

Table C: HCl + NaOH
mL NaOH pH
0.0
3.0
6.0
12.0
Question 4: Based on your observations in Data Table C, classify each of the resulting solutionsas acidic, basic or neutral.
a. HCl + 0.0 mL NaOH
b. HCl + 3.0 mL NaOH
c. HCl + 6.0 mL NaOH
d. HCl + 12.0 mL NaOH
c© 2011 Advanced Instructional Systems, Inc. and North Carolina State University 39

Measuring Enthalpy Changes Worksheet
As you work through the steps in the lab procedures, record your experimental values and theresults on this worksheet.Table A: Heat of Solution
Initial temperature of water ◦C
Temperature of solution after addition to CaCl2◦C
∆T1A (Tfinal - Tinitial) for dissolution of CaCl2◦C
Initial temperature of water ◦C
Temperature of solution after addition to NH4NO3◦C
∆T2A (Tfinal - Tinitial) for dissolution of NH4NO3◦C
Question 1: For dissolution of CaCl2, please answer a - c.
a. Was heat given off or absorbed? Could you feel it?
b. Was the process exothermic or endothermic?
c. Did the entropy increase, decrease, remain the same or can you not tell from your results?
Question 2: For dissolution of NH4NO3, please answer a - c.
a. Was heat given off or absorbed? Could you feel it?
b. Was the process exothermic or endothermic?
c. Did the entropy increase, decrease, remain the same or can you not tell from your results?
c© 2011 Advanced Instructional Systems, Inc. and North Carolina State University 40

Question 3: Which chemical would you use in a cold pack, CaCl2 or NH4NO3?
Table B: Heat of Reaction
Temperature Observations
Initial FeCl3 solution ◦C
Solution after addition of NaOH ◦C
∆T1B◦C
Question 4: For the reaction of FeCl3 and NaOH, please answer a - d.
a. What evidence indicates that a reaction occurred?
b. Did the reaction give off or absorb heat? Could you feel it?
c. Did the entropy increase, decrease, remain the same or can you not tell from your results?
d. Was the reaction spontaneous? Justify your answer.
c© 2011 Advanced Instructional Systems, Inc. and North Carolina State University 41

Table C: Heat of Neutralization
Temperature Observations
Initial NaOH solution ◦C
Solution after addition of water ◦C
∆T1C◦C
Solution after addition of HCl ◦C
∆T2C◦C
Solution after addition of HNO3◦C
∆T3C◦C
Solution after addition ofHC2H3O2◦C
∆T4C◦C
Question 5: In which test tubes was there evidence for a reaction?
Question 6:
a. Were the temperature changes about the same or very different for the reactions?
b. Can you account for this result? Hint: write the reaction equations and compare them.
Question 7: Did the entropy increase, decrease, remain the same or can you not tell from yourresults?
c© 2011 Advanced Instructional Systems, Inc. and North Carolina State University 42

Table D: Temperature and Time During the Heating of Water
Elapsedtime,min
Temperature,◦C
Observations
0.0
0.5
1.0
1.5
2.0
2.5
3.0
3.5
4.0
4.5
5.0
5.5
6.0
6.5
7.0
7.5
8.0
8.5
9.0
9.5
10.0
Elapsedtime,min
Temperature,◦C
Observations
13.0
13.5
14.0
14.5
15.0
15.5
16.0
16.5
17.0
17.5
18.0
18.5
19.0
19.5
20.0
20.5
21.0
21.5
22.0
22.5
23.0
c© 2011 Advanced Instructional Systems, Inc. and North Carolina State University 43

Elapsedtime,min
Temperature,◦C
Observations
10.5
11.0
11.5
12.0
12.5
Elapsedtime,min
Temperature,◦C
Observations
23.5
24.0
24.5
25.0
Record the following.
Time at which all the ice has (just) melted min
Time at which bubbles first appear min
Time at which steam first appear min
Time at which true boiling begins min
Question 8:
a. Were there times when the temperature stayed constant for several readings?
b. What was happening during these times?
c© 2011 Advanced Instructional Systems, Inc. and North Carolina State University 44

Question 9: What happened to the entropy of the system for each of the following processes? Didit increase greatly, increase slightly, decrease greatly, decrease slightly, stay the same or can younot tell from your results?
a. As the ice melted?
b. As the water was heated?
c. As the water boiled?
c© 2011 Advanced Instructional Systems, Inc. and North Carolina State University 45

Redox Reactions Worksheet
As you work through the steps in the lab procedures, record your experimental values and theresults on this worksheet.
Table A: Reactions of Oxidizing Agents
Cu2+ Mg2+ MnO1−4
H2O2
KI
Question 1: List the oxidizing agents in order, from weakest to strongest.
Question 2: Write half-reactions for the oxidizing agents in order, from weakest to strongest.(Hint: Remember that oxidizing agents get reduced.)
Table A2: Reactions of Reducing Agents
Cu Mg Zn
H2O2
KI
c© 2011 Advanced Instructional Systems, Inc. and North Carolina State University 46

Question 3: List the reducing agents in order, from strongest to weakest.
Question 4: Write the half-reactions for the reducing agents in order, from weakest to strongest.(Hint: Remember that reducing agents get oxidized.)
Question 5: The strongest oxidizing agent is said to have the most positive potential and thestrongest reducing agent has the most negative potential. Based on your observations, list all thehalf-reactions (as reductions) in order from most negative to most positive.
Question 6: Consider the reaction involving magnesium metal.
a. With what compound, element or ion did magnesium react?
b. Write a half-reaction for what happened to this chemical. You may use a Table of standardReduction Potentials1 for help.
c. Write the balanced equation for the reaction that occurred between magnesium metal andthis chemical.
Question 7: You also observed a reaction with zinc metal.
a. With what compound, element or ion did zinc react?
1../tables/tables.pdf
c© 2011 Advanced Instructional Systems, Inc. and North Carolina State University 47

b. Write a half-reaction for what happened to this chemical. You may use a Table of standardReduction Potentials2 for help.
c. Write the balanced equation for the reaction that occurred between zinc metal and thischemical.
Question 8: Based on your answers to Question 5, will either of these combinations produce areaction?
a. Cu + Mg2+
b. Cu2+ + Mg
Table B1: Cell Potentials vs a Cu2+/Cu Couple
ElectrochemicalCell
Half-Cell BeingStudied
Measured Potential Differencevs Cu2+/Cu in mV
Measured Potential Differencesvs Cu2+/Cu in V
Copper-Copper Cu2+/Cu
Silver-Copper Ag1+/Ag
Lead - Copper Pb2+/Pb
Zinc-Copper Zn2+/Zn
2../tables/tables.pdf
c© 2011 Advanced Instructional Systems, Inc. and North Carolina State University 48

Table B2: Cell Potentials in Order, with Half-Reactions
Half-Cell
Measured Cell Potential(Most negative to mostpositive)
Calculated Cell Potential vsSHE (Add +0.34 V)
Standard Reduction Potentialvs SHE from table
/ V V V
/ V V V
/ V V V
/ V V V
Question 9: Based on the order obtained by experiment,
a. Which species has the highest energy filled or partially filled orbitals?
b. Which species has the lowest energy unfilled or partially filled orbitals?
c. Which species is the strongest reducing agent?
d. Which species is the strongest oxidizing agent?
Question 10: Using the order you found in Data Table B2 for the cell potentials, write thehalf-reaction for each half-cell. Write the reactions as reductions.
Question 11: The Mg2+/Mg couple was not tested when measuring half-cell potentials. Basedon its behavior in Part A, where would you place it in Data Table B2? (If you are doing Part Bfirst, return to this question after completing both parts of the lab.
c© 2011 Advanced Instructional Systems, Inc. and North Carolina State University 49