Embed Size (px)
Citation preview

Molecular Weight Distributions of Asphaltenes andDeasphaltened Oils Studied by Laser DesorptionIonization and Ion Mobility Mass Spectrometry
Chris Becker,† Kuangnan Qian,‡ and David H. Russell*,†
Texas A & M University, P.O. Box 30012, College Station, Texas 77843, and ExxonMobil Research and EngineeringCompany, Annandale, New Jersey 08801
Laser desorption ionization (LDI) and ion mobility massspectrometry (IM-MS) are applied to study molecularweight distribution and cross sections of petroleum as-phaltene (ASPH) and deasphaltened oils (DAO). Ionmobility data confirmed the presence of gas-phase ag-gregation in LDI experiments. Most of the molecules withMW > 3000 g/mol in LDI result from gas-phase aggrega-tion. Two-dimensional (2D) IM-MS trend lines are com-pared with model polymer systems to confirm the orderof cross sections (polywax > polystyrene . DAO > ASPH. fullerenes), and these data illustrate that ASPH has amore condensed average structure than DAO.
Determining chemical compositions of heavy petroleum hasreceived growing attention in the research community, owing tothe depletion of light crude oil supplies and increasing demandfor hydrocarbon-based energy. Petroleum vacuum residue (PVR)is one type of heavy petroleum derived from vacuum distillationof crude oils. Nominally, all molecules in PVR boil above 540 °C.These heavy petroleum resources have a low H/C ratio and highS, N, O, and metal contents.1-4 PVR also contains a high level ofasphaltenes (typically defined as n-heptane insolubles). Effectiveproduction and utilization of these heavy hydrocarbon resourcesrequires better understanding of their chemical properties, includ-ing molecular weight distribution, functional groups, compositions,structures (e.g., condensed aromatic core versus two or threealkyl-bridged, small cores), etc.;5,6 however, even the determina-tion of molecular weight distributions of heavy petroleum samples,in particular that of asphaltene, is still problematic as reflectedby the large number of publications in this area.7-13 The difficultyarises as a result of the chemical nature of asphaltene samples
(∼50% boils above 700 °C and high polar content). Condensedphase aggregation of these molecules is well-known to have adirect impact on traditional MW measurement techniques, suchasgelpermeationchromatography14andvaporpressureosmometry.13,15,16
Although gas-phase aggregation of asphaltenes has been reportedfor various ionization techniques including laser desorption,8
electrospray,17,18 and field desorption ionization,12 uniquely es-tablishing the occurrence of aggregation is not straightforwardwhen dealing with crude petroleum samples.
Ion mobility spectrometry (IMS) is a gas-phase, postionizationseparation method that adds new dimensions to mass spectrom-etry (MS).19-22 IMS separates gas-phase ions based on theircollision cross section and, when coupled with mass (m/z)separation, has shown unique strength in differentiation of peptidemixtures,21,23-27 carbon clusters,28 and polymeric molecules29 thathave significant overlaps in mass chromatograms. IM-MS is oftenused in conjunction with advanced ionization tools such as matrix-
* Corresponding author. E-mail: [email protected]. Phone: 979-845-3345.
† Texas A & M University.‡ ExxonMobil Research and Engineering Company.
(1) Altgelt, K. H.; Boduszynski, M. M. Energy Fuels 1992, 6, 68–72.(2) Boduszynski, M. M. Energy Fuels 1987, 1, 2–11.(3) Boduszynski, M. M. Energy Fuels 1988, 2, 597–613.(4) Boduszynski, M. M.; Altgelt, K. H. Energy Fuels 1992, 6, 72–76.(5) Jaffe, S. B. Compositional based modeling. Presented at the 222nd National
Meeting of the American Chemical Society, Chicago, IL, 2001.(6) Jaffe, S. B.; Freund, H.; Olmstead, W. N. Ind. Eng. Chem. Res. 2005, 44,
9840–9852.(7) Schneider, M. H.; Ballard Andrews, A.; Mitra-Kirtley, S.; Mullins, O. C.
Energy Fuels 2007, 21, 2875–2882.(8) Hortal, A. R.; Hurtado, P.; Martinez-Haya, B.; Mullins, O. C. Energy Fuels
2007, 21, 2863–2868.
(9) Mullins, O. C. Abstracts of Papers, 232nd National Meeting of the AmericanChemical Society, San Francisco, CA, Sept 10-14, 2006; American ChemicalSociety: Washington, DC, 2006; PETR-169.
(10) Badre, S.; Goncalves, C. C.; Norinaga, K.; Gustavson, G.; Mullins, O. C.Fuel 2005, 85, 1–11.
(11) Cunico, R. L.; Sheu, E. Y.; Mullins, O. C. Pet. Sci. Technol. 2004, 22, 787–798.
(12) Qian, K.; Edwards, K. E.; Siskin, M.; Olmstead, W. N.; Mennito, A. S.;Dechert, G. J.; Hoosain, N. E. Energy Fuels 2007, 21, 1042–1047.
(13) Acevedo, S.; Gutierrez, L. B.; Negrin, G.; Pereira, J. C.; Mendez, B.; Delolme,F.; Dessalces, G.; Broseta, D. Energy Fuels 2005, 19, 1548–1560.
(14) Hall, G.; Herron, S. P. Adv. Chem. Ser. 1981, 195, 137–53.(15) Al-Jarrah, M. M. F.; Al-Dujaili, A. H. Fuel Sci. Technol. Int. 1989, 7, 69–
88.(16) Stubington, J. F.; Sergeant, G. D.; Barrett, D.; Do, P.T.D.H.; Raval, K. A.
Fuel 1995, 74, 79–82.(17) Qian, K.; Edwards, K. E.; Dechert, G. J.; Jaffe, S. B.; Green, L. A.; Olmstead,
W. N. Anal. Chem. 2008, 80, 849–855.(18) Qian, K. E.; Kathleen, E.; Diehl, John, H.; Green, Larry, A. Energy Fuels
2004, 18, 1784–1791.(19) Kanu, A. B.; Dwivedi, P.; Tam, M.; Matz, L.; Hill, H. H., Jr. J. Mass Spectrom.
2008, 43, 1–22.(20) Koeniger, S. L.; Merenbloom, S. I.; Valentine, S. J.; Jarrold, M. F.; Udseth,
H. R.; Smith, R. D.; Clemmer, D. E. Anal. Chem. 2006, 78, 4161–4174.(21) McLean, J. A.; Russell, D. H. Am. Biotechnol. Lab. 2005, 23 (18), 20–21.(22) McLean, J. A.; Ruotolo, B. T.; Gillig, K. J.; Russell, D. H. Int. J. Mass
Spectrom. 2005, 240, 301–315.(23) Valentine, S. J.; Plasencia, M. D.; Liu, X.; Krishnan, M.; Naylor, S.; Udseth,
H. R.; Smith, R. D.; Clemmer, D. E. J. Proteome Res. 2006, 5, 2977–2984.(24) Myung, S.; Wiseman, J. M.; Valentine, S. J.; Takats, Z.; Cooks, R. G.;
Clemmer, D. E. J. Phys. Chem. B 2006, 110, 5045–5051.(25) Baker, E. S.; Hong, J. W.; Gaylord, B. S.; Bazan, G. C.; Bowers, M. T. J. Am.
Chem. Soc. 2006, 128, 8484–8492.(26) Sudha, R.; Kohtani, M.; Jarrold, M. F. J. Phys. Chem. B 2005, 109, 6442–
6447.
Anal. Chem. 2008, 80, 8592–8597
10.1021/ac801473f CCC: $40.75 2008 American Chemical Society8592 Analytical Chemistry, Vol. 80, No. 22, November 15, 2008Published on Web 10/21/2008
assisted laser desorption ionization (MALDI)19,22,30 and electro-spray ionization (ESI)24 to analyze high molecular weight andhigh-polarity materials. In this work, we explore IM-MS coupledwith laser desorption ionization (LDI) for heavy petroleumcharacterization. Our primary interest is to differentiate aggregatesfrom true molecular ions and evaluate the utility of IM-MS formore accurate determination of asphaltene MW distributions and,possibly, differentiation of various asphaltene structures.
EXPERIMENTAL SECTIONThe asphaltene and deasphaltened oils (DAO) used in these
studies were obtained from Exxon Mobil Research and Engineer-ing Company. Asphaltene and DAO are separated by dissolvingPVR in n-heptane with a sample to solvent ratio of 1:10. Asphalteneis collected as n-heptane insolubles (28%). Elemental analyses wereobtained by Exxon Mobil laboratories via standard assay, andaromatic carbon content was determined by 13C NMR. Polystyrene1400 samples were purchased from Polymer Science Laboratory,and the polywax 650 was obtained from Aldrich. Samples wereprepared for LDI by dissolving a specific portion of the sample ineither benzene or toluene and spotting on an analysis plate usinga dried droplet technique.
LDI-MS spectra were acquired on an Applied Biosystems time-of-flight (TOF) STR mass spectrometer using a 337 nm nitrogenlaser (Spectra-Physics) at a firing rate of 20 Hz. Calibration ofthe nitrogen laser energy was performed using an Ophir Novapower/energy meter coupled to a PE-10 Ophir pyroelectric head.All LDI-MS experiments were performed using the same instru-ment settings. Analysis of petroleum samples by field desorptionmass spectrometry was conducted on a VG-ZAB mass spectrom-eter as described previously.12
The LDI-IM-MS used in these studies was constructed incollaboration with Ionwerks, Inc. (Houston, TX) and is similar toinstrumentation described previously.31-33 LDI was performedusing a frequency-tripled solid-state Nd:YAG laser (355 nm, PowerChip) operated at a frequency of 300 Hz. After LDI, ions areextracted into the drift cell under the influence of a weakelectrostatic field (10-20 V cm-1 Torr-1), and IMS separationsare carried out in a 15 cm long drift cell (periodic high-field/low-field regions) maintained at 1-10 Torr with He gas (measuredwith an Inficon capacitance manometer). In all IM-MS experi-ments, the LDI source is maintained at the same pressure as thedrift cell. Typical IMS field strengths were 10-20 V cm-1 Torr-1,and all measurements were performed at ambient temperature(ca. 23 °C). Ions eluting the drift cell were extracted into anorthogonal reflectron-TOF for mass analysis. The mass spectrom-eter was externally calibrated using C60, C70 (Sigma), and insulin(Sigma). Unless otherwise noted, all spectra were acquired at a
laser intensity equivalent to the observed signal threshold. Highlaser power (16 µJ/pulse) in these experiments corresponds toan intensity where the multichannel-plate detector was nearsaturation, and moderate laser power (8 µJ/pulse) was roughlybetween high and threshold intensities.
In many instances, it was necessary to compare IM-MS spectraof petroleums to that of other model compounds. Althoughcodepositions of these samples provide the most direct methodto accomplish this comparison, it is disadvantageous to allow theformation of coaggregates in the gas phase while conductingstudies of gas-phase aggregation. Where necessary, comparisonswere made through subsequent acquisitions for samples depositedadjacent to one another on a sample plate, followed by graphicallyoverlaying the resulting spectra using Ionwerks custom software.In these experiments, the arrival time distributions (ATD) of ionsat the detector are directly proportional to the ion-neutral collisioncross sections (CCS), as described by McDaniel and Mason.34
Molecular modeling was used to generate theoretical trendlines using polynuclear aromatic hydrocarbons (PAHs) as ana-logues for asphaltene molecules. Theoretical calculations wereperformed to optimize the structures of PAHs and their multimers.The energy of the structures was minimized using molecularmechanics calculations employing the cff02 force field in theCerius2 (Accelrys Software Inc.) modeling environment. Theoreti-cal CCS values were determined using the trajectory Monte Carlomethod in MOBCAL.35,36
RESULTS AND DISCUSSIONThe determined bulk composition of the two samples is
summarized in Table 1. Asphaltene shows increased S, N, metal,and aromatic carbon content and reduced H/C ratio as expected.Figure 1 contains the LDI mass spectra for asphaltene and DAOat three different laser intensities. These spectra were obtainedusing a standard high-resolution TOF mass spectrometer operatedat high vacuum. Spectra acquired at 3 µJ/pulse (Figure 1, partsA and D) correspond to data acquired near the ionizationthreshold. In general, LDI-MS data shows a lower MW distributionat threshold for these samples when compared to values by fielddesorption mass spectrometry (FD-MS). For example, analysisof the asphaltene sample by FD-MS reveals a MW distributionpeaked around m/z 900 ranging from 300 to 3000 m/z.12 Theresults from FD-MS shows a higher MW distribution than datafor LDI-MS at threshold, which shows a MW distribution peaked
(27) Sudha, R.; Jarrold, M. F. J. Phys. Chem. B 2005, 109, 11777–11780.(28) Scott, C. D.; Ugarov, M.; Hauge, R. H.; Sosa, E. D.; Arepalli, S.; Schultz,
J. A.; Yowell, L. J. Phys. Chem. C 2007, 111, 36–44.(29) Jackson, A. T.; Scrivens, J. H.; Williams, J. P.; Baker, E. S.; Gidden, J.;
Bowers, M. T. Int. J. Mass Spectrom. 2004, 238, 287–297.(30) Steiner, W. E.; Clowers, B. H.; English, W. A.; Hill, H. H., Jr. Rapid Commun.
Mass Spectrom. 2004, 18, 882–888.(31) Gillig, K. J.; Ruotolo, B.; Stone, E. G.; Russell, D. H.; Fuhrer, K.; Gonin,
M.; Schultz, A. J. Anal. Chem. 2000, 72, 3965–3971.(32) Gillig, K. J.; Russell, D. H. US Patent 6,639,213,2003.(33) Gillig, K. J.; Ruotolo, B. T.; Stone, E. G.; Russell, D. H. Int. J. Mass Spectrom.
2004, 239, 43–49.
(34) McDaniel, E. W.; Mason, E. A. The Mobility and Diffusion of Ions in Gases;Wiley, 1973.
(35) Mesleh, M. F.; Hunter, J. M.; Shvartsburg, A. A.; Schatz, G. C.; Jarrold,M. F. J. Phys. Chem. 1996, 100, 16082.
(36) Shvartsburg, A. A.; Jarrold, M. F. Chem. Phys. Lett. 1996, 261, 86.
Table 1. Sample Properties for the Petroleum VacuumResidue Components: Asphaltene (ASPH) andDeasphaltened Oils (DAO), 28 and 72 wt % of PVR,Respectively
samples ASPH DAO
S (wt %) 7.8 5.0N (wt %) 1.2 0.5Ni, ppm 341 72V, ppm 841 166H/C 1.2 1.5% aromatic carbon 46.5 29.5
8593Analytical Chemistry, Vol. 80, No. 22, November 15, 2008

at m/z 600 ranging from m/z 350 to 2500 (Figure 1A). Thesedifferences in MW distribution are similar to LDI analysis by otherresearch groups, which report lower MW distributions byLDI-MS,9,12,37 and may arise from the differences in responsefactor for molecular weight and compound type between the twotechniques. Increasing the laser energy reveals additional spectralfeatures in both the low and high end of the MW distribution,e.g., compare the moderate (8 µJ/pulse) and high (16 µJ/pulse)laser-intensity spectra of Figure 1, parts B and C, and parts E andF, respectively). The change in MW distribution is most notablefor asphaltene samples where increasing the laser intensityextended the MW distribution to about ∼7000 m/z (not shown)at 18 µJ/pulse instead of ∼2500 m/z, as observed at thresholdintensities. A correlation between MW distribution and laserintensity was also observed for the DAO sample. Herod and co-workers have previously described a bimodal, high MW compo-nent (>50 000 m/z) present in petroleum samples using sizeexclusion chromatography.38,39 This high MW distribution wasalso observed by the same group using LDI-MS under certaininstrumental conditions (i.e., linear mode and reduced detectorgain); however, we did not observe the ultrahigh MW distributionin the current study for our petroleum samples with conditionssimilar to that described in the literature.38,39
We attribute the observed change in MW distribution to gas-phase phenomenon rather than preexisting species that becomeionized only at the higher laser intensity. That is, the increase insignal for low molecular weight species arises from fragmentationcaused by the higher laser energies (i.e., higher laser energyresults in ions having higher internal energies which are releasedthrough fragmentation). Furthermore, the increase in high-mass
signal may arise from the presence of gas-phase aggregates. High-mass ion signal is more pronounced in LDI spectra of asphaltenesthan DAO (Figure 1), and asphaltenes are known to have a highertendency for aggregation (i.e., higher aromaticity and more polarfunctionalities than DAO). The regularly spaced peaks presenton the tailing edge of the MW distributions observed at higherlaser power (Figure 1C) correspond to intervals of 24 m/z (carbonclusters) which have been previously observed.40 Althoughevidence for gas-phase aggregation of asphaltenes in LDI-MSstudies has been reported elsewhere,8,37 the true nature of highmolecular weight components in asphaltene samples has beendebated, and there is not sufficient evidence by LDI-MS alone toexclude preexisting higher-mass species.
In an effort to address the issue of gas-phase aggregationdirectly, vacuum residue samples were analyzed by LDI-IM-MS.Figure 2 contains the IM-MS spectra of an asphaltene sampleoverlaid with the spectra acquired from deposited fullerenes. Mostnotable in this data is the MW distribution of the asphaltenesample, which extends up to m/z greater than 15 000. This resultwas surprising considering there is no signal in this region foranalogous LDI-MS experiments that do not incorporate mobility.We attribute this appearance of high MW signal to the higherpressure of the IMS experiment. In high-vacuum LDI-MS, ionsare formed and transferred to the TOF mass spectrometer withoutexperiencing collisions with a neutral gas molecule. When a bathgas is present, as in the LDI-IM-MS experiments, desorbed ionswill experience numerous cooling collisions as they are extractedinto the drift cell. With these cooling collisions, energy that wouldotherwise be released through declustering processes is trans-ferred to the bath gas, thereby stabilizing aggregates that arepresent in the gas phase.
On close inspection of Figure 2, the drift-time distributionbroadens around m/z 2500, then returns to typical peak widths
(37) Pomerantz, A. E.; Hammond, M. R.; Morrow, A. L.; Mullins, O. C.; Zare,R. N. J. Am. Chem. Soc. 2008, 130, 7216–7217.
(38) Herod, A. A.; Bartle, K. D.; Kandiyoti, R. Energy Fuels 2007, 21, 2176–2203.
(39) Millan, M.; Behrouzi, M.; Karaca, F.; Morgan, T. J.; Herod, A. A.; Kandiyoti,R. Catal. Today 2005, 109, 154–161.
(40) Rizzi, A.; Cosmina, P.; Flego, C.; Montanari, L.; Seraglia, R.; Traldi, P. J.Mass Spectrom. 2006, 41, 1232–1241.
Figure 1. LDI of asphaltene and deasphaltened oil (DAO) at various laser energies: (A and D) 3 µJ/pulse, (B and E) 8 µJ/pulse, and (C andF) 16 µJ/pulse (threshold, moderate, and high laser intensities, respectively).
8594 Analytical Chemistry, Vol. 80, No. 22, November 15, 2008
for petroleum samples at higher values of m/z. The change indrift-time distributions (∼m/z 2500) also corresponds to a changein trend-line slope, exhibiting a steeper slope for ion signal below2500 m/z than at higher m/z values. A probable explanation isthat this broadening and slope change arises from the superim-position of more than one trend line at this mass-mobility range,one trend line resulting from monomers, and a second resultingfrom higher-order aggregates. The slope of higher MW speciesis lower, indicative of tighter packing for “sheets” of low molecularweight monomers. This interpretation is consistent with previousreports41,42 which demonstrated that aggregation of asphaltenesoccurs via π-stacking interactions, which can lead to a blocklikeformation, with significantly higher mobility than a correspondingquasi-planar structure of the same molecular weight.
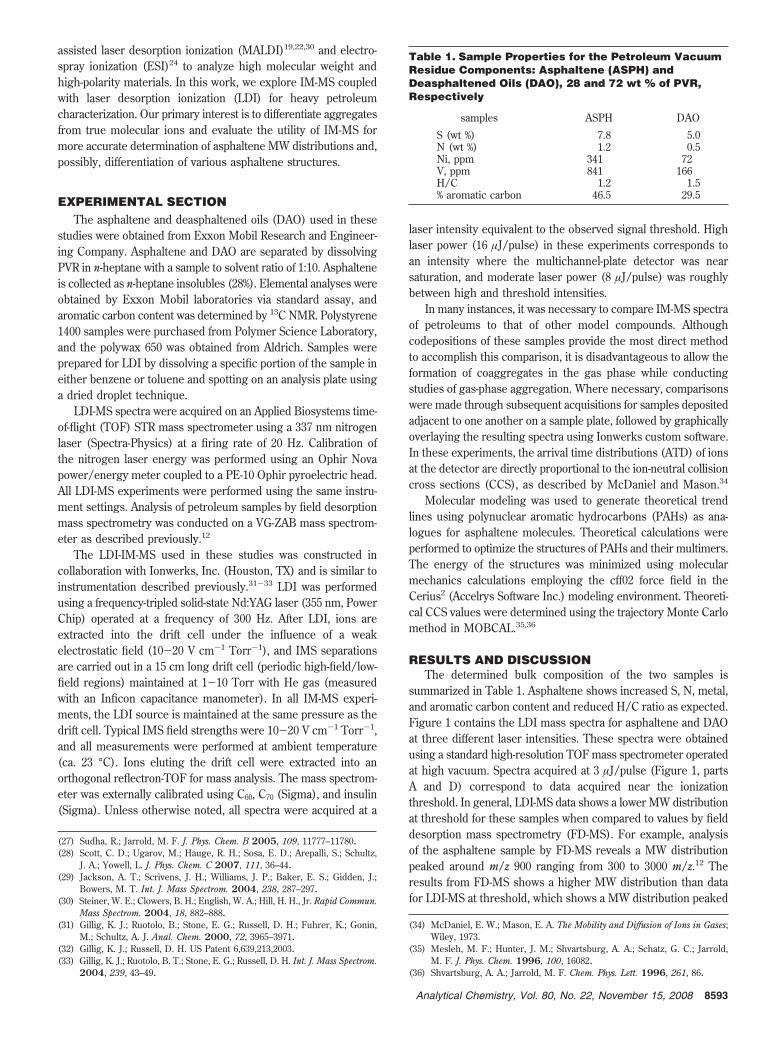
Analysis of the trend-line width and slope, as well as theabsence of signal in LDI-MS experiments, agrees well with theinterpretation that the higher m/z component consists primarilyof single-charged aggregates. In addition, the IM-MS experimentprovides opportunity to further probe the high m/z species.Assuming the presence of a bath gas is responsible for theobservation of higher-mass clusters (as discussed above), then adirect correlation between the pressure in the LDI-IMS sourceand the high MW signal is expected. To investigate the pressureeffect, pressure in the drift cell and LDI source was varied whilemaintaining threshold laser power and constant field strength (15V cm-1 Torr-1) in the drift cell and source region. The results ofthese experiments are plotted in Figure 3 and demonstrate anincrease in the high-mass ion signal as the pressure in the driftcell is increased, agreeing well with a gas-phase aggregationhypothesis; i.e., a pressure increase of the bath gas enhances theeffect of collisional cooling, thereby increasing the probability ofobserving aggregates. Note that there are no new spectral featuresin the two-dimensional (2D) IM-MS projections at higher pressure(Figure 3C), indicating that the increase in signal is occurringonly in the region attributed to gas-phase aggregates.
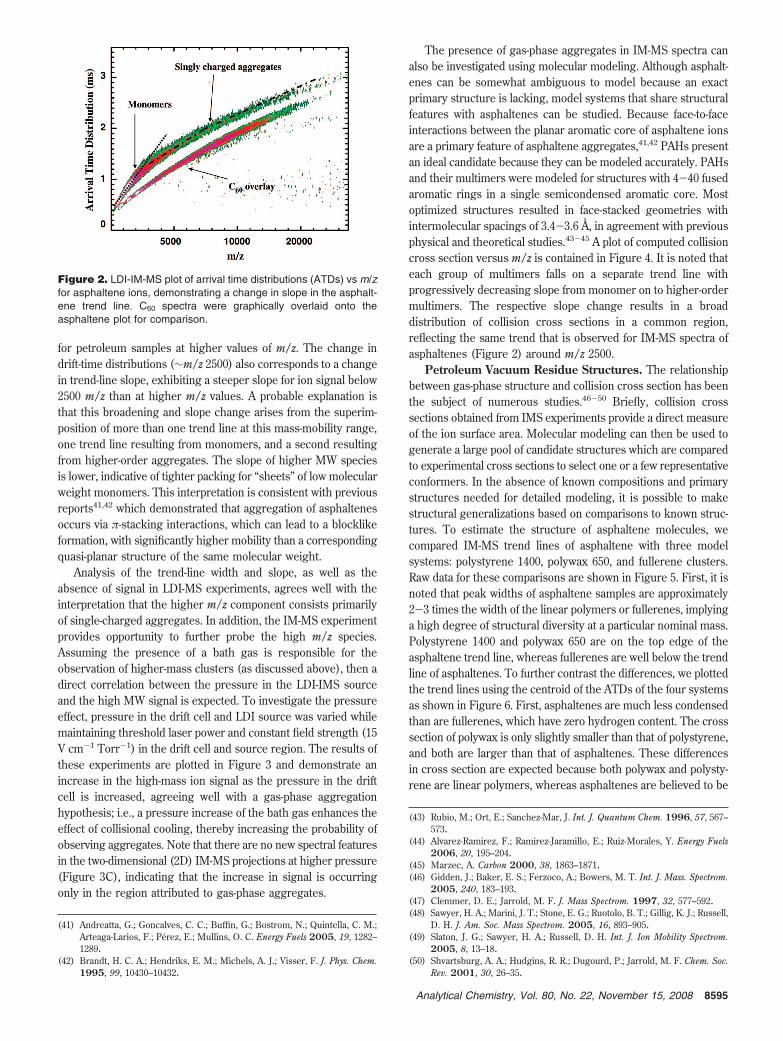
The presence of gas-phase aggregates in IM-MS spectra canalso be investigated using molecular modeling. Although asphalt-enes can be somewhat ambiguous to model because an exactprimary structure is lacking, model systems that share structuralfeatures with asphaltenes can be studied. Because face-to-faceinteractions between the planar aromatic core of asphaltene ionsare a primary feature of asphaltene aggregates,41,42 PAHs presentan ideal candidate because they can be modeled accurately. PAHsand their multimers were modeled for structures with 4-40 fusedaromatic rings in a single semicondensed aromatic core. Mostoptimized structures resulted in face-stacked geometries withintermolecular spacings of 3.4-3.6 Å, in agreement with previousphysical and theoretical studies.43-45 A plot of computed collisioncross section versus m/z is contained in Figure 4. It is noted thateach group of multimers falls on a separate trend line withprogressively decreasing slope from monomer on to higher-ordermultimers. The respective slope change results in a broaddistribution of collision cross sections in a common region,reflecting the same trend that is observed for IM-MS spectra ofasphaltenes (Figure 2) around m/z 2500.
Petroleum Vacuum Residue Structures. The relationshipbetween gas-phase structure and collision cross section has beenthe subject of numerous studies.46-50 Briefly, collision crosssections obtained from IMS experiments provide a direct measureof the ion surface area. Molecular modeling can then be used togenerate a large pool of candidate structures which are comparedto experimental cross sections to select one or a few representativeconformers. In the absence of known compositions and primarystructures needed for detailed modeling, it is possible to makestructural generalizations based on comparisons to known struc-tures. To estimate the structure of asphaltene molecules, wecompared IM-MS trend lines of asphaltene with three modelsystems: polystyrene 1400, polywax 650, and fullerene clusters.Raw data for these comparisons are shown in Figure 5. First, it isnoted that peak widths of asphaltene samples are approximately2-3 times the width of the linear polymers or fullerenes, implyinga high degree of structural diversity at a particular nominal mass.Polystyrene 1400 and polywax 650 are on the top edge of theasphaltene trend line, whereas fullerenes are well below the trendline of asphaltenes. To further contrast the differences, we plottedthe trend lines using the centroid of the ATDs of the four systemsas shown in Figure 6. First, asphaltenes are much less condensedthan are fullerenes, which have zero hydrogen content. The crosssection of polywax is only slightly smaller than that of polystyrene,and both are larger than that of asphaltenes. These differencesin cross section are expected because both polywax and polysty-rene are linear polymers, whereas asphaltenes are believed to be
(41) Andreatta, G.; Goncalves, C. C.; Buffin, G.; Bostrom, N.; Quintella, C. M.;Arteaga-Larios, F.; Perez, E.; Mullins, O. C. Energy Fuels 2005, 19, 1282–1289.
(42) Brandt, H. C. A.; Hendriks, E. M.; Michels, A. J.; Visser, F. J. Phys. Chem.1995, 99, 10430–10432.
(43) Rubio, M.; Ort, E.; Sanchez-Mar, J. Int. J. Quantum Chem. 1996, 57, 567–573.
(44) Alvarez-Ramirez, F.; Ramirez-Jaramillo, E.; Ruiz-Morales, Y. Energy Fuels2006, 20, 195–204.
(45) Marzec, A. Carbon 2000, 38, 1863–1871.(46) Gidden, J.; Baker, E. S.; Ferzoco, A.; Bowers, M. T. Int. J. Mass. Spectrom.
2005, 240, 183–193.(47) Clemmer, D. E.; Jarrold, M. F. J. Mass Spectrom. 1997, 32, 577–592.(48) Sawyer, H. A.; Marini, J. T.; Stone, E. G.; Ruotolo, B. T.; Gillig, K. J.; Russell,
D. H. J. Am. Soc. Mass Spectrom. 2005, 16, 893–905.(49) Slaton, J. G.; Sawyer, H. A.; Russell, D. H. Int. J. Ion Mobility Spectrom.
2005, 8, 13–18.(50) Shvartsburg, A. A.; Hudgins, R. R.; Dugourd, P.; Jarrold, M. F. Chem. Soc.
Rev. 2001, 30, 26–35.
Figure 2. LDI-IM-MS plot of arrival time distributions (ATDs) vs m/zfor asphaltene ions, demonstrating a change in slope in the asphalt-ene trend line. C60 spectra were graphically overlaid onto theasphaltene plot for comparison.
8595Analytical Chemistry, Vol. 80, No. 22, November 15, 2008
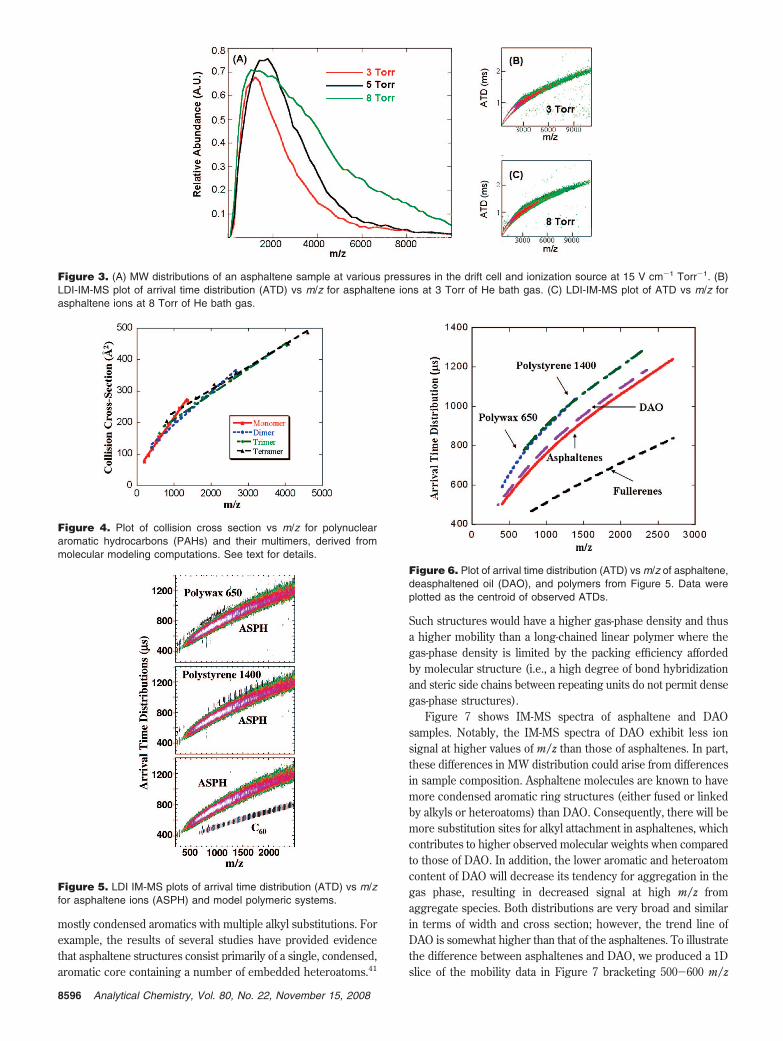
mostly condensed aromatics with multiple alkyl substitutions. Forexample, the results of several studies have provided evidencethat asphaltene structures consist primarily of a single, condensed,aromatic core containing a number of embedded heteroatoms.41
Such structures would have a higher gas-phase density and thusa higher mobility than a long-chained linear polymer where thegas-phase density is limited by the packing efficiency affordedby molecular structure (i.e., a high degree of bond hybridizationand steric side chains between repeating units do not permit densegas-phase structures).
Figure 7 shows IM-MS spectra of asphaltene and DAOsamples. Notably, the IM-MS spectra of DAO exhibit less ionsignal at higher values of m/z than those of asphaltenes. In part,these differences in MW distribution could arise from differencesin sample composition. Asphaltene molecules are known to havemore condensed aromatic ring structures (either fused or linkedby alkyls or heteroatoms) than DAO. Consequently, there will bemore substitution sites for alkyl attachment in asphaltenes, whichcontributes to higher observed molecular weights when comparedto those of DAO. In addition, the lower aromatic and heteroatomcontent of DAO will decrease its tendency for aggregation in thegas phase, resulting in decreased signal at high m/z fromaggregate species. Both distributions are very broad and similarin terms of width and cross section; however, the trend line ofDAO is somewhat higher than that of the asphaltenes. To illustratethe difference between asphaltenes and DAO, we produced a 1Dslice of the mobility data in Figure 7 bracketing 500-600 m/z
Figure 3. (A) MW distributions of an asphaltene sample at various pressures in the drift cell and ionization source at 15 V cm-1 Torr-1. (B)LDI-IM-MS plot of arrival time distribution (ATD) vs m/z for asphaltene ions at 3 Torr of He bath gas. (C) LDI-IM-MS plot of ATD vs m/z forasphaltene ions at 8 Torr of He bath gas.
Figure 4. Plot of collision cross section vs m/z for polynucleararomatic hydrocarbons (PAHs) and their multimers, derived frommolecular modeling computations. See text for details.
Figure 5. LDI IM-MS plots of arrival time distribution (ATD) vs m/zfor asphaltene ions (ASPH) and model polymeric systems.
Figure 6. Plot of arrival time distribution (ATD) vs m/z of asphaltene,deasphaltened oil (DAO), and polymers from Figure 5. Data wereplotted as the centroid of observed ATDs.
8596 Analytical Chemistry, Vol. 80, No. 22, November 15, 2008
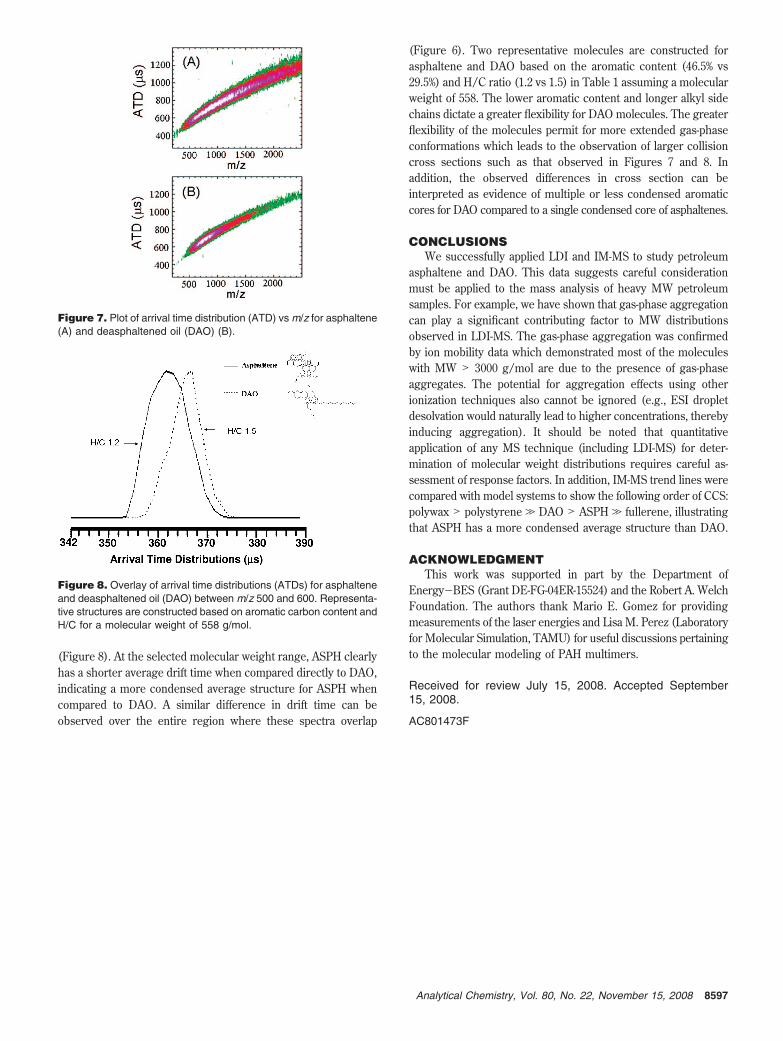
(Figure 8). At the selected molecular weight range, ASPH clearlyhas a shorter average drift time when compared directly to DAO,indicating a more condensed average structure for ASPH whencompared to DAO. A similar difference in drift time can beobserved over the entire region where these spectra overlap
(Figure 6). Two representative molecules are constructed forasphaltene and DAO based on the aromatic content (46.5% vs29.5%) and H/C ratio (1.2 vs 1.5) in Table 1 assuming a molecularweight of 558. The lower aromatic content and longer alkyl sidechains dictate a greater flexibility for DAO molecules. The greaterflexibility of the molecules permit for more extended gas-phaseconformations which leads to the observation of larger collisioncross sections such as that observed in Figures 7 and 8. Inaddition, the observed differences in cross section can beinterpreted as evidence of multiple or less condensed aromaticcores for DAO compared to a single condensed core of asphaltenes.
CONCLUSIONSWe successfully applied LDI and IM-MS to study petroleum
asphaltene and DAO. This data suggests careful considerationmust be applied to the mass analysis of heavy MW petroleumsamples. For example, we have shown that gas-phase aggregationcan play a significant contributing factor to MW distributionsobserved in LDI-MS. The gas-phase aggregation was confirmedby ion mobility data which demonstrated most of the moleculeswith MW > 3000 g/mol are due to the presence of gas-phaseaggregates. The potential for aggregation effects using otherionization techniques also cannot be ignored (e.g., ESI dropletdesolvation would naturally lead to higher concentrations, therebyinducing aggregation). It should be noted that quantitativeapplication of any MS technique (including LDI-MS) for deter-mination of molecular weight distributions requires careful as-sessment of response factors. In addition, IM-MS trend lines werecompared with model systems to show the following order of CCS:polywax > polystyrene . DAO > ASPH . fullerene, illustratingthat ASPH has a more condensed average structure than DAO.
ACKNOWLEDGMENTThis work was supported in part by the Department of
Energy-BES (Grant DE-FG-04ER-15524) and the Robert A. WelchFoundation. The authors thank Mario E. Gomez for providingmeasurements of the laser energies and Lisa M. Perez (Laboratoryfor Molecular Simulation, TAMU) for useful discussions pertainingto the molecular modeling of PAH multimers.
Received for review July 15, 2008. Accepted September15, 2008.
AC801473F
Figure 7. Plot of arrival time distribution (ATD) vs m/z for asphaltene(A) and deasphaltened oil (DAO) (B).
Figure 8. Overlay of arrival time distributions (ATDs) for asphalteneand deasphaltened oil (DAO) between m/z 500 and 600. Representa-tive structures are constructed based on aromatic carbon content andH/C for a molecular weight of 558 g/mol.
8597Analytical Chemistry, Vol. 80, No. 22, November 15, 2008