Embed Size (px)
Citation preview
Molecular studies of initial atmospheric corrosion of
copper
Exploration of ultra‐sensitive techniques for the inhibiting effect of self
assembled monolayers, and the effect of gamma radiation
Saman Hosseinpour
Doctoral Thesis in Corrosion Science
Royal Institute of Technology
Stockholm, Sweden. December 2013
ii
Akademisk avhandling som med tillstånd av Kungliga Tekniska Högskolan
framlägges till offentlig granskning för avläggande av teknologie
doktorsexamen den 20 december 2013 kl 10 i KTH, Brinellvägen 8,
Kollegiesallen, Stockholm.
Title: Molecular studies of initial atmospheric corrosion of copper Exploration of ultra‐sensitive techniques for the inhibiting effect of self assembled monolayers, and the effect of gamma radiation
TRITA‐CHE Report 2013:50 ISSN 1654‐1081 ISBN 978‐91‐7501‐950‐5
KTH Royal Institute of Technology
School of Chemical Science and Engineering
Surface and Corrosion Science
Drottning Kristinas väg 51
SE‐10044, Stockholm, Sweden
Denna avhandling är skyddad enligt upphovsrättslagen. Alla rättigheter
förbehålles.
Copyright ©2013 Saman Hosseinpour. All rights reserved. No part of this thesis
may be reproduced by any means without permission from the author.
The following items are reprinted with permission:
PAPER I: © 2011 American Chemical Society PAPER II: © 2012 American Chemical Society PAPER III: © 2013 American Chemical Society PAPER IV: © 2013 Electrochemical Society PAPER V: © 2013 Electrochemical Society PAPER VI: © 2013 Electrochemical Society PAPER VII: © 2012 Electrochemical Society PAPER VIII: © 2013 Elsevier Printed at US‐AS, Stockholm 2013
iii
Abstract
Atmospheric corrosion indoors is of great practical importance for the degradation of metals, for example in electronics, military equipment, and cultural heritage items. It involves a wide range of chemical, electrochemical, and physical processes occurring in gas, liquid, and solid phases, and at the interfaces between them. Hence, a molecular understanding of the fundamental interactions during atmospheric corrosion is of utmost importance.
Copper is one of the most used metals in electrical contacts, power generators, heat exchangers, etc. and is prone to indoor atmospheric corrosion. Although corrosion and oxidation of copper in the presence of corrosion stimulators is thermodynamically inevitable, there are ways to reduce the kinetics of corrosion and oxidation reactions.
Self assembled monolayers (SAMs) of organic molecules, when adsorbed on copper surfaces, have proven to be efficient barriers against copper corrosion. However, understanding at the molecular level of the initial stages of corrosion of SAM covered copper in atmospheric corrosion conditions is lacking. The main reason is the inability of the conventional analytical methods to detect and characterize very thin corrosion products formed during the initial stages (from seconds to days) of atmospheric corrosion of SAM covered copper. To overcome this situation a highly surface sensitive technique, vibrational sum frequency spectroscopy (VSFS), has been utilized in situ and ex situ in this thesis to detect and follow the oxidation of alkanethiol SAM covered copper in dry air as well as to assess the conformational changes of SAM molecules during oxidation. A very sensitive gravimetric method, quartz crystal microbalance with dissipation monitoring (QCM‐D), and a highly sensitive and versatile optical technique, nanoplasmonic sensing (NPS), were combined in situ with VSFS to quantify this very slow oxidation process. This combination allowed the heterogeneity of the oxidation process as well as the mass and the rigidity of the corrosion products to be detected simultaneously.
To address indoor atmospheric corrosion conditions where carboxylic acids play an important role we next studied the interaction between SAM covered copper and humidified air, to which formic acid was added. The in situ identification of the corrosion products and their formation kinetics was done using near surface sensitive infrared reflection/absorption spectroscopy (IRAS), and the effect of hydrocarbon chain length in alkanethiol SAMs on their corrosion protection efficiency was investigated. The effect of the anchoring group in the SAMs on their corrosion protection efficiency was studied for hexaneselenol using ‐SeH as the anchoring group, and the results were compared with its thiol counterpart, hexanethiol, with ‐SH as the anchoring group. Complementary in situ and ex situ VSFS measurements were performed to assess the quality of the SAMs before, during, and after exposure.
It was shown that the SAMs of alkanethiols greatly inhibited the formation of copper (I) oxide and slowed down the formation of other corrosion products, i.e. copper formate and copper hydroxid. This was due to a selective hindrance of the corrosion

iv
stimulators, oxygen, water, and formic acid molecules reaching the copper‐SAM interface. The corrosion inhibiting effect increased with the hydrocarbon chain length. The SAMs of hexaneselenols, on the other hand, exhibited an accelerated formation of copper (I) oxide, copper formate and copper hydroxide compared to an unprotected surface as a result of the partial removal of hexaneselenol molecules from the copper surface during prolonged exposure.
The experience gained in characterizing and quantifying thin copper oxides was further used to explore the influence of gamma (γ) radiation on copper corrosion in anoxic water. This multi‐analytical approach included IRAS, cathodic reduction, confocal Raman microscope, atomic force microscopy, scanning electron microscopy, x‐ray photoelectron spectroscopy, and inductively coupled plasma ‐ atomic emission spectroscopy. The results clearly showed that copper dissolution as well as the oxide layer thickness increase with gamma radiation under the exposure conditions.
v
Sammanfattning
Atmosfärisk korrosion under inomhusförhållanden är av stor praktisk betydelse på grund av dess inverkan på exempelvis vårt kulturarv i museimiljöer, tillförlitligheten hos elektronik i olika industriella sammanhang, eller militär utrustning förvarad i olika förråd. Den atmosfäriska korrosionen styrs av ett brett spektrum av kemiska, elektrokemiska och fysikaliska processer som äger rum i tre faser: atmosfären, den tunna fuktfilmen på objektytan och den fasta fasen, samt i de bägge fasgränserna mellan de tre faserna. För att kunna hitta motmedel mot korrosionen är det av yttersta vikt att öka den molekylära förståelsen för dessa processer.
Koppar är en mycket använd metall i elektriska eller elektroniska komponenter, i värmeväxlare eller VVS-sammanhang, som beslag och i en rad olika dekorer. Metallen korroderar eller oxiderar spontant i många korrosiva miljöer, men det finns ett brett spektrum av metoder för att minska korrosions- eller oxidationshastigheten. Monoskikt av tätpackade självassocierande organiska molekyler (engelska: self assembled monolayers, förkortat SAM) adsorberade på kopparytan har visat sig vara effektiva barriärer för kopparkorrosion. Den molekylära insikten i dessa monoskikts funktionssätt för att minska den atmosfäriska korrosionen är dock ännu rätt så begränsad. Den främsta orsaken är oförmågan hos mer etablerade analytiska metoder att kunna karakterisera de ytterst små mängder av korrosionsprodukter som bildas under den atmosfäriska korrosionens inledande skeenden upp till några dagars exponering.
Den extremt ytkänsliga och i korrosionssammanhang fortfarande relativt oprövade analysmetoden summafrekvensspektroskopi (engelska: vibrational sum frequency spectroscopy, förkortat VSFS) har därför använts för att under pågående exponering följa det mycket långsamma oxidationsförlopp som uppstår när koppar, skyddat av något organiskt monoskikt, exponeras för torr luft. VSFS har även kunnat användas för att under pågående oxidation följa strukturella förändringar hos monoskiktet. För att kvantifiera en så långsam oxidationsprocess har även en annan extremt masskänslig metod kunnat kombineras med VSFS, en kvartskristallmikrovåg med s.k. dissipationsövervakning, förkortat QCM-D. Ytterligare en i korrosionssammanhang oprövad men lika masskänslig teknik har kunnat kombineras med VSFS. Den metoden besitter än så länge bara ett engelskt namn, nanoplasmonic sensing (NPS). Kombinationen VSFS–QCM-D–NPS har utnyttjats i en serie unika försök, där inte bara de ytterst långsamma oxidationshastigheterna kunnat mätas upp, utan även andra viktiga faktorer såsom graden av heterogenitet i den bakomliggande oxidationsprocessen.
För att närma sig en miljö som kan efterlikna korrosiva inomhusförhållanden har atmosfären i nästa steg befuktats och dessutom har låga halter av myrsyra tillsats. Just tillsatsen av karboxylsyror har visat sig generera korrosionsprodukter med en sammansättning som på koppar och vissa andra metaller efterliknar de som bildas under atmosfärisk korrosion inomhus. Identifiering av korrosionsprodukter och deras tillväxthastighet på koppar, skyddat av olika långa tätpackade kolkedjor med en tiolgrupp i ena ändan som binder till kopparsubstratet, har kunnat ske med infraröd reflektions-absorptionsspektroskopi (IRAS) under in situ-förhållanden. Ju längre kolvätekedjor desto större korrosionsinhibieringsförmåga kunde påvisas. När den på koppar förankrade tiolgruppen ersattes med en selenolgrupp blev korrosionsinhibieringsförmågan sämre. Kompletterande mätningar in situ och ex situ utfördes med hjälp av VSFS för att undersöka kvaliteten på de tätpackade kolvätekedjorna, varvid kunde påvisas att graden av tätpackning hos kolkedjorna försämrades med ökad exponeringstid.
vi
Förutom den allmänna nedbromsningen av korrosionshastigheten på koppar blev sammansättningen av bildade korrosionsprodukter på oskyddat koppar en annan än på koppar skyddat av tioler. I det förra fallet detekterades korrosionsprodukterna koppar(I)oxid, koppar(II)format och koppar(II)hydroxid, under det att ingen koppar(I)oxid påvisades på skyddat koppar, endast små mängder koppar(II)format och koppar(II)hydroxid kunde detekteras. De adsorberade kolkedjorna tycks hindra de korrosionsstimulerande molekylerna vatten, myrsyra och syrgas från att nå kopparytan lika effektivt. När de tiolförankrade kolvätekedjorna ersattes med selenolförankrade kolvätekedjor desorberades en del kolvätekedjor från kopparsubstratet vid längre exponeringstider. Resultatet blev att mängden korrosionsprodukter nu blev signifikant större än på oskyddat koppar, sannolikt på grund av galvanisk korrosion.
Erfarenheterna från detta doktorsarbete vad gäller kvantifiering av små mängder kopparoxider har även utnyttjats för att undersöka inverkan av -strålning på kopparkorrosion i rent vatten. Härvid användes ett multianalytiskt angreppssätt bestående av IRAS, katodisk reduktion, konfokal Ramanmikroskopi, atomkraftsmikroskopi, svepelektronmikroskopi, fotoelektronspektroskopi, samt analys av utlöst mängd koppar i vattenlösningen med induktivt kopplad plasmaatomemissionsspektroskopi. Resultaten visar tydligt att utlösningen av koppar, liksom det bildade oxidskiktets tjocklek, ökar med -strålningen under rådande exponeringsförhållanden.
vii
List of papers
I. Initial Oxidation of Alkanethiol‐Covered Copper Studied by Vibrational
Sum Frequency Spectroscopy
Saman Hosseinpour, Jonas Hedberg, Steven Baldelli, Christofer Leygraf,
and Magnus Johnson
J. Phys. Chem. C; 2011, 115, 23871–23879
II. Integration of Quartz Crystal Microbalance with Vibrational Sum
Frequency Spectroscopy−Quan fica on of the Ini al Oxida on of
Alkanethiol‐Covered Copper
Saman Hosseinpour, Markus Schwind, Bengt Kasemo, Christofer Leygraf,
and Magnus Johnson
J. Phys. Chem. C; 2012, 116, 24549−24557
III. Combined in Situ Quartz Crystal Microbalance with Dissipation
Monitoring, Indirect Nanoplasmonic Sensing, and Vibrational Sum
Frequency Spectroscopic Monitoring of Alkanethiol‐Protected Copper
Corrosion
Markus Schwind, Saman Hosseinpour, Magnus Johnson, Christoph
Langhammer, Igor Zorić, Christofer Leygraf, and Bengt Kasemo
Langmuir; 2013, 29, 7151−7161
IV. Nanoplasmonic Sensing for Monitoring the Initial Stages of
Atmospheric Corrosion of Cu Nanodisks and Thin Films
Markus Schwind, Saman Hosseinpour, Christoph Langhammer, Igor
Zoric, Christofer Leygraf, and Bengt Kasemo
J. Electrochem. Soc.; 2013, 160 (10), C487‐C492

viii
V. Alkanethiols as Inhibitors for the Atmospheric Corrosion of Copper
Induced by Formic Acid: Effect of Chain Length
Saman Hosseinpour, Magnus Johnson, and Christofer Leygraf
J. Electrochem. Soc.; 2013, 160 (6), C270‐C276
Paper V was selected as a “TECH HIGHLIGHT” in The Electrochemical
Society Interface; Vol. 22, No. 3, Fall 2013
VI. Self‐Assembled Monolayers as Inhibitors for the Atmospheric
Corrosion of Copper Induced by Formic Acid: A Comparison between
Hexanethiol and Hexaneselenol
Saman Hosseinpour, Mats Göthelid, Christofer Leygraf, and Magnus
Johnson.
J. Electrochem. Soc.; 2014, 161 (1), C1‐C7
VII. Radiation Induced Corrosion of Copper in Anoxic Aqueous Solution
Åsa Björkbacka, Saman Hosseinpour, Christofer Leygraf, and Mats
Jonsson
Electrochemical and Solid‐State Letters; 2012, 15 (5), C5‐C7
VIII. Radiation Induced Corrosion of Copper for Spent Nuclear Fuel Storage
Åsa Björkbacka, Saman Hosseinpour, Magnus Johnson, Christofer
Leygraf, and Mats Jonsson
Radiation Physics and Chemistry; 2013, 92, 80–86
ix
Conference presentations based on the results from this thesis
IX. In Situ Surface Analysis of Octadecanethiol on Copper, Eurocorr 2011,
Stockholm, Sweden.
X. Molecular Studies of Self Assembled Monolayers as Corrosion Inhibitors
for Copper, ECS meeting 2013, San Francisco, USA.
XI. In Situ Monitoring of Ultra Slow Oxide Growth on Copper Protected by a
Self Assembled Monolayer, ECS meeting 2013, San Francisco, USA.
XII. 2013 European Corrosion Medal Award lecture by Christofer Leygraf
was to a large extent based on the current thesis work.
Other publications not included in the thesis
XIII. Monolayer Study by VSFS: In Situ Response to Compression and Shear
in Contact
Ahmed Ghalgaoui, Ryosuke Shimizu, Saman Hosseinpour, Rubén
Alvarez Asencio, Clayton McKee, Magnus Johnson, and Mark Rutland.
Submitted manuscript
XIV. Translated book: Mechanical Behavior of Engineering Materials:
Metals, Ceramics, Polymers, and Composites; Rosler J., Harders H.,
Baker M., 2012, ISBN: 978‐964‐90138‐3‐1.
Translated to Farsi by: Mohammad Esmaeelian, Saman Hosseinpour,
Alireza Modarresi
XV. Translated book: Protective Coatings for Turbine Blades; Tamarin Y.,
2010, ISBN: 978‐964‐223‐535‐3.
Translated to Farsi by: Saman Hosseinpour

x
The author’s contribution to the included papers
Paper I. All the experiments, planning, and the major part of the evaluation and
writing.
Paper II. All the experiments and the major part of the planning, evaluation,
and writing.
Paper III. Part of experimental work, all VSFS experiments, part of planning,
evaluation, and writing. The evaluation of NPS results and major part of the
writing was done by Markus Schwind (Chalmers).
Paper IV. Part of experimental work, part of planning and re‐writing the paper.
The evaluation of results and major part of the writing was done by Markus
Schwind (Chalmers).
Paper V. All the experiments, planning and major part of the evaluation and
writing.
Paper VI. Majority of the experiments, planning and major part of the
evaluation and writing. AP‐XPS measurements were performed by Prof. Mats
Göthelid (KTH).
Paper VII. Surface characterization, part of planning and minor part of writing.
The main part of the writing, sample preparation and exposure were
performed by Åsa Björkbacka (KTH).
Paper VIII. Surface characterization, part of planning and minor part of writing.
The main part of the writing, sample preparation and exposure were
performed by Åsa Björkbacka (KTH).
xi
Summary of Papers
In Paper I, the oxidation of copper samples covered with self assembled
monolayers (SAMs) of octadecanethiol (ODT) were studied by vibrational sum
frequency spectroscopy (VSFS). The in situ VSFS spectral shape changed upon
sample oxidation in dry air atmosphere as a result of the interference between
resonant and nonresonant susceptibilities and was used as an indirect measure
for the formation of a copper (I) oxide layer on the metal substrate. Infrared
reflection/absorption spectroscopy (IRAS) and cathodic reduction (CR) were
performed as complementary measurements to assess the upper limit of the
thickness of the formed oxide under these conditions. The results showed the
ability of VSFS to detect the formation of an oxide layer with a thickness of <2
nm after 19 hours of exposure.
In Paper II, a quartz crystal microbalance with dissipation monitoring
(QCM‐D) was integrated with VSFS for in situ quantification of the thickness of
the formed oxide under conditions similar to those in Paper I, and to follow the
oxidation kinetics under these conditions. The correlation between the mass
uptake due to oxidation, detected by QCM‐D, and the interference between
resonant and nonresonant susceptibilities of VSFS signal was used to calibrate
the VSFS results allowing the determination of the absolute oxide thickness
with the time resolution of hours. This combination enabled the detection of
35% of a full monolayer of the oxide after 10 hours of exposure.
In Paper III, further quantification was performed on the previously
mentioned samples using in situ integrated QCM‐D, VSFS, and indirect
nanoplasmonic sensing (NPS). In brief, the VSFS enabled the assessment of the
quality of the ODT monolayer on the copper surface during sample oxidation
while the QCM‐D results allowed an absolute mass detection due to the sample
oxidation with great mass sensitivity. The NPS results were used to quantify the
oxidation process with a temporal resolution of 1‐2 sec. Moreover, the rigidity
xii
and the heterogeneity of the oxide film were detected by the dissipation factor
in QCM‐D and NPS respectively.
The main purpose of Paper IV was to demonstrate the application of two
versions of NPS, direct and indirect NPS, as tools for monitoring the corrosion.
The direct NPS uses the nanodisks as the active surface as well as the sensing
particles, while in the indirect NPS extended copper film acts as the active
surface and embedded nanodisks act as sensing particles. Both methods were
used to show the effect of ODT as a corrosion inhibitor. Further, the effect of
the presence of humidity on the corrosion kinetics was demonstrated on bare
and ODT covered samples with both methods. The obtained results showed a
protective effect of ODT, a heterogeneous distribution of the corrosion
products as well as the importance of the adsorbed water on the surface in the
corrosion process. Both methods showed very high sensitivity (sub‐monolayer
detection limit) and a temporal resolution of 1‐2 sec.
Paper V describes how the chain length of the self assembled monolayers
(SAMs) of alkanethiols affects the protection of copper from corrosion in a
laboratory air containing humidity and formic acid. In situ IRAS measurements
were performed to follow the kinetics of formation of the reaction products. It
was shown that longer alkanethiol molecules have a superior corrosion
protection efficiency comparing to their shorter counterparts. In all cases the
formation of oxide on the copper surface was inhibited. This was attributed to
the selective hindrance of the alkanethiol molecules on the surface to the
permeation of oxygen, water, and formic acid molecules through the chains.
Complimentary VSFS measurements were performed to show that the
oxidation of the SAM covered samples in this corrosive atmosphere coincides
with the increase in the number of defects in the molecular structure of the
SAMs.
In Paper VI, the ability of SAMs of hexanethiol and hexaneselenol to
protect the copper surfaces from corrosion in humidified air containing formic
acid was compared. Oxide formation was observed for the hexaneselenol
xiii
covered samples in contrast to hexanethiol covered samples where the
formation of copper (I) oxide was completely eliminated. This difference was
attributed to the partial removal of the hexaneselenol molecules from the
copper surface during the corrosion process. This results in the formation of
local galvanic cells on the sample surface, which leads to a faster corrosion
kinetics even by comparison to bare copper. The VSFS measurements
confirmed the partial removal of the hexaneselenol molecules. In addition,
ambient pressure x‐ray photoelectron spectroscopy (AP‐XPS) measurements
were performed on selected samples to demonstrate the ability of the
hexanethiol molecules to remove the surface oxides upon their adsorption to
the surface from the gas phase.
Paper VII deals with the effect of gamma (γ) radiation on the corrosion of
copper samples in anoxic aqueous solutions. It was shown that the gamma
radiation has a significant effect on the corrosion of the copper surfaces.
Inductively coupled plasma ‐ atomic emission spectroscopy (ICP‐AES)
measurements indicated an increase in the metal release in the case of
irradiated samples compared with the reference samples with no irradiation.
Copper (I) oxide was detected as the main corrosion product under this
condition using Infrared reflection/absorption spectroscopy (IRAS), scanning
electron microscopy ‐ energy dispersive x‐ray spectroscopy (SEM‐EDS), and
confocal Raman microscope (CRM). SEM‐EDS and atomic force microscopy
(AFM) enabled the detection of distinctive round corrosion features on the
irradiated sample surfaces.
Paper VIII was an extension of Paper VII and the effect of the gamma dose
rate and total dose, which were related to metal release and corrosion of the
copper samples. This study has relevance to the deep repository concept for
nuclear fuels in Sweden. IRAS and CR as well as ICP‐AES measurements were
performed to quantify the amount of corrosion products formed at different
dose rates. XPS measurements were used to identify the type of the corrosion
products. Numerical simulations were also conducted to evaluate the effect of
aqueous radiation chemistry on copper corrosion. It was found that the

xiv
aqueous radiation chemistry is not the only driving process in the corrosion of
the copper samples under these conditions.
xv
Table of Contents
Abstract ............................................................................................................. iii
Sammanfattning ................................................................................................. v
List of papers .................................................................................................... vii
Summary of Papers ............................................................................................ xi
List of the techniques used in this study .......................................................... xvii
1 Introduction .............................................................................................. 1
1.1 Reading guidance .......................................................................................... 1
1.2 Motivation and main aims ............................................................................. 1
1.3 Atmospheric corrosion .................................................................................. 2
1.4 Atmospheric corrosion of copper .................................................................. 4
1.5 Self assembled monolayers (SAMs) ............................................................... 5
1.6 Radiation induced corrosion on copper ........................................................ 6
2 Theory ...................................................................................................... 8
2.1 Infrared and Raman Spectroscopy ................................................................ 8
2.2 Vibrational sum frequency spectroscopy (VSFS) ......................................... 12
2.3 Cathodic reduction (CR) ............................................................................... 18
2.4 Quartz crystal microbalance ‐ with dissipation monitoring (QCM‐D) ......... 20
2.5 Nanoplasmonic sensing (NPS) ..................................................................... 22
2.5.1 Direct nanoplasmonic sensing .......................................................... 23
2.5.2 Indirect nanoplasmonic sensing ....................................................... 24
3 Experimental .......................................................................................... 26
3.1 Sample preparation ..................................................................................... 26
3.2 Deposition of SAMs ..................................................................................... 27
3.3 Corrosive atmosphere generation and exposure conditions ...................... 27
xvi
3.4 Exposures with gamma radiation ............................................................... 28
3.5 IRAS measurements .................................................................................... 29
3.6 VSFS measurements ................................................................................... 30
3.7 CR measurements ....................................................................................... 31
3.8 QCM‐D measurements ............................................................................... 32
3.9 NPS measurements and NPS sample preparations .................................... 33
4 Summary of Key Results and Discussion ..................................................36
4.1 ODT covered copper in dry air – quantitative assessment of ultra slow
oxide growth rate (results from papers I, II, III, and IV) ........................... 36
4.1.1 In situ VSFS ....................................................................................... 36
4.1.2 In situ VSFS integrated with QCM‐D ................................................ 43
4.1.3 In situ VSFS integrated with QCM‐D and NPS .................................. 46
4.2 ODT covered copper in dry or humidified air – oxide growth monitored by
direct and indirect NPS (results from paper IV) ....................................... 53
4.3 Alkanethiol covered copper – effect of chain length on atmospheric
corrosion inhibition (results from paper V) ............................................. 58
4.4 Alkanethiol and alkaneselenol covered copper – effect of head group on
atmospheric corrosion inhibition (results from paper VI) ....................... 63
4.5 Gamma radiation induced corrosion of copper (results from papers VII and
VIII) ........................................................................................................... 69
5 Conclusions and Outlook .........................................................................75
6 Acknowledgements .................................................................................77
7 References ..............................................................................................79
xvii
List of the techniques used in this study
VSFS: Vibrational sum frequency spectroscopy
IRAS: Infrared reflection/absorption spectroscopy
AP‐XPS: Ambient pressure x‐ray photoelectron spectroscopy
CRM: Confocal Raman microscopy
QCM‐D: Quartz crystal microbalance with dissipation monitoring
AFM: Atomic force microscopy
SEM‐EDS: Scanning electron microscopy ‐ energy dispersive x‐ray
spectroscopy
ICP‐AES: Inductively coupled plasma ‐ atomic emission spectroscopy
Direct and indirect NPS: Nanoplasmonic sensing
CR: Cathodic reduction

1
1 Introduction
1.1 Reading guidance
In this chapter, readers are given a motivation for the thesis followed by a
brief introduction to the field of atmospheric corrosion, specifically the
atmospheric corrosion of copper. The effectiveness of self assembled
monolayer (SAM) of organic molecules in protecting copper from corrosion and
the effect of gamma radiation on inducing copper corrosion are discussed.
In Chapter 2 a theoretical basis is provided for the main techniques used in
this thesis. The sample preparation methods and the relevant experimental
details are presented in Chapter 3.
Chapter 4 summarizes the key results from different papers included in this
thesis. In this chapter the oxidation of SAM covered copper in dry air and its
quantification using ultra sensitive techniques are in focus (results from Papers
I – IV). Effect of a more corrosive atmosphere, containing humidity and formic
acid, on corrosion of bare and SAM covered copper are also discussed and the
corrosion protection of different SAMs is compared (results from Papers V, VI).
Finally the effect of gamma radiation on inducing corrosion of copper is
evaluated (results from Papers VII, VIII).
In Chapter 5, short conclusions from the work are given followed by
suggestions for future work.
1.2 Motivation and main aims
This thesis work forms part of a broader study with the main aim of
developing a molecular foundation for the atmospheric corrosion of copper, a
highly complex form of corrosion involving three phases (metal, aqueous
adlayer and gas) and two interfaces (solid/liquid and liquid/gas).1 The model
system used for the current study is bare copper or copper protected with a

2
self assembled organic monolayer (SAM), which is exposed to a dry air or
humid air and formic acid containing atmosphere mimicking indoor
atmospheric corrosion. This information can be ultimately used in a computer
model simulating the atmospheric corrosion of copper induced by carboxylic
acids.2
As a part of this effort, vibrational sum frequency spectroscopy (VSFS), a
quartz crystal microbalance ‐ with dissipation monitoring (QCM‐D), and
nanoplasmonic sensing (NPS) were used as in situ analytical tools either alone
or in combination to detect and quantify the initial stages of SAM covered
copper corrosion. Detailed study of the early stages of corrosion of copper
allowed different possible molecular mechanisms to be resolved governing the
initial atmospheric corrosion of SAM covered copper.
1.3 Atmospheric corrosion
Atmospheric corrosion is one of the most important forms of corrosion and
is defined as the interaction between a material and its surrounding
atmospheric environment1 which results in, often destructive, changes in the
material. Although the topic of atmospheric corrosion is relevant for different
materials such as concrete,3 stone,4, 5 glass, polymeric films, and painted
objects, the majority of the studies in this field are focused on metals. In
contrast to traditional corrosion studies where the sample is immersed in a
liquid phase, or studies performed under ultra high vacuum conditions,
atmospheric corrosion is often triggered by a very thin water layer of varying
thickness deposited onto the surface from atmospheric humidity, or from fog,
dew or rain water.1 Nevertheless, dry oxidation and corrosion upon the
adsorption of corrosive gases can also be categorized as atmospheric corrosion.
Overall direct costs related to atmospheric corrosion in the United States was
estimated to be in the range of 100 million US dollars per year or about 1% of
the Swedish gross national products (GNP) every year.1 However, the
estimation of the indirect costs due to atmospheric corrosion as well as its

3
detrimental effects on cultural heritages is potentially larger but more difficult
to calculate. Despite the fact that atmospheric corrosion has been recognized
since mankind was able to produce metallic objects, and in spite of its
enormous technological importance, the science of atmospheric corrosion is
less than 100 years old.6, 7 Atmospheric corrosion science is a multidisciplinary
area involving chemistry, physics, material science, and other disciplines. With
the development of new analytical techniques in the last decades, a variety of
approaches have been taken to gain molecular insights into the mechanisms of
atmospheric corrosion.
Atmospheric corrosion can be divided into two categories, outdoor and
indoor atmospheric corrosion.1 The former deals with corrosion phenomena in
the outdoor atmosphere where pollutants, aerosol particles, weather
conditions, and sunshine play important roles.8‐10 Since the exposure conditions
in this case are governed by natural phenomena, i.e. rain, sunshine, outdoor
temperature, the interpretation of the results obtained by studying corroded
samples in outdoor conditions is very challenging.11 Scientific studies on indoor
atmospheric corrosion are relatively new and date back to the growing interest
in corrosion effects on electronics in the last few decades.12 Indoor atmospheric
corrosion is triggered by relative humidity, corrosive gases and particles
present under indoor conditions.1, 13 Therefore, the rate of indoor atmospheric
corrosion is usually much lower than that for outdoor conditions since the
concentration of corrosive stimulators are usually lower indoors.14 Further, the
composition of the corrosion products in outdoor and indoor corrosion is
different. Studying the low corrosion rate in indoor conditions requires
experimental techniques with higher sensitivity and lower detection limits than
outdoors. Some of these tools not only enable studying the interface between
solid substrates and a surface water layer, but they are also capable of
providing information about the interface between a water layer and the gas
phase.15 These three phases, i.e. the gas phase, the liquid phase, and the solid
phase, as well as the interfaces between them have recently been the subject
of a few studies related to atmospheric corrosion.16‐19
4
Some organic compounds have received greater attention due to their
important role in atmospheric corrosion of metals in indoor environments.20‐22
For example, it has been shown that the concentration of carboxylic acids in
indoor environments is higher than those in outdoor atmospheres as a result of
anthropogenic activities.1, 23, 24 The effect of formic acid, the simplest type of
carboxylic acids, on the atmospheric corrosion of copper has been investigated
in more detail in this doctoral thesis due to its importance as an indoor
corrosion stimulator by means of different in situ and ex situ analytical
techniques.
1.4 Atmospheric corrosion of copper
Copper is extensively used in electrical contacts, power generators and
transmitters, heat exchangers, construction (mainly sheathing), and
transportation due to its excellent thermal and electrical conductivity.
However, copper undergoes oxidation and corrosion when it is exposed to the
atmosphere, which is manifested as the formation of a brownish‐green or
brownish‐blue patina layer.25‐27 Except for a few applications, where this patina
layer is appealing, such as on sculptures and architectural monuments,
formation of this layer is considered to be detrimental to the performance of
the system. This is even more important in the case of electrical contacts and
microelectronics where maintaining the original copper surface characteristics
are essential for their performance.28 Another example where copper corrosion
might even result in catastrophic events is in waste nuclear fuel storage where
copper canisters are intended be able to isolate the nuclear fuel from the
environment for 100,000 years.29
In the presence of a surface water layer, Cu (I) oxide (cuprite or Cu2O, with
a cubic structure) is readily formed on the copper surface. Cuprite might be
further transformed to Cu (II) oxide (tenorite or CuO) in the presence of strong
oxidants or at high temperatures.30 The aqueous adlayer provides a medium
where corrosive gases can dissolve. It also provides the condition for
5
electrochemical reactions on the copper surface. In indoor environments,
where humidity and organic acids can deposit on the metallic copper surface,
other corrosion products such as copper hydroxide (Cu(OH)2) and copper
carboxylates (Cu(R‐COO)2.xH2O) have also been identified in the corrosion
product layer using infrared reflection/absorption spectroscopy (IRAS) and x‐
ray photoelectron spectroscopy (XPS).22, 31
Although the kinetics of the copper corrosion in humidified air containing
low amount of carboxylic acids, e.g. 120 ppb formic acid, acetic acid, and
propionic acid have been thoroughly studied using IRAS, QCM, and cathodic
reduction over days and weeks of laboratory exposures,22, 31, 32 quantitative
information about the initial phases of atmospheric corrosion of copper is
rather limited. One of the reasons is the lack of sufficiently sensitive
instruments to detect very thin corrosion products with high enough temporal
resolution.
In this study a combination of extremely sensitive techniques, vibrational
sum frequency spectroscopy (VSFS), quartz crystal microbalance with
dissipation monitoring (QCM‐D), and nanoplasmonic sensing (NPS) has been
used to shed some light on the ultra slow formation of corrosion products on
copper under atmospheric conditions.
1.5 Self assembled monolayers (SAMs)
Self assembled monolayers (SAMs) are considered as model systems to
study molecular interactions on surfaces, and as well‐controlled substrates in
bioanalytical, organometallic, physical organic, bioorganic, and electrochemical
studies.33 SAMs of organic molecules are commonly used to protect metallic
surfaces from corrosion by spontaneous formation of ordered, ultrathin films
on the metallic substrate.34 Adsorption kinetics, stability, and efficiency of
SAMs to protect corroding metal surfaces from corrosion and oxidation have
been the subject of many publications and a vast number of analytical
6
techniques such as contact angle,35 atomic force microscopy (AFM),36 scanning
tunneling microscopy (STM),37 XPS,38, 39 low energy electron diffraction (LEED),
ellipsometry,39, 40 IRAS,41, 42 VSFS,43 and QCM44 have been applied to study
SAMs. In this thesis ultra‐slow oxidation of alkanethiol and alkaneselenol (also
denoted as alkylthiol and alkylselenol, respectively) covered copper has been
investigated quantitatively and qualitatively through a multi‐analytical
approach involving, among others, IRAS, VSFS, QCM‐D, and NPS. Alkanethiols
were chosen since they were among the most studied SAMs for corrosion
inhibition on copper and because of their good stability and ease of adsorption
on copper surfaces through their sulfur head groups. Alkaneselenols, on the
other hand, have been less studied despite the similarities to their thiol
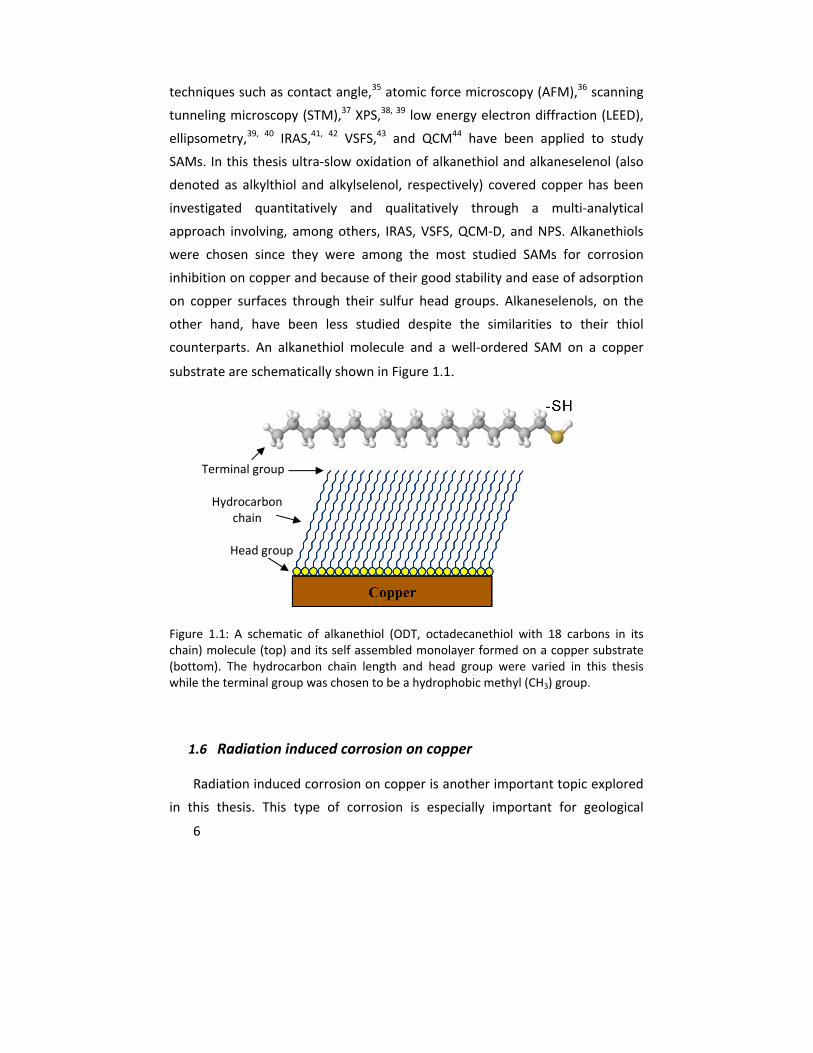
counterparts. An alkanethiol molecule and a well‐ordered SAM on a copper
substrate are schematically shown in Figure 1.1.
Figure 1.1: A schematic of alkanethiol (ODT, octadecanethiol with 18 carbons in its chain) molecule (top) and its self assembled monolayer formed on a copper substrate (bottom). The hydrocarbon chain length and head group were varied in this thesis while the terminal group was chosen to be a hydrophobic methyl (CH3) group.
1.6 Radiation induced corrosion on copper
Radiation induced corrosion on copper is another important topic explored
in this thesis. This type of corrosion is especially important for geological
Head group
Hydrocarbon chain
Terminal group
7
disposal of spent nuclear fuel (long term storage of highly radioactive waste) in
countries such as Belgium, Canada, Finland, France, Germany, Japan, Sweden,
Switzerland, and United Kingdom.45 The Swedish approach is based on
canisters made of copper, in which corrosion could lead to catastrophic events.
Despite its importance, very few studies have dealt with the effect of radiation
on the corrosion of copper canisters. In this study copper pieces in anoxic water
were exposed to gamma radiation in conditions relevant to this repository
concept for nuclear fuels. Inductively coupled plasma ‐ atomic emission
spectroscopy (ICP‐AES), IRAS, cathodic reduction (CR), XPS, and scanning
electron microscopy with energy dispersive x‐ray spectroscopy (SEM‐EDS)
measurements were performed on irradiated samples to elucidate the effect of
irradiation on corrosion of the copper samples.
8
2 Theory
In this section a brief description is presented of the theoretical
background of the main techniques used by the author in this thesis, i.e. IR and
Raman spectroscopy, VSFS, CR, QCM‐D and NPS. The theoretical basis of other
techniques used will be described more briefly where corresponding results are
presented.
2.1 Infrared and Raman Spectroscopy
Infrared (IR) spectroscopy is based on the linear interaction of an
electromagnetic wave in the infrared region with matter, i.e. a wavelength of
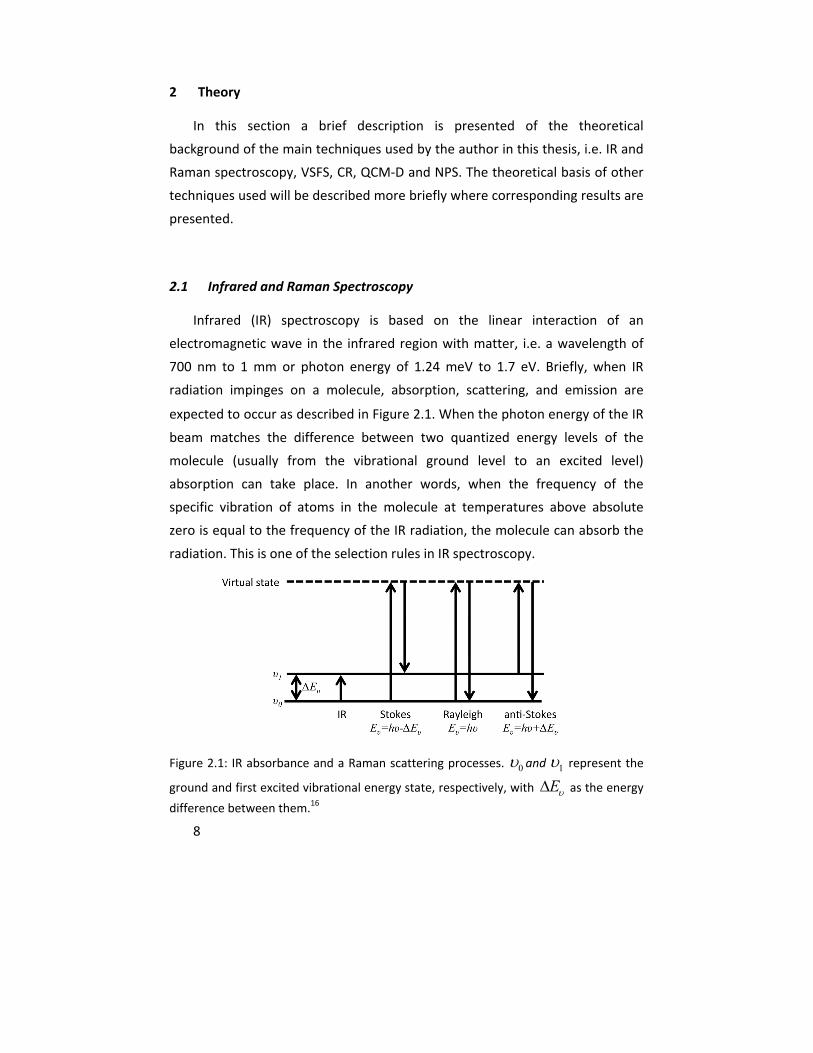
700 nm to 1 mm or photon energy of 1.24 meV to 1.7 eV. Briefly, when IR
radiation impinges on a molecule, absorption, scattering, and emission are
expected to occur as described in Figure 2.1. When the photon energy of the IR
beam matches the difference between two quantized energy levels of the
molecule (usually from the vibrational ground level to an excited level)
absorption can take place. In another words, when the frequency of the
specific vibration of atoms in the molecule at temperatures above absolute
zero is equal to the frequency of the IR radiation, the molecule can absorb the
radiation. This is one of the selection rules in IR spectroscopy.
Figure 2.1: IR absorbance and a Raman scattering processes. 0 and 1 represent the
ground and first excited vibrational energy state, respectively, with E as the energy
difference between them.16
9
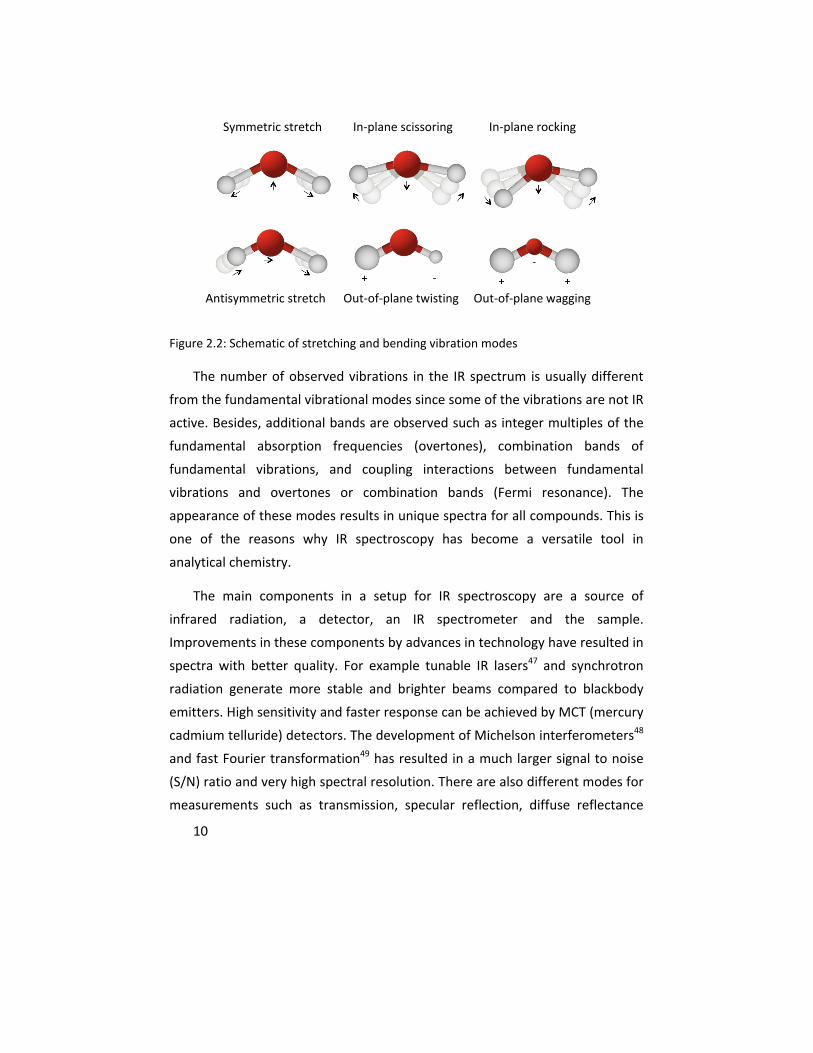
A nonlinear molecule with N atoms has 3N‐6 vibrational modes, called
normal modes.46 The majority of these modes are stretching and bending
modes, which can be symmetric or antisymmetric as illustrated in Figure 2.2.
For a linear molecule the number of normal vibrational modes are 3N‐5. In
each of these modes, atoms vibrate around their equilibrium positions with the
same frequency. For a vibration to give rise to IR absorption the dipole moment
of the molecule must change, as described in Equation (2.1)
0Q
(2.1)
Where µ is the dipole moment with respect to the normal coordinate Q. This is
another selection rule in IR spectroscopy. The intensity (I) of an IR band in the
spectrum is defined as:
2
IQ
(2.2)
Information about vibrational transitions is usually provided as peaks in an
absorption spectrum, where the absorbance is given as:
0
logR
AR
(2.3)
Where R0 is the background signal, which is the intensity of the reflected beam
from the reference sample surface, and R is the intensity of the reflected beam
from the sample surface with adsorbates on it. Absorbance (A) is linearly
proportional to the concentration of the sample and therefore IR spectroscopy
can be used as a quantitative technique. Changes in the absorbance of each
peak then quantitatively represent the addition or removal of adsorbing
molecules on the substrate. For example, in the case of in situ exposures in this
study, the absorbance of each peak represents the amount of formed or
removed corrosion products upon sample exposure.
10
Figure 2.2: Schematic of stretching and bending vibration modes
The number of observed vibrations in the IR spectrum is usually different
from the fundamental vibrational modes since some of the vibrations are not IR
active. Besides, additional bands are observed such as integer multiples of the
fundamental absorption frequencies (overtones), combination bands of
fundamental vibrations, and coupling interactions between fundamental
vibrations and overtones or combination bands (Fermi resonance). The
appearance of these modes results in unique spectra for all compounds. This is
one of the reasons why IR spectroscopy has become a versatile tool in
analytical chemistry.
The main components in a setup for IR spectroscopy are a source of
infrared radiation, a detector, an IR spectrometer and the sample.
Improvements in these components by advances in technology have resulted in
spectra with better quality. For example tunable IR lasers47 and synchrotron
radiation generate more stable and brighter beams compared to blackbody
emitters. High sensitivity and faster response can be achieved by MCT (mercury
cadmium telluride) detectors. The development of Michelson interferometers48
and fast Fourier transformation49 has resulted in a much larger signal to noise
(S/N) ratio and very high spectral resolution. There are also different modes for
measurements such as transmission, specular reflection, diffuse reflectance
Out‐of‐plane twistingAntisymmetric stretch Out‐of‐plane wagging
In‐plane scissoring In‐plane rocking Symmetric stretch
11
(DRIFTS), attenuated total reflection (ATR) and infrared reflection/absorption
spectroscopy (IRAS). Among the mentioned methods, IRAS is the most suitable
method for study of corrosion reactions on metallic surfaces.50
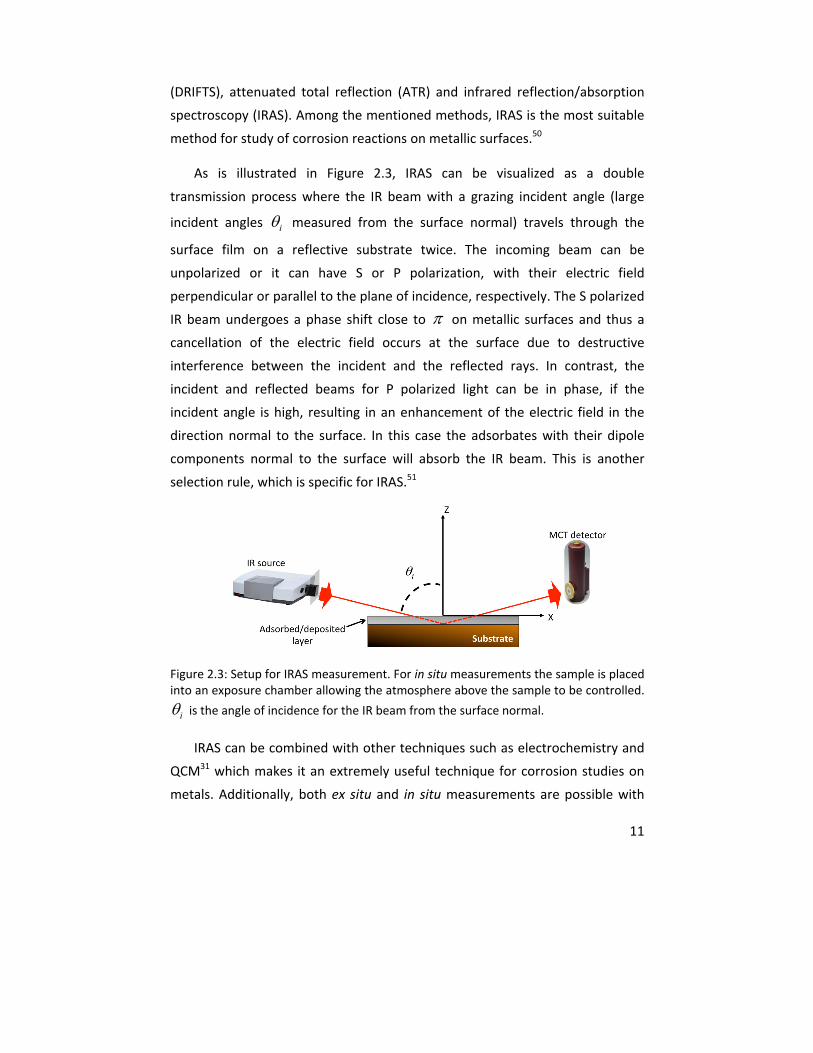
As is illustrated in Figure 2.3, IRAS can be visualized as a double
transmission process where the IR beam with a grazing incident angle (large
incident angles i measured from the surface normal) travels through the
surface film on a reflective substrate twice. The incoming beam can be
unpolarized or it can have S or P polarization, with their electric field
perpendicular or parallel to the plane of incidence, respectively. The S polarized
IR beam undergoes a phase shift close to on metallic surfaces and thus a
cancellation of the electric field occurs at the surface due to destructive
interference between the incident and the reflected rays. In contrast, the
incident and reflected beams for P polarized light can be in phase, if the
incident angle is high, resulting in an enhancement of the electric field in the
direction normal to the surface. In this case the adsorbates with their dipole
components normal to the surface will absorb the IR beam. This is another
selection rule, which is specific for IRAS.51
Figure 2.3: Setup for IRAS measurement. For in situ measurements the sample is placed into an exposure chamber allowing the atmosphere above the sample to be controlled.
i is the angle of incidence for the IR beam from the surface normal.
IRAS can be combined with other techniques such as electrochemistry and
QCM31 which makes it an extremely useful technique for corrosion studies on
metals. Additionally, both ex situ and in situ measurements are possible with

12
small modifications, where the latter method facilitates studies of interactions
between different corrosive atmospheres and metallic surfaces, as will be
described later.
In Figure 2.1 the Raman process as an inelastic and off‐resonance scattering
process is also depicted where the molecules are momentarily excited to a
virtual energy state. The selection rule associated with Raman spectroscopy
requires a change in the polarizability, α, during a vibration, Equation (2.4).
0Q
(2.4)
2.2 Vibrational sum frequency spectroscopy (VSFS)
Unlike IR spectroscopy, VSFS is based on the nonlinear interaction between
light and matter which makes it unique for surface studies.52 A prerequisite for
such nonlinear interaction is the presence of strong electromagnetic fields,
which can be achieved by lasers.53 The first VSF spectra were reported in late
1980s by a pioneer in non linear spectroscopy, R. Shen,54, 55 and since then it
has found expanding applications in the fields of physics, chemistry, and
specifically in surface science.
The theory of nonlinear spectroscopy has been the subject of many review
articles56‐60 so only a very brief background will be provided here. The
propagation of an electromagnetic wave through a material exerts a force on
molecules comprising the matter. In the case of ambient light or low intensity
sources of light this force induces an electric dipole moment µ according to:
0 E (2.5)
where µ0 and α are the permanent dipole and polarizability of molecules in the
material, respectively, and E is the intensity of the electromagnetic field. In
condensed matter the sum of the electric dipoles results in the bulk
13
polarization P. The induced polarization by an electromagnetic field is
described as:
(1)0P E (2.6)
where χ(1) is the first order susceptibility and ε0 is the permittivity of vacuum. In
linear processes such as reflection or refraction, P oscillates with the same
frequency as the electromagnetic field and emits light with the same
frequency.
In the case of stronger electromagnetic fields, usually achieved by strong
pulsed lasers, the induced dipole in the material can no longer be described by
Equation (2.5) and higher orders of polarizability need to be added as:
2 30 ...E E E (2.7)
where β and γ are the first and second order hyperpolarizabilities, respectively.
These additional terms determine the nonlinear response of the medium
through the second and third order nonlinear susceptibilities (χ(2)and χ(3)) as:
(1) (2) 2 (3) 30 ( ....)P E E E (2.8)
Taking the general form of an electric field into account as:
cosiE E t (2.9)
the second order polarization can be written as:
(1) (2) 20
(2)(1) 2
0
( ( cos ) ( cos ) )
( ( cos ) (1 cos 2 ))2
i i
i i
P E t E t
E t E t
(2.10)
As is shown in Equation (2.10) the emitted light from the induced nonlinear
polarization has a term which oscillates at twice the frequency of the incident E
field. In VSFS this E field is expressed as the sum of two oscillating incident
14
fields, E1 and E2, from two laser beams with frequencies of ω1 and ω2. Therefore
it can be described as:
1 1 2 2cos cosE E t E t (2.11)
The second order term of the induced polarization, P(2), can thus be written as:
(2) (2) 2 2 2 20 1 2 1 1 2 2
21 2 1 2 1 2 1 2
( cos 2 cos 2
1 1cos( ) cos( ) )
2 2
P E E E t E t
E E t E E t
(2.12)
The last two terms are the origins of difference frequency generation (DFG) and
sum frequency generation (SFG) where the light is emitted at the frequencies
equal to the difference and the sum of the frequencies of the incoming beams,
respectively.
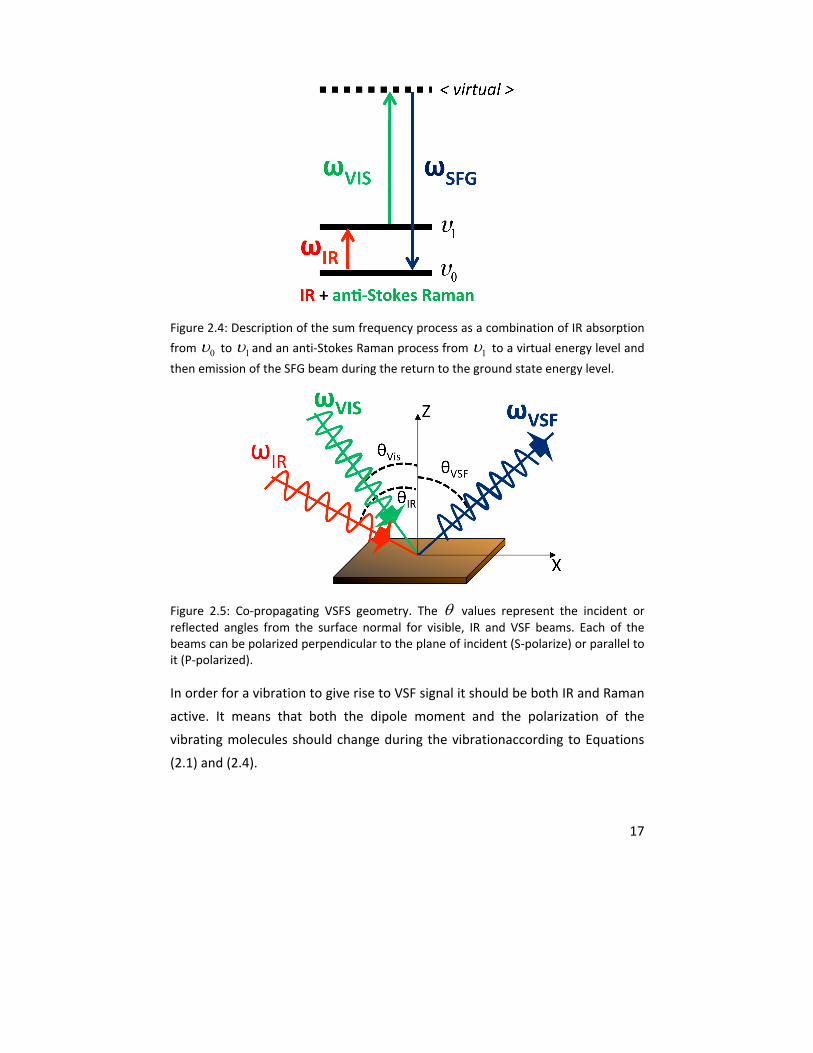
In practice VSFS can be regarded as a combination of infrared absorption and
anti‐Stokes Raman scattering as depicted in Figure 2.4. Two beams, one with a
fixed frequency in the visible or near IR region ( )Vis and one tunable in the IR
region ( )IR , overlap temporarily and spatially on the sample and generate a
third beam with its frequency equal to the sum of the frequencies of the
incident beams ( )SF Vis IR , which contains vibrational information
about the molecules at the surface as is illustrated in Figure 2.5. The intensity
of the VSF signal VSFI is proportional to the intensity of the visible and IR
beams ( VisI and )IRI and the square of the effective second‐order susceptibility
(2)eff according to Equation (2.13).
2(2)VSF eff Vis IRI I I (2.13)
where (2)eff is a third‐rank tensor and has 27 elements containing the
information about second‐order susceptibility of the vibrating molecules
15
(2) and Fresnel factors. For a VSF spectrum with n vibrations,(2) contains
contributions from resonant and nonresonant parts (2)( NR and (2) )R according
to Equation (2.14).
(2) (2) (2),NR R n
n
(2.14)
Where (2)R is summed over all vibrations contributing to the VSF signal. It can
be related to the molecular hyperpolarizability as:
(2) (2)
0R R
N
(2.15)
where N and 0 are the number of contributing oscillators and the dielectric
permittivity, respectively. The brackets indicate the average over all molecular
orientations. VSF spectra can be modeled using the following equation:
22
(2) (2) (2), , ,
nΓn
VSF IR NR eff R eff NR effn n n IR
AI
i
(2.16)
where (2)
,NR eff and (2)
,R eff are the effective nonresonant and resonant
susceptibilities, respectively. They contain information about the Fresnel
factors as well as surface molecules. A , n , IR , and are the amplitude,
vibrational transition frequency, IR laser frequency, and damping constant of
nth vibration mode, respectively. Both the resonant and nonresonant parts of
equation (2.16) are complex numbers. Therefore, this equation for a single
vibrational mode can be expressed as:
16
2 2, ,
2 2, ,
2 22 2 2 2
, , , ,
( )
( )
2 ( )
VSF IR NR eff R eff
NR eff R eff
NR eff R eff NR eff R eff
I exp i exp i
exp i exp i
cos
(2.17)
where and are the phases of the effective resonant and nonresonant
susceptibilities, respectively. For simplicity, the term “effective” for resonant
and nonresonant susceptibilities is omitted hereafter. Equation (2.17) contains
the cross term of the resonant and nonresonant phases, which determines the
shape of the VSF spectra. This phase difference can result in destructive and
constructive interference between the adjacent peaks and with the
nonresonant signal, and generate VSF spectra with positive, negative or
derivative shape peaks at the resonant frequencies. In the case of dielectric
materials this interference is negligible since (2)NR is much smaller than (2)
R .
However in the case of metal substrates where (2)NR has a dominant effect in
the VSF spectrum,61 this interference can be problematic in the interpretation
of the spectra, and in finding the peak positions. Thus, nonlinear fitting using
Equation (2.16) should be performed with special care. When the frequency of
the IR beam coincides with the transition frequency of the vibrating molecules,
the VSF signal is enhanced as is shown in Equation (2.16).
17
Figure 2.4: Description of the sum frequency process as a combination of IR absorption
from 0 to 1 and an anti‐Stokes Raman process from 1 to a virtual energy level and
then emission of the SFG beam during the return to the ground state energy level.
Figure 2.5: Co‐propagating VSFS geometry. The values represent the incident or reflected angles from the surface normal for visible, IR and VSF beams. Each of the beams can be polarized perpendicular to the plane of incident (S‐polarize) or parallel to it (P‐polarized).
In order for a vibration to give rise to VSF signal it should be both IR and Raman
active. It means that both the dipole moment and the polarization of the
vibrating molecules should change during the vibrationaccording to Equations
(2.1) and (2.4).
18
Moreover, the VSF signal is forbidden in centrosymmetric environments such
as most of the bulk materials due to symmetry constraints. This gives VSFS its
surface specificity. In other words, under the electric dipole approximation, the
VSF signal is solely generated from media possessing a net orientation and with
broken symmetry. This includes the surfaces of different bulk materials as well
as the interfaces between them. Therefore VSFS becomes an ideal tool for
various surface studies where the bulk contribution is unwanted.
VSFS measurements can be performed with IR, visible, and VSF beams
having different polarization combinations parallel or perpendicular to the
plane of incidence. Having the information obtained from measurements in
different polarization combinations facilitates an orientation analysis of the
molecules at surfaces or interfaces. However, for metallic surfaces where the IR
beam is largely cancelled for the S polarized light (perpendicular to the plane of
incident), only measurement with a P polarized IR beam gives rise to a
detectable VSF signal. The cancelation for the S polarized visible beam on
metallic surfaces is not as pronounced as that for the IR beam. However
measurements with a P polarized visible beam result in the highest VSF signal.
Therefore, all the VSFS measurements in this thesis are performed using P
polarized VSF, visible, and IR beams.
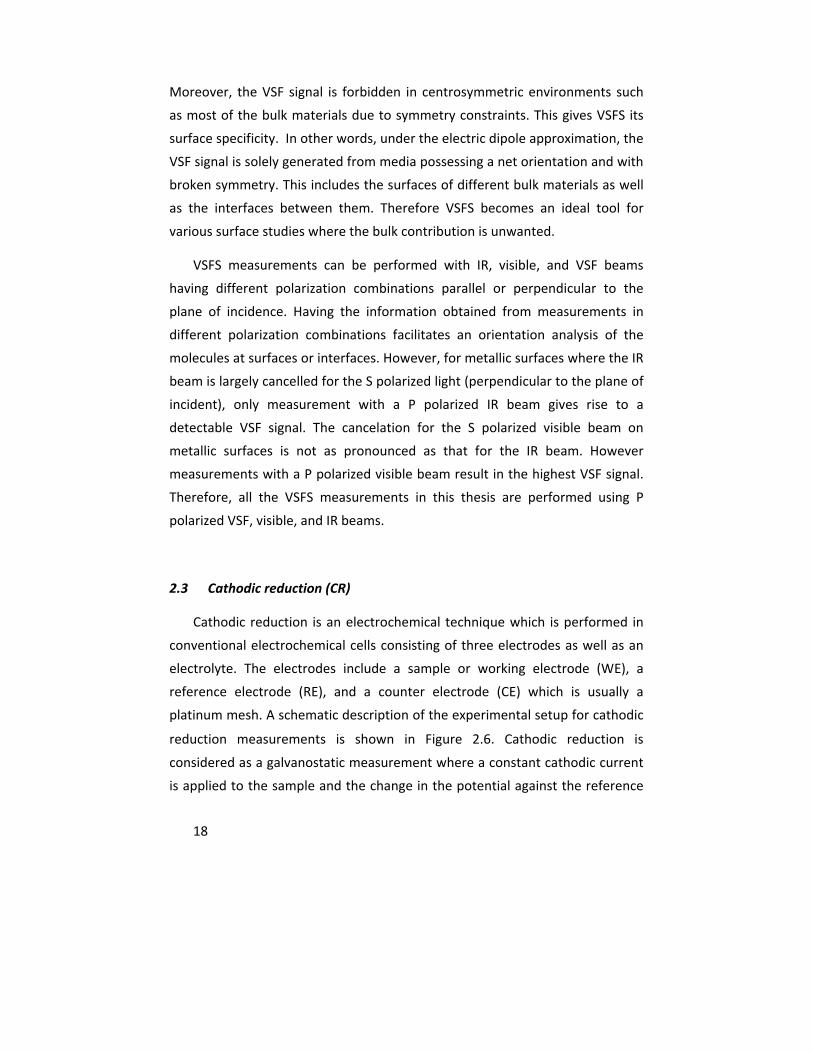
2.3 Cathodic reduction (CR)
Cathodic reduction is an electrochemical technique which is performed in
conventional electrochemical cells consisting of three electrodes as well as an
electrolyte. The electrodes include a sample or working electrode (WE), a
reference electrode (RE), and a counter electrode (CE) which is usually a
platinum mesh. A schematic description of the experimental setup for cathodic
reduction measurements is shown in Figure 2.6. Cathodic reduction is
considered as a galvanostatic measurement where a constant cathodic current
is applied to the sample and the change in the potential against the reference
19
electrode is recorded over the time. This technique has been widely used for
copper corrosion studies after exposure to field or laboratory environments.62, 63
Figure 2.6: Setup for electrochemical measurements. It includes a working electrode (sample), a counter electrode (platinum mesh), a reference electrode, and a conductive electrolyte.
In CR measurements when a homogeneous layer, e.g. an oxide layer with a
specific thickness, is present on the sample surface the potential remains
constant over time. It will be reflected as a plateau in the potential‐time
curve.64 After the full reduction of the layer, the potential drops quickly until it
reaches the reduction potential of the next layer. For each constituent of the
film there is a specific reduction potential. Therefore, the plateaus in the
potential versus time curve can be used to identify the different constituents of
the deposited films on the surface. Additionally, the time required for complete
reduction of each constituent can be used to quantify its thickness using
Faraday’s law:65
10000( ) / ( )d t I M A n F (2.18)
Where d is the thickness of the reduced layer (nm), t is the reduction
time (sec), I is the applied cathodic current (mA), M is the molar mass of the
20
oxide (g mole‐1), A is the sample area in contact with the electrolyte (cm2), n
is the number of electrons required to reduce a unit of molecular weight of
oxide, is the specific weight of the reduced oxide (g cm‐3), and F is
Faraday’s constant (9.65×10⁴C mol‐1).
After full reduction of all layers on the surface the potential decreases
suddenly to a more negative value which corresponds to the reduction
potential of the hydrogen ions to hydrogen gas. This indicates the final step of
the reduction process of the surface layers.31
2.4 Quartz crystal microbalance ‐ with dissipation monitoring (QCM‐D)
QCM‐D is an extremely mass sensitive technique with a nanogram
detection limit and millisecond time resolution. The working mechanism is
based on the vibration of a piezoelectric quartz crystal. This vibration is induced
by applying an AC field to the crystal which produces an oscillatory distortion.66
The frequency of the quartz crystal vibration can be altered by adding or
removing mass from its surface. Information about the added or removed mass
is obtained by monitoring such variations in the oscillation frequency and using
the Sauerbrey equation,67 Equation (2.19). In this equation f is the change in
the oscillation frequency of the crystal, 0f is the recorded frequency at the
beginning of the measurement, m is the change in the detected mass per unit
of area (g cm‐2), q is the density of the quartz (2.68 g cm‐3) and q is the shear
wave velocity (2.947×10¹¹ g cm‐1 s‐2). The quartz crystal surface can be coated
with various types of materials such as metals. Since QCM‐D monitors the
absolute mass variations it can be extremely useful for studying corrosion
phenomena which lead to increased/decreased mass upon the formation or
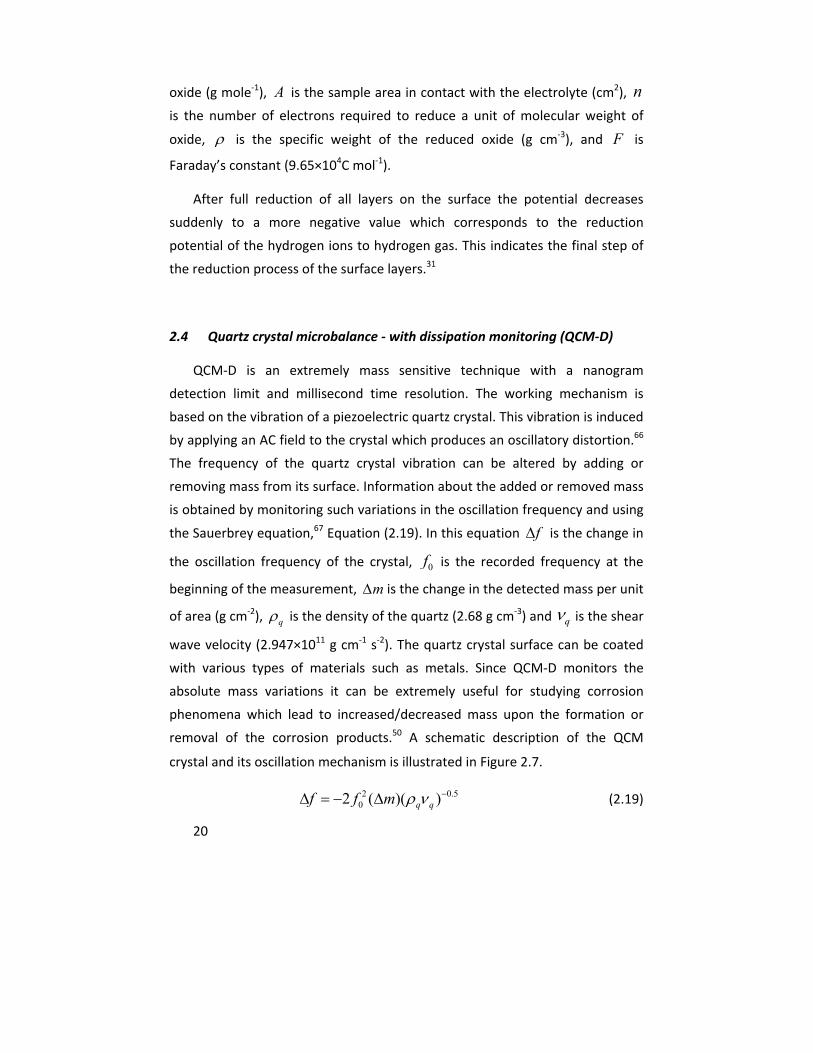
removal of the corrosion products.50 A schematic description of the QCM
crystal and its oscillation mechanism is illustrated in Figure 2.7.
2 0.502 ( )( )q qf f m (2.19)
21
Figure 2.7: a) Schematics of QCM sensors from the top and bottom view. The surface of the crystal can be coated with various materials (gold and copper in this study). b) A side view of an oscillating QCM crystal in an alternating voltage.68
QCM‐D measurements are very sensitive to temperature variations and
special care should be taken during the measurements since small variations in
temperature lead to changes in the recorded frequency and might cause
misinterpretation regarding the adsorbed mass.
Dissipation monitoring in QCM‐D is a method for measuring the quality or
lifetime of the oscillation (Q factor), i.e. the energy dissipation of the oscillator,
which provides additional information about the viscoelasticity and rigidity of
the adsorbed material on the crystal surface.69, 70 Such information can be
obtained by switching off the electric field and monitoring the decay of the
oscillation over the time, or decay time . Equation (2.20) shows the
relationship between the dissipation factor D and the oscillation frequency
f of the crystal.
1D
f (2.20)
The information regarding the dissipation properties can be obtained
simultaneously with the frequency of the QCM‐D by measuring the width of the
resonance frequency or the power required to maintain a constant oscillation
22
amplitude. In principle the more rigid the adsorbed material is, the smaller is
the energy dissipation.
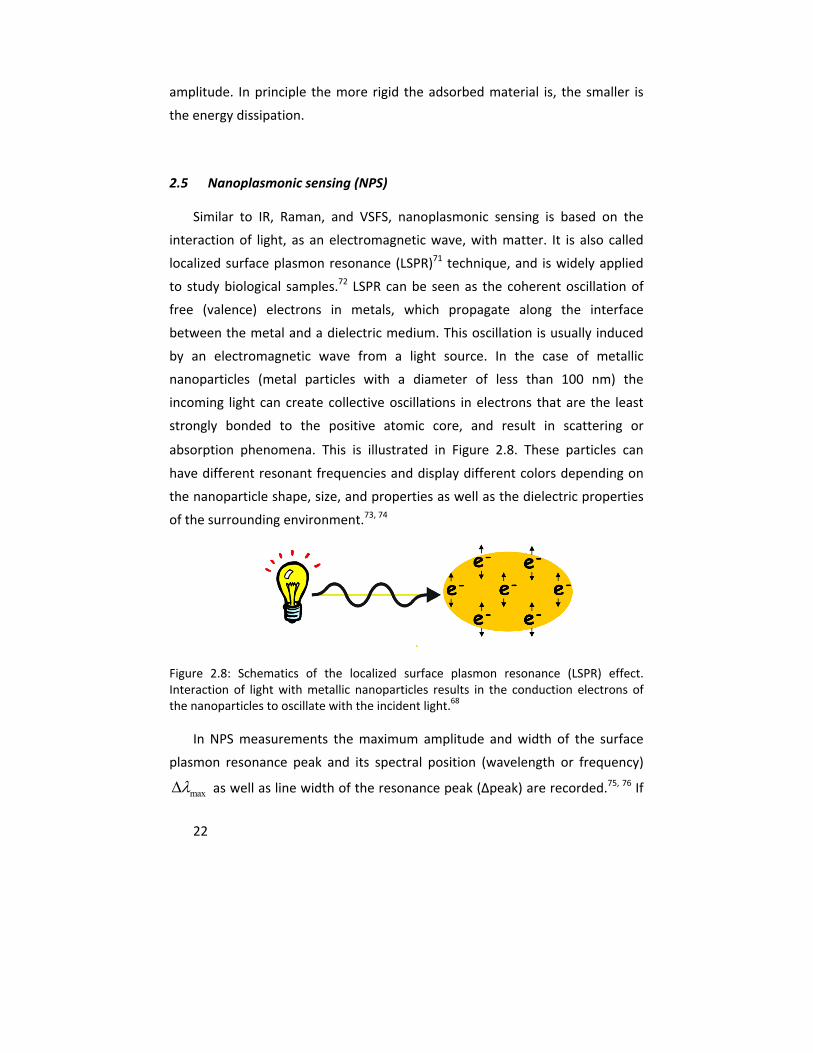
2.5 Nanoplasmonic sensing (NPS)
Similar to IR, Raman, and VSFS, nanoplasmonic sensing is based on the
interaction of light, as an electromagnetic wave, with matter. It is also called
localized surface plasmon resonance (LSPR)71 technique, and is widely applied
to study biological samples.72 LSPR can be seen as the coherent oscillation of
free (valence) electrons in metals, which propagate along the interface
between the metal and a dielectric medium. This oscillation is usually induced
by an electromagnetic wave from a light source. In the case of metallic
nanoparticles (metal particles with a diameter of less than 100 nm) the
incoming light can create collective oscillations in electrons that are the least
strongly bonded to the positive atomic core, and result in scattering or
absorption phenomena. This is illustrated in Figure 2.8. These particles can
have different resonant frequencies and display different colors depending on
the nanoparticle shape, size, and properties as well as the dielectric properties
of the surrounding environment.73, 74
Figure 2.8: Schematics of the localized surface plasmon resonance (LSPR) effect. Interaction of light with metallic nanoparticles results in the conduction electrons of the nanoparticles to oscillate with the incident light.68
In NPS measurements the maximum amplitude and width of the surface
plasmon resonance peak and its spectral position (wavelength or frequency)
max as well as line width of the resonance peak (∆peak) are recorded.75, 76 If
23
the NPS measurements are performed with transmission geometry, another
parameter can also be recorded – the change of the extinction amplitude
(transmission value at the LSPR peak minimum). Any change in these
parameters as the result of changes in the optical properties of the
nanoparticles or their surrounding environment can be recorded with very high
sensitivity and great time resolution.75
NPS is a surface sensitive technique since the field of the oscillating
electrons decays rapidly with distance from the surface of the metal
nanoparticles. Thus, only the changes in the proximity of the metallic particles
(tens of nanometers from the surface) are recorded as shifts in the LSPS peaks.
One of the drawbacks of NPS measurements is that the relationships
between the changes of the LSPR peaks and the physical properties of the
sample or environment are usually not easily deduced. Hence, further
calibration using other analytical techniques is required. For example, the
combination of NPS with QCM‐D75 or the integration of NPS, QCM‐D, and
VSFS77 have been used to obtain information regarding the oxidation of
aluminum and copper under different conditions.75
There are two main methods for NPS measurements: the traditional direct
version, and indirect NPS (derived from direct NPS) which is suitable for
studying extended films, as will be discussed in the following section. In this
thesis both versions of NPS are used to study the corrosion of copper under
atmospheric corrosion conditions.
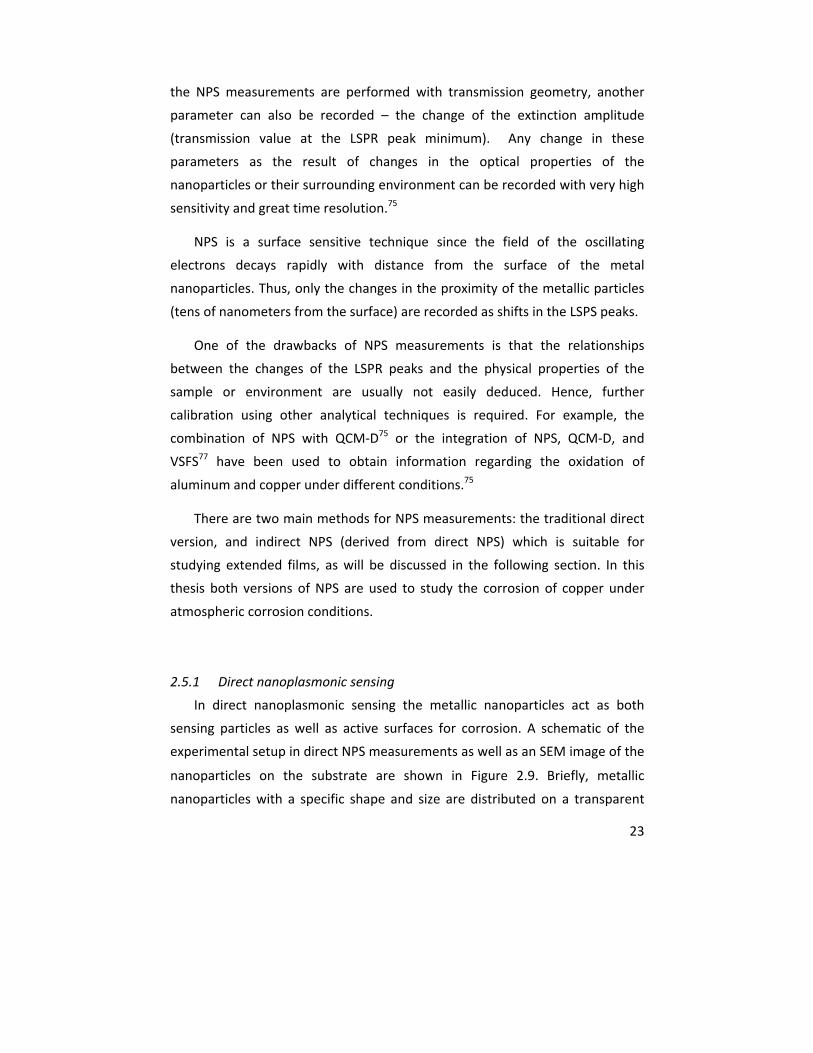
2.5.1 Direct nanoplasmonic sensing
In direct nanoplasmonic sensing the metallic nanoparticles act as both
sensing particles as well as active surfaces for corrosion. A schematic of the
experimental setup in direct NPS measurements as well as an SEM image of the
nanoparticles on the substrate are shown in Figure 2.9. Briefly, metallic
nanoparticles with a specific shape and size are distributed on a transparent
24
substrate. More details about the sample preparation will be provided in the
Experimental section. The electromagnetic wave source (light) is shown
orthogonal to the sample surface. Transmitted light is recorded on the other
side of the sample. Direct NPS can be used in the reflection mode as well. The
plasmonic effect of the nanoparticles causes absorption of the beam at specific
frequencies and is recorded as transmission versus wavelength over time.
Figure 2.9: Schematics of direct nanoplasmonic sensing. The metallic nanodisks on the transparent substrate act as sensing particles as well as the active surface in oxidation reactions. The inset shows a secondary electron image of the nanoparticles.
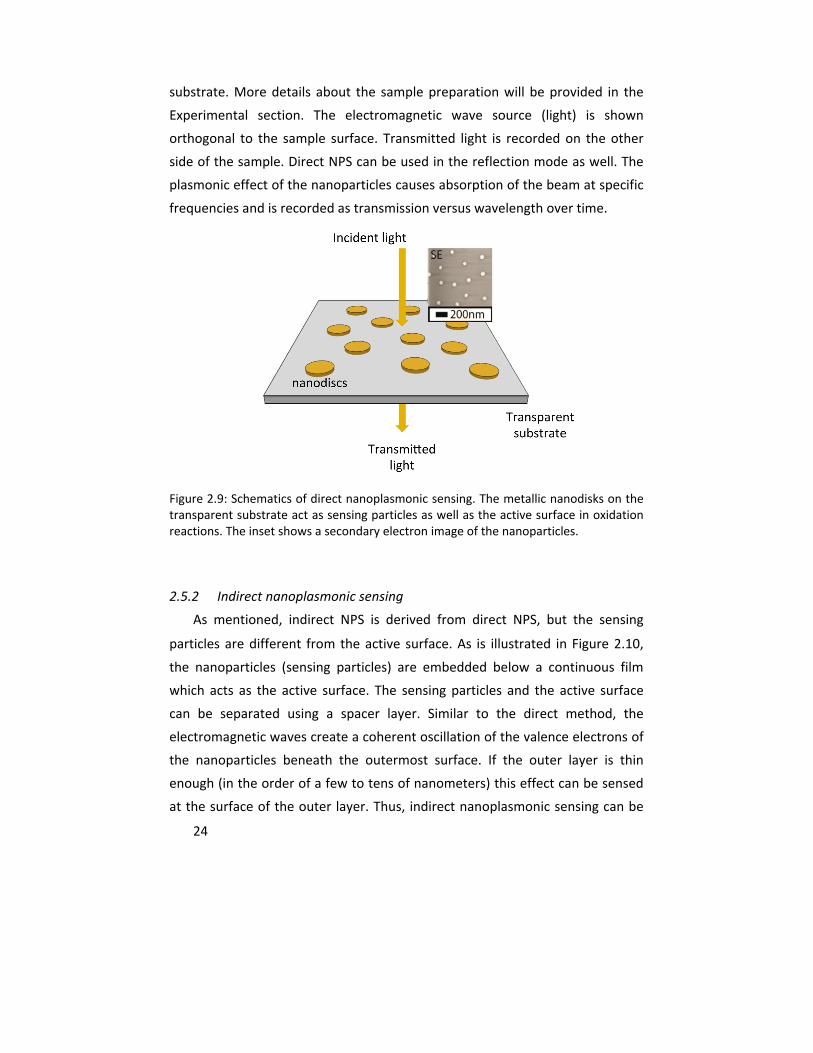
2.5.2 Indirect nanoplasmonic sensing
As mentioned, indirect NPS is derived from direct NPS, but the sensing
particles are different from the active surface. As is illustrated in Figure 2.10,
the nanoparticles (sensing particles) are embedded below a continuous film
which acts as the active surface. The sensing particles and the active surface
can be separated using a spacer layer. Similar to the direct method, the
electromagnetic waves create a coherent oscillation of the valence electrons of
the nanoparticles beneath the outermost surface. If the outer layer is thin
enough (in the order of a few to tens of nanometers) this effect can be sensed
at the surface of the outer layer. Thus, indirect nanoplasmonic sensing can be
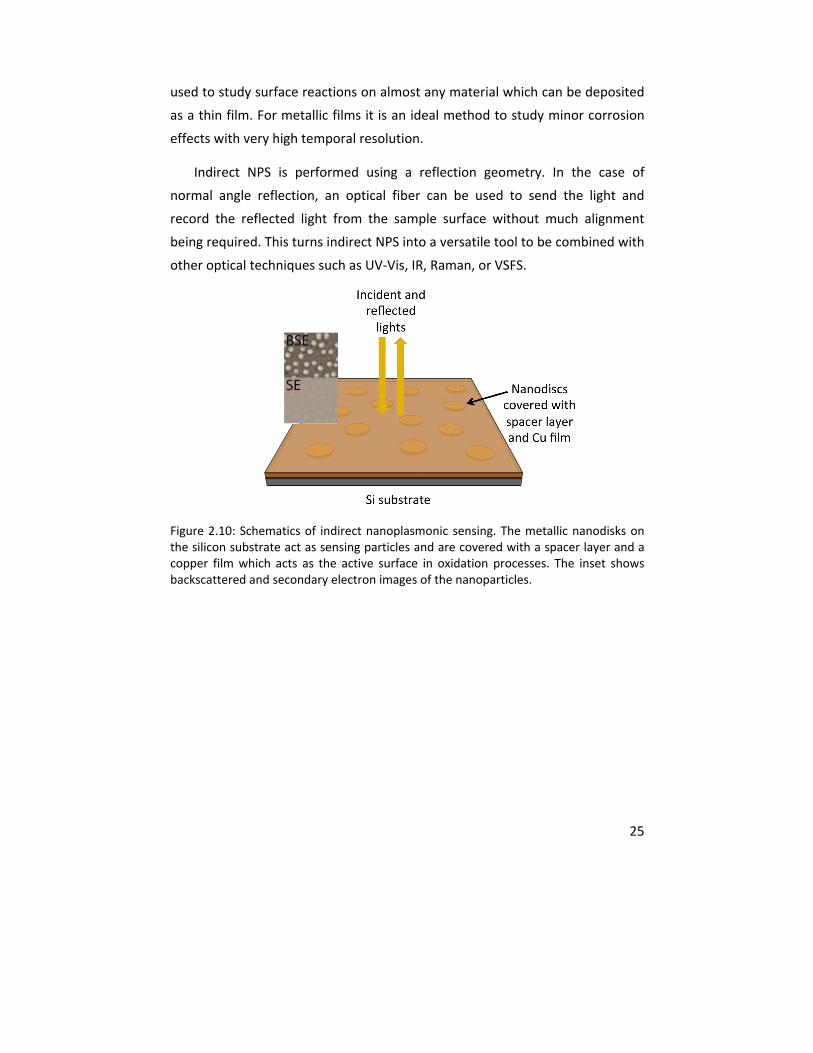
25
used to study surface reactions on almost any material which can be deposited
as a thin film. For metallic films it is an ideal method to study minor corrosion
effects with very high temporal resolution.
Indirect NPS is performed using a reflection geometry. In the case of
normal angle reflection, an optical fiber can be used to send the light and
record the reflected light from the sample surface without much alignment
being required. This turns indirect NPS into a versatile tool to be combined with
other optical techniques such as UV‐Vis, IR, Raman, or VSFS.
Figure 2.10: Schematics of indirect nanoplasmonic sensing. The metallic nanodisks on the silicon substrate act as sensing particles and are covered with a spacer layer and a copper film which acts as the active surface in oxidation processes. The inset shows backscattered and secondary electron images of the nanoparticles.

26
3 Experimental
The theoretical background for the main experimental methods used in this
thesis was provided in the previous section. Specific information regarding the
sample preparation for each measurement as well as the instrumentation used
will be provided in this section.
3.1 Sample preparation
The main samples used in this thesis consist of as‐rolled bulk copper sheets
(Goodfellow, 99.99% purity) with a thickness of 1 mm, which were cut into
pieces of 2 × 2 cm2. In order to obtain a reproducible sample surface as well as
to remove the corrosion products, all the samples were abraded with #1200 SiC
paper followed by polishing with 6, 3, 1, and 0.25 µm polycrystalline diamond
pastes. Pure ethanol (Merck, Germany, 99.9%) was used as a lubricant during
the polishing and contact with water was avoided. The samples were then
sonicated in ethanol for at least 5 minutes to remove the residual diamond
particles from their surfaces.
When oxide free surfaces were desired, the polished samples were put into
a 5%wt amidosulfonic acid aqueous solution (ASA, H3NSO3, Sigma‐Aldrich) for
at least 30 seconds. The role of ASA was to remove the thin oxide layer which
naturally forms on the polished copper surfaces in the lab atmosphere.
Samples were then either dried using a stream of nitrogen gas to immediately
start the exposure or were transferred to the next preparation step (SAM
deposition).
In the cases where Cu coated QCM crystal surfaces where used as samples,
only sonication in ethanol and ASA treatment were performed (no polishing).
27
All the glassware used in these studies was cleaned using Deconex 11
Universal (Borer Chemie AG, Zuchwil, Switzerland) for at least 12 hours and
then rinsed several times with Milli‐Q water (18.2 MΩ cm).
The sample preparation for radiation induced corrosion studies will be
explained in the corresponding section.
3.2 Deposition of SAMs
Where the SAM covered samples were needed for measurements the
polished and cleaned copper surfaces were put into a 1 mM ethanolic solution
of the desired SAMs. The SAMs used in this study include alkanethiols
(CH3(CH2)XSH) from Sigma‐Aldrich with a purity of more than 95% where X was
chosen to be 3, 5, 7, 11, and 17, as well as and Hexaneselenol (CH3(CH2)5SeH)
with a purity of 98% from AFchempharm.
The SAM solution was purged half an hour before the deposition process
with pure nitrogen gas to remove the oxygen from the solution. Nitrogen
purging was performed continuously during the SAMs deposition to avoid any
oxidation of the sample surface during this period.
3.3 Corrosive atmosphere generation and exposure conditions
The air used in the measurements was dried using a Zander KEA adsorption
dryer, filtered and CO2 reduced (CO2 content less than 20 ppm). To produce the
humidified air, a part of the dry air was passed through a bottle containing
Milli‐Q water. This stream was then mixed with the original dry air with
appropriate ratio in a thermostatic bath using a mixing chamber to generate
the gas with a relative humidity of 80 ± 0.3%.
To create a laboratory air which mimics indoor atmospheric corrosion
condition another portion of the main dry air was passed through a bottle
28
containing a formic acid (HCOOH) permeation tube from Vici metronics and
then mixed with the dry or humidified air in the mixing chamber. The total
concentration of the formic acid in the generated corrosive atmosphere was
kept at 100 ppb (almost 10 times higher than the formic acid concentration
indoors). The total flow of the corrosive atmosphere was 1.2 L/min. All the
measurements were performed with the mixed corrosive air at room
temperature (21 ± 0.5 °C). The relative humidity and the temperature of the
gas was measured using a Metronic probe. When exposure with no oxygen was
desired the dry air was replaced with dry nitrogen (oxygen content below 100
ppb).
3.4 Exposures with gamma radiation
The samples used to study the effect of gamma radiation on copper
corrosion were 10 × 10 × 10 mm copper cubes (99.992% purity) abraded with
SiC paper mesh 800 on all sides followed by polishing with 3 µm polycrystalline
diamond paste on the top side. Ethanol was used as lubricant during the
polishing and samples were then sonicated in ethanol for 5 minutes to remove
the residual particles from their surfaces. Copper cubes were placed in glass
beakers containing 10 mL deaerated Milli‐Q water in a N2 filled glove box and
irradiated for desired dose rates and durations. Gamma radiation was
performed using MDS Nordion 1000 Elite Cs‐137 gamma source and dose rates
were determined using Fricke dosimetry. In each set of measurements one
copper cube was preserved as the reference sample (not irradiated but
otherwise treated in exactly the same way as the irradiated sample).
Trace elemental analyses of the solution was performed by ICP‐AES, and
sample surface characterization before and after irradiation were performed
using XPS, SEM‐EDS, AFM, CRM, IRAS, and CR. Also numerical simulations of
homogeneous radiation chemistry of water were performed using MAKSIMA‐
chemist software and the output was compared with the experimental results.
29
A Jeol JSM‐6490LV SEM with a Jeol EX‐230 EDS was used to image the
sample surface and to analyze the elemental distribution. An Agilent 5500
atomic force microscope with a commercially obtained cantilever was used in
static mode to obtain a topographic image. Confocal Raman imaging was
performed on a 40 × 40 μm area of the irradiated sample using a WITEC alpha
300 system Confocal Raman Microscope equipped with a 532 nm laser source
and a 50 X Nikon objective to map the distribution of vibrations on the surface.
Trace elemental analysis was performed on all solutions using inductively
coupled plasma ‐ atomic emission spectroscopy (Thermo Scientific iCAP 6000
series ICP spectrometer (ICP‐AES)). The analysis for copper was performed at
wavelengths of 219.9 and 217.8 nm using ICP multi element standard IV from
Merck. The details of IRAS and CR measurements are provided below.
3.5 IRAS measurements
In situ IRAS measurements were performed using P‐polarized light with an
incident grazing angle of 78° from the surface normal. The reflected beam was
subsequently directed towards a MCT detector, which was cooled with liquid
nitrogen. The spectra were obtained using a Digilab FTS 40 pro FTIR instrument
with an external homemade compartment which allowed the reflection
measurements. 1024 scans with a resolution of 4 cm‐1 were acquired to assure
a good quality of the spectra and a high signal to noise ratio. The absorbance
unit 0( log( / ))R R was used to measure the intensity of the peaks where R
was the reflectance from the sample surface and 0R the reflectance from the
background sample (before exposure). The sample was mounted horizontally
on a Teflon holder inside the closed exposure chamber and the whole chamber
was purged continuously with the appropriate atmosphere from the gas mixing
system. A valve before the exposure chamber allowed switching between
different exposure conditions very easily.
30
3.6 VSFS measurements
To perform the VSFS measurements, the fundamental 1024 nm laser beam
was generated in an Ekspla (Nd:YAG) picosecond laser system with a pulse
length of 27 ps and repetition rate of 20 Hz. This laser source was used to pump
a LaserVision optical parameter generator/amplifier (OPG/OPA). Using a KTP
crystal (Potassium Titanyl Phosphate) the frequency of the fundamental beam
was doubled to generate a 532 nm visible beam. A part of this visible beam was
used to pump the first stage of the OPG/OPA consisting of two angle‐tuned KTP
crystals to produce an idler beam of 1.2‐1.6 µm. The idler beam was then
combined with a part of the fundamental beam in two angle‐tuned nonlinear
KTA (Potassium Titanyl Arsenate) crystals through different frequency mixing
which produced a tunable mid‐IR beam in the range of 1.5‐5.0 µm. The average
output energy of the IR beam from the OPG/OPA was adjusted to be below 300
µJ to avoid sample damage. The fixed visible beam and the tunable IR beam
were then spatially and temporarily overlapped on the sample surface in a co‐
propagating geometry as illustrated in Figure 2.5. The incident angles for IR and
visible beams ( IR and Vis ) from the surface normal were 63° and 55°,
respectively. The generated VSF signal from the sample surface was then
spatially and optically filtered from the reflected IR and visible beams and was
directed to a monochromator (Jobin Yvon) with an attached photomultiplier
tube (PMT, Hamamatsu). An integrated boxcar (Stanford research Instrument)
and a PC were used to subsequently detect and record the VSF spectra. The
spectral region was set to cover the CH stretching vibration region from 2750
cm‐1 to 3050 cm‐1 with a scan rate of 1 cm‐1/sec. Part of the IR and visible
beams were reflected to separate detectors and their intensity were recorded
during each scan. The obtained VSF signal was then normalized to these
intensities using a Matlab program to account for the fluctuations of the beams
and gas phase absorption during the scanning procedure. The SF, visible, and IR
beams were P polarized (parallel to the plane of incidence), since this
polarization combination yields the strongest VSF signal for metal surfaces. At
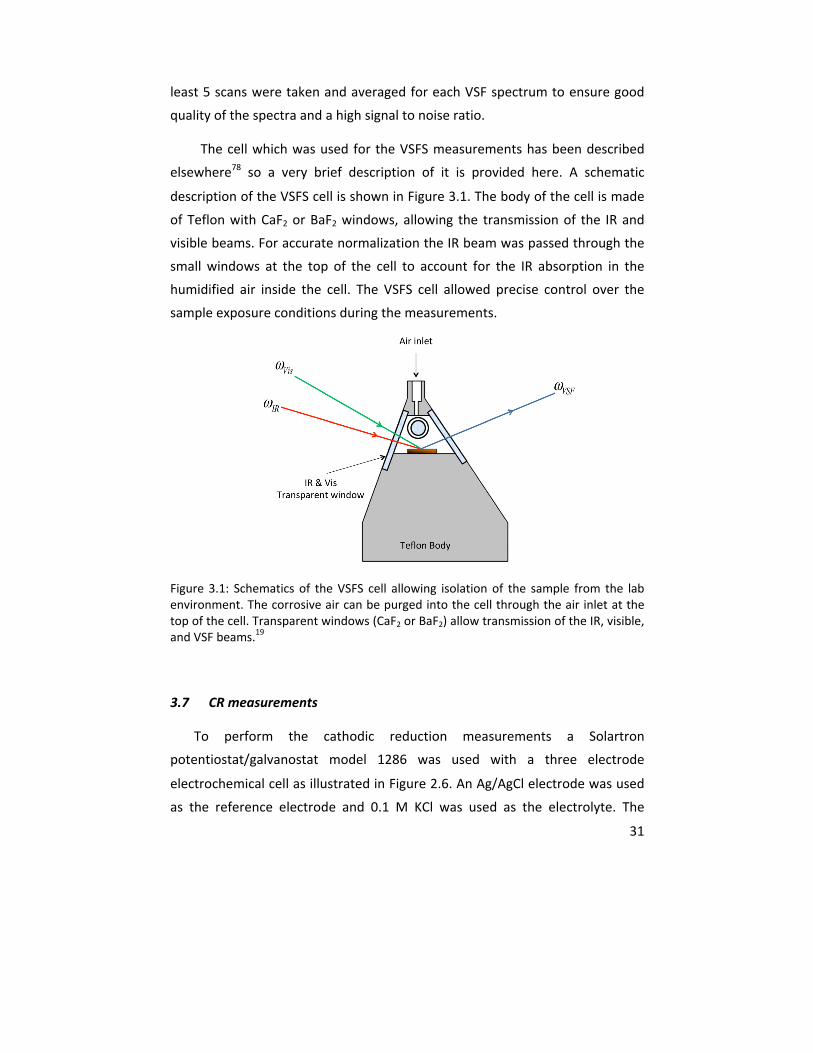
31
least 5 scans were taken and averaged for each VSF spectrum to ensure good
quality of the spectra and a high signal to noise ratio.
The cell which was used for the VSFS measurements has been described
elsewhere78 so a very brief description of it is provided here. A schematic
description of the VSFS cell is shown in Figure 3.1. The body of the cell is made
of Teflon with CaF2 or BaF2 windows, allowing the transmission of the IR and
visible beams. For accurate normalization the IR beam was passed through the
small windows at the top of the cell to account for the IR absorption in the
humidified air inside the cell. The VSFS cell allowed precise control over the
sample exposure conditions during the measurements.
Figure 3.1: Schematics of the VSFS cell allowing isolation of the sample from the lab environment. The corrosive air can be purged into the cell through the air inlet at the top of the cell. Transparent windows (CaF2 or BaF2) allow transmission of the IR, visible, and VSF beams.19
3.7 CR measurements
To perform the cathodic reduction measurements a Solartron
potentiostat/galvanostat model 1286 was used with a three electrode
electrochemical cell as illustrated in Figure 2.6. An Ag/AgCl electrode was used
as the reference electrode and 0.1 M KCl was used as the electrolyte. The
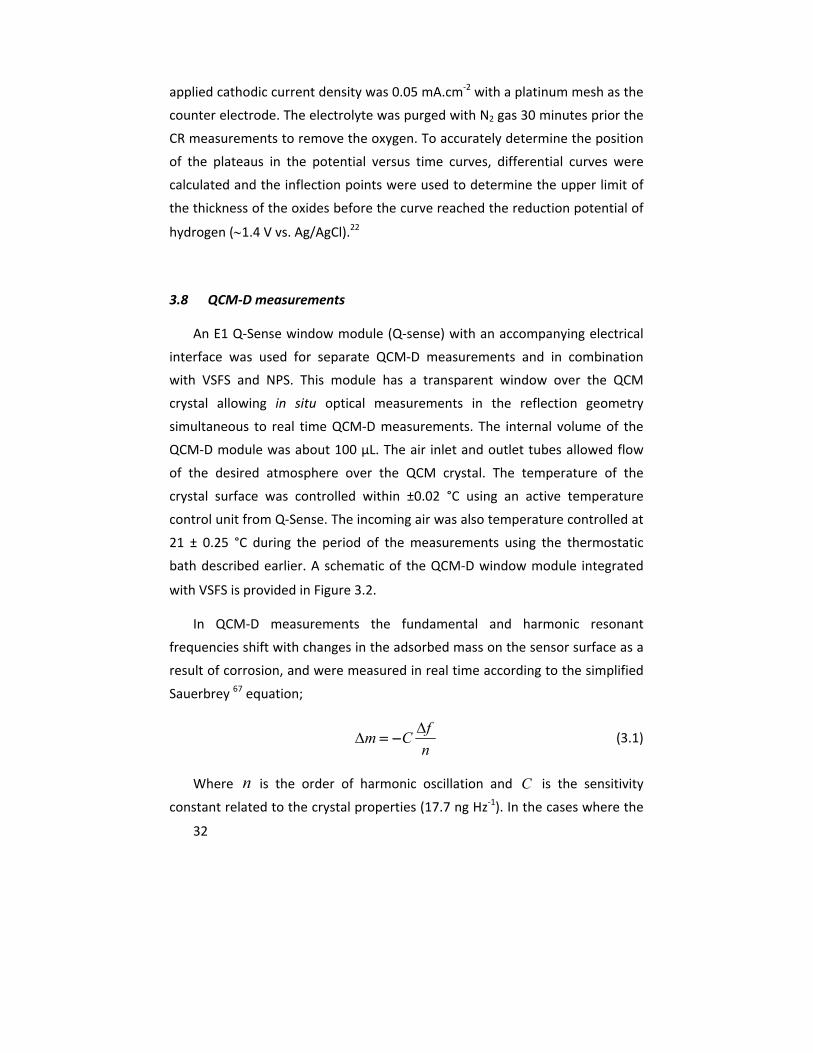
32
applied cathodic current density was 0.05 mA.cm‐2 with a platinum mesh as the
counter electrode. The electrolyte was purged with N2 gas 30 minutes prior the
CR measurements to remove the oxygen. To accurately determine the position
of the plateaus in the potential versus time curves, differential curves were
calculated and the inflection points were used to determine the upper limit of
the thickness of the oxides before the curve reached the reduction potential of
hydrogen (1.4 V vs. Ag/AgCl).22
3.8 QCM‐D measurements
An E1 Q‐Sense window module (Q‐sense) with an accompanying electrical
interface was used for separate QCM‐D measurements and in combination
with VSFS and NPS. This module has a transparent window over the QCM
crystal allowing in situ optical measurements in the reflection geometry
simultaneous to real time QCM‐D measurements. The internal volume of the
QCM‐D module was about 100 µL. The air inlet and outlet tubes allowed flow
of the desired atmosphere over the QCM crystal. The temperature of the
crystal surface was controlled within ±0.02 °C using an active temperature
control unit from Q‐Sense. The incoming air was also temperature controlled at
21 ± 0.25 °C during the period of the measurements using the thermostatic
bath described earlier. A schematic of the QCM‐D window module integrated
with VSFS is provided in Figure 3.2.
In QCM‐D measurements the fundamental and harmonic resonant
frequencies shift with changes in the adsorbed mass on the sensor surface as a
result of corrosion, and were measured in real time according to the simplified
Sauerbrey 67 equation;
fm C
n
(3.1)
Where n is the order of harmonic oscillation and C is the sensitivity
constant related to the crystal properties (17.7 ng Hz‐1). In the cases where the
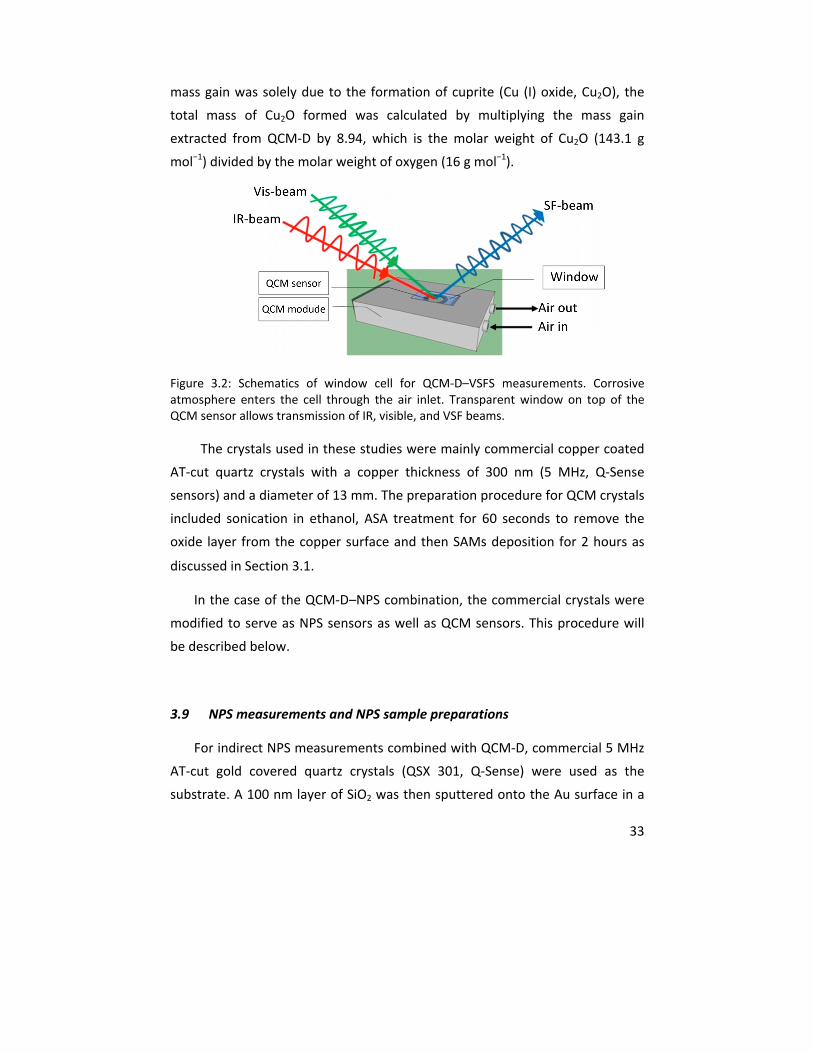
33
mass gain was solely due to the formation of cuprite (Cu (I) oxide, Cu2O), the
total mass of Cu2O formed was calculated by multiplying the mass gain
extracted from QCM‐D by 8.94, which is the molar weight of Cu2O (143.1 g
mol−1) divided by the molar weight of oxygen (16 g mol−1).
Figure 3.2: Schematics of window cell for QCM‐D–VSFS measurements. Corrosive atmosphere enters the cell through the air inlet. Transparent window on top of the QCM sensor allows transmission of IR, visible, and VSF beams.
The crystals used in these studies were mainly commercial copper coated
AT‐cut quartz crystals with a copper thickness of 300 nm (5 MHz, Q‐Sense
sensors) and a diameter of 13 mm. The preparation procedure for QCM crystals
included sonication in ethanol, ASA treatment for 60 seconds to remove the
oxide layer from the copper surface and then SAMs deposition for 2 hours as
discussed in Section 3.1.
In the case of the QCM‐D–NPS combination, the commercial crystals were
modified to serve as NPS sensors as well as QCM sensors. This procedure will
be described below.
3.9 NPS measurements and NPS sample preparations
For indirect NPS measurements combined with QCM‐D, commercial 5 MHz
AT‐cut gold covered quartz crystals (QSX 301, Q‐Sense) were used as the
substrate. A 100 nm layer of SiO2 was then sputtered onto the Au surface in a
34
commercial sputtering system (FHR MS 150). The Au nanoparticles, the sensing
particles, were then fabricated on this layer using hole‐mask colloidal
lithography (explained in detail elsewhere).79 Briefly it includes a sequence of
steps starting with dispersion of negatively charged polystyrene (PS)
nanoparticles on polymethyl methacrylate (PMMA) spin‐coated surfaces which
are covered with a positively charged monolayer of poly diallyl dimethyl
ammonium chloride (PDDA). The PS nanoparticles are commercially available in
different sizes. The size of the PS particles and their distribution determine the
size and distance of the sensing particles on the NPS sensors. In the next step a
thin layer of gold is evaporated on the PS covered sample which thereafter is
removed by tape‐stripping, leaving holes with the same size as the PS particles
on the surface. In the next step the hole‐mask is covered with the selected
metal to the desired thickness in an evaporator. Finally the mask is removed by
sonication in ethyl acetate for several minutes. This sequence of steps leaves
separated metal nanodisks on the sample with specific shape (diameter and
thickness) to act as the sensor particles for NPS measurements. These
sequences are illustrated in Figure 3.3.
Figure 3.3: Hole‐mask colloidal lithography process. a) to f) show the sequence of steps to fabricate the nanoplasmonic sensing samples.68
To fabricate the sensors for direct NPS in paper IV, PS nanoparticles with
60 nm in diameter were dispersed on a glass substrate and 20 nm of copper
35
film was then deposited on the hole‐mask followed by dissolution of the hole‐
mask. This rendered a substrate covered by identical Cu nanodisks as shown in
the SEM image in Figure 2.9. As was already mentioned in section 3.1, the
sensors were then sonicated in ethanol and placed in an ASA solution for 30 sec
to remove the initial oxide from their surfaces. After the ASA treatment the Cu
nanodisks exhibited a diameter of 57 nm and a height of approximately 12 nm.
Longer ASA treatments were avoided to preserve the shape and size of the
nanoparticles in the desired range. The preparation process was then followed
by SAMs deposition when required. To fabricate the indirect NPS samples
another 20 nm SiO2 spacer layer as well as a 20 nm copper film were then
evaporated on the direct NPS samples and the same preparation procedures
were applied. As substrate silicon wafers were used for the fabrication of the
indirect NPS sensors.
To perform the NPS measurements the samples were illuminated using an
Avantes AvaLight‐HAL tungsten halogen light source. To guide this light to the
sample surface (VSFS–QCM‐D–NPS, indirect NPS or direct NPS sensors) an
optical fiber bundle (Avantes FCR‐7xx200‐2‐ME) was used. This fiber bundle
consisted of six fibers for incident light which are concentrically arranged
around the seventh fiber collecting the reflected light from the sample at a
normal angle. In the case of direct NPS, an identical fiber is used to collect the
transmitted light after the sample.
36
4 Summary of Key Results and Discussion
The main findings of this thesis are summarized in this chapter with the
same order as they appear in the papers. Section 4.1 deals with the efforts
made to quantify the initial oxidation of the ODT covered copper in dry air
using a combination of VSFS, QCM‐D, and NPS. This follows approximately the
chronological order in which the measurements were performed. In section 4.2
NPS was applied to follow the oxidation of ODT covered copper in a humidity
containing atmosphere. In Section 4.3 a more corrosive air containing formic
acid was used and the effect of the chain length of alkanethiol SAMs was
studied. Section 4.4 includes a comparison of the corrosion protection
efficiency of SAMs with different headgroups (i.e. –SH vs. –SeH). In Section 4.5
a short summary is presented of the results from studies concerning the effect
of gamma radiation on the corrosion of copper.
4.1 ODT covered copper in dry air – quantitative assessment of ultra slow
oxide growth rate (results from papers I, II, III, and IV)
4.1.1 In situ VSFS
A qualitative study was performed to follow the initial stages of oxidation
of ODT covered copper in dry air using VSFS. Additionally, measurements were
performed to quantify the amount of oxide formed using complimentary IRAS
and CR.
For VSFS measurements an amidosulfonic acid treated copper surface with
a self assembled monolayer of ODT deposited on it was placed in a closed cell
and purged with N2 gas. This is referred to as the “before exposure sample”
hereafter. Five peaks were identified in the VSF spectrum taken in the CH
stretching region (2750‐3050 cm‐1) as is shown in Figure 4.1. They include the
CH2 symmetric stretch at 2850 cm‐1, the CH3 symmetric stretch at 2880 cm‐1,
the CH2 antisymmetric stretch at 2915 cm‐1, the Fermi resonance between the
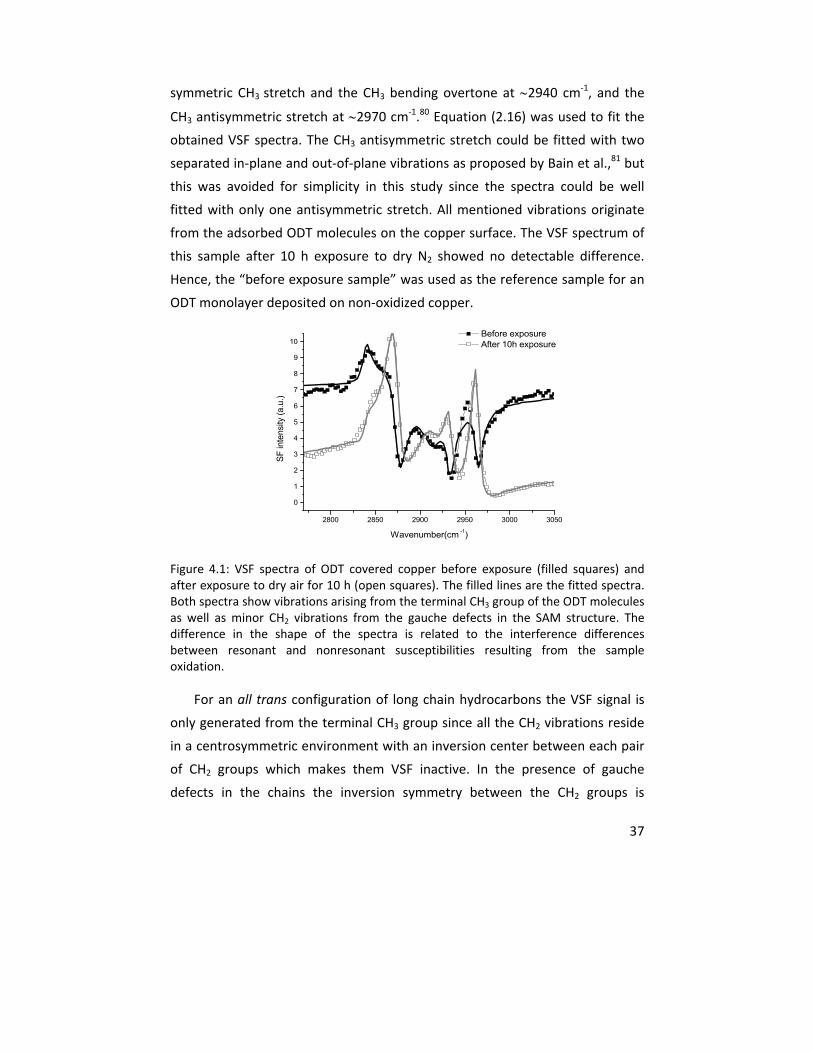
37
symmetric CH3 stretch and the CH3 bending overtone at 2940 cm‐1, and the
CH3 antisymmetric stretch at 2970 cm‐1.80 Equation (2.16) was used to fit the
obtained VSF spectra. The CH3 antisymmetric stretch could be fitted with two
separated in‐plane and out‐of‐plane vibrations as proposed by Bain et al.,81 but
this was avoided for simplicity in this study since the spectra could be well
fitted with only one antisymmetric stretch. All mentioned vibrations originate
from the adsorbed ODT molecules on the copper surface. The VSF spectrum of
this sample after 10 h exposure to dry N2 showed no detectable difference.
Hence, the “before exposure sample” was used as the reference sample for an
ODT monolayer deposited on non‐oxidized copper.
Figure 4.1: VSF spectra of ODT covered copper before exposure (filled squares) and after exposure to dry air for 10 h (open squares). The filled lines are the fitted spectra. Both spectra show vibrations arising from the terminal CH3 group of the ODT molecules as well as minor CH2 vibrations from the gauche defects in the SAM structure. The difference in the shape of the spectra is related to the interference differences between resonant and nonresonant susceptibilities resulting from the sample oxidation.
For an all trans configuration of long chain hydrocarbons the VSF signal is
only generated from the terminal CH3 group since all the CH2 vibrations reside
in a centrosymmetric environment with an inversion center between each pair
of CH2 groups which makes them VSF inactive. In the presence of gauche
defects in the chains the inversion symmetry between the CH2 groups is
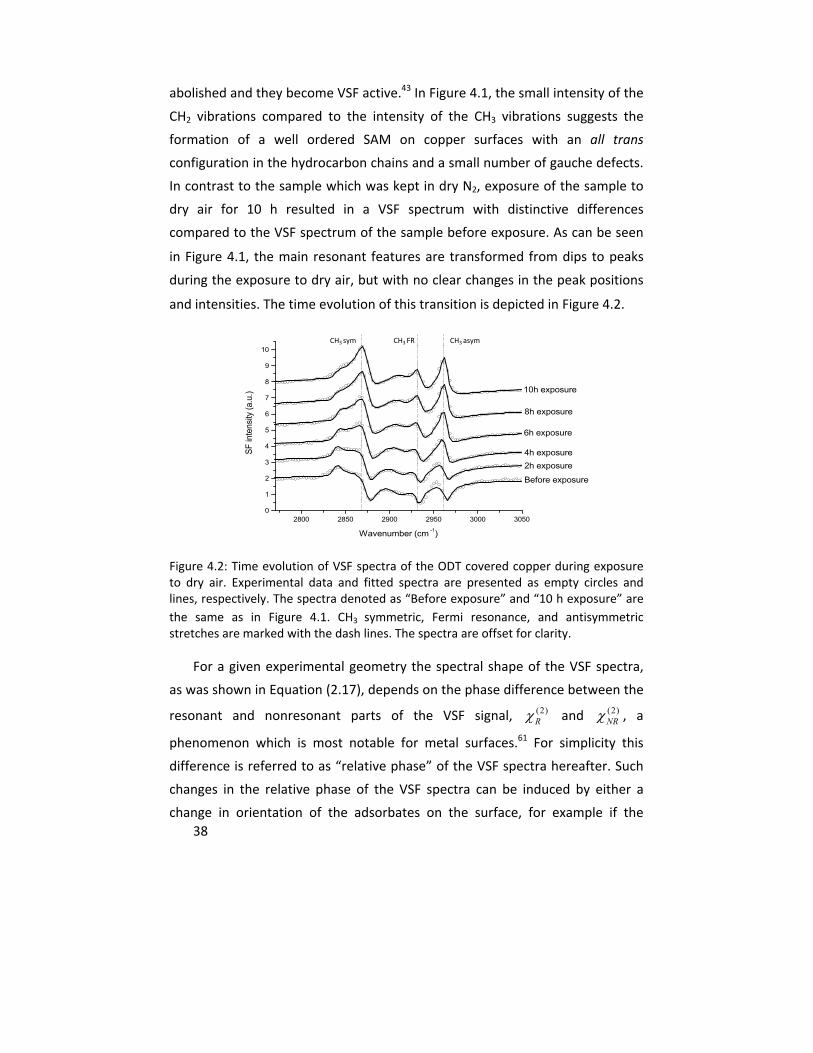
38
abolished and they become VSF active.43 In Figure 4.1, the small intensity of the
CH2 vibrations compared to the intensity of the CH3 vibrations suggests the
formation of a well ordered SAM on copper surfaces with an all trans
configuration in the hydrocarbon chains and a small number of gauche defects.
In contrast to the sample which was kept in dry N2, exposure of the sample to
dry air for 10 h resulted in a VSF spectrum with distinctive differences
compared to the VSF spectrum of the sample before exposure. As can be seen
in Figure 4.1, the main resonant features are transformed from dips to peaks
during the exposure to dry air, but with no clear changes in the peak positions
and intensities. The time evolution of this transition is depicted in Figure 4.2.
Figure 4.2: Time evolution of VSF spectra of the ODT covered copper during exposure to dry air. Experimental data and fitted spectra are presented as empty circles and lines, respectively. The spectra denoted as “Before exposure” and “10 h exposure” are
the same as in Figure 4.1. CH3 symmetric, Fermi resonance, and antisymmetric stretches are marked with the dash lines. The spectra are offset for clarity.
For a given experimental geometry the spectral shape of the VSF spectra,
as was shown in Equation (2.17), depends on the phase difference between the
resonant and nonresonant parts of the VSF signal, (2)R and (2)
NR , a
phenomenon which is most notable for metal surfaces.61 For simplicity this
difference is referred to as “relative phase” of the VSF spectra hereafter. Such
changes in the relative phase of the VSF spectra can be induced by either a
change in orientation of the adsorbates on the surface, for example if the
CH3 sym CH3 FR CH3 asym
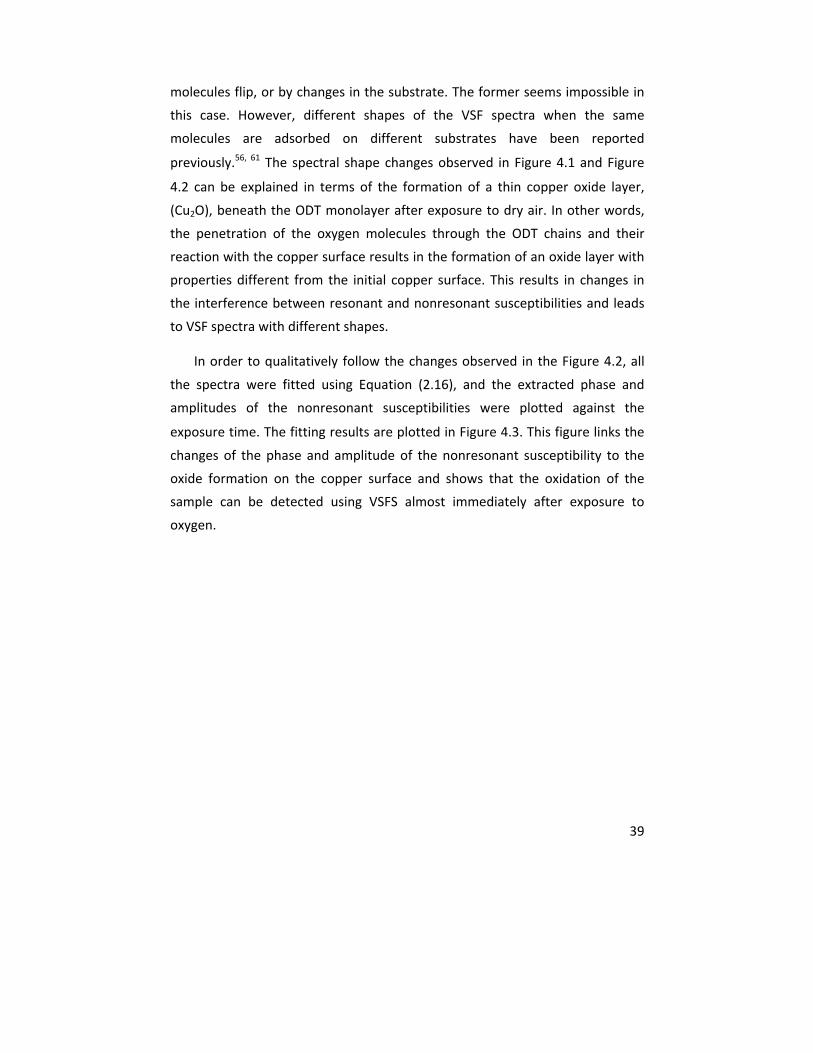
39
molecules flip, or by changes in the substrate. The former seems impossible in
this case. However, different shapes of the VSF spectra when the same
molecules are adsorbed on different substrates have been reported
previously.56, 61 The spectral shape changes observed in Figure 4.1 and Figure
4.2 can be explained in terms of the formation of a thin copper oxide layer,
(Cu2O), beneath the ODT monolayer after exposure to dry air. In other words,
the penetration of the oxygen molecules through the ODT chains and their
reaction with the copper surface results in the formation of an oxide layer with
properties different from the initial copper surface. This results in changes in
the interference between resonant and nonresonant susceptibilities and leads
to VSF spectra with different shapes.
In order to qualitatively follow the changes observed in the Figure 4.2, all
the spectra were fitted using Equation (2.16), and the extracted phase and
amplitudes of the nonresonant susceptibilities were plotted against the
exposure time. The fitting results are plotted in Figure 4.3. This figure links the
changes of the phase and amplitude of the nonresonant susceptibility to the
oxide formation on the copper surface and shows that the oxidation of the
sample can be detected using VSFS almost immediately after exposure to
oxygen.
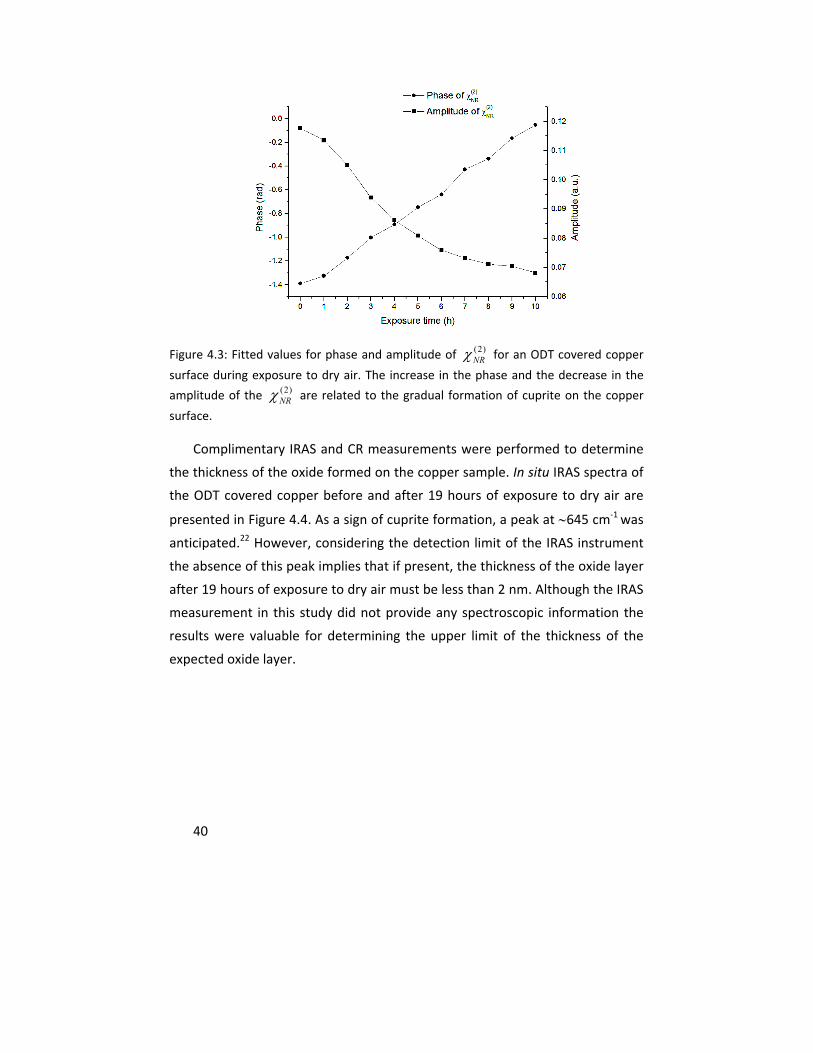
40
Figure 4.3: Fitted values for phase and amplitude of (2)NR for an ODT covered copper
surface during exposure to dry air. The increase in the phase and the decrease in the
amplitude of the (2)NR are related to the gradual formation of cuprite on the copper
surface.
Complimentary IRAS and CR measurements were performed to determine
the thickness of the oxide formed on the copper sample. In situ IRAS spectra of
the ODT covered copper before and after 19 hours of exposure to dry air are
presented in Figure 4.4. As a sign of cuprite formation, a peak at 645 cm‐1 was
anticipated.22 However, considering the detection limit of the IRAS instrument
the absence of this peak implies that if present, the thickness of the oxide layer
after 19 hours of exposure to dry air must be less than 2 nm. Although the IRAS
measurement in this study did not provide any spectroscopic information the
results were valuable for determining the upper limit of the thickness of the
expected oxide layer.
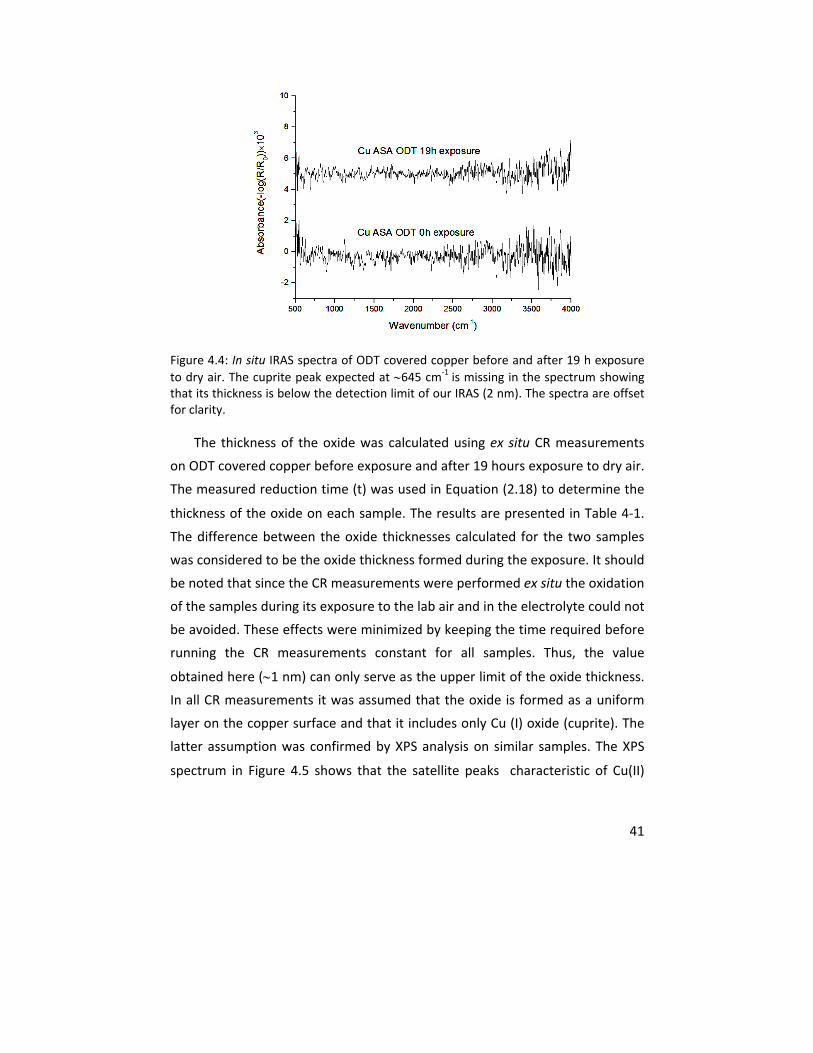
41
Figure 4.4: In situ IRAS spectra of ODT covered copper before and after 19 h exposure to dry air. The cuprite peak expected at 645 cm‐1 is missing in the spectrum showing that its thickness is below the detection limit of our IRAS (2 nm). The spectra are offset for clarity.
The thickness of the oxide was calculated using ex situ CR measurements
on ODT covered copper before exposure and after 19 hours exposure to dry air.
The measured reduction time (t) was used in Equation (2.18) to determine the
thickness of the oxide on each sample. The results are presented in Table 4‐1.
The difference between the oxide thicknesses calculated for the two samples
was considered to be the oxide thickness formed during the exposure. It should
be noted that since the CR measurements were performed ex situ the oxidation
of the samples during its exposure to the lab air and in the electrolyte could not
be avoided. These effects were minimized by keeping the time required before
running the CR measurements constant for all samples. Thus, the value
obtained here (1 nm) can only serve as the upper limit of the oxide thickness.
In all CR measurements it was assumed that the oxide is formed as a uniform
layer on the copper surface and that it includes only Cu (I) oxide (cuprite). The
latter assumption was confirmed by XPS analysis on similar samples. The XPS
spectrum in Figure 4.5 shows that the satellite peaks characteristic of Cu(II)
42
oxide (CuO), at 941.6 eV and 943.8 eV, are absent in the spectrum and only
peaks related to metallic copper and Cu(I) oxide (Cu2O) were detected.82
Figure 4.5: X‐ray photoelectron spectrum of the Cu 2p region of a Cu sample covered with ODT exposed to dry air for 20 h. It confirms the absence of satellite peaks at 941.6 eV and 943.8 eV, characteristic of CuO and corresponding to the formation of Cu2+ species at the surface of the electrode.
Table 4‐1: Average thickness of the Cu2O formed on exposed and unexposed ODT covered copper measured by cathodic reduction.
Sample Oxide thickness (nm) ± 0.3
Cu ASA ODT before exposure 0.5
Cu ASA ODT after 19h exposure 1.5
Summarizing the results presented here, it is obvious that VSFS has a
significantly enhanced ability in detecting very thin oxide films compared to
other techniques used in atmospheric corrosion studies, IRAS and CR. Careful
analysis of the nonresonant contribution of the VSF signal provides useful
information regarding the oxidation of SAM covered samples in different
atmospheres.
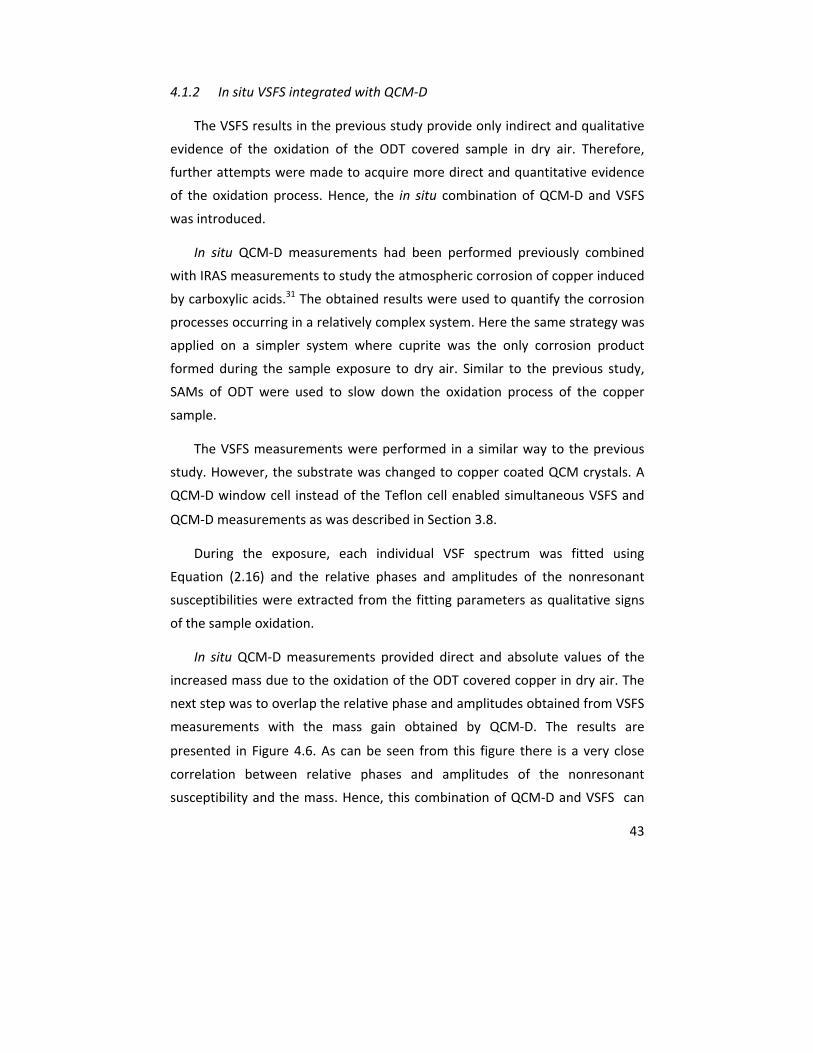
43
4.1.2 In situ VSFS integrated with QCM‐D
The VSFS results in the previous study provide only indirect and qualitative
evidence of the oxidation of the ODT covered sample in dry air. Therefore,
further attempts were made to acquire more direct and quantitative evidence
of the oxidation process. Hence, the in situ combination of QCM‐D and VSFS
was introduced.
In situ QCM‐D measurements had been performed previously combined
with IRAS measurements to study the atmospheric corrosion of copper induced
by carboxylic acids.31 The obtained results were used to quantify the corrosion
processes occurring in a relatively complex system. Here the same strategy was
applied on a simpler system where cuprite was the only corrosion product
formed during the sample exposure to dry air. Similar to the previous study,
SAMs of ODT were used to slow down the oxidation process of the copper
sample.
The VSFS measurements were performed in a similar way to the previous
study. However, the substrate was changed to copper coated QCM crystals. A
QCM‐D window cell instead of the Teflon cell enabled simultaneous VSFS and
QCM‐D measurements as was described in Section 3.8.
During the exposure, each individual VSF spectrum was fitted using
Equation (2.16) and the relative phases and amplitudes of the nonresonant
susceptibilities were extracted from the fitting parameters as qualitative signs
of the sample oxidation.
In situ QCM‐D measurements provided direct and absolute values of the
increased mass due to the oxidation of the ODT covered copper in dry air. The
next step was to overlap the relative phase and amplitudes obtained from VSFS
measurements with the mass gain obtained by QCM‐D. The results are
presented in Figure 4.6. As can be seen from this figure there is a very close
correlation between relative phases and amplitudes of the nonresonant
susceptibility and the mass. Hence, this combination of QCM‐D and VSFS can
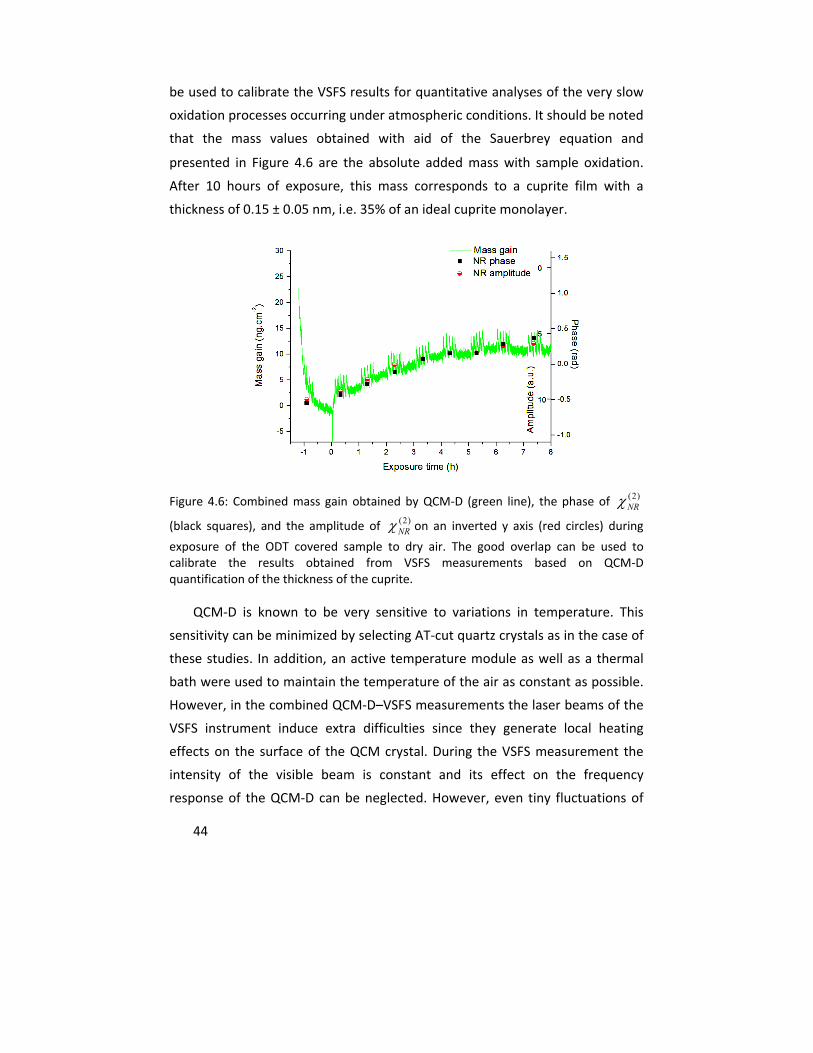
44
be used to calibrate the VSFS results for quantitative analyses of the very slow
oxidation processes occurring under atmospheric conditions. It should be noted
that the mass values obtained with aid of the Sauerbrey equation and
presented in Figure 4.6 are the absolute added mass with sample oxidation.
After 10 hours of exposure, this mass corresponds to a cuprite film with a
thickness of 0.15 ± 0.05 nm, i.e. 35% of an ideal cuprite monolayer.
Figure 4.6: Combined mass gain obtained by QCM‐D (green line), the phase of (2)NR
(black squares), and the amplitude of (2)NR on an inverted y axis (red circles) during
exposure of the ODT covered sample to dry air. The good overlap can be used to calibrate the results obtained from VSFS measurements based on QCM‐D quantification of the thickness of the cuprite.
QCM‐D is known to be very sensitive to variations in temperature. This
sensitivity can be minimized by selecting AT‐cut quartz crystals as in the case of
these studies. In addition, an active temperature module as well as a thermal
bath were used to maintain the temperature of the air as constant as possible.
However, in the combined QCM‐D–VSFS measurements the laser beams of the
VSFS instrument induce extra difficulties since they generate local heating
effects on the surface of the QCM crystal. During the VSFS measurement the
intensity of the visible beam is constant and its effect on the frequency
response of the QCM‐D can be neglected. However, even tiny fluctuations of
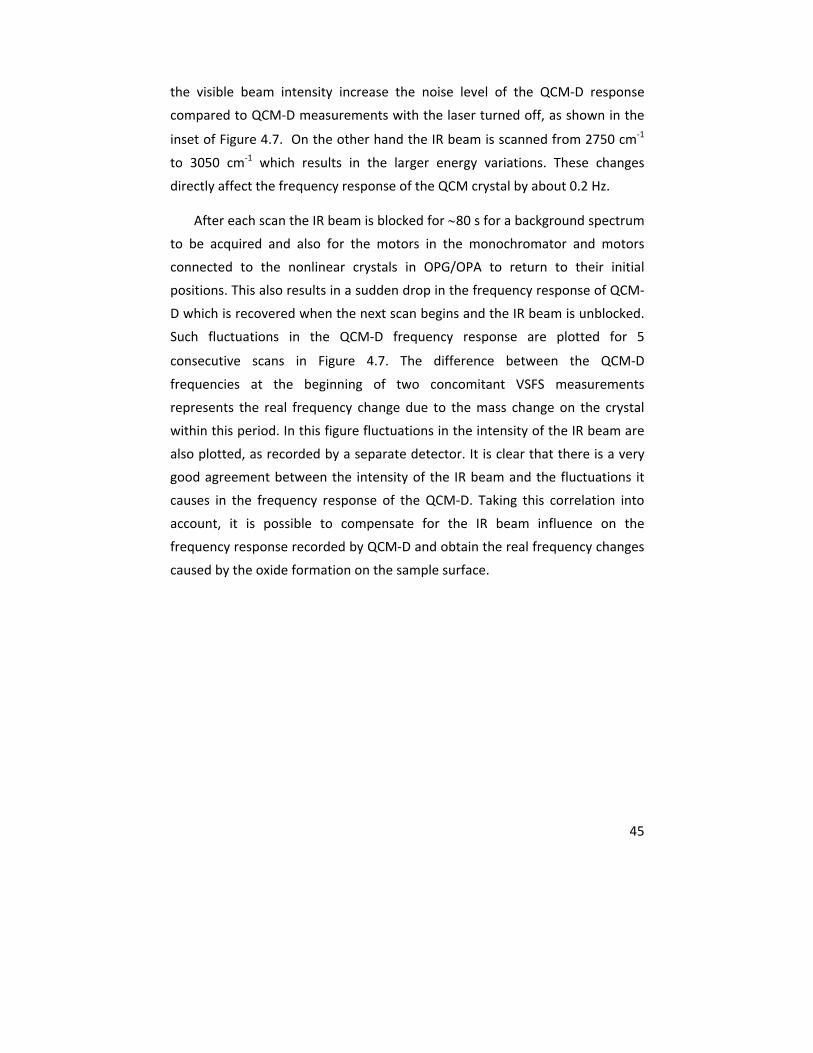
45
the visible beam intensity increase the noise level of the QCM‐D response
compared to QCM‐D measurements with the laser turned off, as shown in the
inset of Figure 4.7. On the other hand the IR beam is scanned from 2750 cm‐1
to 3050 cm‐1 which results in the larger energy variations. These changes
directly affect the frequency response of the QCM crystal by about 0.2 Hz.
After each scan the IR beam is blocked for 80 s for a background spectrum
to be acquired and also for the motors in the monochromator and motors
connected to the nonlinear crystals in OPG/OPA to return to their initial
positions. This also results in a sudden drop in the frequency response of QCM‐
D which is recovered when the next scan begins and the IR beam is unblocked.
Such fluctuations in the QCM‐D frequency response are plotted for 5
consecutive scans in Figure 4.7. The difference between the QCM‐D
frequencies at the beginning of two concomitant VSFS measurements
represents the real frequency change due to the mass change on the crystal
within this period. In this figure fluctuations in the intensity of the IR beam are
also plotted, as recorded by a separate detector. It is clear that there is a very
good agreement between the intensity of the IR beam and the fluctuations it
causes in the frequency response of the QCM‐D. Taking this correlation into
account, it is possible to compensate for the IR beam influence on the
frequency response recorded by QCM‐D and obtain the real frequency changes
caused by the oxide formation on the sample surface.
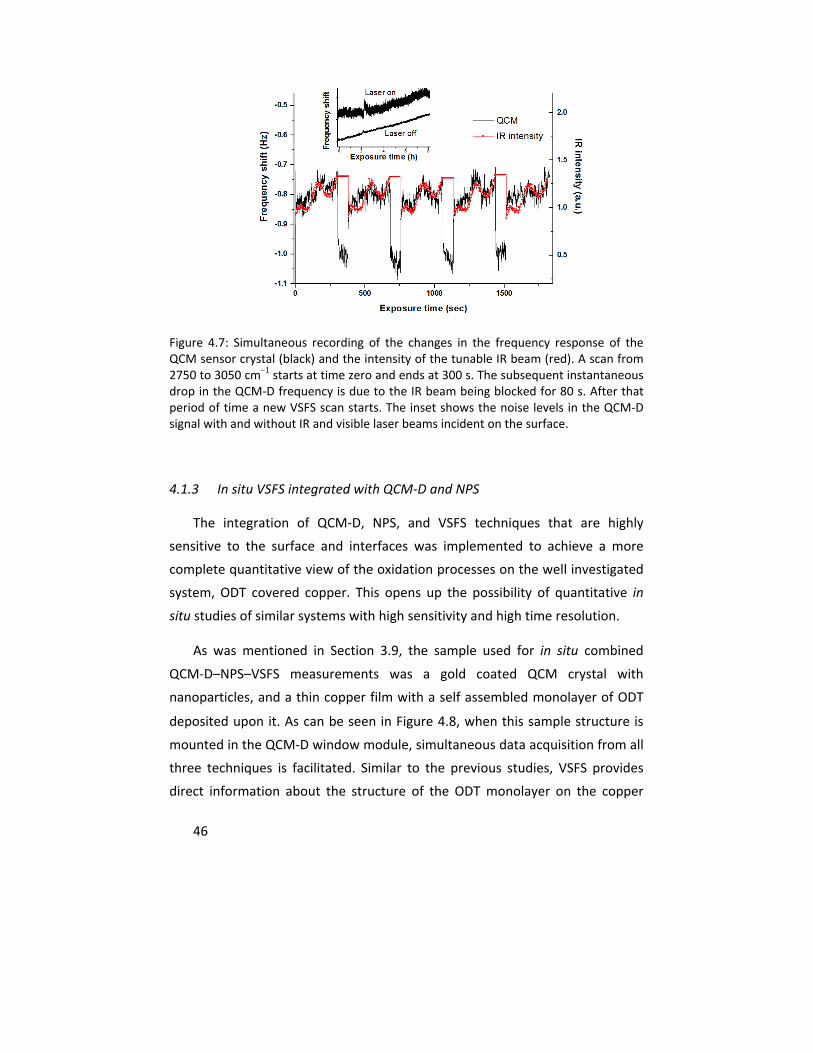
46
Figure 4.7: Simultaneous recording of the changes in the frequency response of the QCM sensor crystal (black) and the intensity of the tunable IR beam (red). A scan from 2750 to 3050 cm−1 starts at time zero and ends at 300 s. The subsequent instantaneous drop in the QCM‐D frequency is due to the IR beam being blocked for 80 s. After that period of time a new VSFS scan starts. The inset shows the noise levels in the QCM‐D signal with and without IR and visible laser beams incident on the surface.
4.1.3 In situ VSFS integrated with QCM‐D and NPS
The integration of QCM‐D, NPS, and VSFS techniques that are highly
sensitive to the surface and interfaces was implemented to achieve a more
complete quantitative view of the oxidation processes on the well investigated
system, ODT covered copper. This opens up the possibility of quantitative in
situ studies of similar systems with high sensitivity and high time resolution.
As was mentioned in Section 3.9, the sample used for in situ combined
QCM‐D–NPS–VSFS measurements was a gold coated QCM crystal with
nanoparticles, and a thin copper film with a self assembled monolayer of ODT
deposited upon it. As can be seen in Figure 4.8, when this sample structure is
mounted in the QCM‐D window module, simultaneous data acquisition from all
three techniques is facilitated. Similar to the previous studies, VSFS provides
direct information about the structure of the ODT monolayer on the copper
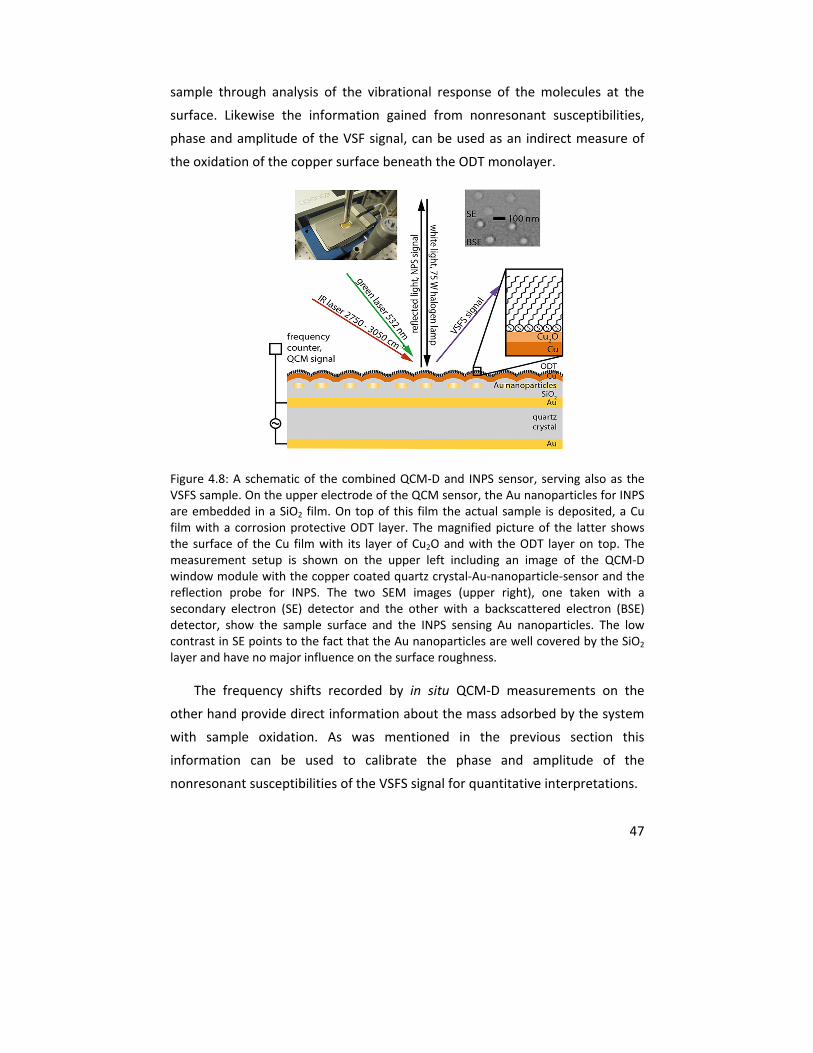
47
sample through analysis of the vibrational response of the molecules at the
surface. Likewise the information gained from nonresonant susceptibilities,
phase and amplitude of the VSF signal, can be used as an indirect measure of
the oxidation of the copper surface beneath the ODT monolayer.
Figure 4.8: A schematic of the combined QCM‐D and INPS sensor, serving also as the VSFS sample. On the upper electrode of the QCM sensor, the Au nanoparticles for INPS are embedded in a SiO2 film. On top of this film the actual sample is deposited, a Cu film with a corrosion protective ODT layer. The magnified picture of the latter shows the surface of the Cu film with its layer of Cu2O and with the ODT layer on top. The measurement setup is shown on the upper left including an image of the QCM‐D window module with the copper coated quartz crystal‐Au‐nanoparticle‐sensor and the reflection probe for INPS. The two SEM images (upper right), one taken with a secondary electron (SE) detector and the other with a backscattered electron (BSE) detector, show the sample surface and the INPS sensing Au nanoparticles. The low contrast in SE points to the fact that the Au nanoparticles are well covered by the SiO2 layer and have no major influence on the surface roughness.
The frequency shifts recorded by in situ QCM‐D measurements on the
other hand provide direct information about the mass adsorbed by the system
with sample oxidation. As was mentioned in the previous section this
information can be used to calibrate the phase and amplitude of the
nonresonant susceptibilities of the VSFS signal for quantitative interpretations.

48
Information gained from the indirect nanoplasmonic sensing integrated
with QCM‐D and VSFS adds another dimension to the quantification of the
oxidation of the samples, with the great sensitivity of INPS to local changes in
optical properties close to the sensing particles, as well as its high time
resolution. Although the sensing mechanism for NPS measurements is very
different from that for QCM‐D and VSFS measurements, the results from all
these techniques showed a very clear agreement. For NPS the shifts of the LSPR
peak position max were recorded during the sample exposure. This is a very
sensitive measure of the change of the surface optical properties with sample
oxidation. In Figure 4.9 the simultaneous in situ measures of the “primary”
observables, namely the frequency response f or mass change measured by
QCM‐D, shifts of the LSPR peaks max measured by NPS, and phase and
amplitude of the nonresonant susceptibilities of the VSF spectra are presented.
Clearly all three techniques are sensitive to the changes connected to the
oxidation of the ODT covered copper, i.e. the formation of Cu2O. As can be
seen all observations show very similar changes during sample exposure. In
fact, the frequency changes and the changes of the LSPR peak positions can be
quantitatively connected using a linear relationship where a 1 nm shift in
max corresponds to a 4.6 ng/cm2 mass gain. Similarly, the phase and the
amplitude of the nonresonant susceptibilities can be related to f . The fitted
amplitudes correlate linearly with the f values and the phase values can to a
first approximation also be linearly correlated with f .
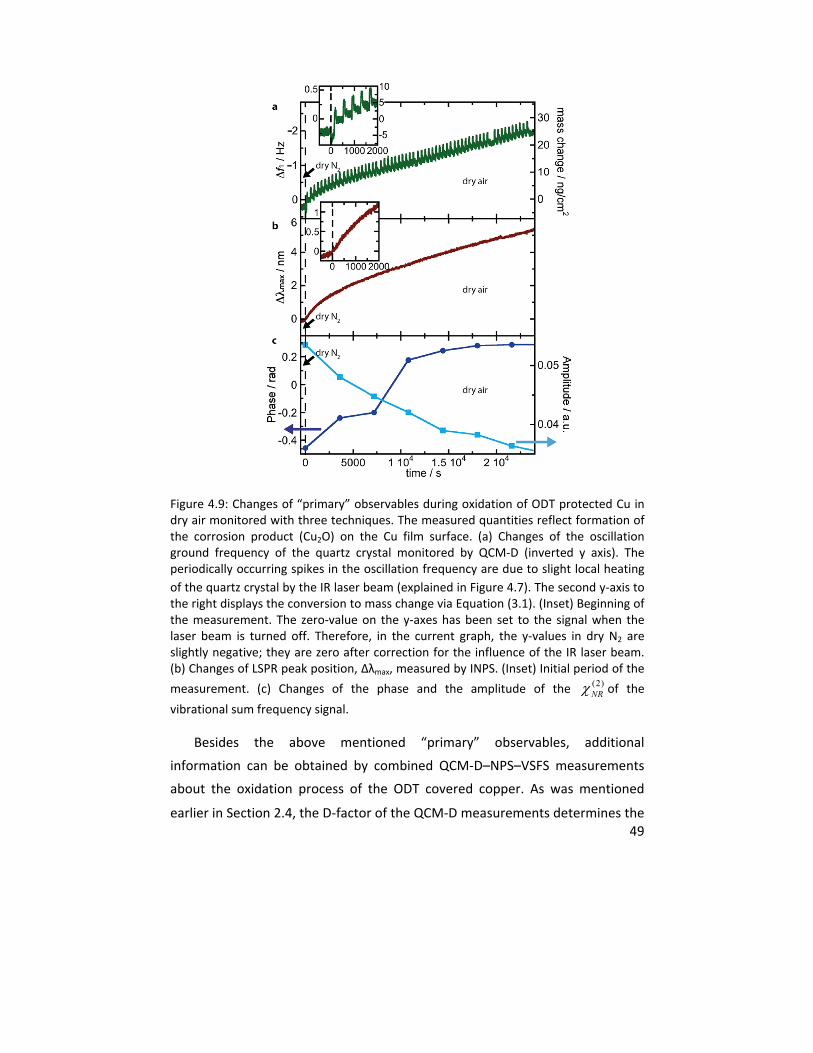
49
Figure 4.9: Changes of “primary” observables during oxidation of ODT protected Cu in dry air monitored with three techniques. The measured quantities reflect formation of the corrosion product (Cu2O) on the Cu film surface. (a) Changes of the oscillation ground frequency of the quartz crystal monitored by QCM‐D (inverted y axis). The periodically occurring spikes in the oscillation frequency are due to slight local heating
of the quartz crystal by the IR laser beam (explained in Figure 4.7). The second y‐axis to the right displays the conversion to mass change via Equation (3.1). (Inset) Beginning of the measurement. The zero‐value on the y‐axes has been set to the signal when the laser beam is turned off. Therefore, in the current graph, the y‐values in dry N2 are slightly negative; they are zero after correction for the influence of the IR laser beam. (b) Changes of LSPR peak position, Δλmax, measured by INPS. (Inset) Initial period of the
measurement. (c) Changes of the phase and the amplitude of the (2)NR of the
vibrational sum frequency signal.
Besides the above mentioned “primary” observables, additional
information can be obtained by combined QCM‐D–NPS–VSFS measurements
about the oxidation process of the ODT covered copper. As was mentioned
earlier in Section 2.4, the D‐factor of the QCM‐D measurements determines the
50
damping of the oscillation frequency as a measure for the rigidity of the
adsorbed film. Furthermore the changes of the reflection amplitudes and width
of the LSPR peaks measured with NPS also include important information
regarding the LSPR lifetime or heterogeneity of the changes on the surface.
These parameters are referred to as “secondary” observables and are recorded
at the same time as the “primary” observables.
As can be seen in Figure 4.10a, the damping factor in QCM‐D after 500
seconds exposure time becomes almost constant. This implies the formation of
a rigid film on the sample surface, which is in line with the formation of a water
free copper oxide layer. An initial small and rapid increase in the damping
during the first 500 seconds of the exposure is most likely due to changes in
surface properties. Figure 4.10b shows the changes of the reflection amplitudes
(∆reflection) as well as the changes of the LSPR peak width (∆peak width)
during the exposure. The moderate and linear increase of the peak width
(increase of 15 nm or ca. 10% of the initial value during 8 h exposure) indicates
the formation of a homogeneous oxide layer on the surface, in contrast to the
cases where localized corrosion results in the change of the peak width of more
than 100 nm (ca. 50% of the original value).75 The ∆reflection parameter
showed different behavior during the first hour of exposure and later on. This
might be due to different oxidation processes occurring at these stages.
However the exact interpretation of this parameter is not clear at this stage
and requires further investigation.
Another “secondary” observable presented in Figure 4.10c is the ratio
between the fitted amplitude of the symmetric CH2 to symmetric CH3 stretching
vibrations. As was discussed in Section 4.1.1, this ratio serves as an indication
of the degree of ordering of the SAMs and the amount of gauche defects in
their structure. The results presented here show no systematic trend in this
ratio, indicating that the ODT monolayer retains its molecular structure during
oxidation. This observation is very different when similar samples are exposed
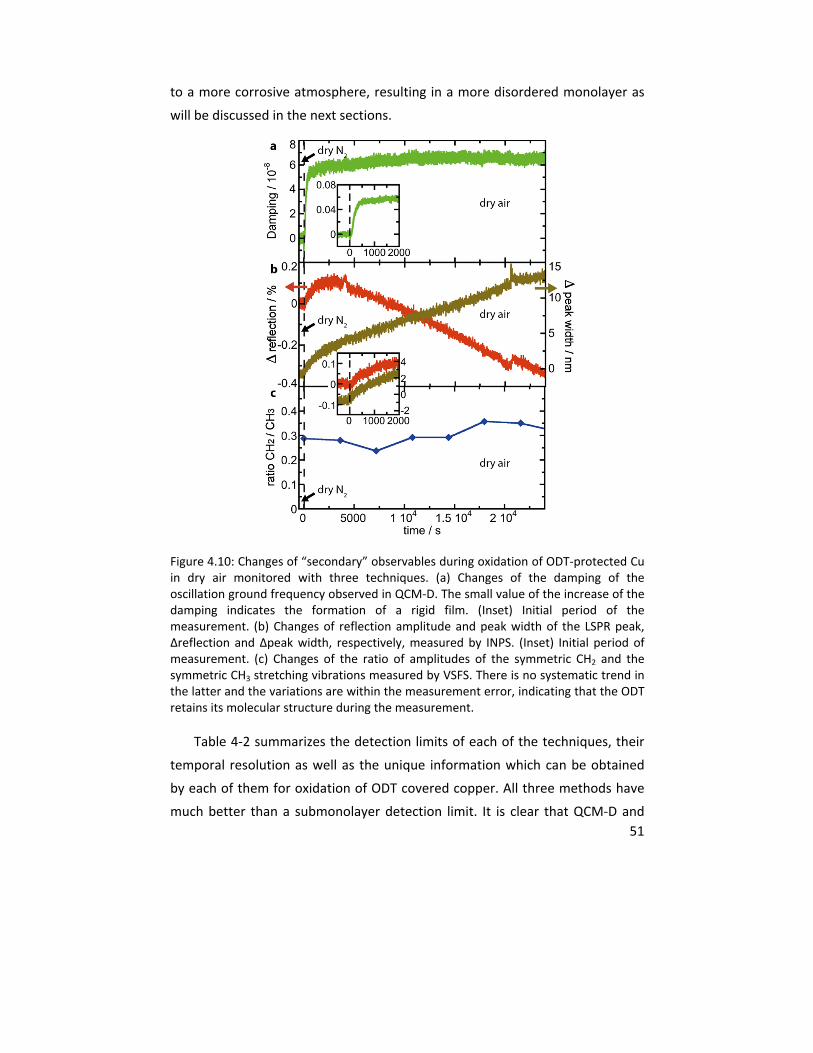
51
to a more corrosive atmosphere, resulting in a more disordered monolayer as
will be discussed in the next sections.
Figure 4.10: Changes of “secondary” observables during oxidation of ODT‐protected Cu in dry air monitored with three techniques. (a) Changes of the damping of the oscillation ground frequency observed in QCM‐D. The small value of the increase of the damping indicates the formation of a rigid film. (Inset) Initial period of the measurement. (b) Changes of reflection amplitude and peak width of the LSPR peak, Δreflection and Δpeak width, respectively, measured by INPS. (Inset) Initial period of measurement. (c) Changes of the ratio of amplitudes of the symmetric CH2 and the symmetric CH3 stretching vibrations measured by VSFS. There is no systematic trend in the latter and the variations are within the measurement error, indicating that the ODT retains its molecular structure during the measurement.
Table 4‐2 summarizes the detection limits of each of the techniques, their
temporal resolution as well as the unique information which can be obtained
by each of them for oxidation of ODT covered copper. All three methods have
much better than a submonolayer detection limit. It is clear that QCM‐D and
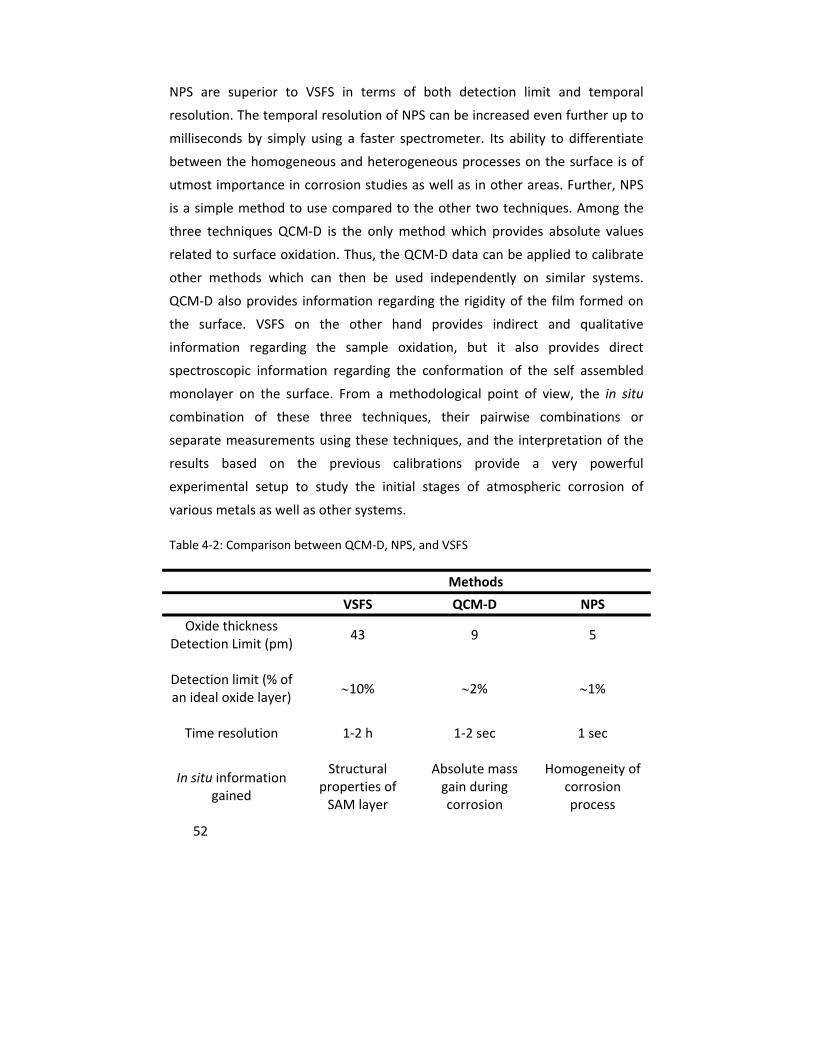
52
NPS are superior to VSFS in terms of both detection limit and temporal
resolution. The temporal resolution of NPS can be increased even further up to
milliseconds by simply using a faster spectrometer. Its ability to differentiate
between the homogeneous and heterogeneous processes on the surface is of
utmost importance in corrosion studies as well as in other areas. Further, NPS
is a simple method to use compared to the other two techniques. Among the
three techniques QCM‐D is the only method which provides absolute values
related to surface oxidation. Thus, the QCM‐D data can be applied to calibrate
other methods which can then be used independently on similar systems.
QCM‐D also provides information regarding the rigidity of the film formed on
the surface. VSFS on the other hand provides indirect and qualitative
information regarding the sample oxidation, but it also provides direct
spectroscopic information regarding the conformation of the self assembled
monolayer on the surface. From a methodological point of view, the in situ
combination of these three techniques, their pairwise combinations or
separate measurements using these techniques, and the interpretation of the
results based on the previous calibrations provide a very powerful
experimental setup to study the initial stages of atmospheric corrosion of
various metals as well as other systems.
Table 4‐2: Comparison between QCM‐D, NPS, and VSFS
Methods
VSFS QCM‐D NPS
Oxide thickness Detection Limit (pm)
43 9 5
Detection limit (% of an ideal oxide layer)
10% 2% 1%
Time resolution 1‐2 h 1‐2 sec 1 sec
In situ information gained
Structural properties of SAM layer
Absolute mass gain during corrosion
Homogeneity of corrosion process
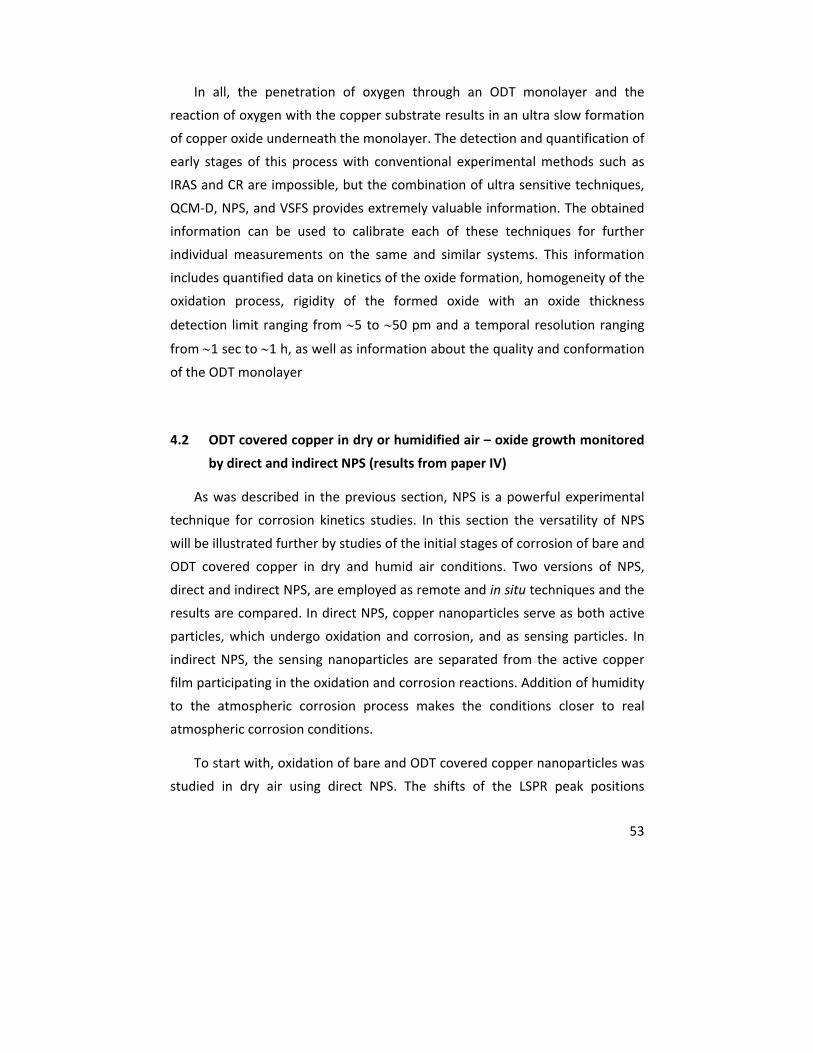
53
In all, the penetration of oxygen through an ODT monolayer and the
reaction of oxygen with the copper substrate results in an ultra slow formation
of copper oxide underneath the monolayer. The detection and quantification of
early stages of this process with conventional experimental methods such as
IRAS and CR are impossible, but the combination of ultra sensitive techniques,
QCM‐D, NPS, and VSFS provides extremely valuable information. The obtained
information can be used to calibrate each of these techniques for further
individual measurements on the same and similar systems. This information
includes quantified data on kinetics of the oxide formation, homogeneity of the
oxidation process, rigidity of the formed oxide with an oxide thickness
detection limit ranging from 5 to 50 pm and a temporal resolution ranging
from 1 sec to 1 h, as well as information about the quality and conformation
of the ODT monolayer
4.2 ODT covered copper in dry or humidified air – oxide growth monitored
by direct and indirect NPS (results from paper IV)
As was described in the previous section, NPS is a powerful experimental
technique for corrosion kinetics studies. In this section the versatility of NPS
will be illustrated further by studies of the initial stages of corrosion of bare and
ODT covered copper in dry and humid air conditions. Two versions of NPS,
direct and indirect NPS, are employed as remote and in situ techniques and the
results are compared. In direct NPS, copper nanoparticles serve as both active
particles, which undergo oxidation and corrosion, and as sensing particles. In
indirect NPS, the sensing nanoparticles are separated from the active copper
film participating in the oxidation and corrosion reactions. Addition of humidity
to the atmospheric corrosion process makes the conditions closer to real
atmospheric corrosion conditions.
To start with, oxidation of bare and ODT covered copper nanoparticles was
studied in dry air using direct NPS. The shifts of the LSPR peak positions
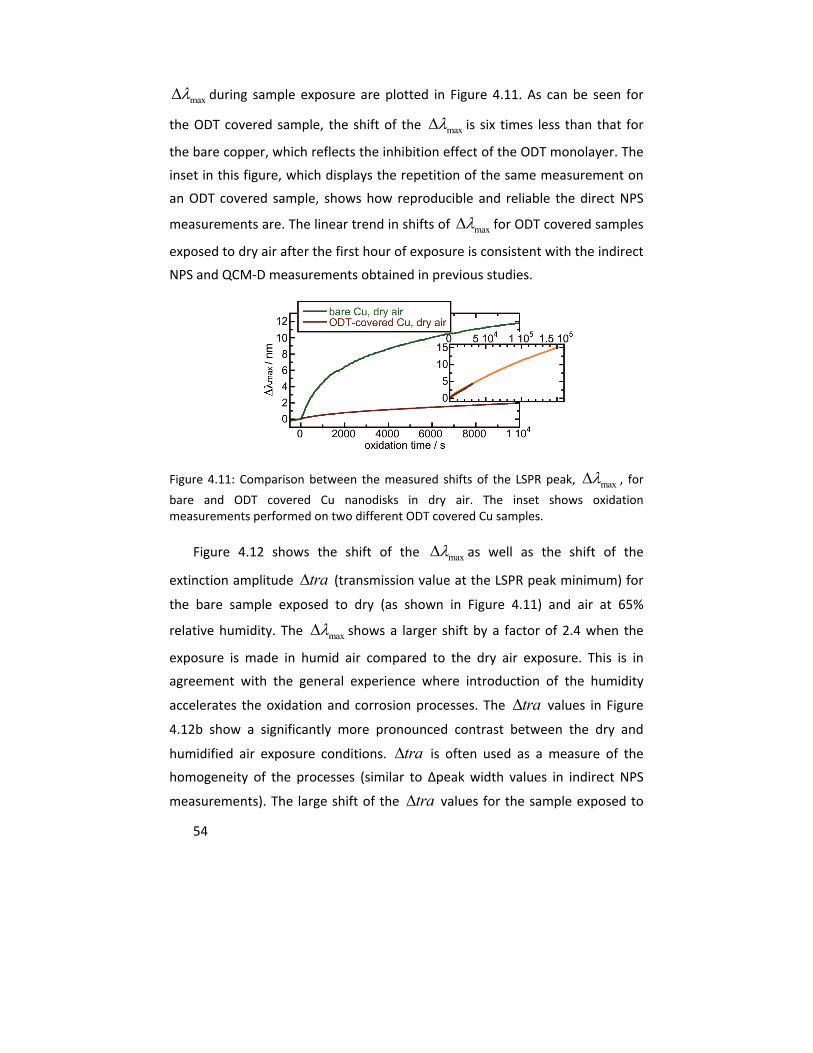
54
max during sample exposure are plotted in Figure 4.11. As can be seen for
the ODT covered sample, the shift of the max is six times less than that for
the bare copper, which reflects the inhibition effect of the ODT monolayer. The
inset in this figure, which displays the repetition of the same measurement on
an ODT covered sample, shows how reproducible and reliable the direct NPS
measurements are. The linear trend in shifts of max for ODT covered samples
exposed to dry air after the first hour of exposure is consistent with the indirect
NPS and QCM‐D measurements obtained in previous studies.
Figure 4.11: Comparison between the measured shifts of the LSPR peak, max , for
bare and ODT covered Cu nanodisks in dry air. The inset shows oxidation measurements performed on two different ODT covered Cu samples.
Figure 4.12 shows the shift of the max as well as the shift of the
extinction amplitude tra (transmission value at the LSPR peak minimum) for
the bare sample exposed to dry (as shown in Figure 4.11) and air at 65%
relative humidity. The max shows a larger shift by a factor of 2.4 when the
exposure is made in humid air compared to the dry air exposure. This is in
agreement with the general experience where introduction of the humidity
accelerates the oxidation and corrosion processes. The tra values in Figure
4.12b show a significantly more pronounced contrast between the dry and
humidified air exposure conditions. tra is often used as a measure of the
homogeneity of the processes (similar to ∆peak width values in indirect NPS
measurements). The large shift of the tra values for the sample exposed to
55
humid air indicates a heterogeneous or localized oxidation processes on the
surface of the copper nanoparticles. The localized oxidation process can start at
defects at the surface such as grain boundaries or other inhomogeneities.
Figure 4.12: (a) Shifts of max observed during the oxidation of bare Cu nanodisks in
dry and humid air (65 ± 5% RH). (b) The corresponding changes of tra for the experiment displayed in (a).
Similarly, the shift of max is larger when the ODT covered sample is
exposed to humidified air compared to dry air exposure (the same result as in
Figure 4.11), as is shown in Figure 4.13a. The initial and sudden rise of max in
the case of humid air exposure was attributed to the adsorption of water on
the sample.
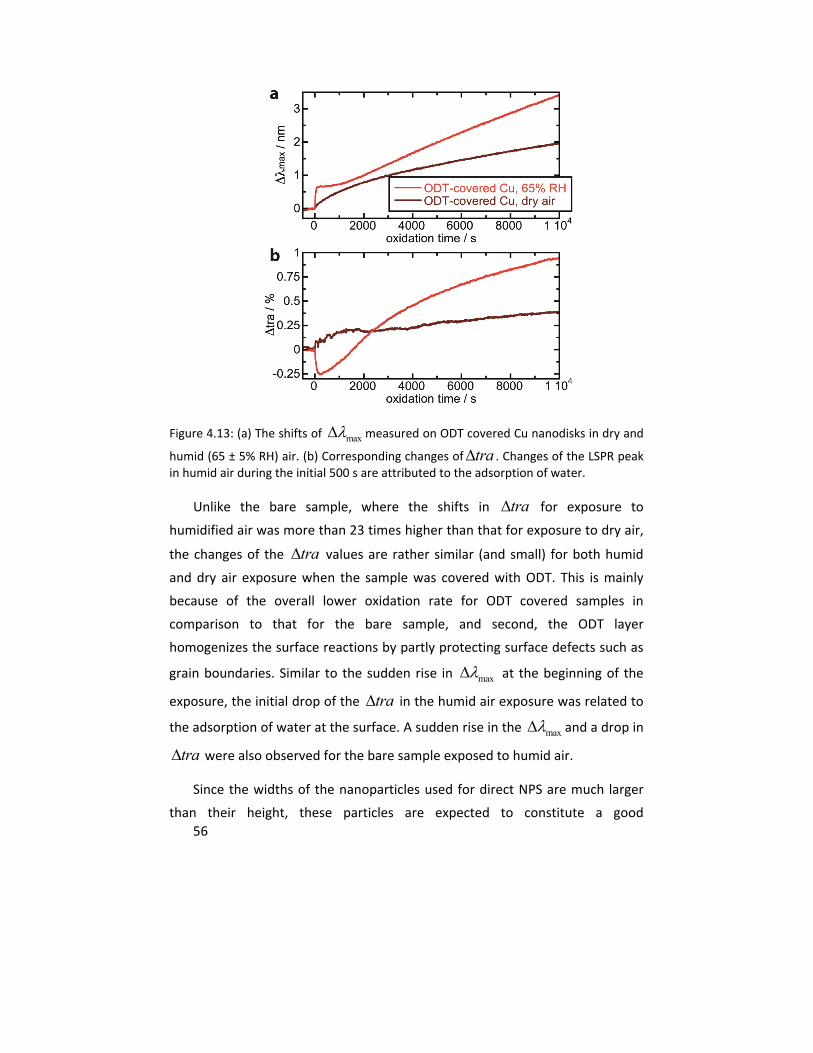
56
Figure 4.13: (a) The shifts of max measured on ODT covered Cu nanodisks in dry and
humid (65 ± 5% RH) air. (b) Corresponding changes of tra . Changes of the LSPR peak in humid air during the initial 500 s are attributed to the adsorption of water.
Unlike the bare sample, where the shifts in tra for exposure to
humidified air was more than 23 times higher than that for exposure to dry air,
the changes of the tra values are rather similar (and small) for both humid
and dry air exposure when the sample was covered with ODT. This is mainly
because of the overall lower oxidation rate for ODT covered samples in
comparison to that for the bare sample, and second, the ODT layer
homogenizes the surface reactions by partly protecting surface defects such as
grain boundaries. Similar to the sudden rise in max at the beginning of the
exposure, the initial drop of the tra in the humid air exposure was related to
the adsorption of water at the surface. A sudden rise in the max and a drop in
tra were also observed for the bare sample exposed to humid air.
Since the widths of the nanoparticles used for direct NPS are much larger
than their height, these particles are expected to constitute a good
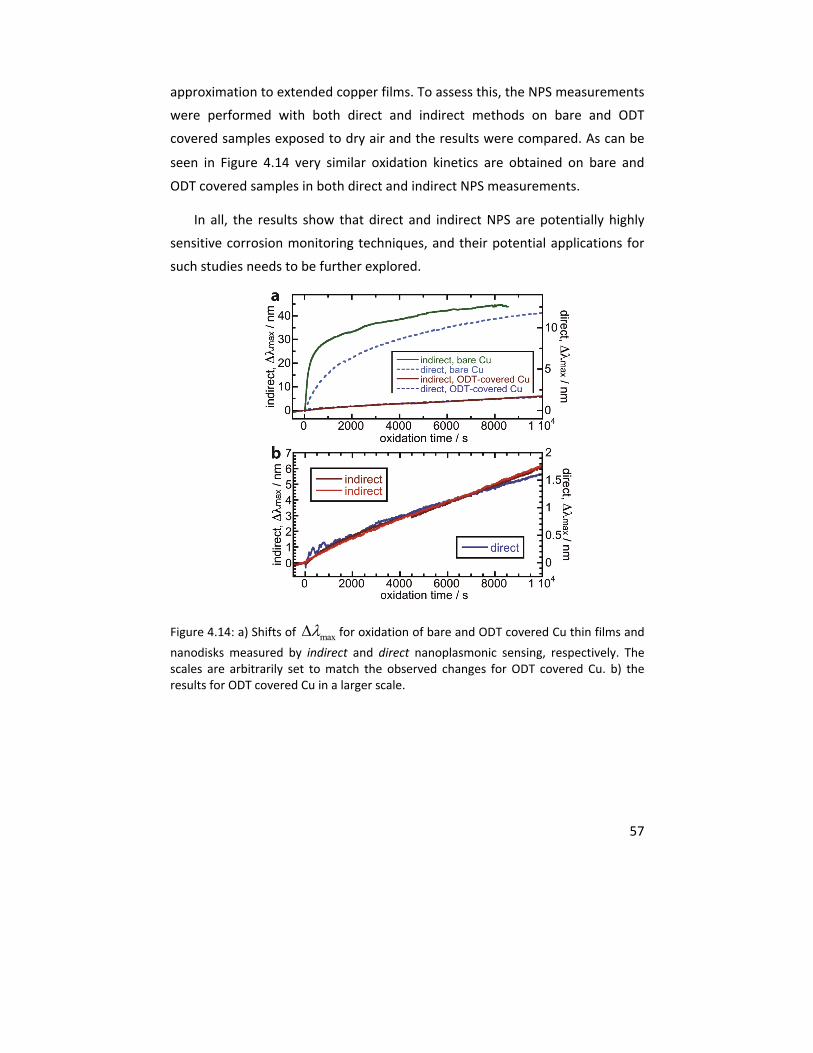
57
approximation to extended copper films. To assess this, the NPS measurements
were performed with both direct and indirect methods on bare and ODT
covered samples exposed to dry air and the results were compared. As can be
seen in Figure 4.14 very similar oxidation kinetics are obtained on bare and
ODT covered samples in both direct and indirect NPS measurements.
In all, the results show that direct and indirect NPS are potentially highly
sensitive corrosion monitoring techniques, and their potential applications for
such studies needs to be further explored.
Figure 4.14: a) Shifts of max for oxidation of bare and ODT covered Cu thin films and
nanodisks measured by indirect and direct nanoplasmonic sensing, respectively. The scales are arbitrarily set to match the observed changes for ODT covered Cu. b) the results for ODT covered Cu in a larger scale.
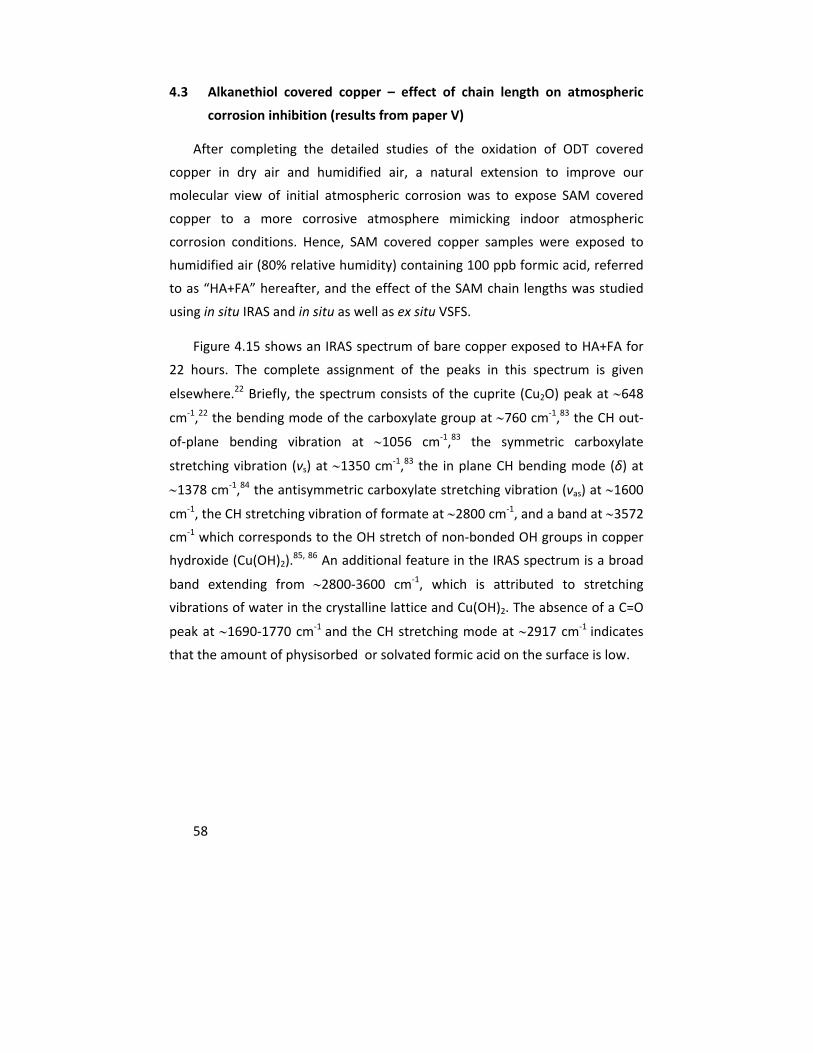
58
4.3 Alkanethiol covered copper – effect of chain length on atmospheric
corrosion inhibition (results from paper V)
After completing the detailed studies of the oxidation of ODT covered
copper in dry air and humidified air, a natural extension to improve our
molecular view of initial atmospheric corrosion was to expose SAM covered
copper to a more corrosive atmosphere mimicking indoor atmospheric
corrosion conditions. Hence, SAM covered copper samples were exposed to
humidified air (80% relative humidity) containing 100 ppb formic acid, referred
to as “HA+FA” hereafter, and the effect of the SAM chain lengths was studied
using in situ IRAS and in situ as well as ex situ VSFS.
Figure 4.15 shows an IRAS spectrum of bare copper exposed to HA+FA for
22 hours. The complete assignment of the peaks in this spectrum is given
elsewhere.22 Briefly, the spectrum consists of the cuprite (Cu2O) peak at 648
cm‐1,22 the bending mode of the carboxylate group at 760 cm‐1,83 the CH out‐
of‐plane bending vibration at 1056 cm‐1,83 the symmetric carboxylate
stretching vibration (νs) at 1350 cm‐1,83 the in plane CH bending mode (δ) at
1378 cm‐1,84 the antisymmetric carboxylate stretching vibration (νas) at 1600
cm‐1, the CH stretching vibration of formate at 2800 cm‐1, and a band at 3572
cm‐1 which corresponds to the OH stretch of non‐bonded OH groups in copper
hydroxide (Cu(OH)2).85, 86 An additional feature in the IRAS spectrum is a broad
band extending from 2800‐3600 cm‐1, which is attributed to stretching
vibrations of water in the crystalline lattice and Cu(OH)2. The absence of a C=O
peak at 1690‐1770 cm‐1 and the CH stretching mode at 2917 cm‐1
indicates
that the amount of physisorbed or solvated formic acid on the surface is low.
59
Figure 4.15: In situ IRAS spectrum of bare copper exposed to corrosive air containing 80% relative humidity and 100 ppb formic acid for 22 h. The main corrosion products were identified as cuprite, copper formate, and copper hydroxide, and show main
vibrational peaks at 645 cm‐1, 1600 cm‐1, and 3572 cm‐1.
The rate of the increase in the intensity of the peaks related to each of
these vibrations for the bare sample exposed to HA+FA is shown in Figure 4.16.
As can be seen in this figure a very distinct and strong peak related to the
formation of cuprite (Cu2O), observed at 648 cm‐1, can be detected already
after a short exposure time. In contrast, the exposure of alkanethiol covered
samples with different chain lengths in HA+FA resulted in no formation of
cuprite, while the other peaks were observed with a delay depending on the
chain length of the alkanethiol deposited on the copper surface. An in situ IRAS
spectrum of a butanethiol covered sample after 50 hours of exposure to HA+FA
as well as the intensities of the antisymmetric formate (at 1600 cm‐1) and the
copper hydroxide OH stretch (at 3572 cm‐1) vibrations are plotted in Figure
4.17 and Figure 4.18, respectively. The peak at 1600 cm‐1 was chosen to
represent the formation of copper formate since it is the strongest peak in the
spectrum.
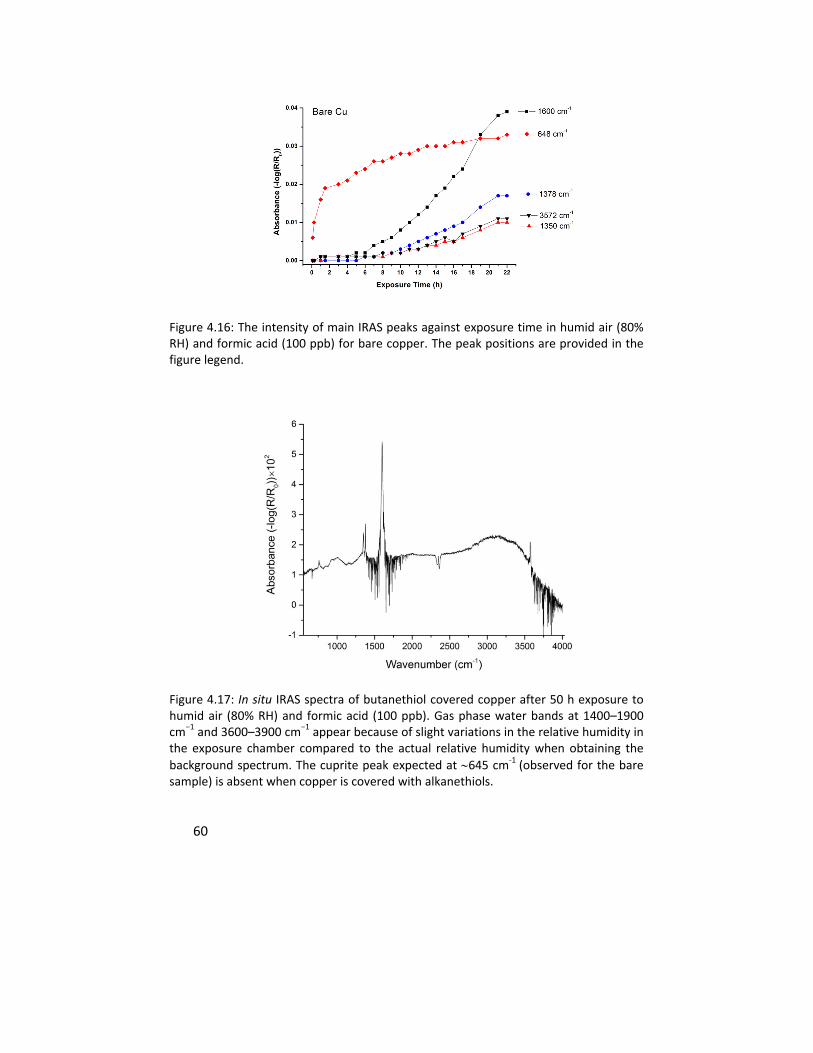
60
Figure 4.16: The intensity of main IRAS peaks against exposure time in humid air (80% RH) and formic acid (100 ppb) for bare copper. The peak positions are provided in the figure legend.
Figure 4.17: In situ IRAS spectra of butanethiol covered copper after 50 h exposure to humid air (80% RH) and formic acid (100 ppb). Gas phase water bands at 1400–1900 cm−1 and 3600–3900 cm−1 appear because of slight variations in the relative humidity in the exposure chamber compared to the actual relative humidity when obtaining the
background spectrum. The cuprite peak expected at 645 cm‐1 (observed for the bare sample) is absent when copper is covered with alkanethiols.
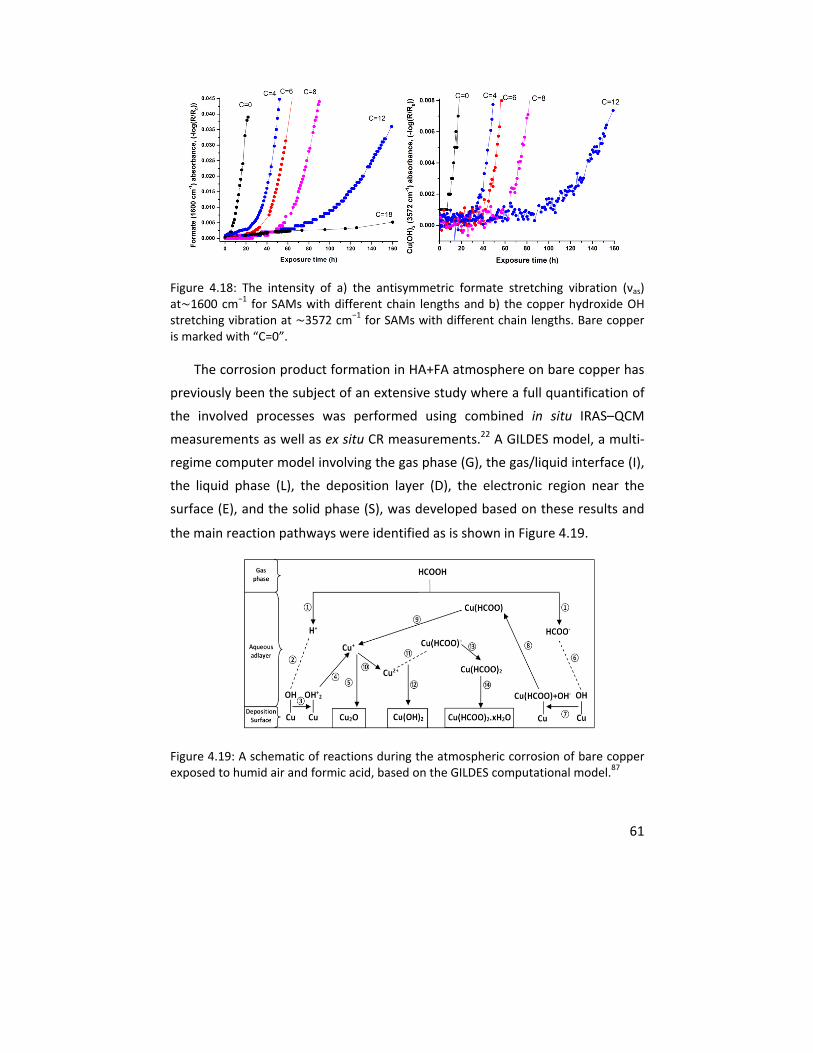
61
Figure 4.18: The intensity of a) the antisymmetric formate stretching vibration (νas) at∼1600 cm−1 for SAMs with different chain lengths and b) the copper hydroxide OH stretching vibration at ∼3572 cm−1 for SAMs with different chain lengths. Bare copper is marked with “C=0”.
The corrosion product formation in HA+FA atmosphere on bare copper has
previously been the subject of an extensive study where a full quantification of
the involved processes was performed using combined in situ IRAS–QCM
measurements as well as ex situ CR measurements.22 A GILDES model, a multi‐
regime computer model involving the gas phase (G), the gas/liquid interface (I),
the liquid phase (L), the deposition layer (D), the electronic region near the
surface (E), and the solid phase (S), was developed based on these results and
the main reaction pathways were identified as is shown in Figure 4.19.
Figure 4.19: A schematic of reactions during the atmospheric corrosion of bare copper exposed to humid air and formic acid, based on the GILDES computational model.87
62
Comparing the IRAS results obtained on bare sample and SAM covered
samples during their exposure to HA+FA, it is obvious that the reaction leading
to the formation of the cuprite, reaction (5) in the GILDES model, is retarded
when the samples are protected by SAMs. This was inferred to be a “selective
hindrance” of the corrosion stimulators (water, oxygen, and formic acid) to
reach the copper surface by the presence of SAMs. The increased delay in the
formation of other corrosion products, i.e. copper formate and copper
hydroxide, by increasing the SAM chain lengths was in agreement with the
previous studies,34, 80 showing enhanced corrosion protection for SAMs with
longer chains.
In situ and ex situ VSFS measurements were performed on alkanethiol
covered SAMs exposed to HA+FA to assess the quality of the monolayer during
corrosion of the sample. Figure 4.20 shows the in situ VSF spectra on a
hexanethiol covered sample during its exposure to HA+FA. Similar to what was
explained in Section 4.1, where the ODT covered sample was exposed to dry
air, the evolution of the VSF spectral shape was correlated with
oxidation/corrosion of the sample. However, the presence of formic acid in the
atmosphere results in more severe corrosion effects on the sample surface,
which manifests itself as the formation of copper formate and copper
hydroxide. It also causes an increase in the amount of gauche defects in the
structure of the SAMs, which can be identified by an increased ratio of the
amplitudes of the CH2/CH3 symmetric vibrations during exposure.

63
Figure 4.20: The normalized in situ VSF spectra of hexanethiol covered copper in dry nitrogen (before exposure) and during exposure to humid air (80% RH) and formic acid (100 ppb) for 20 h and 60 h, respectively. Experimental data are shown as empty squares, and fitted curves as black lines. For visual clarification some of the peak positions used in the fittings are marked with vertical dashed lines: the CH2 symmetric stretch (at ∼2855 cm‐1), the CH3 symmetric stretch (at ∼2875 cm‐1), the CH3 Fermi resonance (at ∼2938 cm‐1), and the out‐of‐plane CH3 antisymmetric stretch (at ∼2965 cm‐1). The evolution of the VSFS spectra is an indication of sample oxidation/corrosion. The relative intensity of the CH2/CH3 peaks increased with the exposure time and is a sign of the formation of more gauche defects during the corrosion of the sample . The spectra are offset for clarity.
In all, exposure of alkanethiol covered copper to humidified air containing
formic acid results in a detectable copper formate and copper hydroxide
formation, while no copper (I) oxide was detected by IRAS. The absence of
cuprite was attributed to a selective hindrance of water, oxygen, and formic
acid molecules to reach the copper‐SAM interface. An increased corrosion
inhibition was observed for alkanethiols with longer chain lengths. VSFS results
provided evidence of a more disordered monolayer after sample exposure.
4.4 Alkanethiol and alkaneselenol covered copper – effect of head group
on atmospheric corrosion inhibition (results from paper VI)
After demonstrating the ability of complimentary IRAS and VSFS
measurements for studying the inhibition effect of alkanethiol SAMs on the
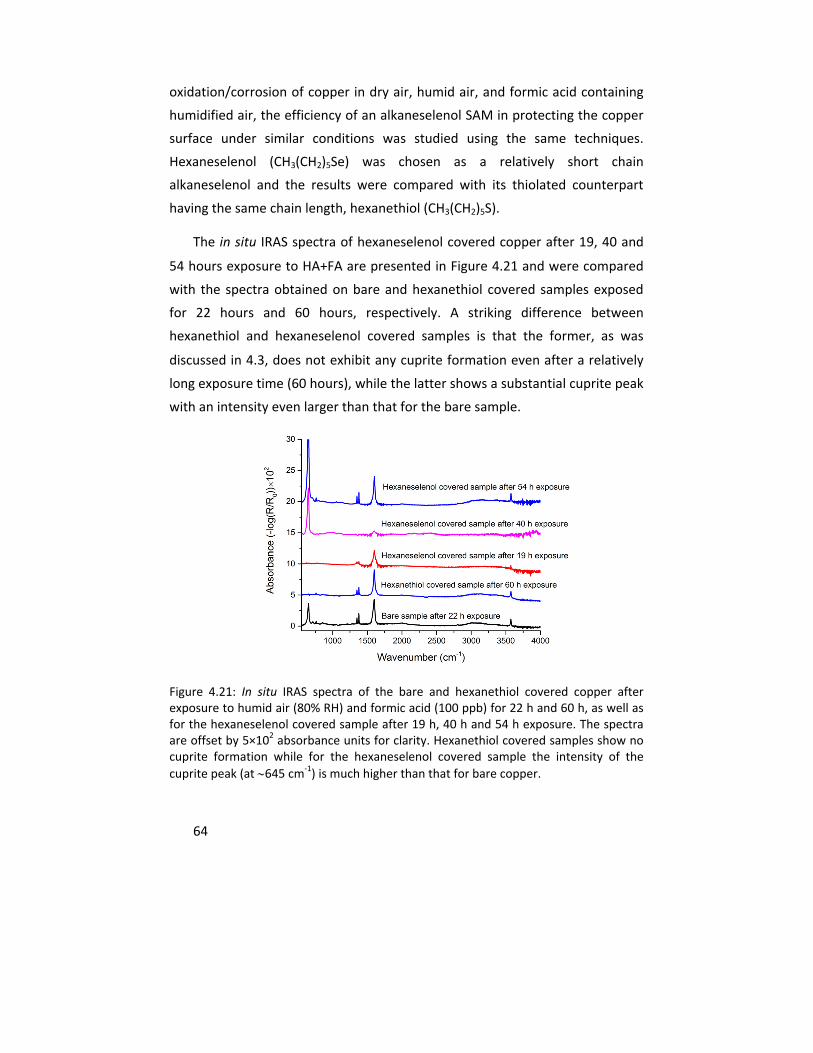
64
oxidation/corrosion of copper in dry air, humid air, and formic acid containing
humidified air, the efficiency of an alkaneselenol SAM in protecting the copper
surface under similar conditions was studied using the same techniques.
Hexaneselenol (CH3(CH2)5Se) was chosen as a relatively short chain
alkaneselenol and the results were compared with its thiolated counterpart
having the same chain length, hexanethiol (CH3(CH2)5S).
The in situ IRAS spectra of hexaneselenol covered copper after 19, 40 and
54 hours exposure to HA+FA are presented in Figure 4.21 and were compared
with the spectra obtained on bare and hexanethiol covered samples exposed
for 22 hours and 60 hours, respectively. A striking difference between
hexanethiol and hexaneselenol covered samples is that the former, as was
discussed in 4.3, does not exhibit any cuprite formation even after a relatively
long exposure time (60 hours), while the latter shows a substantial cuprite peak
with an intensity even larger than that for the bare sample.
Figure 4.21: In situ IRAS spectra of the bare and hexanethiol covered copper after exposure to humid air (80% RH) and formic acid (100 ppb) for 22 h and 60 h, as well as for the hexaneselenol covered sample after 19 h, 40 h and 54 h exposure. The spectra are offset by 5×10² absorbance units for clarity. Hexanethiol covered samples show no cuprite formation while for the hexaneselenol covered sample the intensity of the
cuprite peak (at 645 cm‐1) is much higher than that for bare copper.
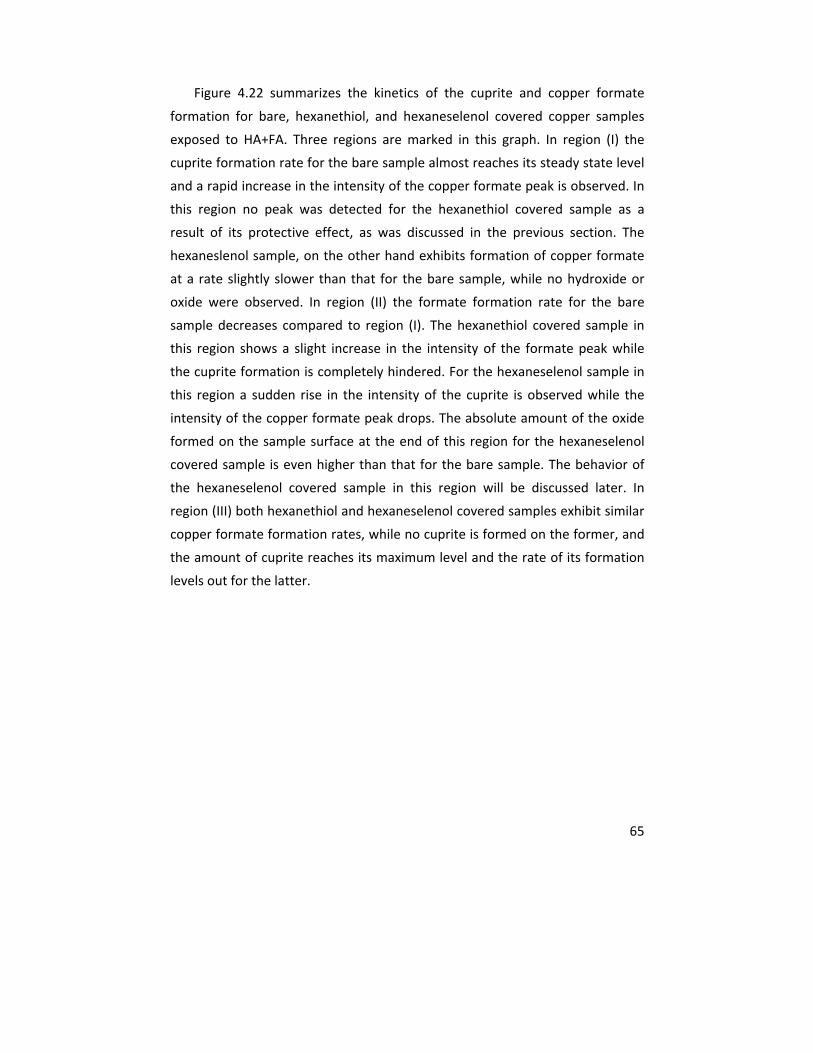
65
Figure 4.22 summarizes the kinetics of the cuprite and copper formate
formation for bare, hexanethiol, and hexaneselenol covered copper samples
exposed to HA+FA. Three regions are marked in this graph. In region (I) the
cuprite formation rate for the bare sample almost reaches its steady state level
and a rapid increase in the intensity of the copper formate peak is observed. In
this region no peak was detected for the hexanethiol covered sample as a
result of its protective effect, as was discussed in the previous section. The
hexaneslenol sample, on the other hand exhibits formation of copper formate
at a rate slightly slower than that for the bare sample, while no hydroxide or
oxide were observed. In region (II) the formate formation rate for the bare
sample decreases compared to region (I). The hexanethiol covered sample in
this region shows a slight increase in the intensity of the formate peak while
the cuprite formation is completely hindered. For the hexaneselenol sample in
this region a sudden rise in the intensity of the cuprite is observed while the
intensity of the copper formate peak drops. The absolute amount of the oxide
formed on the sample surface at the end of this region for the hexaneselenol
covered sample is even higher than that for the bare sample. The behavior of
the hexaneselenol covered sample in this region will be discussed later. In
region (III) both hexanethiol and hexaneselenol covered samples exhibit similar
copper formate formation rates, while no cuprite is formed on the former, and
the amount of cuprite reaches its maximum level and the rate of its formation
levels out for the latter.
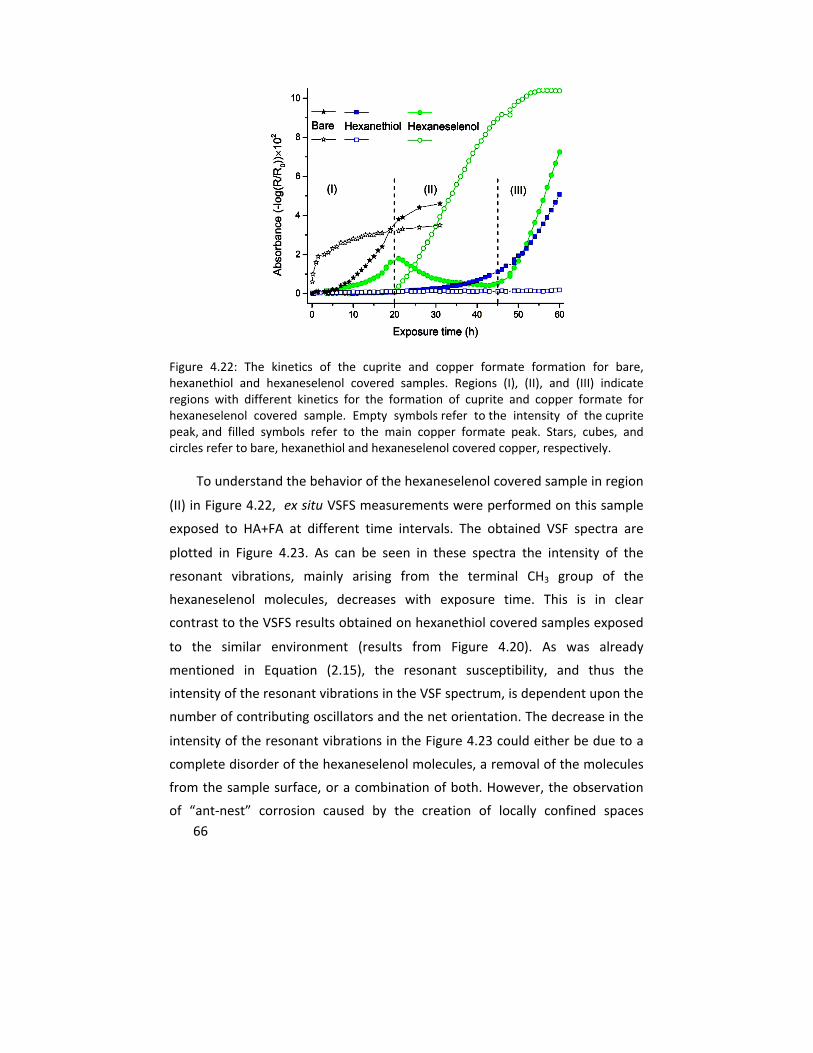
66
Figure 4.22: The kinetics of the cuprite and copper formate formation for bare, hexanethiol and hexaneselenol covered samples. Regions (I), (II), and (III) indicate regions with different kinetics for the formation of cuprite and copper formate for hexaneselenol covered sample. Empty symbols refer to the intensity of the cuprite peak, and filled symbols refer to the main copper formate peak. Stars, cubes, and circles refer to bare, hexanethiol and hexaneselenol covered copper, respectively.
To understand the behavior of the hexaneselenol covered sample in region
(II) in Figure 4.22, ex situ VSFS measurements were performed on this sample
exposed to HA+FA at different time intervals. The obtained VSF spectra are
plotted in Figure 4.23. As can be seen in these spectra the intensity of the
resonant vibrations, mainly arising from the terminal CH3 group of the
hexaneselenol molecules, decreases with exposure time. This is in clear
contrast to the VSFS results obtained on hexanethiol covered samples exposed
to the similar environment (results from Figure 4.20). As was already
mentioned in Equation (2.15), the resonant susceptibility, and thus the
intensity of the resonant vibrations in the VSF spectrum, is dependent upon the
number of contributing oscillators and the net orientation. The decrease in the
intensity of the resonant vibrations in the Figure 4.23 could either be due to a
complete disorder of the hexaneselenol molecules, a removal of the molecules
from the sample surface, or a combination of both. However, the observation
of “ant‐nest” corrosion caused by the creation of locally confined spaces
67
between the partly removed selenol molecules from the copper substrate, and
also the heterogeneity observed on hexaneselenol covered samples after
exposure, which will be discussed in the followings, favor the explanation based
on partial removal of the selenol layer from the surface. The removal of
molecules is although accompanied initially by an increased disorder of the
chains as is manifested by the obvious increase in the CH2/CH3 intensity ratio by
exposure time.
Figure 4.23: Normalized VSF spectra of hexaneselenol covered copper before exposure and after 18 h, 40 h, and 60 h exposure to humid air (80% RH) and formic acid (100 pbb). All spectra are offset for clarity. The intensity of the resonant peaks decreases with the exposure time indicating the partial removal of the hexaneselenol molecules from the surface with corrosion.
Previous scanning Kelvin probe force microscopy (SKPFM) studies have
shown that the adsorption of SAMs on metallic surfaces affects the surface
Volta potential (surface work function).88 Removal of the hexaneselenol
molecules from the sample surface creates a heterogeneous condition where
hexaneselenol covered areas are locally separated from the uncovered parts.
Therefore, localized electrochemical cells with separated cathodic and anodic
areas are formed on the surface which accelerates the electrochemical
reactions and, thus, the formation of corrosion products becomes even faster
than that on bare copper exposed to the same corrosive atmosphere.
68
Another striking phenomenon in phase (II) in Figure 4.22 is the decrease in
the intensity of the copper formate peak at the expense of the increase in the
intensity of the cuprite peak. This observation suggests that under certain
conditions initially formed copper formate is transformed to cuprite. Such a
transformation has been observed previously in “ant‐nest” corrosion of copper
where copper was exposed to an environment containing humidity and formic
acid.89, 90
The VSF spectral shapes are different for the hexaneselenol and
hexanethiol covered samples before exposure (results from Figure 4.23 and
Figure 4.20). The former shows the resonant vibrations as peaks, while in the
latter the resonances are dips in the VSF spectra. As was mentioned earlier this
is due to different phases between the resonant and nonresonant
susceptibilities due to the presence or absence of an oxide layer on the copper
surface. The initial oxide layer on the copper surface can be chemically reduced
by dipping the sample in solution of hexanethiol or hexaneselenol, whereby the
hexanethiol is much more effective than hexaneselenol. The results suggest
that when the hexanethiol and hexaneselenol are adsorbed they have different
abilities to chemically reduce the initial oxide on the copper surface. This
difference has been the subject of previous studies.91 To elucidate this ability of
hexanethiol molecules, ambient pressure x‐ray photoelectron spectroscopy
(AP‐XPS) measurements were performed for initially oxidized copper being
exposed to hexanethiol molecules in the gas phase. As can be seen in Figure
4.24, when hexanethiol molecules are introduced into the system, the intensity
of the oxide peak in XPS spectrum decreases while the intensity of peak related
to carbon increases (results are not shown here). A further increase in the
amount of hexanethiol molecules results in the complete removal of the
surface oxide. The exposure of oxide‐free hexanethiol covered samples to
oxygen results in a sample oxidation as expected from previous experience.
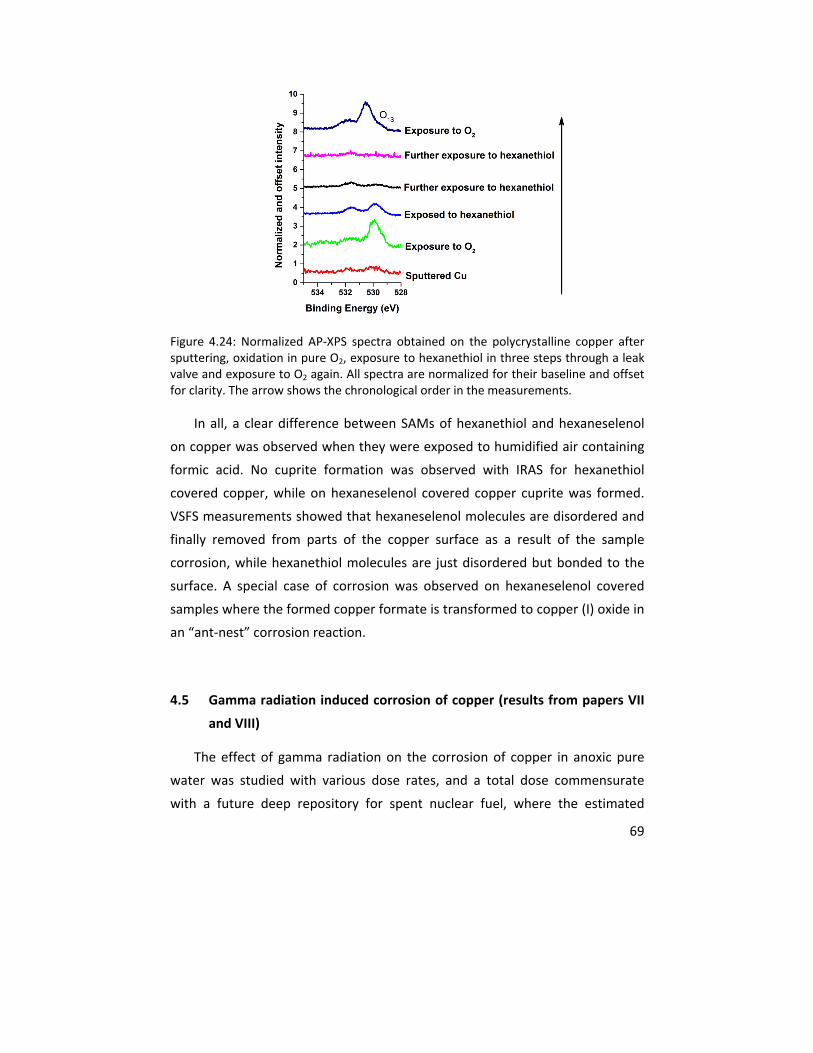
69
Figure 4.24: Normalized AP‐XPS spectra obtained on the polycrystalline copper after sputtering, oxidation in pure O2, exposure to hexanethiol in three steps through a leak valve and exposure to O2 again. All spectra are normalized for their baseline and offset for clarity. The arrow shows the chronological order in the measurements.
In all, a clear difference between SAMs of hexanethiol and hexaneselenol
on copper was observed when they were exposed to humidified air containing
formic acid. No cuprite formation was observed with IRAS for hexanethiol
covered copper, while on hexaneselenol covered copper cuprite was formed.
VSFS measurements showed that hexaneselenol molecules are disordered and
finally removed from parts of the copper surface as a result of the sample
corrosion, while hexanethiol molecules are just disordered but bonded to the
surface. A special case of corrosion was observed on hexaneselenol covered
samples where the formed copper formate is transformed to copper (I) oxide in
an “ant‐nest” corrosion reaction.
4.5 Gamma radiation induced corrosion of copper (results from papers VII
and VIII)
The effect of gamma radiation on the corrosion of copper in anoxic pure
water was studied with various dose rates, and a total dose commensurate
with a future deep repository for spent nuclear fuel, where the estimated
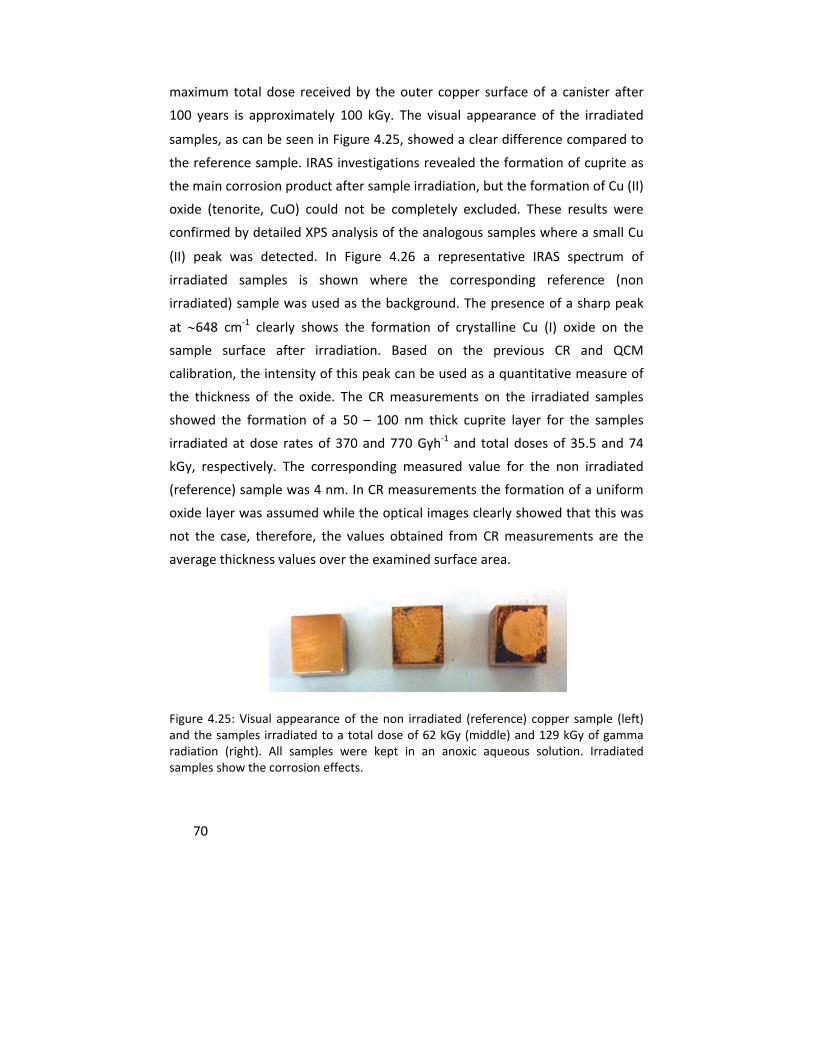
70
maximum total dose received by the outer copper surface of a canister after
100 years is approximately 100 kGy. The visual appearance of the irradiated
samples, as can be seen in Figure 4.25, showed a clear difference compared to
the reference sample. IRAS investigations revealed the formation of cuprite as
the main corrosion product after sample irradiation, but the formation of Cu (II)
oxide (tenorite, CuO) could not be completely excluded. These results were
confirmed by detailed XPS analysis of the analogous samples where a small Cu
(II) peak was detected. In Figure 4.26 a representative IRAS spectrum of
irradiated samples is shown where the corresponding reference (non
irradiated) sample was used as the background. The presence of a sharp peak
at 648 cm‐1 clearly shows the formation of crystalline Cu (I) oxide on the
sample surface after irradiation. Based on the previous CR and QCM
calibration, the intensity of this peak can be used as a quantitative measure of
the thickness of the oxide. The CR measurements on the irradiated samples
showed the formation of a 50 – 100 nm thick cuprite layer for the samples
irradiated at dose rates of 370 and 770 Gyh‐1 and total doses of 35.5 and 74
kGy, respectively. The corresponding measured value for the non irradiated
(reference) sample was 4 nm. In CR measurements the formation of a uniform
oxide layer was assumed while the optical images clearly showed that this was
not the case, therefore, the values obtained from CR measurements are the
average thickness values over the examined surface area.
Figure 4.25: Visual appearance of the non irradiated (reference) copper sample (left) and the samples irradiated to a total dose of 62 kGy (middle) and 129 kGy of gamma radiation (right). All samples were kept in an anoxic aqueous solution. Irradiated samples show the corrosion effects.
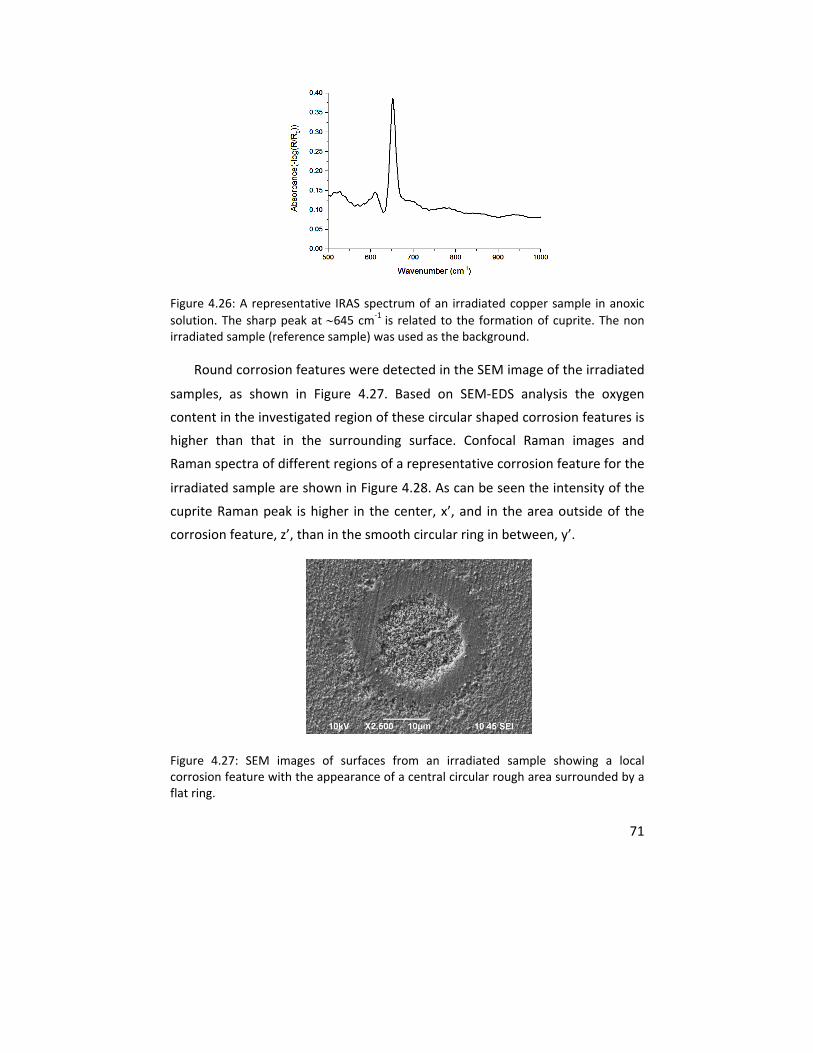
71
Figure 4.26: A representative IRAS spectrum of an irradiated copper sample in anoxic
solution. The sharp peak at 645 cm‐1 is related to the formation of cuprite. The non
irradiated sample (reference sample) was used as the background.
Round corrosion features were detected in the SEM image of the irradiated
samples, as shown in Figure 4.27. Based on SEM‐EDS analysis the oxygen
content in the investigated region of these circular shaped corrosion features is
higher than that in the surrounding surface. Confocal Raman images and
Raman spectra of different regions of a representative corrosion feature for the
irradiated sample are shown in Figure 4.28. As can be seen the intensity of the
cuprite Raman peak is higher in the center, x’, and in the area outside of the
corrosion feature, z’, than in the smooth circular ring in between, y’.
Figure 4.27: SEM images of surfaces from an irradiated sample showing a local corrosion feature with the appearance of a central circular rough area surrounded by a flat ring.
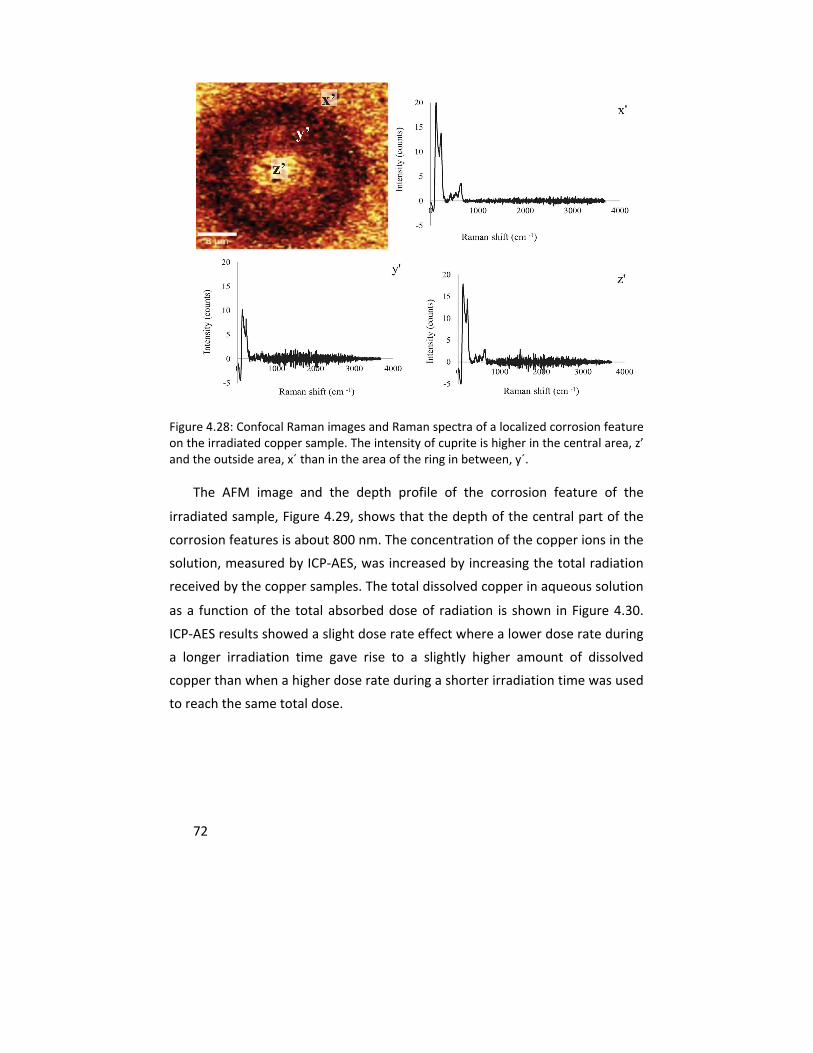
72
Figure 4.28: Confocal Raman images and Raman spectra of a localized corrosion feature on the irradiated copper sample. The intensity of cuprite is higher in the central area, z’ and the outside area, x´ than in the area of the ring in between, y´.
The AFM image and the depth profile of the corrosion feature of the
irradiated sample, Figure 4.29, shows that the depth of the central part of the
corrosion features is about 800 nm. The concentration of the copper ions in the
solution, measured by ICP‐AES, was increased by increasing the total radiation
received by the copper samples. The total dissolved copper in aqueous solution
as a function of the total absorbed dose of radiation is shown in Figure 4.30.
ICP‐AES results showed a slight dose rate effect where a lower dose rate during
a longer irradiation time gave rise to a slightly higher amount of dissolved
copper than when a higher dose rate during a shorter irradiation time was used
to reach the same total dose.
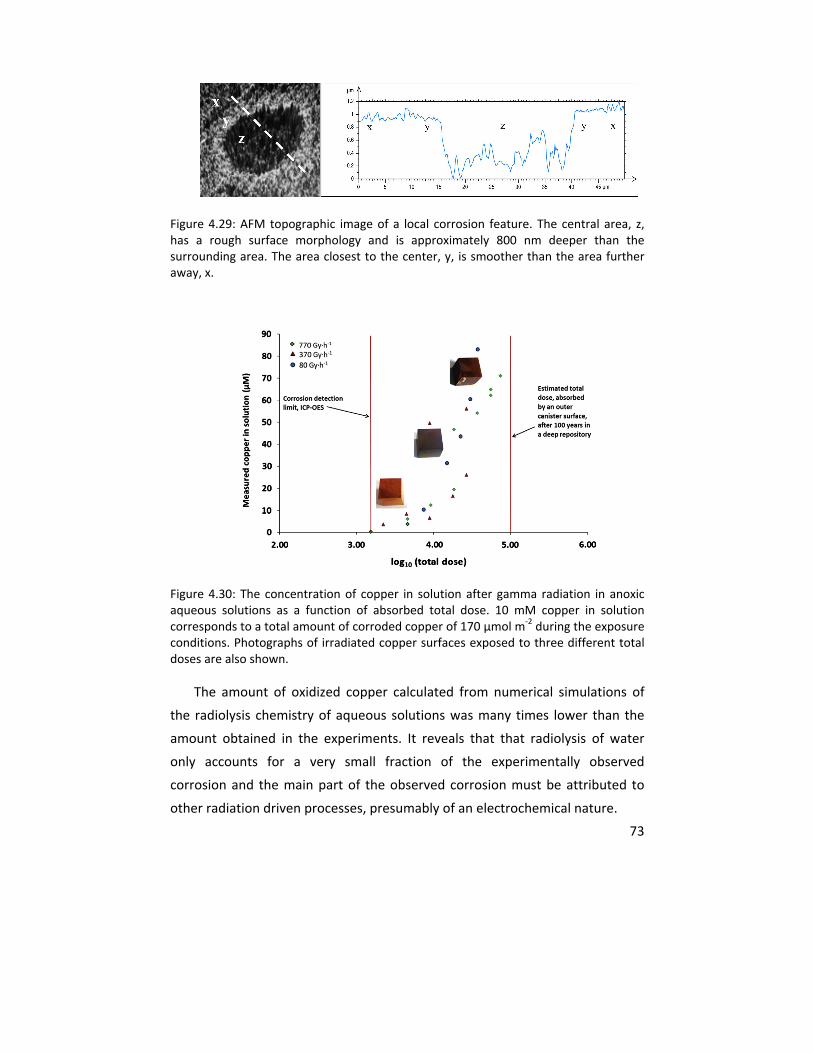
73
Figure 4.29: AFM topographic image of a local corrosion feature. The central area, z, has a rough surface morphology and is approximately 800 nm deeper than the surrounding area. The area closest to the center, y, is smoother than the area further away, x.
Figure 4.30: The concentration of copper in solution after gamma radiation in anoxic aqueous solutions as a function of absorbed total dose. 10 mM copper in solution corresponds to a total amount of corroded copper of 170 µmol m‐2 during the exposure conditions. Photographs of irradiated copper surfaces exposed to three different total doses are also shown.
The amount of oxidized copper calculated from numerical simulations of
the radiolysis chemistry of aqueous solutions was many times lower than the
amount obtained in the experiments. It reveals that that radiolysis of water
only accounts for a very small fraction of the experimentally observed
corrosion and the main part of the observed corrosion must be attributed to
other radiation driven processes, presumably of an electrochemical nature.
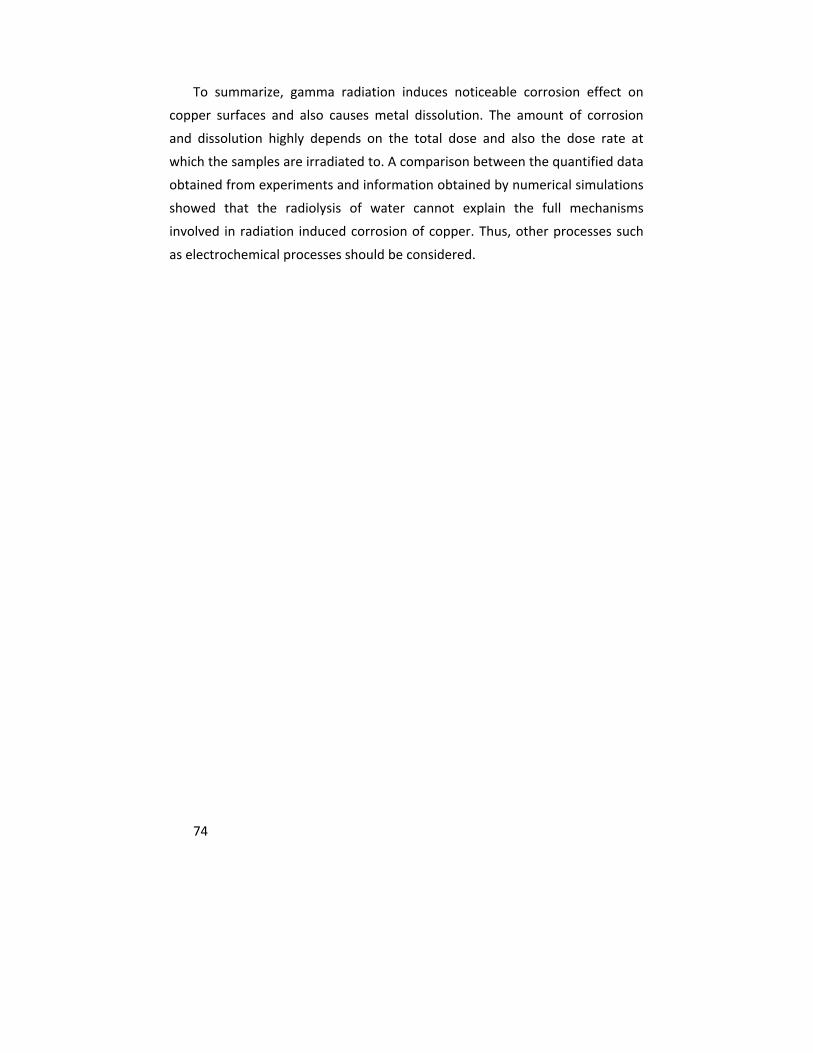
74
To summarize, gamma radiation induces noticeable corrosion effect on
copper surfaces and also causes metal dissolution. The amount of corrosion
and dissolution highly depends on the total dose and also the dose rate at
which the samples are irradiated to. A comparison between the quantified data
obtained from experiments and information obtained by numerical simulations
showed that the radiolysis of water cannot explain the full mechanisms
involved in radiation induced corrosion of copper. Thus, other processes such
as electrochemical processes should be considered.
75
5 Conclusions and Outlook
In this thesis the initial stage of atmospheric corrosion of copper in dry air,
humid air, and humid air containing formic acid has been in focus, and the
effectiveness of self assembled monolayers (SAMs) of alkanethiols or
alkaneselenols in protecting copper from corrosion has been investigated.
A systematic investigation was performed in dry and humidified air by
utilizing a combination of vibrational sum frequency spectroscopy (VSFS),
quartz crystal microbalance with dissipation monitoring (QCM‐D), and
nanoplasmonic sensing (NPS) to quantify the initial oxidation process of SAM
covered copper, as well as to obtain direct information about the conformation
of SAMs and the heterogeneity of the surface reactions. This combination
allowed detection of copper (I) oxide with a thickness of 1 to 10% of an ideal
oxide monolayer and a time resolution as low as 1 second. A near surface
sensitive technique, infrared reflection/absorption spectroscopy (IRAS) was
used to characterize and follow the kinetics of formation of corrosion products
when SAM covered copper was exposed to a more corrosive atmosphere
containing humidified air and low amounts of formic acid. This made it possible
to establish a molecular view of the initial atmospheric corrosion of copper.
SAMs of alkanethiols with different chain lengths can effectively protect
copper surfaces from formation of copper (I) oxide and delay the formation of
copper formate and copper hydroxide through a selective hindrance of the
corrosion stimulators, i.e. oxygen, water, and formic acid. This corrosion
inhibiting ability increased with the chain length of the alkanethiols. The
protective ability was lower when hexaneselenol was used instead of its thiol
counterpart. The corrosion process of hexaneselenol covered copper was
accompanied by the formation of copper oxide, copper formate, and copper
hydroxide. Local removal of the hexaneselenol molecules from the copper
surface upon prolonged exposure to humidified air with formic acid created
conditions for galvanic effects and an accelerated corrosion process. The
resulting corrosion effects are similar to so‐called “ant‐nest” corrosion.

76
The knowledge gained from atmospheric corrosion studies on copper and
some of the methods for such studies were applied to assess the effect of gamma
radiation on corrosion of copper. It was found that gamma radiation induces
copper corrosion in anoxic water and this effect needs to be further investigated.
Whereas this thesis provided new molecular insights into the initial stages
of atmospheric corrosion of SAM covered copper, new questions arose which
motivate further investigation. The exact physical basis of the selective
hindrance of the corrosion stimulating molecules oxygen, water, and formic
acid by the alkanethiol SAMs has not been deduced. To obtain such
information in situ XPS measurements could be helpful. In all, the
measurements on alkanethiol covered samples in this thesis assumed
homogenous SAMs, whereas recent VSFS imaging results showed that SAMs on
metals can form domains with slightly different orientation and varying
confirmation.92 This can have a great influence on the local corrosion
protection efficiency of SAMs. VSFS imaging measurements could be used for
studying these corrosion conditions in a similar manner to what has been
presented in this thesis. Other local probing methods, such as scanning Kelvin
Force Microscopy and Raman imaging could also be used to extract information
about local variations of SAMs and the distribution of corrosion products.
Although alkaneselenol covered samples showed a greater macroscopic
heterogeneity compared to their thiol counterparts, local variations in their
structure and the effect on the observed macroscopic heterogeneity are yet to
be investigated. In this case the exact mechanism of the removal of selenol
molecules from the sample surface upon prolonged exposure is not understood
yet, and further investigations are required, preferably with in situ VSFS
measurements in ultra high vacuum. Such results could be used in GILDES
computer modeling to predict the atmospheric corrosion of SAM covered
copper under various conditions. Moreover, other important systems
undergoing atmospheric corrosion (i.e. various metals and their interactions
with different corrosion stimulators) could be investigated using a similar
combination of VSFS, QCM‐D and NPS.

77
Acknowledgements
I would like to thank and acknowledge several people who have helped me during my doctoral studies:
Christofer Leygraf; It was extremely difficult for me to write down how much I enjoyed my PhD time in KTH because of your presence. From the beginning you showed immense support and helped me with both scientific and personal matters. I always felt welcome to come to your office and start a discussion which usually ended with me being more relaxed, encouraged and somewhat wiser. Your supervision was so great that I could stay here forever and work for you as a PhD student. I don’t think it is the end of our collaboration and I am looking forward to working with you again in future.
Magnus Johnson; I highly appreciate your inputs, your comments, and your ideas. We often had very challenging discussions before submitting each paper and you always showed a great deal of patience. It was very enjoyable to work with you. We started scientific work together which is not finished yet. I am looking forward to seeing the continuation of this work in future.
Steven Baldelli; though we had very little chance to work directly together, I had your full support and guidance during my PhD. Many times our Skype conversations and all those funny smiley faces motivated me to stop complaining and to try new ideas in the lab. I am sure I need those Skype texts and symbols again in future. Both of us had many ideas about new measurements which I hope we can follow them together after my PhD.
Jonas Hedberg; thank you for teaching me a lot about VSFS in the lab. I will not forget the time we shared our office in the first year of my PhD. Since then you were always available to answer my questions.
Mark Rutland; the last year of my PhD would not be that pleasant without your generous offer for the post‐doc position in your group. Also your hints were very valuable for me to decide about my future career. Playing volleyball was always more competitive and fun when you were in the other team.
Inger Odnevall Wallinder; thank you for your help during the first year of my PhD and also for your great work as FA in KTH.
Per Claesson; though we never collaborated together and had very little contact, I was always inspired by the way you look at science. The interest you show during the Tuesday seminars and all those clever questions you usually ask, your talk about having balance in life in our summer trip, and your very interesting lectures on intermolecular forces are the things that I will remember you with.
Gunilla Herting; you were always available when I needed help and I enjoyed our discussions on different issues and our funny Swedish conversations.
Mats Jonsson and Åsa Björkbacka; it was very enjoyable to collaborate with you on a very nice topic. I will always be proud of being part of your research team.

78
Markus Schwind; we spent ten very long days in our lab and performed an incredibly good job. I am very happy about the outcomes. A special thanks to my other co‐authors from Chalmers, Bengt Kasemo, Igor Zoric, and Christoph Langhammer. It was a great honor for me to work with you.
Mats Götelid; we spent one week in Lund running XPS measurements in the night shifts which was very tough but I am happy that the outcome was good.
Ping Qiu and Harveth Gill; thank you for the valuable discussions on IRAS and QCM. I always enjoyed reading your work and used them a lot in my thesis.
Eric Tyrode, Jonathan Liljeblad, and Petru Niga; Thank you for sharing discussions on VSFS and for all those brilliant Thursday group meetings.
Thank you Golrokh Heydari and Chao Liu for sharing an office with me.
Mattias Forslund; thank you for the valuable discussions on IRAS and KPFM as well as helping me with the AFM measurements. You did a great job fixing my figures for the thesis.
Majid Sababi; thank you for your helps in the EC lab. You always helped me with all those “miracles” when I was stuck with a problem.
Neda Mazinanian; a special thank to you for being a very good and helpful friend and being an awesome motivation for me to go to the gym.
Esben, Shadi, Maziar, Jesper, Erik, Yousef and Deb; it was a pleasure to have you around during these years.
Thank you all the past and present members of the division during my time here. I enjoyed all our Tuesday seminars, trips and coffee breaks.
Thanks to my past mentors and colleagues in Azad University of Saveh, Iran for encouraging me to peruse an academic career and do my PhD in Sweden.
Thank you all my colleagues in the board of the PhD student council and in the Risk assessment group. I believe we did a great job together that others can also benefit from.
Thank you all my friends in Stockholm who always supported me in these years.
Thank you my colleagues in the board of PerSiS for your outstanding activities. Being with you made my social life in Sweden a lot more attractive and pleasant.
Thank you Rohollah Ghasemi and Mohammad Fereshtehnejad for being good friends and great supports. Living alone without having you around could be a lot more difficult for me during these years.
The Swedish Research Council (VR) and Svenska Kärnbränslehantering AB (SKB) are gratefully acknowledged for financial support.
In the end I would like to have my biggest appreciation to my mom, my dad, my sister and her husband who supported, encouraged and helped me. I love you all.
79
6 References
1. Leygraf, C., Atmospheric Corrosion. In Corrosion Mechanisms in Theory and Practice, CRC Press: 2002. 2. Gil, H.; Leygraf, C.; Tidblad, J., GILDES Model Simulations of the Atmospheric Corrosion of Zinc Induced by Low Concentrations of Carboxylic Acids. Journal of The Electrochemical Society 2012, 159, C123‐C128. 3. Castro, P., The Atmospheric Corrosion Performance Of Reinforced Concrete in The Peninsula of Yucatan, Mexico. A Review. Corrosion Reviews 1999, 17, 333‐382. 4. Johansson, L. G.; Lindqvist, O.; Mangio, R. E., Corrosion of Calcareous Stones in Humid Air Containing SO2 and NO2. 1988, 5, 439‐449. 5. Graedel, T. E., Mechanisms for the Atmospheric Corrosion of Carbonate Stone. Journal of The Electrochemical Society 2000, 147, 1006‐1009. 6. Vernon, W. H. J., First (Experimental) Report to the Atmospheric Corrosion Research Committee (of the British Non‐Ferrous Metals Research Association). Transactions of the Faraday Society 1924, 19, 839‐845. 7. Vernon, W. H. J., Second Experimental Report to the Atmospheric Corrosion Research Committee (British Non‐Ferrous Metals Research Association). Transactions of the Faraday Society 1927, 23, 113‐183. 8. Forslund, M.; Leygraf, C., In Situ Weight Gain Rates on Copper during Outdoor Exposures: Dependence on Airborne Pollutants and Climatic Parameters. Journal of The Electrochemical Society 1997, 144, 113‐120. 9. Odnevall, I.; Leygraf, C., Formation of NaZn4Cl(OH)6SO4 ∙6H2O in a Marine Atmosphere. Corrosion Science 1993, 34, 1213‐1229. 10. Odnevall, I.; Leygraf, C., The Formation of Zn4SO4(OH)6 ∙4H2O in a Rural Atmosphere. Corrosion Science 1994, 36, 1077‐1087. 11. Guttman, H., Atmospheric and Weather Factors in Corrosion Testing. Journal of The Electrochemical Society 1980, 127, C359‐C359. 12. Marcus, P.; Oudar, J., Corrosion Mechanisms in Theory and Practice. M. Dekker: New York, 1995; p viii, 641 p. 13. Ailor, W. H., Atmospheric Corrosion. Wiley: 1982. 14. Rice, D. W.; Cappell, R. J.; Kinsolving, W.; Laskowski, J. J., Indoor Corrosion of Metals. Journal of The Electrochemical Society 1980, 127, 891‐901. 15. Johnson, C. M.; Leygraf, C., Atmospheric Corrosion of Zinc by Organic Constituents: III. An Infrared Reflection‐Absorption Spectroscopy Study of the Influence of Formic Acid. Journal of The Electrochemical Society 2006, 153, B547‐B550. 16. Johnson, M. Vibrational Sum Frequency and Infrared Reflection/Absoprption Spectroscopy Studies of the Air/Liquid and
80
Liquid/Metal Interfaces, Doctoral Thesis. Royal Institute of Technology (KTH), 2005. 17. Gil, H. The Initial Atmospheric Corrosion of Copper and Zinc Induced by Carboxylic Acids, Doctoral Thesis. Royal Institute of Technology (KTH), 2011. 18. Qiu, P. Quantified in Situ Analysis of Initial Atmospheric Corrosion, Doctoral Thesis. Royal Institute of Technology (KTH), 2011. 19. Hedberg, J. A Molecular View of Initial Atmospheric Corrosion, Doctoral Thesis. Royal Institute of Technology (KTH), 2009. 20. Persson, D.; Leygraf, C., Metal Carboxylate Formation during Indoor Atmospheric Corrosion of Cu, Zn, and Ni. Journal of The Electrochemical Society 1995, 142, 1468‐1477. 21. Bastidas, D. M.; La Iglesia, V. M., Organic Acid Vapours and their Effect on Corrosion of Copper: A Review. Corrosion Engineering Science and Technology 2007, 42, 272‐280. 22. Gil, H.; Leygraf, C., Initial Atmospheric Corrosion of Copper Induced by Carboxylic Acids. Journal of The Electrochemical Society 2007, 154, C611‐C617. 23. Weschler, C. J., Chemical Reactions Among Indoor Pollutants: What We’ve Learned in the New Millennium. Indoor Air. 2004, 14, 184‐194. 24. Uhde, E.; Salthammer, T., Impact of Reaction Products from Building Materials and Furnishings on Indoor Air Quality—A Review of Recent Advances in Indoor Chemistry. Atmospheric Environment 2007, 41, 3111‐3128. 25. Fontana, M. G., Corrosion Engineering. Tata McGraw‐Hill: 2005. 26. Graedel, T. E.; Nassau, K.; Franey, J. P., Copper Patinas Formed in the Atmosphere—I. Introduction. Corrosion Science 1987, 27, 639‐657. 27. Graedel, T. E., Copper Patinas Formed in the Atmosphere—II. A Qualitative Assessment of Mechanisms. Corrosion Science 1987, 27, 721‐740. 28. Gil, H.; Calderón, J. A.; Buitrago, C. P.; Echavarría, A.; Echeverría, F., Indoor Atmospheric Corrosion of Electronic Materials in Tropical‐Mountain Environments. Corrosion Science 2010, 52, 327‐337. 29. Hedin, A. Long‐Term Safety for the Final Repository for Spent Nuclear Fuel at Forsmark: Main Report of the SR‐Site Project; Swedish Nuclear Fuel and Waste Management Company (Svensk kärnbränslehantering AB.): 2011. 30. López‐Delgado, A.; Cano, E.; Bastidas, J. M.; López, F. A., A Comparative Study on Copper Corrosion Originated by Formic and Acetic Acid Vapours. Journal of Materials Science 2001, 36, 5203‐5211. 31. Gil, H.; Leygraf, C., Quantitative in Situ Analysis of Initial Atmospheric Corrosion of Copper Induced by Acetic Acid. Journal of The Electrochemical Society 2007, 154, C272‐C278. 32. Gil, H.; Echavarría, A.; Echeverría, F., Electrochemical Reduction Modeling of Copper Oxides Obtained During in Situ and ex Situ Conditions in the Presence of Acetic Acid. Electrochimica Acta 2009, 54, 4676‐4681.
81
33. Love, J. C.; Estroff, L. A.; Kriebel, J. K.; Nuzzo, R. G.; Whitesides, G. M., Self‐Assembled Monolayers of Thiolates on Metals as a Form of Nanotechnology. Chem Rev. 2005, 1103‐1169. 34. Laibinis, P. E.; Whitesides, G. M., Self‐Assembled Monolayers of n‐Alkanethiolates on Copper are Barrier Films that Protect the Metal Against Oxidation by Air. Journal of the American Chemical Society 1992, 114, 9022‐9028. 35. Whitesides, G. M.; Laibinis, P. E., Wet Chemical Approaches to the Characterization of Organic Surfaces: Self‐Assembled Monolayers, Wetting, and the Physical‐Organic Chemistry of the Solid‐Liquid Interface. Langmuir 1990, 6, 87‐96. 36. Schönherr, H.; Vancso, G. J.; Huisman, B.‐H.; van Veggel, F. C. J. M.; Reinhoudt, D. N., An Atomic Force Microscopy Study of Self‐Assembled Monolayers of Calix[4]resorcinarene Adsorbates on Au(111). Langmuir 1997, 13, 1567‐1570. 37. Stranick, S. J.; Kamna, M. M.; Krom, K. R.; Parikh, A. N.; Allara, D. L.; Weiss, P. S., Scanning Tunneling Microscopy Studies of Self‐Assembled Monolayers of Alkanethiols on Gold. Journal of Vacuum Science & Technology B: Microelectronics and Nanometer Structures 1994, 12, 2004‐2007. 38. Bain, C. D.; Whitesides, G. M., Attenuation Lengths of Photoelectrons in Hydrocarbon Films. The Journal of Physical Chemistry 1989, 93, 1670‐1673. 39. Geer, R. E.; Stenger, D. A.; Chen, M. S.; Calvert, J. M.; Shashidhar, R.; Jeong, Y. H.; Pershan, P. S., X‐ray and Ellipsometric Studies of Self‐Assembled Monolayers of Fluorinated Chlorosilanes. Langmuir 1994, 10, 1171‐1176. 40. Wasserman, S. R.; Whitesides, G. M.; Tidswell, I. M.; Ocko, B. M.; Pershan, P. S.; Axe, J. D., The Structure of Self‐Assembled Monolayers of Alkylsiloxanes on Silicon: a Comparison of Results from Ellipsometry and Low‐Angle X‐ray Reflectivity. Journal of the American Chemical Society 1989, 111, 5852‐5861. 41. Fonder, G.; Cecchet, F.; Peremans, A.; Thiry, P. A.; Delhalle, J.; Mekhalif, Z., Conformational Order of n‐Dodecanethiol and n‐Dodecaneselenol Monolayers on Polycrystalline Copper Investigated by PM‐IRRAS and SFG Spectroscopy. Surface Science 2009, 603, 2276‐2282. 42. Allara, D. L.; Nuzzo, R. G., Spontaneously Organized Molecular Assemblies. 2. Quantitative Infrared Spectroscopic Determination of Equilibrium Structures of Solution‐Adsorbed n‐Alkanoic Acids on an Oxidized Aluminum Surface. Langmuir 1985, 1, 52‐66. 43. Ye, S.; Nihonyanagi, S.; Fujishima, K.; Uosaki, K., Conformational Order of Octadecanethiol (ODT) Monolayer at Gold/ Solution Interface: Internal Reflection Sum Frequency Generation (SFG) Study. In Studies in Surface Science
82
and Catalysis, Yasuhiro Iwasawa, N. O.; Hironobu, K., Eds. Elsevier: 2001; Vol. Volume 132, pp 705‐710. 44. Cimpoca, G. V.; Popescu, I. V.; Dulama, I. D.; Radulescu, C.; Bancuta, I.; Cimpoca, M.; Cernica, I.; Schiopu, V.; Danila, M.; Gavrila, R. In Self Assembled Monolayer of Ethanthiol on Gold Surfaces by Quartz Crystal Microbalance, Semiconductor Conference, 2009. CAS 2009. International, 12‐14 Oct. 2009, 2009; 2009; pp 135‐138. 45. Björkbacka, Å.; Hosseinpour, S.; Johnson, M.; Leygraf, C.; Jonsson, M., Radiation Induced Corrosion of Copper for Spent Nuclear Fuel Storage. Radiation Physics and Chemistry 2013, 92, 80‐86. 46. Skoog, D. A., Principles of Instrumental Analysis. Saunders College Publishing: 1985. 47. Demtröder, W., Laser Spectroscopy. Springer: 2008. 48. Hecht, J., Optics: Light for a New Age. Scribner: 1988. 49. Griffiths, P.; De Haseth, J. A., Fourier Transform Infrared Spectrometry. Wiley: 2007. 50. Marcus, P.; Mansfeld, F. B., Analytical Methods In Corrosion Science and Engineering. Taylor & Francis: 2010. 51. Greenler, R. G., Reflection Method for Obtaining the Infrared Spectrum of a Thin Layer on a Metal Surface. The Journal of Chemical Physics 1969, 50, 1963‐1968. 52. Bloembergen, N.; Chang, R. K.; Jha, S. S.; Lee, C. H., Optical Second‐Harmonic Generation in Reflection from Media with Inversion Symmetry. Physical Review 1968, 174, 813‐822. 53. Bloembergen, N.; Pershan, P. S., Light Waves at the Boundary of Nonlinear Media. Physical Review 1962, 128, 606‐622. 54. Zhu, X. D.; Suhr, H.; Shen, Y. R., Surface Vibrational Spectroscopy by Infrared‐Visible Sum Frequency Generation. Physical Review B 1987, 35, 3047‐3050. 55. Hunt, J. H.; Guyot‐Sionnest, P.; Shen, Y. R., Observation of C‐H Stretch Vibrations of Monolayers of Molecules Optical Sum‐Frequency Generation. Chemical Physics Letters 1987, 133, 189‐192. 56. Lambert, A. G.; Davies, P. B.; Neivandt, D. J., Implementing the Theory of Sum Frequency Generation Vibrational Spectroscopy: A Tutorial Review. Applied Spectroscopy Reviews 2005, 40, 103‐145. 57. Wang, H. F.; Gan, W.; Lu, R.; Rao, Y.; Wu, B. H., Quantitative Spectral and Orientational Analysis in Surface Sum Frequency Generation Vibrational Spectroscopy (SFG‐VS). International Reviews in Physical Chemistry 2005, 24, 191‐256.
83
58. Zhuang, X.; Miranda, P. B.; Kim, D.; Shen, Y. R., Mapping Molecular Orientation and Conformation at Interfaces by Surface Nonlinear Optics. Physical Review B 1999, 59, 12632‐12640. 59. Richmond, G. L., Molecular Bonding and Interactions at Aqueous Surfaces as Probed by Vibrational Sum Frequency Spectroscopy. Chemical Reviews 2002, 102, 2693‐2724. 60. Miranda, P. B.; Shen, Y. R., Liquid Interfaces: A Study by Sum‐Frequency Vibrational Spectroscopy. The Journal of Physical Chemistry B 1999, 103, 3292‐3307. 61. Bain, C. D., Sum‐Frequency Vibrational Spectroscopy of the Solid/Liquid Interface. Journal of the Chemical Society, Faraday Transactions 1995, 91, 1281‐1296. 62. Miley, H. A., Copper Oxide Films. Journal of the American Chemical Society 1937, 59, 2626‐2629. 63. Campbell, W. E.; Thomas, U. B., Tarnish Studies: The Electrolytic Reduction Method for the Analysis of Films on Metal Surfaces. Transactions of The Electrochemical Society 1939, 76, 303‐328. 64. Krumbein, S. J.; Newell, B.; Pascucci, V., Monitoring Environmental Tests by Coulometric Reduction of Metallic Control Samples. Journal of Testing and Evaluation 1989, 17, 357‐367. 65. Stansbury, E. E.; Buchanan, R. A., Fundamentals of Electrochemical Corrosion. ASM International: 2000. 66. Zakipour, S.; Leygraf, C., Quartz Crystal Microbalance Applied to Studies of Atmospheric Corrosion of Metals. British Corrosion Journal 1992, 27, 295‐298. 67. Sauerbrey, G., Verwendung von Schwingquarzen zur Wägung dünner Schichten und zur Mikrowägung. Zeitschrift für Physik 1959, 155, 206‐222. 68. Schwind, M. Nanoplasmonic Sensing for Materials Science, Doctoral Thesis. Chalmers University of Technology, 2013. 69. Rodahl, M.; Hook, F.; Krozer, A.; Brzezinski, P.; Kasemo, B., Quartz Crystal Microbalance Setup for Frequency and Q‐Factor Measurements in Gaseous and Liquid Environments. Review of Scientific Instruments 1995, 66, 3924‐3930. 70. Rodahl, M.; Kasemo, B., A Simple Setup to Simultaneously Measure the Resonant Frequency and the Absolute Dissipation Factor of a Quartz Crystal Microbalance. Review of Scientific Instruments 1996, 67, 3238‐3241. 71. Eustis, S.; El‐Sayed, M. A., Why Gold Nanoparticles are More Precious than Pretty Gold: Noble Metal Surface Plasmon Resonance and its Enhancement of the Radiative and Nonradiative Properties of Nanocrystals of Different Shapes. Chemical Society Reviews 2006, 35, 209‐217.
84
72. Anker, J. N.; Hall, W. P.; Lyandres, O.; Shah, N. C.; Zhao, J.; Van Duyne, R. P., Biosensing with Plasmonic Nanosensors. Nat Mater 2008, 7, 442‐453. 73. Dahmen, C.; von Plessen, G., Optical Effects of Metallic Nanoparticles. Australian Journal of Chemistry 2007, 60, 447‐456. 74. Dmitriev, A., Nanoplasmonic Sensors. Springer: 2012. 75. Schwind, M.; Langhammer, C.; Kasemo, B.; Zorić, I., Nanoplasmonic Sensing and QCM‐D as Ultrasensitive Complementary Techniques for Kinetic Corrosion Studies of Aluminum Nanoparticles. Applied Surface Science 2011, 257, 5679‐5687. 76. Bohren, C. F.; Huffman, D. R.; Clothiaux, E. E., Absorption and Scattering of Light by Small Particles. Wiley VCH Verlag GmbH: 2010. 77. Schwind, M.; Hosseinpour, S.; Johnson, C. M.; Langhammer, C.; Zorić, I.; Leygraf, C.; Kasemo, B., Combined in Situ Quartz Crystal Microbalance with Dissipation Monitoring, Indirect Nanoplasmonic Sensing, and Vibrational Sum Frequency Spectroscopic Monitoring of Alkanethiol‐Protected Copper Corrosion. Langmuir 2013, 29, 7151‐7161. 78. Hedberg, J.; Henriquez, J.; Baldelli, S.; Johnson, C. M.; Leygraf, C., Initial Atmospheric Corrosion of Zinc Exposed to Formic Acid, Investigated by in Situ Vibrational Sum Frequency Spectroscopy and Density Functional Theory Calculations. The Journal of Physical Chemistry C 2008, 113, 2088‐2095. 79. Fredriksson, H.; Alaverdyan, Y.; Dmitriev, A.; Langhammer, C.; Sutherland, D. S.; Zäch, M.; Kasemo, B., Hole–Mask Colloidal Lithography. Advanced Materials 2007, 19, 4297‐4302. 80. Jennings, G. K.; Munro, J. C.; Yong, T.‐H.; Laibinis, P. E., Effect of Chain Length on the Protection of Copper by n‐Alkanethiols. Langmuir 1998, 14, 6130‐6139. 81. Bain, C. D.; Davies, P. B.; Ong, T. H.; Ward, R. N.; Brown, M. A., Quantitative Analysis of Monolayer Composition by Sum‐Frequency Vibrational Spectroscopy. Langmuir 1991, 7, 1563‐1566. 82. Biesinger, M. C.; Lau, L. W. M.; Gerson, A. R.; Smart, R. S. C., Resolving Surface Chemical States in XPS Analysis of First Row Transition Metals, Oxides and Hydroxides: Sc, Ti, V, Cu and Zn. Applied Surface Science 2010, 257, 887‐898. 83. Nakamoto, K., Infrared and Raman Spectra of Inorganic and Coordination Compounds. 4th ed.; Wiley: New York, 1986. 84. Carter Iii, R. O.; Poindexter, B. D.; Weber, W. H., Vibrational Spectra of Copper Formate Tetrahydrate, Copper Formate Dihydrate and Three Anhydrous Forms of Copper Formate. Vibrational Spectroscopy 1991, 2, 125‐134. 85. Farmer, V. C., The Infrared Spectra of Minerals. Mineralogical Society: London, 1974.
85
86. Von Jaggi, H.; Oswald, H. R., Die Kristallstruktur des Kupferhydroxids Cu(OH)2. Acta Crystallographica 1961, 14, 1041‐1045. 87. Gil, H.; Leygraf, C.; Tidblad, J., GILDES Model Simulations of the Atmospheric Corrosion of Copper Induced by Low Concentrations of Carboxylic Acids. Journal of The Electrochemical Society 2011, 158, C429‐C438. 88. Lü, J.; Delamarche, E.; Eng, L.; Bennewitz, R.; Meyer, E.; Güntherodt, H. J., Kelvin Probe Force Microscopy on Surfaces: Investigation of the Surface Potential of Self‐Assembled Monolayers on Gold. Langmuir 1999, 15, 8184‐8188. 89. Bastidas, D. M.; Cayuela, I.; Bastidas, J. M., Ant‐Nest Corrosion of Copper Tubing in Air‐Conditioning Units. Revista De Metalurgia 2006, 42, 367‐381. 90. Notoya, T., Localized Corrosion in Copper Tubes and the Effect of Anti‐Tarnishing Pretreatment. Journal of Materials Science Letters 1991, 10, 389‐391. 91. Mekhalif, Z.; Fonder, G.; Laffineur, F.; Delhalle, J., Comparative Assessment of n‐Dodecanethiol and n‐Dodecaneselenol Monolayers on Electroplated Copper. Journal of Electroanalytical Chemistry 2008, 621, 245‐253. 92. Santos, G.; Baldelli, S., Scale Dependence of the Orientation and Conformation Distribution Analysis of a Molecular Monolayer Using Sum Frequency Generation Imaging Microscopy. The Journal of Physical Chemistry C 2012, 116, 25874‐25887.


![Northeastern Brazilian marine atmospheric corrosion ... · Northeastern Brazilian marine atmospheric corrosion performances of ... in this case, sorted by NBR 14643/01 [4] and t4,](https://img.pdfslide.us/doc/110x75/5be3a87709d3f2d7048b9a8d/northeastern-brazilian-marine-atmospheric-corrosion-northeastern-brazilian.jpg)