Embed Size (px)
Citation preview

Molecular Spectroscopy: Principles and Biophysical
Applications
BiCh132 Fall Quarter 2012
Jack BeauchampMany of the illustrations and tables used in these presentations were taken from the scientific literature and various WWW sites; the authors are collectively acknowledged.
This presentation is adapted in part from BiCh132 lectures of Professor Barton.
Recommended text: “Principles of Fluorescence Spectroscopy” by J. R. Lakowicz (3rd Edition; 2006)
Molecular Probes Handbook -11th Edition (Invitrogen)

Introduction to Fluorescence Spectroscopy
Useful probe of: environment structure dynamics chemical reactions
Timescales: visible absorption~ 10-15 sec vibrations ~ 10-14 sec emission~ 10-9 sec for allowed transitions 10-6-10-3 sec for forbidden transitions
On these timescales, emission is sensitive to competing processes

3210
3210
Absorption10-15 s Fluorescence
10-9 s
SolventCollisional vibrational dissipation
~ 10-12s
S1
T1
Phosphorescence10-6 – 10-3 s
S0
Intersystem crossing
Simplified Energy Level Diagram(Jablonski Diagram)

Franck–Condon principle energy diagram. Since electronic transitions are very fast compared with nuclear motions, vibrational levels are favored when they correspond to a minimal change in the nuclear coordinates. The potential wells are shown favoring transitions between v = 0 and v = 2.
Franck-Condon Principle for Electronic Transitions

Schematic representation of the absorption and fluorescence spectra corresponding to the energy diagram in previous slide. The symmetry is due to the equal shape of the ground and excited state potential wells. The narrow lines can usually only be observed in the spectra of dilute gases. The darker curves represent the inhomogeneous broadening of the same transitions as occurs in liquids and solids. Electronic transitions between the lowest vibrational levels of the electronic states (the 0-0 transition) have the same energy in both absorption and fluorescence.
Franck-Condon Principle for Electronic Transitions

Edward Condon
Franck-Condon Principle for Electronic
Transitions (1926)
Classically, the Franck–Condon principle is the approximation that an electronic transition is most likely to occur without changes in the positions of the nuclei in the molecular entity and its environment. The resulting state is called a Franck–Condon state, and the transition involved, a vertical transition. The quantum mechanical formulation of this principle is that the intensity of a vibronic transition is proportional to the square of the overlap integral between the vibrational wavefunctions of the two states that are involved in the transition.

Edward Condon

F = fluorescence quantum yield = fraction of singlets relaxing from excited state via fluorescence # photons emitted by fluorescence
unless some catalytic chemiluminescent process
Fluorescence Intensity x # excited state molecules x c I0
kF = rate of spontaneous emission P00 = transition probability
same path for excitation and emission
10 F
# photons absorbed=
FF
othersF
FF kk
k=
Rate constant for emission
kF + (rate constants for non-radiative pathways)
Fluorescence Quantum Yields

1. Internal conversion, kic
collision with solventdissipation of energy through internal vibrational modesbasically transfer into excited vibrational states of S0
Note - kic increases with Ttherefore FF decreases with T
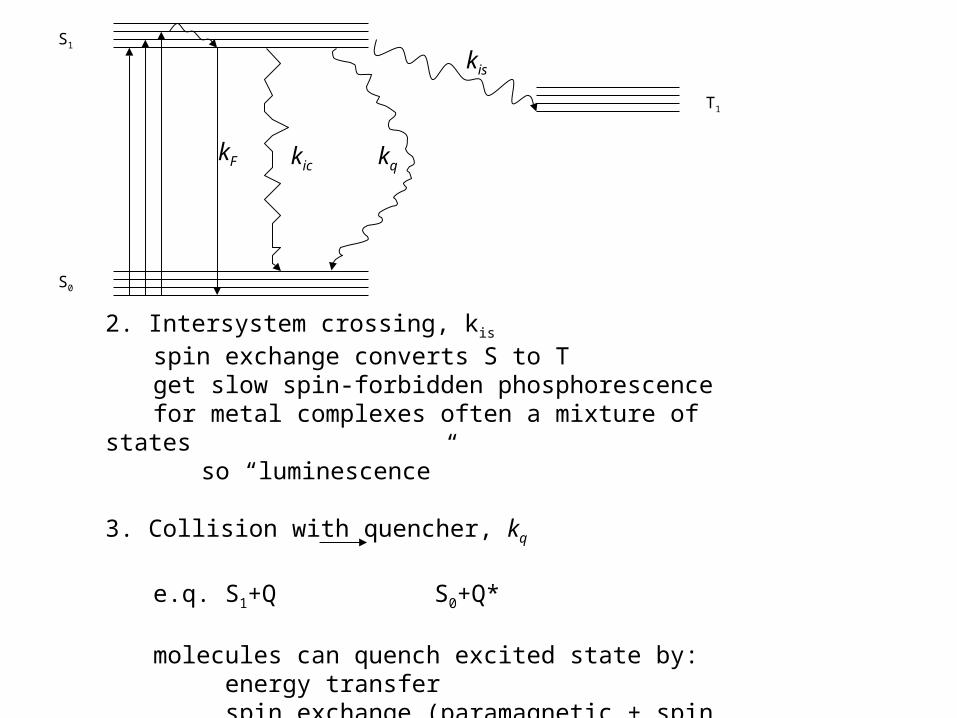
What processes compete with fluorescence?
kF kic kq
kis
S0
S1
T1
kF kic kq
kis
S0
S1
T1
2. Intersystem crossing, kis
spin exchange converts S to Tget slow spin-forbidden phosphorescencefor metal complexes often a mixture of states
so “luminescence”
3. Collision with quencher, kq
e.q. S1+Q S0+Q*
molecules can quench excited state by: energy transfer spin exchange (paramagnetic + spin orbit coupling) electron transfer or proton transfer (+ energy)

Note - kF is not temperature dependent but all else is
][Qkkkk
k
qisicF
FF
So, what matters are the rates of these competing processes
Also,
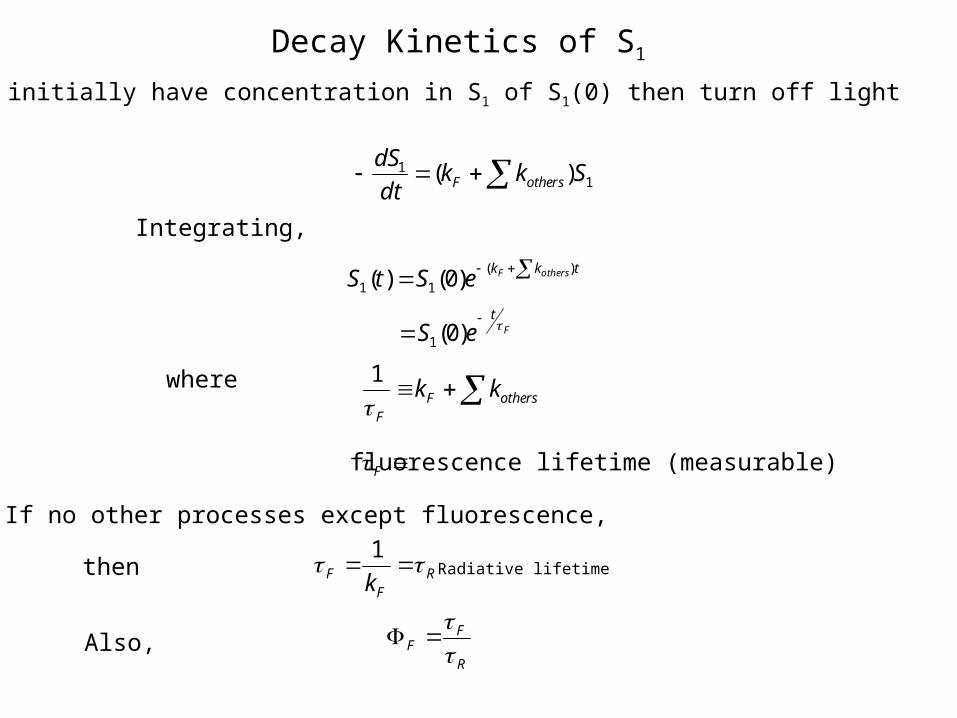
Decay Kinetics of S1
Suppose initially have concentration in S1 of S1(0) then turn off light
Integrating,
where
If no other processes except fluorescence,
11 )( Skk
dt
dSothersF
tkk othersFeStS)(
11 )0()(
F
t
eS )0(1
othersFF
kk1
F fluorescence lifetime (measurable)
then RF
F k
1Radiative lifetime
R
FF

Can measure steady state or time resolved emission
For lifetimes: - then flash and turn off light and measure decay as a function of time- flash photolysis- single photon counting- streak cameras- time resolution depends on flash(also frequency domain measurements - phase modulation)
For quantum yields, need geometry constant and correct for emission detectors-use standards (actinometry)
Practical things:
Excitation
Monochromator
Emission
Monochromator
Detector
Light source Emitted light
Sample

Principle: When a fluorescent molecule is excited with plane polarized light, light is emitted in the same polarized plane, provided that the molecule remains stationary throughout the excited state (which has a duration of 4 nanoseconds for fluorescein). If the molecule rotates and tumbles out of this plane during the excited state, light is emitted in a different plane from the excitation light. If vertically polarized light is exciting the fluorophore, the intensity of the emitted light can be monitored in vertical and horizontal planes (degree of movement of emission intensity from vertical to horizontal plane is related to the mobility of the fluorescently labeled molecule). If a molecule is very large, little movement occurs during excitation and the emitted light remains highly polarized. If a molecule is small, rotation and tumbling is faster and the emitted light is depolarized relative to the excitationplane.
Fluorescence Polarization / Depolarization
Practical (sometimes annoying) things:

Schematic representation of FP detection. Monochromatic light passes through a vertical polarizing filter and excites fluorescent molecules in the sample tube. Only those molecules that are oriented properly in the vertically polarized plane absorb light, become excited, and subsequently emit light. The emitted light is measured in both the horizontal and vertical planes.
Fluorescence Polarization / Depolarization

Here Ill is the intensity of emitted light polarized parallel to the excitation light, and I⊥ is the intensity of emitted light polarized perpendicular to the excitation light. An important property of the polarization that emerges from this equation is that it is independent of the fluorophore concentration. Although thisequation assumes that the instrument has equal sensitivity for light in both the perpendicular and parallel orientations, in practice this is not the case.
Fluorescence Polarization / Depolarization
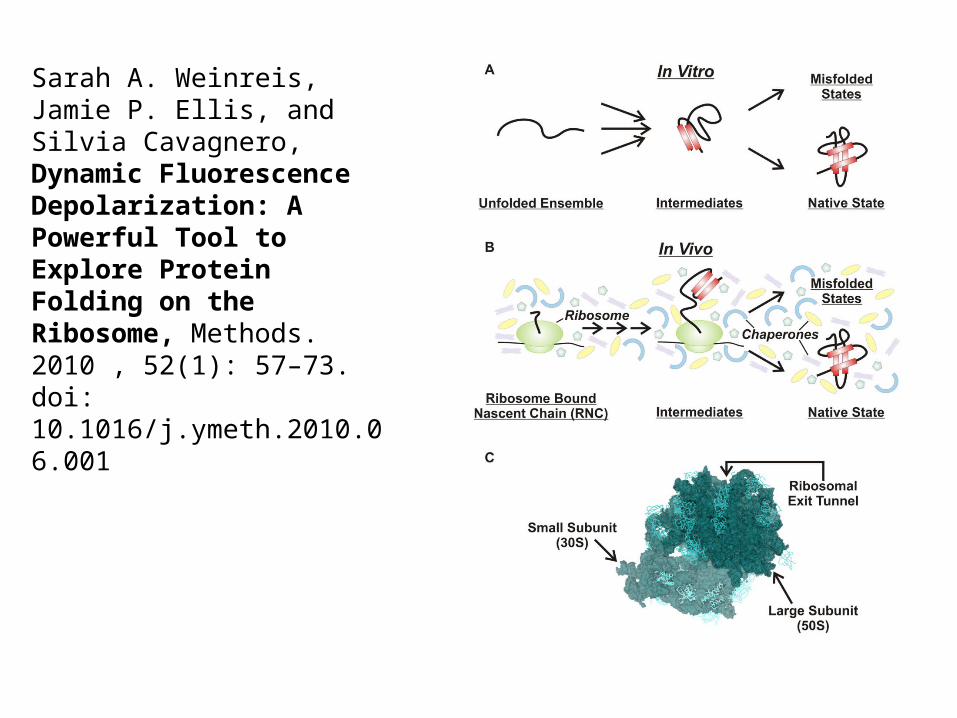
Sarah A. Weinreis, Jamie P. Ellis, and Silvia Cavagnero, Dynamic Fluorescence Depolarization: A Powerful Tool to Explore Protein Folding on the Ribosome, Methods. 2010 , 52(1): 57–73. doi: 10.1016/j.ymeth.2010.06.001

Schematic depiction of a protein folding reaction in the cytoplasm of an E. coli cell, showing vividly how different the environment is from dilute in vitro refolding experiments. The cytoplasmic components are present at their known concentrations. Features of particular importance to the folding of a protein of interest (in orange) are: the striking extent of volume exclusion due to macromolecular crowding, the presenceof molecular chaperones that interact with nascent and incompletely folded proteins (GroEL in green, DnaK in red, and trigger factor in yellow), and the possibility of co-translational folding upon emergence of the polypeptide chain from the ribosome (ribosomal proteins are purple; all RNA is salmon). The cytoplasm image is courtesy of A. Elcock.
Anne Gershenson and Lila M. Gierasch, Protein Folding in the Cell: Challenges and Progress, Curr Opin Struct Biol. 2011, 21(1):32–41. http://dx.doi.org/10.1016/j.sbi.2010.11.001

Practical things (for a few $ more):
http://www.olympusfluoview.com/applications/fretintro.html
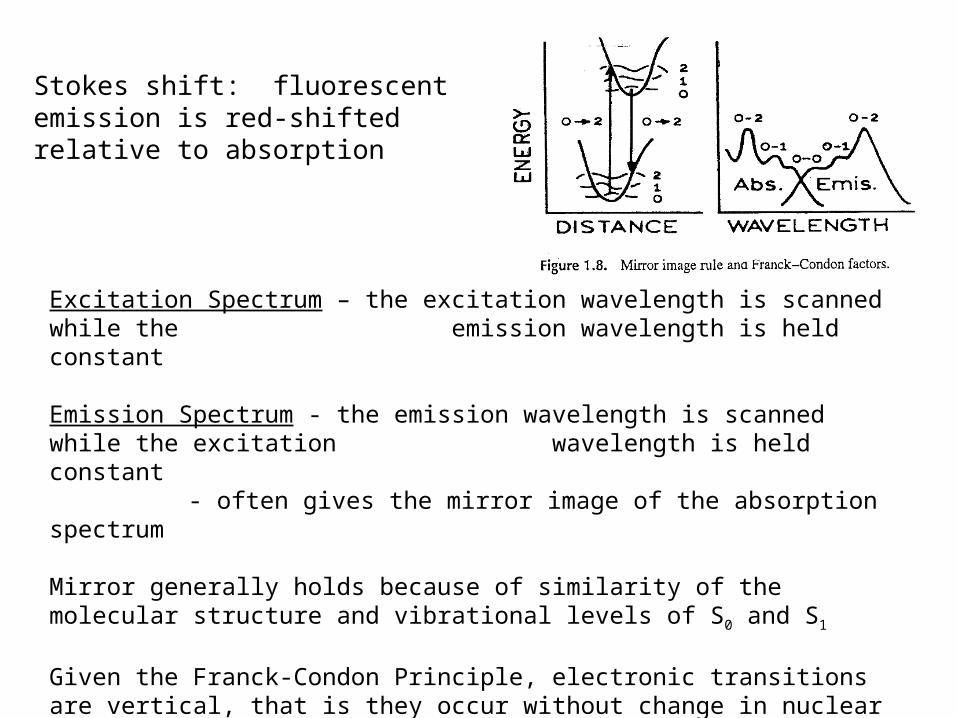
Excitation Spectrum – the excitation wavelength is scanned while the emission wavelength is held constant
Emission Spectrum - the emission wavelength is scanned while the excitation wavelength is held constant
- often gives the mirror image of the absorption spectrum
Mirror generally holds because of similarity of the molecular structure and vibrational levels of S0 and S1
Given the Franck-Condon Principle, electronic transitions are vertical, that is they occur without change in nuclear positions. If a particular transition probability between 0 and 2 vibrational levels is highest in absorption, it will also be most probable in emission.
Stokes shift: fluorescent emission is red-shifted relative to absorption

Some Exceptions to Mirror Image Rule
1. Contaminants !!
2. Excitation to higher state(s) S2
3. Different geometry in excited state
4. Exciplexes (CT state)
5. Excimers
6. pK effects (excited state acid base properties)
Dimer excited state

Acid-base properties are modified in electronically excited states
Example- pKa for acridine in ground state= 5.5 pKa for acridine in excited state= 10.7
protonation can occur during excited state lifetime
Effects are quantified with use of the Förster Cycle
Think of some applications of this phenomenon
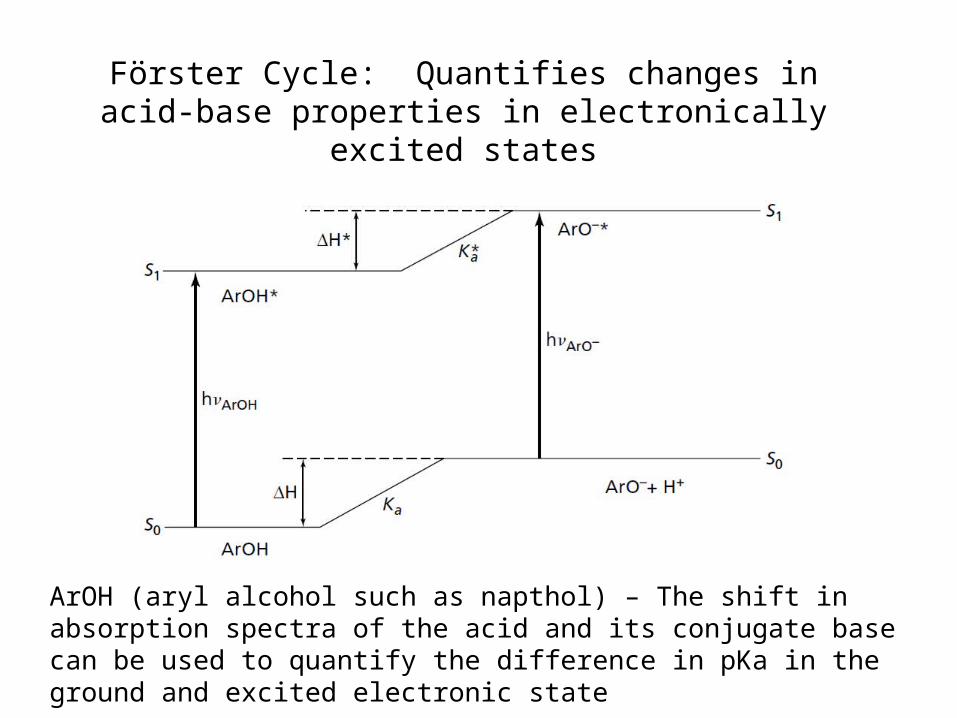
Förster Cycle: Quantifies changes in acid-base properties in electronically excited states
ArOH (aryl alcohol such as napthol) – The shift in absorption spectra of the acid and its conjugate base can be used to quantify the difference in pKa in the ground and excited electronic state
.
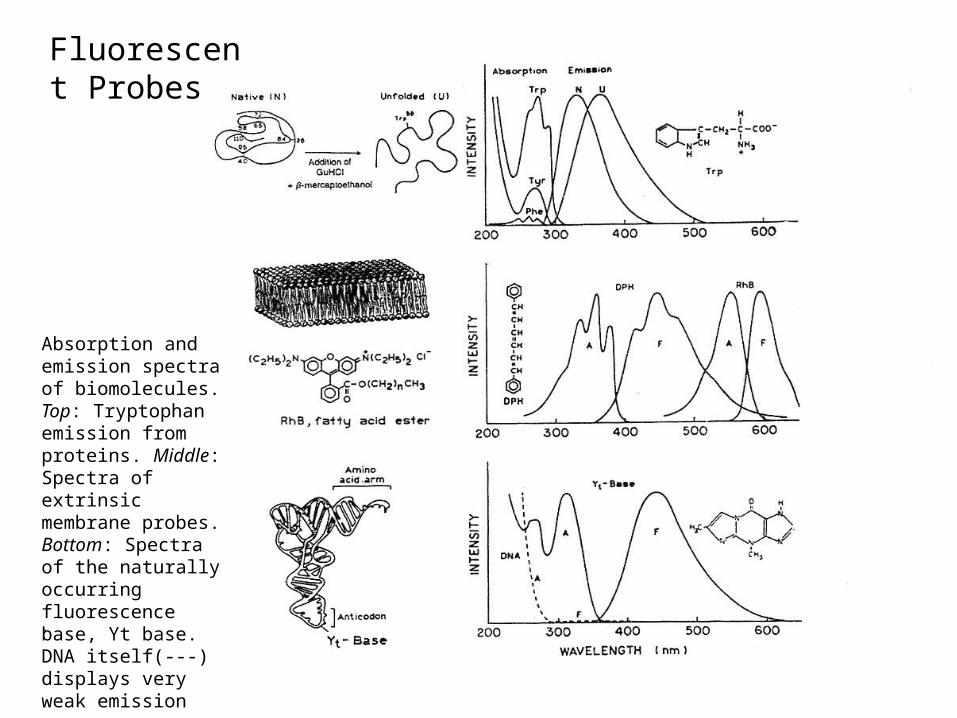
Fluorescent Probes
Absorption and emission spectra of biomolecules. Top: Tryptophan emission from proteins. Middle: Spectra of extrinsic membrane probes. Bottom: Spectra of the naturally occurring fluorescence base, Yt base. DNA itself(---) displays very weak emission
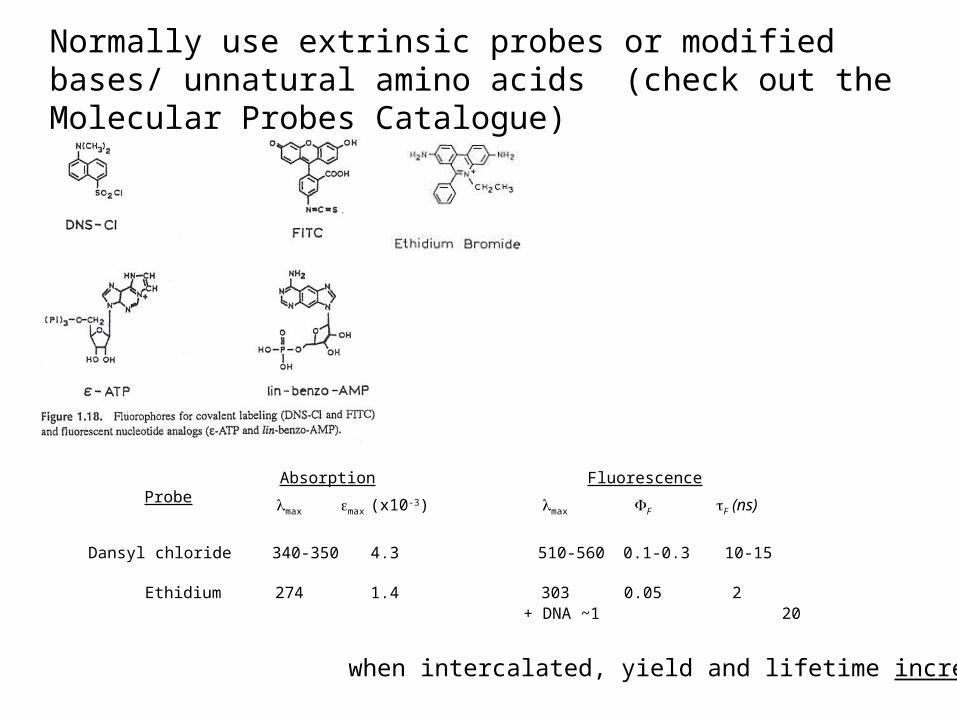
Normally use extrinsic probes or modified bases/ unnatural amino acids (check out the Molecular Probes Catalogue)
when intercalated, yield and lifetime increase
Probe
Dansyl chloride
Ethidium
lmax max (x10-3) lmax F F (ns)
Absorption Fluorescence
340-350
274
4.3
1.4
510-560
303
0.1-0.3
0.05
10-15
2+ DNA ~1 20

If you have 2 fluorescent components (probes), even two bound components, they will have different rates of quenching, kq
kq gives measure of accessibility of chromophore
F1
F2
Q
kq for F1 > kq for F2
Fluorescence Quenching

In the absence of quencher,
in the presence of quencher,
where quenching is the result of bimolecular collisions.
Stern-Volmer Analysis of Quenching
othersF kk
10
][
1
Qkkk qothersFQ
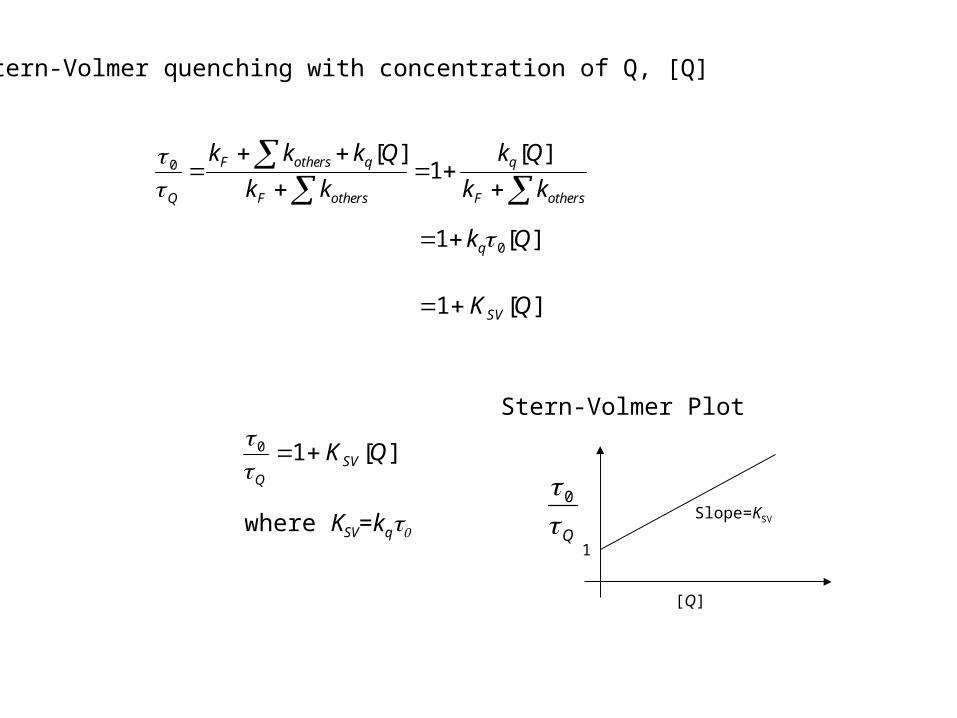
othersF
q
othersF
qothersF
Q kk
Qk
kk
Qkkk ][1
][0
][1 0 Qkq
][1 QKSV
Stern-Volmer quenching with concentration of Q, [Q]
Stern-Volmer Plot
[Q]
Q 0
1
Slope=KSV
][10 QKSVQ
where KSV=kq
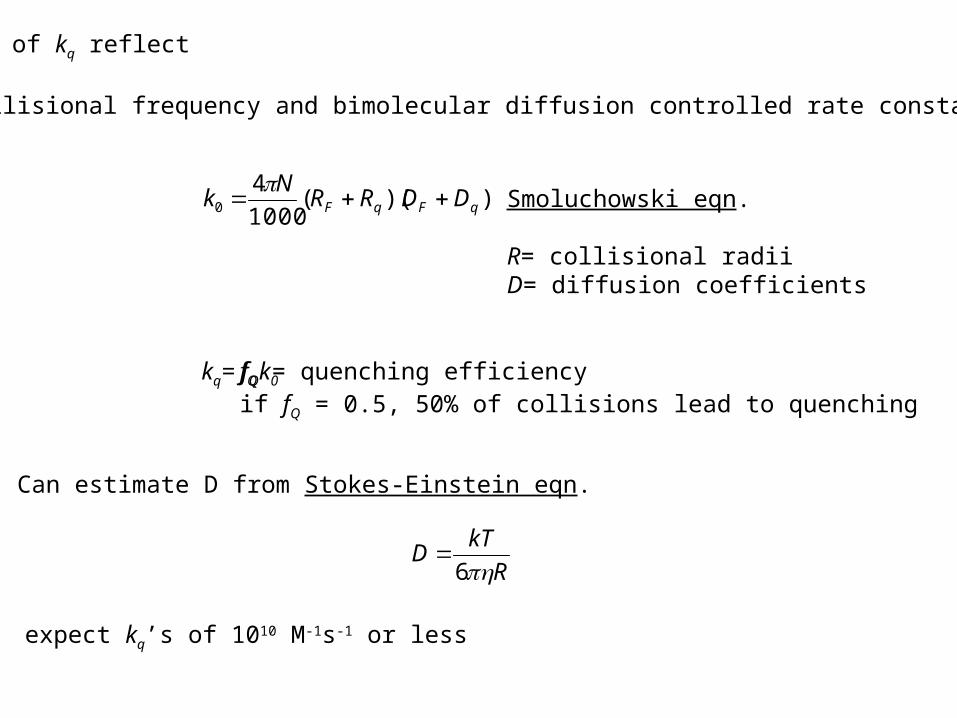
expect kq’s of 1010 M-1s-1 or less
Values of kq reflect
collisional frequency and bimolecular diffusion controlled rate constant, k0
))((1000
40 qFqF DDRR
Nk
Smoluchowski eqn.
R= collisional radiiD= diffusion coefficients
kq= fQk0 fQ = quenching efficiencyif fQ = 0.5, 50% of collisions lead to quenching
Can estimate D from Stokes-Einstein eqn.
R
kTD
6

]Q][F[
]FQ[KS Q + F FQ
Consider equilibrium formation of a ground state complex which is not fluorescent:
The total conc. of fluorophore = ]FQ[]F[]F[ 0
]Q][F[
]F[]F[K 0
S
1]F[
]F[]Q[K 0
S
]F[
]F[]Q[K1 0
S
or
If FQ is not fluorescent, then 00 F
F
]F[
]F[ fraction of fluorescence
F
F]Q[K1 0
S

so that
gives same KS.V. as
But could have
or even
00
F
F
[Q]
F
F0
[Q]
Q 0
1
Slope=KS.V.
[Q] [Q]
F
F0
F
F0
Q 0
Q 0
]Q[K1F
FSV
0
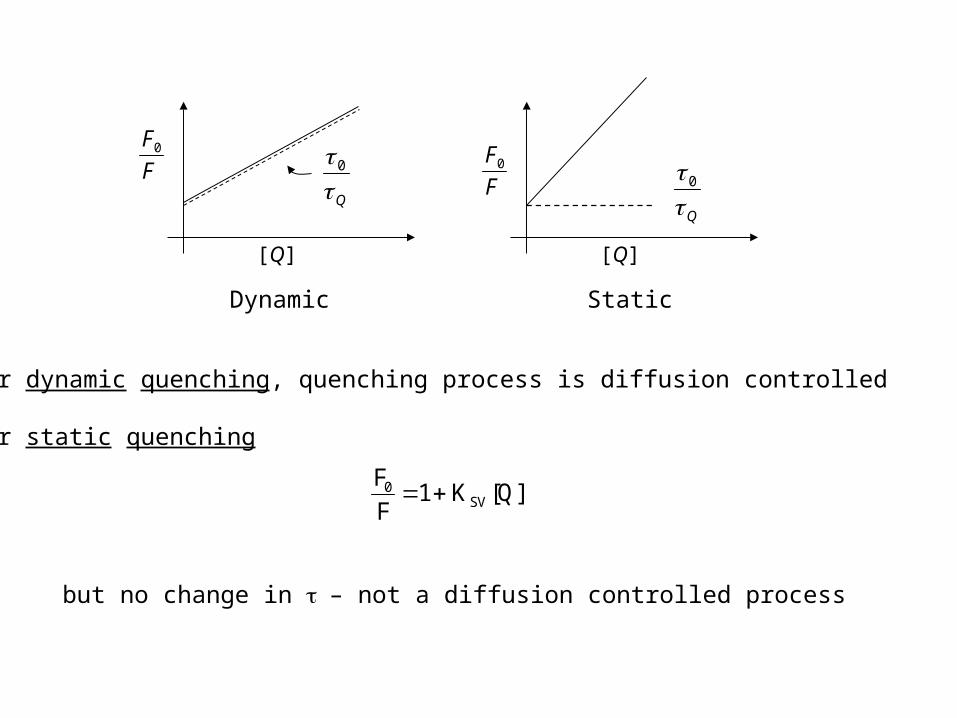
For dynamic quenching, quenching process is diffusion controlled
For static quenching
but no change in – not a diffusion controlled process
[Q] [Q]
F
F0
F
F0
Q 0
Q 0
Dynamic Static

Singlet-Singlet Energy Transfer(Förster Transfer)

Singlet-Singlet Energy Transfer(Förster Transfer)

Singlet-Singlet Energy Transfer(Förster Transfer)
Very useful for “long range” distance (20-80 Å)
R
R
Donor Acceptor
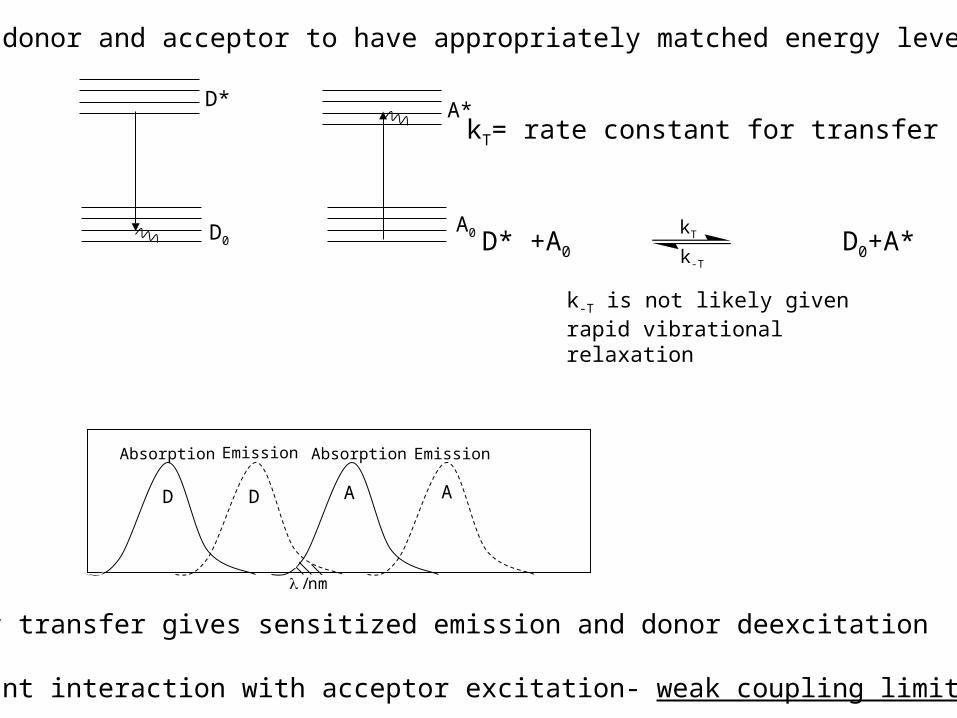
D*
D0
A*
A0
Pick donor and acceptor to have appropriately matched energy levels:
D D A A
Absorption AbsorptionEmission Emission
kT= rate constant for transfer
D* +A0 D0+A*kT
k-T
k-T is not likely given rapid vibrational relaxation
Energy transfer gives sensitized emission and donor deexcitation
Resonant interaction with acceptor excitation- weak coupling limit
nm/
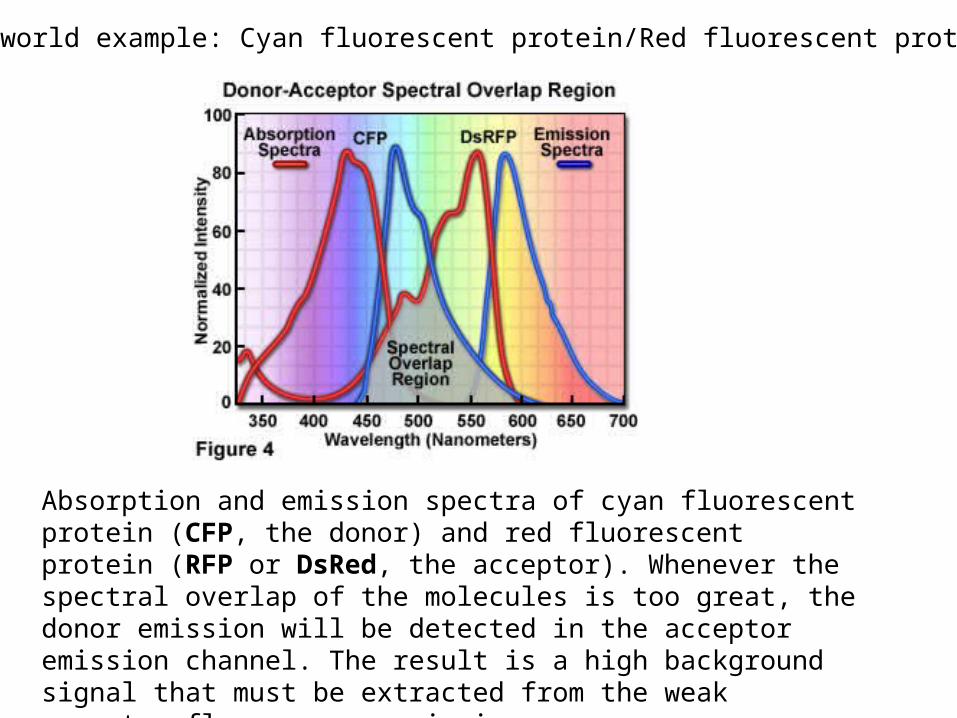
Real world example: Cyan fluorescent protein/Red fluorescent protein
Absorption and emission spectra of cyan fluorescent protein (CFP, the donor) and red fluorescent protein (RFP or DsRed, the acceptor). Whenever the spectral overlap of the molecules is too great, the donor emission will be detected in the acceptor emission channel. The result is a high background signal that must be extracted from the weak acceptor fluorescence emission.

What’s the basis for the interaction?
-As in exciton coupling, dipole-dipole: just weak coupling limit
Can describe the potential operator
5AD
3AD
DA R
)R)(R(3
RV
Where R is distance between A + D and are dipole moment operators
AD ,
3
AD
Rlump all geometric and orientational parameters in here- really hard to know , lots of variability
= 0-4
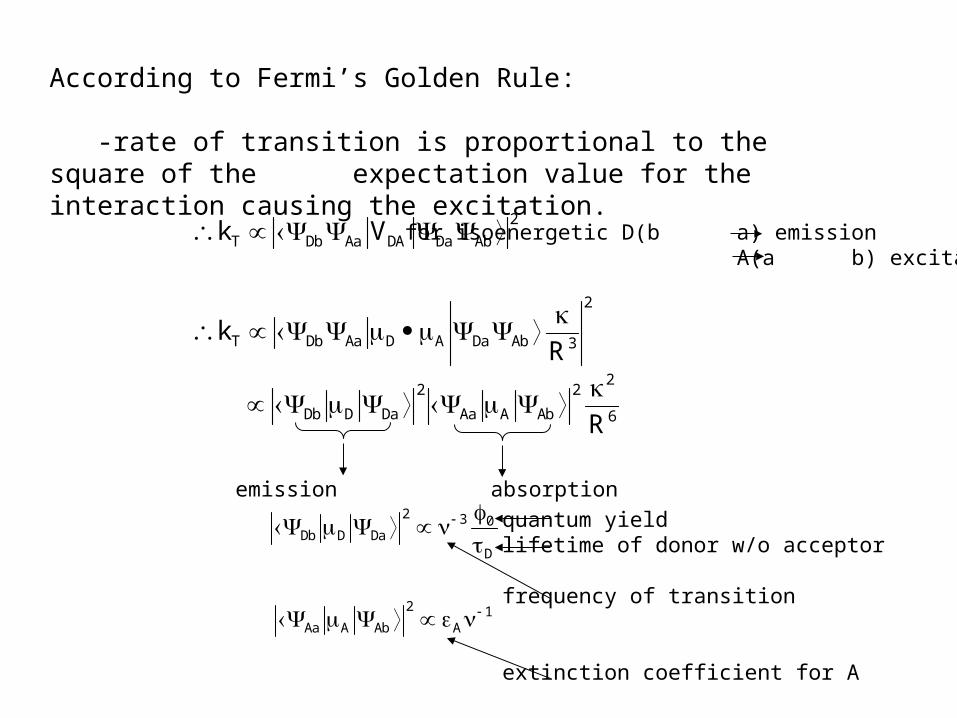
According to Fermi’s Golden Rule:
-rate of transition is proportional to the square of the expectation value for the interaction causing the excitation.
2
AbDaDAAaDbT Vk
2
3AbDaADAaDbT Rk
6
22
AbAAa
2
DaDDb R
D
032
DaDDb
1A
2
AbAAa
emission absorption
for isoenergetic D(b a) emission A(a b) excitation
quantum yieldlifetime of donor w/o acceptor
frequency of transition
extinction coefficient for A
4A
D
D6
2
T Rk
60
DT )
R
R(
1k
d)(f)(J 4DA
d)(f)(J 4DA
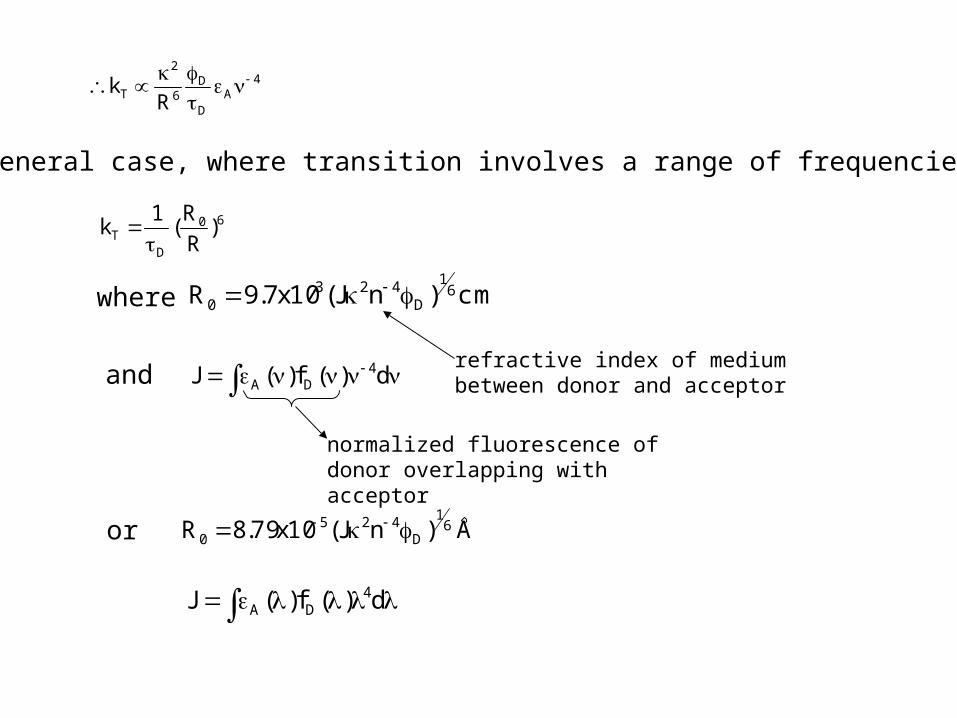
For general case, where transition involves a range of frequencies
cm)nJ(10x7.9R 61
D423
0 where
A)nJ(10x79.8R 61
D425
0
and
or
normalized fluorescence of donor overlapping with acceptor
refractive index of medium between donor and acceptor

DTothersF
TothersFAD
D k1kk
kkk
6
60
R
R1
1k
k1k
k
kkk
kE
T0
0T
0T
T
othersFT
T
660
660
RR1
RR
60
6
60
RR
RE
Naively, looks like D is emitting and A is reabsorbing but that transfer is trivial.
Also what would be effect on ?D
Usual to define efficiency
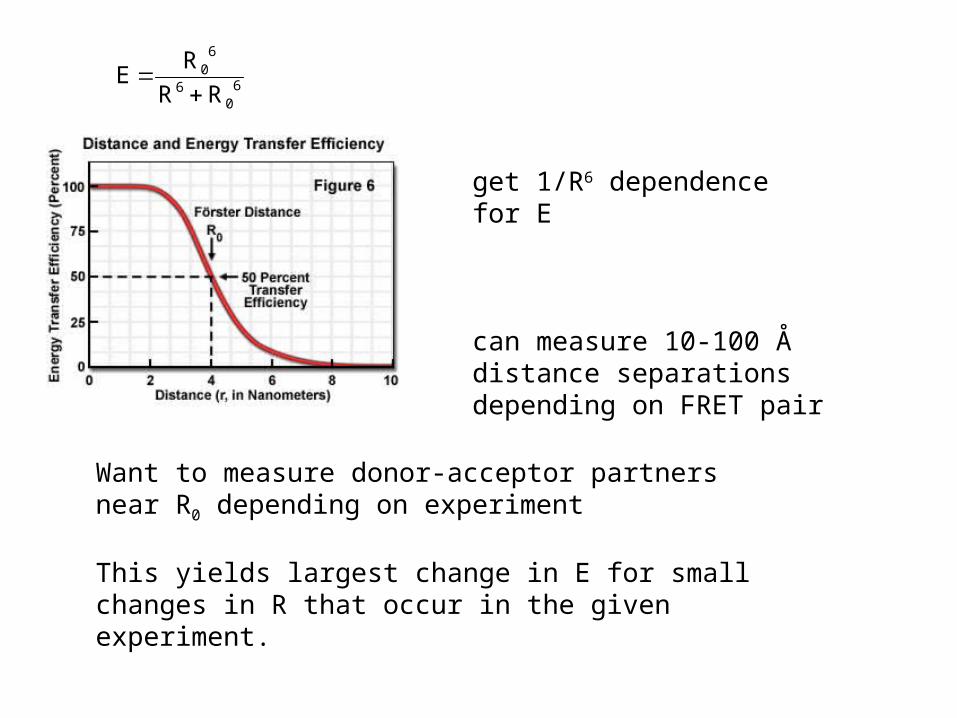
60
6
60
RR
RE
get 1/R6 dependence for E
can measure 10-100 Å distance separations depending on FRET pair
Want to measure donor-acceptor partners near R0 depending on experiment
This yields largest change in E for small changes in R that occur in the given experiment.
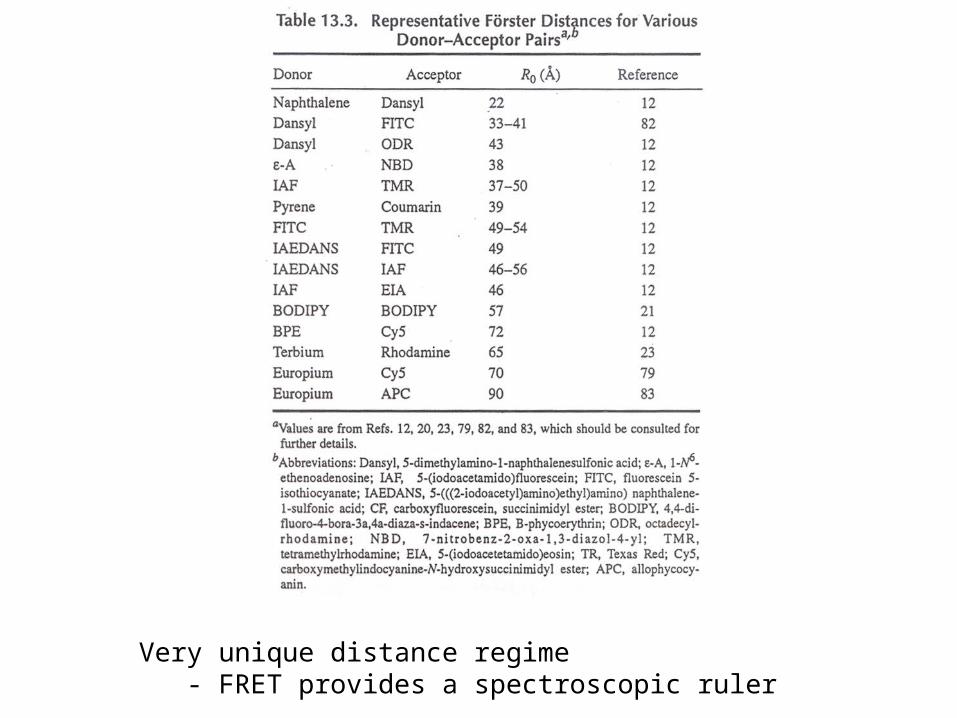
Very unique distance regime- FRET provides a spectroscopic ruler

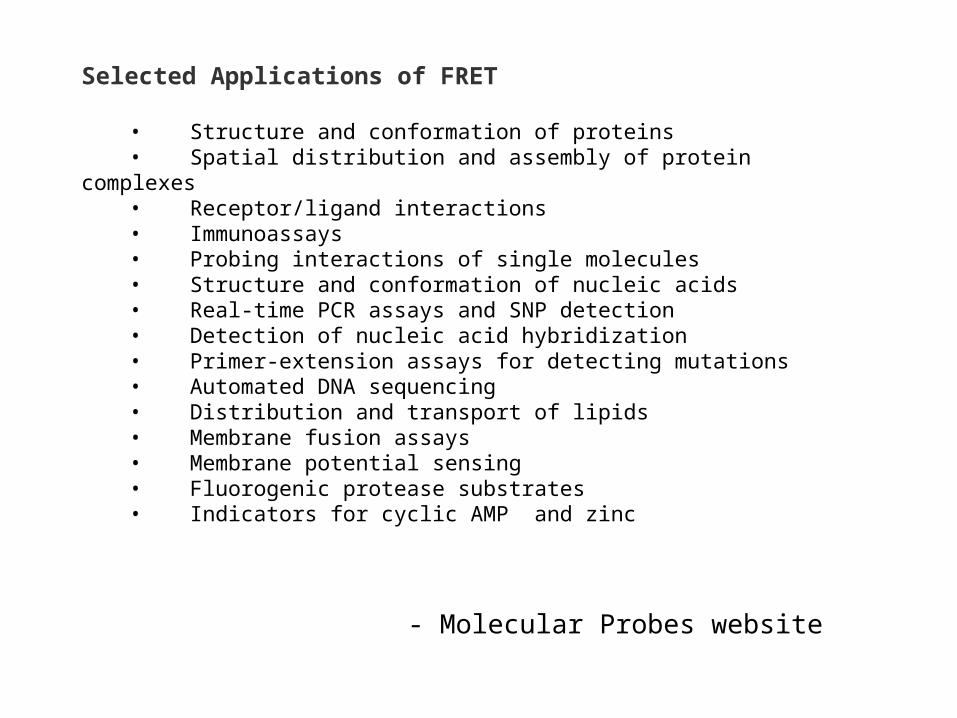
Selected Applications of FRET
• Structure and conformation of proteins • Spatial distribution and assembly of protein complexes • Receptor/ligand interactions • Immunoassays • Probing interactions of single molecules • Structure and conformation of nucleic acids • Real-time PCR assays and SNP detection • Detection of nucleic acid hybridization • Primer-extension assays for detecting mutations
• Automated DNA sequencing • Distribution and transport of lipids • Membrane fusion assays • Membrane potential sensing • Fluorogenic protease substrates • Indicators for cyclic AMP and zinc
- Molecular Probes website
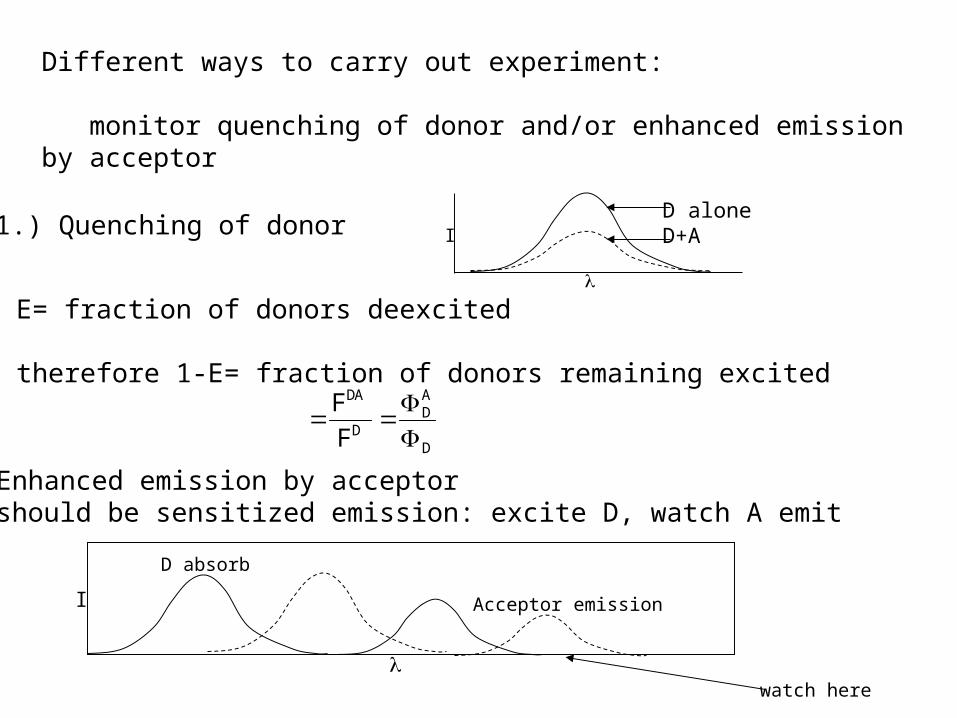
Different ways to carry out experiment:
monitor quenching of donor and/or enhanced emission by acceptor
1.) Quenching of donorD aloneD+A
E= fraction of donors deexcited
therefore 1-E= fraction of donors remaining excited
2.) Enhanced emission by acceptor-should be sensitized emission: excite D, watch A emit
D absorb
Acceptor emission
watch here
D
AD
D
DA
F
F
l
I
l
I

Dalone D+A Aalone
donor quench A sensitized emission
An example: Distance measurement in melittin
Depending upon solvent, can exist as monomer or tetramer, -helix or random coil
In practice, want 3 replicas for study:
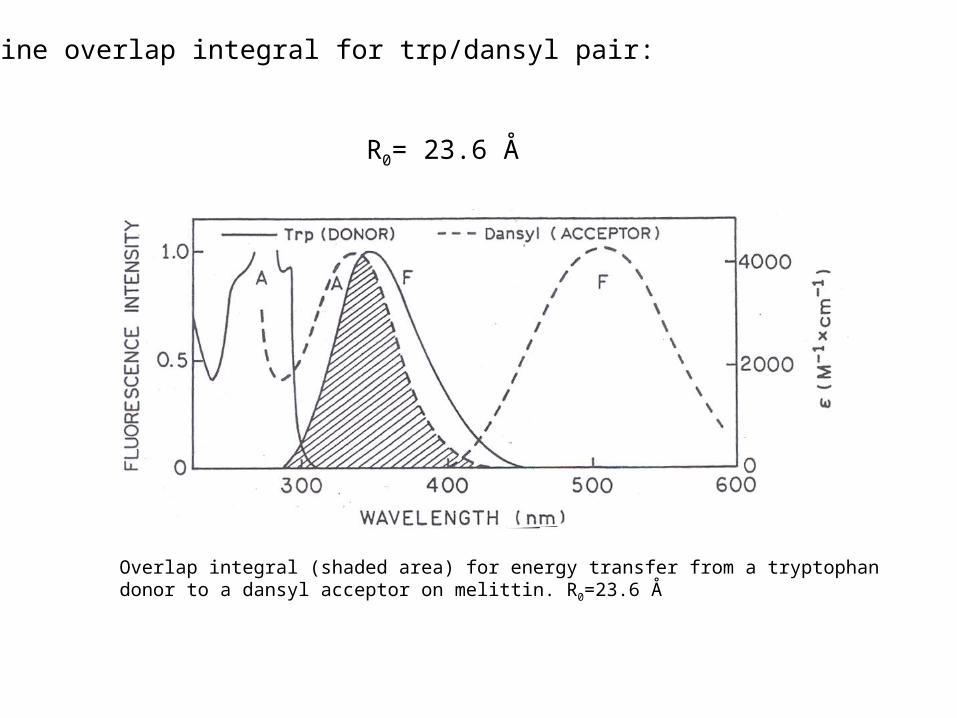
Overlap integral (shaded area) for energy transfer from a tryptophan donor to a dansyl acceptor on melittin. R0=23.6 Å
Determine overlap integral for trp/dansyl pair:
R0= 23.6 Å

55.0E1F
F
D
DA
E=0.45 R=24.4Å

But there are issues-
1.) 2 is not known, nor directly measurable for so even rough estimate suffices
6120 )(RR
Dale Eisinger Method- exploit the jitter
Likely there is fast geometric averaging before transfer, blurring 2
often set 2=2/3 for dynamic avg. of all geometriesmeans uncertainty in R is < 15%
macromolecule
acceptor
donor
κ is related to the relative orientation of the donor/acceptor pair

2.) Imperfect Stoichiometry
3.) Does the probe perturb the structure?
if possible it is good to rely on intrinsic probes: in a protein tyr/trp energy transfer is possible
D
A1
A2
kT1
kT2
otherF2T1T
2T1T
kkkk
kkE
(monomer/ tetramer equilibrium for example)
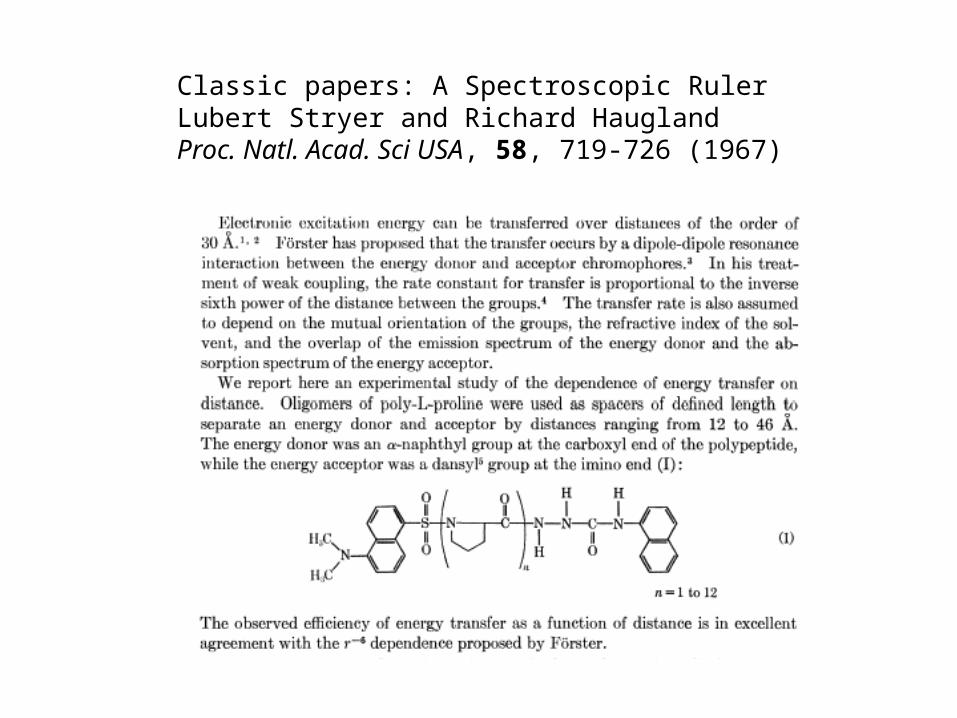
Classic papers: A Spectroscopic RulerLubert Stryer and Richard HauglandProc. Natl. Acad. Sci USA, 58, 719-726 (1967)

DA
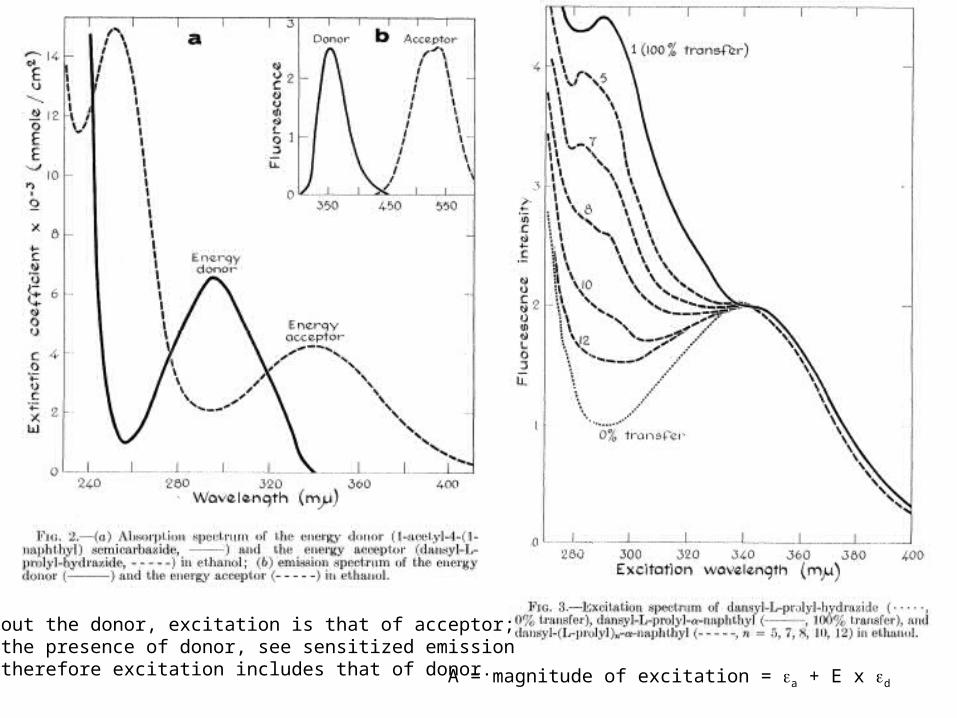
A = magnitude of excitation = a + E x d
Without the donor, excitation is that of acceptor; in the presence of donor, see sensitized emission and therefore excitation includes that of donor.

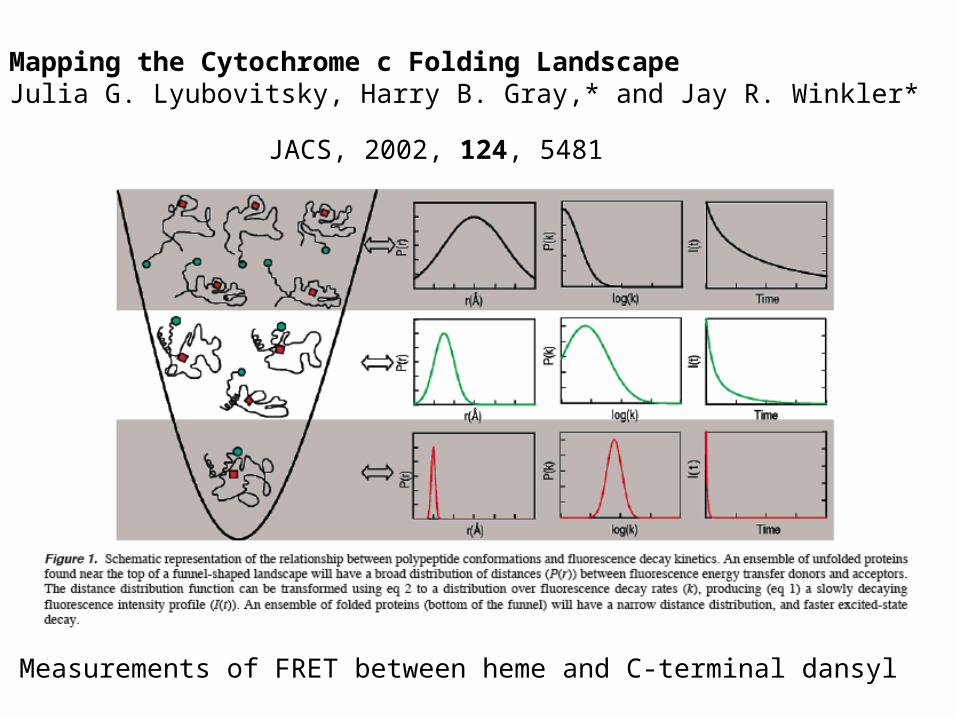
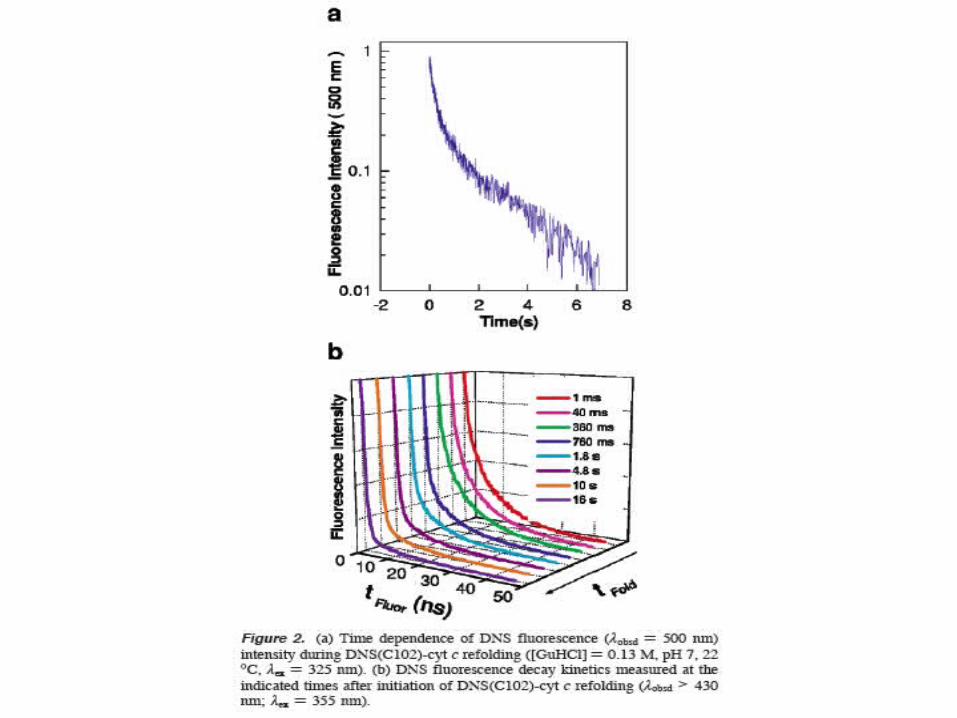
Mapping the Cytochrome c Folding LandscapeJulia G. Lyubovitsky, Harry B. Gray,* and Jay R. Winkler*
JACS, 2002, 124, 5481
Measurements of FRET between heme and C-terminal dansyl

There is a rapid equilibration among extendedconformations, enabling escape from frustratedcompact structures
Some population of extended conformations,with long distances remain even at long times.

Single Molecule Fluorescence Experiments

Example: Nucleic Aid Conformation and dynamics
Single molecule FRET study of Holliday junction by total internal reflectance microscopy. The nucleic acid is tethered to the surface via biotin-neutravidin conjugation. The conformational dynamics is shown in the fluorescence time trace.
McKinney, Declais, Lilley, Ha, Nature Structural Biol. 10 93-97 (2003)
TIRF
Area detector/camera


![INDEX 0269 [globalgenealogy.com]globalgenealogy.com/countries/canada/ontario/eastern-ontario/... · BEAUCHAMP, Yvon Gerard 0216 BERTRAND, Rose Delima 0093 BEAUCHAMP, Yvonne 0084A](https://img.pdfslide.us/doc/110x75/5b9b79ef09d3f2d06f8cf723/index-0269-beauchamp-yvon-gerard-0216-bertrand-rose-delima-0093-beauchamp.jpg)