Embed Size (px)
Citation preview

1
Molecular recognition and self-assembly mechanism of
cocrystallization process
Na Wang,a Hongxun Hao, *a,b Haijiao Lu a and Ruilin Xua
a National Engineering Research Center of Industrial Crystallization Technology, School of Chemical Engineering and
Technology, Tianjin University, Tianjin, 300072, P R China b Collaborative Innovation Center of Chemical Science and Engineering, Tianjin, P R China
Contents of Supporting Information:
1. Experimental section ................................................................................................... 2
1.1 Materials. .............................................................................................................. 2
1.2 Analytical methods & equipments. ........................................................................ 2
1.3 Experimental section. ............................................................................................ 3
2. Figure Contents .......................................................................................................... 5
Figure S1 ..................................................................................................................... 5
Figure S2 ..................................................................................................................... 5
Figure S3 ..................................................................................................................... 6
Figure S4 ..................................................................................................................... 7
Figure S5 ..................................................................................................................... 9
Figure S6 ................................................................................................................... 10
Figure S7 ................................................................................................................... 13
Figure S8 ................................................................................................................... 14
3. Table contents ........................................................................................................... 15
Table S1 .................................................................................................................... 15
Table S2 .................................................................................................................... 16
Table S3 .................................................................................................................... 17
Table S4 .................................................................................................................... 18
4. CCDC number .......................................................................................................... 20
Electronic Supplementary Material (ESI) for CrystEngComm.This journal is © The Royal Society of Chemistry 2017

2
1. Experimental section
1.1 Materials.
Analytical-grade urea was supplied by Tianjin Fengchuan Chemical Reagent Technologies Co., Ltd.
of China. Its mass fraction purity is higher than 99.0%. The m-cresol (MC) with mass fraction purity
higher than 99.0% was purchased from Tianjin Yuanli Chemical Co., Ltd. of China. Its purity was
determined by gas chromatograph. The analytical-grade toluene was purchased from Tianjin
Guangfu Fine Chemical Research Institute. The dimethyl sulfoxide-d6 (DMSO-d6, 99.9 atom % D,
contains 0.03% (v/v) TMS) was purchased from SIGMA-ALORICH Co., of USA. All chemicals
were used without further purification. Figure S1 indicates the molecular structures of urea and MC.
1.2 Analytical methods & equipments.
1.2.1 X-ray diffraction. Powder samples for X-ray powder diffraction (PXRD) analysis were piled
on a glass slide. The patterns were collected by Rigaku D/MAX 2500 in 2θ range from 2° to 50°
with a step size of 0.02°, voltage of 40 kV, and current of 100 mA. The single crystal X-ray
diffraction data of MC_U cocrystal were collected on a Rigaku-Rapid II diffractometer with
Mercury2 CCD area-detector by using graphite-monochromatized Mo Kα radiation (λ= 0.71073).
1.2.2 Thermal analysis. The thermodynamic properties of MC_U cocrystal were determined by
DSC (DSC 1/500, Mettler-Toledo, Switzerland) under protection of nitrogen atmosphere (dry
nitrogen; purging rate: 50 mL/min). The samples (5-10 mg) were placed into 50 μL aluminum pans,
and the measurement temperature range was 25-100 °C with heating rate of 5 °C/min. The
temperature deviations of the measurement were ± 0.3 K.
1.2.3 Fourier transformed infrared spectrometer (FTIR). Infrared spectra of urea, MC and
MC_U cocrystal were collected by using FTS6000 infrared instrument (Bio-rad). 1-2 mg samples
and 200 mg pure KBr were thoroughly ground to smaller than 2 µm and then homogeneously mixed
by a mortar and pestle. The interaction between MC and urea was confirmed based on the
wavenumbers.
1.2.4 1H-nuclear magnetic resonance (1H NMR). 1H NMR analyses were performed on a Varian
Inova 500 MHz Spectrometer (Palo Alto, CA, USA). Approximately 6-8 mg samples were dissolved
into 0.6 ml DMSO-d6. The existence of dMCUs were confirmed based on the changes of the
chemical shifts of protons among MC, urea and MC_U cocrystal.
3
1.2.5 Raman spectroscopy (Raman). The RamanRXN2TM HYBRID analyzer (Kaiser Optical
Systems, Inc. USA) which was equipped with both a PhAT probe head (for non-contact
measurements) and a MR probe head (for direct measurements) was used to in situ monitor for the
formation processes of MC_U cocrystal. The Raman spectra were collected from 100 to 1890 cm-1
at 1 min intervals during the isothermal process and 30 s intervals during the cooling process,
respectively, and with 3 s exposure time. The iC RamanTM software (METTLER TOLEDO) was
used to collect and analyze the Raman data. The MR probe head with immersion optics was used to
in situ monitor the formation of MC_U cocrystal in solution while the PhAT probe head was used
to collect the characteristic peaks for qualitative analysis.
1.2.6 Attenuated total reflection Fourier transformed infrared spectroscopy (ATR-FTIR). The
ATR-FTIR ReactIR 45m (METTLER TOLEDO) which is designed to be flexible to use the full
range of Comp probe and conduit technologies was used to in situ monitor the solute concentration.
The iC IRTM software was used for data acquisition and analysis. The measurement duration was set
at 1 min and spectra were collected from 1000 to 1890 cm-1.
1.2.7 Focused Beam Reflectance Measurement (FBRM). A laboratory scale FBRM (model
M400LF) system coupled with iC FBRMTM software from METTLER TOLEDO was employed to
measure the particles with a 2 s duration. The total counts of particles were used to monitor the
appearance and disappearance of crystals.
1.3 Experimental section.
1.3.1 Cocrystal preparation.
The single crystals of MC_U cocrystal were grown by using slow cooling crystallization. Certain
amounts of urea were added into m-cresol at 25 °C. Then, the suspension was heated until urea was
completely dissolved to form a clear solution. At last, the solution was cooled down to 25 °C slowly.
And MC_U cocrystal seeds and toluene applied during the cooling process. The suitable single
crystals were analyzed by single crystal X-ray diffractometer, DSC, FTIR, 1H NMR and Raman
spectroscopy.
1.3.2 Cooling cocrystallization. Cooling cocrystallization experiments were performed in a 250
mL double-jacketed glass crystallizer as shown in Figure S2. The temperature of jacketed
crystallizer was controlled by a thermostat, and the accuracy of temperature control is ±0.01 °C. An
overhead mechanical agitator was used to mix the solution. For all experiments, the agitation speed

4
was maintained at 300 rpm. Predetermined amounts of urea (24.00g) were completely dissolved in
m-cresol (108.00g) without any other solvents in the crystallizer. At this ratio of materials, a clear
solution can be obtained only when temperature is above 60 °C while it will remain as suspension
at 60 °C. The suspension with urea particles was heated up to 76 °C rapidly and held at that
temperature for 20 min to dissolve all urea solid particles. Then, the solution was cooled down to
60 °C rapidly. In the final step cooling process, the solution was cooled down to 50 °C at cooling
rate of 0.1 °C/min. When the temperature dropped down to 59.7 °C, a burst of nucleation occurred.
Then, the crystallizer was held at 50 °C for 30 min. The obtained suspension was filtered and the
filtered cake was washed with appropriate amount of toluene, and then dried at ambient conditions
for 24 hours. The final products were analyzed by PXRD, DSC, FTIR and 1H NMR. During these
experiments, Raman, ATR-FTIR spectroscopic analyzers and FBRM were used in combination to
in situ monitor the cooling cocrystallization processes.
1.3.3 Dimer verification experiments. To verify the hypothesis that m-cresol-urea dimers (dMCUs)
were firstly formed in solution before the formation of MC_U cocrystals, the following experiments
which are similar to the cooling cocrystallization experiments were designed. And the devices for
the dMCUs verification experiment are the same with the cooling cocrystallization experiments, as
showed in Figure 2. In the experiments, in order to make the experimental phenomena and trends
more prominent, 42.17g MC_U cocrystals were added into 90.00g m-cresol at 35 °C with agitation
speed of 300 rpm. With this ratio of cocrystal to m-cresol, the saturation point of the solution should
be 60 °C. The system was maintained at 35°C for 75 min to make the system to reach stability. Then,
the system was rapidly heated up to 65 °C and was held at 65 °C for 20 min to dissolve all particles.
Next, the clear solution was cooled down to 60 °C in 10 min and held for 30 min. At last, the clear
solution was cooled down to 55 °C at cooling rate of 0.05 °C/min, then down to the final temperature
35 °C at cooling rate of 0.1 °C/min. When the temperature dropped down to 56.7 °C, flaky crystals
appeared slowly. The first step cooling rate is slower than the second step, so as to avoid the
occurrence of burst nucleation. The process was also in situ monitored by Raman, ATR-FTIR
spectroscopy and FBRM.
In order to confirm the existence of dMCUs and to find the disappearing and appearing temperatures
of dMCUs upon heating or cooling, we have also designed a cycle procedure of heating and cooling
on the basis of the above experiments and the process was also in situ monitored by ATR-FTIR

5
spectroscopy and FBRM.
2. Figure Contents
Figure S1
Figure S2
Figure S1. Molecular structures of urea and m-cresol
Figure S2. A schematic diagram of the experimental setup consisting of Raman, ATR-FTIR spectroscopic analysers and FBRM.

6
Figure S3
Figure S3. PXRD patterns and DSC thermogram of MC_U cocrystal. a) shows the PXRD pattern of urea, MC_U cocrystal (CCDC) calculated by single crystal crystallography and MC_U cocrystal obtained by experiments, respectively. b) shows the DSC data of MC_U cocrystal with peak melting temperature (Tp) of 71.7 °C.

7
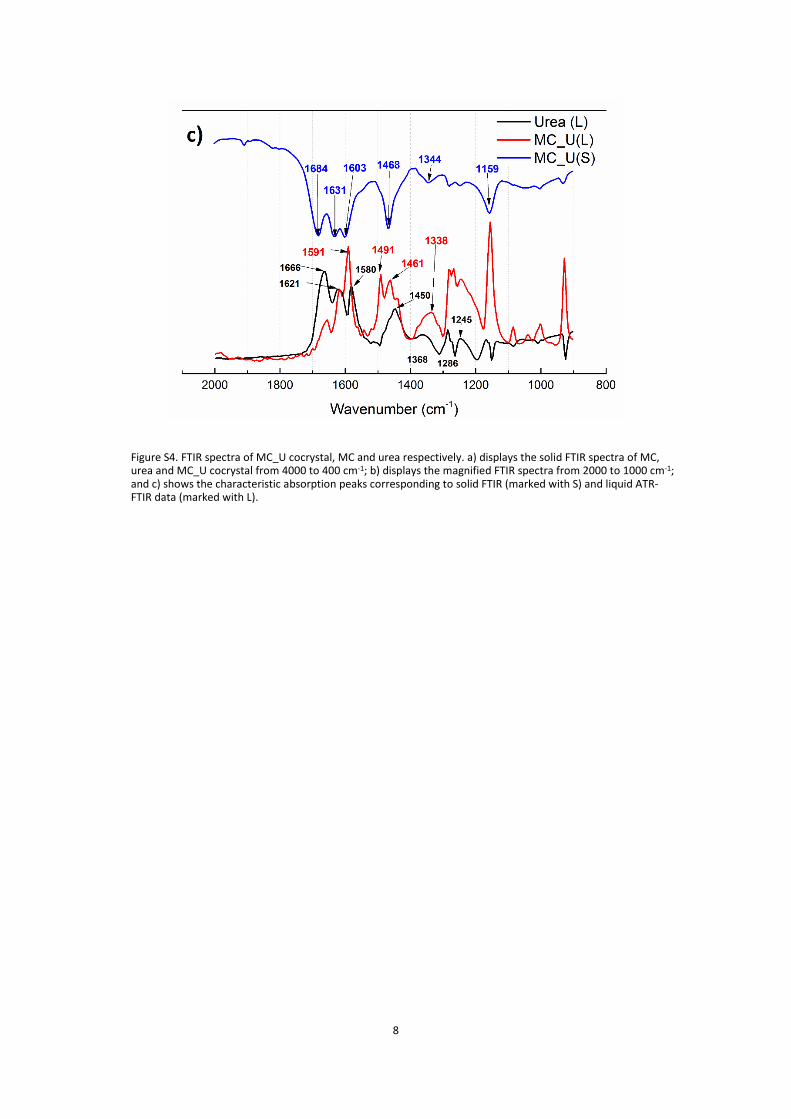
Figure S4
8
Figure S4. FTIR spectra of MC_U cocrystal, MC and urea respectively. a) displays the solid FTIR spectra of MC, urea and MC_U cocrystal from 4000 to 400 cm-1; b) displays the magnified FTIR spectra from 2000 to 1000 cm-1; and c) shows the characteristic absorption peaks corresponding to solid FTIR (marked with S) and liquid ATR-FTIR data (marked with L).

9
Figure S5
Figure S5. 1H NMR spectra of MC_U cocrystal, MC and urea in DMSO-d6, respectively. a) displays the 1H NMR spectra of MC, urea and MC_U cocrystal with the schematic diagram of MC_U cocrystal: the characteristic chemical shift of MC_U cocrystal, -OH of MC and -NH2 of urea were marked by different colors; # indicates the chemical shift values of characteristic protons of MC_U cocrystal; $ indicates the chemical shift of active hydrogen and the value in red is the -OH of MC while the value in blue is the -NH2 of urea. b) displays the different chemical shift of -NH2 in urea and MC_U cocrystal, respectively. and c) shows the different chemical shift of -OH in MC and MC_U cocrystal, respectively. The schematic diagram of “inductive effect” which is shown between b) and c) diagrams can explain the cause of the phenomenon and the deviation of chemical shift. 1H NMR (MC, 500 MHz, [D6]DMSO, 25 °C, TMS): δ = 9.21 (s, 1H; OH), 7.03 (t, 1H; =CH-), δ = 6.56 (dd, 3H; =CH-), 2.21 ppm (s, 3H; CH3). 1H NMR (Urea, 500 MHz, [D6]DMSO, 25 °C, TMS): δ = 5.44 ppm (s, 4H; NH2).

10
Figure S6

11

12
Figure S6. Raman spectra of urea, MC and MC_U cocrystal in the range of a) 1890-150 cm-1; b) 1700-1450 cm-1; c) 1050-960 cm-1; d) 650-425 cm-1 and e) 350-270 cm-1.

13
Figure S7
Figure S7. Changing trends of Raman, ATR-FTIR and FBRM data during cooling crystallization process of dimer verification experiments. R: Raman data, IR: ATR-FTIR data, FP: fingerprint region of MC_U cocrystal

14
Figure S8
Figure S8. Changing trends of ATR-FTIR and FBRM data during heating and cooling processes for investigating the effect of temperature on formation of dMCUs: dMCUs disappear when temperature is higher than 74.46 °C while dMCUs are formed when temperature is lower than 74.11 °C.

15
3. Table contents
Table S1
Table S1. Crystal Data and Structure Refinement
empirical formula C8H12O2N2
formula weight 168.20 g/mol
temperature 123 K
wavelength 0.71073 Å
crystal system, space group orthorhombic, Pbca (61)
unit cell dimensions a = 11.2502(5) Å, alpha =90 deg b = 7.1880(4) Å, beta = 90 deg c = 21.7868(15) Å, gamma = 90 deg
Volume 1761.82(17) Å3
Z, calculated density 8, 1.26817 g/cm3
F(000) 720
μ 0.092 mm-1
limiting indices -12 ≤ h ≤ 13, -4 ≤ k ≤ 8, -18 ≤ l≤ 25
completeness to theta = 25.010 99.80%
Tmin/Tmax 0.989/0.995
data/restrains/parameters 2036/0/111
goodness-of-fit on F̂2 1.098
R-Factor (%) 5.52
16
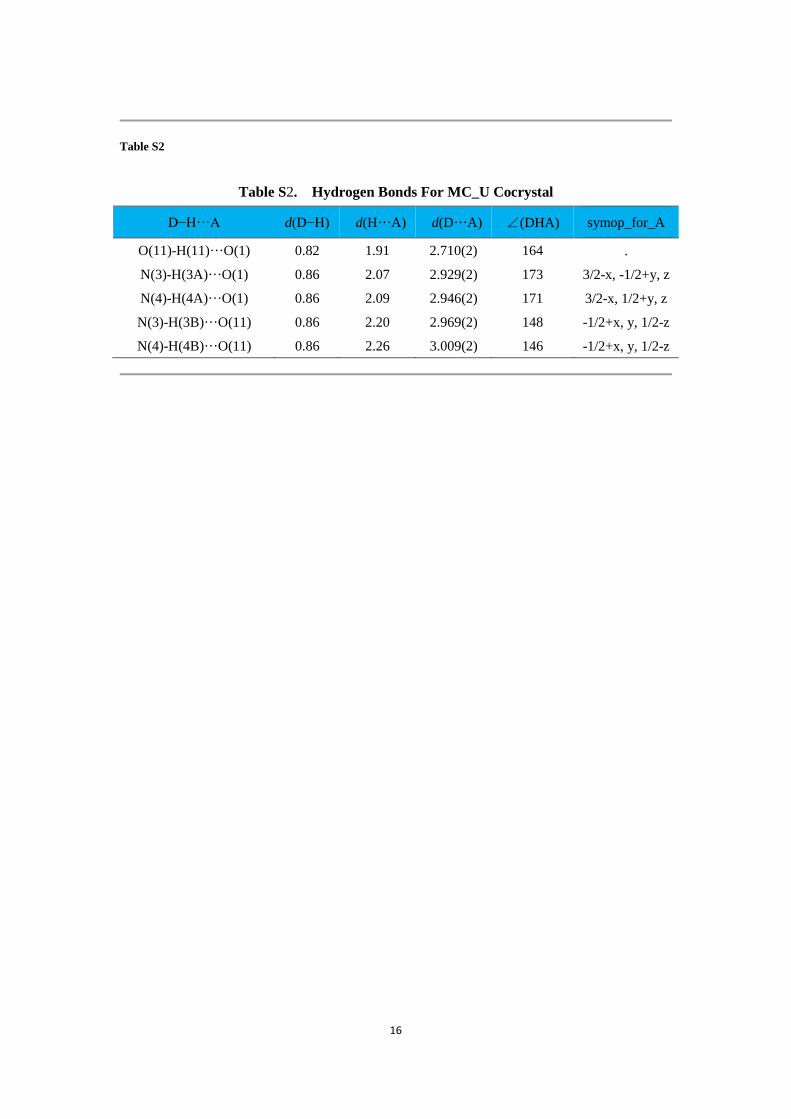
Table S2
Table S2. Hydrogen Bonds For MC_U Cocrystal
D−H···A d(D−H) d(H···A) d(D···A) ∠(DHA) symop_for_A
O(11)-H(11)···O(1) 0.82 1.91 2.710(2) 164 .
N(3)-H(3A)···O(1) 0.86 2.07 2.929(2) 173 3/2-x, -1/2+y, z
N(4)-H(4A)···O(1) 0.86 2.09 2.946(2) 171 3/2-x, 1/2+y, z
N(3)-H(3B)···O(11) 0.86 2.20 2.969(2) 148 -1/2+x, y, 1/2-z
N(4)-H(4B)···O(11) 0.86 2.26 3.009(2) 146 -1/2+x, y, 1/2-z

17
Table S3
Table S3. The Characteristic Frequencies (cm-1) of Urea, m-Cresol and MC_U
Frequencies
(cm-1) Assignme
nts
Frequencies
(cm-1) Assignme
nts
Frequencies
(cm-1) Assignm
ents IR Raman IR Raman IR Raman
U a
3435 νas(NH2)
MC
3332 ν(OH)
MC_U
3442 νas(NH2)
3335 νs(NH2)
3041 ν(=C-H) 3343 νs(NH2)
3260 2926 ν(CH3) 3210 ν(OH)
1679 1678
ν(C=O)
1668 γ(=C-H) 1684 1673 ν(C=O)
1648 1617
ν(C=C)
1655L
δs(NH2) 1666L 1594 1593 1631 1623
1625 1624
δs(NH2)
1490 1618L
1621L 1457 δas(CH3) 1603
1614L 1380 δs(CH3) 1591L 1590 ν(C=C)
1580L 1579 ν(C=O)
1329
ν(C-O)
1544 ν(C=O)
1540 1275 1271
1491L
νas(C-N) 1464 1468
νas(C-N) 1468 1484
1450L 1163 ν(C=C) 1461L
1176
ρs(NH2)
1002 ν(C=C) 1442L
1167L 776 780
meta
1344 1341
ν(C-O) 1157 733 736 1338L
1054 ρas(NH2) 689 690 1277 1283
1005 1010 νs(C-N) 445 ν(C-O) 1267L
784 781 ω(C=O) 306 ν(O-H) 1159 1167 ρs(NH2)
715 701 τas(NH2) 1155L
564 570 ρ(C=O)
1059L
FP
region b
547 1048 1089
Symbols
ν: Stretching
δ: Deformation Vibration
τ: Torsion
γ: Out-of-Plane Bending
β: In-Plane Bending
ω: Out-of-Plane Waging
ρ: In-Plane Waging
Subscript
s: Symmetric
as: Antisymmetric
Superscript
L: ATR-FTIR data
a: Urea
b: fingerprint region
1039L
1006 1015
1000
811
meta 767 735
683 685
591 C=O···H
-O
444 ν(C-O)
325 ν(O-H)

18
Table S4
With the help of MestReNova software which is used for analysis of NMR data, we get the following
Table S4 to explain the dMCUs. Samples of 7.1 mg (MC_U cocrystal), 7.0 mg (MC) and 7.3 mg
(urea) were dissolved into 0.6 ml of DMSO-d6 (0.03% (v/v) TMS), respectively. The original and
normalized NMR data are shown in Table S4. The normalization process for the “normalized 2 data”
in the last column of the Table S4 is as follows:
Firstly, the concentrations of the three samples were normalized to the same concentration.
Secondly, normalized data of MC and urea were converted to the value of the same scale with MC_U
cocrystal, that is, the “normalized data” of MC will be multiplied by 64.29% to get the “normalized
2 data” column, while the “normalized data” of urea will be multiplied by 35.71% to get the
corresponding “normalized 2 data”, in the column “Normalized 2”. And 64.29% and 35.71% are
the proportion of MC and urea in MC_U cocrystal, respectively.
Take the OH in MC for example, the “normalized 2 data” is 12.16.
And 12.16 = 18.65 * 7.1 / 7.0 * 64.19%.
In 1H NMR, the peak area is proportional to the number of protons and the ratio of the peak area is
the height of the integral curve (T. Pan, Y. Zhang and Suchman, Spectrum analytical method, East
China University of Science and Technology Press, Shanghai, 2009.). From the Normalized column
and the Component 1 (MC_U cocrystal) in Table S4, we can know that the ratio of protons in the
group is 1:1:3:4:3 (11.30 : 11.51 : 33.74 : 52.27 : 36.96 ≈1:1:3:4:3 = (1H; OH) : (1H; =CH-) : (3H;
=CH-) : (4H; NH2) ; (3H; CH3)). And the ratio means that MC_U cocrystal solution contains
equimolar amounts of MC and urea. Therefore, the dimers (dMCUs) are present in the solution.
What’s more, by comparing Component 2 and 3 with Component 1 in the Normalized 2 column,
we can know that the normalized values are very close , for example, 12.16/11.30 ≈ 1 and
55.30/52.27 ≈ 1. It means that dMCUs content only one part of MC and one part of urea. So, we
can conclude that the m-cresol-urea dimers (dMCUs), rather than trimers and tetramers, exist in
solution even before MC_U cocrystals appear as a solid.

19
Table S4. The original and normalized 1H NMR data of Urea, m-Cresol and MC_U
a: Integral range of a certain characteristic peak
b: Normalized values compared with the standard peak is processed by MestReNova software. In
this process, the peak of TMS was selected as the standard peak.
c: Normalized values at the same concentration compared with the standard peak
d: Standard peak, and the normalized value of the standard peak is 1.00.
e: The relative content of TMS is too low and the relative content of urea is too high, resulting in
the normalized value of NH2 in urea more than 100.
Components Assignment Chemical Shift
/ppm Range a
/ppm Normalized b Normalized 2 c
1 MC_U
cocrystal
s, 1H; OH 9.22 9.24 ~ 9.20 11.30 11.30
t, 1H; =CH- 7.02 7.06 ~ 6.99 11.51 11.51
dd, 3H; =CH- 6.56 6.61 ~ 6.51 33.74 33.74
s, 4H; NH2 5.42 5.54 ~ 5.30 52.27 52.27
s, 3H; CH3 2.21 2.23 ~ 2.19 36.96 36.96
TMS - 0.00 0.02 ~ -0.02 1.00 d 1.00 d
2 MC
s, 1H; OH 9.21 9.23 ~ 9.19 18.65 12.16
t, 1H; =CH- 7.03 7.06 ~ 6.99 19.12 12.47
dd, 3H; =CH- 6.56 6.61 ~ 6.51 55.21 36.00
s, 3H; CH3 2.21 2.23 ~ 2.19 60.60 39.52
TMS - 0.00 0.02 ~ -0.02 1.00 d -
3 Urea s, 4H; NH2 5.44 5.55 ~ 5.32 159.19 e 55.30
TMS - 0.00 0.02 ~ -0.02 1.00 d -
20
4. CCDC number
1541360


![Privacy and Mechanism Designaaroth/Papers/PrivacyMDSurvey.pdf · 2013-06-06 · private mechanism: the exponential mechanism of [MT07]. De nition 2.2. The exponential mechanism is](https://img.pdfslide.us/doc/110x75/5f0baa9c7e708231d4319fea/privacy-and-mechanism-design-aarothpapers-2013-06-06-private-mechanism-the.jpg)