Embed Size (px)
Citation preview
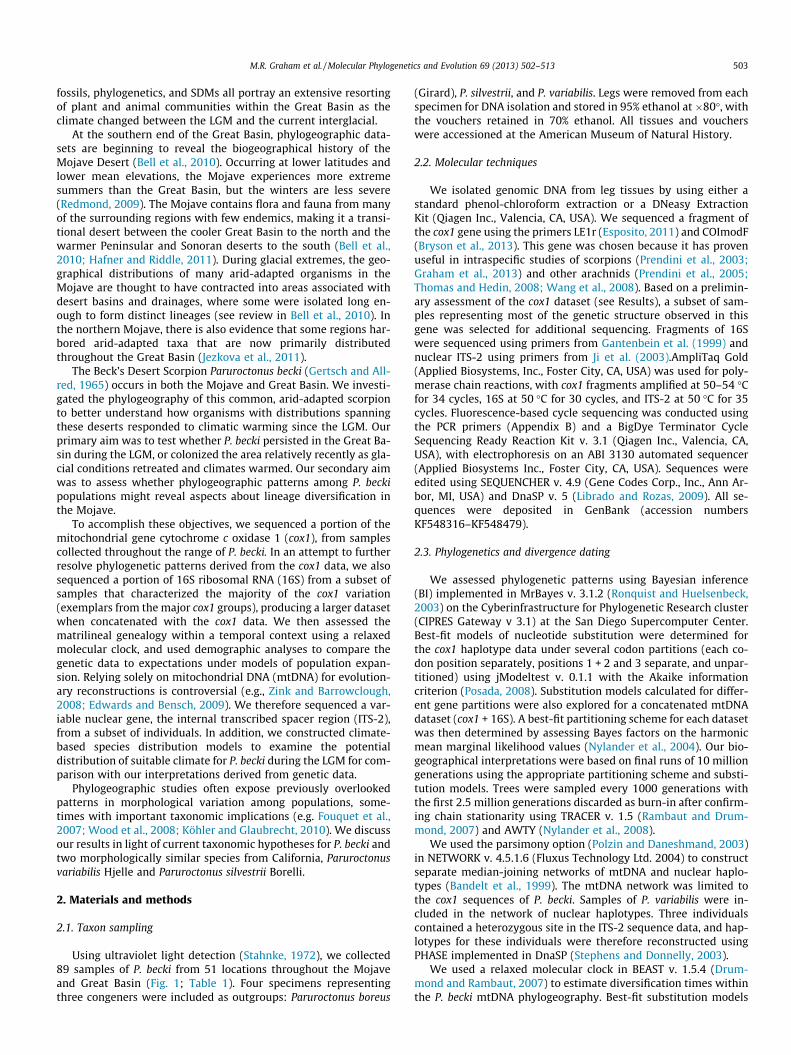
Molecular Phylogenetics and Evolution 69 (2013) 502–513
Contents lists available at ScienceDirect
Molecular Phylogenetics and Evolution
journal homepage: www.elsevier .com/locate /ympev
Phylogeography of Beck’s Desert Scorpion, Paruroctonus becki, revealsPliocene diversification in the Eastern California Shear Zone andpostglacial expansion in the Great Basin Desert
1055-7903/$ - see front matter Published by Elsevier Inc.http://dx.doi.org/10.1016/j.ympev.2013.07.028
⇑ Corresponding author. Address: Department of Biology, Eastern ConnecticutState University, 83 Windham Street, Willimantic, CT 06226, USA
E-mail address: [email protected] (M.R. Graham).
Matthew R. Graham a,⇑, Jef R. Jaeger a, Lorenzo Prendini b, Brett R. Riddle a
a School of Life Sciences, University of Nevada Las Vegas, 4505 South Maryland Parkway, Las Vegas, NV 89154-4004, USAb Division of Invertebrate Zoology, American Museum of Natural History, Central Park West at 79th Street, New York, NY 10024-5192, USA
a r t i c l e i n f o a b s t r a c t
Article history:Received 12 November 2012Revised 10 July 2013Accepted 29 July 2013Available online 9 August 2013
Keywords:BiogeographyBasin and rangeCOIEcological niche modelingMitochondrial DNAMojave Desert
The distribution of Beck’s Desert Scorpion, Paruroctonus becki (Gertsch and Allred, 1965), spans the‘warm’ Mojave Desert and the western portion of the ‘cold’ Great Basin Desert. We used genetic analysesand species distribution modeling to test whether P. becki persisted in the Great Basin Desert during theLast Glacial Maximum (LGM), or colonized the area as glacial conditions retreated and the climatewarmed. Phylogenetic and network analyses of mitochondrial cytochrome c oxidase 1 (cox1), 16S rDNA,and nuclear internal transcribed spacer (ITS-2) DNA sequences uncovered five geographically-structuredgroups in P. becki with varying degrees of statistical support. Molecular clock estimates and the geograph-ical arrangement of three of the groups suggested that Pliocene geological events in the tectonicallydynamic Eastern California Shear Zone may have driven diversification by vicariance. Diversificationwas estimated to have continued through the Pleistocene, during which a group endemic to the westernGreat Basin diverged from a related group in the eastern Mojave Desert and western Colorado Plateau.Demographic and network analyses suggested that P. becki underwent a recent expansion in the GreatBasin. According to a landscape interpolation of genetic distances, this expansion appears to haveoccurred from the northwest, implying that P. becki may have persisted in part of the Great Basin duringthe LGM. This prediction is supported by species distribution models which suggest that climate wasunsuitable throughout most of the Great Basin during the LGM, but that small patches of suitable climatemay have remained in areas of the Lahontan Trough.
Published by Elsevier Inc.
1. Introduction
The Great Basin Desert is perhaps the most biologically uniqueof the currently recognized North American deserts (Hafner andRiddle, 2011). The region is positioned between the Sierra Nevadato the west and the Rocky Mountains to the east, and occurs fur-ther north and at a higher elevation than the other North Americandeserts (Cronquist et al., 1972; Olson et al., 2001). These factors to-gether make the summer climate less severe, and the winters long-er and colder. Accordingly, the Great Basin is sometimes referred toas the only ‘cold’ or ‘temperate’ desert in North America (Grayson,1993).
During the late Pleistocene, the Great Basin climate was attimes even colder, with temperatures fluctuating between cool gla-cial periods and warm interglacials (Spaulding, 1990; Thompson,1990). Such climatic fluctuations probably made conditions evenmore extreme for desert organisms. Based on macrofossil data
from packrat middens, many Great Basin plants are thought tohave undergone severe range shifts, especially since the Last Gla-cial Maximum (LGM approximately 21 Kya), in response to Pleisto-cene climate fluctuations (Thompson, 1990; Thompson andAnderson, 2000). Although arid shrub-steppe vegetation was ableto persist in some northern areas during the most recent Pleisto-cene glacial-interglacial cycles (Madsen et al., 2001; Wilson andPitts, 2010), phylogeographic data suggest that several arid-adapted taxa may have colonized the Great Basin only recently, fol-lowing the LGM (Nowak et al., 1994; Hornsby and Matocq, 2011).Other arid-adapted species, however, appear to have remained inthe Great Basin during the Pleistocene in spite of severe habitatchanges. These species potentially endured fluctuations in climateby shifting realized niches (within more stable fundamentalniches), a phenomenon referred to as ‘niche drifting’ (Jezkovaet al., 2011). Furthermore, genetic data and species distributionmodels (SDMs) suggest that some montane species in the GreatBasin responded to Pleistocene climates by shifting ranges alongelevational gradients (Walteri and Guralnick, 2008; Galbreathet al., 2009, 2010), colonizing lower elevations during glacial peri-ods and higher elevations during interglacials. Information from
M.R. Graham et al. / Molecular Phylogenetics and Evolution 69 (2013) 502–513 503
fossils, phylogenetics, and SDMs all portray an extensive resortingof plant and animal communities within the Great Basin as theclimate changed between the LGM and the current interglacial.
At the southern end of the Great Basin, phylogeographic data-sets are beginning to reveal the biogeographical history of theMojave Desert (Bell et al., 2010). Occurring at lower latitudes andlower mean elevations, the Mojave experiences more extremesummers than the Great Basin, but the winters are less severe(Redmond, 2009). The Mojave contains flora and fauna from manyof the surrounding regions with few endemics, making it a transi-tional desert between the cooler Great Basin to the north and thewarmer Peninsular and Sonoran deserts to the south (Bell et al.,2010; Hafner and Riddle, 2011). During glacial extremes, the geo-graphical distributions of many arid-adapted organisms in theMojave are thought to have contracted into areas associated withdesert basins and drainages, where some were isolated long en-ough to form distinct lineages (see review in Bell et al., 2010). Inthe northern Mojave, there is also evidence that some regions har-bored arid-adapted taxa that are now primarily distributedthroughout the Great Basin (Jezkova et al., 2011).
The Beck’s Desert Scorpion Paruroctonus becki (Gertsch and All-red, 1965) occurs in both the Mojave and Great Basin. We investi-gated the phylogeography of this common, arid-adapted scorpionto better understand how organisms with distributions spanningthese deserts responded to climatic warming since the LGM. Ourprimary aim was to test whether P. becki persisted in the Great Ba-sin during the LGM, or colonized the area relatively recently as gla-cial conditions retreated and climates warmed. Our secondary aimwas to assess whether phylogeographic patterns among P. beckipopulations might reveal aspects about lineage diversification inthe Mojave.
To accomplish these objectives, we sequenced a portion of themitochondrial gene cytochrome c oxidase 1 (cox1), from samplescollected throughout the range of P. becki. In an attempt to furtherresolve phylogenetic patterns derived from the cox1 data, we alsosequenced a portion of 16S ribosomal RNA (16S) from a subset ofsamples that characterized the majority of the cox1 variation(exemplars from the major cox1 groups), producing a larger datasetwhen concatenated with the cox1 data. We then assessed thematrilineal genealogy within a temporal context using a relaxedmolecular clock, and used demographic analyses to compare thegenetic data to expectations under models of population expan-sion. Relying solely on mitochondrial DNA (mtDNA) for evolution-ary reconstructions is controversial (e.g., Zink and Barrowclough,2008; Edwards and Bensch, 2009). We therefore sequenced a var-iable nuclear gene, the internal transcribed spacer region (ITS-2),from a subset of individuals. In addition, we constructed climate-based species distribution models to examine the potentialdistribution of suitable climate for P. becki during the LGM for com-parison with our interpretations derived from genetic data.
Phylogeographic studies often expose previously overlookedpatterns in morphological variation among populations, some-times with important taxonomic implications (e.g. Fouquet et al.,2007; Wood et al., 2008; Köhler and Glaubrecht, 2010). We discussour results in light of current taxonomic hypotheses for P. becki andtwo morphologically similar species from California, Paruroctonusvariabilis Hjelle and Paruroctonus silvestrii Borelli.
2. Materials and methods
2.1. Taxon sampling
Using ultraviolet light detection (Stahnke, 1972), we collected89 samples of P. becki from 51 locations throughout the Mojaveand Great Basin (Fig. 1; Table 1). Four specimens representingthree congeners were included as outgroups: Paruroctonus boreus
(Girard), P. silvestrii, and P. variabilis. Legs were removed from eachspecimen for DNA isolation and stored in 95% ethanol at�80�, withthe vouchers retained in 70% ethanol. All tissues and voucherswere accessioned at the American Museum of Natural History.
2.2. Molecular techniques
We isolated genomic DNA from leg tissues by using either astandard phenol-chloroform extraction or a DNeasy ExtractionKit (Qiagen Inc., Valencia, CA, USA). We sequenced a fragment ofthe cox1 gene using the primers LE1r (Esposito, 2011) and COImodF(Bryson et al., 2013). This gene was chosen because it has provenuseful in intraspecific studies of scorpions (Prendini et al., 2003;Graham et al., 2013) and other arachnids (Prendini et al., 2005;Thomas and Hedin, 2008; Wang et al., 2008). Based on a prelimin-ary assessment of the cox1 dataset (see Results), a subset of sam-ples representing most of the genetic structure observed in thisgene was selected for additional sequencing. Fragments of 16Swere sequenced using primers from Gantenbein et al. (1999) andnuclear ITS-2 using primers from Ji et al. (2003).AmpliTaq Gold(Applied Biosystems, Inc., Foster City, CA, USA) was used for poly-merase chain reactions, with cox1 fragments amplified at 50–54 �Cfor 34 cycles, 16S at 50 �C for 30 cycles, and ITS-2 at 50 �C for 35cycles. Fluorescence-based cycle sequencing was conducted usingthe PCR primers (Appendix B) and a BigDye Terminator CycleSequencing Ready Reaction Kit v. 3.1 (Qiagen Inc., Valencia, CA,USA), with electrophoresis on an ABI 3130 automated sequencer(Applied Biosystems Inc., Foster City, CA, USA). Sequences wereedited using SEQUENCHER v. 4.9 (Gene Codes Corp., Inc., Ann Ar-bor, MI, USA) and DnaSP v. 5 (Librado and Rozas, 2009). All se-quences were deposited in GenBank (accession numbersKF548316–KF548479).
2.3. Phylogenetics and divergence dating
We assessed phylogenetic patterns using Bayesian inference(BI) implemented in MrBayes v. 3.1.2 (Ronquist and Huelsenbeck,2003) on the Cyberinfrastructure for Phylogenetic Research cluster(CIPRES Gateway v 3.1) at the San Diego Supercomputer Center.Best-fit models of nucleotide substitution were determined forthe cox1 haplotype data under several codon partitions (each co-don position separately, positions 1 + 2 and 3 separate, and unpar-titioned) using jModeltest v. 0.1.1 with the Akaike informationcriterion (Posada, 2008). Substitution models calculated for differ-ent gene partitions were also explored for a concatenated mtDNAdataset (cox1 + 16S). A best-fit partitioning scheme for each datasetwas then determined by assessing Bayes factors on the harmonicmean marginal likelihood values (Nylander et al., 2004). Our bio-geographical interpretations were based on final runs of 10 milliongenerations using the appropriate partitioning scheme and substi-tution models. Trees were sampled every 1000 generations withthe first 2.5 million generations discarded as burn-in after confirm-ing chain stationarity using TRACER v. 1.5 (Rambaut and Drum-mond, 2007) and AWTY (Nylander et al., 2008).
We used the parsimony option (Polzin and Daneshmand, 2003)in NETWORK v. 4.5.1.6 (Fluxus Technology Ltd. 2004) to constructseparate median-joining networks of mtDNA and nuclear haplo-types (Bandelt et al., 1999). The mtDNA network was limited tothe cox1 sequences of P. becki. Samples of P. variabilis were in-cluded in the network of nuclear haplotypes. Three individualscontained a heterozygous site in the ITS-2 sequence data, and hap-lotypes for these individuals were therefore reconstructed usingPHASE implemented in DnaSP (Stephens and Donnelly, 2003).
We used a relaxed molecular clock in BEAST v. 1.5.4 (Drum-mond and Rambaut, 2007) to estimate diversification times withinthe P. becki mtDNA phylogeography. Best-fit substitution models
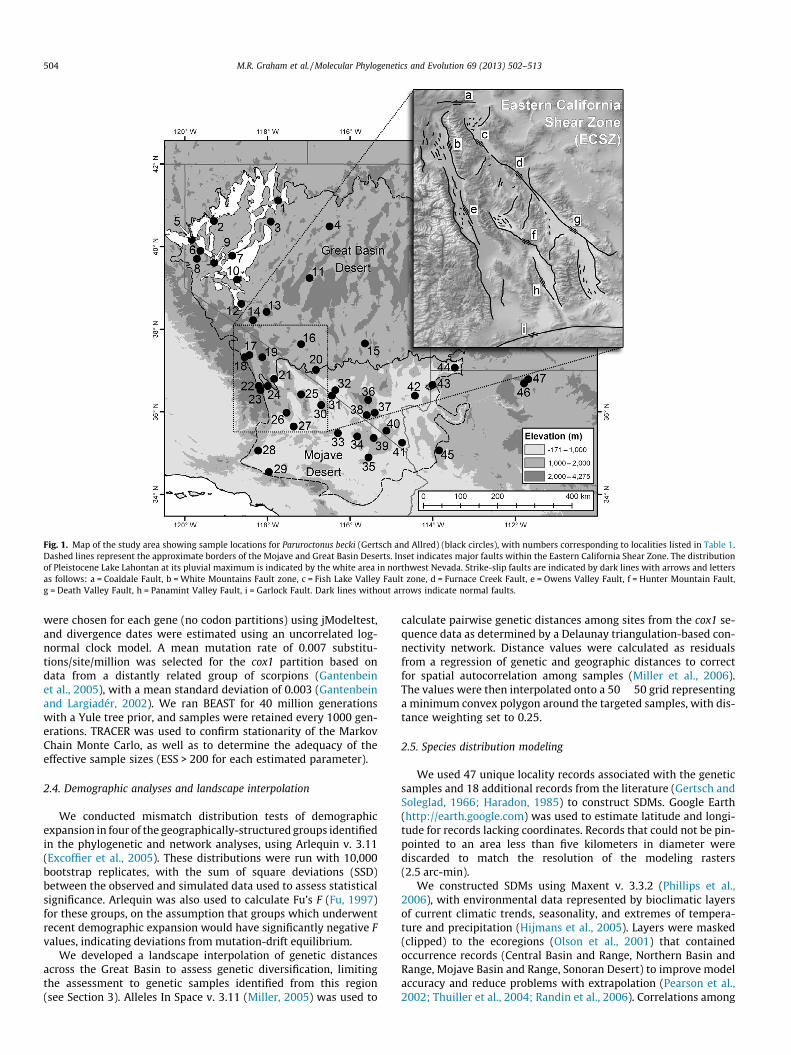
Fig. 1. Map of the study area showing sample locations for Paruroctonus becki (Gertsch and Allred) (black circles), with numbers corresponding to localities listed in Table 1.Dashed lines represent the approximate borders of the Mojave and Great Basin Deserts. Inset indicates major faults within the Eastern California Shear Zone. The distributionof Pleistocene Lake Lahontan at its pluvial maximum is indicated by the white area in northwest Nevada. Strike-slip faults are indicated by dark lines with arrows and lettersas follows: a = Coaldale Fault, b = White Mountains Fault zone, c = Fish Lake Valley Fault zone, d = Furnace Creek Fault, e = Owens Valley Fault, f = Hunter Mountain Fault,g = Death Valley Fault, h = Panamint Valley Fault, i = Garlock Fault. Dark lines without arrows indicate normal faults.
504 M.R. Graham et al. / Molecular Phylogenetics and Evolution 69 (2013) 502–513
were chosen for each gene (no codon partitions) using jModeltest,and divergence dates were estimated using an uncorrelated log-normal clock model. A mean mutation rate of 0.007 substitu-tions/site/million was selected for the cox1 partition based ondata from a distantly related group of scorpions (Gantenbeinet al., 2005), with a mean standard deviation of 0.003 (Gantenbeinand Largiadér, 2002). We ran BEAST for 40 million generationswith a Yule tree prior, and samples were retained every 1000 gen-erations. TRACER was used to confirm stationarity of the MarkovChain Monte Carlo, as well as to determine the adequacy of theeffective sample sizes (ESS > 200 for each estimated parameter).
2.4. Demographic analyses and landscape interpolation
We conducted mismatch distribution tests of demographicexpansion in four of the geographically-structured groups identifiedin the phylogenetic and network analyses, using Arlequin v. 3.11(Excoffier et al., 2005). These distributions were run with 10,000bootstrap replicates, with the sum of square deviations (SSD)between the observed and simulated data used to assess statisticalsignificance. Arlequin was also used to calculate Fu’s F (Fu, 1997)for these groups, on the assumption that groups which underwentrecent demographic expansion would have significantly negative Fvalues, indicating deviations from mutation-drift equilibrium.
We developed a landscape interpolation of genetic distancesacross the Great Basin to assess genetic diversification, limitingthe assessment to genetic samples identified from this region(see Section 3). Alleles In Space v. 3.11 (Miller, 2005) was used to
calculate pairwise genetic distances among sites from the cox1 se-quence data as determined by a Delaunay triangulation-based con-nectivity network. Distance values were calculated as residualsfrom a regression of genetic and geographic distances to correctfor spatial autocorrelation among samples (Miller et al., 2006).The values were then interpolated onto a 50 � 50 grid representinga minimum convex polygon around the targeted samples, with dis-tance weighting set to 0.25.
2.5. Species distribution modeling
We used 47 unique locality records associated with the geneticsamples and 18 additional records from the literature (Gertsch andSoleglad, 1966; Haradon, 1985) to construct SDMs. Google Earth(http://earth.google.com) was used to estimate latitude and longi-tude for records lacking coordinates. Records that could not be pin-pointed to an area less than five kilometers in diameter werediscarded to match the resolution of the modeling rasters(2.5 arc-min).
We constructed SDMs using Maxent v. 3.3.2 (Phillips et al.,2006), with environmental data represented by bioclimatic layersof current climatic trends, seasonality, and extremes of tempera-ture and precipitation (Hijmans et al., 2005). Layers were masked(clipped) to the ecoregions (Olson et al., 2001) that containedoccurrence records (Central Basin and Range, Northern Basin andRange, Mojave Basin and Range, Sonoran Desert) to improve modelaccuracy and reduce problems with extrapolation (Pearson et al.,2002; Thuiller et al., 2004; Randin et al., 2006). Correlations among
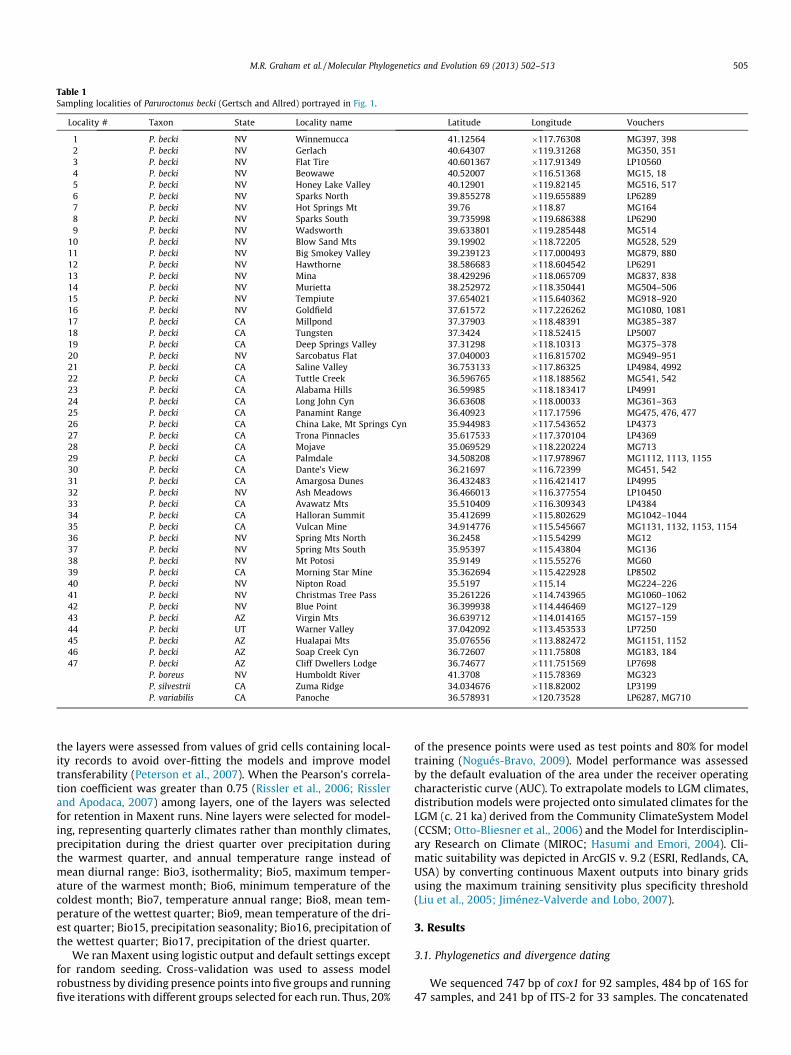
Table 1Sampling localities of Paruroctonus becki (Gertsch and Allred) portrayed in Fig. 1.
Locality # Taxon State Locality name Latitude Longitude Vouchers
1 P. becki NV Winnemucca 41.12564 �117.76308 MG397, 3982 P. becki NV Gerlach 40.64307 �119.31268 MG350, 3513 P. becki NV Flat Tire 40.601367 �117.91349 LP105604 P. becki NV Beowawe 40.52007 �116.51368 MG15, 185 P. becki NV Honey Lake Valley 40.12901 �119.82145 MG516, 5176 P. becki NV Sparks North 39.855278 �119.655889 LP62897 P. becki NV Hot Springs Mt 39.76 �118.87 MG1648 P. becki NV Sparks South 39.735998 �119.686388 LP62909 P. becki NV Wadsworth 39.633801 �119.285448 MG514
10 P. becki NV Blow Sand Mts 39.19902 �118.72205 MG528, 52911 P. becki NV Big Smokey Valley 39.239123 �117.000493 MG879, 88012 P. becki NV Hawthorne 38.586683 �118.604542 LP629113 P. becki NV Mina 38.429296 �118.065709 MG837, 83814 P. becki NV Murietta 38.252972 �118.350441 MG504–50615 P. becki NV Tempiute 37.654021 �115.640362 MG918–92016 P. becki NV Goldfield 37.61572 �117.226262 MG1080, 108117 P. becki CA Millpond 37.37903 �118.48391 MG385–38718 P. becki CA Tungsten 37.3424 �118.52415 LP500719 P. becki CA Deep Springs Valley 37.31298 �118.10313 MG375–37820 P. becki NV Sarcobatus Flat 37.040003 �116.815702 MG949–95121 P. becki CA Saline Valley 36.753133 �117.86325 LP4984, 499222 P. becki CA Tuttle Creek 36.596765 �118.188562 MG541, 54223 P. becki CA Alabama Hills 36.59985 �118.183417 LP499124 P. becki CA Long John Cyn 36.63608 �118.00033 MG361–36325 P. becki CA Panamint Range 36.40923 �117.17596 MG475, 476, 47726 P. becki CA China Lake, Mt Springs Cyn 35.944983 �117.543652 LP437327 P. becki CA Trona Pinnacles 35.617533 �117.370104 LP436928 P. becki CA Mojave 35.069529 �118.220224 MG71329 P. becki CA Palmdale 34.508208 �117.978967 MG1112, 1113, 115530 P. becki CA Dante’s View 36.21697 �116.72399 MG451, 54231 P. becki CA Amargosa Dunes 36.432483 �116.421417 LP499532 P. becki NV Ash Meadows 36.466013 �116.377554 LP1045033 P. becki CA Avawatz Mts 35.510409 �116.309343 LP438434 P. becki CA Halloran Summit 35.412699 �115.802629 MG1042–104435 P. becki CA Vulcan Mine 34.914776 �115.545667 MG1131, 1132, 1153, 115436 P. becki NV Spring Mts North 36.2458 �115.54299 MG1237 P. becki NV Spring Mts South 35.95397 �115.43804 MG13638 P. becki NV Mt Potosi 35.9149 �115.55276 MG6039 P. becki CA Morning Star Mine 35.362694 �115.422928 LP850240 P. becki NV Nipton Road 35.5197 �115.14 MG224–22641 P. becki NV Christmas Tree Pass 35.261226 �114.743965 MG1060–106242 P. becki NV Blue Point 36.399938 �114.446469 MG127–12943 P. becki AZ Virgin Mts 36.639712 �114.014165 MG157–15944 P. becki UT Warner Valley 37.042092 �113.453533 LP725045 P. becki AZ Hualapai Mts 35.076556 �113.882472 MG1151, 115246 P. becki AZ Soap Creek Cyn 36.72607 �111.75808 MG183, 18447 P. becki AZ Cliff Dwellers Lodge 36.74677 �111.751569 LP7698
P. boreus NV Humboldt River 41.3708 �115.78369 MG323P. silvestrii CA Zuma Ridge 34.034676 �118.82002 LP3199P. variabilis CA Panoche 36.578931 �120.73528 LP6287, MG710
M.R. Graham et al. / Molecular Phylogenetics and Evolution 69 (2013) 502–513 505
the layers were assessed from values of grid cells containing local-ity records to avoid over-fitting the models and improve modeltransferability (Peterson et al., 2007). When the Pearson’s correla-tion coefficient was greater than 0.75 (Rissler et al., 2006; Risslerand Apodaca, 2007) among layers, one of the layers was selectedfor retention in Maxent runs. Nine layers were selected for model-ing, representing quarterly climates rather than monthly climates,precipitation during the driest quarter over precipitation duringthe warmest quarter, and annual temperature range instead ofmean diurnal range: Bio3, isothermality; Bio5, maximum temper-ature of the warmest month; Bio6, minimum temperature of thecoldest month; Bio7, temperature annual range; Bio8, mean tem-perature of the wettest quarter; Bio9, mean temperature of the dri-est quarter; Bio15, precipitation seasonality; Bio16, precipitation ofthe wettest quarter; Bio17, precipitation of the driest quarter.
We ran Maxent using logistic output and default settings exceptfor random seeding. Cross-validation was used to assess modelrobustness by dividing presence points into five groups and runningfive iterations with different groups selected for each run. Thus, 20%
of the presence points were used as test points and 80% for modeltraining (Nogués-Bravo, 2009). Model performance was assessedby the default evaluation of the area under the receiver operatingcharacteristic curve (AUC). To extrapolate models to LGM climates,distribution models were projected onto simulated climates for theLGM (c. 21 ka) derived from the Community ClimateSystem Model(CCSM; Otto-Bliesner et al., 2006) and the Model for Interdisciplin-ary Research on Climate (MIROC; Hasumi and Emori, 2004). Cli-matic suitability was depicted in ArcGIS v. 9.2 (ESRI, Redlands, CA,USA) by converting continuous Maxent outputs into binary gridsusing the maximum training sensitivity plus specificity threshold(Liu et al., 2005; Jiménez-Valverde and Lobo, 2007).
3. Results
3.1. Phylogenetics and divergence dating
We sequenced 747 bp of cox1 for 92 samples, 484 bp of 16S for47 samples, and 241 bp of ITS-2 for 33 samples. The concatenated
506 M.R. Graham et al. / Molecular Phylogenetics and Evolution 69 (2013) 502–513
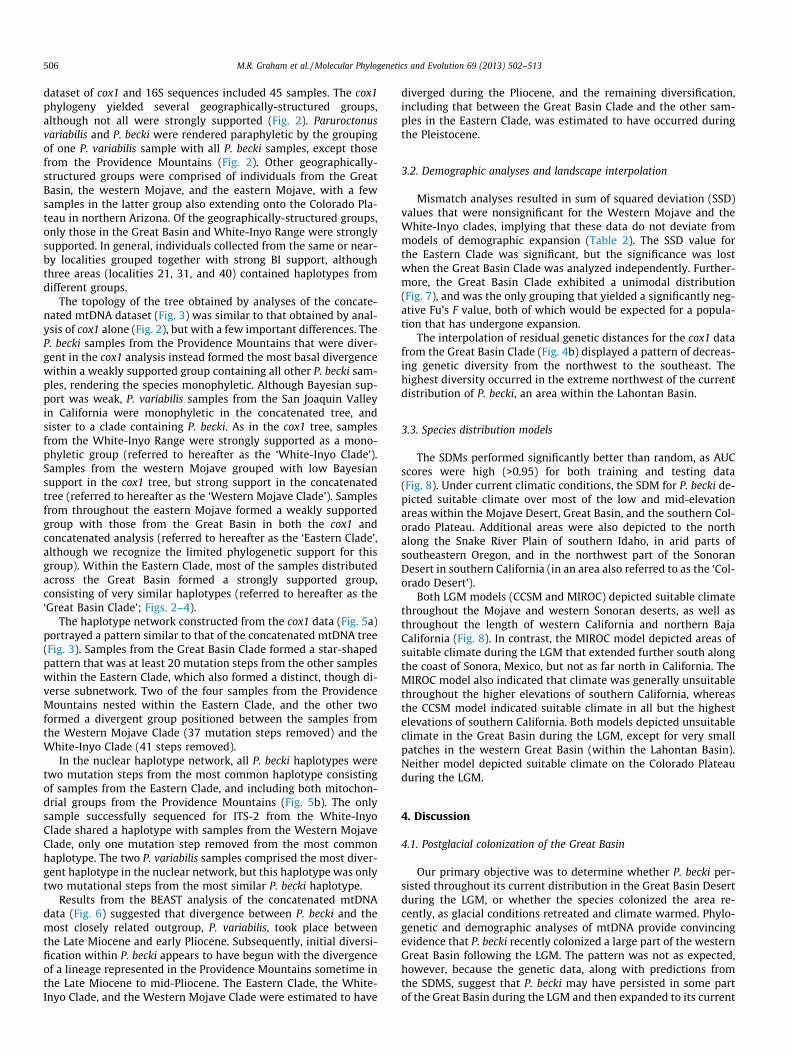
dataset of cox1 and 16S sequences included 45 samples. The cox1phylogeny yielded several geographically-structured groups,although not all were strongly supported (Fig. 2). Paruroctonusvariabilis and P. becki were rendered paraphyletic by the groupingof one P. variabilis sample with all P. becki samples, except thosefrom the Providence Mountains (Fig. 2). Other geographically-structured groups were comprised of individuals from the GreatBasin, the western Mojave, and the eastern Mojave, with a fewsamples in the latter group also extending onto the Colorado Pla-teau in northern Arizona. Of the geographically-structured groups,only those in the Great Basin and White-Inyo Range were stronglysupported. In general, individuals collected from the same or near-by localities grouped together with strong BI support, althoughthree areas (localities 21, 31, and 40) contained haplotypes fromdifferent groups.
The topology of the tree obtained by analyses of the concate-nated mtDNA dataset (Fig. 3) was similar to that obtained by anal-ysis of cox1 alone (Fig. 2), but with a few important differences. TheP. becki samples from the Providence Mountains that were diver-gent in the cox1 analysis instead formed the most basal divergencewithin a weakly supported group containing all other P. becki sam-ples, rendering the species monophyletic. Although Bayesian sup-port was weak, P. variabilis samples from the San Joaquin Valleyin California were monophyletic in the concatenated tree, andsister to a clade containing P. becki. As in the cox1 tree, samplesfrom the White-Inyo Range were strongly supported as a mono-phyletic group (referred to hereafter as the ‘White-Inyo Clade’).Samples from the western Mojave grouped with low Bayesiansupport in the cox1 tree, but strong support in the concatenatedtree (referred to hereafter as the ‘Western Mojave Clade’). Samplesfrom throughout the eastern Mojave formed a weakly supportedgroup with those from the Great Basin in both the cox1 andconcatenated analysis (referred to hereafter as the ‘Eastern Clade’,although we recognize the limited phylogenetic support for thisgroup). Within the Eastern Clade, most of the samples distributedacross the Great Basin formed a strongly supported group,consisting of very similar haplotypes (referred to hereafter as the‘Great Basin Clade’; Figs. 2–4).
The haplotype network constructed from the cox1 data (Fig. 5a)portrayed a pattern similar to that of the concatenated mtDNA tree(Fig. 3). Samples from the Great Basin Clade formed a star-shapedpattern that was at least 20 mutation steps from the other sampleswithin the Eastern Clade, which also formed a distinct, though di-verse subnetwork. Two of the four samples from the ProvidenceMountains nested within the Eastern Clade, and the other twoformed a divergent group positioned between the samples fromthe Western Mojave Clade (37 mutation steps removed) and theWhite-Inyo Clade (41 steps removed).
In the nuclear haplotype network, all P. becki haplotypes weretwo mutation steps from the most common haplotype consistingof samples from the Eastern Clade, and including both mitochon-drial groups from the Providence Mountains (Fig. 5b). The onlysample successfully sequenced for ITS-2 from the White-InyoClade shared a haplotype with samples from the Western MojaveClade, only one mutation step removed from the most commonhaplotype. The two P. variabilis samples comprised the most diver-gent haplotype in the nuclear network, but this haplotype was onlytwo mutational steps from the most similar P. becki haplotype.
Results from the BEAST analysis of the concatenated mtDNAdata (Fig. 6) suggested that divergence between P. becki and themost closely related outgroup, P. variabilis, took place betweenthe Late Miocene and early Pliocene. Subsequently, initial diversi-fication within P. becki appears to have begun with the divergenceof a lineage represented in the Providence Mountains sometime inthe Late Miocene to mid-Pliocene. The Eastern Clade, the White-Inyo Clade, and the Western Mojave Clade were estimated to have
diverged during the Pliocene, and the remaining diversification,including that between the Great Basin Clade and the other sam-ples in the Eastern Clade, was estimated to have occurred duringthe Pleistocene.
3.2. Demographic analyses and landscape interpolation
Mismatch analyses resulted in sum of squared deviation (SSD)values that were nonsignificant for the Western Mojave and theWhite-Inyo clades, implying that these data do not deviate frommodels of demographic expansion (Table 2). The SSD value forthe Eastern Clade was significant, but the significance was lostwhen the Great Basin Clade was analyzed independently. Further-more, the Great Basin Clade exhibited a unimodal distribution(Fig. 7), and was the only grouping that yielded a significantly neg-ative Fu’s F value, both of which would be expected for a popula-tion that has undergone expansion.
The interpolation of residual genetic distances for the cox1 datafrom the Great Basin Clade (Fig. 4b) displayed a pattern of decreas-ing genetic diversity from the northwest to the southeast. Thehighest diversity occurred in the extreme northwest of the currentdistribution of P. becki, an area within the Lahontan Basin.
3.3. Species distribution models
The SDMs performed significantly better than random, as AUCscores were high (>0.95) for both training and testing data(Fig. 8). Under current climatic conditions, the SDM for P. becki de-picted suitable climate over most of the low and mid-elevationareas within the Mojave Desert, Great Basin, and the southern Col-orado Plateau. Additional areas were also depicted to the northalong the Snake River Plain of southern Idaho, in arid parts ofsoutheastern Oregon, and in the northwest part of the SonoranDesert in southern California (in an area also referred to as the ‘Col-orado Desert’).
Both LGM models (CCSM and MIROC) depicted suitable climatethroughout the Mojave and western Sonoran deserts, as well asthroughout the length of western California and northern BajaCalifornia (Fig. 8). In contrast, the MIROC model depicted areas ofsuitable climate during the LGM that extended further south alongthe coast of Sonora, Mexico, but not as far north in California. TheMIROC model also indicated that climate was generally unsuitablethroughout the higher elevations of southern California, whereasthe CCSM model indicated suitable climate in all but the highestelevations of southern California. Both models depicted unsuitableclimate in the Great Basin during the LGM, except for very smallpatches in the western Great Basin (within the Lahontan Basin).Neither model depicted suitable climate on the Colorado Plateauduring the LGM.
4. Discussion
4.1. Postglacial colonization of the Great Basin
Our primary objective was to determine whether P. becki per-sisted throughout its current distribution in the Great Basin Desertduring the LGM, or whether the species colonized the area re-cently, as glacial conditions retreated and climate warmed. Phylo-genetic and demographic analyses of mtDNA provide convincingevidence that P. becki recently colonized a large part of the westernGreat Basin following the LGM. The pattern was not as expected,however, because the genetic data, along with predictions fromthe SDMS, suggest that P. becki may have persisted in some partof the Great Basin during the LGM and then expanded to its current
Fig. 2. Majority rule (50%) consensus tree depicting results of Bayesian phylogenetic analysis of cox1 mtDNA sequences for Paruroctonus becki (Gertsch and Allred). Verticallyarranged bars indicate geographically-structured groups of haplotypes. Arrows point to two Paruroctonus variabilis Hjelle samples. Stars indicate individuals from theProvidence Mountains. Nodes with Bayesian posterior probability values indicating strong support (PP > 0.9) are represented by black circles. Support values are indicatedabove nodes.
M.R. Graham et al. / Molecular Phylogenetics and Evolution 69 (2013) 502–513 507
widespread distribution in the western Great Basin when the cli-mate warmed.
The SDMs projected onto LGM conditions depicted suitable cli-mate across much of the Mojave and, importantly, in small low-elevation sub-basins in the western Great Basin (Fig. 8). According
to the CCSM model, the predicted area encompasses Walker Lake(Fig. 8b), whereas the MIROC model predicted sub-basins furthernorth that include Pyramid Lake and the Smoke Creek Desert(Fig. 8c). These sub-basins occur within the Lahontan Trough,which filled with water and coalesced to form Lake Lahontan
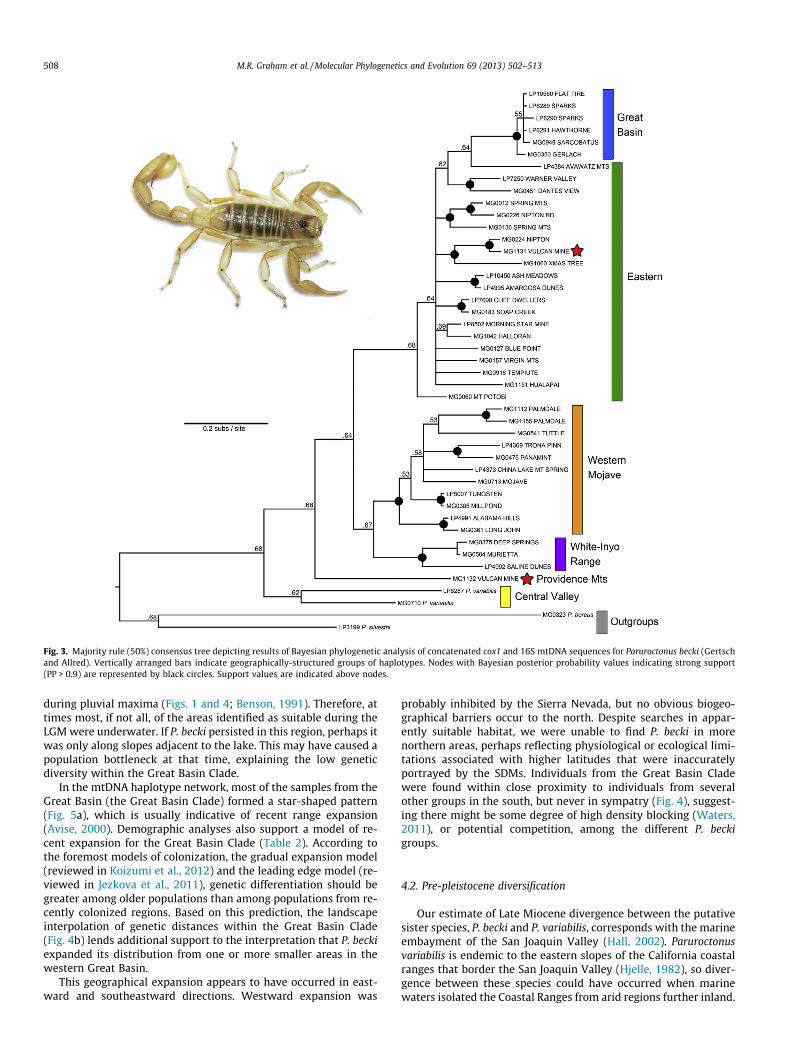
Fig. 3. Majority rule (50%) consensus tree depicting results of Bayesian phylogenetic analysis of concatenated cox1 and 16S mtDNA sequences for Paruroctonus becki (Gertschand Allred). Vertically arranged bars indicate geographically-structured groups of haplotypes. Nodes with Bayesian posterior probability values indicating strong support(PP > 0.9) are represented by black circles. Support values are indicated above nodes.
508 M.R. Graham et al. / Molecular Phylogenetics and Evolution 69 (2013) 502–513
during pluvial maxima (Figs. 1 and 4; Benson, 1991). Therefore, attimes most, if not all, of the areas identified as suitable during theLGM were underwater. If P. becki persisted in this region, perhaps itwas only along slopes adjacent to the lake. This may have caused apopulation bottleneck at that time, explaining the low geneticdiversity within the Great Basin Clade.
In the mtDNA haplotype network, most of the samples from theGreat Basin (the Great Basin Clade) formed a star-shaped pattern(Fig. 5a), which is usually indicative of recent range expansion(Avise, 2000). Demographic analyses also support a model of re-cent expansion for the Great Basin Clade (Table 2). According tothe foremost models of colonization, the gradual expansion model(reviewed in Koizumi et al., 2012) and the leading edge model (re-viewed in Jezkova et al., 2011), genetic differentiation should begreater among older populations than among populations from re-cently colonized regions. Based on this prediction, the landscapeinterpolation of genetic distances within the Great Basin Clade(Fig. 4b) lends additional support to the interpretation that P. beckiexpanded its distribution from one or more smaller areas in thewestern Great Basin.
This geographical expansion appears to have occurred in east-ward and southeastward directions. Westward expansion was
probably inhibited by the Sierra Nevada, but no obvious biogeo-graphical barriers occur to the north. Despite searches in appar-ently suitable habitat, we were unable to find P. becki in morenorthern areas, perhaps reflecting physiological or ecological limi-tations associated with higher latitudes that were inaccuratelyportrayed by the SDMs. Individuals from the Great Basin Cladewere found within close proximity to individuals from severalother groups in the south, but never in sympatry (Fig. 4), suggest-ing there might be some degree of high density blocking (Waters,2011), or potential competition, among the different P. beckigroups.
4.2. Pre-pleistocene diversification
Our estimate of Late Miocene divergence between the putativesister species, P. becki and P. variabilis, corresponds with the marineembayment of the San Joaquin Valley (Hall, 2002). Paruroctonusvariabilis is endemic to the eastern slopes of the California coastalranges that border the San Joaquin Valley (Hjelle, 1982), so diver-gence between these species could have occurred when marinewaters isolated the Coastal Ranges from arid regions further inland.
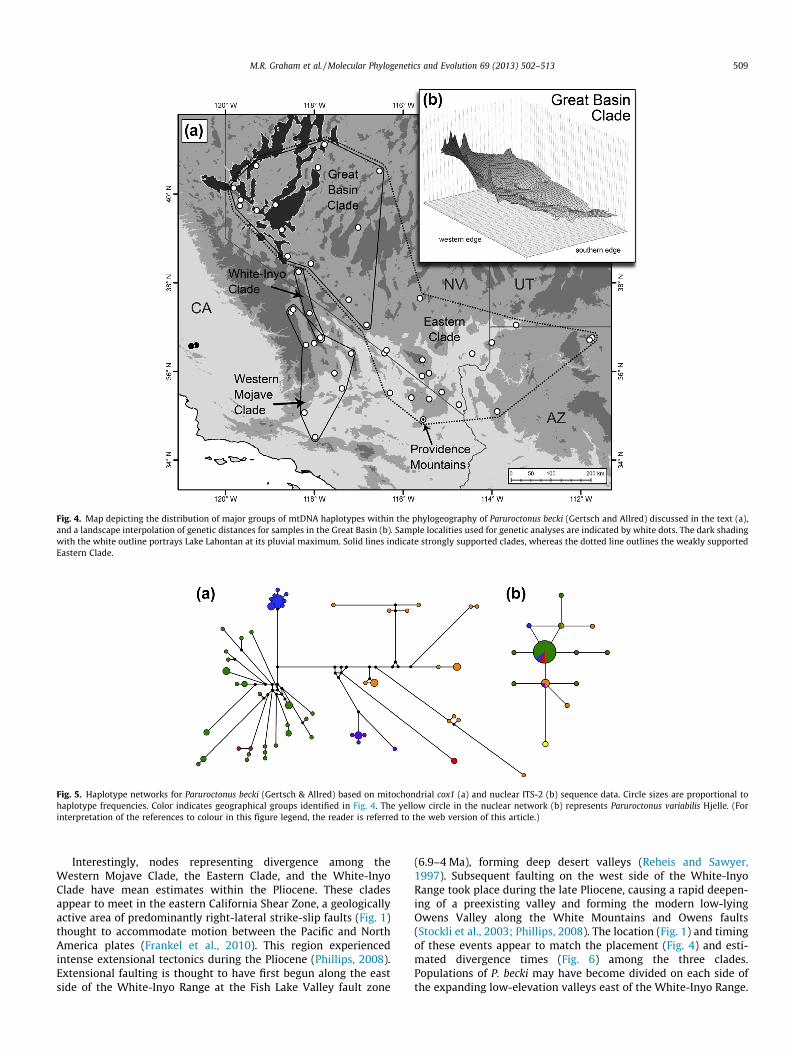
Fig. 4. Map depicting the distribution of major groups of mtDNA haplotypes within the phylogeography of Paruroctonus becki (Gertsch and Allred) discussed in the text (a),and a landscape interpolation of genetic distances for samples in the Great Basin (b). Sample localities used for genetic analyses are indicated by white dots. The dark shadingwith the white outline portrays Lake Lahontan at its pluvial maximum. Solid lines indicate strongly supported clades, whereas the dotted line outlines the weakly supportedEastern Clade.
Fig. 5. Haplotype networks for Paruroctonus becki (Gertsch & Allred) based on mitochondrial cox1 (a) and nuclear ITS-2 (b) sequence data. Circle sizes are proportional tohaplotype frequencies. Color indicates geographical groups identified in Fig. 4. The yellow circle in the nuclear network (b) represents Paruroctonus variabilis Hjelle. (Forinterpretation of the references to colour in this figure legend, the reader is referred to the web version of this article.)
M.R. Graham et al. / Molecular Phylogenetics and Evolution 69 (2013) 502–513 509
Interestingly, nodes representing divergence among theWestern Mojave Clade, the Eastern Clade, and the White-InyoClade have mean estimates within the Pliocene. These cladesappear to meet in the eastern California Shear Zone, a geologicallyactive area of predominantly right-lateral strike-slip faults (Fig. 1)thought to accommodate motion between the Pacific and NorthAmerica plates (Frankel et al., 2010). This region experiencedintense extensional tectonics during the Pliocene (Phillips, 2008).Extensional faulting is thought to have first begun along the eastside of the White-Inyo Range at the Fish Lake Valley fault zone
(6.9–4 Ma), forming deep desert valleys (Reheis and Sawyer,1997). Subsequent faulting on the west side of the White-InyoRange took place during the late Pliocene, causing a rapid deepen-ing of a preexisting valley and forming the modern low-lyingOwens Valley along the White Mountains and Owens faults(Stockli et al., 2003; Phillips, 2008). The location (Fig. 1) and timingof these events appear to match the placement (Fig. 4) and esti-mated divergence times (Fig. 6) among the three clades.Populations of P. becki may have become divided on each side ofthe expanding low-elevation valleys east of the White-Inyo Range.
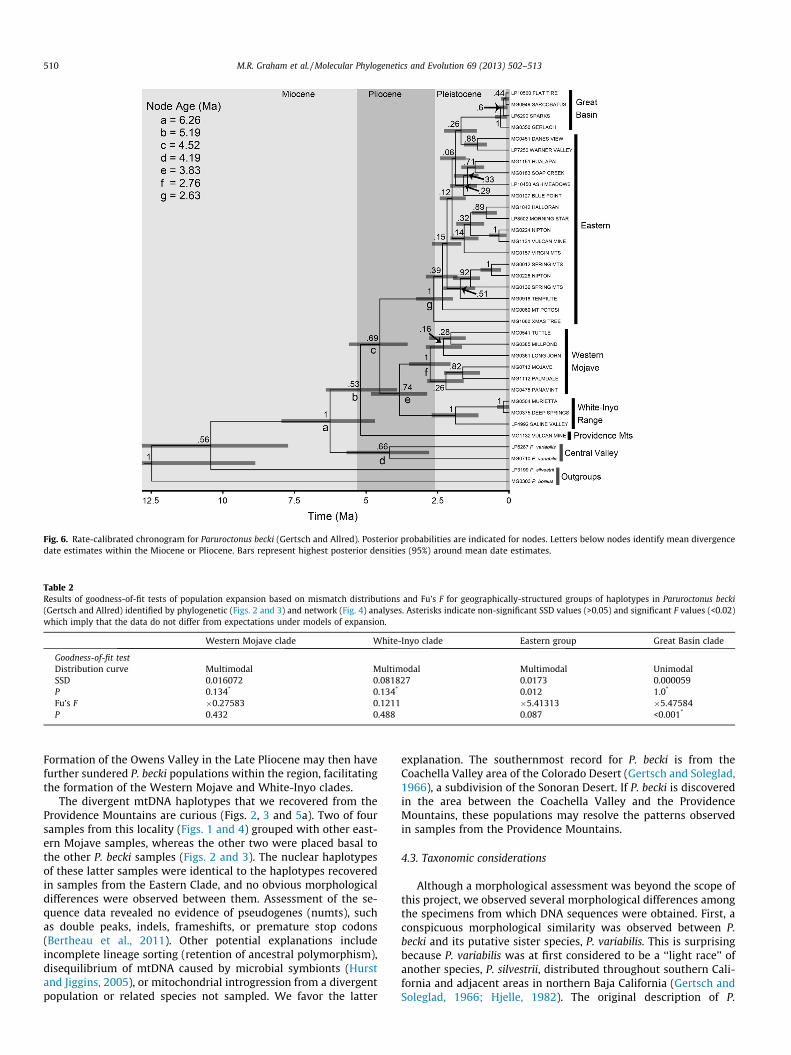
Fig. 6. Rate-calibrated chronogram for Paruroctonus becki (Gertsch and Allred). Posterior probabilities are indicated for nodes. Letters below nodes identify mean divergencedate estimates within the Miocene or Pliocene. Bars represent highest posterior densities (95%) around mean date estimates.
Table 2Results of goodness-of-fit tests of population expansion based on mismatch distributions and Fu’s F for geographically-structured groups of haplotypes in Paruroctonus becki(Gertsch and Allred) identified by phylogenetic (Figs. 2 and 3) and network (Fig. 4) analyses. Asterisks indicate non-significant SSD values (>0.05) and significant F values (<0.02)which imply that the data do not differ from expectations under models of expansion.
Western Mojave clade White-Inyo clade Eastern group Great Basin clade
Goodness-of-fit testDistribution curve Multimodal Multimodal Multimodal UnimodalSSD 0.016072 0.081827 0.0173 0.000059P 0.134* 0.134* 0.012 1.0*
Fu’s F �0.27583 0.1211 �5.41313 �5.47584P 0.432 0.488 0.087 <0.001*
510 M.R. Graham et al. / Molecular Phylogenetics and Evolution 69 (2013) 502–513
Formation of the Owens Valley in the Late Pliocene may then havefurther sundered P. becki populations within the region, facilitatingthe formation of the Western Mojave and White-Inyo clades.
The divergent mtDNA haplotypes that we recovered from theProvidence Mountains are curious (Figs. 2, 3 and 5a). Two of foursamples from this locality (Figs. 1 and 4) grouped with other east-ern Mojave samples, whereas the other two were placed basal tothe other P. becki samples (Figs. 2 and 3). The nuclear haplotypesof these latter samples were identical to the haplotypes recoveredin samples from the Eastern Clade, and no obvious morphologicaldifferences were observed between them. Assessment of the se-quence data revealed no evidence of pseudogenes (numts), suchas double peaks, indels, frameshifts, or premature stop codons(Bertheau et al., 2011). Other potential explanations includeincomplete lineage sorting (retention of ancestral polymorphism),disequilibrium of mtDNA caused by microbial symbionts (Hurstand Jiggins, 2005), or mitochondrial introgression from a divergentpopulation or related species not sampled. We favor the latter
explanation. The southernmost record for P. becki is from theCoachella Valley area of the Colorado Desert (Gertsch and Soleglad,1966), a subdivision of the Sonoran Desert. If P. becki is discoveredin the area between the Coachella Valley and the ProvidenceMountains, these populations may resolve the patterns observedin samples from the Providence Mountains.
4.3. Taxonomic considerations
Although a morphological assessment was beyond the scope ofthis project, we observed several morphological differences amongthe specimens from which DNA sequences were obtained. First, aconspicuous morphological similarity was observed between P.becki and its putative sister species, P. variabilis. This is surprisingbecause P. variabilis was at first considered to be a ‘‘light race’’ ofanother species, P. silvestrii, distributed throughout southern Cali-fornia and adjacent areas in northern Baja California (Gertsch andSoleglad, 1966; Hjelle, 1982). The original description of P.
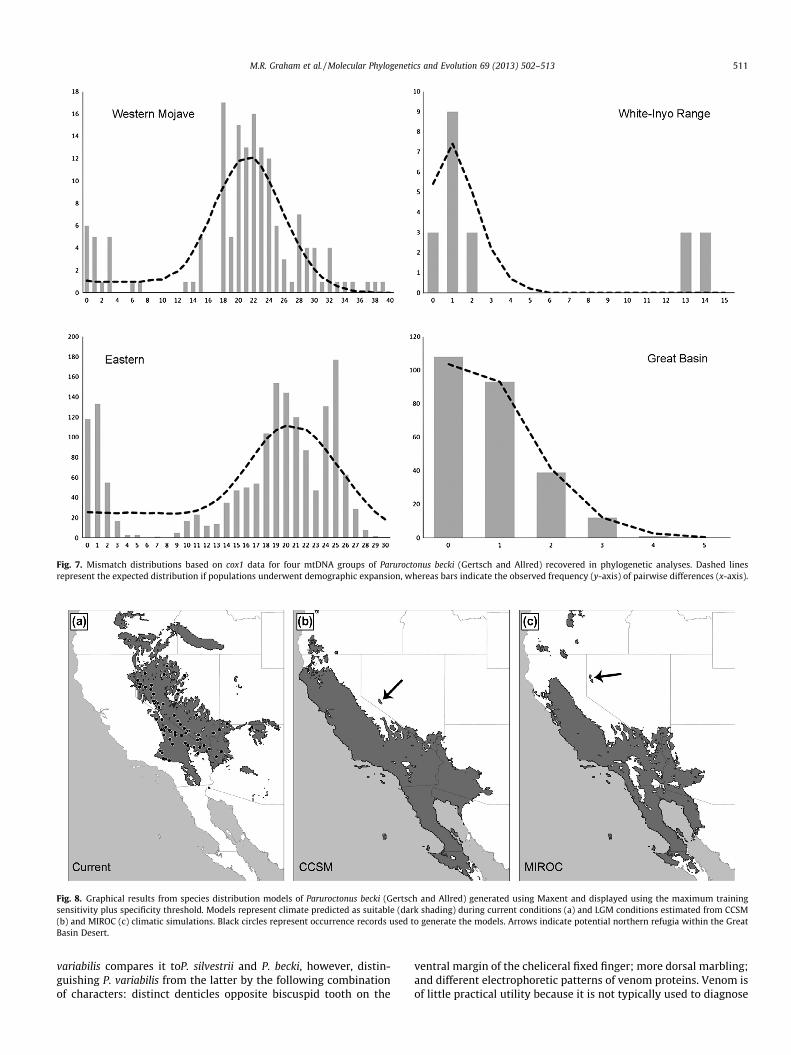
Fig. 7. Mismatch distributions based on cox1 data for four mtDNA groups of Paruroctonus becki (Gertsch and Allred) recovered in phylogenetic analyses. Dashed linesrepresent the expected distribution if populations underwent demographic expansion, whereas bars indicate the observed frequency (y-axis) of pairwise differences (x-axis).
Fig. 8. Graphical results from species distribution models of Paruroctonus becki (Gertsch and Allred) generated using Maxent and displayed using the maximum trainingsensitivity plus specificity threshold. Models represent climate predicted as suitable (dark shading) during current conditions (a) and LGM conditions estimated from CCSM(b) and MIROC (c) climatic simulations. Black circles represent occurrence records used to generate the models. Arrows indicate potential northern refugia within the GreatBasin Desert.
M.R. Graham et al. / Molecular Phylogenetics and Evolution 69 (2013) 502–513 511
variabilis compares it toP. silvestrii and P. becki, however, distin-guishing P. variabilis from the latter by the following combinationof characters: distinct denticles opposite biscuspid tooth on the
ventral margin of the cheliceral fixed finger; more dorsal marbling;and different electrophoretic patterns of venom proteins. Venom isof little practical utility because it is not typically used to diagnose
512 M.R. Graham et al. / Molecular Phylogenetics and Evolution 69 (2013) 502–513
scorpion species, and the degree to which venom proteomes varywithin scorpion species has yet to be satisfactorily assessed. Dorsalmarbling was also found to be an unreliable diagnostic character.Although most P. becki are superficially similar in color and degreeof marbling of the dorsum, some populations (e.g. Locality 32: AshMeadows) contained phenotypes with darker marbling than thatof P. variabilis. We examined several P. becki specimens, represent-ing each major group, but none possessed cheliceral denticles. Con-sequently, the presence of cheliceral denticles appears to bediagnostic for P. variabilis. Based on this morphological differenceand the differences in mitochondrial and nuclear DNA sequencedata presented herein, we could not refute the current taxonomicstatus of these two species. Nevertheless, both species would ben-efit from more rigorous morphological evaluation andredescription.
4.4. Concluding remarks
Floristic responses to late Pleistocene climate fluctuations arerelatively well characterized for the Great Basin due to the wealthof data that have been extracted from packrat middens throughoutsouthwestern North America (Betancourt et al., 1990). The geo-graphical ranges of Great Basin plant species are thought to haveresponded in two ways: taxa were either ‘orthoselective’ and rela-tively insensitive to climate change, experiencing little change totheir geographical ranges (e.g., shifted along elevational gradientsbut did not undergo large geographic changes); or taxa shifted tonew areas, following a ‘migration’ model (Nowak et al., 1994).Using this logic, a model of late Pleistocene distributional responsemay be developed for the Great Basin terrestrial fauna.
Rodent species that occupy basins within the region appear tofall into both categories. Recent phylogeographic assessments ofthe chisel-toothed kangaroo rat, Dipodomys microps Merriam (Jezk-ova et al., 2011), and the pallid kangaroo mouse, Microdipodops pal-lidus Merriam (Hafner et al., 2008), suggest that both speciesremained in the Great Basin during the LGM (rendering themorthoselective). Phylogeography of the bushy-tailed woodrat, Neo-toma cinerea (Ord), suggests that it followed the migration model,as the LGM distribution of this species appears to have shifted tothe south (Hornsby and Matocq, 2011). Other recent studies ofarid-adapted reptile species, the desert horned lizard, Phrynosomaplatyrhinos Girard (Jezkova, 2010) and the western North Americannightsnake, Hypsiglena torquata (Günther) (Mulcahy, 2008), sug-gest that both species probably followed the migration model. Datafrom P. becki also fit a migration model, but with the caveat thatthis scorpion may have persisted within small parts of the westernGreat Basin, and recently expanded to occupy a larger part of theregion.
The phylogeography of P. becki also uncovered an unexpecteddegree of phylogeographic structure across the Mojave Desert. Gi-ven that mitochondrial groupings were not strongly supported bynuclear data, and the fact that no obvious morphological diver-gences were discerned from samples collected throughout the spe-cies’ range, we conclude that P. becki probably represents a singlespecies. Such patterns underscore the need for integrative ap-proaches to delimit species and assess relationships among little-known terrestrial invertebrates like scorpions.
Acknowledgments
We thank George Graham, Penny Graham, Jessica Graham,Tereza Jezkova, Michael Webber, Rebeca Rivera, Joshua Ingoldt,Joshua Greenwood, Ashley Fisher, Mallory Eckstut, Robert Bryson,Jr., Kanvaly Bamba, Brent Hendrixson, Jeremy Huff, MichelleMcCoy, Randy Mercurio, Abe Miller, Gordon Pratt, Warren Savary,Darrell Ubick, and Zach Valois for assisting with fieldwork or
donating samples; Paula Cushing (Denver Museum of Nature andScience) for the loan of one sample; Michael Wall (SDNHM) andGreg Cox (Death Valley National Park) for assistance with voucherspecimens; Lauren Esposito for developing primers; and OfeliaDelgado and Monica Mosier for generating sequence data contrib-uted by the AMNH. Fieldwork in Death Valley National Park wasconducted under permits issued to MRG and Warren Savary, andin Mojave National Preserve under permits issued to MRG. Collec-tions within Death Valley National Park were conducted under aseparate task agreement with UNLV (JRJ and MRG), and we thankthe National Park Service for their support. This project wassupported in part by National Science Foundation Grants DBI0421519 to UNLV, and DEB 0413453 and DEB 0228699 to LP. Fur-ther support was provided by a grant from the Richard LounsberyFoundation to LP.
References
Avise, J., 2000. Phylogeography: The History and Formation of Species. HarvardUniversity Press, Cambridge, MA.
Bandelt, H.J., Forster, P., Rohl, A., 1999. Median-joining networks for inferringintraspecific phylogenies. Mol. Biol. Evol. 16, 37–48.
Betancourt, J.L., Van Devender, T.R., Martin, P.S. (Eds.), 1990. Packrat Middens: theLast 40,000 Years of Biotic Change. University of Arizona Press, Tucson, AZ.
Bell, K.C., Hafner, D.J., Leitner, P., Matocq, M.D., 2010. Phylogeography of the groundsquirrel subgenus Xerospermophilus and assembly of the Mojave Desert biota. J.Biogeogr. 37, 363–378.
Benson, L.V., 1991. Timing of the last high-stand of Lake Lahontan. J. Paleolimnol. 5,115–126.
Bertheau, C., Schuler, H., Krumböck, S., Arthofer, W., Stauffer, C., 2011. Hit or miss inphylogeographic analyses: the case of the cryptic NUMTs. Mol. Ecol. Res. 11,1056–1059.
Bryson, R.W., Riddle, B.R., Graham, M.R., Smith, B.T., Prendini, L., 2013. As old as thehills: montane scorpions in southwestern North America reveal ancientassociations between biotic diversification and landscape history. PLoS ONE 8,e52822.
Cronquist, A., Holmgren, A.H., Holmgren, N.H., Reveal, J.L., 1972. IntermountainFlora: Vascular Plants of the Intermountain West, USA, vol. 1. Hafner PublishingCompany, New York, NY.
Drummond, A.J., Rambaut, A., 2007. BEAST: Bayesian evolutionary analysis bysampling trees. BMC Evol. Biol. 7, 214.
Edwards, S., Bensch, S., 2009. Looking forwards or looking backwards in avianphylogeography? A comment on Zink and Barrowclough 2008. Mol. Ecol. 18,2930–2933.
Esposito, L.A., 2011. Systematics and Biogeography of the New World ScorpionGenus Centruroides Marx, 1890 (Scorpiones:Buthidae). PhD Dissertation. CityUniversity of New York. 322 p.
Excoffier, L., Laval, G., Schneider, S., 2005. ARLEQUIN ver. 3.0: an integrated softwarepackage for population genetics data analysis. Evol. Bioinform. 1, 47–50.
Fouquet, A., Vences, M., Salducci, M.D., Meyer, A., Marty, C., Blanc, M., Gilles, A.,2007. Revealing cryptic diversity using molecular phylogenetics andphylogeography in frogs of the Scinax ruber and Rhinella margaritifera speciesgroups. Mol. Phylogenet. Evol. 43, 567–582.
Frankel, K.L., Lee, J., Bishop, K., Dawers, N., Ganev, P., Unruh, J., Owen, L., 2010.Miocene-Quaternary tectonic evolution of the northern eastern California shearzone. In: Clifton, H.E., Ingersoll, R.V. (Eds.), Geologic Excursions in California andNevada: Tectonics, Stratigraphy, and Hydrogeology: Pacific Section, SEPM(Society for Sedimentary Geology), pp. 173–231.
Fu, Y.X., 1997. Statistical tests of neutrality of mutations against population growth,hitchhiking and background selection. Genetics 147, 915–925.
Galbreath, K.E., Hafner, D.J., Zamudio, K.R., 2009. When cold is better: climate-driven elevation shifts yield complex patterns of diversification anddemography in an alpine specialist (American pika, Ochotona princeps).Evolution 63, 2848–2863.
Galbreath, K.E., Hafner, D.J., Zamudio, K.R., Agnew, K., 2010. Isolation andintrogression in the Intermountain West: contrasting gene genealogies revealthe complex biogeographic history of the American pika (Ochotona princeps). J.Biogeogr. 37, 344–362.
Gantenbein, B., Fet, V., Largiadèr, C.R., Scholl, A., 1999. First DNA phylogeny ofEuscorpius Thorell, 1876 (Scorpiones: Euscorpiidae) and its bearing ontaxonomy and biogeography of this genus. Biogeographica 75, 49–65.
Gantenbein, B., Largiadér, C.R., 2002. Mesobuthus gibbosus (Scorpiones: Buthidae) onthe island of Rhodes – hybridization between Ulysses’ stowaways and nativescorpions? Mol. Ecol. 11, 925–938.
Gantenbein, B., Fet, V., Gantenbein-Ritter, I.A., Balloux, F., 2005. Evidence forrecombination in scorpion mitochondrial DNA (Scorpiones: Buthidae). Proc. R.Soc. Lond. B Biol. Sci. 272, 697–704.
Gertsch, W.J., Allred, D.M., 1965. Scorpions of the Nevada Test Site. Brigham YoungUniversity Science Bulletin, pp. 1–15.
Gertsch, W.J., Soleglad, M.E., 1966. Scorpions of the Vejovis boreus group (genusParuroctonus) in North America. Am. Museum Novitates 2278, 1–54.
M.R. Graham et al. / Molecular Phylogenetics and Evolution 69 (2013) 502–513 513
Graham, M.R., Jaeger, J.R., Prendini, L., Riddle, B.R., 2013. Phylogeography of theArizona hairy scorpion (Hadrurus arizonensis) supports a model of bioticassembly in the Mojave Desert and adds a new Pleistocene refugium. J.Biogeogr. 40, 1298–1312.
Grayson, D.K., 1993. The Desert’s Past: a Natural Prehistory of the Great Basin.Smithsonian Institution Press, Washington, DC.
Hall, C.A., 2002. Nearshore marine paleoclimatic regions, increasing zoogeographicprovinciality, mollsucan extinctions, and paleoshorelines, California: LateOligocene (27 Ma) to Late Pliocene (2.5 Ma). Geological Society of AmericaSpecial Paper 357.
Hafner, J.C., Upham, N.S., Reddington, E., Torres, C.W., 2008. Phylogeography of thepallid kangaroo mouse, Microdipodops pallidus: a sand-obligate endemic of theGreat Basin, western North America. J. Biogeogr. 35, 2102–2118.
Hafner, D.J., Riddle, B.R., 2011. Boundaries and barriers of North American warmdeserts: an evolutionary perspective. In: Upchurch, P., McGowan, A., Slater, C.(Eds.), Palaeogeography and Palaeobiogeography: Biodiversity in Space andTime. CRC Press, Boca Raton, FL, pp. 75–114.
Haradon, R.M., 1985. New groups and species belonging to the nominate subgroupParuroctonus (Scorpiones, Vaejovidae). J. Arachnol. 13, 19–42.
Hasumi, H., Emori, S., 2004. K-1 Coupled Model (MIROC) Description. K-1 TechnicalReport 1. Center for Climate System Research, University of Tokyo, Tokyo.
Hijmans, R.J., Cameron, S.E., Parra, J.L., Jones, P., Jarvis, A., 2005. Very high resolutioninterpolated climate surfaces for global land areas. Int. J. Climatol. 25, 1965–1978.
Hjelle, J.T., 1982. Paruroctonus variabilis, a new species of scorpion from California(Scorpionida: Vaejovidae). Wasmann J. Biol. 40, 98–101.
Hornsby, A.D., Matocq, M.D., 2011. Differential regional response of the bushy-tailed woodrat (Neotoma cinerea) to late Quaternary climate change. J. Biogeogr.39, 289–305.
Hurst, G.D.D., Jiggins, F.M., 2005. Problems with mitochondrial DNA as a marker inpopulation, phylogeographic and phylogenetic studies: the effects of inheritedsymbionts. Proc. R. Soc. Lond. B Biol. Sci. 272, 1525–1534.
Jezkova, T., 2010. Reconstructing Species Responses to Past Climatic Changes usingNiche Modeling and Genetic Data. PhD Dissertation, University of Nevada, LasVegas, USA.
Jezkova, T., Olah-Hemmings, V., Riddle, B.R., 2011. Niche shifting in response towarming climate after the last glacial maximum: inference from genetic dataand niche assessments in the chisel-toothed kangaroo rat (Dipodomys microps).Global Change Biol. 17, 3486–3502.
Ji, Y.-J., Zhang, D.-X., He, L.-J., 2003. Evolutionary conservation and versatility of anew set of primers for amplifying the ribosomal internal transcribed spacerregions in insects and other invertebrates. Mol. Ecol. Notes 3, 581–585.
Jiménez-Valverde, A., Lobo, J.M., 2007. Threshold criteria for conversion ofprobability of species presence to either-or presence-absence. Acta Oecol. –Int. J. Ecol. 31, 361–369.
Koizumi, I., Usio, N., Kawai, T., Azuma, N., Masuda, R., 2012. Loss of genetic diversitymeans loss of geological information: the endangered Japanese crayfish exhibitsremarkable historical footprints. PLoS ONE 7, 1–7.
Köhler, F., Glaubrecht, M., 2010. Uncovering an overlooked radiation: molecularphylogeny and biogeography of Madagascar’s endemic river snails(Caenogastropoda: Pachychilidae: Madagasikara gen. nov.). Biol. J. Linn. Soc.99, 867–894.
Librado, P., Rozas, J., 2009. DnaSP v5: a software for comprehensive analysis of DNApolymorphism data. Bioinformatics 25, 1451–1452.
Liu, C.R., Berry, P.M., Dawson, T.P., Pearson, R.G., 2005. Selecting thresholds ofoccurrence in the prediction of species distributions. Ecography 28, 385–393.
Madsen, D.B., Rhode, D., Grayson, D.K., Broughton, J.M., Livingston, S.D., Hunt, J.,Quade, J., Schmitt, D.N., Shaver III, M.W., 2001. Late Quaternary environmentalchange in the Bonneville basin, western USA. Palaeogeogr. Palaeoclim.Palaeoecol. 167, 243–271.
Miller, M.P., 2005. Alleles In Space (AIS): computer software for the joint analysis ofinterindividual spatial and genetic information. J. Hered. 96, 722–724.
Miller, M.P., Bellinger, M.R., Forsman, E.D., Haig, S.M., 2006. Effects of historicalclimate change, habitat connectivity, and vicariance on genetic structure anddiversity across the range of the red tree vole (Phenacomys longicaudus) in thePacific Northwestern United States. Mol. Ecol. 15, 145–159.
Mulcahy, D.G., 2008. Phylogeography and species boundaries of the western NorthAmerican nightsnake (Hypsiglena torquata): revisiting the subspecies concept.Mol. Phylogenet. Evol. 46, 1095–1115.
Nogués-Bravo, D., 2009. Predicting the past distribution of species climatic niches.Global Ecol. Biogeogr. 18, 521–531.
Nowak, C.L., Nowak, R.S., Tausch, R.J., Wigand, P.E., 1994. Tree and shrub dynamicsin the northwestern Great Basin woodland and shrubland steppe during the latePleistocene and Holocene. Am. J. Bot. 81, 265–277.
Nylander, J.A.A., Ronquist, F., Huelsenbeck, J.P., Nieves-Aldrey, J.L., 2004. Bayesianphylogenetic analysis of combined data. Syst. Biol. 53, 47–67.
Nylander, J.A.A., Wilgenbusch, J.C., Warren, D.L., Swofford, D.L., 2008. AWTY (are wethere yet?): a system for graphical exploration of MCMC convergence inBayesian phylogenetic inference. Bioinformatics 24, 581–583.
Olson, D.M. et al., 2001. Terrestrial ecoregions of the World: a new map of life onEarth. Bioscience 51, 1–6.
Otto-Bliesner, B.L., Brady, E.C., Clauzet, G., Tomas, R., Levis, S., Kothavala, Z., 2006.Last Glacial Maximum and Holocene climate in CCSM3. J. Climatol. 19, 2526–2544.
Pearson, R.G., Dawson, T.P., Berry, P.M., Harrison, P.A., 2002. SPECIES: a spatialevaluation of climate impact on the envelope of species. Ecol. Model. 154, 289–300.
Peterson, A.T., Papes, M., Eaton, M., 2007. Transferability and model evaluation inecological niche modeling: a comparison of GARP and Maxent. Ecography 30,550–560.
Phillips, S.J., Anderson, R.P., Schapire, R.E., 2006. Maximum entropy modeling ofspecies geographic distributions. Ecol. Model. 190, 231–259.
Phillips, F.M., 2008. Geological and hydrological history of the paleo-Owensdrainage since the late Miocene. In: Reheis, M.C., Hershler, R. (Eds.), LateCenozoic Drainage History of the Southwestern Great Basin and Lower ColoradoRiver Region: Geologic and Biotic Perspectives: Geological Society of AmericaSpecial Paper 439, pp. 115–150.
Polzin, T., Daneshmand, S.V., 2003. On Steiner trees and minimum spanning trees inhypergraphs. Oper. Res. Lett. 31, 12–20.
Posada, D., 2008. JModelTest: phylogenetic model averaging. Mol. Biol. Evol. 25,1253–1256.
Prendini, L., Crowe, T.M., Wheeler, W.C., 2003. Systematics and biogeography of thefamily Scorpionidae Latreille, with a discussion of phylogenetic methods. Invert.Syst. 17, 185–259.
Prendini, L., Weygoldt, P., Wheeler, W.C., 2005. Systematics of the Damon variegatusgroup of African whip spiders (Chelicerata: Amblypygi): Evidence frombehaviour, morphology and DNA. Org. Divers. Evol. 5, 203–236.
Rambaut, A., Drummond, A.J., 2007. Tracer v1.4. <http://beast.bio.ed.ac.uk/Tracer>.Randin, C.F., Dirnbock, T., Dullinger, S., Zimmermann, N.E., Zappa, M., Guisan, A.,
2006. Are niche-based species distribution models transferable in space? J.Biogeogr. 33, 1689–1703.
Redmond, K.T., 2009. Historic climate variability in the Mojave Desert. In: Webb,R.H., Fenstermaker, L.F., Heaton, J.S., Hughson, D.L., McDonald, E.V., Miller, D.M.(Eds.), The Mojave Desert: Ecosystem Processes and Sustainability. University ofNevada Press, Reno, NV, pp. 11–30.
Reheis, M.C., Sawyer, T.L., 1997. Late Cenozoic history and slip rates of the Fish LakeValley, Emigrant Peak, and Deep Springs fault zones, Nevada and California.Geol. Soc. Am. Bull. 109, 280–299.
Rissler, L.J., Hijmans, R.J., Graham, C.H., Moritz, C., Wake, D.B., 2006.Phylogeographic lineages and species comparisons in conservation analyses: acase study of the California herpetofauna. Am. Nat. 167, 655–666.
Rissler, L.J., Apodaca, J.J., 2007. Adding more ecology into species delimitation:Ecological niche models and phylogeography help define cryptic species in theblack salamander (Aneides flavipunctatus). Syst. Biol. 56, 924–942.
Ronquist, F., Huelsenbeck, J.P., 2003. MrBayes 3: Bayesian phylogenetic inferenceunder mixed models. Bioinformatics 19, 1572–1574.
Spaulding, A.W., 1990. Vegetational and climatic development of the MojaveDesert: the Last Glacial Maximum to the Present. In: Betancourt, J.L., VanDevender, T.T., Martin, P.S. (Eds.), Packrat Middens: The Last 40,000 Years ofBiotic Change. University of Arizona Press, Tucson, AZ, pp. 200–239.
Stahnke, H.L., 1972. UV light, a useful field tool. Bioscience 22, 604–607.Stockli, D.F., Dumitru, T.A., McWilliams, M.O., Farley, K.A., 2003. Cenozoic tectonic
evolution of the White Mountains, California and Nevada. Geol. Soc. Am. Bull.115, 788–816.
Stephens, M., Donnelly, P., 2003. A comparison of Bayesian methods for haplotypereconstruction from population genotype data. Am. J. Hum. Genet. 73, 1162–1169.
Thomas, S.M., Hedin, M., 2008. Multigenic phylogeographic divergence in thepaleoendemic southern Appalachian opilionid Fumontana deprehendor Shear(Opiliones, Laniatores, Triaenonychidae). Mol. Phylogenet. Evol. 46, 645–658.
Thuiller, W., Brotons, L., Araujo, M.B., Lavorel, S., 2004. Effects of restrictingenvironmental range of data to project current and future species distributions.Ecography 27, 165–172.
Thompson, R.S., 1990. Late Quaternary vegetation and climate in the Great Basin. In:Betancourt, J.L., Van Devender, T.R., Martin, P.S. (Eds.), Packrat Middens: TheLast 40,000 Years of Biotic Change. University of Arizona Press, AZ, Tucson, AZ,pp. 167–199.
Thompson, R.S., Anderson, K.H., 2000. Biomes of western North America at 18,000,6000 and 0 14C yr bp reconstructed from pollen and packrat midden data. J.Biogeogr. 27, 555–584.
Wang, Q., Li, S., Wang, R., Paquin, P., 2008. Phylogeographic analysis of Pimoidae(Arachnida: Araneae) inferred from mitochondrial cytochrome c oxidasesubunit I and nuclear 28S rRNA gene regions. J. Zool. Syst. Evol. Res. 46, 96–104.
Walteri, E., Guralnick, R.P., 2008. Ecological niche modelling of montane mammalsin the Great Basin, North America: examining past and present connectivity ofspecies across basins and ranges. J. Biogeogr. 36, 148–161.
Waters, J.M., 2011. Competitive exclusion: phylogeography’s ‘elephant in theroom’? Mol. Ecol. 20, 4388–4394.
Wilson, J.S., Pitts, J.P., 2010. Illuminating the lack of consensus among descriptionsof earth history data in the North American deserts: a resource for biologists.Prog. Phys. Geog. 34, 419–441.
Wood, D.A., Fisher, R.N., Reeder, T.W., 2008. Novel patterns of historical isolation,dispersal, and secondary contact across Baja California in the Rosy Boa(Lichanura trivergata). Mol. Phylogenet. Evol. 46, 484–502.
Zink, R.M., Barrowclough, G.F., 2008. Mitochondrial DNA under siege in avianphylogeography. Mol. Ecol. 17, 2107–2121.