Embed Size (px)
Citation preview
Molecular Orientation Induced by Cooling Stresses. Birefringence in Polycarbonate: 111. Constrained Quench and Injection Molding
R. WIMBERGER-FRIED1
Philips Research Laboratories, P.O. Box 80000, 5600 JA Eindhoven, The Netherlands
SYNOPSIS
Residual stress and birefringence distributions are determined in polycarbonate samples obtained by quenching in a specially designed apparatus and by injection molding. The molecular orientation is distinguished from the thermally and pressure-induced residual stresses. The birefringence in the quenched samples is found to be positive and almost constant, independent of the quench temperature, but varying strongly with initial quench temperature between 150 and 180°C. The residual stress level, as determined by layer removal and sectioning, is very low. The birefringence distribution is mainly due to a tensile equibiaxial orientation induced by transient cooling stresses built up above Tg. The samples which are injection-molded with a high injection speed and without packing pressure display the same birefringence distribution as the quenched samples, apart from a local maximum beneath the surface due to the shear flow during filling. Apart from the flow during filling and packing, the frozen-in molecular orientation in injection-molded samples is also induced by transient thermal stresses present during vitrification. The birefringence from thermally induced orientation was found to be of comparable magnitude to that from flow-induced orientation. For a correct prediction of molecular orientation the thermal strains above Tg must therefore be included in simulation programs. Because of the low level of thermal stresses, the application of a packing pressure will lead to tensile stresses at the surface in general. 0 1994 John Wiley & Sons, Inc. Keywords: injection molding polycarbonate birefringence molecular orientation . residual stresses constrained quench
INTRODUCTION
Complicated residual stress distributions have been reported for injection-molded samples and ascribed to thermal and flow-induced stresses built up during the molding A very convenient tech- nique to determine residual stress distributions is the so-called layer removal ( LR) technique intro- duced by Treuting and Read.' But because of several limitations, in principle and in practice, of this technique, ' especially the low spatial resolution, al- ternative techniques have been employed, birefrin- gence being the one most frequently used for amor- phous polymers.
In injection-molded specimens, there will always be contributions of flow-induced frozen-in orienta-
Journal of Polymer Science: Part B Polymer Physics, Vol. 32,595-605 (1994) 0 1994 John Wiley & Sons, Inc. CCC OSS7-6266/94/040595-11
tion and of residual stresses to birefringence. Since for most polymers the stress-optical coefficient of the melt is considerably higher than that of the glass, the contribution of molecular orientation will gen- erally be predominant.'-" The measurement of the frozen-in molecular orientation is an important part of the characterization of the state of a molded product. Orientation affects the properties and de- termines the dimensional stability of polymer prod- ucts to a great extent. Since orientation is accom- panied by entropy stresses above Tg, the question has arisen whether frozen-in orientation should be called residual stress.12 It is of course a matter of definition, but flow-induced orientation has different consequences than "real" stresses for a product in the sense that it cannot be measured by LR. It is the viscoelastic memory of stresses, whose recovery has been tremendously retarded by the cooling
595
596 WIMBERGER-FRIEDL
through Tg. Therefore it will not be called residual stress here, but frozen-in orientation.
In order to study residual stresses, in particular thermally induced ones, free quenching experiments have usually been carried 0 ~ t . l ~ The boundary con- ditions in free quenching are, however, quite differ- ent from those in injection-molding. A much more relevant experiment is constrained quenching. Comparing the birefringence distributions of sam- ples quenched freely and between plates, Saffell and Windle l4 reported essentially parabolic stress dis- tributions for both cases, whereas Isayev l1 reported completely different distributions in the case of samples quenched between plates. In injection- molded samples not only the anisothermal cooling, but also the pressure variation during vitrification gives rise to residual ~ t r e s s e s . ~ , ~ ~ , ~ ~ When the pressure varies with time while the solidification proceeds, subsequently vitrified layers will be hampered in their response to a pressure change. This leads to residual stresses which are compressive in those layers which vitrified under the highest pressure and tensile in those vitrified under the lowest pressure.
In the present contribution, the stress and bire- fringence distributions in constrained-quenched polycarbonate will be described and compared with those found in injection-molded samples. The fro- zen-in orientation will be distinguished from the thermal and the pressure-induced residual stresses.
EX PE R I M E N TA 1
All experiments were carried out with polycarbonate CD 2000/15000 from Bayer AG, Leverkusen, FRG. This is an optical grade with low molecular weight, the same polymer used in previous in~estigati0ns.l~ The thermomechanical properties are described else~here.’~”~
Quench Apparatus
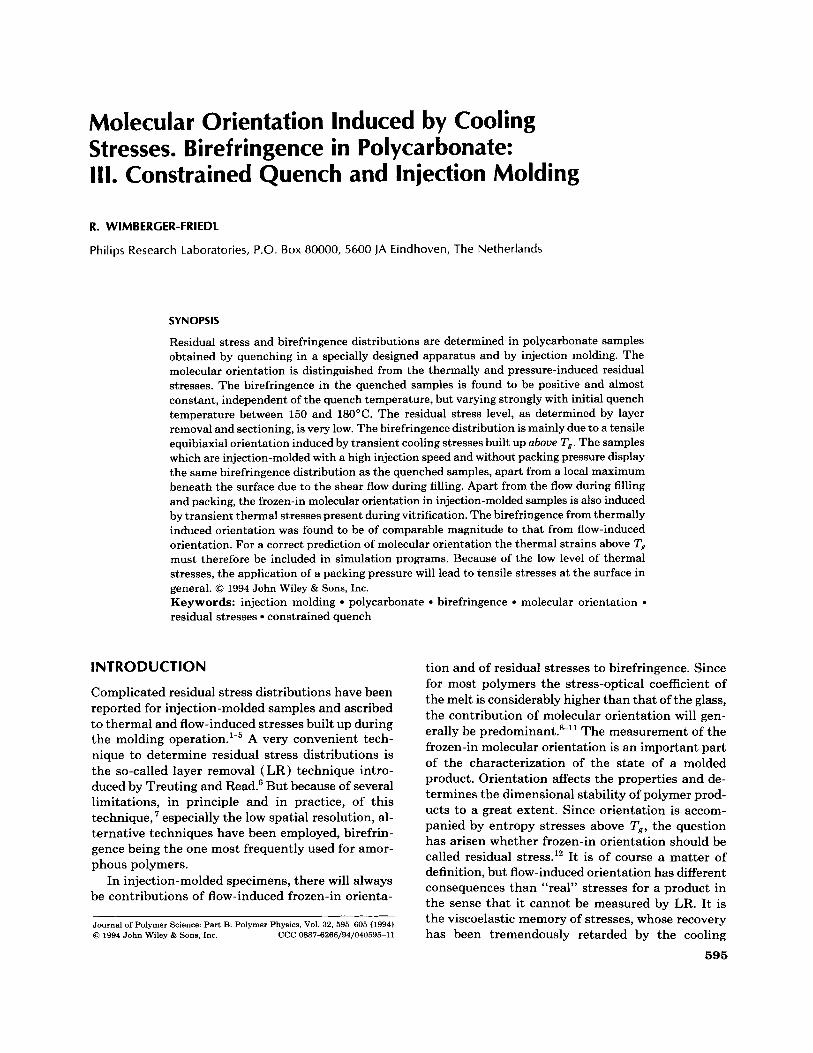
In order to simulate injection-molding conditions, the cooling rate should be as high as possible. How- ever, no deformation must be applied before and during the quench. Therefore an apparatus was de- veloped, in which the sample can be annealed in situ. The predried sample is placed between two pis- tons with copper faces in a quartz cylinder with an inner diameter of 30 mm (Fig. 1). The whole ar- rangement is then heated to Ti above Tg of the sam- ple. The top piston is typically loaded with 5N (cor- responding to kPa pressure in the sample) to insure good thermal contact during the quench when the
Figure 1. Quenching apparatus: S, sample, T i , oven temperature, T,, water temperature, L, load, FT, fluo- roptical thermometer. Arrows indicate the direction of water circulation. Hatched areas indicate the water chan- nels.
sample contracts. Upon opening a valve, thermo- stated water is pumped through both pistons (in- dicated by the hatched area in Fig. 1 ), which initially were empty. The pistons fit precisely into the quartz cylinder. The latter is sufficiently insulating so that the rim of the PC sample does not solidify before the core. Only then can the upper piston follow the local axial shrinkage of the sample at any point, a precondition for high and homogeneous cooling rates. The true cooling rates were determined by glass fiber “thermocouples” connected to a fluoroptic thermometer ( Luxtron 750). At the tip of the glass fiber there is a fluorescent component embedded in a plastic cladding. The fibers were inserted radially into the samples at various distances from the sur- face at different circumferential angles. In this way the temperature distribution close to the sensor is least affected by the presence of the other sensors and there is no heat conduction along the fiber.
In place of a disk, rods were also quenched be- tween the plates. In that case several rods were used simultaneously between the pistons in order to re- duce the effective load on the individual rod.
Injection Molding
The injection-molding experiments were carried out on an Arburg Allrounder %-ton machine equipped with a PMC 1000 control at the Philips-CCP. The
BIREFRINGENCE IN POLYCARBONATE. I11 597
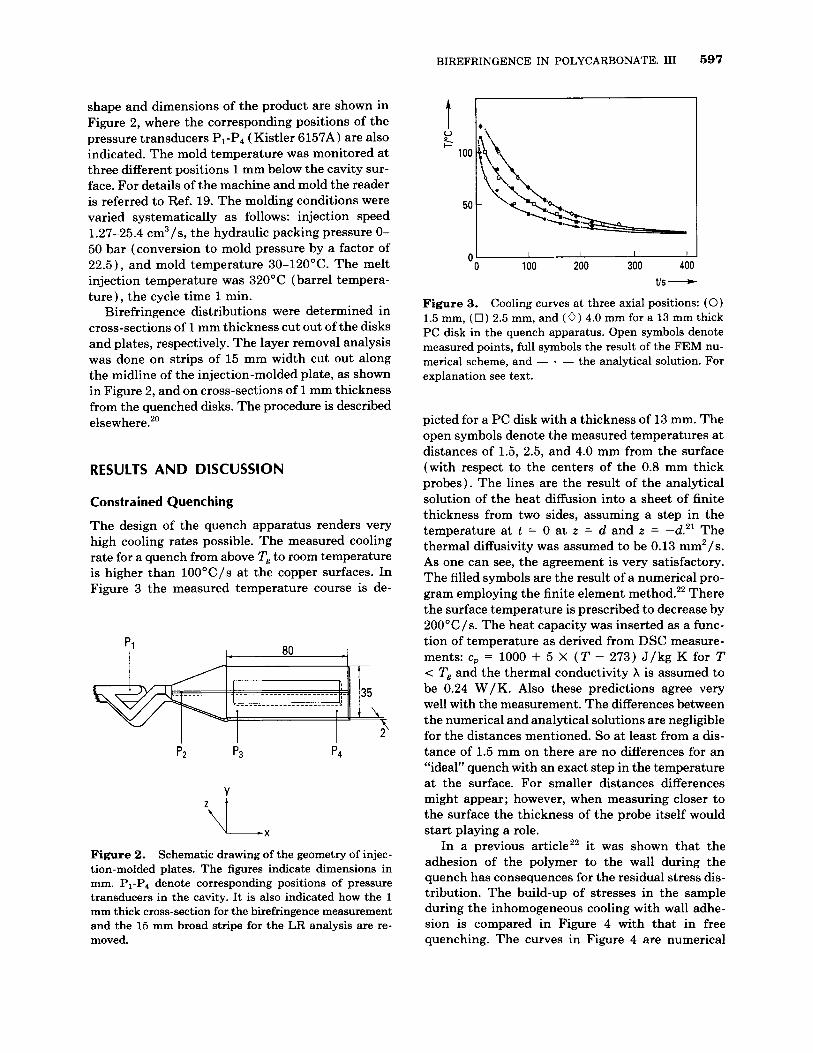
shape and dimensions of the product are shown in Figure 2, where the corresponding positions of the pressure transducers P1-P4 (Kistler 6157A) are also indicated. The mold temperature was monitored at three different positions 1 mm below the cavity sur- face. For details of the machine and mold the reader is referred to Ref. 19. The molding conditions were varied systematically as follows: injection speed 1.27-25.4 cm3/s, the hydraulic packing pressure 0- 50 bar (conversion to mold pressure by a factor of 22.5), and mold temperature 30-120°C. The melt injection temperature was 320°C (barrel tempera- ture), the cycle time 1 min.
Birefringence distributions were determined in cross-sections of 1 mm thickness cut out of the disks and plates, respectively. The layer removal analysis was done on strips of 15 mm width cut out along the midline of the injection-molded plate, as shown in Figure 2, and on cross-sections of 1 mm thickness from the quenched disks. The procedure is described elsewhere.20
RESULTS AND DISCUSSION
Constrained Quenching
The design of the quench apparatus renders very high cooling rates possible. The measured cooling rate for a quench from above Tg to room temperature is higher than 100°C/s at the copper surfaces. In Figure 3 the measured temperature course is de-
80 P1 I 4
I I I p2 p3 p4
L
V
L, Figure 2. Schematic drawing of the geometry of injec- tion-molded plates. The figures indicate dimensions in mm. P1-P4 denote corresponding positions of pressure transducers in the cavity. It is also indicated how the 1 mm thick cross-section for the birefringence measurement and the 15 mm broad stripe for the LR analysis are re- moved.
I I I I I
100 200 300 400 t/S - 0'
0
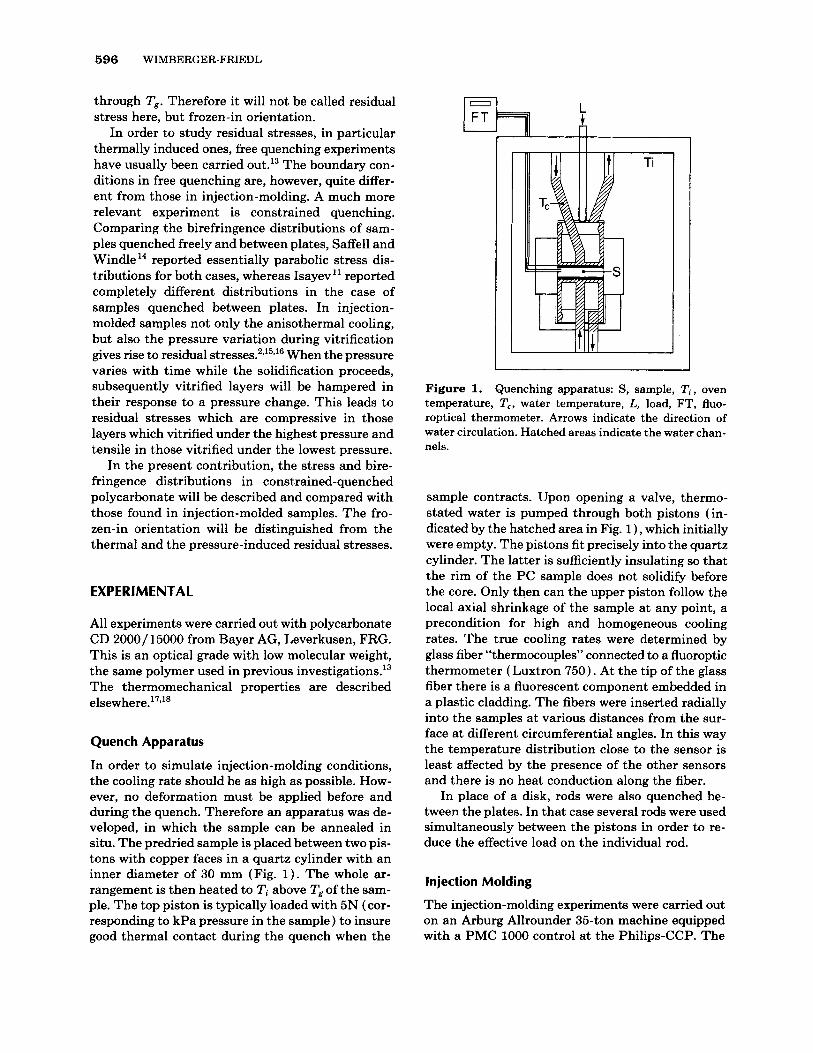
Figure 3. Cooling curves at three axial positions: (0) 1.5 mm, (0) 2.5 mm, and (0) 4.0 mm for a 13 mm thick PC disk in the quench apparatus. Open symbols denote measured points, full symbols the result of the FEM nu- merical scheme, and - * - the analytical solution. For explanation see text.
picted for a PC disk with a thickness of 13 mm. The open symbols denote the measured temperatures at distances of 1.5, 2.5, and 4.0 mm from the surface (with respect to the centers of the 0.8 mm thick probes). The lines are the result of the analytical solution of the heat diffusion into a sheet of finite thickness from two sides, assuming a step in the temperature at t = 0 at z = d and z = -d." The thermal diffusivity was assumed to be 0.13 mmz/s. As one can see, the agreement is very satisfactory. The filled symbols are the result of a numerical pro- gram employing the finite element method.z2 There the surface temperature is prescribed to decrease by 200"C/s. The heat capacity was inserted as a func- tion of temperature as derived from DSC measure- ments: c,, = 1000 + 5 X (T - 273) J /kg K for T < Tg and the thermal conductivity h is assumed to be 0.24 W/K. Also these predictions agree very well with the measurement. The differences between the numerical and analytical solutions are negligible for the distances mentioned. So at least from a dis- tance of 1.5 mm on there are no differences for an "ideal" quench with an exact step in the temperature at the surface. For smaller distances differences might appear; however, when measuring closer to the surface the thickness of the probe itself would start playing a role.
In a previous articlez2 it was shown that the adhesion of the polymer to the wall during the quench has consequences for the residual stress dis- tribution. The build-up of stresses in the sample during the inhomogeneous cooling with wall adhe- sion is compared in Figure 4 with that in free quenching. The curves in Figure 4 are numerical
598 WIMBERGER-FRIEDL
0 1 z/d -
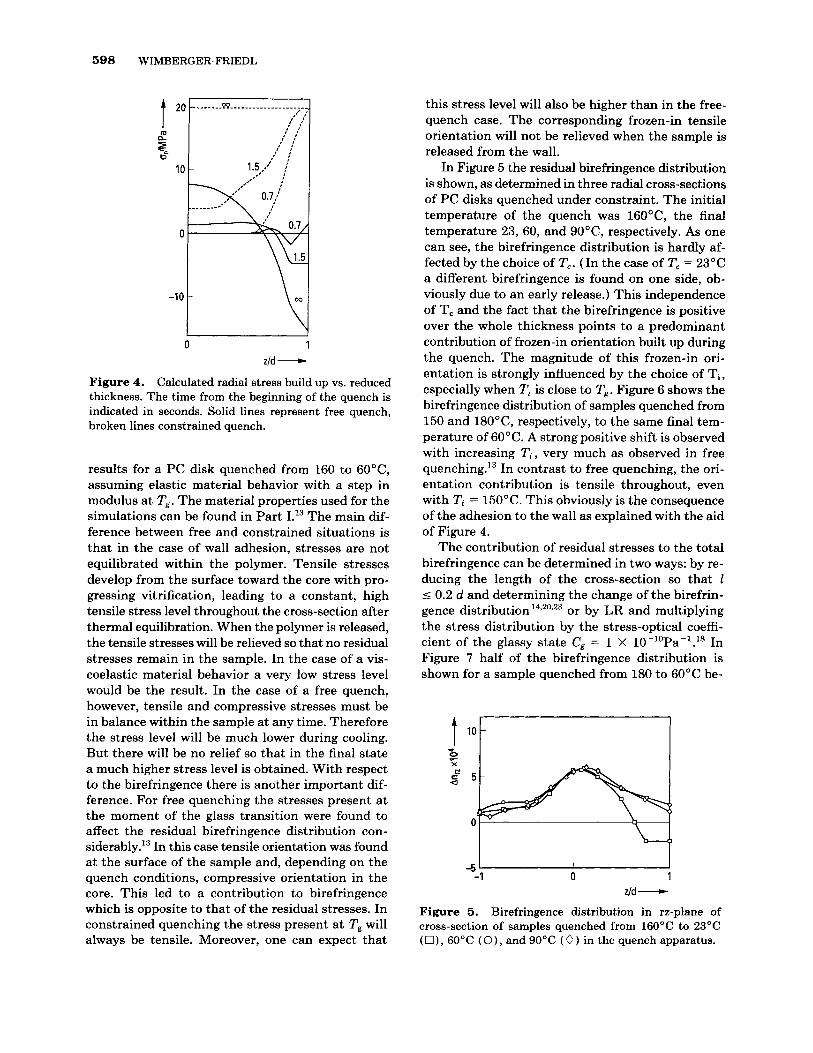
Figure 4. Calculated radial stress build up vs. reduced thickness. The time from the beginning of the quench is indicated in seconds. Solid lines represent free quench, broken lines constrained quench.
results for a PC disk quenched from 160 to 60"C, assuming elastic material behavior with a step in modulus at Tg. The material properties used for the simulations can be found in Part I.13 The main dif- ference between free and constrained situations is that in the case of wall adhesion, stresses are not equilibrated within the polymer. Tensile stresses develop from the surface toward the core with pro- gressing vitrification, leading to a constant, high tensile stress level throughout the cross-section after thermal equilibration. When the polymer is released, the tensile stresses will be relieved so that no residual stresses remain in the sample. In the case of a vis- coelastic material behavior a very low stress level would be the result. In the case of a free quench, however, tensile and compressive stresses must be in balance within the sample at any time. Therefore the stress level will be much lower during cooling. But there will be no relief so that in the final state a much higher stress level is obtained. With respect to the birefringence there is another important dif- ference. For free quenching the stresses present at the moment of the glass transition were found to affect the residual birefringence distribution con- ~iderab1y.l~ In this case tensile orientation was found at the surface of the sample and, depending on the quench conditions, compressive orientation in the core. This led to a contribution to birefringence which is opposite to that of the residual stresses. In constrained quenching the stress present at Tg will always be tensile. Moreover, one can expect that
this stress level will also be higher than in the free- quench case. The corresponding frozen-in tensile orientation will not be relieved when the sample is released from the wall.
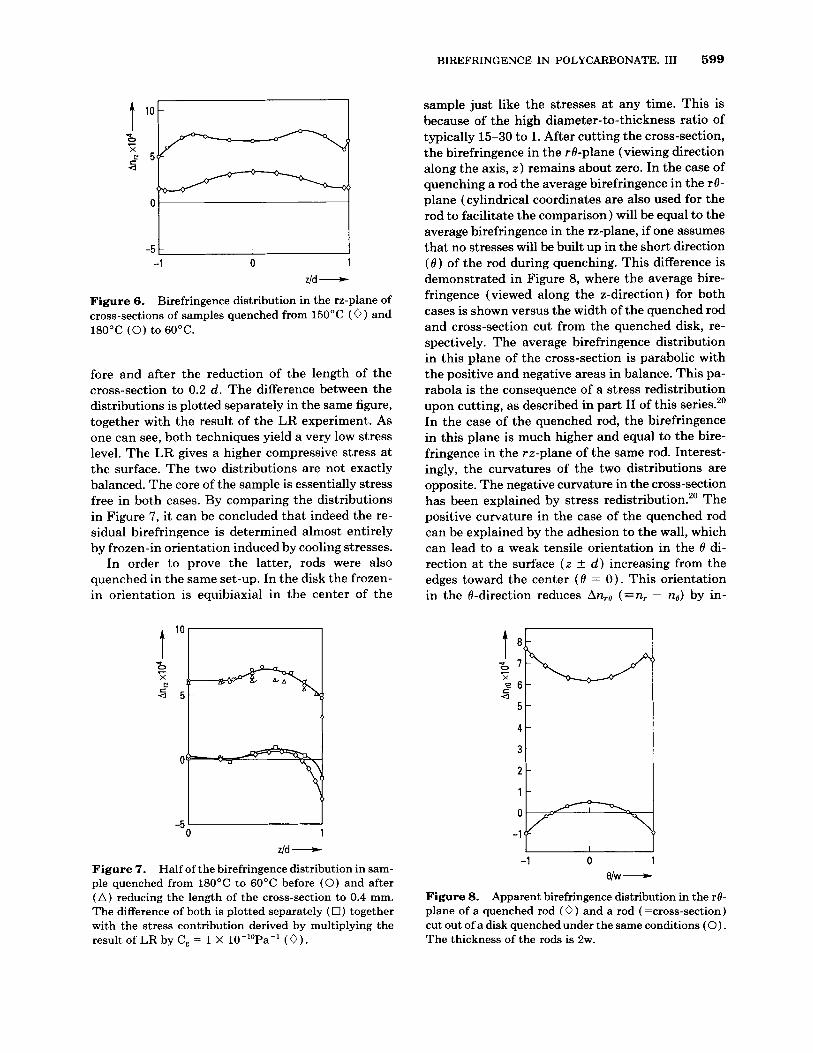
In Figure 5 the residual birefringence distribution is shown, as determined in three radial cross-sections of PC disks quenched under constraint. The initial temperature of the quench was 160"C, the final temperature 23, 60, and 90°C, respectively. As one can see, the birefringence distribution is hardly af- fected by the choice of T,. (In the case of T, = 23°C a different birefringence is found on one side, ob- viously due to an early release.) This independence of T, and the fact that the birefringence is positive over the whole thickness points to a predominant contribution of frozen-in orientation built up during the quench. The magnitude of this frozen-in ori- entation is strongly influenced by the choice of Ti , especially when Ti is close to Tg. Figure 6 shows the birefringence distribution of samples quenched from 150 and 180"C, respectively, to the same final tem- perature of 60°C. A strong positive shift is observed with increasing Ti, very much as observed in free q~enching. '~ In contrast to free quenching, the ori- entation contribution is tensile throughout, even with Ti = 150°C. This obviously is the consequence of the adhesion to the wall as explained with the aid of Figure 4.
The contribution of residual stresses to the total birefringence can be determined in two ways: by re- ducing the length of the cross-section so that 1 I 0.2 d and determining the change of the birefrin- gence distribution 14,20,23 or by LR and multiplying the stress distribution by the stress-optical coeffi- cient of the glassy state C, = 1 X 10⁻¹⁰Pa-'.'8 In Figure 7 half of the birefringence distribution is shown for a sample quenched from 180 to 60°C be-
~r I
T l o t
X
a 2 5
0
-5 ' I I -1 0 1
z/d - Figure 5. Birefringence distribution in rz-plane of cross-section of samples quenched from 160°C to 23°C ( O ) , 60°C ( O ) , and 90°C (0) in the quench apparatus.
BIREFRINGENCE IN POLYCARBONATE. I11 599
-5 -1 0 1
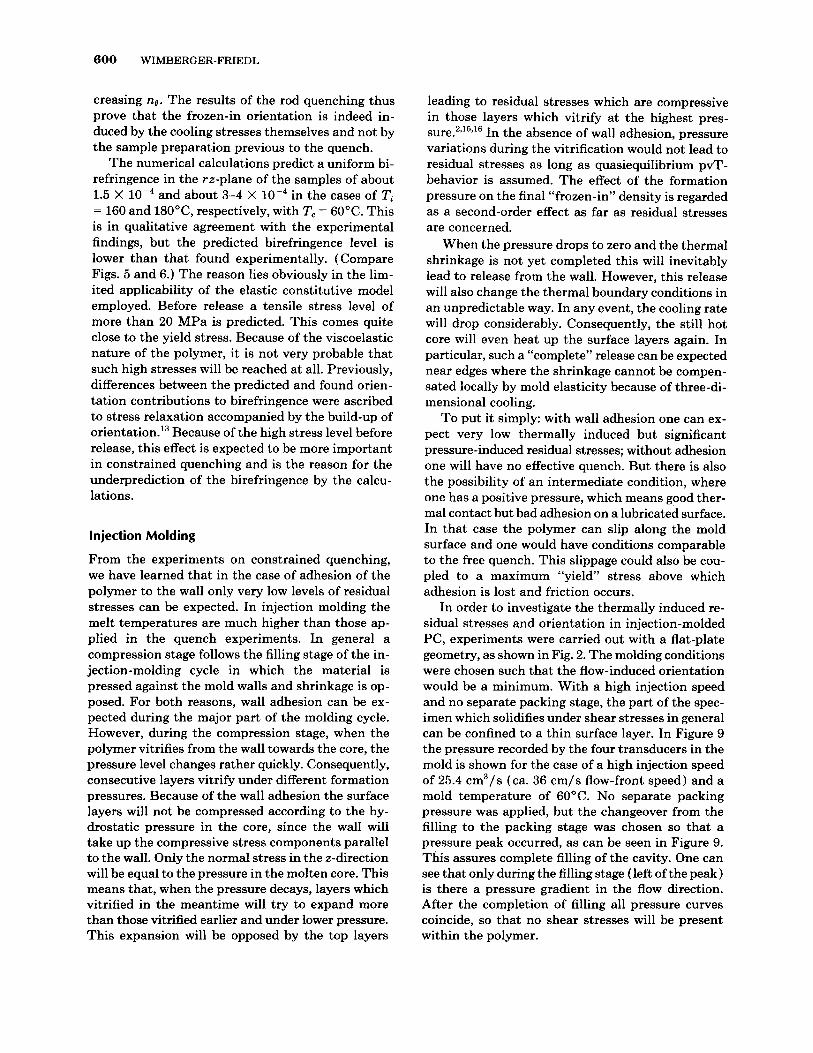
z/d - Figure 6. Birefringence distribution in the rz-plane of cross-sections of samples quenched from 150°C (0) and 180°C (0) to 60°C.
fore and after the reduction of the length of the cross-section to 0.2 d . The difference between the distributions is plotted separately in the same figure, together with the result of the LR experiment. As one can see, both techniques yield a very low stress level. The LR gives a higher compressive stress at the surface. The two distributions are not exactly balanced. The core of the sample is essentially stress free in both cases. By comparing the distributions in Figure 7, it can be concluded that indeed the re- sidual birefringence is determined almost entirely by frozen-in orientation induced by cooling stresses.
In order to prove the latter, rods were also quenched in the same set-up. In the disk the frozen- in orientation is equibiaxial in the center of the
-5 ' 0 1
z/d - Figure 7. Half of the birefringence distribution in sam- ple quenched from 18OoC to 60°C before (0) and after ( A ) reducing the length of the cross-section to 0.4 mm. The difference of both is plotted separately (0 ) together with the stress contribution derived by multiplying the result of LR by C, = 1 X 10-''Pa-' (0).
sample just like the stresses at any time. This is because of the high diameter-to-thickness ratio of typically 15-30 to 1. After cutting the cross-section, the birefringence in the r0-plane (viewing direction along the axis, z ) remains about zero. In the case of quenching a rod the average birefringence in the r0- plane (cylindrical coordinates are also used for the rod to facilitate the comparison) will be equal to the average birefringence in the rz-plane, if one assumes that no stresses will be built up in the short direction ( 0 ) of the rod during quenching. This difference is demonstrated in Figure 8, where the average bire- fringence (viewed along the z-direction) for both cases is shown versus the width of the quenched rod and cross-section cut from the quenched disk, re- spectively. The average birefringence distribution in this plane of the cross-section is parabolic with the positive and negative areas in balance. This pa- rabola is the consequence of a stress redistribution upon cutting, as described in part I1 of this series." In the case of the quenched rod, the birefringence in this plane is much higher and equal to the bire- fringence in the rz-plane of the same rod. Interest- ingly, the curvatures of the two distributions are opposite. The negative curvature in the cross-section has been explained by stress redistribution." The positive curvature in the case of the quenched rod can be explained by the adhesion to the wall, which can lead to a weak tensile orientation in the 0 di- rection at the surface ( z k d ) increasing from the edges toward the center ( 0 = 0). This orientation in the &direction reduces Anrs (= n, - ns) by in-
, -1 0
e/w - Figure 8. Apparent birefringence distribution in the re- plane of a quenched rod (0) and a rod (=cross-section) cut out of a disk quenched under the same conditions (0). The thickness of the rods is 2w.
600 WIMBERGER-FRIEDL
creasing ne. The results of the rod quenching thus prove that the frozen-in orientation is indeed in- duced by the cooling stresses themselves and not by the sample preparation previous to the quench.
The numerical calculations predict a uniform bi- refringence in the rz-plane of the samples of about 1.5 X lo-* and about 3-4 X in the cases of Ti = 160 and 180°C, respectively, with T, = 6OoC. This is in qualitative agreement with the experimental findings, but the predicted birefringence level is lower than that found experimentally. (Compare Figs. 5 and 6.) The reason lies obviously in the lim- ited applicability of the elastic constitutive model employed. Before release a tensile stress level of more than 20 MPa is predicted. This comes quite close to the yield stress. Because of the viscoelastic nature of the polymer, it is not very probable that such high stresses will be reached at all. Previously, differences between the predicted and found orien- tation contributions to birefringence were ascribed to stress relaxation accompanied by the build-up of 0rientati0n.l~ Because of the high stress level before release, this effect is expected to be more important in constrained quenching and is the reason for the underprediction of the birefringence by the calcu- lations.
Injection Molding
From the experiments on constrained quenching, we have learned that in the case of adhesion of the polymer to the wall only very low levels of residual stresses can be expected. In injection molding the melt temperatures are much higher than those ap- plied in the quench experiments. In general a compression stage follows the filling stage of the in- jection-molding cycle in which the material is pressed against the mold walls and shrinkage is op- posed. For both reasons, wall adhesion can be ex- pected during the major part of the molding cycle. However, during the compression stage, when the polymer vitrifies from the wall towards the core, the pressure level changes rather quickly. Consequently, consecutive layers vitrify under different formation pressures. Because of the wall adhesion the surface layers will not be compressed according to the hy- drostatic pressure in the core, since the wall will take up the compressive stress components parallel to the wall. Only the normal stress in the z-direction will be equal to the pressure in the molten core. This means that, when the pressure decays, layers which vitrified in the meantime will try to expand more than those vitrified earlier and under lower pressure. This expansion will be opposed by the top layers
leading to residual stresses which are compressive in those layers which vitrify at the highest pres- sure.2,15,16 In the absence of wall adhesion, pressure variations during the vitrification would not lead to residual stresses as long as quasiequilibrium pvT- behavior is assumed. The effect of the formation pressure on the final “frozen-in’) density is regarded as a second-order effect as far as residual stresses are concerned.
When the pressure drops to zero and the thermal shrinkage is not yet completed this will inevitably lead to release from the wall. However, this release will also change the thermal boundary conditions in an unpredictable way. In any event, the cooling rate will drop considerably. Consequently, the still hot core will even heat up the surface layers again. In particular, such a “complete” release can be expected near edges where the shrinkage cannot be compen- sated locally by mold elasticity because of three-di- mensional cooling.
To put it simply: with wall adhesion one can ex- pect very low thermally induced but significant pressure-induced residual stresses; without adhesion one will have no effective quench. But there is also the possibility of an intermediate condition, where one has a positive pressure, which means good ther- mal contact but bad adhesion on a lubricated surface. In that case the polymer can slip along the mold surface and one would have conditions comparable to the free quench. This slippage could also be cou- pled to a maximum “yield)’ stress above which adhesion is lost and friction occurs.
In order to investigate the thermally induced re- sidual stresses and orientation in injection-molded PC, experiments were carried out with a flat-plate geometry, as shown in Fig. 2. The molding conditions were chosen such that the flow-induced orientation would be a minimum. With a high injection speed and no separate packing stage, the part of the spec- imen which solidifies under shear stresses in general can be confined to a thin surface layer. In Figure 9 the pressure recorded by the four transducers in the mold is shown for the case of a high injection speed of 25.4 cm3/s (ca. 36 cm/s flow-front speed) and a mold temperature of 6OoC. No separate packing pressure was applied, but the changeover from the filling to the packing stage was chosen so that a pressure peak occurred, as can be seen in Figure 9. This assures complete filling of the cavity. One can see that only during the filling stage (left of the peak) is there a pressure gradient in the flow direction. After the completion of filling all pressure curves coincide, so that no shear stresses will be present within the polymer.
BIREFRINGENCE IN POLYCARBONATE. I11 601
! I - P1 1 I 80 (.o p.
60
40
20
0 I I I I I I
t/S - 0 0.5 1.0 1.5
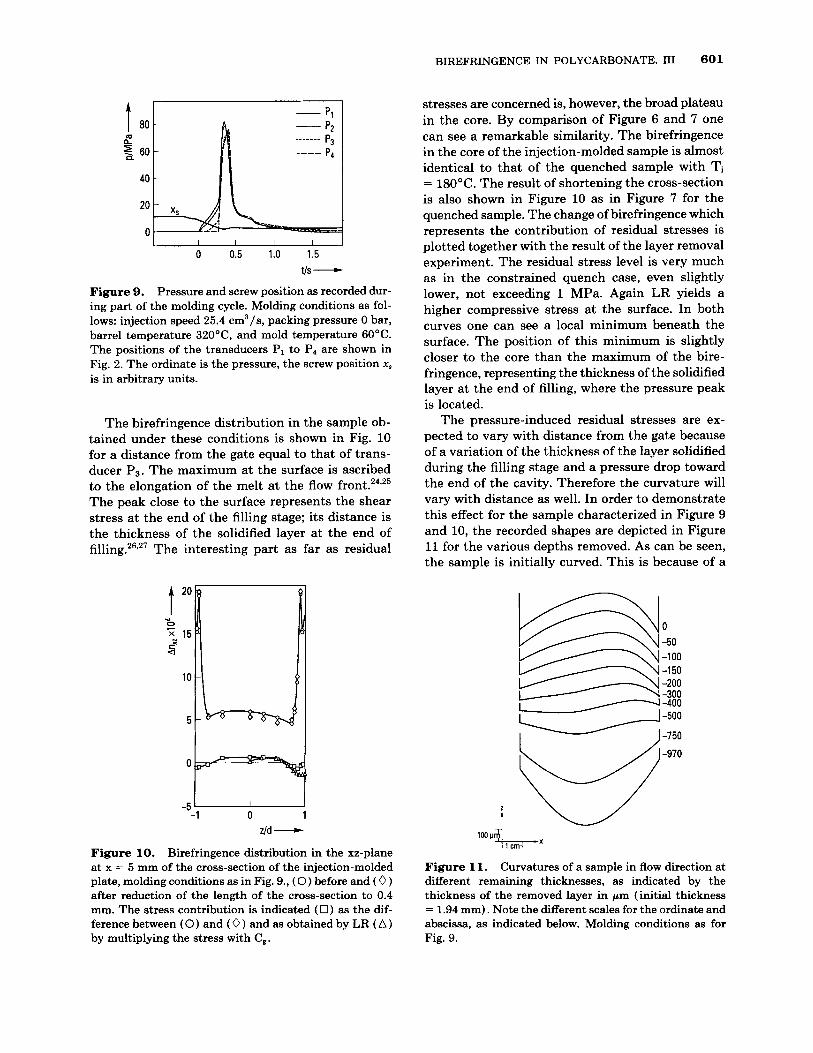
Figure 9. Pressure and screw position as recorded dur- ing part of the molding cycle. Molding conditions as fol- lows: injection speed 25.4 cm3/s, packing pressure 0 bar, barrel temperature 320°C, and mold temperature 60°C. The positions of the transducers PI to P4 are shown in Fig. 2. The ordinate is the pressure, the screw position xS is in arbitrary units.
The birefringence distribution in the sample ob- tained under these conditions is shown in Fig. 10 for a distance from the gate equal to that of trans- ducer PB. The maximum at the surface is ascribed to the elongation of the melt a t the flow The peak close to the surface represents the shear stress a t the end of the filling stage; its distance is the thickness of the solidified layer at the end of filling.26,27 The interesting part as far as residual
stresses are concerned is, however, the broad plateau in the core. By comparison of Figure 6 and 7 one can see a remarkable similarity. The birefringence in the core of the injection-molded sample is almost identical to that of the quenched sample with Ti
= 18OoC. The result of shortening the cross-section is also shown in Figure 10 as in Figure 7 for the quenched sample. The change of birefringence which represents the contribution of residual stresses is plotted together with the result of the layer removal experiment. The residual stress level is very much as in the constrained quench case, even slightly lower, not exceeding 1 MPa. Again LR yields a higher compressive stress at the surface. In both curves one can see a local minimum beneath the surface. The position of this minimum is slightly closer to the core than the maximum of the bire- fringence, representing the thickness of the solidified layer at the end of filling, where the pressure peak is located.
The pressure-induced residual stresses are ex- pected to vary with distance from the gate because of a variation of the thickness of the layer solidified during the filling stage and a pressure drop toward the end of the cavity. Therefore the curvature will vary with distance as well. In order to demonstrate this effect for the sample characterized in Figure 9 and 10, the recorded shapes are depicted in Figure 11 for the various depths removed. As can be seen, the sample is initially curved. This is because of a
-5 -1 0 1
z/d - Figure 10. Birefringence distribution in the xz-plane at x = 5 mm of the cross-section of the injection-molded plate, molding conditions as in Fig. 9., (0) before and ( 0 ) after reduction of the length of the cross-section to 0.4 mm. The stress contribution is indicated (0) as the dif- ference between (0) and (0) and as obtained by LR ( A ) by multiplying the stress with C,.
i Figure 11. Curvatures of a sample in flow direction at different remaining thicknesses, as indicated by the thickness of the removed layer in pm (initial thickness = 1.94 mm) . Note the different scales for the ordinate and abscissa, as indicated below. Molding conditions as for Fig. 9.
602 WIMBERGER-FRIEDL
thermal asymmetry of 2°C in the mold across the gap, which is also the reason for the asymmetry in the birefringence distribution of Figure 10. The ini- tial curvature increases with distance from the gate (from left to right). By removing layers subse- quently the curvature decreases, but the relative variation of the curvature along the sample in- creases. Closer to the gate the change of sign of the curvature occurs a t smaller distances from the sur- face than at the end of the flow path. Towards the core the curvatures become more homogeneous again. An analysis of different parts of the sample would obviously lead to different results. For an ex- act analysis one would have to use the local second derivative of the shape instead of the total deflection. The stress distribution shown in Figure 10 was ob- tained from the average curvature over the total length of the sample. Consequently, the calculated stress distribution will be damped as compared to the exact local stress distribution. For the calculation of the gapwise residual stress distribution, the initial curvature is subtracted and the gapwise curvature distribution is fitted with a fourth-degree polyno- mial. Equibiaxiality is assumed. The latter assump- tion is justified, since hardly any anisotropy was in- troduced in the samples, as can be concluded from the birefringence distribution in Figure 10. Recently, van Hastenberg et a1." reported residual stress dis- tributions in samples of the same geometry, distin- guishing three zones in the flow direction. For PC they found only minor differences along the flow path.
In the broad plateau of the birefringence distri- bution in the core of the example shown in Figure 10 a contribution of shear flow can be excluded be- cause the principal direction of the refractive index tensor is parallel to the wall.25 The distribution is the same as in the constrained quench. This means that this birefringence is due to molecular orienta- tion which is induced by tensile thermal stresses during cooling in the mold. Because of the similarity with quenching, one might extrapolate the birefrin- gence from the plateau toward the surface and in this way distinguish the flow-induced contribution from the total birefringence. This distinction is im- portant also for the verification of injection-mould- ing simulation programs. In the case shown in Figure 11, the contribution of thermally induced orientation is on the average 5 X which is more than twice that of the flow-induced orientation (averaged over the thickness). In contrast to the flow-induced fro- zen-in orientation, the thermal contribution is equi- biaxial (except at the edges of the sample), however.
In constrained quench the final temperature was
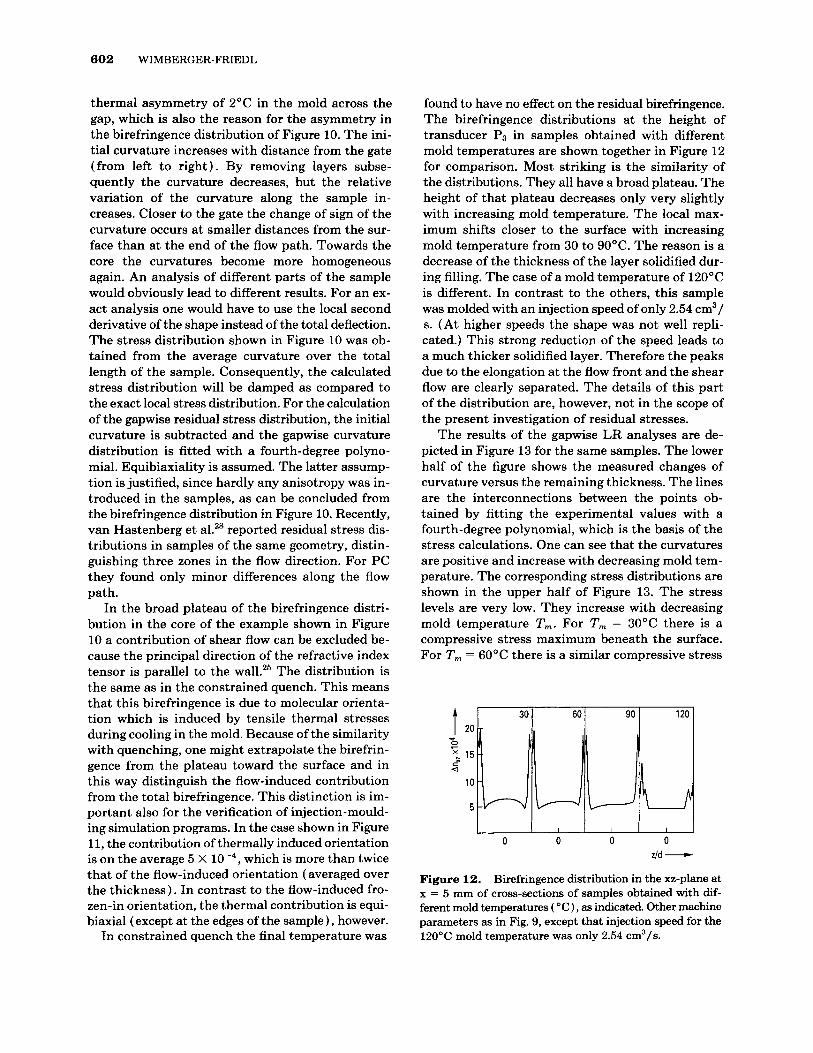
found to have no effect on the residual birefringence. The birefringence distributions at the height of transducer P3 in samples obtained with different mold temperatures are shown together in Figure 12 for comparison. Most striking is the similarity of the distributions. They all have a broad plateau. The height of that plateau decreases only very slightly with increasing mold temperature. The local max- imum shifts closer to the surface with increasing mold temperature from 30 to 90°C. The reason is a decrease of the thickness of the layer solidified dur- ing filling. The case of a mold temperature of 120°C is different. In contrast to the others, this sample was molded with an injection speed of only 2.54 cm3/ s. (At higher speeds the shape was not well repli- cated.) This strong reduction of the speed leads to a much thicker solidified layer. Therefore the peaks due to the elongation at the flow front and the shear flow are clearly separated. The details of this part of the distribution are, however, not in the scope of the present investigation of residual stresses.
The results of the gapwise LR analyses are de- picted in Figure 13 for the same samples. The lower half of the figure shows the measured changes of curvature versus the remaining thickness. The lines are the interconnections between the points ob- tained by fitting the experimental values with a fourth-degree polynomial, which is the basis of the stress calculations. One can see that the curvatures are positive and increase with decreasing mold tem- perature. The corresponding stress distributions are shown in the upper half of Figure 13. The stress levels are very low. They increase with decreasing mold temperature T,. For T, = 30°C there is a compressive stress maximum beneath the surface. For T, = 60°C there is a similar compressive stress
0 0 0 0 z/d -
Figure 12. Birefringence distribution in the xz-plane at x = 5 mm of cross-sections of samples obtained with dif- ferent mold temperatures ( "C ) , as indicated. Other machine parameters as in Fig. 9, except that injection speed for the 12OOC mold temperature was only 2.54 cm3/s.
BIREFRINGENCE IN POLYCARBONATE. I11 603
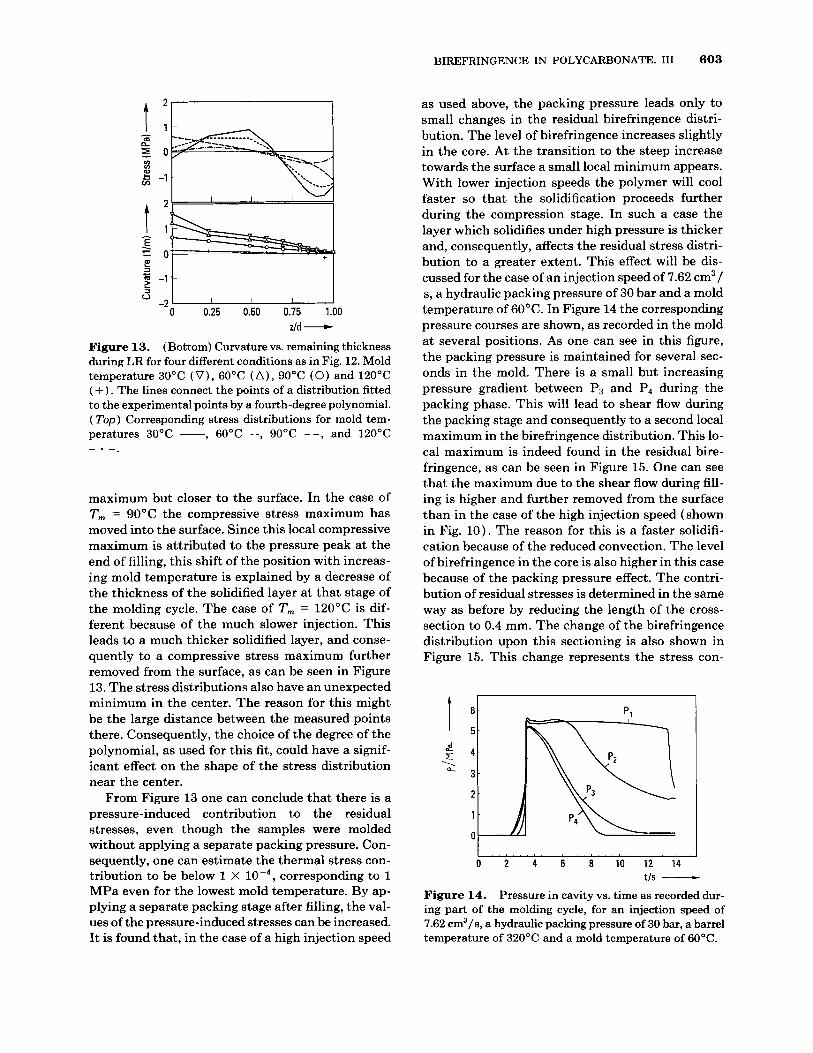
z/d - Figure 13. (Bottom) Curvature vs. remaining thickness during LR for four different conditions as in Fig. 12. Mold temperature 30°C ( V ) , 60°C ( A ) , 90°C (0 ) and 120°C (+ ) . The lines connect the points of a distribution fitted to the experimental points by a fourth-degree polynomial. ( T o p ) Corresponding stress distributions for mold tem- peratures 30°C -, 60°C --, 90°C --, and 120°C - . -
maximum but closer to the surface. In the case of T, = 90°C the compressive stress maximum has moved into the surface. Since this local compressive maximum is attributed to the pressure peak at the end of filling, this shift of the position with increas- ing mold temperature is explained by a decrease of the thickness of the solidified layer a t that stage of the molding cycle. The case of T, = 120°C is dif- ferent because of the much slower injection. This leads to a much thicker solidified layer, and conse- quently to a compressive stress maximum further removed from the surface, as can be seen in Figure 13. The stress distributions also have an unexpected minimum in the center. The reason for this might be the large distance between the measured points there. Consequently, the choice of the degree of the polynomial, as used for this fit, could have a signif- icant effect on the shape of the stress distribution near the center.
From Figure 13 one can conclude that there is a pressure-induced contribution to the residual stresses, even though the samples were molded without applying a separate packing pressure. Con- sequently, one can estimate the thermal stress con- tribution to be below 1 X lop4, corresponding to 1 MPa even for the lowest mold temperature. By ap- plying a separate packing stage after filling, the val- ues of the pressure-induced stresses can be increased. It is found that, in the case of a high injection speed
as used above, the packing pressure leads only to small changes in the residual birefringence distri- bution. The level of birefringence increases slightly in the core. At the transition to the steep increase towards the surface a small local minimum appears. With lower injection speeds the polymer will cool faster so that the solidification proceeds further during the compression stage. In such a case the layer which solidifies under high pressure is thicker and, consequently, affects the residual stress distri- bution to a greater extent. This effect will be dis- cussed for the case of an injection speed of 7.62 cm3/ s, a hydraulic packing pressure of 30 bar and a mold temperature of 6OoC. In Figure 14 the corresponding pressure courses are shown, as recorded in the mold at several positions. As one can see in this figure, the packing pressure is maintained for several sec- onds in the mold. There is a small but increasing pressure gradient between P3 and P4 during the packing phase. This will lead to shear flow during the packing stage and consequently to a second local maximum in the birefringence distribution. This lo- cal maximum is indeed found in the residual bire- fringence, as can be seen in Figure 15. One can see that the maximum due to the shear flow during fill- ing is higher and further removed from the surface than in the case of the high injection speed (shown in Fig. 10). The reason for this is a faster solidifi- cation because of the reduced convection. The level of birefringence in the core is also higher in this case because of the packing pressure effect. The contri- bution of residual stresses is determined in the same way as before by reducing the length of the cross- section to 0.4 mm. The change of the birefringence distribution upon this sectioning is also shown in Figure 15. This change represents the stress con-
0 2 4 6 8 1 0 1 2 1 4 tls -
Figure 14. Pressure in cavity vs. time as recorded dur- ing part of the molding cycle, for an injection speed of 7.62 cm3/s, a hydraulic packing pressure of 30 bar, a barrel temperature of 320°C and a mold temperature of 60°C.
604 WIMBERGER-FRIEDL
I I -1 0 1
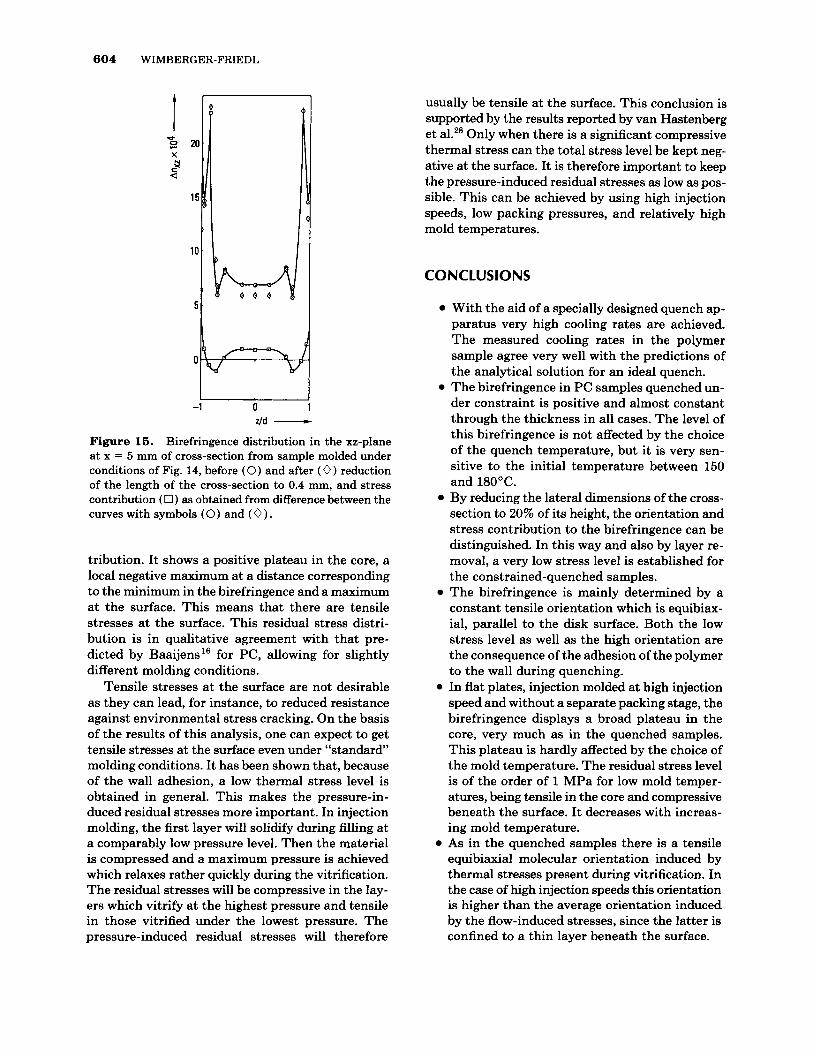
z/d - Figure 15. Birefringence distribution in the xz-plane at x = 5 mm of cross-section from sample molded under conditions of Fig. 14, before (0) and after ( 0 ) reduction of the length of the cross-section to 0.4 mm, and stress contribution (0 ) as obtained from difference between the curves with symbols (0) and (0).
tribution. It shows a positive plateau in the core, a local negative maximum at a distance corresponding to the minimum in the birefringence and a maximum at the surface. This means that there are tensile stresses a t the surface. This residual stress distri- bution is in qualitative agreement with that pre- dicted by Baaijens16 for PC, allowing for slightly different molding conditions.
Tensile stresses a t the surface are not desirable as they can lead, for instance, to reduced resistance against environmental stress cracking. On the basis of the results of this analysis, one can expect to get tensile stresses a t the surface even under ((standard" molding conditions. It has been shown that, because of the wall adhesion, a low thermal stress level is obtained in general. This makes the pressure-in- duced residual stresses more important. In injection molding, the first layer will solidify during filling at a comparably low pressure level. Then the material is compressed and a maximum pressure is achieved which relaxes rather quickly during the vitrification. The residual stresses will be compressive in the lay- ers which vitrify a t the highest pressure and tensile in those vitrified under the lowest pressure. The pressure-induced residual stresses will therefore
usually be tensile a t the surface. This conclusion is supported by the results reported by van Hastenberg et a1.28 Only when there is a significant compressive thermal stress can the total stress level be kept neg- ative at the surface. It is therefore important to keep the pressure-induced residual stresses as low as pos- sible. This can be achieved by using high injection speeds, low packing pressures, and relatively high mold temperatures.
CONCLUSIONS
With the aid of a specially designed quench ap- paratus very high cooling rates are achieved. The measured cooling rates in the polymer sample agree very well with the predictions of the analytical solution for an ideal quench. The birefringence in PC samples quenched un- der constraint is positive and almost constant through the thickness in all cases. The level of this birefringence is not affected by the choice of the quench temperature, but it is very sen- sitive to the initial temperature between 150 and 180°C. By reducing the lateral dimensions of the cross- section to 20% of its height, the orientation and stress contribution to the birefringence can be distinguished. In this way and also by layer re- moval, a very low stress level is established for the constrained-quenched samples. The birefringence is mainly determined by a constant tensile orientation which is equibiax- ial, parallel to the disk surface. Both the low stress level as well as the high orientation are the consequence of the adhesion of the polymer to the wall during quenching. In flat plates, injection molded at high injection speed and without a separate packing stage, the birefringence displays a broad plateau in the core, very much as in the quenched samples. This plateau is hardly affected by the choice of the mold temperature. The residual stress level is of the order of 1 MPa for low mold temper- atures, being tensile in the core and compressive beneath the surface. It decreases with increas- ing mold temperature. As in the quenched samples there is a tensile equibiaxial molecular orientation induced by thermal stresses present during vitrification. In the case of high injection speeds this orientation is higher than the average orientation induced by the flow-induced stresses, since the latter is confined to a thin layer beneath the surface.
BIREFRINGENCE IN POLYCARBONATE. I11 605
For a correct prediction of frozen-in molecular orientation numerical simulation programs must take into account the effects of thermal strains above T,. By applying a packing pressure a local com- pressive stress maximum is created at a dis- tance from the surface, which corresponds to the thickness of the solidified layer at the mo- ment of compression at the end of filling. Be- cause of the low thermal stress level this pres- sure contribution can become predominant. In this way highly undesirable tensile stresses are induced at the surface. This effect will be stronger with lower injection speed and higher packing pressure.
The author is very grateful to Ir. D. Samoy and W. de Natris from Philips-CCP for their help with the injection- molding experiments and H. van Vlerken and J. G. de Bruin for the careful preparation of the cross-sections.
REFERENCES AND NOTES
1. R. S. Spencer, and G. D. Gilmore, Mod. Plast., 9 7 ,
2. H. Wiegand and H. Vetter, Kunststoffe, 5 6 , 761
3. H. Wiegand and H. Vetter, Kunststofle, 5 7 , 276
4. G. Wubken, Plastverurbeiter, 2 6 , 17 (1975). 5. A. Siegmann, A. Buchman, and S. Kenig, Polym. Eng.
6. R. G. Treuting and W. T. Read, J. Appl. Phys., 2 2 ,
7. J. R. White, Polym. Test., 4, 165 (1984).
( 1959).
(1966).
( 1967).
Sci., 22,560 (1982).
130 (1951).
8. J. L. S. Wales, J. van Leeuwen, and R. van der Vijgh,
9. M. Fleipner, Kunststofle, 6 3 , 636 ( 1973). Polym. Eng. Sci., 12, 358 (1972).
10. M. R. Kamal and V. Tan, Polym. Eng. Sci., 19,558
11. A, I. Isayev, Polym. Eng. Sci., 23 , 271 (1983). 12. L. C. E. Struik, Polym. Eng. Sci., 18, 799 (1978). 13. R. Wimberger-Friedl and J. G. de Bruin, J. Polym.
14. J. R. Saffell and A. H. Windle, J. Appl. Polym. Sci.,
15. G. Titomanlio, V. Drucato, and M. R. Kamal, Intern.
16. F. P. T. Baaijens, Rheol. Acta, 30 , 284 (1991). 17. R. Wimberger-Friedl, Rheol. Acta, 30 , 329 ( 1991). 18. R. Wimberger-Fried1 and J. G. de Bruin, Rheol. Acta,
19. A. A. M. Flaman, Thesis, Eindhoven (1990). 20. R. Wimberger-Friedl and J. G. de Bruin, J. Polym.
21. H. S . Carslaw and T. C. Jaeger, Conduction of Heat
22. R. Wimberger-Fried1 and R. D. H. M. Hendriks, Poly-
23. N. J. Mills, J. Muter. Sci., 17, 558 (1982). 24. Z. Tadmor, J. Appl. Polym. Sci., 18, 1753 (1974). 25. R. Wimberger-Friedl, Polym. Eng. Sci., 30, 813
(1990). 26. H. Janeschitz-Kriegl, Rheol. Acta, 16, 327 (1977);
18,693 ( 1979). 27. A. I. Isayev and C. A. Hieber, Rheol. Acta, 19, 168
( 1980). 28. C. H. van Hastenberg, P. C. Wildervanck, A. J. H.
Leenen, and G. G. J. Schennink, Polym. Eng. Sci., 32, 506 (1992).
( 1979).
Sci.-B Polym. Phys., 31 1041 (1993).
25,1117 (1980).
Polym. Proc., 1 , 55 ( 1987).
30,419 (1991).
Sci. Polym. Phys., 31 1051 (1993).
in Solids, Clarendon Press, Oxford 1959.
mer, 30,1143 (1989).
Received April 27, 1993 Accepted June 15, 1993