Embed Size (px)
Citation preview
A G R I C U L T U R A L A N D F O O D S C I E N C E
Vol. 16 (2007): 157-169
157
© Agricultural and Food Science Manuscript received March 2007
Molecular genetic variation in sheep of the central Volga area inhabited by Finno-Ugric peoples
Miika Tapio, Mikhail OzerovMTT Agrifood Research Finland, Biotechnology and Food Research, FI-31600 Jokioinen, Finland
Haldja ViinalassInstitute of Veterinary Medicine and Animal Sciences of the Estonian University of Life Sciences,
51014 Tartu, Estonia
Tatyana KiseliovaAll-Russian Research Institute of Animal Genetics and Breeding, Russian Academy of Agricultural Sciences,
189620 St. Petersburg-Pushkin, Russia
Juha KantanenMTT Agrifood Research Finland, Biotechnology and Food Research, FI-31600 Jokioinen, Finland,
email: [email protected]
Based on morphology, native northern European sheep breeds belong to the short tailed type, of which the Romanov is the only native example still distributed in northwest Russia. Besides this, there exist local sheep populations kept by Finno-Ugric peoples in the central Volga region, which represent additional genetic resources in the area. Four sheep populations from the central Volga region were genotyped for 20 microsatellites and compared with geographically proximate breeds (Estonian Whitehead and Blackhead, the Finnsheep and an exported and a native population of Russian Romanov) and with local populations in Estonia, Finland and Russian Karelia. Between-breed analyses including admixture analysis using molecular genetic markers and the phenotypic characteristics indicated that the Volgaic populations have not remained pure. The Viena population from Russian Karelia, the Romanov breed and, to some extent, the Komi population, have escaped extensive mixing, making them most attractive for conservation pro-grammes. The study compared imported and native Romanov breed populations and the results suggest that the diversity parameters are markedly similar in these two populations.
Key-words: Sheep, genetic resource, microsatellite, Finno-Ugric
A G R I C U L T U R A L A N D F O O D S C I E N C E
Tapio M. et al. Molecular analysis of Volgaic sheep varieties
158
A G R I C U L T U R A L A N D F O O D S C I E N C E
Vol. 16 (2007): 157-169
159
Introduction
The northern European area, extending from Iceland and Fennoscandia to the Urals, has ancient indig-enous sheep that belong to the northern short-tailed breed group. In contrast, the majority of sheep in other parts of Europe belong to thin-tailed breed groups with long or medium-long tails (e.g. Ryder 1983). The short-tailed breeds in the Nordic and Baltic countries are well documented (e.g. FAO 2006) and an extensive set of these breeds were recently molecularly characterized and assessed for conservation prioritisation (Tapio et al. 2005b, Tapio 2006). Among the Russian short-tailed sheep the characterization is lacking and the Romanov breed is the only short-tailed sheep type that has been documented in detail (Semyonov and Selkin 1989). In recent molecular analysis (Tapio et al. 2005b, Tapio 2006) this breed was, however, represented by an imported Romanov population in Lithuania. That study also assessed one local non-institutionalised sheep population, the Viena sheep, from Russian Karelia. In our terminology, ‘an institutionalised breed’ has a herd book or other pedigree recording system and its’ breed characters are determined and controlled by a breeding society. The Romanov and the Viena sheep have been suggested to be of high conservation value (Tapio et al. 2005b). The study, however, had two limitations. Firstly, the sheep in the vast area lying between Moscow and the Urals were not included. Secondly, the Romanov sample was taken from outside the country of origin and the population might have experienced a genetic bottle-neck, resulting in decreased variation and, possibly, resulting in a wrongly inferred conservation value. For these reasons, there is a need to characterize Russian short-tailed sheep more extensively.
The Romanov breed is the only Russian institu-tionalised sheep breed in the northern short-tailed breed group. The main area of distribution of the breed has been the Yaroslavl Region north of Mos-cow. Earlier, there was another short-tailed breed, the Nolinsk, in the Kirov Region further to the east (Litovchenko and Yesaulova 1972). Although the Nolinsk became extinct, the central Volga area has several non-institutionalised sheep types without
herd books. The non-institutionalised sheep types could be very important for the maintenance of Russian sheep genetic resources as the Nolinsk became extinct and the number of pure-bred Ro-manovs in Russia has sharply decreased (Marzanov and Samorukov 2006).
The central Volga area contains Finno-Ugric re-publics. Although the Finno-Ugric peoples in the area are linguistically close to other Finno-Ugric peoples, such as the Finns and the Estonians, ge-netic studies support genetic propinquity with the geographically neighbouring (Finno-Ugric or non-Finno-Ugric) peoples (Rosser et al. 2000, Bermi-sheva et al. 2002). This does not support the idea that Finno-Ugric peoples would have remained as completely isolated islands separated from the surrounding Slavic populations. Thus, the Finno-Ugric and Russian areas in the north should form a continuum where genetic and cultural links have crossed the ethnic barriers. Consequently, the genetic variation in native sheep may have been shaped by isolation by distance, and the sheep owned by Finno-Ugric peoples should be analyzed together with the Romanov sheep.
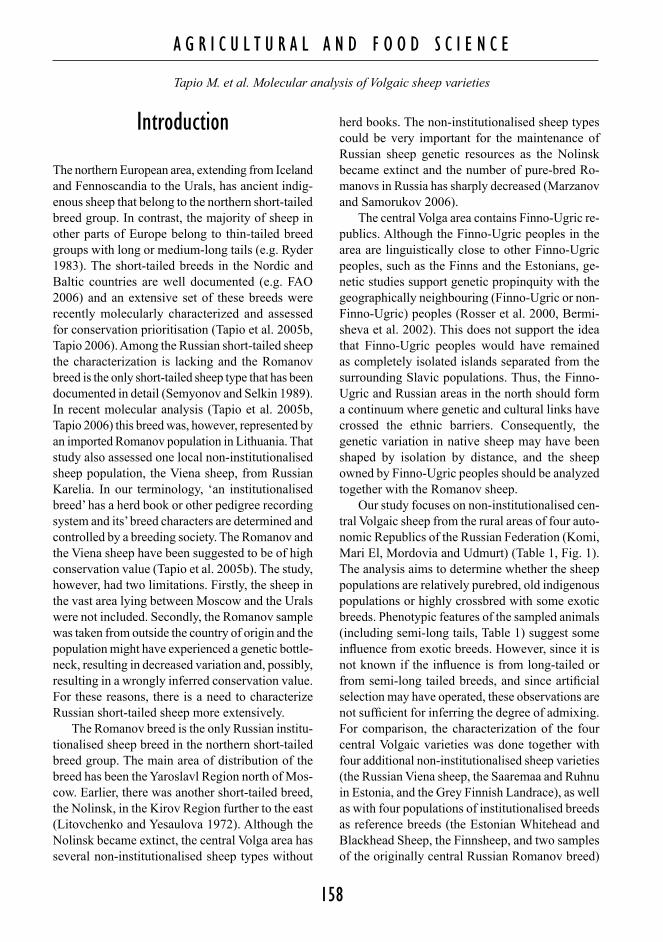
Our study focuses on non-institutionalised cen-tral Volgaic sheep from the rural areas of four auto-nomic Republics of the Russian Federation (Komi, Mari El, Mordovia and Udmurt) (Table 1, Fig. 1). The analysis aims to determine whether the sheep populations are relatively purebred, old indigenous populations or highly crossbred with some exotic breeds. Phenotypic features of the sampled animals (including semi-long tails, Table 1) suggest some influence from exotic breeds. However, since it is not known if the influence is from long-tailed or from semi-long tailed breeds, and since artificial selection may have operated, these observations are not sufficient for inferring the degree of admixing. For comparison, the characterization of the four central Volgaic varieties was done together with four additional non-institutionalised sheep varieties (the Russian Viena sheep, the Saaremaa and Ruhnu in Estonia, and the Grey Finnish Landrace), as well as with four populations of institutionalised breeds as reference breeds (the Estonian Whitehead and Blackhead Sheep, the Finnsheep, and two samples of the originally central Russian Romanov breed)
A G R I C U L T U R A L A N D F O O D S C I E N C E
Tapio M. et al. Molecular analysis of Volgaic sheep varieties
158
A G R I C U L T U R A L A N D F O O D S C I E N C E
Vol. 16 (2007): 157-169
159
(Table 1, Fig. 1). The Estonian reference breeds are partly of local origin, but have been graded to British breeds and later crossed with some other common west European breeds. They represent “cosmopolitan western breeds” in the current study. The Finnsheep and the Romanov are predominant native breeds of their regions and are included as purebred local reference breeds. The currently de-scribed Russian Romanov population is the first sample of the breed from the site of origin analyzed for its microsatellite variation.
Material and methods
Genetic variation at 20 microsatellite loci (Table 2) was assessed in 84 individuals belonging to four Volgaic local populations (Komi, Mari, Mordovian
and Udmurtian). Blood samples (Table 1, Fig. 1) were taken from sheep from several flocks and vil-lages and sampling within a flock was random. In addition, 27 Romanov sheep were sampled in the Yaroslavl region in central Russia, which constitutes the geographical origin of the breed. The remain-ing data for the 225 individuals from 8 populations (Estonian Whitehead, Estonian Blackhead, Estonian Ruhnu and Estonian Saaremaa, Finnsheep, Grey Finnish Landrace, and Romanov in Lithuania) and the sample preparation and semiautomatic fragment typing methods were described by Tapio et al. (2003, 2005a, 2005b).
Genetic variability was quantified as the total number of alleles, unbiased expected heterozygos-ity or gene diversity (Nei 1987), and mean allelic richness (El Mousadik and Petit 1996) correspond-ing to the mean of the expected numbers of alleles over loci for a sample size of 20 diploid individuals or 40 chromosomes (i.e. r[40]). These estimates
Fig. 1. Geographical locations of the studied north-eastern European sheep populations.
A G R I C U L T U R A L A N D F O O D S C I E N C E
Tapio M. et al. Molecular analysis of Volgaic sheep varieties
160
A G R I C U L T U R A L A N D F O O D S C I E N C E
Vol. 16 (2007): 157-169
161
were calculated using FSTAT 2.932 (Goudet 1995). The same software was used to measure and test among-breed and within-breed fixation indices, θ and f of Weir and Cockerham (1984) correspond-ing to Wright’s FST and FIS, respectively. Theta (θ) quantifies excess of homozygotes in the total population due to population differentiation, and
small-f (f) quantifies the excess of homozygotes within each population or the average over the populations.
The structure of genetic relationship among populations was investigated to discover whether some local sheep varieties appear as intermedi-ates of the reference breeds. The Volgaic region
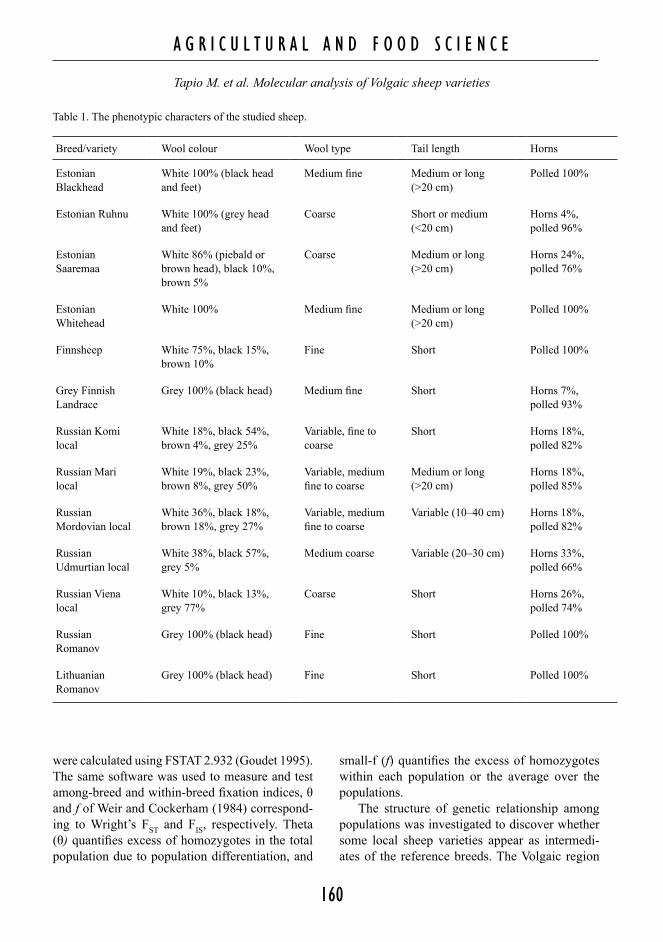
Breed/variety Wool colour Wool type Tail length Horns
Estonian Blackhead
White 100% (black head and feet)
Medium fine Medium or long (>20 cm)
Polled 100%
Estonian Ruhnu White 100% (grey head and feet)
Coarse Short or medium (<20 cm)
Horns 4%, polled 96%
Estonian Saaremaa
White 86% (piebald or brown head), black 10%, brown 5%
Coarse Medium or long (>20 cm)
Horns 24%, polled 76%
Estonian Whitehead
White 100% Medium fine Medium or long (>20 cm)
Polled 100%
Finnsheep White 75%, black 15%, brown 10%
Fine Short Polled 100%
Grey Finnish Landrace
Grey 100% (black head) Medium fine Short Horns 7%, polled 93%
Russian Komi local
White 18%, black 54%, brown 4%, grey 25%
Variable, fine to coarse
Short Horns 18%, polled 82%
Russian Mari local
White 19%, black 23%, brown 8%, grey 50%
Variable, medium fine to coarse
Medium or long (>20 cm)
Horns 18%, polled 85%
Russian Mordovian local
White 36%, black 18%, brown 18%, grey 27%
Variable, medium fine to coarse
Variable (10–40 cm) Horns 18%, polled 82%
Russian Udmurtian local
White 38%, black 57%, grey 5%
Medium coarse Variable (20–30 cm) Horns 33%, polled 66%
Russian Viena local
White 10%, black 13%, grey 77%
Coarse Short Horns 26%, polled 74%
Russian Romanov
Grey 100% (black head) Fine Short Polled 100%
Lithuanian Romanov
Grey 100% (black head) Fine Short Polled 100%
Table 1. The phenotypic characters of the studied sheep.
A G R I C U L T U R A L A N D F O O D S C I E N C E
Tapio M. et al. Molecular analysis of Volgaic sheep varieties
160
A G R I C U L T U R A L A N D F O O D S C I E N C E
Vol. 16 (2007): 157-169
161
is located east of the geographical origin of any of the reference breeds, including the Romanov (Fig. 1). Assuming isolation by distance, the purebred native sheep populations should form a geneti-cally remote group, while an intermediate position would suggest them to be crossbreds. Relationship structure was explored using principal components analysis (PCA), NeigborNet (Bryant and Moulton 2004) and the Population Graph method (Dyer and Nason 2004). When applied to allele frequency data, each successive principal component (PC) aims at explaining the maximum variance in the
allele frequency table. Data explained by separate PCs are uncorrelated. Analysis was performed for correlations of standardized allele frequencies ac-cording to Cavalli-Sforza et al. (1994) using Ade-4 (Thioulouse et al. 1997). NeighborNet is similar to the common Neigbor joining method, but by showing reticulations it can represent alternative trees in presence of distinct phylogenetic signals, which may arise, for instance, from gene flow between populations (see Bryant and Moulton 2004 for details). NeighborNet was constructed using SplitsTree 4 (Huson and Bryant 2006) and was based on Chord distance (Cavalli-Sforza and Edwards 1967). The Population Graph method explores the covariation in the whole population set. The method initially considers all n(n – 1)/2 links between n populations and it subsequently removes the connections whose exclusion does not significantly reduce the fit between the population network model and the data. Thus, the remain-ing links among the populations are necessary to explain the data, while a missing bond between a pair of populations indicates that the potential similarities in their gene pools are caused indirectly through other connecting populations as described in the network. Network construction was done us-ing an online population graph server (available online at http://dyerlab.bio.vcu.edu/). The network was added on to the PCA plot, with PCA results de-termining the coordinates for the population node. Graph structure was tested using binomial testing described by Dyer and Nason (2004). Graph size and node centrality were explored using Agna 2.1.1 (Benta 2003, available online at http://www.geoci-ties.com/imbenta/agna/). The size of the graph is the largest value among the shortest paths between every pair of populations. Evaluating the closeness of a node to the center of the graph was done us-ing the Bavelas-Leavitt centrality measure (Bave-las 1948). For each node, this measure is the ratio of the sum of the shortest paths to and from the node to the sum of all of the shortest paths in the entire graph.
The allele frequency data of each non-institu-tionalised sheep type was fitted separately to an admixture model using three reference breeds (the Estonian Whitehead, the Finnsheep and the Russian
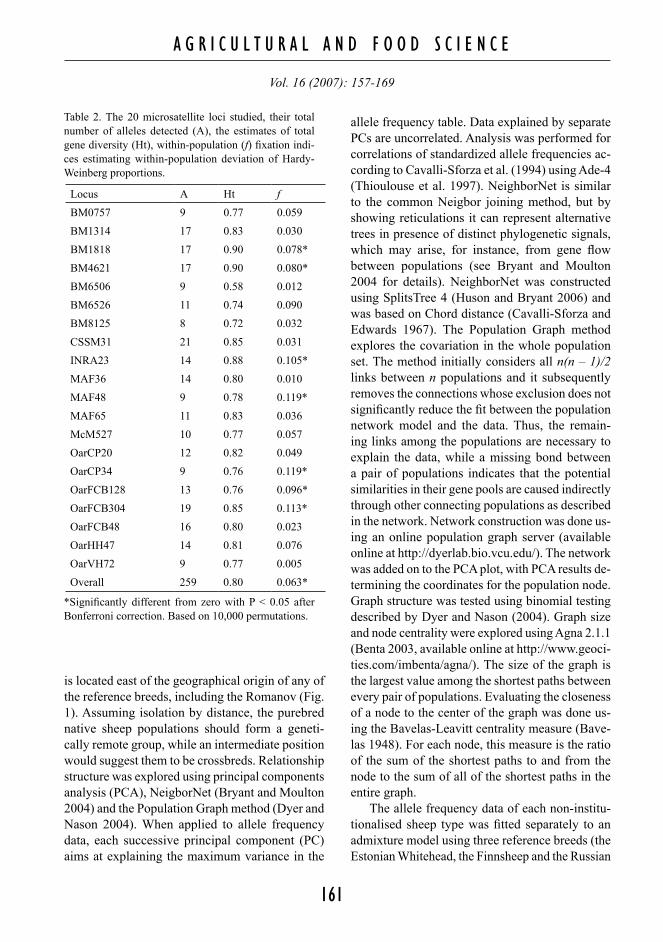
Locus A Ht fBM0757 9 0.77 0.059BM1314 17 0.83 0.030BM1818 17 0.90 0.078*BM4621 17 0.90 0.080*BM6506 9 0.58 0.012BM6526 11 0.74 0.090BM8125 8 0.72 0.032CSSM31 21 0.85 0.031INRA23 14 0.88 0.105*MAF36 14 0.80 0.010MAF48 9 0.78 0.119*MAF65 11 0.83 0.036McM527 10 0.77 0.057OarCP20 12 0.82 0.049OarCP34 9 0.76 0.119*OarFCB128 13 0.76 0.096*OarFCB304 19 0.85 0.113*OarFCB48 16 0.80 0.023OarHH47 14 0.81 0.076OarVH72 9 0.77 0.005Overall 259 0.80 0.063*
Table 2. The 20 microsatellite loci studied, their total number of alleles detected (A), the estimates of total gene diversity (Ht), within-population (f) fixation indi-ces estimating within-population deviation of Hardy-Weinberg proportions.
*Significantly different from zero with P < 0.05 after Bonferroni correction. Based on 10,000 permutations.
A G R I C U L T U R A L A N D F O O D S C I E N C E
Tapio M. et al. Molecular analysis of Volgaic sheep varieties
162
A G R I C U L T U R A L A N D F O O D S C I E N C E
Vol. 16 (2007): 157-169
163
Romanov) as hypothetical parental populations. The admixture model assumes that the parental popula-tions have had the same and a constant population size and that the analyzed population was formed at an undefined time point as a combination of the given parental populations only, which, in turn, had evolved independently for an undefined time prior to the admixture event. Contributions from paren-tal populations were given by the mY estimate of historic admixture (Bertorelle and Excoffier 1998, Dupanloup and Bertorelle 2001) considering only allele frequencies. Estimates were calculated using Admix 2.0 (Dupanloup and Bertorelle 2001) and were based on 1,000 bootstrap resamplings over loci.
Results
In the 336 sheep analyzed 259 alleles were detected at the 20 microsatellite loci (Table 2), averaging 13.0 alleles per locus. The total gene diversity was on average 0.80 over loci. The Estonian Ruhnu was the least variable and the local Udmurtian sheep was the most variable population irrespective of the diversity measure used (Table 3). The within-population gene diversity and allelic richness [r40] ranged from 0.52 to 0.79 and from 3.21 to 6.40, respectively. Significant positive f values for the Estonian Saaremaa local (0.177), Komi local (0.231), Udmurtian local (0.097) and Viena local (0.218) indicate that these populations are subdivided (Table 3). Over the populations, some locus-wise f estimates (Table 3) and the combined f (0.063, P < 0.05) were also significantly positive.
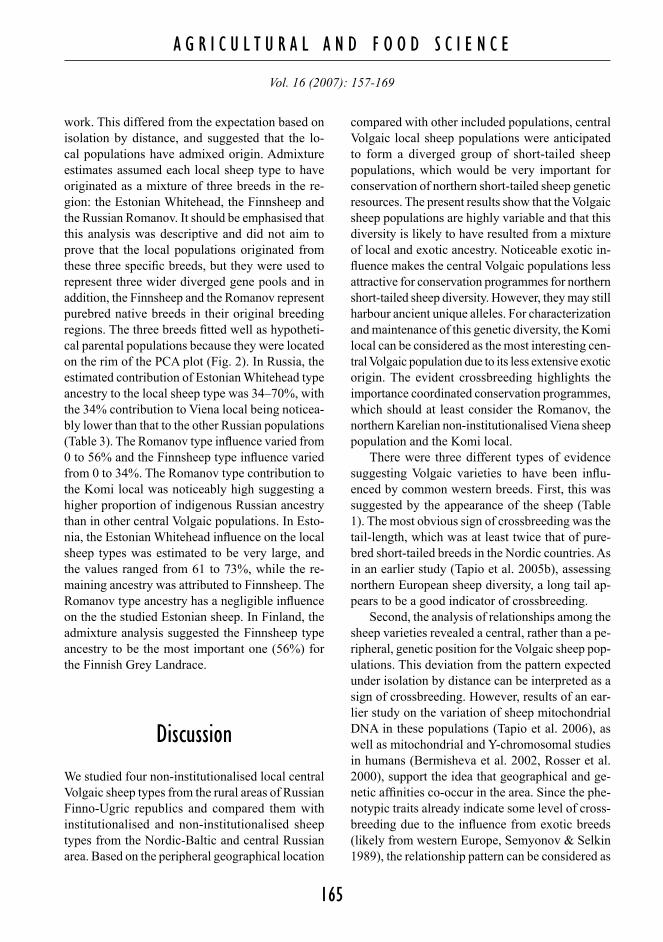
The overall differentiation was substantial: Weir and Cockerham (1984) θ indicated 9.4% of the variation to stem from among population vari-ation. The pairwise differentiation estimates varied from 0.018 (between the Whitehead and Blackhead Sheep in Estonia) to 0.249 (between the Estonian Ruhnu and the Komi local sheep). All pairwise θ values, except the one between the Udmurtian and the Mordovian sheep (0.037), were significantly different from zero. The Ruhnu and the Komi local
were highly diverged from all other populations (Table 4).
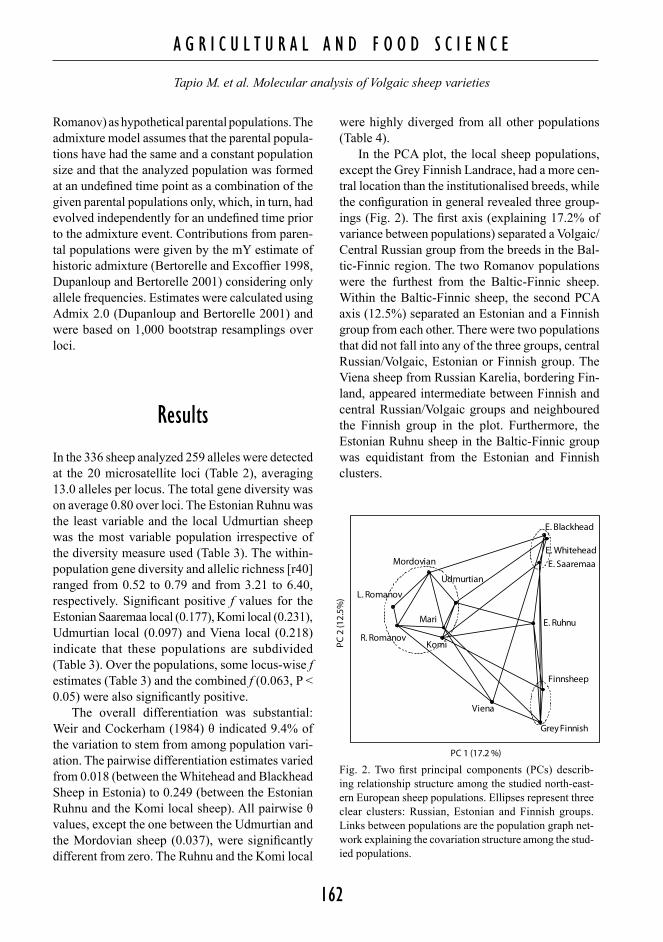
In the PCA plot, the local sheep populations, except the Grey Finnish Landrace, had a more cen-tral location than the institutionalised breeds, while the configuration in general revealed three group-ings (Fig. 2). The first axis (explaining 17.2% of variance between populations) separated a Volgaic/Central Russian group from the breeds in the Bal-tic-Finnic region. The two Romanov populations were the furthest from the Baltic-Finnic sheep. Within the Baltic-Finnic sheep, the second PCA axis (12.5%) separated an Estonian and a Finnish group from each other. There were two populations that did not fall into any of the three groups, central Russian/Volgaic, Estonian or Finnish group. The Viena sheep from Russian Karelia, bordering Fin-land, appeared intermediate between Finnish and central Russian/Volgaic groups and neighboured the Finnish group in the plot. Furthermore, the Estonian Ruhnu sheep in the Baltic-Finnic group was equidistant from the Estonian and Finnish clusters.
PC 1 (17.2 %)
PC 2
(12.
5%) L. Romanov
R. Romanov
Mordovian
Komi
Mari
Udmurtian
Viena
E. Ruhnu
E. Saaremaa
Grey Finnish
Finnsheep
E. Blackhead
E. Whitehead
Fig. 2. Two first principal components (PCs) describ-ing relationship structure among the studied north-east-ern European sheep populations. Ellipses represent three clear clusters: Russian, Estonian and Finnish groups. Links between populations are the population graph net-work explaining the covariation structure among the stud-ied populations.
A G R I C U L T U R A L A N D F O O D S C I E N C E
Tapio M. et al. Molecular analysis of Volgaic sheep varieties
162
A G R I C U L T U R A L A N D F O O D S C I E N C E
Vol. 16 (2007): 157-169
163
Bre
ed/v
arie
ty**
NH
er[
40]
fD
egre
eC
entra
lity
mY
(E.W
hite
head
)m
Y(F
inns
heep
)m
Y(R
.Rom
anov
)
E. B
lack
head
280.
74 (0
.13)
6.19
(1.6
6)–0
.011
46.
80E.
Ruh
nu24
0.52
(0.2
0)3.
21 (0
.99)
–0.0
255
6.80
0.61
(±0.
13)
0.52
(±0.
12)
–0.1
3 (±
0.07
)0.
73 (±
0.11
)0.
27(±
0.11
)E.
Whi
tehe
ad30
0.78
(0.0
7)6.
35 (1
.52)
0.04
33
5.91
E. S
aare
maa
210.
77 (0
.08)
6.00
(1.3
7)0.
177*
46.
180.
68 (±
0.12
)0.
25 (±
0.12
)0.
06 (±
0.06
)Fi
nnsh
eep
300.
77 (0
.08)
5.96
(1.5
6)–0
.009
46.
18G
rey
Finn
ish
Land
race
300.
72 (0
.11)
5.05
(1.3
7)0.
022
56.
800.
34 (±
0.09
)0.
56 (±
0.08
)0.
10 (±
0.05
)
R. K
omi l
ocal
270.
66 (0
.14)
4.39
(0.9
4)0.
231*
57.
160.
58 (±
0.14
)–0
.03
(±0.
13)
0.45
(±0.
07)
0.44
(±0.
07)
0.56
(±0.
07)
R. M
ari l
ocal
260.
78 (0
.07)
6.24
(1.3
1)0.
025
57.
160.
61 (±
0.19
)0.
19 (±
0.18
)0.
20 (±
0.08
)R
. Mor
dovi
an lo
cal
110.
76 (0
.10)
5.68
(1.2
9)0.
064
56.
480.
51 (±
0.13
)0.
18 (±
0.12
)0.
31 (±
0.08
)R
. Udm
urtia
n lo
cal
200.
79 (0
.07)
6.40
(1.5
9)0.
097*
57.
160.
70 (±
0.18
)0.
17 (±
0.17
)0.
13 (±
0.08
)R
. Vie
na lo
cal
310.
72 (0
.11)
5.61
(1.4
9)0.
218*
46.
800.
34 (±
0.09
)0.
39 (±
0.09
)0.
27 (±
0.05
)R
. Rom
anov
270.
72 (0
.12)
5.26
(1.0
8)0.
007
56.
80L.
Rom
anov
310.
71 (0
.12)
5.18
(1.2
9)0.
004
25.
04
* Th
e va
lue
is si
gnifi
cant
ly la
rger
than
zer
o w
ith P
< 0
.05
afte
r Bon
ferr
oni c
orre
ctio
n. B
ased
on
5200
per
mut
atio
ns.
** E
., R
. and
L. i
n na
mes
refe
r to
Esto
nia,
Rus
sian
Fed
erat
ion
and
Lith
uani
a as
the
coun
try o
f orig
in.
Tabl
e 3.
Sam
ple
size
s (N
), ge
ne d
iver
sity
(He)
, alle
lic ri
chne
ss c
orre
spon
ding
to th
e ex
pect
ed n
umbe
r of a
llele
s in
a sa
mpl
e of
20
dipl
oid
indi
vidu
als (
r[40
]). W
ithin
-po
pula
tion
fixat
ion
inde
x (f
) for
test
ing
exce
ss o
f hom
ozyg
otes
in th
e sa
mpl
e. B
ased
on
popu
latio
n gr
aph
anal
ysis
(Fig
. 2),
the
tabl
e in
dica
tes t
he n
umbe
r of l
inks
to
othe
r bre
eds (
Deg
ree)
and
Bav
elas
-Lea
vitt
Cen
tralit
y (C
entra
lity)
mea
surin
g co
nnec
tedn
ess o
f a b
reed
and
the
clos
enes
s of a
bre
ed to
the
netw
ork
cent
re, r
espe
ctiv
e-ly
. Thr
ee la
st c
olum
ns in
dica
te m
Y a
dmix
ture
coe
ffici
ents
(boo
tstra
p av
erag
e co
effic
ient
s ± st
anda
rd d
evia
tion)
ass
umin
g lo
cal v
arie
ties b
eing
form
ed b
y ad
mix
ture
of
the
thre
e in
dica
ted
bree
ds. F
or K
omi a
nd R
uhnu
pop
ulat
ions
, coe
ffici
ents
wer
e re
calc
ulat
ed w
ithou
t the
par
enta
l pop
ulat
ion
mak
ing
a ne
gativ
e co
ntrib
utio
n. S
tand
ard
devi
atio
n ov
er lo
ci fo
r the
div
ersi
ty e
stim
ates
is in
par
enth
eses
.
A G R I C U L T U R A L A N D F O O D S C I E N C E
Tapio M. et al. Molecular analysis of Volgaic sheep varieties
164
A G R I C U L T U R A L A N D F O O D S C I E N C E
Vol. 16 (2007): 157-169
165
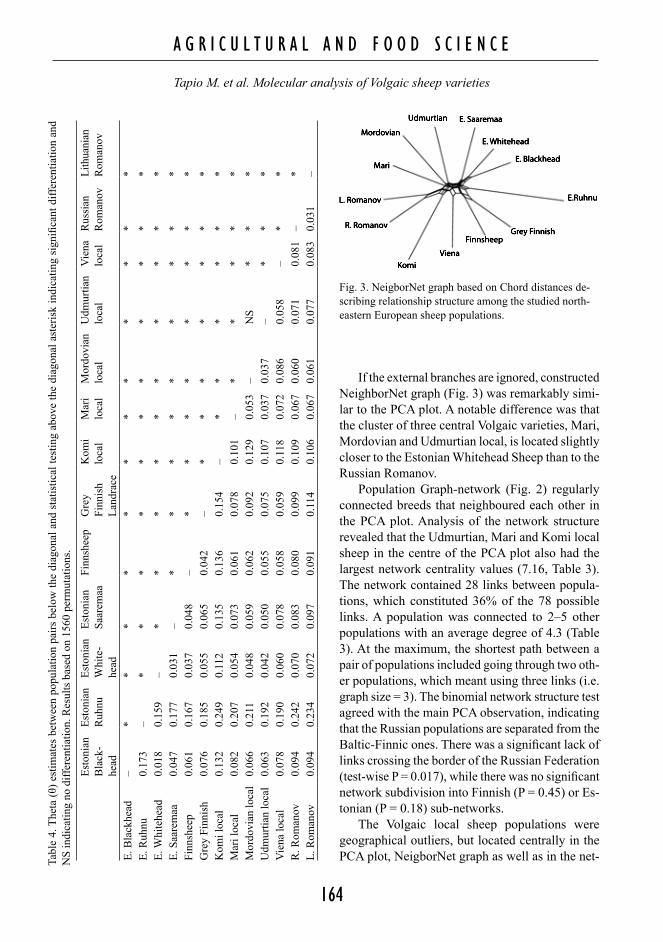
If the external branches are ignored, constructed NeighborNet graph (Fig. 3) was remarkably simi-lar to the PCA plot. A notable difference was that the cluster of three central Volgaic varieties, Mari, Mordovian and Udmurtian local, is located slightly closer to the Estonian Whitehead Sheep than to the Russian Romanov.
Population Graph-network (Fig. 2) regularly connected breeds that neighboured each other in the PCA plot. Analysis of the network structure revealed that the Udmurtian, Mari and Komi local sheep in the centre of the PCA plot also had the largest network centrality values (7.16, Table 3). The network contained 28 links between popula-tions, which constituted 36% of the 78 possible links. A population was connected to 2–5 other populations with an average degree of 4.3 (Table 3). At the maximum, the shortest path between a pair of populations included going through two oth-er populations, which meant using three links (i.e. graph size = 3). The binomial network structure test agreed with the main PCA observation, indicating that the Russian populations are separated from the Baltic-Finnic ones. There was a significant lack of links crossing the border of the Russian Federation (test-wise P = 0.017), while there was no significant network subdivision into Finnish (P = 0.45) or Es-tonian (P = 0.18) sub-networks.
The Volgaic local sheep populations were geographical outliers, but located centrally in the PCA plot, NeigborNet graph as well as in the net-
Esto
nian
B
lack
-he
ad
Esto
nian
R
uhnu
Esto
nian
W
hite
-he
ad
Esto
nian
Sa
arem
aaFi
nnsh
eep
Gre
y Fi
nnis
h La
ndra
ce
Kom
i lo
cal
Mar
i lo
cal
Mor
dovi
an
loca
lU
dmur
tian
loca
lV
iena
lo
cal
Rus
sian
R
oman
ovLi
thua
nian
R
oman
ov
E. B
lack
head
–*
**
**
**
**
**
*E.
Ruh
nu0.
173
–*
**
**
**
**
**
E. W
hite
head
0.01
80.
159
–*
**
**
**
**
*E.
Saa
rem
aa0.
047
0.17
70.
031
–*
**
**
**
**
Finn
shee
p0.
061
0.16
70.
037
0.04
8–
**
**
**
**
Gre
y Fi
nnis
h0.
076
0.18
50.
055
0.06
50.
042
–*
**
**
**
Kom
i loc
al0.
132
0.24
90.
112
0.13
50.
136
0.15
4–
**
**
**
Mar
i loc
al0.
082
0.20
70.
054
0.07
30.
061
0.07
80.
101
–*
**
**
Mor
dovi
an lo
cal
0.06
60.
211
0.04
80.
059
0.06
20.
092
0.12
90.
053
–N
S*
**
Udm
urtia
n lo
cal
0.06
30.
192
0.04
20.
050
0.05
50.
075
0.10
70.
037
0.03
7–
**
*V
iena
loca
l0.
078
0.19
00.
060
0.07
80.
058
0.05
90.
118
0.07
20.
086
0.05
8–
**
R. R
oman
ov0.
094
0.24
20.
070
0.08
30.
080
0.09
90.
109
0.06
70.
060
0.07
10.
081
–*
L. R
oman
ov0.
094
0.23
40.
072
0.09
70.
091
0.11
40.
106
0.06
70.
061
0.07
70.
083
0.03
1–
Tabl
e 4.
The
ta (θ
) est
imat
es b
etw
een
popu
latio
n pa
irs b
elow
the
diag
onal
and
sta
tistic
al te
stin
g ab
ove
the
diag
onal
ast
eris
k in
dica
ting
sign
ifica
nt d
iffer
entia
tion
and
NS
indi
catin
g no
diff
eren
tiatio
n. R
esul
ts b
ased
on
1560
per
mut
atio
ns.
Fig. 3. NeigborNet graph based on Chord distances de-scribing relationship structure among the studied north-eastern European sheep populations.
A G R I C U L T U R A L A N D F O O D S C I E N C E
Tapio M. et al. Molecular analysis of Volgaic sheep varieties
164
A G R I C U L T U R A L A N D F O O D S C I E N C E
Vol. 16 (2007): 157-169
165
work. This differed from the expectation based on isolation by distance, and suggested that the lo-cal populations have admixed origin. Admixture estimates assumed each local sheep type to have originated as a mixture of three breeds in the re-gion: the Estonian Whitehead, the Finnsheep and the Russian Romanov. It should be emphasised that this analysis was descriptive and did not aim to prove that the local populations originated from these three specific breeds, but they were used to represent three wider diverged gene pools and in addition, the Finnsheep and the Romanov represent purebred native breeds in their original breeding regions. The three breeds fitted well as hypotheti-cal parental populations because they were located on the rim of the PCA plot (Fig. 2). In Russia, the estimated contribution of Estonian Whitehead type ancestry to the local sheep type was 34–70%, with the 34% contribution to Viena local being noticea-bly lower than that to the other Russian populations (Table 3). The Romanov type influence varied from 0 to 56% and the Finnsheep type influence varied from 0 to 34%. The Romanov type contribution to the Komi local was noticeably high suggesting a higher proportion of indigenous Russian ancestry than in other central Volgaic populations. In Esto-nia, the Estonian Whitehead influence on the local sheep types was estimated to be very large, and the values ranged from 61 to 73%, while the re-maining ancestry was attributed to Finnsheep. The Romanov type ancestry has a negligible influence on the the studied Estonian sheep. In Finland, the admixture analysis suggested the Finnsheep type ancestry to be the most important one (56%) for the Finnish Grey Landrace.
Discussion
We studied four non-institutionalised local central Volgaic sheep types from the rural areas of Russian Finno-Ugric republics and compared them with institutionalised and non-institutionalised sheep types from the Nordic-Baltic and central Russian area. Based on the peripheral geographical location
compared with other included populations, central Volgaic local sheep populations were anticipated to form a diverged group of short-tailed sheep populations, which would be very important for conservation of northern short-tailed sheep genetic resources. The present results show that the Volgaic sheep populations are highly variable and that this diversity is likely to have resulted from a mixture of local and exotic ancestry. Noticeable exotic in-fluence makes the central Volgaic populations less attractive for conservation programmes for northern short-tailed sheep diversity. However, they may still harbour ancient unique alleles. For characterization and maintenance of this genetic diversity, the Komi local can be considered as the most interesting cen-tral Volgaic population due to its less extensive exotic origin. The evident crossbreeding highlights the importance coordinated conservation programmes, which should at least consider the Romanov, the northern Karelian non-institutionalised Viena sheep population and the Komi local.
There were three different types of evidence suggesting Volgaic varieties to have been influ-enced by common western breeds. First, this was suggested by the appearance of the sheep (Table 1). The most obvious sign of crossbreeding was the tail-length, which was at least twice that of pure-bred short-tailed breeds in the Nordic countries. As in an earlier study (Tapio et al. 2005b), assessing northern European sheep diversity, a long tail ap-pears to be a good indicator of crossbreeding.
Second, the analysis of relationships among the sheep varieties revealed a central, rather than a pe-ripheral, genetic position for the Volgaic sheep pop-ulations. This deviation from the pattern expected under isolation by distance can be interpreted as a sign of crossbreeding. However, results of an ear-lier study on the variation of sheep mitochondrial DNA in these populations (Tapio et al. 2006), as well as mitochondrial and Y-chromosomal studies in humans (Bermisheva et al. 2002, Rosser et al. 2000), support the idea that geographical and ge-netic affinities co-occur in the area. Since the phe-notypic traits already indicate some level of cross-breeding due to the influence from exotic breeds (likely from western Europe, Semyonov & Selkin 1989), the relationship pattern can be considered as
A G R I C U L T U R A L A N D F O O D S C I E N C E
Tapio M. et al. Molecular analysis of Volgaic sheep varieties
166
A G R I C U L T U R A L A N D F O O D S C I E N C E
Vol. 16 (2007): 157-169
167
evidence for substantial non-native ancestry.Finally, the levels of within-population varia-
bility, and fitting of the admixture model with three reference breeds as parental populations, supported the idea concerning the influence of cosmopolitan breeds: the Udmurtian and Mari local popula-tions, together with the synthetic Estonian White-head Sheep, were the most variable populations. They were even more variable than the Finnsheep, which was earlier shown to be the most variable one among 32 northern European breeds (Tapio et al. 2005b). The variable Estonian breed is known to have an admixed ancestry. In the case of the vari-able Volgaic varieties (Mari, Mordovian and Ud-murtian local), the fitting of the admixture model, considering the Estonian Whitehead as one ances-tor, suggested that over 60% of the ancestry comes from this “cosmopolitan western breed”. A similar proportion was obtained for the long-tailed Esto-nian Saaremaa sheep and for the Estonian Ruhnu sheep with variable tail-length, while the estimated Whitehead contribution for the presumably pure-bred, short-tailed Finnish and Russian-Karelian varieties was approximately half of this (Table 3). Within-breed subdivision may elevate the diversity estimates if subpopulations maintain distinct sam-ples of ancestry. However, several of the studied Volgaic varieties did not show significant subdivi-sion and comparison to Viena sheep suggests that subdivision is not sufficient to explain the observa-tion. The frequency based admixture estimates are likely to be biased towards equal contribution from the suggested parental populations (Bertorelle and Excoffier 1998, Dupanloup and Bertorelle 2001), but the estimates suggesting high Whitehead and low Finnsheep contribution for the three highly variable Volgaic varieties clearly deviate from this symmetrical pattern and support major “western” influence in the populations. Notably, the indica-tions for such a crossbred ancestry are weaker for the Komi variety and this result is supported by the NeighborNet graph.
The admixture result suggests primarily a west-ern (i.e. Estonian Whitehead) origin for the central Russian varieties. This agrees with the neighbour net graph (Figure 3), where three out of four varie-ties are located closer to Estonian Whitehead than
Russian Romanov. On the other hand, it disagrees with the PCA plot configuration (Fig. 2), where the varieties are proximal to the Romanov sheep. Non-neutrality or non-amplifying microsatellite al-leles could be an explanation for the disagreement, but, for example, excluding the four loci with the largest excess of homozygotes within-populations (INRA23, MAF48, OarCP34 and OarFCB304; Table 1) had only a minor influence on admixture estimates and the PCA plot. The disagreement be-tween the admixture estimates and the PCA plot rather stems from the plotting method used, which is highly influenced by sharing of rare alleles but less by frequency differences in the common al-leles. In addition to the neighbour net plot, a prin-cipal coordinates plot based on pairwise θ values (Table 4), would be consistent with the admixture estimates, but this would require excluding the two highly diverged populations, Ruhnu and Komi lo-cal (not presented).
Two cases of negative contributions were ob-served (Table 3): Finnsheep to Russian Komi local, and Romanov to Estonian Ruhnu. Negative esti-mates might occur for a variety of reasons (Ber-torelle and Excoffier 1998, Alvarez et al. 2004). In our case, a probable cause for negative estimates is that the given parental population has not in reality contributed to the admixed population (Bertorelle and Excoffier 1998) or a derived hybrid population is treated as a parental population (Dupanloup et al. 2004). Negative estimates might also indicate violation in the assumed model and suggest e.g. reciprocal gene flow (Bertorelle and Excoffier 1998). Since the negative estimates did not differ significantly from zero, we here considered nega-tive estimates as evidence of zero contribution, and recalculated the estimates without the respective parental population. This differs from the interpre-tation by Alvarez et al. (2004), who suggested that negative contributions are indicative of ongoing admixture. Our interpretation to exclude the pa-rental population showing a negative contribution was supported by model-based clustering results (Pritchard et al. 2000), assuming three popula-tions and updating allele frequencies based on the three reference populations (data not reported in detail): the contribution estimates of Dupanloup
A G R I C U L T U R A L A N D F O O D S C I E N C E
Tapio M. et al. Molecular analysis of Volgaic sheep varieties
166
A G R I C U L T U R A L A N D F O O D S C I E N C E
Vol. 16 (2007): 157-169
167
and Bertorelle (2001) and those of Pritchard et al. (2000) demonstrated a strong linear relationship (r = 0.87). The two methods indicated otherwise matching estimates but the model-based cluster-ing suggested more equal contributions from the parental populations: the respective ranges were 0–0.73 and 0.10–0.59, and zero ancestral contribu-tion sensu Dupanloup and Bertorelle (2001) cor-responded to contribution of 0.18 sensu Pritchard et al. (2000).
The Lithuanian and Russian Romanov popu-lations were significantly differentiated but re-sembled each other more than any other breed. A relatively closer relationship between an Egyptian Romanov and the currently included Lithuanian Romanov was observed in the previous study by Tapio et al. (2003). Blott et al. (1998) demonstrated a similar genetic pattern among the different na-tional populations of the widely spread Hereford cattle breed. Furthermore, the three Romanov pop-ulations (Egyptian, Lithuanian and Russian) have all shown remarkably similar levels of molecular variability. This suggests that breed comparisons based on molecular genetic variation are not neces-sarily always sensitive to the population samples studied.
Our results together with the observed pheno-types indicate that the non-institutionalised sheep varieties in the central Volga area have been influ-enced by exotic breeds. It seems that pure ancient varieties can be found only in the most peripheral regions, such as the Viena Karelia in the present study area. The apparent crossbred ancestry makes the central Volgaic varieties less interesting for a conservation programme focussed on northern short-tailed sheep though the breeds may still har-bour ancient alleles not present in other breeds. Ex-tensive crossbreeding highlights the importance of the purebred Romanov and Viena sheep. Among the central Volgaic populations, the less admixed Komi variety appears as the most interesting can-didate for a conservation programme.
Acknowledgements. The authors thank Ilma Tapio and Meng-Hua Li for helpful discussions on earlier versions of the manuscript and two anonymous reviewers for their useful comments. We are also grateful to the Nordic
Genebank for Farm Animals (NGH) for the use of Esto-nian samples. We acknowledge the following persons for assistance in sample collection in the Middle Volga and the Volga-Kama regions: Paula Kokkonen, Galina Mišarina, Esa-Jussi Salminen, Konstantin Zamjatin, Vasili Petrov, Lidija Matrosova, Jouni Kortesharju, and Natalia Devjatkina.This work was financially supported by the Academy of Finland and the Finnish Ministry of Agriculture and For-estry (SUNARE-program and Russia In Flux-program). M.T. was supported by the Department of Education in Finland (Finnish Graduate School in Population Genetics coordinated by Oulu University).
ReferencesAlvarez, I., Royo, L.J., Fernandez, I., Gutierrez, J.P.,
Gomez, E. & Goyache F. 2004. Genetic relationships and admixture among sheep breeds from Northern Spain assessed using microsatellites. Journal of Ani-mal Science 82: 2246–2252.
Bavelas, A. 1948. A Mathematical Model for Group Struc-tures. Human Organization 7: 16–30.
Benta, I.M. 2003. Agna. Version 2.1.1. Cork, University College Cork, Ireland. Available at http://www.geoci-ties.com/imbenta/agna/.
Bertorelle, G. & Excoffier, L. 1998. Inferring admixture pro-portions from molecular data. Molecular Biology and Evolution 15: 1298–1311.
Bermisheva, M.A., Tambets, K., Villems, R. & Khusnutdi-nova, E.K. 2002. Diversity of Mitochondrial DNA Haplo-groups in Ethnic Populations of the Volga-Ural Region. Molecular Biology 36: 802–812.
Blott, S.C., Williams J.L. & Haley C.S. 1998. Genetic vari-ation within the Hereford breed of cattle. Animal Genet-ics 29: 202–211.
Bryant, D., & Moulton, V. 2004. NeighborNet: an agglom-erative algorithm for the construction of planar phylo-genetic networks. Molecular Biology and Evolution 21: 255–265.
Cavalli-Sforza, L.L. & Edwards, A.W.F. 1967. Phylogenet-ic analysis: models and estimation procedures. Evolu-tion 21: 550–570.
Cavalli-Sforza, L.L., Menozzi P. & Piazza, A. 1994. The His-tory and Geography of Human Genes. Princeton Univer-sity Press, Princeton, New Jersey. 1024 p.
Dupanloup, I., & Bertorelle, G. 2001. Inferring Admixture Proportions from Molecular Data: Extension to Any Number of Parental Populations. Molecular Biology and Evolution 18: 672–675.
Dupanloup, I., Bertorelle, G., Chikhi, L., & Barbujani, G. 2004. Estimating the Impact of Prehistoric Admixture on the Genome of Europeans. Molecular Biology and Evolution 21: 1361–1372.
Dyer, R.J. & Nason, J.D. 2004. Population Graphs: The Graph-Theoretic Shape of Genetic Structure. Molecu-
A G R I C U L T U R A L A N D F O O D S C I E N C E
Tapio M. et al. Molecular analysis of Volgaic sheep varieties
168
A G R I C U L T U R A L A N D F O O D S C I E N C E
Vol. 16 (2007): 157-169
169
lar Ecology 13: 1713–1728.El Mousadik, A. & Petit, R.J. 1996. High level of genet-
ic differentiation for allelic richness among popula-tions of the argan tree [Argania spinosa (L.) Skeels] endemic of Morocco. Theoretical and Applied Genet-ics 92: 832–839.
FAO 2006. DAD-IS 2.0 Domestic animal diversity informa-tion system. Cited 12 Sept 2006. Available on the inter-net: www.fao.org/dad-is/
Goudet, J., 1995. FSTAT Version 1.2: a computer pro-gram to calculate F-statistics. Journal of Heredity 86: 485–486.
Huson, D.H. & Bryant, D. 2006. Application of Phyloge-netic Networks in Evolutionary Studies. Molecular Bi-ology and Evolution 23: 254–267.
Litovchenko, G.R. & Yesaulova, P.A. 1972. Ovtsevodstvo. Publisher ”Kolos”, Moscow. (In Russian) 567 p.
Marzanov, N.S. & Samorukov, Yu. 2006. Za romanovkoi bol’shoe bydysheje. Informatsionnyi Bylleten. Yaroslavl 7–8 (July–August): 2–5.
Nei, M. 1987. Molecular Evolutionary Genetics, Columbia University Press, New York. 512 p.
Pritchard, J.K, Stephens, M. & Donelly, P. 2000. Inference of population structure using multilocus genotype data. Genetics 155: 945–959.
Rosser, Z.H., Zerjal, T., Hurles, M.E., Adojaan, M., Alavan-tic, D., Amorim, A., Amos, W., Armenteros, M., Arroyo, E., Barbujani, G., Beckman, G., Beckman, L., Bertran-petit, J., Bosch, E., Bradley, D.G., Brede, G., Cooper, G., Corte-Real, H.B.S.M., de Knijff, P., Decorte, R., Dubro-va, Y.E., Evgrafov, O., Gilissen, A., Glisic, S., Golge, M., Hill, E.W., Jeziorowska, A., Kalaydjieva, L., Kayser, M., Kivisild, T., Kravchenko, S.A., Krumina, A., Kucinskas, V., Lavinha, J., Livshits, L.A., Malaspina, P., Maria, S., McElreavey, K., Meitinger, T.A., Mikelsaar, A.V., Mitch-ell, R.J., Nafa, K., Nicholson, J., Norby, S., Pandya, A., Parik, J., Patsalis, P.C., Pereira, L., Peterlin, B., Piel-berg, G., Prata, M.L., Previdere, C., Roewer, L., Root-si, S., Rubinsztein, D.C., Saillard, J., Santos, F.R., Ste-fanescu, G., Sykes, B.C., Tolun, A., Villems, R., Tyler-
Smith, C. & Jobling, M.A. 2000. Y-Chromosomal diver-sity in Europe is clinal and influenced primarily by ge-ography, rather than by language. American Journal of Human Genetics 67: 1526–1543.
Ryder, M.L. 1983. Sheep and man. Duckworth, London. 846 p.
Semyonov, S.I. & Selkin, I.I. 1989. Sheep. In: Dmitriev, N.G. & Ernst, L.K. (eds) Animal genetic resources of the USSR. Food Animal Production and Health paper No. 65. Food and Agriculture Organization of the Unit-ed Nations, Rome, Italy, p 143–254.
Tapio, I., Tapio, M., Grislis, Z., Holm, L.-E., Jeppsson, S., Kantanen, J., Miceikiene, I., Olsaker, I., Viinalass, H. & Eythorsdottir, E. 2005a. Unfolding of population struc-ture in Baltic sheep breeds using microsatellite analy-sis. Heredity 94: 448–456.
Tapio, M. 2006. Origin and maintenance of genetic di-versity in northern European sheep. Acta Universitatis Ouluensis, Scientiae Rerum Naturalium, A 473 (PhD-thesis). 67 p.
Tapio, M., Marzanov, N., Ozerov, M., Ćinkulov, M., Gon-zarenko, G., Kiselyova, T., Murawski, M., Viinalass, H. & Kantanen, J. 2006. Sheep mitochondrial DNA varia-tion in European, Caucasian and Central Asian areas. Molecular Biology and Evolution 23: 1776–1783.
Tapio, M., Miceikiene, I., Vilkki, J. & Kantanen, J. 2003. Comparison of microsatellite and blood protein diversi-ty in sheep: inconsistencies in fragmented breeds. Mo-lecular Ecology 12: 2045–2056.
Tapio, M., Tapio, I., Grislis, Z., Holm, L.-E., Jeppsson, S., Kantanen, J., Miceikiene, I., Olsaker, I., Viinalass, H. & Eythorsdottir, E. 2005b. Native breeds demonstrate high contributions to the molecular variation in northern Eu-ropean sheep. Molecular Ecology 14: 3951–3963.
Thioulouse, J., Chessel, D., Dolédec, S. & Olivier, J.M. 1997. ADE-4: a multivariate analysis and graphical dis-play software. Statistics and Computing, 7: 75–83.
Weir, B.S. & Cockerham, C.C. 1984. Estimating F-statis-tics for the analysis of population structure. Evolution 38: 1358–1370.
A G R I C U L T U R A L A N D F O O D S C I E N C E
Tapio M. et al. Molecular analysis of Volgaic sheep varieties
168
A G R I C U L T U R A L A N D F O O D S C I E N C E
Vol. 16 (2007): 157-169
169
SELOSTUSLampaiden molekyyligeneettinen variaatio suomalais-ugrilaisten kansojen
asuttamilla alueilla Volgan keskijuoksullaMiika Tapio, Mikhail Ozerov, Haldja Viinalass, Tatyana Kiseliova, Juha Kantanen
MTT Biotekniikka- ja elintarviketutkimus, Estonian University of Life Sciences ja Russian Academy of Agricultural Sciences
Pohjois-Euroopan alkuperäiset lammasrodut ovat olleet lyhythäntäisiä. Niin myös Luoteis-Venäjän ainoa jäljellä oleva alkuperäislammasrotu, romanov. Romanovlammas ja suomalais-ugrilaisten kansojen alueilla esiintyvät paikalliset lammaskannat muodostavat tärkeän, mutta vielä tutkimattoman geenivaran Pohjois-Euroopassa. Tässä tutkimuksessa neljästä Keski-Volgalla esiintyvästä lammaskannasta genotyypitettiin 20 mikrosatelliittia, ja kantoja verrattiin maantieteellisesti läheisiin rotuihin, Viron valkea- ja tummapäähän, suomenlampaaseen ja romanoviin, sekä paikallisiin lammaspopulaatioihin Virossa, Suomessa ja Venäjän Karjalassa. Populaatioi-
den välisten erojen tarkastelu, hybridisaatioanalyysit ja kantojen fenotyyppiset ominaisuudet viittasivat siihen, että suomalais-ugrilaisilla alueilla esiintyvät kannat ei-vät ole säilyneet puhtaina. Tämä ei välttämättä vähennä niiden arvoa pohjoisten lyhythäntäisten lampaiden gee-nivarojen säilyttämistä ajatellen, mutta korostaa puhtaan romanovin sekä Vienan Karjalan lampaan geenivarojen merkitystä. Tutkimuksessa verrattiin ensimmäistä kertaa romanovlampaasta sen alkuperäiseltä elinalueelta ja muilta elinalueilta otettuja näytteitä. Näiden populaati-oiden geneettistä variaatiota kuvaavat parametrit olivat hyvin samankaltaisia.


![Candidate Gene Approach for Parasite Resistance in Sheep · PDF file · 2014-03-17problems in sheep and goat [1,2]. ... within-breed genetic variation has also been demon- ... markers](https://img.pdfslide.us/doc/110x75/5ab52dba7f8b9a0f058c7f71/candidate-gene-approach-for-parasite-resistance-in-sheep-in-sheep-and-goat-12.jpg)