Embed Size (px)
Citation preview
Advances in Anthropology 2012. Vol.2, No.4, 181-197 Published Online November 2012 in SciRes (http://www.SciRP.org/journal/aa) http://dx.doi.org/10.4236/aa.2012.24021
Copyright © 2012 SciRes. 181
Molecular Genetic Perspectives on the Origin of the Lyngngam Tribe of Meghalaya, India*
Banrida T. Langstieh1,2#, Vikrant Kumar1,3#, Meka Aruna1#, Alla Govardhan Reddy4, Shilpi Dasgupta1, Alla Nirmala1, Kumarasamy Thangaraj4, Lalji Singh4,
Battini Mohan Reddy1† 1Molecular Anthropology Group, Indian Statistical Institute, Hyderabad, India 2Department of Anthropology, North-Eastern Hill University, Shillong, India
3Human Genetics Group, Genome Institute of Singapore, Singapore City, Singapore 4Centre for Cellular and Molecular Biology, Hyderabad, India
Email: [email protected], [email protected], [email protected], [email protected], [email protected], [email protected],
[email protected], [email protected], †[email protected]
Received July 10th, 2012; revised August 22nd, 2012; accepted September 10th, 2012
Meghalaya, one of the Northeast Indian states, is inhabited by two major tribal clusters, Khasi and Garo. The disputed origin of the Lyngngam tribe of Meghalaya is a result of their geographic distribution, which is sandwiched between that of the above two major tribal clusters. Our earlier analysis of ethnohistoric, linguistic and demographic data suggested the neighbouring Khasi and Garo as the putative parental population(s) of Lyngngam. In this paper, we have investigated the Lyngngam, Garo and all the 7 sub-tribes of Khasi of Meghalaya using molecular genetic markers-autosomal, Y-chromosome and mtDNA-to explore the possible origin of the Lyngngam tribe. We obtained admixture estimates for Lyngngam versus the putative parental populations. While autosomal STRs and mtDNA results clearly suggest Khasi origin of the Lyngngam, Y-STR distances show greater proximity of Lyngngam to the Garo. Further, the com-parative analysis of the Y-Chromosome and mtDNA haplogroup data on relevant Austro-Asiatic and Ti-beto-Burman populations from South and Southeast Asia, published by us earlier, clearly exclude the possibility of Lyngngam origin from outside Meghalaya. The molecular genetic evidence in conjunction with the linguistic, demographic and ethno-historic information clearly suggests Khasi origin of the Lyngngam tribe. Keywords: Austro-Asiatics; Admixture; Autosomal STRs; Y-Chromosome Markers;
MtDNA HVS-I and II Sequences
Introduction
One of the most fundamental and unique features of Indian population structure is the division of its population into strictly defined hierarchical endogamous castes, tribes and religious groups (Figure 1) within any particular geographic region and/or linguistic category (Reddy et al., 2010; Malhotra, 1984; Malhotra & Vasulu, 1993). However, it is the subdivision of each of these castes, tribes and religious groups into a number of endogamous subunits like subcastes or subtribes and the processes involved in this sub-structuring of the Indian popula- tion that makes it quite fascinating for population geneticists. Basically, two different models-fission and fusion-can explain this continuous process of subdivision and/or amalgamation/ admixture, although a totally contrasting model especially to negate the process of fission behind formation of subcastes has also been proposed and demonstrated with empirical evidence (Karve, 1961; Karve & Dandekar, 1951; Karve & Malhotra, 1968). On the other hand, subsequently, number of investi- gators have documented situations where in a number of en-
dogamous subcastes, subtribes and/or breeding isolates have arisen within a single caste or tribe which had a relatively greater genetic affinity among them as compared to other such groups (Malhotra, 1978, 1979; Reddy, 1983, 1984, 2010; Reddy et al., 1995, 1999, 2001a, 2001b, 2001c, 2007; Crawford et al., 2001; Mitchell et al., 2006; Kumar et al., 2004, 2007). A number of different factors and/or processes have been impli- cated to be responsible for such subdivisions and subsequent maintenance of their endogamy with distinct group identity (Malhotra, 1978, 1979; Reddy, 2010).
Admixture is also a continual process, which occurs over many generations. The correct identification of ancestral popu- lations and the degree of asymmetry in gene flow (sex biased admixture) are important issues in the admixture studies (Chakraborty, 1986). Recent studies indicate the trend of studying ethnic admixture by identifying the patterns of pater- nal and maternal gene flow and their contribution to the gene pool of the admixed group, which is made possible with the analysis of Y-chromosome (paternal) and mtDNA (maternal) specific markers (Dipierri et al., 1998; Kittles et al., 1999; Kivisild et al., 1999; Kivisild et al., 2002; Kivisild et al., 2003). India offers immense variety of such situations, which continue o fascinate evolutionary anthropologists. The interest in dis-
*Declaration of Interest: The authors report no declarations of interest. #Banrida, Vikrant and Aruna were with us at ISI as Ph.D. students when they participated in this project. †Corresponding author. t

B. T. LANGSTIEH ET AL.
Figure 1. Schematic diagram depicting essential features of Indian population structure. The exogamous “clans” in tribes are equivalent to “lineages” in the caste and religious groups.
Figure 2. Location map of Meghalaya showing the core areas of distribution of different sub-tribes of the Khasi, Lyngngam and Garo. Filled circles denote Khasi subtribes, whereas dotted circle denotes the capital of Meghalaya (Shillong).
Copyright © 2012 SciRes. 182

B. T. LANGSTIEH ET AL.
secting Indian population structure has therefore been redou- bled in recent years, especially with the proliferation of DNA
(2
s considered as an Austro-Asiatic group, particu- la
identify the Lyngngam as “Megam”, one of the sub- tr
rally intermediate between the Khasis and th
hur, 1979). T
n of the Lyngngam and given thconvincingly. However, based on the linguistic affiliation, it
appears that the Lyngngam might have been relatively more akin to the Khasi than to the Garo. The Lexico-Statistical
it with a population of about 7000 individuals organ- iz
ed from 515 subjects, after obtaining written informed consent. These subjects r Garo, all the 7
a. The sampled popula- s that could be successfully
sc
examine if Lyngngam has any specific and close relationship
technology and development of rapid screening techniques. Meghalaya is one of the states of Northeastern India (Figure 2)
inhabited mostly by the tribes whose population is ~2,306,069001 census). Amidst the ethnic majority of populations with
East Asian physical features and speaking Tibeto-Burman lan- guages in the northeastern region, while the Khasi represents Khasi-Khmuic (earlier categorized as Mon-Khmer) speakers of the Austro-Asiatic linguistic family (Diffloth, 2005), occupying the central and eastern regions of Meghalaya, the Garo repre- sents Tibeto-Burman speakers of the state, inhabiting the re- gions towards the west. These are the two overwhelmingly predominant, indigenous and linguistically distinct tribal clus- ters that inhabit Meghalaya, and follow the system of matrilin- eal descent and matrilocal residence. These two tribal clusters are found to be genetically also quite distinct (Reddy et al., 2007). Sandwiched between these two linguistically and ge- netically contrasting populations of Khasi and Garo there is a small tribe of shifting cultivators known as Lyngngam, which inhabits the border areas of west Khasi Hills and South Garo Hills of Meghalaya. Because of its unique geographic position with territorial proximity to both the Khasi and Garo, the origin of the Lyngngam has been disputed, and is claimed to be a subtribe of both the tribes. Based on the prevalent notions, the origin and ethnic position of the Lyngngam can be categorized as follows:
1) Based on the physical features and linguistic similarity, Lyngngam i
rly under the Mon-Khmer subfamily (Gurdon, 1907; Grierson, 1928; Barrett, 1982). The contemporary Khasis therefore con- sider the Lyngngam as one of the Khasi subtribes (Rodborne, 1977).
2) Bhattacharjee (1978), Sangma (1981) and a majority of the Garos
ibes of the Garo. 3) A mixed/hybrid group (Playfair, 1909; Bareh, 1967; Non-
gsiang, 1994), cultue Garos (Ehrenfels, 1955). There are only a couple of clans
that are unique to Lyngngam, many other clans have affinity with and exogamous to certain clans of either the Khasi or Garo, suggesting probably their evolution from a common ancestor. Likewise, there are similar as well as distinctive socio-cultural features of Lyngngam when compared to the neighbouring Khasi and Garo (Langstieh & Reddy, 1999, 2004).
4) A distinct tribe, probably with an independent origin, cer- tainly not a sub-tribe of either the Khasi or Garo (Mat
he preliminary genetic and dermatoglyphic evidences (Ahmed et al., 1997; Thapa et al., 1998) support the Lyngngam as bio- logically distinct from both the Khasi and Garo. Concurrent to this most of the informants believe that they were the autoch- thons of the present habitat in western Meghalaya. The analysis of folk narratives of the Lyngngam, “Kon Bli”, suggests that their ancestors were explorers and warriors who came to Meghalaya and defended the land that they presently occupy (Langstieh & Reddy, 1999, 2004), suggesting probably the independent origin of this tribe.
From the foregoing information, no clear answers emerge regarding origin and ethnic positio
e type of available data it was not possible to resolve the issue
Analysis (Swadesh, 1950, 1951, 1972) of the 200 Lyngngam and the corresponding Khasi words collected by us suggests that although Khasi and Lyngngam both speak the broad Khasi- Khmuic language of the Austro-Asiatic family, their speech forms might have been separated around 1500 years ago (CI: 1.69 M - 2.09 M years) from a common speech form (Langstieh, 2003).
Our recent exploratory studies (Langstieh & Reddy, 1999, 2004) of this small tribe based on demography, ethnohistory, marital networks, clan structure and other population structural measures suggest that Lyngngam as a whole forms an endoga- mous un
ed into about 1400 households. However, 22% of the Lyngn- gam marriages were contracted outside this tribe (Langstieh & Reddy, 1999, 2004), a great majority of those male spouses coming from the neighbouring Khasi and Garo. The majority of the Khasi contributors to the Lyngngam fold hail from the neighbouring Nongtrai, Maram, War, Bhoi and Khynriam sub- tribes in the decreasing order of frequency and a great majority of the 29 Lyngngam clans were involved in the exogamous interactions. Further, the Lyngngam clans suggest a relatively greater degree of commonness with the Khasi although a cou- ple of Lyngngam clans could be traced as common with the Garo as well (Langstieh & Reddy, 1999, 2004). Although the uniquely identified Lyngngam specific clans suggest that they might represent the founding ancestors of this admixed popula- tion, given the Austro-Asiatic affinity of the Lyngngam dialect and the names of Lyngngam clans suggest probable Khasi ori- gin of this tribe. Due to its geographic position, this tribe might have later developed marital interactions with the neighboring Tibeto Burman Garos. Given the above scenario, there is strong possibility that the gene pool of the Lyngngam may have dis- tinct genetic signatures from both these putative parental popu-lations (Khasi and Garo), while the former is likely to have overwhelming contribution to the genetic makeup of the Lyngngam. The results based on molecular genetic markers, particularly the uniparental mitochondrial DNA (mtDNA) and Y chromosome (NRY) markers, should reflect these expecta- tions in a more conclusive way. In the present paper, we shall outline the findings based on the analysis of molecular genetic markers-autosomal, mtDNA and Y-chromosome-and test the degree of correspondence between the molecular genetic evi- dences and the patterns expected from the ethno-historic and demographic information and estimate genetic contributions of different source populations to the gene pool of Lyngngam.
Materials and Methods
Collection of Blood Samples
About 5 ml of intravenous blood samples were collect
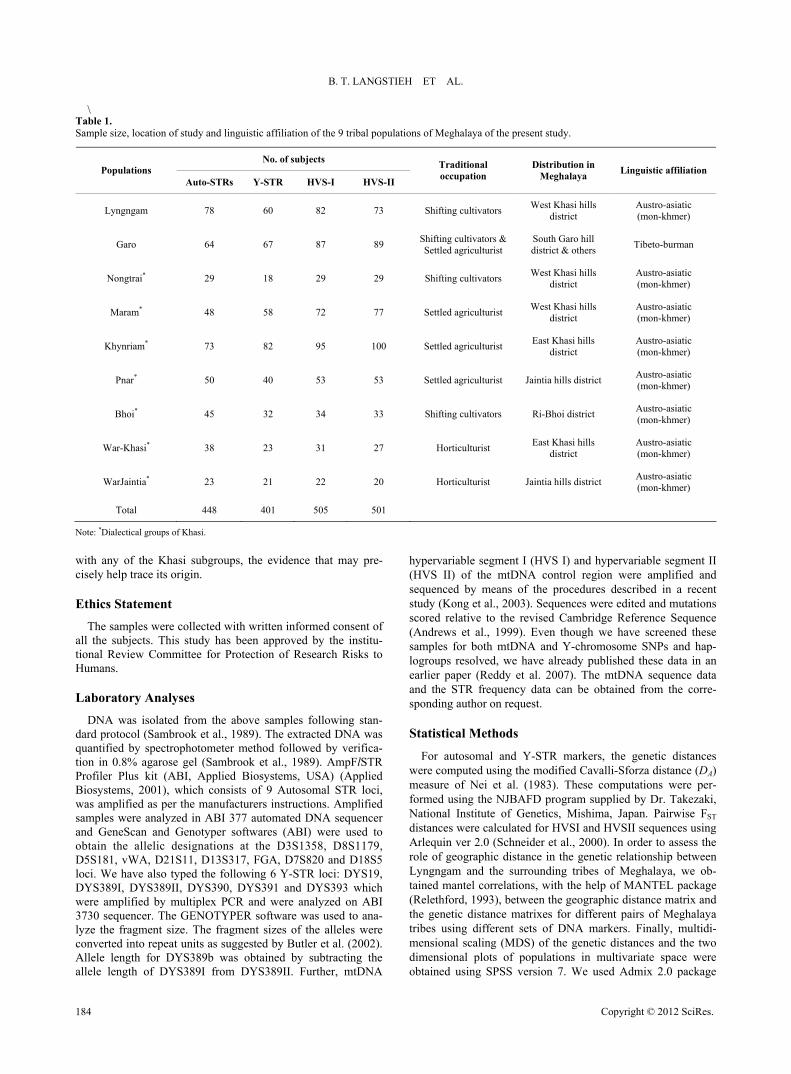
epresent, besides Lyngngam andsubtribes of the Khasi tribe of Meghalaytions and the number of subject
reened for different sets of markers are given in Table 1. As the language of Lyngngam is known to be similar to that of the Khasi, blood samples were also collected from all the 7 sub- tribes of the Khasi besides the neighboring Garo. This may help
Copyright © 2012 SciRes. 183
B. T. LANGSTIEH ET AL.
\ Table 1. Sample size, location of study and linguistic affiliation of the 9 tribal popu ons of Meghalaya of the present study.
No. of subjects
lati
Populations Auto-STRs Y-STR HVS-I HVS-II
occupation MeghalayTraditional Distribution in
a Linguistic affiliation
Lyngngam 78 73 Shi 60 82 fting cultivatorsWest Khasi hills
district Austro-asiatic (mon-khmer)
Garo 64 67 87 89 Shifting cultivators & South Garo hill
Nongtrai* 29 18 29 29 West Khasi hills Austro-asiatic
* West Khasi hills Austro-asiatic
Khynriam* 73 82 95 100 Settled agriculturist East Khasi hills Austro-asiatic
* Ja Austro-asiatic
Bhoi* 45 32 34 33 Shifting cultivators Ri-Bhoi district Austro-asiatic
Wa si* 38 East Khasi hills Austro-asiatic
WarJaintia* 23 21 22 20 Horticulturist Ja Austro-asiatic
Total 448 401 505 501
Settled agriculturist district & others Tibeto-burman
Shifting cultivators district (mon-khmer)
Maram 48 58 72 77 Settled agriculturist district (mon-khmer)
district (mon-khmer)
Pnar 50 40 53 53 Settled agriculturist intia hills district(mon-khmer)
(mon-khmer)
r-Kha 23 31 27 Horticulturist district (mon-khmer)
intia hills district(mon-khmer)
Note: ups of Khas
with an he Khasi subgroups, th dence that may pr
d with written informed consent of study has been approved by the institu- ittee for Protection of Research Risks to
H
as isolated from the above samples following stan- al., 1989). The extracted DNA was
method followed by verifica-tio
allele length of DYS389I from DYS389II. Further, mtDNA
hypervariable segment I (HVS I) and hypervariable segment II (HVS II) of the mtDNA control region were amplified and sequenced by means of the procedures described in a recent
cs, Mishima, Japan. Pairwise FST HVSI and HVSII sequences using
ider et al., 2000). In order to assess the ro
*Dialectical gro i.
y of t e evi e- cisely help trace its origin.
Ethics Statement
The samples were collecteall the subjects. Thistional Review Comm
umans.
Laboratory Analyses
DNA wdard protocol (Sambrook etquantified by spectrophotometer
n in 0.8% agarose gel (Sambrook et al., 1989). AmpFlSTR Profiler Plus kit (ABI, Applied Biosystems, USA) (Applied Biosystems, 2001), which consists of 9 Autosomal STR loci, was amplified as per the manufacturers instructions. Amplified samples were analyzed in ABI 377 automated DNA sequencer and GeneScan and Genotyper softwares (ABI) were used to obtain the allelic designations at the D3S1358, D8S1179, D5S181, vWA, D21S11, D13S317, FGA, D7S820 and D18S5 loci. We have also typed the following 6 Y-STR loci: DYS19, DYS389I, DYS389II, DYS390, DYS391 and DYS393 which were amplified by multiplex PCR and were analyzed on ABI 3730 sequencer. The GENOTYPER software was used to ana- lyze the fragment size. The fragment sizes of the alleles were converted into repeat units as suggested by Butler et al. (2002). Allele length for DYS389b was obtained by subtracting the
study (Kong et al., 2003). Sequences were edited and mutations scored relative to the revised Cambridge Reference Sequence (Andrews et al., 1999). Even though we have screened these samples for both mtDNA and Y-chromosome SNPs and hap- logroups resolved, we have already published these data in an earlier paper (Reddy et al. 2007). The mtDNA sequence data and the STR frequency data can be obtained from the corre- sponding author on request.
Statistical Methods
For autosomal and Y-STR markers, the genetic distances were computed using the modified Cavalli-Sforza distance (DA) measure of Nei et al. (1983). These computations were per- formed using the NJBAFD program supplied by Dr. Takezaki, National Institute of Genetidistances were calculated for Arlequin ver 2.0 (Schne
le of geographic distance in the genetic relationship between Lyngngam and the surrounding tribes of Meghalaya, we ob- tained mantel correlations, with the help of MANTEL package (Relethford, 1993), between the geographic distance matrix and the genetic distance matrixes for different pairs of Meghalaya tribes using different sets of DNA markers. Finally, multidi- mensional scaling (MDS) of the genetic distances and the two dimensional plots of populations in multivariate space were obtained using SPSS version 7. We used Admix 2.0 package
Copyright © 2012 SciRes. 184
B. T. LANGSTIEH ET AL.
initially developed by Bertorelle and Excoffier (1998) for two parental populations and extended to any number of parental populations by Dupanloup and Bertorelle (2000), for obtaining the admixture proportions of different putative parental popula- tions.
Results
Phylogenetic Affinity of Lyngngam to Khasi and Garo
In order to trace the origin of Lyngngam from among the Meghalaya tribes we examined relative genetic distances of Lyngngam to the Khasi and Garo populations with reference to different sets of genetic m e 2). This was done in
hasi, all al
es and the Garo. It is intriguing to note that while th
ng of the Lyngn-
in
y single Khasi subtribe, the overall contributions of th
and f the 7
pr
arkers (Tabltwo stages, first Lyngngam with the neighboring KKhasi and Garo and then Lyngngam with the 7 individuKhasi subtrib
e Lyngngam shows much greater affinity to the Khasi when compared to the Garo in HVS I &II sequences-based distances as well as in autosomal STR-based distances, it shows greater affinity to the Garo in the Y-STR distances, suggesting di- chotomous nature of their genetic relationship to Khasi and Garo. To see if Lyngngam is specifically close to any particular Khasi subgroup, the distance matrices were subjected to multi- dimensional scaling and the plots based on the first two dimen- sions are presented in Figure 3. This analysis suggests relative closeness of Lyngngam to the neighboring Bhoi and Khynriam, when compared to the other Khasi tribes as well as to the Garo in the autosomal STRs whereas it shows closer affinity in the decreasing order to the neighboring Nongtrai, Khynriam and Pnar, and Nongtrai, Khynriam and War Khasi, respectively, in case of the HVS I & II sequences. This pattern is substantiated by the significant mantel correlation obtained between geo- graphic and genetic distance matrices based on HVS I & II sequences (Table 3). Given matrilineal descent, this may sug- gest founding of the Lyngngam maternal gene pool predomi- nantly from a common Khasi source, especially since the ma- ternal lineages remain relatively static and the admixture is primarily by way of males moving in from the surrounding populations. However, in case of Y STRs, Lyngngam is rela- tively closer to the Garo as well as to a few neighboring Khasi tribes viz. Khynriam, Maram and Pnar.
Sharing Pattern of the Lyngngam Y-STR and mtDNA HVS I & II Haplotypes with other Meghalaya Tribes
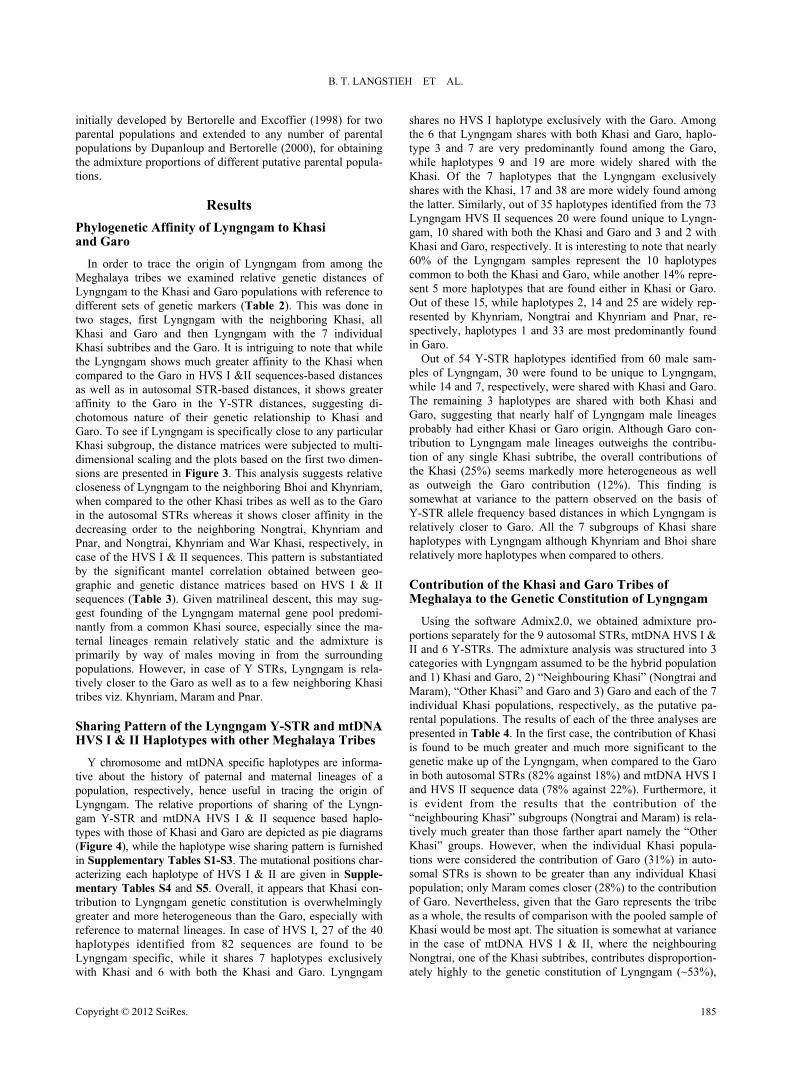
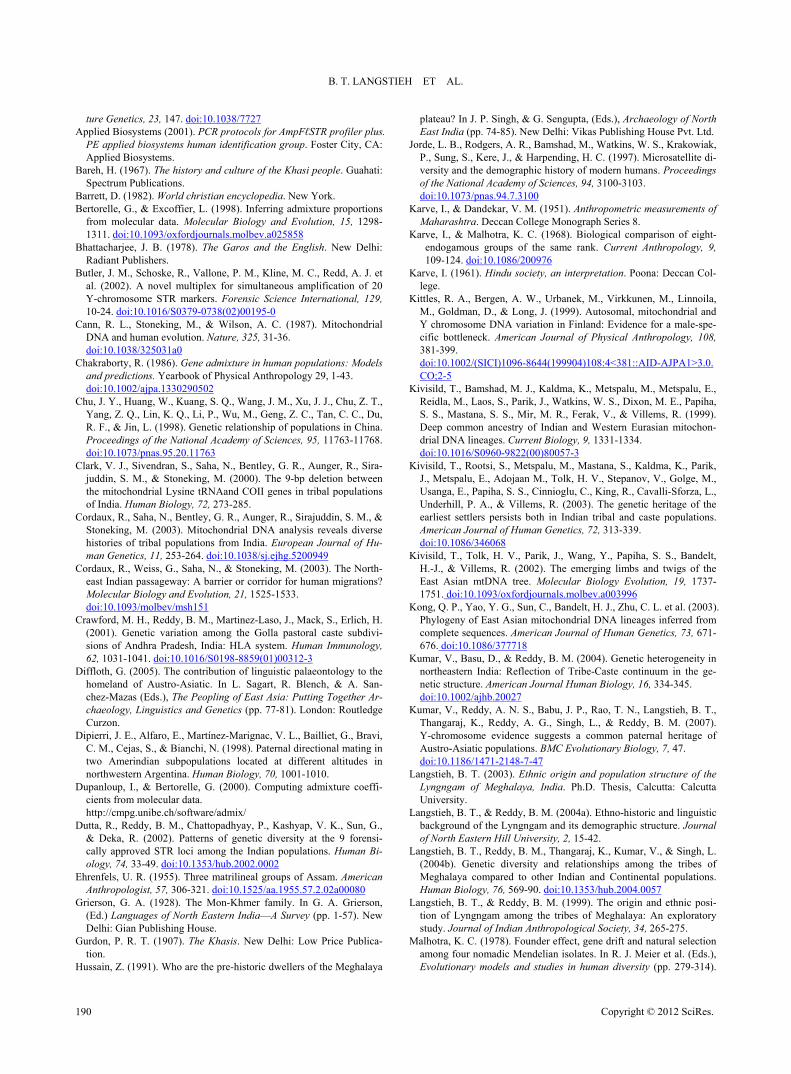
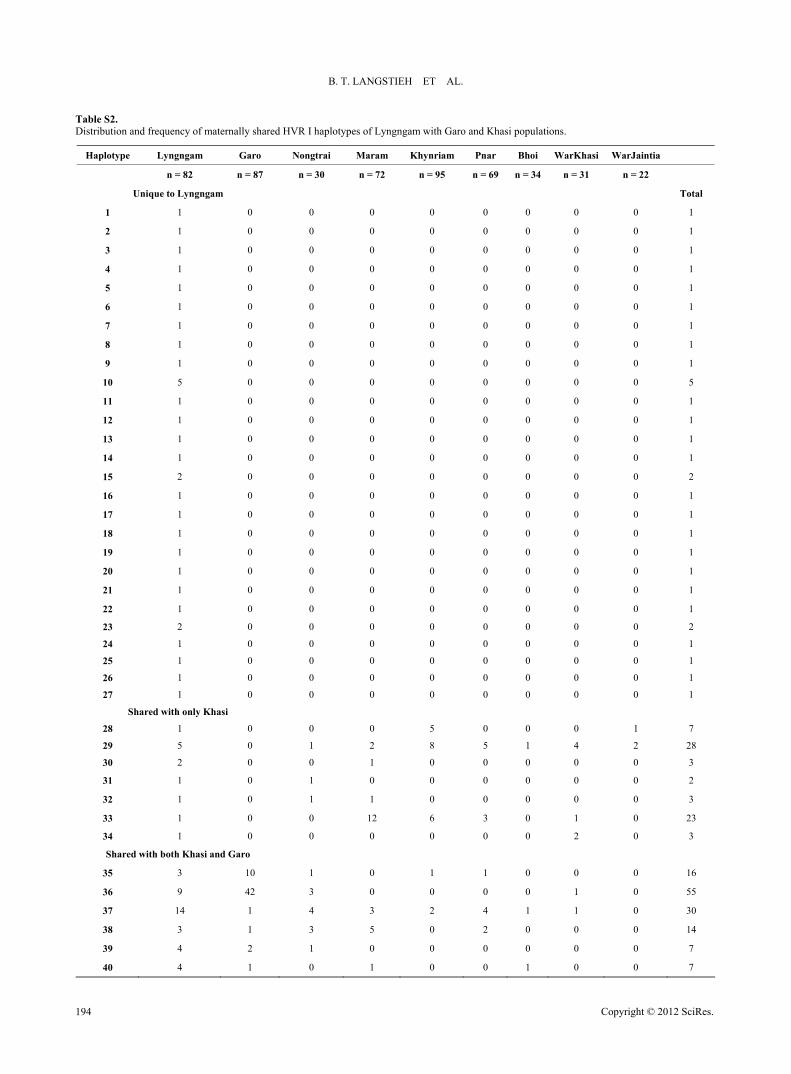
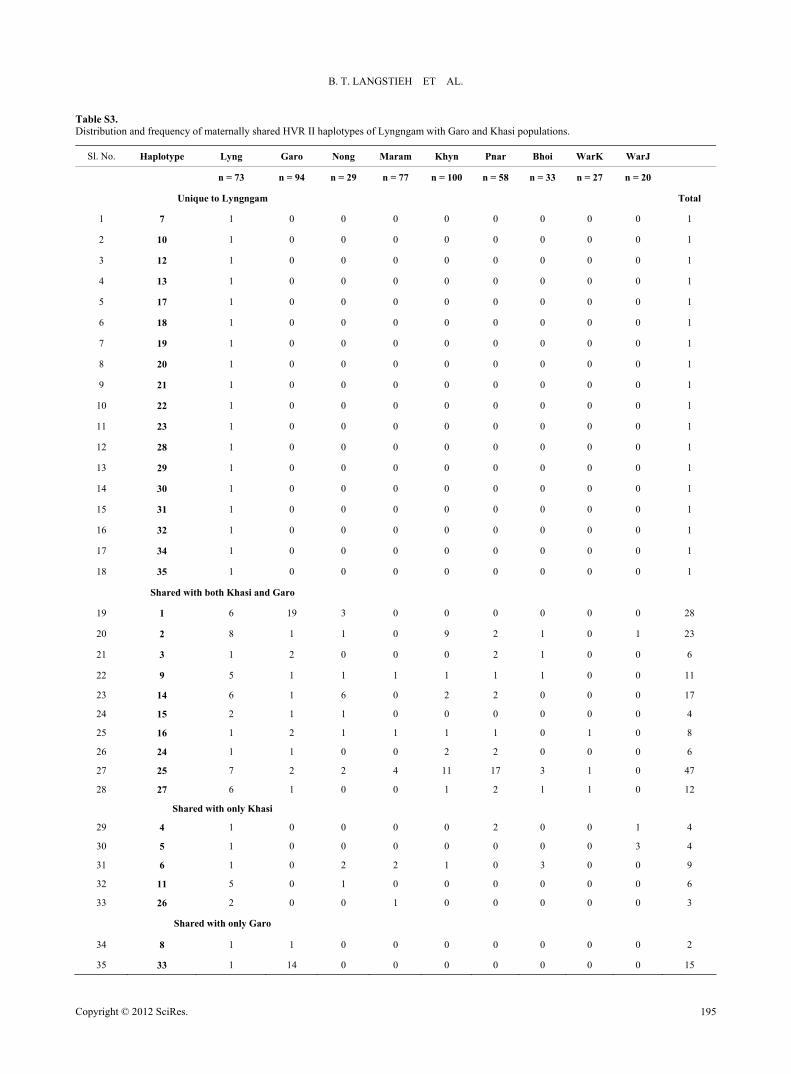
Y chromosome and mtDNA specific haplotypes are informa- tive about the history of paternal and maternal lineages of a population, respectively, hence useful in tracing the origin of Lyngngam. The relative proportions of sharigam Y-STR and mtDNA HVS I & II sequence based haplo- types with those of Khasi and Garo are depicted as pie diagrams (Figure 4), while the haplotype wise sharing pattern is furnished
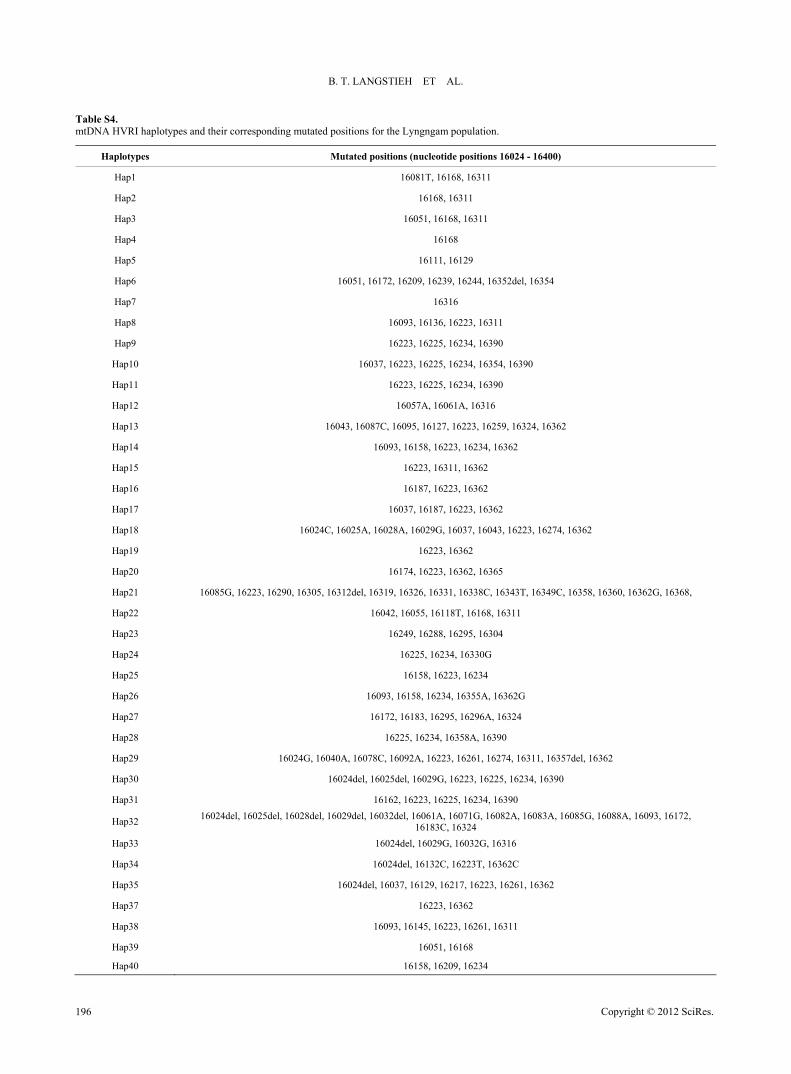
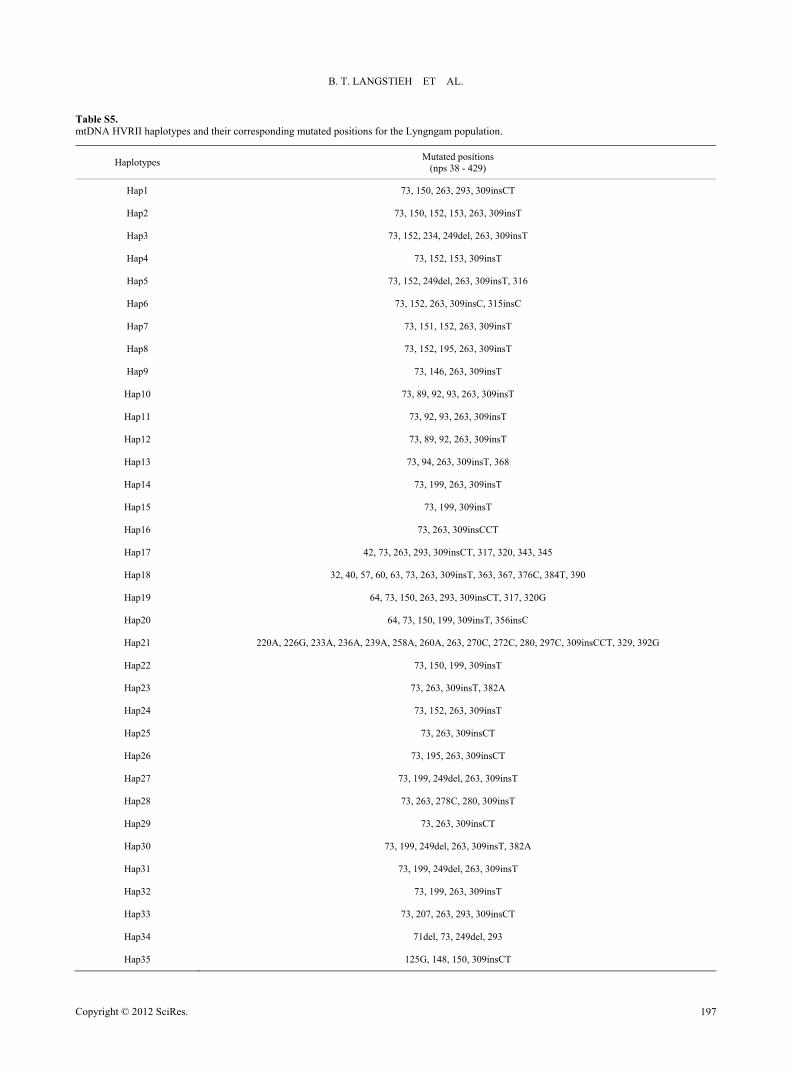
Supplementary Tables S1-S3. The mutational positions char- acterizing each haplotype of HVS I & II are given in Supple- mentary Tables S4 and S5. Overall, it appears that Khasi con-tribution to Lyngngam genetic constitution is overwhelmingly greater and more heterogeneous than the Garo, especially with reference to maternal lineages. In case of HVS I, 27 of the 40 haplotypes identified from 82 sequences are found to be Lyngngam specific, while it shares 7 haplotypes exclusively with Khasi and 6 with both the Khasi and Garo. Lyngngam
shares no HVS I haplotype exclusively with the Garo. Among the 6 that Lyngngam shares with both Khasi and Garo, haplo- type 3 and 7 are very predominantly found among the Garo, while haplotypes 9 and 19 are more widely shared with the Khasi. Of the 7 haplotypes that the Lyngngam exclusively shares with the Khasi, 17 and 38 are more widely found among the latter. Similarly, out of 35 haplotypes identified from the 73 Lyngngam HVS II sequences 20 were found unique to Lyngn- gam, 10 shared with both the Khasi and Garo and 3 and 2 with Khasi and Garo, respectively. It is interesting to note that nearly 60% of the Lyngngam samples represent the 10 haplotypes common to both the Khasi and Garo, while another 14% repre- sent 5 more haplotypes that are found either in Khasi or Garo. Out of these 15, while haplotypes 2, 14 and 25 are widely rep- resented by Khynriam, Nongtrai and Khynriam and Pnar, re- spectively, haplotypes 1 and 33 are most predominantly found in Garo.
Out of 54 Y-STR haplotypes identified from 60 male sam- ples of Lyngngam, 30 were found to be unique to Lyngngam, while 14 and 7, respectively, were shared with Khasi and Garo. The remaining 3 haplotypes are shared with both Khasi and Garo, suggesting that nearly half of Lyngngam male lineages probably had either Khasi or Garo origin. Although Garo con- tribution to Lyngngam male lineages outweighs the contribu- tion of an
e Khasi (25%) seems markedly more heterogeneous as well as outweigh the Garo contribution (12%). This finding is somewhat at variance to the pattern observed on the basis of Y-STR allele frequency based distances in which Lyngngam is relatively closer to Garo. All the 7 subgroups of Khasi share haplotypes with Lyngngam although Khynriam and Bhoi share relatively more haplotypes when compared to others.
Contribution of the Khasi and Garo Tribes of Meghalaya to the Genetic Constitution of Lyngngam
Using the software Admix2.0, we obtained admixture pro- portions separately for the 9 autosomal STRs, mtDNA HVS I & II and 6 Y-STRs. The admixture analysis was structured into 3 categories with Lyngngam assumed to be the hybrid population and 1) Khasi and Garo, 2) “Neighbouring Khasi” (Nongtrai Maram), “Other Khasi” and Garo and 3) Garo and each oindividual Khasi populations, respectively, as the putative pa-rental populations. The results of each of the three analyses are
esented in Table 4. In the first case, the contribution of Khasi is found to be much greater and much more significant to the genetic make up of the Lyngngam, when compared to the Garo in both autosomal STRs (82% against 18%) and mtDNA HVS I and HVS II sequence data (78% against 22%). Furthermore, it is evident from the results that the contribution of the “neighbouring Khasi” subgroups (Nongtrai and Maram) is rela- tively much greater than those farther apart namely the “Other Khasi” groups. However, when the individual Khasi popula- tions were considered the contribution of Garo (31%) in auto- somal STRs is shown to be greater than any individual Khasi population; only Maram comes closer (28%) to the contribution of Garo. Nevertheless, given that the Garo represents the tribe as a whole, the results of comparison with the pooled sample of Khasi would be most apt. The situation is somewhat at variance in the case of mtDNA HVS I & II, where the neighbouring Nongtrai, one of the Khasi subtribes, contributes disproportion-ately highly to the genetic constitution of Lyngngam (~53%),
Copyright © 2012 SciRes. 185

B. T. LANGSTIEH ET AL.
Copyright © 2012 SciRes. 186
Table 2. Lyngngam genetic distances with the 3 broad Meghalaya populations.
Genetic systems (distance measures) Garo Neighboring Khasi All Khasi
Autosomal STRs (Nei’s DA) 0.073 0.062 0.044
Y-STRs (Nei’s DA) 0.052 0.066 0.066
mtDNA HVS-I (pairwise FST) 0.085 0.039 0.025
mtDN FST) A HVS-II (pairwise 0.076 0.053 0.032
Table 3. Results of Mantel correlations between the distance matrices based on geography and different sets of DNA markers.
Geography Autosomal STR Y-STR mtDNA HVS I
Geography
Autosomal STR 0.1749
Y-STR 0.3919 0.0949
mtDNA HVS I 0.4972* −0.0398 0.4915
mtDNA HVS II 0.4974 0.0978 0.2708 0.797* *
Table 4. Admixture pr and their standard s (S.D.) for the autoso (9 loci), Y STR (6 mtDNA HVRS I & II.
(a) Two parental populations
oportions (m) deviation mal STR loci) and
Popn N Autosomal (m ± S.D.)
N Y chromosomal
(m ± S.D.) N
mtDNA HVS I N
mtDNA HVS II
mHV
(m ± S.D.) (m ± S.D.)
tDNA S I+II
(m ± S.D.)
Khasi 650 0.8151 ± 0.1310 274 0.3220 ± 94 ± 0.0726 344 0.6052 ± 0.1000 0.7787 ± 0.0707
0. 0 0.22 0.39 0.2
(b) Three parental populations
0.1895 353 0.77
Garo 128 1849 ± 0.131 67 0.6780 ± 0.1895 87 06 ± 0.0726 94 48 ± 0.1000 213 ± 0.0707
Neigh. Khasi 186 0.5122 ± 0.1395 76 0.1607 ± 1.7581 102 0.3971 ± 0.2294 106 0.0984 ± 0.2137 0.3916 ± 0.2236
Other Khasi 464 0.2382 ± 0.1583 198 0.2148 ± 1.8829 251 0.3913 ± 0.2239 238 0.6016 ± 0.2040 0.3990 ± 0.2135
Garo 128 0.2496 ± 0.1140 67 0.6244 ± 0.3211 87 0.2117 ± 0.0747 94 0.3000 ± 0.1066 0.2094 ± 0.0730
(c) Nine individual Meghalaya populations
Popn N Autosomal (m ± S.D.)
N Y chromosomal
(m ± S.D.)
N
mtDNA
(m ± S.D.)
mtDNA
(m ± S.D.)
mtDNA
(m ± S.D.) HVS I N HVS II HVS I + II
Nongtrai 90 0.1850 ± 0.1354 18 3005 29 0.3925 ± 0.1928 0.5310 ± 0.2821
M 0. 7 0.02 −0.1 2 0. 0
Khynriam 146 −0.0177 ± 0.3536 82 0.0476 ± 2.8416 95 0.05 100 0.34 0.03
Pnar 100 0.1131 ± 0.1652 40 −0.3932 ± 3.2148 69 0.1160 ± 0.1481 58 0.1266 ± 0.1972 0.1250 ± 0.1568
Bhoi 90 0.1517 ± 0.3341 32 −0.1736 ± 1.8787 34 0.0789 ± 0.0989 33 0.0884 ± 0.1983 0.0753 ± 0.0985
War-Khasi 82 0.0016 ± 0.1235 23 0.1572 ± 1.2828 31 0.0939 ± 0.1555 27 −0.0168 ± 0.1302 0.0963 ± 0.1567
War-Jaintia 46 −0.0216 ± 0.3448 21 0.2828 ± 1.0826 22 −0.0005 ± 0.0425 20 0.0742 ± 0.0850 0.0001 ± 0.0423
Garo 128 0.3065 ± 0.1824 67 0.7939 ± 1.6881 87 0.1047 ± 0.1544 94 0.1509 ± 0.1380 0.1039 ± 0.1436
0.0467 ± 1.2817 30 0.5231 ± 0.
aram 96 2814 ± 0.167 58 0.2386 ± 2.7037 72 67 ± 0.1975 77 624 ± 0.137 0304 ± 0.205
72 ± 0.2929 66 ± 0.2691 81 ± 0.2925
Note: N = Sample size. *

B. T. LANGSTIEH ET AL.
Figure 3. Projection of Meghalaya tribal populations on the two-dimensional space based on the multi-dimensional scaling distances based on different sets of markers (For MDS, the stress value and R2 for Autosomal STR, Y-STR, HVS I and HVS II are 0.124 & 0.94, 0.214 & 0.84, 0.149 & 0.93 and 0.142 & 0.92, respectively); (a) Autosomal STRS; (b) Y-STRS; (c) mtDNA HVRI; (d) mtDNA HVRII.
Figure 4. Pattern of sharing of mtDNA and Y-STR haplotypes between Lyngngam individuals and putative parental populations, the Khasi and Garo. the next highest contribution being from Pnar (12%) and Garo the trend observed in Y-STR haplotype sharing, suggest that
the Garo contribution (68%) to Lyngngam outweighs that of th2%) in r Khasi
(11%). On the other hand, the admixture proportions based on the
allele frequency at the 6 Y-chromosome STR loci, contrary to Khasi (32%). Garo contribution is similarly high (6comparison to the neighbouring Khasi (16%) and othe
e
Copyright © 2012 SciRes. 187

B. T. LANGSTIEH ET AL.
groups (22%). Further, when individual Khasi subtribes are
ution of Garo turns out to be much higher (79%).
r- i-
versity of this region as he other regions of the country (Clark et al., 2000; Dutt ; Cordaux et al., 20
these populations are somewhat permeable, creating possibili- considered as putative parental populations along with Garo, the contrib
Discussion
Northeast region of India was considered as an important corridor for historic and prehistoric movement of populations into and out of the Indian subcontinent (Clark et al., 2000; Cor- daux et al., 2003, 2004; Reddy et al., 2007) and provides com- plex population history characterized by multiple ethnic, lin- guistic and migration backgrounds. This has resulted in enomous cultural (Hussain, 1991; Sharma, 1966) and genetic d
compared to ta et al., 2002
04; Langstieh et al., 2004b; Reddy et al., 2005). Populations of this region are predominantly of tribal origin, interspersed with some caste populations. Composed of East Asian and European ethnic elements, they speak languages of three major linguistic families-Tibeto-Burman, Indo-European and Austro- Asiatic. Unlike in the rest of India, the tribal boundaries of
ties for exchange of genes among them. The Lyngngam tribe of Meghalaya whose genetic origins are being investigated is in the midst of Austro-Asiatic Khasi and Tibeto-Burman Garo, the two tribal clusters that primarily inhabit this state. Having been affiliated to the same linguistic group, there is every indication that the Lyngngam might have originated from the common source as that of the Khasi populations. However, given its geographic position contiguous to Garo and only to a couple of Khasi subtribes, the Lyngngam has had little day-to-day inter- action with the majority of the Khasi sub-tribes. In the above background, despite the lack of mobility of female lineages in this matrilocal society, the high proportions of Khasi specific autosomal and mtDNA lineages observed in the Lyngngam and vice versa reflect that the initial constitution/founding of female lineages of the Lyngngam and Khasi sub-populations probably would have been from a common source. As far as the individ- ual Khasi populations are concerned, the Nongtrai neighbor seems the most probable candidate to have contributed pre- dominantly to the Lyngngam female lineages as reflected by not only the high proportion of admixture (~53%) with refer-
Figure 5. Plot on the first two dimensions derived from the multi-dimensional scaling of the pairwise FST distances of the populations based on Y-haplogroups (for comparative data, refer Reddy et al., 2007). SEA = Southeast Asian; AA = Austro-Asiatic; IE = Indo-European; TB = Tibeto-Burman; Khy = Khynriam; Lyn = Lyngngam; Wkhasi = War Khasi; Viet = Vietnamese (adapted from Reddy et al., 2007).
Copyright © 2012 SciRes. 188

B. T. LANGSTIEH ET AL.
Figure 6. Plot on the first two-dimensions derived from the multidimensional scaling of the pairwise FST distances of the populations based on mtDNA hap-logr an; Wk enccommon maternal clans found among the Nongtrai and Lyngn- gam (Langstieh & Reddy, 2004). This is reflected partly in the high mantel correlation between geographic and genetic dis- tance matrices based on mtDNA sequences as well as in the relative proximity of the Lyngngam to the Nongtrai in the MDS plot based on mtDNA distances (Figure 3).
To sum up, the foregoing analyses of the ethnohistoric, lin- guistic and demographic information in conjunction with the molecular genetic evidence trace Khasi (more particularly the Nongtrai subtribe of Khasi) as the most probable parental source of the Lyngngam, which is consistent with the first of the four notions concerning the origin of this tribe as outlined in the in- troduction. Nevertheless, it is necessary to discount the possibil- ity of Lyngngam origin from the sources outside Megha- laya/India, particularly from the populations of Southeast Asia, where from many Tibeto-Burman populations were known to have migrated to Northeast India, before any rational conclu- sion on their origin can be drawn. A strong support for Khasi origin of the Lyngngam can be drawn from Reddy et al. (2007) who performed multidimensional scaling analysis of the FST
distances based on mtDNA and Y-chromosome haplogroup
ustro-Asiatic populations from the South and Southeast Asia, including the 7 Khasi subtribes, Lyngngam and Garo of the present study. The two-dimensional plots representing the populations in the mul- tivariate space are reproduced here for Y-chromosome (Figure 5) and mtDNA (Figure 6). The position of Lyngngam in both the plots is relatively more proximate to the Austro-Asiatic Khasi tribes of Meghalaya when compared to the Garo as well as to other South Asian and Southeast Asian populations, Austro-Asiatic or non Austro-Asiatic, ruling out the possibility of their origin from outside Meghalaya and/or outside the Austro-Asiatic Khasi. There is nothing in the results that goes against concluding Khasi (particularly the Nongtrai) origin of the Lyngngam tribe despite limited statistical power of the study with small number of genetic loci employed.
REFERENCES
Ahmed, T. J., Sengupta, S., & Ghosh, A. K. (1997). A genetic study on the Lyngàm of Meghalaya. Journal of Human Ecology, 8, 473-475.
Andrews, R. N., Kubacka, I., Chinnery, P. F., Lightowlers, R. N., Turnbull, D. M., & Howell, N. (1999). Reanalysis and revision of the Cambridge reference sequence for human mitochondrial DNA. Na-
oups (for comparative data, refer Reddy et al., 2007). SEA = Southeast Asian; AA = Austro-Asiatic; IE = Indo-European; TB = Tibeto-Burm= WarKhasi; Ch = Chong (adapted from Reddy et al., 2007).
e to mtDNA HVS sequences but also the high proportion of frequency data of the Austro-Asiatic and non-A
Copyright © 2012 SciRes. 189
B. T. LANGSTIEH ET AL.
plateau? In J. P. Singh, & G. Sengupta, (Eds.), Archaeology of North East India (pp. 74-85). New Delhi: Vikas Publishing House Pvt. Ltd.
Jorde, L. B., Rodgers, A. R., Bamshad, M., Watkins, W. S., Krakowiak, P., Sung, S., Kere, J., & Harpending, H. C. (1997). Microsatellite di- versity and the demographic history of modern humans. Proceedings of the National Academy of Sciences, 94, 3100-3103. doi:10.1073/pnas.94.7.3100
ture Genetics, 23, 147. doi:10.1038/7727 Applied Biosystems (2001). PCR protocols for AmpFℓSTR profiler plus.
PE applied biosystems human identification group. Foster City, CA: Applied Biosystems.
Bareh, H. (1967). The history and culture of the Khasi people. Guahati: Spectrum Publications.
Barrett, D. (1982). World christian encyclopedia. New York. Bertorelle, G., & Excoffier, L. (1998). Inferring admixture proportions
from molecular data. Molecular Biology and Evolution, 15, 1298- 1311. doi:10.1093/oxfordjournals.molbev.a025858
Karve, I., & Dandekar, V. M. (1951). Anthropometric measurements of
Maharashtra. Deccan College Monograph Series 8. Karve, I., & Malhotra, K. C. (1968). Biological comparison of eight-
endogamous groups of the same rank. Current Anthropology, 9, 109-124. doi:10.1086/200976
Bhattacharjee, J. B. (1978). The Garos and the English. New Delhi:
Radiant Publishers. Butler, J. M., Schoske, R., Vallone, P. M., Kline, M. C., Redd, A. J. et
al. (2002). A novel multiplex for simultaneous amplification of 20 Y-chromosome STR markers. Forensic Science International, 129, 10-24. doi:10.1016/S0379-0738(02)00195-0
Karve, I. (1961). Hindu society, an interpretation. Poona: Deccan Col-
lege. Kittles, R. A., Bergen, A. W., Urbanek, M., Virkkunen, M., Linnoila,
M., Goldman, D., & Long, J. (1999). Autosomal, mitochondrial and Y chromosome DNA variation in Finland: Evidence for a male-spe- cific bottleneck. American Journal of Physical Anthropology, 108, 381-399. doi:10.1002/(SICI)1096-8644(199904)108:4<381::AID-AJPA1>3.0.
Cann, R. L., Stoneking, M., & Wilson, A. C. (1987). Mitochondrial
DNA and human evolution. Nature, 325, 31-36. doi:10.1038/325031a0
Chakraborty, R. (1986). Gene admixture in human populations: Models and predictions. Yearbook of Physical Anthropology 29, 1-43. doi:10.1002/ajpa.1330290502
CO;2-5
Kivisild, T., Bamshad, M. J., Kaldma, K., Metspalu, M., Metspalu, E., Reidla, M., Laos, S., Parik, J., Watkins, W. S., Dixon, M. E., Papiha, S. S., Mastana, S. S., Mir, M. R., Ferak, V., & Villems, R. (1999). Deep common ancestry of Indian and Western Eurasian mitochon- drial DNA lineages. Current Biology, 9, 1331-1334. doi:10.1016/S0960-9822(00)80057-3
Chu, J. Y., Huang, W., Kuang, S. Q., Wang, J. M., Xu, J. J., Chu, Z. T.,
Yang, Z. Q., Lin, K. Q., Li, P., Wu, M., Geng, Z. C., Tan, C. C., Du, R. F., & Jin, L. (1998). Genetic relationship of populations in China. Proceedings of the National Academy of Sciences, 95, 11763-11768. doi:10.1073/pnas.95.20.11763
Clark, V. J., Sivendran, S., Saha, N., Bentley, G. R., Aunger, R., Sira- juddin, S. M., & Stoneking, M. (2000). The 9-bp deletion between the mitochondrial Lysine tRNAand COII genes in tribal populations of India. Human Biology, 72, 273-285.
Cordaux, R., Saha, N., Bentley, G. R., Aunger, R., Sirajuddin, S. M., & Stoneking, M. (2003). Mitochondrial DNA analysis reveals diverse histories of tribal populations from India. European Journal of Hu- man Genetics, 11, 253-264. doi:10.1038/sj.ejhg.5200949
Kivisild, T., Rootsi, S., Metspalu, M., Mastana, S., Kaldma, K., Parik,
J., Metspalu, E., Adojaan M., Tolk, H. V., Stepanov, V., Golge, M., Usanga, E., Papiha, S. S., Cinnioglu, C., King, R., Cavalli-Sforza, L., Underhill, P. A., & Villems, R. (2003). The genetic heritage of the earliest settlers persists both in Indian tribal and caste populations. American Journal of Human Genetics, 72, 313-339. doi:10.1086/346068
Kivisild, T., Tolk, H. V., Parik, J., Wang, Y., Papiha, S. S., Bandelt, H.-J., & Villems, R. (2002). The emerging limbs and twigs of the East Asian mtDNA tree. Molecular Biology Evolution, 19, 1737- 1751. doi:10.1093/oxfordjournals.molbev.a003996
Cordaux, R., Weiss, G., Saha, N., & Stoneking, M. (2003). The North-
east Indian passageway: A barrier or corridor for human migrations? Molecular Biology and Evolution, 21, 1525-1533.
93/molbev/msh151
Kong, Q. P., Yao, Y. G., Sun, C., Bandelt, H. J., Zhu, C. L. et al. (2003). doi:10.10
62, 1031-1041. doi:10.1016/S0198-8859(01)00312-3
Crawford, M. H., Reddy, B. M., Martinez-Laso, J., Mack, S., Erlich, H. (2001). Genetic variation among the Golla pastoral caste subdivi- sions of Andhra Pradesh, India: HLA system. Human Immunology,
ifferent altitudes in
Diffloth, G. (2005). The contribution of linguistic palaeontology to the homeland of Austro-Asiatic. In L. Sagart, R. Blench, & A. San- chez-Mazas (Eds.), The Peopling of East Asia: Putting Together Ar- chaeology, Linguistics and Genetics (pp. 77-81). London: Routledge Curzon.
Dipierri, J. E., Alfaro, E., Martínez-Marignac, V. L., Bailliet, G., Bravi, C. M., Cejas, S., & Bianchi, N. (1998). Paternal directional mating in two Amerindian subpopulations located at dnorthwestern Argentina. Human Biology, 70, 1001-1010.
Dupanloup, I., & Bertorelle, G. (2000). Computing admixture coeffi- cients from molecular data. http://cmpg.unibe.ch/software/admix/
Dutta, R., Reddy, B. M., Chattopadhyay, P., Kashyap, V. K., Sun, G., & Deka, R. (2002). Patterns of genetic diversity at the 9 forensi- cally approved STR loci among the Indian populations. Human Bi- ology, 74, 33-49. doi:10.1353/hub.2002.0002
Ehrenfels, U. R. (1955). Three matrilineal groups of Assam. American Anthropologist, 57, 306-321. doi:10.1525/aa.1955.57.2.02a00080
Grierson, G. A. (1928). The Mon-Khmer family. In G. A. Grierson, (Ed.) Languages of North Eastern India—A Survey (pp. 1-57). New Delhi: Gian Publishing House.
Gurdon, P. R. T. (1907). The Khasis. New Delhi: Low Price Publica- tion.
Hussain, Z. (1991). Who are the pre-historic dwellers of the Meghalaya
Phylogeny of East Asian mitochondrial DNA lineages inferred from complete sequences. American Journal of Human Genetics, 73, 671- 676. doi:10.1086/377718
Kumar, V., Basu, D., & Reddy, B. M. (2004). Genetic heterogeneity in northeastern India: Reflection of Tribe-Caste continuum in the ge- netic structure. American Journal Human Biology, 16, 334-345. doi:10.1002/ajhb.20027
Kumar, V., Reddy, A. N. S., Babu, J. P., Rao, T. N., Langstieh, B. T., Thangaraj, K., Reddy, A. G., Singh, L., & Reddy, B. M. (2007). Y-chromosome evidence suggests a common paternal heritage of Austro-Asiatic populations. BMC Evolutionary Biology, 7, 47. doi:10.1186/1471-2148-7-47
Langstieh, B. T. (2003). Ethnic origin and population structure of the Lyngngam of Meghalaya, India. Ph.D. Thesis, Calcutta: Calcutta University.
Langstieh, B. T., & Reddy, B. M. (2004a). Ethno-historic and linguistic background of the Lyngngam and its demographic structure. Journal of North Eastern Hill University, 2, 15-42.
Langstieh, B. T., Reddy, B. M., Thangaraj, K., Kumar, V., & Singh, L. (2004b). Genetic diversity and relationships among the tribes of Meghalaya compared to other Indian and Continental populations. Human Biology, 76, 569-90. doi:10.1353/hub.2004.0057
Langstieh, B. T., & Reddy, B. M. (1999). The origin and ethnic posi- tion of Lyngngam am alaya: An exploratory ong the tribes of Meghstudy. Journal of Indian Anthropological Society, 34, 265-275.
Malhotra, K. C. (1978). Founder effect, gene drift and natural selection among four nomadic Mendelian isolates. In R. J. Meier et al. (Eds.), Evolutionary models and studies in human diversity (pp. 279-314).
Copyright © 2012 SciRes. 190

B. T. LANGSTIEH ET AL.
Copyright © 2012 SciRes. 191
The Hague: Mouton. doi:10.1515/9783110800043.315 alhotra, K. C. (1979). Excommunication as a process leading to the formation of new groups. The Eastern Anthropol
Mogist, 32, 49-53.
4). New York: Plenum Press.
ajumder (Ed.), Human Population Genetics
Malhotra, K. C. (1984). Population structure among the Dhangar caste- cluster of Maharashtra, India. In J. R. Lukacs (Ed.), The People of South Asia (pp. 295-32
Malhotra, K. C., & Vasulu, T. S. (1993). Structure of human popula- tions in India. In P. P. M(pp. 207-233). New York: Plenum Press. doi:10.1007/978-1-4615-2970-5_15 athur, P. R. (1979). The Khasi of Meghalaya. New Delhi: Cosmo. itchell, R. J., Reddy, B. M., Campo, D., Infantino, T., Kaps, M., &
MM
Crawford, M. H. (2006). Genetic diversity within a caste population of India as measured by Y chromosome haplogroups and haplotypes: sub-castes of the Golla of Andhra Pradesh. American Journal of Physical Anthropology, 130, 385-393. doi:10.1002/ajpa.20329
ei, M., Tajima, F., & Tateno, Y. (1983). Accuracy of estimated phy- logenetic trees from molecular data. Journal of Molecular Evolution, 19, 153-170. doi:10.1007/BF02300753
N
Nongsiang, E. D. (1994). Various forms of festivals and ceremonies of
the Lyngams. In K. R. Marak, & R. Wankhar (Ceremonies in Meghala
Eds.), Festivals and
P print
R. Journal of Biosocial Sciences, 16,
ya (pp 120-123). Shillong: Department of Art and Culture, Government of Meghalaya.
layfair, A. (1909). The Garos. Gauhati: United Publishers, Re1975.
Reddy, B. M. (1983). Temporal trends in marriage distance and village endogamy among the migrant groups of fishermen of coastal Orissa. Collagium Anthropologicum, 7, 125-135.
eddy, B. M. (1984). Demographic structure of the migrant groups of fishermen of Puri coast, India385-398. doi:10.1017/S0021932000015200
eddy, B. M. (2010). Population structure and genetic perspectives on the Indian fishermen. In M. K. Bhasin, & C. Sussane (Eds.), An- thropology Today: Trends and Scope of Human Biology. Anthro-
R
pologist, 6, 165-181. Reddy, B. M., Chopra, V. P., Rodewaldt, A., Dey. B., Veerraju, P., &
Rao, T. V. (1995). Genetic affinities between migrant and parental populations of fishermen on the east coast of India. American Jour- nal of Human Biology, 7, 51-63. doi:10.1002/ajhb.1310070108
Reddy, B. M., & Chopra, V. P. (1999). Biological affinities between the parental and migrant populations of fishermen of the east coast of India. Human Biology, 71, 803-822. ddy, B. M., Sun, G., Javier, RRe . L., Crawford, M. H., Hemam, N. S., & Deka, R. (2001a). Genomic diversity at the 13 STR loci among the 7 subcastes of the substructured Golla population of southern Andhra Pradesh, India . Human Biology, 73, 175-190. doi:10.1353/hub.2001.0025
Reddy, B. M., Demarchi, D. A., & Malhotra, K. C. (2001b). Patterns of variation in a caste-cluster of Dhangars of Maharashtra, India. Colla- gium Antropologicum,25, 425-442.
eddy, B. M., Pfeiffer, A., Crawford, M. H., & Langstieh, B. T. (2001). Populatio
Rn substructure and patterns of quantitative variation among
the Gollas of southern Andhra Pradesh, India. Human Biology, 73, 291-306. doi:10.1353/hub.2001.0026 ddy, B. M., Naidu, V. M., Madhavi, V. K., Thangaraj, K., Kumar, V., Langstieh, B. T., Venkatramana, P. V., Reddy, A. G., & Singh, L.
Re
(2005). Microsatellite diversity in Andhra Pradesh, India: Genetic-stratification versus social stratification. Human Biology, 77, 803- 823. doi:10.1353/hub.2006.0018
R . M., Langstieh, B. T., Kumar, V., Nagaraja, T., Aruna, M., eddy, BThangaraj, K., Reddy, A. N. S., Reddy, A. G., & Singh, L. (2007). Austro-asiatic tribes of northeast India provide missing genetic link between south and Southeast Asia. PLoS One, 2, e1141.
Reddy, B. M., Tripathy, V., Kumar, V., & Nirmala , A. (2010). Mo- lecular genetic perspectives on the Indian social structure. American Journal of Human Biology, 22, 410-417. doi:10.1002/ajhb.20983
elethford, J. H. (1993). MANTEL for Windows version 2.0. odborne, T. (1977). U Khasi. Shillong, Meghalaya, Sh
RR illong: Mrs. H.
San
S
S., Lu, D., Luo, J., Chu, J., Tan, J., Shen, P., Davis, R.,
, & Jin, L. (1999). Y-chromosome evidence for a northward
Rodborne. Sambrook, J., Fritsch, E. F., & Maniatis, T. (1989). Molecular cloning:
A laboratory manual (2nd ed.). New York: Cold Spring Harbor Laboratory Press.
gma, M. S. (1981). History and Culture of the Garos. New Delhi: osmo Publishing. C
Schneider, S., Roessli, D., & Excoffier, L. (2000). Arlequin ver. 2.000: A software for population genetics data analysis. Switzerland: Ge- netics and Biometry Laboratory, University of Geneva.
harma, T. C. (1966). Researches on the prehistoric archaeology of Assam. Journal of the Assam Scientific Society, 9, 1-11.
u, B., Xiao, J., Underhill, P., Deka, R., Zhang, W., Akey, J., Huang, W., Shen, DCavalli-Sforza, L., Chakraborty, R., Xiong, M., Du, R., Oefner, P., Chen, Z.migration of modern humans into eastern Asia during the last ice age. American Journal Human Genetics, 65, 1718-1724. doi:10.1086/302680
wadesh, M. (1950). Salish internal relationships. International Journal American Linguistics, 16, 157-167.
Sdoi:10.1086/464084
wadesh, M. (1951). Diffusional accumulation and archaic residue asS
T
U o, G., Yang, W. nné-Tamir, B., Bertrandpetit, J., Francalacci, P.,
enetics, 26, 358-
historical explanations. Southern Journal of Anthropology, 7, 1-21. Swadesh, M. (1972). The origin and diversification of language. Lon-
don: Routledge & Kagen Paul. hapa, R., Sengupta, S., & Ghosh, A. K. (1998). Dermatoglyphics of the lyngngàm of meghalaya. Indian Journal of Human Ecology, 9, 629-631.
nderhill, P. A., Shen, P., Lin, A. A., Jin, L., PassarinH., Kauffman, E., BoIbrahim, M., Jenkins, T., Kidd, J. R., Mehdi, S. Q., Seielstad, M. T., Wells, R. S., Piazza, A., Davis, R. W., Feldman, M. W., Cavalli- Sforza, L. L., & Oefner, P. J. (2000). Y chromosome sequence varia-tion and the history of human populations. Nature G361. doi:10.1038/81685 ells, R. S., Yuldasheva, N., Ruzibakiev, R., Underhill, P. A., Evseeva, I., Blue-Smith, J., Jin, L., Su, B., Picchappan, R., Shanmugalakshmi, S., Balakrishnan, K., Read
W
, M., Pearson, N. M., Zerjal, T., Webster,
sity.
M. T., Zholoshvili, I., Jamarjashvili, E., Gambarov, S., Nikbin, B., Dostiev, A., Aknazarov, O., Zalloua, P., Tsoy, I., Kitaev, M., Mirra- khimov, M., Chariev, A., & Bodmer, W. F. (2001). The Eurasian heartland: A continental perspective on Y-chromosome diverProceedings of the National Academy of Sciences, 98, 10244-10249. doi:10.1073/pnas.171305098 illiams, R. C., Knowler, W. C., Pettitt, D. J., Long, J. C., Rokala, D. A., Polesky, H. F., Hackenberg, R. A., Steinberg, A. G., & Bennett, P. H. (1992). The magnitude and origin of European-American ature in the Gila River Indian c
W
dmix-
ommunity of Arizona: A union of ge- netics and demography. American Journal of Human Genetics, 51, 101-110.

B. T. LANGSTIEH ET AL.
AT
and G
ppendix able S1.
Sharing pattern of the Lyngam Y-haplotypes with the neighbouring Khasi aro.
DYS DYS DYS DYS DYS DYS
Hap. No. 19 389I 389II 390 391 393 Lyng lGaro Nong Mara Khyn Pnar Bhoi WarK WarJ Tota
Unique to L
1
1
1
9 10 12 1
1
1
1
1 1
1
1
1
1
1
1
Hap23 16 9 26 11 10 13 1 1
Hap24 16 10 26 11 10 14 1 1
Hap25 15 10 27 9 10 14 1 1
Hap26 17 10 27 10 10 13 1 1
yngam
Hap1 14 11 27 9 10 11 1
Hap2 16 9 26 11 10 12 2
Hap3 15 11 27 9 10 13 1
2
1
Hap4 14 9 25 10 10 13 1
Hap5 14 10 25
1
10 10 13
Hap6 15 10 27 11 10 12 1
1
1
1
Hap7 14 9 27 9 10 13 1
Hap8 15 8 29 11 10 13 1
Hap9 15 8 27 1
Hap10 12 9 26 9 10 12 1
Hap11 15 9 26 11 10 13 1
Hap12 15 9 28 11 10 13
1
1
1
1
Hap13 15 14 28 10 10 12 1
Hap14 12 9 28 10 10 14
Hap15 13 9 26 9 10 16
Hap16 16 9 27 10 11 13
Hap17 15 9 27 10 11 13
1
1
1 Hap18 15 8 27 10 10 13
Hap19 17 10 27 10 10 12
Hap20 15 10 26 11 11 12
1
1
1 Hap21 16 10 28 10 10 13 1
Hap22 15 10 27 9 11 16 1
Copyright © 2012 SciRes. 192

B. T. LANGSTIEH ET AL.
Continued
15 10 24 12 10 13 1 1 Hap27
Hap28 15 11 28 8 11 11 1 1
1
Ha 30 1 1
Shared with either Khasi or Garo
Hap31 15 9 27 10 10 12 1 3 4
Hap32 14 9 25 9 10 11 1 2 3
Hap33 15 9 26 9 11 12 1 1 2
Ha 15 9 26 10 10 11 1 1
Ha 1
are ith bo Khasi and Ga
Hap54 15 9 26 9 10 11 2 3 1 1 7
Hap29 15 11 28 8 10 12 1
p 14 9 26 10 11 11
p34 2
p35 15 10 29 11 10 12 1 2
Hap36 13 10 27 10 10 12 1 1 2
Hap37 17 9 26 10 10 11 1 1 1 3
Hap38 15 10 27 9 10 13 1 1 2
Hap39 15 9 27 9 11 12 1 1 2
Hap40 15 9 27 9 10 11 1 1 2
Hap41 14 9 26 9 10 13 1 1 2
Hap42 15 11 27 11 11 13 1 1 2
Hap43 15 10 26 11 11 13 2 1 1 4
Hap44 15 11 29 11 10 12 1 1 2
Hap45 16 11 28 11 11 12 1 2 3
Hap46 15 10 27 9 11 12 1 1 1 3
Hap47 15 11 26 11 11 13 1 1 2
Hap48 15 9 26 11 10 11 1 1 2 4
Hap49 16 10 27 11 10 12 1 1 1 3
Hap50 16 10 26 11 10 12 1 1 2
Hap51 15 10 26 9 11 13 1 3 4
Sh d w th ro
Hap52 15 10 27 10 10 13 1 2 1 1 5
Hap53 15 9 27 10 10 13 3 1 1 5
Copyright © 2012 SciRes. 193
B. T. LANGSTIEH ET AL.
Table S2. D n and uency of nally red R I oty f Ly ngam and Khasi population
pe ngngam G ong aram Kh riam Pna h WarKhasi War aintia
istributio freq mater sha HV hapl pes o ng with Garo s.
Haploty Ly aro N trai M yn r B oi J
n = 82 n = 87 n = 30 n = 72 n = 95 n = 69 n = 34 n = 31 n = 22
Unique to Lyngng Total
1 0 0 0 0 0 0 0 0 1
1 0 0 0 0 0 1
1 0 0 0 0 0 0 0 0 1
1 0 0 0 0 0 0 0 0 1
1 0 0 0 0 0 1
6 1 0 0 0 0 0 0 1
7 1 0 0 0 0 0 0 0 0 1
1 0 0 0 0 0 1
1 0 0 0 0 0 0 0 1
5 0 0 0 0 0 0 0 0 5
1 0 0 0 0 0 1
1 0 0 0 0 0 0 0 1
13 1 0 0 0 0 0 0 0 0 1
1 0 0 0 0 0 1
2 0 0 0 0 0 0 0 2
1 0 0 0 0 0 0 0 0 1
1 0 0 0 0 0 1
1 0 0 0 0 0 0 0 1
19 1 0 0 0 0 0 0 0 0 1
1 0 0 0 0 0 1
1 0 0 0 0 0 0 0 1
22 1 0 0 0 0 0 0 0 0 1
2 0 0 0 0 0 2
24 1 0 0 0 0 0 0 0 0 1
1 0 0 0 0 0 1
1 0 0 0 0 0 1
27 1 0 0 0 0 0 0 0 0 1
Shar ith only
28 1 0 0 0 5 0 0 0 1 7
5 0 1 2 5 4 28
2 0 0 1 0 0 3
31 1 0 1 0 0 0 0 0 0 2
1 0 1 1 0 0 3
1 0 0 12 3 1 23
34 1 0 0 0 0 0 0 2 0 3
red w th Khas d Gar
3 10 1 0 1 1 0 0 0 16
36 9 42 3 0 0 0 0 1 0 55
14 1 4 3 4 1 30
38 3 1 3 2 0 0 0 14
39 4 2 1 0 0 0 0 0 0 7
4 1 0 1 0 0 7
am
1
2 0 0 0
3
4
5 0 0 0
0 0
8 0 0 0
9
10
0
11 0 0 0
12 0
14 0 0 0
15
16
0
17 0 0 0
18 0
20 0 0 0
21 0
23 0 0 0
25 0 0 0
26 0 0 0
ed w Khasi
29 8 1 2
30 0 0 0
32 0 0 0
33 6 0 0
Sha ith bo i an o
35
37 2 1 0
5 0
40 0 1 0
Copyright © 2012 SciRes. 194
B. T. LANGSTIEH ET AL.
Table S3. D n and uency of ternally red R I loty of L ngam ith G and Khasi populatio
H type Lyng Non M m Khy P r oi Wa WarJ
istributio freq ma sha HV I hap pes yng w aro ns.
Sl. No. aplo Garo g ara n na Bh rK
n = 73 n = 94 n = 29 n = 77 n = 100 n = 58 n = 33 n = 27 n = 20
Unique to Lyngngam Total
1 0 0 0
2 10 1 0 0 0
3 1 0 0 0 0 0 0 0
4 13 1 0 0 0 0 0 0 0
5 17 1 0 0 0 0 0 0 0
6 18 1 0 0 0 0 0 0 0
7 19 1 0 0 0 0 0 0 0
8 20 1 0 0 0 0 0 0 0
9 21 1 0 0 0 0 0 0 0
1 22 1 0 0 0 0 0 0 0
1 23 1 0 0 0 0 0 0 0
1 28 1 0 0 0 0 0 0 0
13 29 1 0 0 0 0 0 0 0
14 30 1 0 0 0 0 0 0 0
1 31 1 0 0 0 0 0 0 0
1 32 1 0 0 0 0 0 0 0
1 34 1 0 0 0 0 0 0 0
1 35 1 0 0 0 0 0 0 0
Share ith both Khasi and Garo
1 1 6 19 3 0 0 0 0 0
2 2 8 1 1 0 9 2 1 0
2 3 1 2 0 0 0 2 1 0
22 9 5 1 1 1 1 1 1 0 11
2 14 6 1 6 0 2 2 0 0
2 15 2 1 1 0 0 0 0 0
2 16 1 2 1 1 1 1 0 1
2 24 1 1 0 0 2 2 0 0
27 2 4 11 17 3 1 47
2 27 6 1 0 0 1 2 1 1
Shared with only asi
2 4 1 0 0 0 0 2 0 0
30 5 1 0 0 0 0 0 0 0
31 6 1 0 2 2 1 0 3 0
32 11 5 0 1 0 0 0 0 0
33 0 1 0 0 0 0
S ared with only ro
3 8 1 1 0 0 0 0 0 0
3 33 1 14 0 0 0 0 0 0
1 7 0 0 0 0 0 1
0 0 0 0 0 1
12 0 1
0 1
0 1
0 1
0 1
0 1
0 1
0 0 1
1 0 1
2 0 1
0 1
0 1
5 0 1
6 0 1
7 0 1
8 0 1
d w
9 0 28
0 1 23
1 0 6
0
3 0 17
4 0 4
5 0 8
6 0 6
25 7 2 0
8 0 12
Kh
9 1 4
3 4
0 9
0 6
26 2 0 0 3
h Ga
4 0 2
5 0 15
Copyright © 2012 SciRes. 195
B. T. LANGSTIEH ET AL.
Table mtDN VRI haplotyp orresponding mutated positions for the Lyngngam population.
lotypes Mutated sitions (nuc ide posit s 16024 6400)
S4.A H es and their c
Hap po leot ion - 1
Hap1 16081T, 16168, 16311
Hap2 16168, 16311
Hap3 1, 31
Hap4
Hap5 16111, 129
Hap6 1, 16172, 209, 162 16244, 1 2del, 16
Hap7 16
Hap8 93, 16136, 223, 16
Hap9 23, 16225, 234, 16
Hap10 16037, 23, 16225, 234, 16 16390
Hap11 23, 16225, 234, 16
Hap12 057A, 16 A, 1631
Hap13 160 16087C, 95, 1612 6223, 16 , 16324, 362
Hap14 1609 158, 16 16234, 362
Hap15 16223, 16 16362
Hap16 16187, 16 16362
Hap17 37, 16187, 223, 16
Hap18 16024C, 1 , 16028A, 16029G 037, 160 16223, 4, 1636
Hap19 16223, 362
Hap20 74, 16223, 362, 16
Hap21 16085G 23, 1629 6305, 163 del, 1631 6326, 163 16338C 343T, 16 , 1635 60, 1 , 1636
Hap22 1604 6055, 161 , 16168, 311
Hap23 49, 16288, 295, 16
Hap24 225, 162 16330G
Hap25 16158, 16 16234
Hap26 16093, 158, 1623 355A, 362G
Hap27 1617 6183, 162 16296A 324
Hap28 16 5, 16234, 358A, 16
Hap29 16 , 16040 6078C, 2A, 1622 16261, 1 4, 16311 6357del, 362
Hap30 16 l, 1602 l, 16029G 6223, 16 16234, 90
Hap31 1616 16223, 16 5, 16234, 16390
Hap32 16024 16025del, 1 28del, 160 del, 16032 l, 16061A 071G, 1 , 160 , 16085 088A, 93, 1617
16183 6324
Hap33 160 el, 16029 032G, 16
Hap34 1602 el, 16132C 223T, 16362C
Hap35 4del, 16 16129, 1 17, 1622 6261, 16
Hap37 16223, 362
Hap38 1609 145, 16 16261, 311
Hap39 16051, 168
Hap40 16158, 16 16234
1605 16168, 16 1
16168
16
1605 16 39, 635 354
316
160 16 311
162 16 390
162 16 354,
162 16 390
16 061 6
43, 160 7, 1 259 16
3, 16 223, 16
311,
223,
160 16 362
6025A , 16 43, 1627 2
16
161 16 365
, 162 0, 1 12 9, 1 31, , 16 349C 8, 163 6362G 8,
2, 1 18T 16
162 16 304
16 34,
223,
16 4, 16 16
2, 1 95, , 16
22 16 390
024G A, 1 1609 3, 627 , 1 16
024de 5de , 1 225, 163
2, 22
del, 60 29 de , 16 6082A 83A G, 16 160 2, C, 1
24d G, 16 163
4d , 16
1602 037, 62 3, 1 362
16
3, 16 223, 16
16
209,
Copyright © 2012 SciRes. 196
B. T. LANGSTIEH ET AL.
Copyright © 2012 SciRes. 197
Table S5. mtDN HVRII haplot ding mutated positions for the Lyngnga population.
HaplotypeMuta sitions
(np 8 - 429)
A ypes and their correspon m
s ted pos 3
Hap1 73, 150, 263, 293, 309insCT
Hap2 73, 150, 152, 153, 263, 309insT
Hap3 73, 09insT
nsT
73, nsT, 316
73, 152, 2 insC, 315insC
73, 09insT
73, 1 309insT
T
3 8
4
5
6 T
7 42, 73, 26 320, 343, 345
8 32, 40, 57, 60, 376C, 384T, 390
9
0 64, 73, sT, 356insC
220A, 226G, 233A, 236A, 239A, , 280, 297C, 309insCCT, 329, 392G
T
5
6
7
8
9
0
1
2 insT
3
Hap35 125G, 148, 150, 309insCT
152, 234, 249del, 263, 3
Hap4 73, 152, 153, 309i
Hap5 152, 249del, 263, 309i
Hap6 63, 309
Hap7 151, 152, 263, 3
Hap8 73, 152, 195, 263, 309insT
Hap9 46, 263,
Hap10 73, 89, 92, 93, 263, 309ins
Hap11 73, 92, 93, 263, 309insT
Hap12 73, 89, 92, 263, 309insT
Hap1 73, 94, 263, 309insT, 36
Hap1 73, 199, 263, 309insT
Hap1 73, 199, 309insT
Hap1 73, 263, 309insCC
Hap1 3, 293, 309insCT, 317,
Hap1 63, 73, 263, 309insT, 363, 367,
Hap1 64, 73, 150, 263, 293, 309insCT, 317, 320G
Hap2 150, 199, 309in
Hap21 258A, 260A, 263, 270C, 272C
Hap22 73, 150, 199, 309insT
Hap23 73, 263, 309insT, 382A
Hap24 73, 152, 263, 309ins
Hap2 73, 263, 309insCT
Hap2 73, 195, 263, 309insCT
Hap2 73, 199, 249del, 263, 309insT
Hap2 73, 263, 278C, 280, 309insT
Hap2 73, 263, 309insCT
Hap3 73, 199, 249del, 263, 309insT, 382A
Hap3 73, 199, 249del, 263, 309insT
Hap3 73, 199, 263, 309
Hap3 73, 207, 263, 293, 309insCT
Hap34 71del, 73, 249del, 293