Embed Size (px)
Citation preview
Molecular Evolutionary Analysis of the InfluenzaA(H1N1)pdm, May–September, 2009: Temporal andSpatial Spreading Profile of the Viruses in JapanTeiichiro Shiino1*, Nobuhiko Okabe1, Yoshinori Yasui1, Tomimasa Sunagawa1, Makoto Ujike2,
Masatsugu Obuchi2, Noriko Kishida2, Hong Xu2, Emi Takashita2, Akane Anraku2, Reiko Ito2, Teruko Doi2,
Miho Ejima2, Hiromi Sugawara2, Hiroshi Horikawa3, Shuji Yamazaki3, Yumiko Kato3, Akio Oguchi3,
Nobuyuki Fujita3, Takato Odagiri2, Masato Tashiro2, Haruo Watanabe1
1 Infectious Diseases Surveillance Center, National Institute of Infectious Diseases, Tokyo, Japan, 2 Influenza Virus Research Center, National Institute of Infectious Diseases,
Tokyo, Japan, 3 Genome Analysis Center, Department of Biotechnology, National Institute of Technology and Evaluation, Tokyo, Japan
Abstract
Background: In March 2009, pandemic influenza A(H1N1) (A(H1N1)pdm) emerged in Mexico and the United States. InJapan, since the first outbreak of A(H1N1)pdm in Osaka and Hyogo Prefectures occurred in the middle of May 2009, thevirus had spread over 16 of 47 prefectures as of June 4, 2009.
Methods/Principal Findings: We analyzed all-segment concatenated genome sequences of 75 isolates of A(H1N1)pdmviruses in Japan, and compared them with 163 full-genome sequences in the world. Two analyzing methods, distance-based and Bayesian coalescent MCMC inferences were adopted to elucidate an evolutionary relationship of the viruses inthe world and Japan. Regardless of the method, the viruses in the world were classified into four distinct clusters with a fewexceptions. Cluster 1 was originated earlier than cluster 2, while cluster 2 was more widely spread around the world. Theother two clusters (clusters 1.2 and 1.3) were suggested to be distinct reassortants with different types of segmentassortments. The viruses in Japan seemed to be a multiple origin, which were derived from approximately 28 transportedcases. Twelve cases were associated with monophyletic groups consisting of Japanese viruses, which were referred to asmicro-clade. While most of the micro-clades belonged to the cluster 2, the clade of the first cases of infection in Japanoriginated from cluster 1.2. Micro-clades of Osaka/Kobe and the Fukuoka cases, both of which were school-wide outbreaks,were eradicated. Time of most recent common ancestor (tMRCA) for each micro-clade demonstrated that some distinctviruses were transmitted in Japan between late May and early June, 2009, and appeared to spread nation-wide throughoutsummer.
Conclusions: Our results suggest that many viruses were transmitted from abroad in late May 2009 irrespective ofpreventive actions against the pandemic influenza, and that the influenza A(H1N1)pdm had become a pandemic stage inJune 2009 in Japan.
Citation: Shiino T, Okabe N, Yasui Y, Sunagawa T, Ujike M, et al. (2010) Molecular Evolutionary Analysis of the Influenza A(H1N1)pdm, May–September, 2009:Temporal and Spatial Spreading Profile of the Viruses in Japan. PLoS ONE 5(6): e11057. doi:10.1371/journal.pone.0011057
Editor: Darren P. Martin, Institute of Infectious Disease and Molecular Medicine, South Africa
Received April 6, 2010; Accepted May 20, 2010; Published June 10, 2010
Copyright: � 2010 Shiino et al. This is an open-access article distributed under the terms of the Creative Commons Attribution License, which permitsunrestricted use, distribution, and reproduction in any medium, provided the original author and source are credited.
Funding: This work was supported in part by grants from the Ministry of Education, Culture, Sports, Science, and Technology (MEXT) of Japan and the JapanScience and Technology Agency (JST). The funders had no role in study design, data collection and analysis, decision to publish, or preparation of the manuscript.
Competing Interests: The authors have declared that no competing interests exist.
* E-mail: [email protected]
Introduction
Since pandemic influenza A(H1N1) (A(H1N1)pdm) emerged in
Mexico and the United States (US) in March 2009 [1,2], human-
to-human transmission enabled rapid, worldwide spread of the
virus during the first few weeks of the pandemic. Over 29,000
cases and 145 deaths were reported in over 74 countries as of June
12, 2009 [3], prompting the World Health Organization (WHO)
to raise the influenza pandemic alert level to 6. Since April 28,
2009, the Ministry of Health, Labour and Welfare in Japan
required febrile travelers returning from affected areas to be
screened at the point of entry [4]. A conventional and/or real-time
RT-PCR test for A(H1N1)pdm virus, developed at the National
Institute of Infectious Diseases, was launched on May 4, 2009, by
the quarantine stations and the prefectural and the municipal
public health institutes in Japan. The first confirmed cases were
detected at the Narita International airport quarantine station on
May 9, 2009 at four travelers returned from Canada [5]. The
Quarantine Law and the Pandemic Influenza Preparedness Action
Plan of the Japanese Government [5] requires all patients to be
isolated in a designated hospital for seven days. One student who
had attended a high school in Ibaraki City in Osaka Prefecture
and four others who had attended a high school in Kobe City in
Hyogo Prefecture, were confirmed to have A(H1N1)pdm virus
infection on May 16, 2009 [5]. School-wide outbreaks of influenza
A were reported over the next few days, and all schools in Osaka
PLoS ONE | www.plosone.org 1 June 2010 | Volume 5 | Issue 6 | e11057
Prefecture and Kobe City were closed for either one or two weeks
starting from May 16, 2009. Although the number of newly
confirmed cases in the schools decreased after the school closures,
a few cases that had an epidemiological link to a traveler from
those 2 prefectures were reported in the peripheral areas [5]. On
May 22, the Japanese government revised its Action Plan to relax
quarantine, school closure, and medical service regulations
considering circumstances like local infection sites. According to
this revision, the febrile screening at airport-quarantines was
expired. After the Osaka/Kobe outbreak, some sporadic cases
occurred also in other prefectures. A total of 401 cases from 16 of
47 prefectures in Japan were reported as of June 4, 2009. After
WHO raised the influenza pandemic alert level to phase 6 on June
11,2009, Japan faced two more school-based outbreaks of
A(H1N1)pdm in Fukuoka [6] and Chiba prefectures [7]. The
Japanese government revised its Action Plan again after these
outbreaks, switching to the sentinel surveillance system [8] that
was a same manner for category V infectious diseases in the
Infection Diseases Control Low [9].
The genetic composition of the A(H1N1)pdm virus was
available early in the pandemic [10], and more than 6000 gene
sequences from 3600 individuals were deposited in the GenBank
database by the end of September 2009. The virus was found to
have a genome with an extremely high evolutionary rate
(3.6661023 substitution per site per year) [11]. Accurate analysis
of the viral genome-wide sequence may help us infer the
evolutionary development over a very small time-scale, (since the
beginning of the pandemic A(H1N1)). The phylogenetic relation-
ship of the A(H1N1)pdm viruses over the first pandemic wave was
recently analyzed using a concatenated sequence of six viral
segments [12]. This study reported the circulation of two distinct
genetic groups (clusters) during the pandemic phase. They also
identified three sub-clusters in cluster 1. All the viruses isolated
from the Osaka/Kobe outbreak case [5] belonged to the small
sub-cluster 1.2, which had a cluster 2-like nucleoprotein [12].
Viruses from sub-cluster 1.2, and from sub-cluster 1.3, may be
reassortants between two major clusters [12].
As of September 30, the GenBank/NIAID database has started
providing the full-genome sequences of 452 viruses, of which 75
viruses were derived from Japan. Some of these viruses were
available for study of the epidemiological linkage of the infected
individuals in our previous study, but many, especially after
enforcement of sentinel surveillance, were not. A phylogenetic
inference of full-genome sequences using a time-based Bayesian
coalescent Markov Monte Carlo (Bayesian MCMC) method may
describe an important evolutionary process underlying the
A(H1N1)pdm outbreak in Japan. Our results support the current
epidemiological information about the 2009 influenza A(H1N1)
pandemic in Japan.
Results
Since the first outbreak of the A(H1N1)pdm infection occurred
in the Osaka/Kobe district of Japan in May, the virus infection
gradually extended nation-wide, from the beginning of June. Field
epidemiological investigations reported four other outbreaks cases
during this period (Table S1). The virus had colonized all
prefectures in Japan by the middle of July. Then Japan abandoned
the practice of reporting every case of pandemic virus infections.
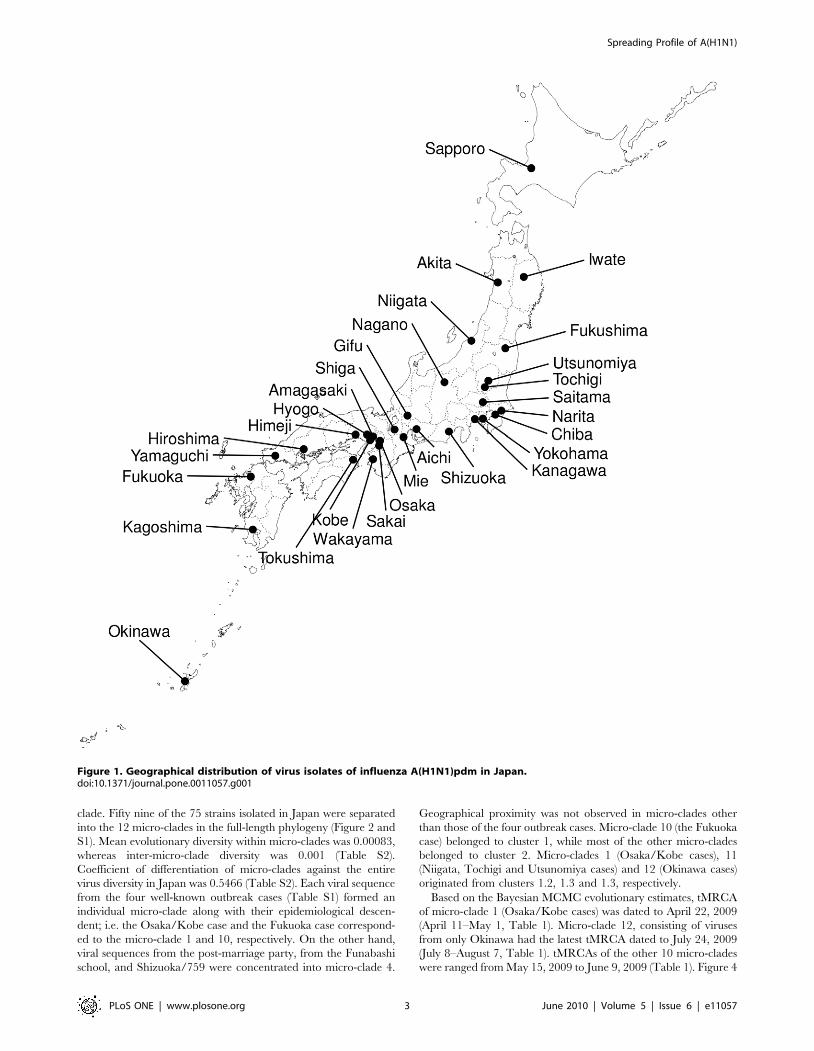
We collected viruses (Figure 1) isolated from hospitalized patients
between May 8, 2009, and September 22, 2009 and sequenced the
full-length genome of 8 segments of the 74 viruses. We also found
a full-length sequence that was apparently derived from Japan (A/
Japan/PR1070/2009(H1N1)) in GenBank genome database.
Consequently, we obtained 75 full-length sequences of Japanese
isolates of A(H1N1)pdm.
We computed the genetic diversity of our isolates in Japan with
that of isolates in the world. The entire nucleotide diversity in a
total of 238 sequences collected from the world including Japan
and 75 Japanese isolates were 0.00164 and 0.00183, respectively,
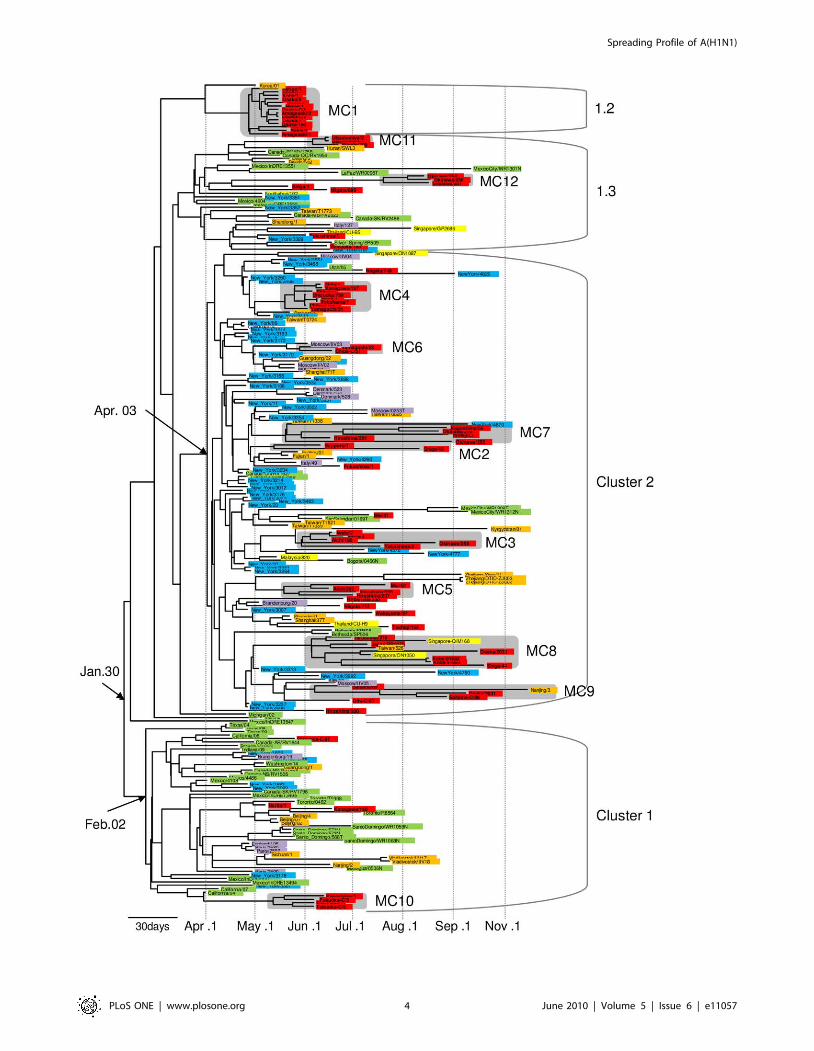
which seem to be identical (Table S2). A Bayesian coalescent-
based phylogenetic inference demonstrated the worldwide circu-
lation of four distinct clusters with a few exceptions (Figure 2),
which was consistent with the result by the distance-based
phylogenetic inference (Figure S1). Divergence topology of the
phylogeny was similar to a previously reported Neighbor-Joining
tree [12] whose cluster 1.1 corresponded to our cluster 1. The
cluster 2 in both studies was identical. We applied a Bayesian
relaxed molecular clock method to the phylogeny and estimated
the mean evolutionary rate of the full-length genome of
A(H1N1)pdm to be 4.061023 substitutions per site per year
(95% probability density ranged 3.661023 to 4.461023: Table 1).
The estimated mean coefficient of variation was 0.34, indicating
substantial heterogeneity in the evolutionary rate in viral lineage.
Tajima’s D statistic for full-length sequence alignment was 22.806
(Table 2), demonstrating a weak purifying selection during the
evolutionary process of A(H1N1)pdm in 2009. The Bayesian
chronological phylogeny also showed that cluster 1 had an older
ancestor than cluster 2. Based on the estimates of the evolutionary
rate, tMRCA of cluster 1 was dated to February 2, 2009 (range
from January 11 to February. 26: Table 1), whereas that of the
cluster 2 was April 3, 2009 (range from March 25 to April 9:
Table 1). Mean root height, i.e. tMRCA of whole samples, was
estimated to January 30, 2009 (range from January 7 to February
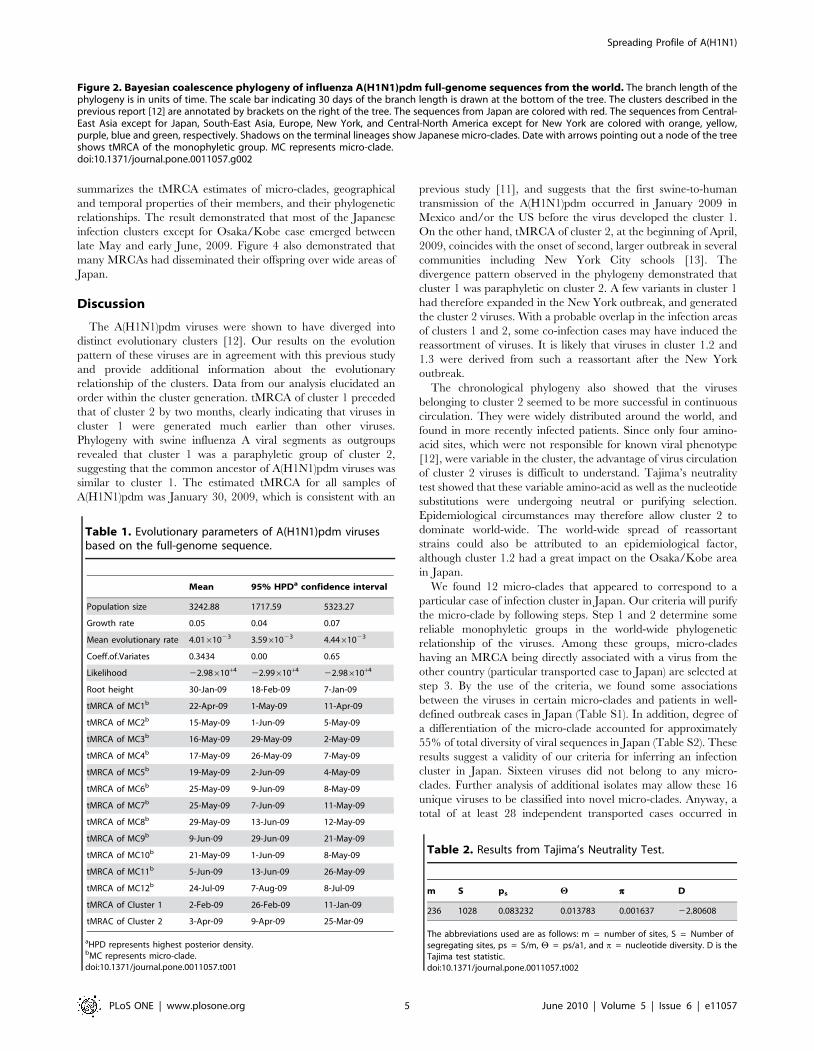
18, 2009: Table 1). We used pre-reassorted ancestral sequences as
an outgroup to show that the common ancestor of A(H1N1)pdm
viruses belonged to cluster 1 (Figure 3). Cluster 2 formed a
monophyletic group, while cluster 1 was paraphyletic. Viruses in
the cluster 2 were more widely distributed when compared with
cluster 1, and were found in more recently infected patients
(Figure 2).
Other than clusters 1 and 2, our phylogenetic analysis showed
two relatively small clusters, which included members of cluster
1.2 and 1.3 from a previous study [12]. Cluster 1.2 contains the
viruses from Osaka/Kobe outbreak and one Korean strain,
whereas cluster 1.3 contains 10 viruses from various geographical
areas and periods in Japan. The phylogenetic analysis (Figure 2,
S1) showed that these clusters diverged before the emergence of a
common ancestor of the major clusters. Viruses belonging to these
clusters were previously suggested to be a reassortant between two
major clusters [12]. We examined a cladistical discordance among
the segments of these viral genomes by comparing neighbor-
joining trees of each segment (Figure S2). Our data showed that
viruses in the cluster 1.2 were clearly composed of HA, MP and
NS segments from the cluster 1 and the NP segment from the
cluster 2 (Table 3). We also showed that viruses in the cluster 1.3
had a different structure when compared with the cluster 1.2. The
MP and NS segments in the cluster 1.3 were derived from cluster 1
while the HA, NP and NA segments were derived from the cluster
2. The NA segment of the cluster 1.2 had an interesting sequence
which seemed to be an intermediate of the clusters 1 and 2. The
origin of other segments in the reassortant clusters was not
determined because of an insufficient accumulation of nucleotide
substitutions among these genes.
We distinguished Japanese viruses into some groups that were
estimated to be derived from a single common transported case,
using two full-length phylogenies according to a given criteria (see
Materials and Methods). Such a group was referred to as a micro-
Spreading Profile of A(H1N1)
PLoS ONE | www.plosone.org 2 June 2010 | Volume 5 | Issue 6 | e11057
clade. Fifty nine of the 75 strains isolated in Japan were separated
into the 12 micro-clades in the full-length phylogeny (Figure 2 and
S1). Mean evolutionary diversity within micro-clades was 0.00083,
whereas inter-micro-clade diversity was 0.001 (Table S2).
Coefficient of differentiation of micro-clades against the entire
virus diversity in Japan was 0.5466 (Table S2). Each viral sequence
from the four well-known outbreak cases (Table S1) formed an
individual micro-clade along with their epidemiological descen-
dent; i.e. the Osaka/Kobe case and the Fukuoka case correspond-
ed to the micro-clade 1 and 10, respectively. On the other hand,
viral sequences from the post-marriage party, from the Funabashi
school, and Shizuoka/759 were concentrated into micro-clade 4.
Geographical proximity was not observed in micro-clades other
than those of the four outbreak cases. Micro-clade 10 (the Fukuoka
case) belonged to cluster 1, while most of the other micro-clades
belonged to cluster 2. Micro-clades 1 (Osaka/Kobe cases), 11
(Niigata, Tochigi and Utsunomiya cases) and 12 (Okinawa cases)
originated from clusters 1.2, 1.3 and 1.3, respectively.
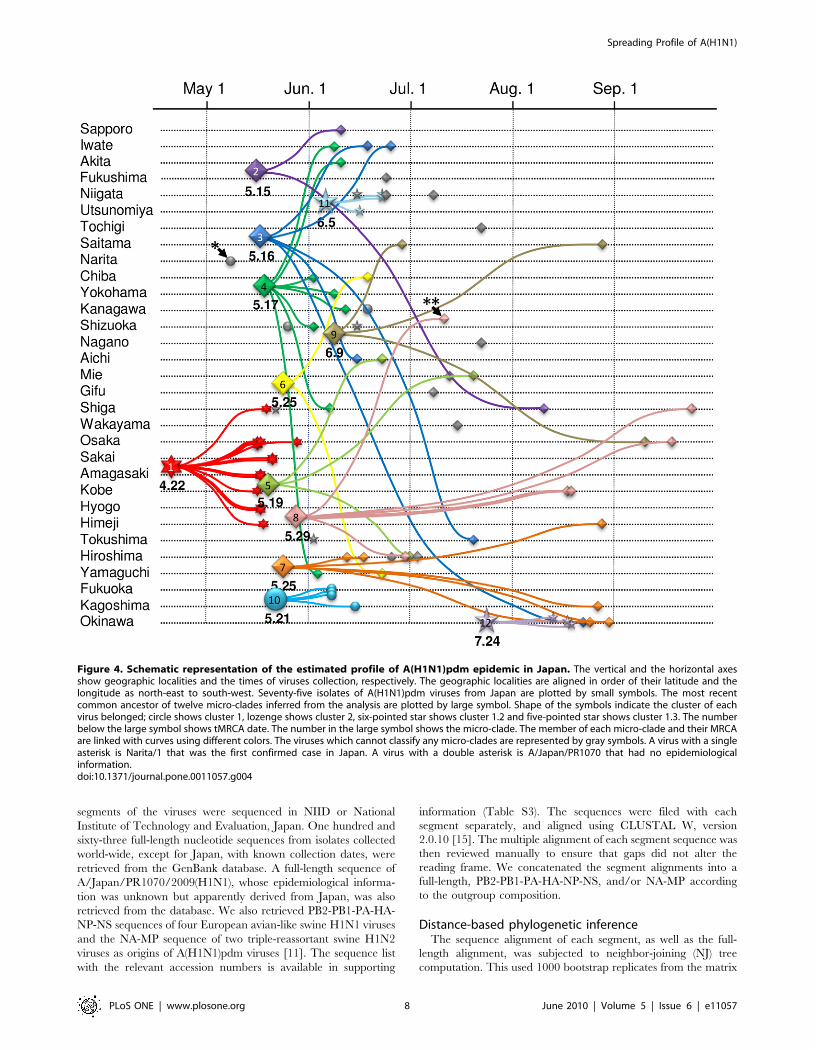
Based on the Bayesian MCMC evolutionary estimates, tMRCA
of micro-clade 1 (Osaka/Kobe cases) was dated to April 22, 2009
(April 11–May 1, Table 1). Micro-clade 12, consisting of viruses
from only Okinawa had the latest tMRCA dated to July 24, 2009
(July 8–August 7, Table 1). tMRCAs of the other 10 micro-clades
were ranged from May 15, 2009 to June 9, 2009 (Table 1). Figure 4
Figure 1. Geographical distribution of virus isolates of influenza A(H1N1)pdm in Japan.doi:10.1371/journal.pone.0011057.g001
Spreading Profile of A(H1N1)
PLoS ONE | www.plosone.org 3 June 2010 | Volume 5 | Issue 6 | e11057
Spreading Profile of A(H1N1)
PLoS ONE | www.plosone.org 4 June 2010 | Volume 5 | Issue 6 | e11057
summarizes the tMRCA estimates of micro-clades, geographical
and temporal properties of their members, and their phylogenetic
relationships. The result demonstrated that most of the Japanese
infection clusters except for Osaka/Kobe case emerged between
late May and early June, 2009. Figure 4 also demonstrated that
many MRCAs had disseminated their offspring over wide areas of
Japan.
Discussion
The A(H1N1)pdm viruses were shown to have diverged into
distinct evolutionary clusters [12]. Our results on the evolution
pattern of these viruses are in agreement with this previous study
and provide additional information about the evolutionary
relationship of the clusters. Data from our analysis elucidated an
order within the cluster generation. tMRCA of cluster 1 preceded
that of cluster 2 by two months, clearly indicating that viruses in
cluster 1 were generated much earlier than other viruses.
Phylogeny with swine influenza A viral segments as outgroups
revealed that cluster 1 was a paraphyletic group of cluster 2,
suggesting that the common ancestor of A(H1N1)pdm viruses was
similar to cluster 1. The estimated tMRCA for all samples of
A(H1N1)pdm was January 30, 2009, which is consistent with an
previous study [11], and suggests that the first swine-to-human
transmission of the A(H1N1)pdm occurred in January 2009 in
Mexico and/or the US before the virus developed the cluster 1.
On the other hand, tMRCA of cluster 2, at the beginning of April,
2009, coincides with the onset of second, larger outbreak in several
communities including New York City schools [13]. The
divergence pattern observed in the phylogeny demonstrated that
cluster 1 was paraphyletic on cluster 2. A few variants in cluster 1
had therefore expanded in the New York outbreak, and generated
the cluster 2 viruses. With a probable overlap in the infection areas
of clusters 1 and 2, some co-infection cases may have induced the
reassortment of viruses. It is likely that viruses in cluster 1.2 and
1.3 were derived from such a reassortant after the New York
outbreak.
The chronological phylogeny also showed that the viruses
belonging to cluster 2 seemed to be more successful in continuous
circulation. They were widely distributed around the world, and
found in more recently infected patients. Since only four amino-
acid sites, which were not responsible for known viral phenotype
[12], were variable in the cluster, the advantage of virus circulation
of cluster 2 viruses is difficult to understand. Tajima’s neutrality
test showed that these variable amino-acid as well as the nucleotide
substitutions were undergoing neutral or purifying selection.
Epidemiological circumstances may therefore allow cluster 2 to
dominate world-wide. The world-wide spread of reassortant
strains could also be attributed to an epidemiological factor,
although cluster 1.2 had a great impact on the Osaka/Kobe area
in Japan.
We found 12 micro-clades that appeared to correspond to a
particular case of infection cluster in Japan. Our criteria will purify
the micro-clade by following steps. Step 1 and 2 determine some
reliable monophyletic groups in the world-wide phylogenetic
relationship of the viruses. Among these groups, micro-clades
having an MRCA being directly associated with a virus from the
other country (particular transported case to Japan) are selected at
step 3. By the use of the criteria, we found some associations
between the viruses in certain micro-clades and patients in well-
defined outbreak cases in Japan (Table S1). In addition, degree of
a differentiation of the micro-clade accounted for approximately
55% of total diversity of viral sequences in Japan (Table S2). These
results suggest a validity of our criteria for inferring an infection
cluster in Japan. Sixteen viruses did not belong to any micro-
clades. Further analysis of additional isolates may allow these 16
unique viruses to be classified into novel micro-clades. Anyway, a
total of at least 28 independent transported cases occurred in
Figure 2. Bayesian coalescence phylogeny of influenza A(H1N1)pdm full-genome sequences from the world. The branch length of thephylogeny is in units of time. The scale bar indicating 30 days of the branch length is drawn at the bottom of the tree. The clusters described in theprevious report [12] are annotated by brackets on the right of the tree. The sequences from Japan are colored with red. The sequences from Central-East Asia except for Japan, South-East Asia, Europe, New York, and Central-North America except for New York are colored with orange, yellow,purple, blue and green, respectively. Shadows on the terminal lineages show Japanese micro-clades. Date with arrows pointing out a node of the treeshows tMRCA of the monophyletic group. MC represents micro-clade.doi:10.1371/journal.pone.0011057.g002
Table 1. Evolutionary parameters of A(H1N1)pdm virusesbased on the full-genome sequence.
Mean 95% HPDa confidence interval
Population size 3242.88 1717.59 5323.27
Growth rate 0.05 0.04 0.07
Mean evolutionary rate 4.0161023 3.5961023 4.4461023
Coeff.of.Variates 0.3434 0.00 0.65
Likelihood 22.98610+4 22.99610+4 22.98610+4
Root height 30-Jan-09 18-Feb-09 7-Jan-09
tMRCA of MC1b 22-Apr-09 1-May-09 11-Apr-09
tMRCA of MC2b 15-May-09 1-Jun-09 5-May-09
tMRCA of MC3b 16-May-09 29-May-09 2-May-09
tMRCA of MC4b 17-May-09 26-May-09 7-May-09
tMRCA of MC5b 19-May-09 2-Jun-09 4-May-09
tMRCA of MC6b 25-May-09 9-Jun-09 8-May-09
tMRCA of MC7b 25-May-09 7-Jun-09 11-May-09
tMRCA of MC8b 29-May-09 13-Jun-09 12-May-09
tMRCA of MC9b 9-Jun-09 29-Jun-09 21-May-09
tMRCA of MC10b 21-May-09 1-Jun-09 8-May-09
tMRCA of MC11b 5-Jun-09 13-Jun-09 26-May-09
tMRCA of MC12b 24-Jul-09 7-Aug-09 8-Jul-09
tMRCA of Cluster 1 2-Feb-09 26-Feb-09 11-Jan-09
tMRAC of Cluster 2 3-Apr-09 9-Apr-09 25-Mar-09
aHPD represents highest posterior density.bMC represents micro-clade.doi:10.1371/journal.pone.0011057.t001
Table 2. Results from Tajima’s Neutrality Test.
m S ps H pp D
236 1028 0.083232 0.013783 0.001637 22.80608
The abbreviations used are as follows: m = number of sites, S = Number ofsegregating sites, ps = S/m, H = ps/a1, and p = nucleotide diversity. D is theTajima test statistic.doi:10.1371/journal.pone.0011057.t002
Spreading Profile of A(H1N1)
PLoS ONE | www.plosone.org 5 June 2010 | Volume 5 | Issue 6 | e11057
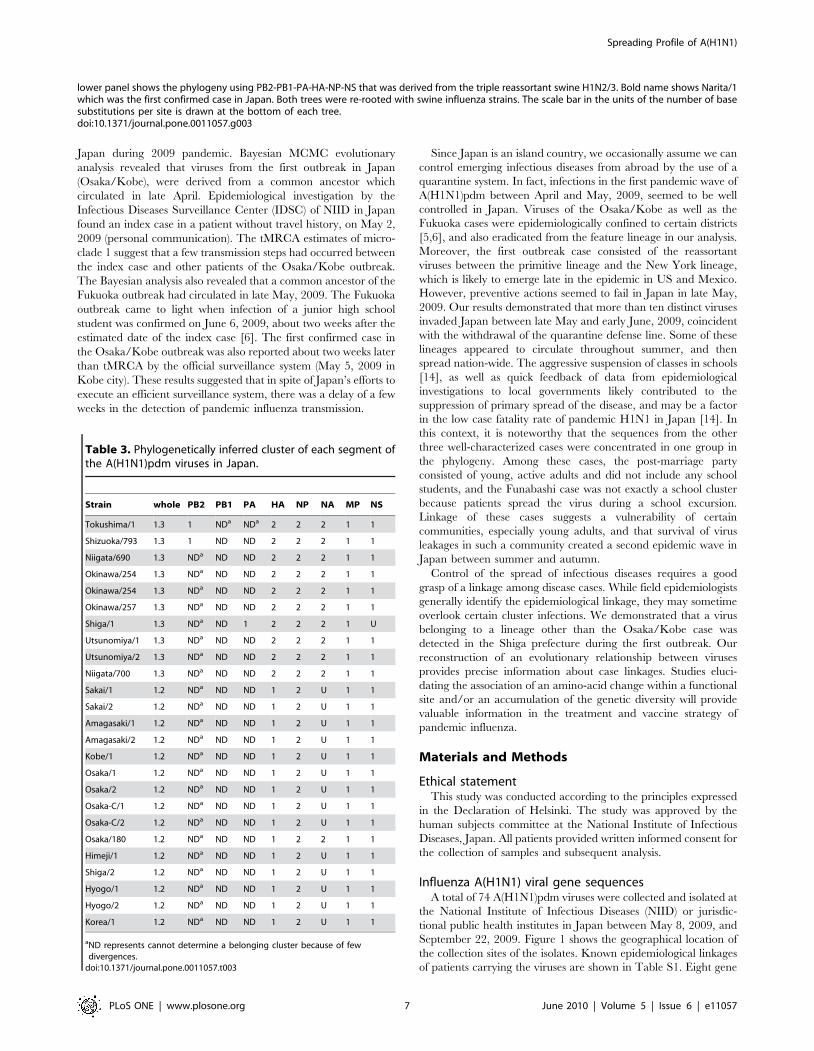
Figure 3. Distance-based neighbor joining phylogeny of influenza A(H1N1)pdm in early phase of the pandemic with particularswine influenza strains. The upper panel shows the phylogeny using NA-MP that was derived from Eurasian avian-like swine H1N1 virus. The
Spreading Profile of A(H1N1)
PLoS ONE | www.plosone.org 6 June 2010 | Volume 5 | Issue 6 | e11057
Japan during 2009 pandemic. Bayesian MCMC evolutionary
analysis revealed that viruses from the first outbreak in Japan
(Osaka/Kobe), were derived from a common ancestor which
circulated in late April. Epidemiological investigation by the
Infectious Diseases Surveillance Center (IDSC) of NIID in Japan
found an index case in a patient without travel history, on May 2,
2009 (personal communication). The tMRCA estimates of micro-
clade 1 suggest that a few transmission steps had occurred between
the index case and other patients of the Osaka/Kobe outbreak.
The Bayesian analysis also revealed that a common ancestor of the
Fukuoka outbreak had circulated in late May, 2009. The Fukuoka
outbreak came to light when infection of a junior high school
student was confirmed on June 6, 2009, about two weeks after the
estimated date of the index case [6]. The first confirmed case in
the Osaka/Kobe outbreak was also reported about two weeks later
than tMRCA by the official surveillance system (May 5, 2009 in
Kobe city). These results suggested that in spite of Japan’s efforts to
execute an efficient surveillance system, there was a delay of a few
weeks in the detection of pandemic influenza transmission.
Since Japan is an island country, we occasionally assume we can
control emerging infectious diseases from abroad by the use of a
quarantine system. In fact, infections in the first pandemic wave of
A(H1N1)pdm between April and May, 2009, seemed to be well
controlled in Japan. Viruses of the Osaka/Kobe as well as the
Fukuoka cases were epidemiologically confined to certain districts
[5,6], and also eradicated from the feature lineage in our analysis.
Moreover, the first outbreak case consisted of the reassortant
viruses between the primitive lineage and the New York lineage,
which is likely to emerge late in the epidemic in US and Mexico.
However, preventive actions seemed to fail in Japan in late May,
2009. Our results demonstrated that more than ten distinct viruses
invaded Japan between late May and early June, 2009, coincident
with the withdrawal of the quarantine defense line. Some of these
lineages appeared to circulate throughout summer, and then
spread nation-wide. The aggressive suspension of classes in schools
[14], as well as quick feedback of data from epidemiological
investigations to local governments likely contributed to the
suppression of primary spread of the disease, and may be a factor
in the low case fatality rate of pandemic H1N1 in Japan [14]. In
this context, it is noteworthy that the sequences from the other
three well-characterized cases were concentrated in one group in
the phylogeny. Among these cases, the post-marriage party
consisted of young, active adults and did not include any school
students, and the Funabashi case was not exactly a school cluster
because patients spread the virus during a school excursion.
Linkage of these cases suggests a vulnerability of certain
communities, especially young adults, and that survival of virus
leakages in such a community created a second epidemic wave in
Japan between summer and autumn.
Control of the spread of infectious diseases requires a good
grasp of a linkage among disease cases. While field epidemiologists
generally identify the epidemiological linkage, they may sometime
overlook certain cluster infections. We demonstrated that a virus
belonging to a lineage other than the Osaka/Kobe case was
detected in the Shiga prefecture during the first outbreak. Our
reconstruction of an evolutionary relationship between viruses
provides precise information about case linkages. Studies eluci-
dating the association of an amino-acid change within a functional
site and/or an accumulation of the genetic diversity will provide
valuable information in the treatment and vaccine strategy of
pandemic influenza.
Materials and Methods
Ethical statementThis study was conducted according to the principles expressed
in the Declaration of Helsinki. The study was approved by the
human subjects committee at the National Institute of Infectious
Diseases, Japan. All patients provided written informed consent for
the collection of samples and subsequent analysis.
Influenza A(H1N1) viral gene sequencesA total of 74 A(H1N1)pdm viruses were collected and isolated at
the National Institute of Infectious Diseases (NIID) or jurisdic-
tional public health institutes in Japan between May 8, 2009, and
September 22, 2009. Figure 1 shows the geographical location of
the collection sites of the isolates. Known epidemiological linkages
of patients carrying the viruses are shown in Table S1. Eight gene
lower panel shows the phylogeny using PB2-PB1-PA-HA-NP-NS that was derived from the triple reassortant swine H1N2/3. Bold name shows Narita/1which was the first confirmed case in Japan. Both trees were re-rooted with swine influenza strains. The scale bar in the units of the number of basesubstitutions per site is drawn at the bottom of each tree.doi:10.1371/journal.pone.0011057.g003
Table 3. Phylogenetically inferred cluster of each segment ofthe A(H1N1)pdm viruses in Japan.
Strain whole PB2 PB1 PA HA NP NA MP NS
Tokushima/1 1.3 1 NDa NDa 2 2 2 1 1
Shizuoka/793 1.3 1 ND ND 2 2 2 1 1
Niigata/690 1.3 NDa ND ND 2 2 2 1 1
Okinawa/254 1.3 NDa ND ND 2 2 2 1 1
Okinawa/254 1.3 NDa ND ND 2 2 2 1 1
Okinawa/257 1.3 NDa ND ND 2 2 2 1 1
Shiga/1 1.3 NDa ND 1 2 2 2 1 U
Utsunomiya/1 1.3 NDa ND ND 2 2 2 1 1
Utsunomiya/2 1.3 NDa ND ND 2 2 2 1 1
Niigata/700 1.3 NDa ND ND 2 2 2 1 1
Sakai/1 1.2 NDa ND ND 1 2 U 1 1
Sakai/2 1.2 NDa ND ND 1 2 U 1 1
Amagasaki/1 1.2 NDa ND ND 1 2 U 1 1
Amagasaki/2 1.2 NDa ND ND 1 2 U 1 1
Kobe/1 1.2 NDa ND ND 1 2 U 1 1
Osaka/1 1.2 NDa ND ND 1 2 U 1 1
Osaka/2 1.2 NDa ND ND 1 2 U 1 1
Osaka-C/1 1.2 NDa ND ND 1 2 U 1 1
Osaka-C/2 1.2 NDa ND ND 1 2 U 1 1
Osaka/180 1.2 NDa ND ND 1 2 2 1 1
Himeji/1 1.2 NDa ND ND 1 2 U 1 1
Shiga/2 1.2 NDa ND ND 1 2 U 1 1
Hyogo/1 1.2 NDa ND ND 1 2 U 1 1
Hyogo/2 1.2 NDa ND ND 1 2 U 1 1
Korea/1 1.2 NDa ND ND 1 2 U 1 1
aND represents cannot determine a belonging cluster because of fewdivergences.
doi:10.1371/journal.pone.0011057.t003
Spreading Profile of A(H1N1)
PLoS ONE | www.plosone.org 7 June 2010 | Volume 5 | Issue 6 | e11057
segments of the viruses were sequenced in NIID or National
Institute of Technology and Evaluation, Japan. One hundred and
sixty-three full-length nucleotide sequences from isolates collected
world-wide, except for Japan, with known collection dates, were
retrieved from the GenBank database. A full-length sequence of
A/Japan/PR1070/2009(H1N1), whose epidemiological informa-
tion was unknown but apparently derived from Japan, was also
retrieved from the database. We also retrieved PB2-PB1-PA-HA-
NP-NS sequences of four European avian-like swine H1N1 viruses
and the NA-MP sequence of two triple-reassortant swine H1N2
viruses as origins of A(H1N1)pdm viruses [11]. The sequence list
with the relevant accession numbers is available in supporting
information (Table S3). The sequences were filed with each
segment separately, and aligned using CLUSTAL W, version
2.0.10 [15]. The multiple alignment of each segment sequence was
then reviewed manually to ensure that gaps did not alter the
reading frame. We concatenated the segment alignments into a
full-length, PB2-PB1-PA-HA-NP-NS, and/or NA-MP according
to the outgroup composition.
Distance-based phylogenetic inferenceThe sequence alignment of each segment, as well as the full-
length alignment, was subjected to neighbor-joining (NJ) tree
computation. This used 1000 bootstrap replicates from the matrix
Figure 4. Schematic representation of the estimated profile of A(H1N1)pdm epidemic in Japan. The vertical and the horizontal axesshow geographic localities and the times of viruses collection, respectively. The geographic localities are aligned in order of their latitude and thelongitude as north-east to south-west. Seventy-five isolates of A(H1N1)pdm viruses from Japan are plotted by small symbols. The most recentcommon ancestor of twelve micro-clades inferred from the analysis are plotted by large symbol. Shape of the symbols indicate the cluster of eachvirus belonged; circle shows cluster 1, lozenge shows cluster 2, six-pointed star shows cluster 1.2 and five-pointed star shows cluster 1.3. The numberbelow the large symbol shows tMRCA date. The number in the large symbol shows the micro-clade. The member of each micro-clade and their MRCAare linked with curves using different colors. The viruses which cannot classify any micro-clades are represented by gray symbols. A virus with a singleasterisk is Narita/1 that was the first confirmed case in Japan. A virus with a double asterisk is A/Japan/PR1070 that had no epidemiologicalinformation.doi:10.1371/journal.pone.0011057.g004
Spreading Profile of A(H1N1)
PLoS ONE | www.plosone.org 8 June 2010 | Volume 5 | Issue 6 | e11057
of the number of base substitutions per site based on the
Maximum Composite Likelihood method [16]. All positions
containing gaps and missing data were eliminated from the
dataset. The mean number of base substitution per site (i.e. genetic
diversity) within and between subpopulations were calculated on
the basis of the distance matrix of 238 and 75 sequences for entire
world and Japan, respectively. Standard error estimates were
obtained by a bootstrap procedure with 500 replicates. Tajima’s
neutrality test [17] was also performed by full-length alignment
data. The distance matrixes, the Tajima’s test statistic, and the
neighbor-joining trees were conducted using MEGA version 4.0
[18].
Bayesian Coalescent MCMC evolutionary analysisEvolutionary rates, molecular clock phylogenies, and other
evolutionary parameters were estimated from heterochronous data
of the full-length concatenated gene sequences of A(H1N1)pdm,
using the Bayesian Markov chain Monte Carlo (MCMC) method.
The nucleotide substitution model used in the analyses was
evaluated by the hierarchical likelihood ratio test using PAUP v4.0
[19] with MrModeltest [20]. The general time-reversible (GTR)
model with invariant sites (I) with four rate categories had
maximum likelihood. Bayesian MCMC analyses were performed
by BEAST v1.4.8 [21] using the substitution model of GTR+I,
three partitions into codon positions, and a relaxed molecular
clock model (the uncorrelated lognormal-distributed model) [22].
Three different population dynamic models (Exponential growth,
Logistic growth, Constant population and Bayesian Skyline Plot
(BSP)) were tested in the analyses. According to the BSP property,
the logistic growth model, and the constant population model were
adopted for the A(H1N1)pdm full-genome and swine influenza A
partial genome, respectively. Each Bayesian MCMC analysis was
run for 30 million states and sampled every 10,000 states. Posterior
probabilities were calculated with a burn-in of 4 million states and
checked for convergence with Tracer v1.4 [23]. The maximum
clade credibility tree for analyzing the MCMC data set was
annotated by TreeAnotator in the BEAST package. Detailed
MCMC phylogeny with readable sequence name was shown in
Figure S3. The posterior distribution of the substitution rate
obtained from the heterochronous sequences was subsequently
incorporated as a prior distribution for the mean evolutionary rate
of the influenza A virus genome, thereby adding a timescale to the
phylogenetic histories of the given viruses and enabling the times
of the most recent common ancestors (tMRCA) to be estimated
[24].
Determination of ‘‘micro-clades’’ within the virusescirculating in Japan
In order to understand a viral lineage that was derived from a
transported case to Japan, we determined monophyletic groups
consisting of the Japanese viruses in the phylogeny. The group of
viruses that fulfilled the following three criteria was defined as the
micro-clade: (1) monophyletic group with above 75% bootstrap
value on the distance-based tree (Figure S1), (2) monophyletic
group on the maximum clade credibility tree of the coalescence-
based analysis (Figure 2), and (3) viruses forming a monophyly or
paraphyly of Japanese viruses in both trees. Involvement of one
virus from other country was permissible. Each micro-clade was
subjected to tMRCA estimation using BEAST.
Supporting Information
Figure S1 Distance-based neighbor joining phylogeny of
influenza A(H1N1)pdm full-genome sequences from around the
world. The scale below the tree shows nucleotide substitutions
per site. Numbers on the branch show bootstrap probabilities.
Only .75% of the probability is shown in the figure. The clusters
described in the previous report [12] are annotated by brackets on
the right of the tree. The sequences from Japan are emphasized
with bold type. Shadows on the terminal lineages show Japanese
micro-clades. MC represents micro-clade.
Found at: doi:10.1371/journal.pone.0011057.s001 (0.22 MB
PDF)
Figure S2 Segment-divided neighbor joining phylogeny of
influenza A(H1N1)pdm. Five trees inferred from the nucleotide
alignment of HA, NP, NA, MP and NS are represented. Trees
inferred from PA, PB1 and PB2 are not shown because no cluster
divergence was observed in these segments. The clusters described
in the previous report [12] are annotated by brackets on the right
of the tree. Red and blue letters show the sequences derived from
the cluster 1.2 and 1.3 viruses, respectively. Green letters show the
other discordant sequences among the segmental trees.
Found at: doi:10.1371/journal.pone.0011057.s002 (0.32 MB
PDF)
Figure S3 Detailed presentation of Bayesian coalescence
phylogeny of influenza A(H1N1)pdm full-genome sequence from
the world. The branch length of the phylogeny is in units of time.
The scale bar indicating 30 days of the branch length is drawn at
the bottom of the tree. The clusters described in the previous
report [12] are annotated by brackets on the right of the tree.
Shadows on the terminal lineages show Japanese micro-clades.
MC represents micro-clade.
Found at: doi:10.1371/journal.pone.0011057.s003 (0.06 MB
PDF)
Table S1 Epidemiological information about the outbreak cases
and isolates in the A(H1N1)pdm epidemic in Japan.
Found at: doi:10.1371/journal.pone.0011057.s004 (0.03 MB
XLS)
Table S2 Estimates of the mean evolutionary diversity of
A(H1N1)pdm in the world and Japan.
Found at: doi:10.1371/journal.pone.0011057.s005 (0.02 MB
XLS)
Table S3 Influenza A viral strains used in the study.
Found at: doi:10.1371/journal.pone.0011057.s006 (0.71 MB
XLS)
Acknowledgments
We are grateful to following members for provision of viruses used in this
study; M. Kikuchi (Sapporo City Institute of Public Health), M. Takahashi
(Research Institute for Environmental Sciences and Public Health of Iwate
Prefecture), H. Saito (Akita Research Center for Public Health and
Environment), S. Hirose (Fukushima Prefectural Institute of Public Health),
A.Hirata(Tochigi Prefectural Institute of Public Health and Environmental
Science), S. Kasuo (Nagano Environmental Conservation Research
Institute), Y. Uno (Saitama City Institute of Health Science and Research),
H. Maru (Chiba Prefectural Institute of Public Health), H. Yokoi (Chiba
City Institute of Health and Environment), S. Watanabe (Kanagawa
Prefectural Institute of Public Health), C. Kawakami (Yokohama City
Institute of Health), C. Hirokawa (Niigata Prefectural Institute of Public
Health and Environmental Sciences), S. Sawatari (Gifu Prefectural
Institute of Health and Environmental Sciences), Y. Miwa (Shizuoka
Institute of Environment and Hygiene), S. Ide (Shizuoka City Institute of
Environmental Sciences and Public Health), M. Hata (Aichi Prefectural
Institute of Public Health), T. Yano (Mie Prefecture Health and
Environment Research Institute), F. Matsumoto (Shiga Prefectural
Institute of Public Health), S. Hiroi (Osaka Prefectural Institute of Public
Health), K. Uchino (Sakai City Institute of Public Health), T. Oshibe
(Hyogo Prefectural Institute of Public Health and Consumer Sciences), A.
Spreading Profile of A(H1N1)
PLoS ONE | www.plosone.org 9 June 2010 | Volume 5 | Issue 6 | e11057
Mori and T. Suga (Kobe Institute of Health), F. Terasoma (Wakayama
Prefectural Research Center of Environment and Public Health), S. Takao
(Center for Public Health and Environment, Hiroshima Prefectural
Technology Research Institute), S. Toda (Yamaguchi Prefectural Institute
of Public Health and Environment), Y. Kawakami (Tokushima Prefectural
Centre for Public Health and Environmental Sciences), D. Kawamoto
(Fukuoka City Institute for Hygiene and the Environment), K. Ishitani and
A. Kamimura (Kagoshima Prefectural Institute for Environmental
Research and Public Health), K. Taira (Okinawa Prefectural Institute of
Health and Environment), and Narita International Airport Quarantine
Station.
We also thank Dr. T. Shimada and Dr. Y. Yahata for their personal
communication about their field studies, and Dr. H. Sato for his helpful d
Author Contributions
Conceived and designed the experiments: TS NO MT HW. Performed the
experiments: MU MO NK HX ET AA RI TD ME HS HH SY YK AO
NF TO. Analyzed the data: TS. Contributed reagents/materials/analysis
tools: TS NO YY TS MU TO MT HW. Wrote the paper: TS. Performed
the epidemiological investigations: NO YY TS.
References
1. Centers for Disease Control and Prevention (2009) Update: swine influenza A
(H1N1) infections–California and Texas, April 2009. MMWR Morb Mortal
Wkly Rep 58: 435–437.
2. Centers for Disease Control and Prevention (2009) Outbreak of swine-origin
influenza A (H1N1) virus infection - Mexico, March-April 2009. MMWR Morb
Mortal Wkly Rep 58: 467–470.
3. World Health Organization (2009) Influenza A(H1N1)–Update 40. Available at
http://wwwwhoint/csr/don/2009_06_12/en/indexhtml June 14:, in press.
4. Ministry of Health LaW (2009) Official notification [in Japanese]. Available:
http://www.mhlw.go.jp/kunkyu/kenkou/influenza/090429-02.html via Inter-
net. Accessed 29 April 2009.
5. Shimada T, Gu Y, Kamiya H, Komiya N, Odaira F, et al. (2009) Epidemiology
of influenza A(H1N1)v virus infection in Japan, May–June 2009. Eurosurveil-
lance 14: 19244.
6. Health and Welfare station of Fukuoka city, Infectious Diseases Surveillance
Center, National Institute of Infectious Diseases, Japan (2009) Field epidemi-
ological investigation of the novel influenza A cluster in Fukuoka city. Available:
http://idsc.nih.go.jp/disease/swine_influenza/2009idsc/epi_fukuoka.html via
Internet. Accessed 2 July 2009.
7. Yahata Y, Shimada T, Yamamoto K, Sunagawa T, Taniguchi K, et al. (2009)
Field epidemiological investigation of the novel influenza A case in Funabashi
city [in Japanese]. Available: http://idsc.nih.go.jp/disease/swine_influenza/
pdf09/report_funabashi2.pdf via Internet. Accessed 29 July 2009.
8. Ministry of Health LaW (2008) Official notification about amendment of
prevention and care for infectious diseases [in Japanese]. Available: http://www.
mhlw.go.jp/za/0729/d26/d26-03-01.pdf via Internet. Accessed 22 July 2009.
9. Infectious Diseases Surveillance Center, National Institute of Infectious Diseases,
Japan (2010) Pathogen surveillance system in Japan and Infectious Agents
Surveillance Report (IASR). IASR 31: 69–70.
10. Dawood FS, Jain S, Finelli L, Shaw MW, Lindstrom S, et al. (2009) Emergence
of a novel swine-origin influenza A (H1N1) virus in humans. N Engl J Med 360:
2605–2615.
11. Smith GJ, Vijaykrishna D, Bahl J, Lycett SJ, Worobey M, et al. (2009) Origins
and evolutionary genomics of the 2009 swine-origin H1N1 influenza Aepidemic. Nature 459: 1122–1125.
12. Fereidouni S, Beer M, Vahlenkamp T, Starick E (2009) Differentiation of twodistinct clusters among currently circulating influenza A(H1N1)v viruses,
March–September 2009. Eurosurveillance 14: 19409.
13. Lessler J, Reich NG, Cummings DA (2009) Outbreak of 2009 pandemicinfluenza A (H1N1) at a New York City school. N Engl J Med 361: 2628–2636.
14. Kawaguchi R, Miyazono M, Noda T, Takayama Y, Sasai Y, et al. (2009)Influenza (H1N1) 2009 outbreak and school closure, Osaka Prefecture, Japan.
Emerg Infect Dis 15: 1685.
15. Larkin MA, Blackshields G, Brown NP, Chenna R, McGettigan PA, et al. (2007)Clustal W and Clustal X version 2.0. Bioinformatics 23: 2947–2948.
16. Tamura K, Nei M, Kumar S (2004) Prospects for inferring very largephylogenies by using the neighbor-joining method. Proc Natl Acad Sci U S A
101: 11030–11035.17. Tajima F (1989) Statistical method for testing the neutral mutation hypothesis by
DNA polymorphism. Genetics 123: 585–595.
18. Tamura K, Dudley J, Nei M, Kumar S (2007) MEGA4: Molecular EvolutionaryGenetics Analysis (MEGA) software version 4.0. Mol Biol Evol 24: 1596–1599.
19. Swofford DL (2003) PAUP. Phylogenetic Analysis Using Parsimony (and OtherMethods). Version 4. Sunderland, Massachusetts: Sinauer Associates.
20. Nylander JAA (2004) MrModeltest v2. Program distributed by the author.
Uppsala University: Evolutionary Biology Centre.21. Drummond AJ, Rambaut A (2007) BEAST: Bayesian evolutionary analysis by
sampling trees. BMC Evol Biol 7: 214.22. Drummond AJ, Ho SY, Phillips MJ, Rambaut A (2006) Relaxed phylogenetics
and dating with confidence. PLoS Biol 4: e88.
23. Rambaut A, Drummond AJ (2007) Tracer v1.4. Available: http://beast.bio.ed.ac.uk/Tracer.html via Internet.
24. Pybus OG, Drummond AJ, Nakano T, Robertson BH, Rambaut A (2003) Theepidemiology and iatrogenic transmission of hepatitis C virus in Egypt: a
Bayesian coalescent approach. Mol Biol Evol 20: 381–387.
Spreading Profile of A(H1N1)
PLoS ONE | www.plosone.org 10 June 2010 | Volume 5 | Issue 6 | e11057