Embed Size (px)
Citation preview
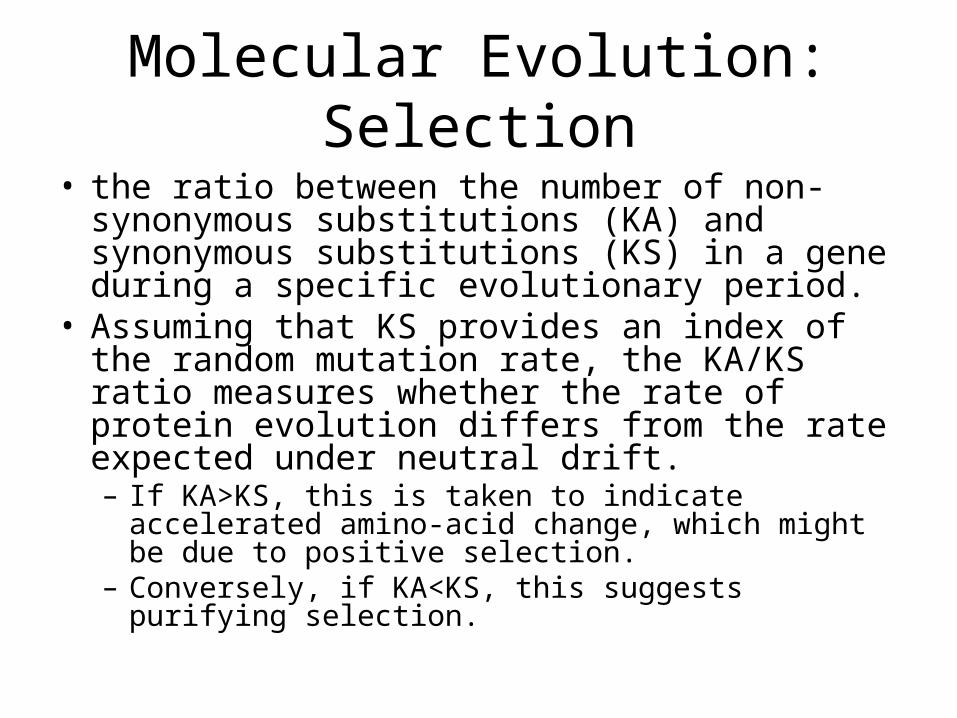
Molecular Evolution: Selection
• the ratio between the number of non-synonymous substitutions (KA) and synonymous substitutions (KS) in a gene during a specific evolutionary period.
• Assuming that KS provides an index of the random mutation rate, the KA/KS ratio measures whether the rate of protein evolution differs from the rate expected under neutral drift. – If KA>KS, this is taken to indicate accelerated amino-
acid change, which might be due to positive selection.– Conversely, if KA<KS, this suggests purifying
selection.
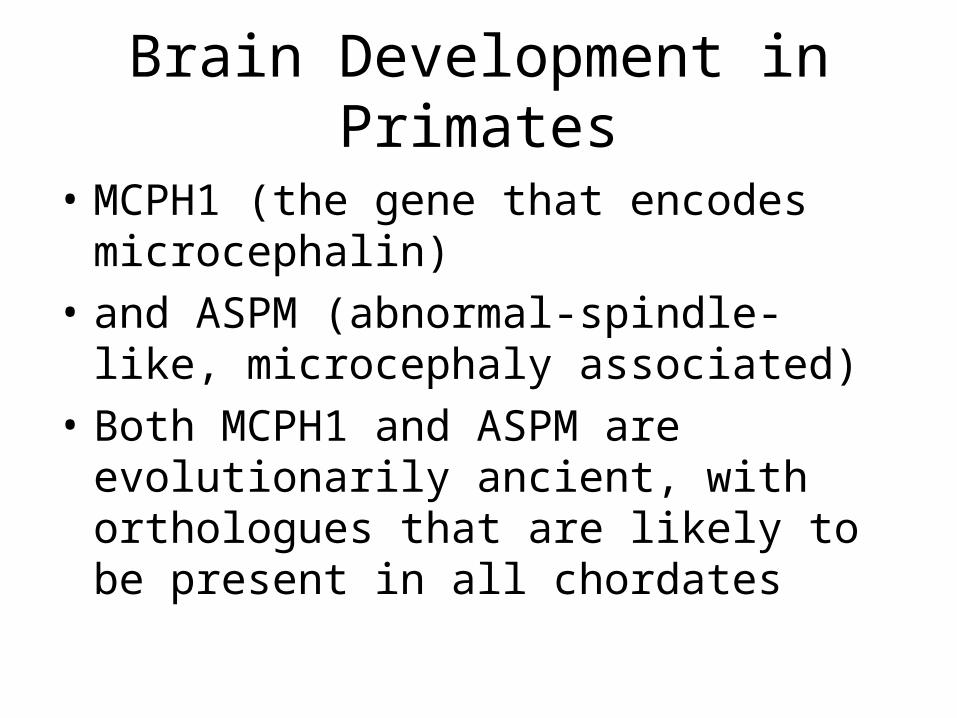
Brain Development in Primates
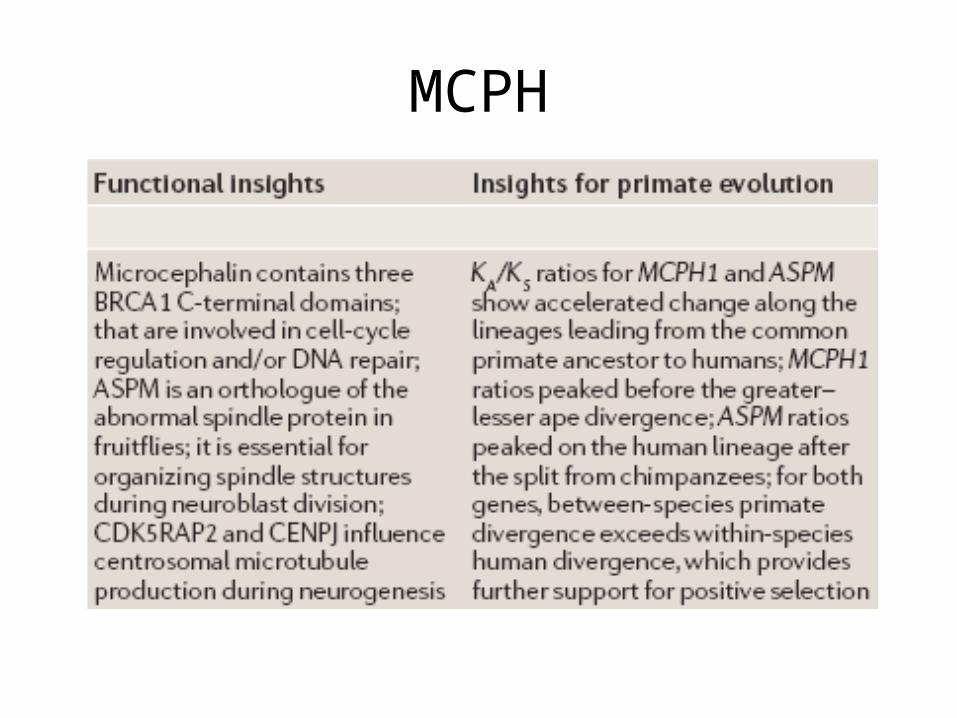
• MCPH1 (the gene that encodes microcephalin)
• and ASPM (abnormal-spindle-like, microcephaly associated)
• Both MCPH1 and ASPM are evolutionarily ancient, with orthologues that are likely to be present in all chordates
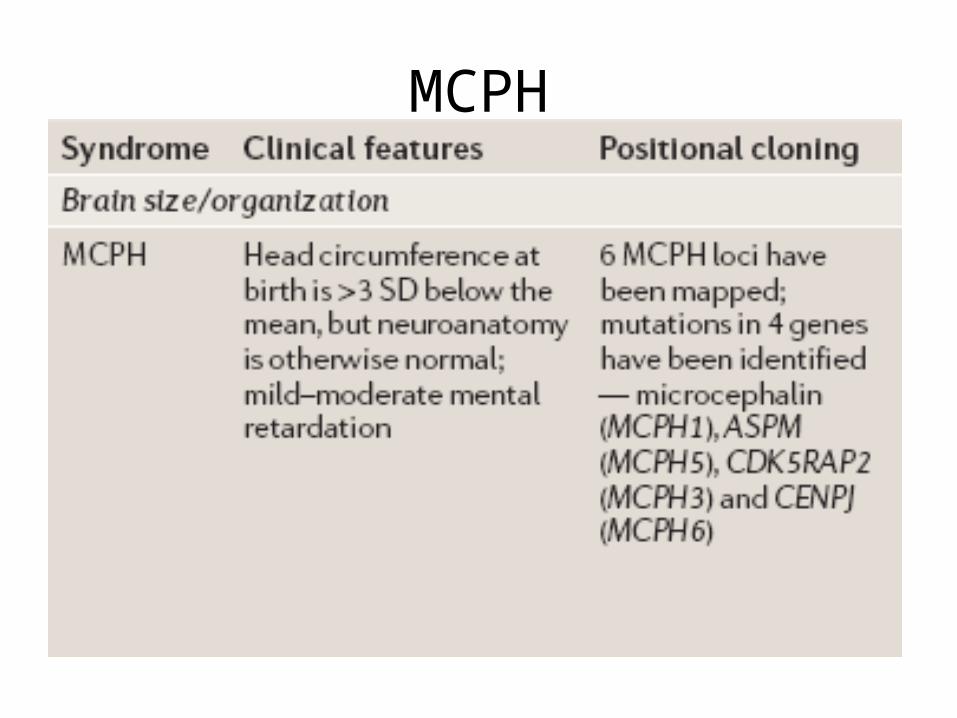
MCPH
MCPH
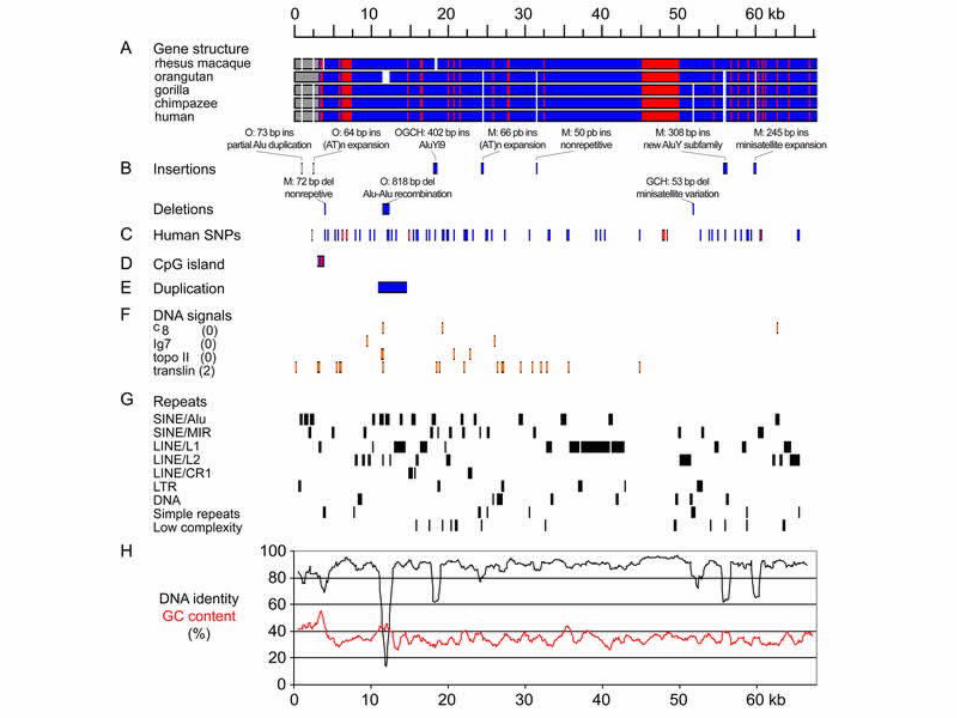
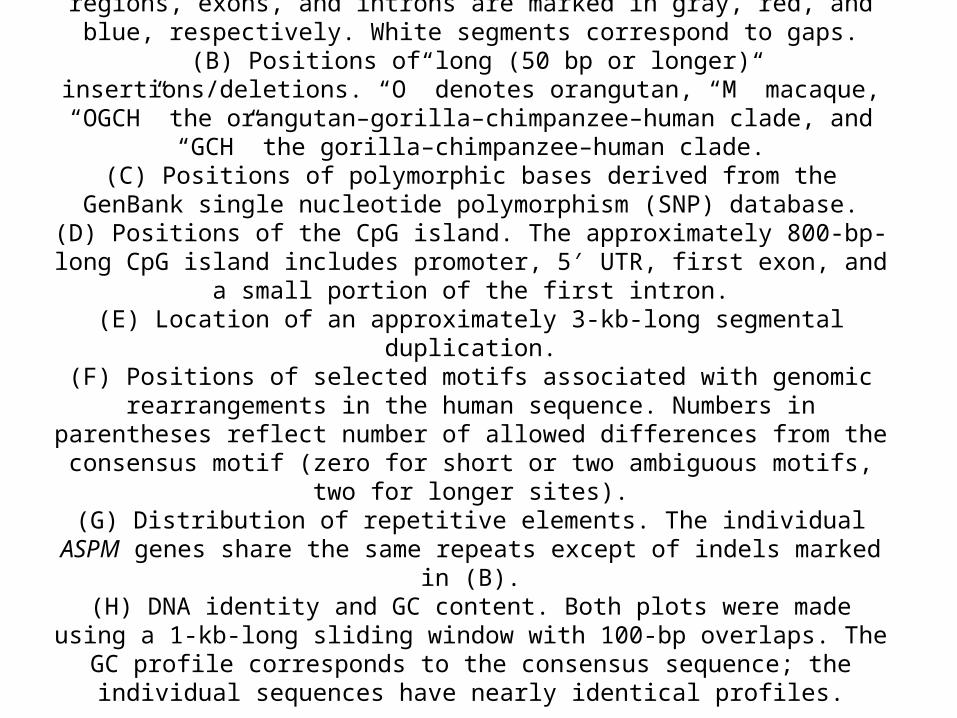
(A) Schematic representation of the alignment. Promoter regions, exons, and introns are marked in gray, red, and blue, respectively. White segments
correspond to gaps.(B) Positions of long (50 bp or longer) insertions/deletions. “O” denotes
orangutan, “M” macaque, “OGCH” the orangutan–gorilla–chimpanzee–human clade, and “GCH” the gorilla–chimpanzee–human clade.
(C) Positions of polymorphic bases derived from the GenBank single nucleotide polymorphism (SNP) database.
(D) Positions of the CpG island. The approximately 800-bp-long CpG island includes promoter, 5′ UTR, first exon, and a small portion of the first intron.
(E) Location of an approximately 3-kb-long segmental duplication.(F) Positions of selected motifs associated with genomic rearrangements in the
human sequence. Numbers in parentheses reflect number of allowed differences from the consensus motif (zero for short or two ambiguous motifs,
two for longer sites).(G) Distribution of repetitive elements. The individual ASPM genes share the
same repeats except of indels marked in (B).(H) DNA identity and GC content. Both plots were made using a 1-kb-long
sliding window with 100-bp overlaps. The GC profile corresponds to the consensus sequence; the individual sequences have nearly identical profiles.
Linkage Studies
Monogenic and Complex Studies
© 2005 Prentice Hall Inc. / A Pearson Education Company / Upper Saddle River, New Jersey 07458
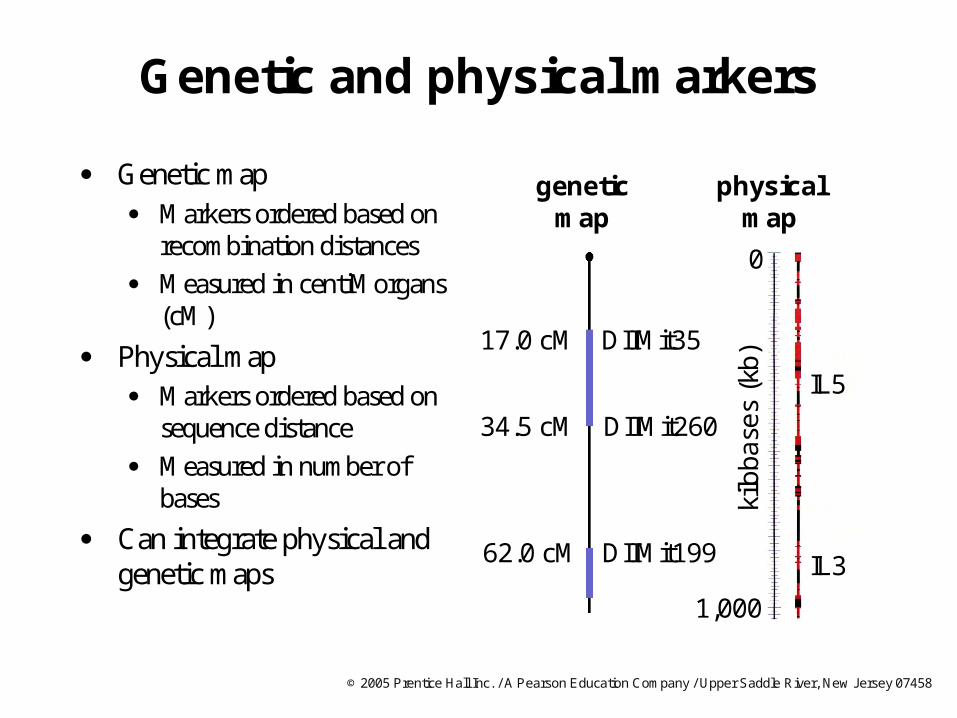
Genetic and physical markers
Genetic map Markers ordered based on
recombination distances
Measured in centiMorgans(cM)
Physical map Markers ordered based on
sequence distance
Measured in number of bases
Can integrate physical and genetic maps
DIIMit260
0
IL3
IL5
kilo
bas
es
(kb)
1,000
DIIMit3517.0 cM
34.5 cM
physicalmap
geneticmap
62.0 cM DIIMit199
© 2005 Prentice Hall Inc. / A Pearson Education Company / Upper Saddle River, New Jersey 07458
Linkage analysis
Find markers that are genetically linked to disease phenotype
Calculate the odds of linkage vs. nonlinkage Threshold for significant linkage typically
taken at 1,000:1 odds of being linked vs. nonlinked
Usually converted into LOD (logarithm of the odds) LOD threshold is 3
© 2005 Prentice Hall Inc. / A Pearson Education Company / Upper Saddle River, New Jersey 07458
An example of linkage analysis
Cystic fibrosis found to be linked to well-known “met” marker on chromosome 7 But linkage was not strong enough to start
sequencing
Finer genetic mapping Markers D7S122 and D7S340 showed very
strong linkage
This finding allowed researchers to narrow down search area for a chromosome walk
© 2005 Prentice Hall Inc. / A Pearson Education Company / Upper Saddle River, New Jersey 07458
Chromosome walking
In 1989, vectors could not carry the large DNA inserts that are possible today
Example: finding the cystic fibrosis gene Walk began with probes constructed from the DNA
markers D7S122 and D7S340
Clones (~30 kb) are pulled out, beginning with marker probe
Clones used for new probes to find next sequence
Chromosome jumping facilitated the process and avoided unclonable regions
Process repeated for 280-kb region
© 2005 Prentice Hall Inc. / A Pearson Education Company / Upper Saddle River, New Jersey 07458
An illustration of chromosome walking
Contiguous clones were generated in both directions
Chromosome jumping marked new starting points for bidirectional cloning
Verified sequence with restriction map
© 2005 Prentice Hall Inc. / A Pearson Education Company / Upper Saddle River, New Jersey 07458
Analyzing candidate genes
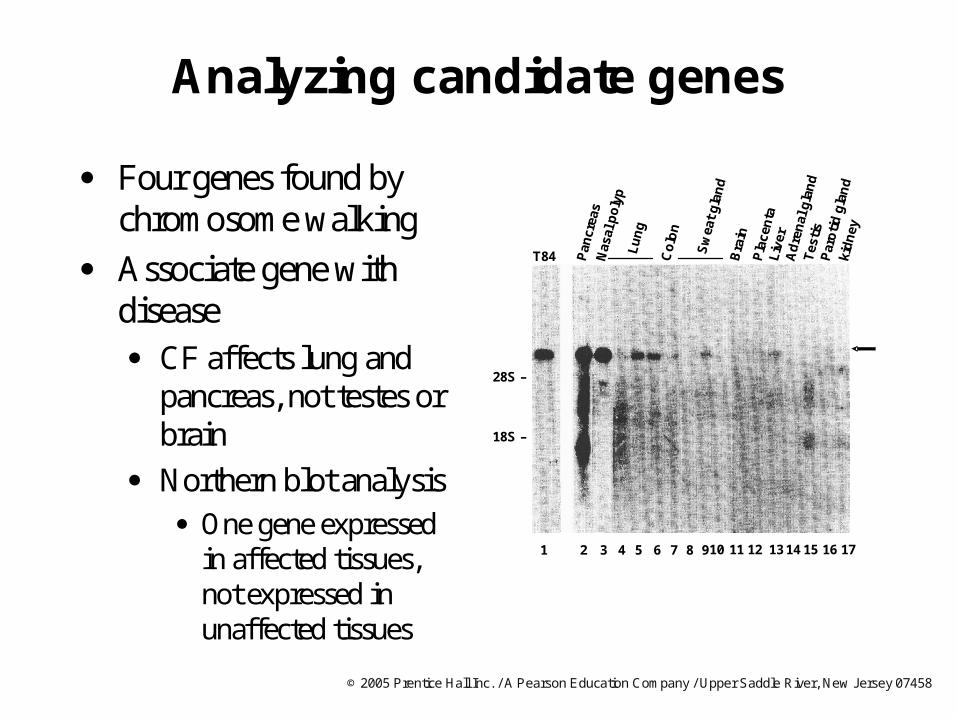
Four genes found by chromosome walking
Associate gene with disease CF affects lung and
pancreas, not testes or brain
Northern blot analysis One gene expressed
in affected tissues, not expressed in unaffected tissues
1 2 3 4 5 6 7 8 910 11 12 13 14 15 16 17
18S –
28S –
T84 Pan
crea
sN
asal
po
lyp
Lu
ng
Co
lon
Sw
eat
gla
nd
Bra
inP
lace
nta
Liv
erA
dre
nal
gla
nd
Tes
tis
Par
oti
d g
lan
dki
dn
ey
© 2005 Prentice Hall Inc. / A Pearson Education Company / Upper Saddle River, New Jersey 07458
Mutation identification
CF patients all had mutations (deletions and substitutions) in identified gene
Identification of gene and function opens up possibilities for therapy

© 2005 Prentice Hall Inc. / A Pearson Education Company / Upper Saddle River, New Jersey 07458
Using genomics to find Mendelian disease genes
Identify candidategenes in human genome
databases
Linkage analysis
Finer genetic mapping
Physical mapping
Gene cloning
Mutation identification Mutation identification

© 2005 Prentice Hall Inc. / A Pearson Education Company / Upper Saddle River, New Jersey 07458
Postgenome approach for finding Mendelian disease genes
High-density SNP map makes linkage analysis easier Pre–human genome: ~6,000 chromosomal markers
Post–human genome: millions of SNPs
Complete sequence of human genome provides all possible candidate genes
Homology searches now much easier Characteristics of disease may suggest what disease
gene should look like (e.g., a brain-specific ion channel for a neurological disease)
© 2005 Prentice Hall Inc. / A Pearson Education Company / Upper Saddle River, New Jersey 07458
Complex disease
Monogenic disease traits Mendelian disease
Mitochondrial disease
Typically rare: < 0.1%
Complex disease Common: > 0.1%
Polygenic or oligogenic
Environmental factors contribute
© 2005 Prentice Hall Inc. / A Pearson Education Company / Upper Saddle River, New Jersey 07458
Factors complicating the analysis of complex-disease traits
Incomplete penetrance Inheritance of gene predisposing individual to
disease is not sufficient to cause disease
Phenocopies People may develop disease without necessarily
possessing a gene that predisposes them to that illness
© 2005 Prentice Hall Inc. / A Pearson Education Company / Upper Saddle River, New Jersey 07458
Common multifactorial diseases
Frequency of some well-known complex-disease traits Hypertension (~23%)
Diabetes (~5%)
Epilepsy (~1%)
Schizophrenia (~1%)
Bipolar disorder (~1%)
Multiple sclerosis (~0.1%)
Autism (~0.1%)
© 2005 Prentice Hall Inc. / A Pearson Education Company / Upper Saddle River, New Jersey 07458
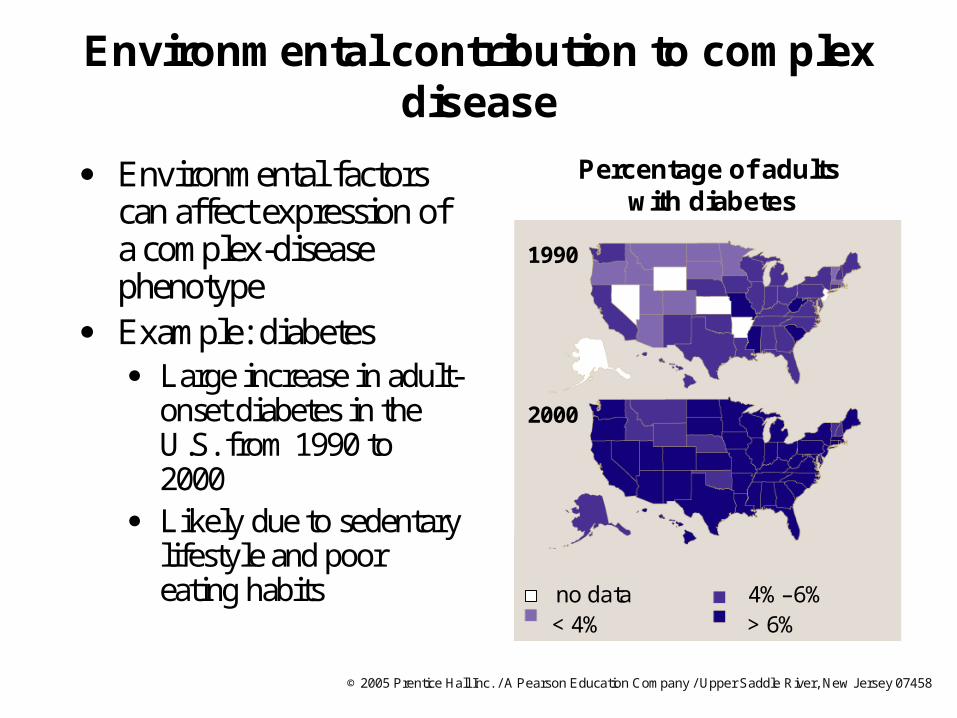
Environmental contribution to complex disease
Environmental factors can affect expression of a complex-disease phenotype
Example: diabetes Large increase in adult-
onset diabetes in the U.S. from 1990 to 2000
Likely due to sedentary lifestyle and poor eating habits
Percentage of adults with diabetes
2000
1990
no data 4%–6%< 4% > 6%
© 2005 Prentice Hall Inc. / A Pearson Education Company / Upper Saddle River, New Jersey 07458
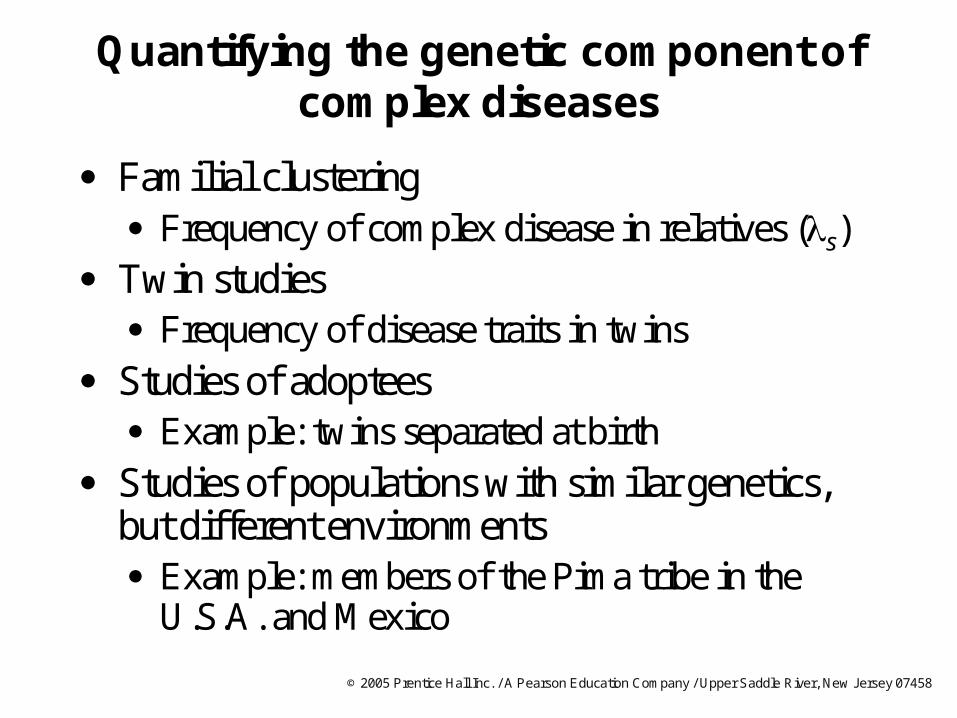
Quantifying the genetic component of complex diseases
Familial clustering Frequency of complex disease in relatives (s)
Twin studies Frequency of disease traits in twins
Studies of adoptees Example: twins separated at birth
Studies of populations with similar genetics, but different environments Example: members of the Pima tribe in the
U.S.A. and Mexico
© 2005 Prentice Hall Inc. / A Pearson Education Company / Upper Saddle River, New Jersey 07458
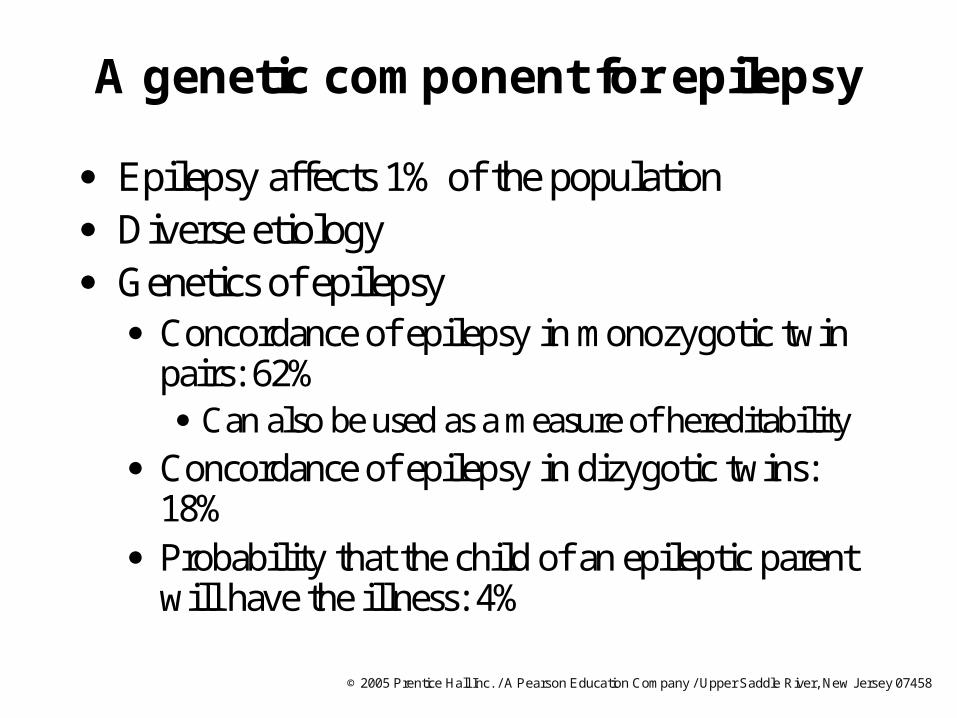
A genetic component for epilepsy
Epilepsy affects 1% of the population Diverse etiology Genetics of epilepsy
Concordance of epilepsy in monozygotic twin pairs: 62% Can also be used as a measure of hereditability
Concordance of epilepsy in dizygotic twins: 18%
Probability that the child of an epileptic parent will have the illness: 4%
© 2005 Prentice Hall Inc. / A Pearson Education Company / Upper Saddle River, New Jersey 07458
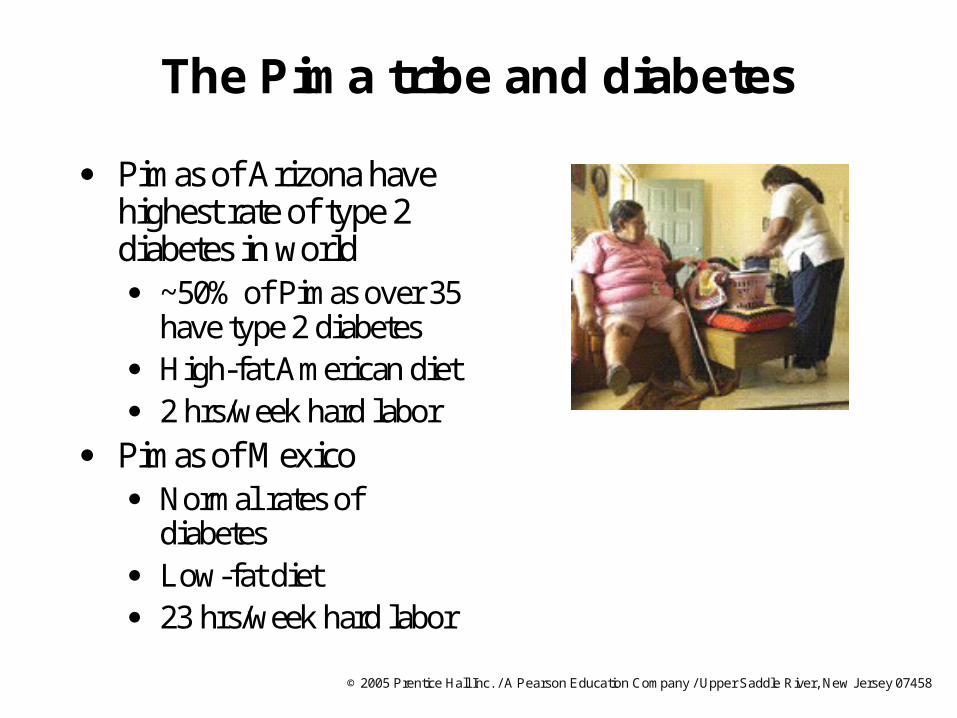
The Pima tribe and diabetes
Pimas of Arizona have highest rate of type 2 diabetes in world ~50% of Pimas over 35
have type 2 diabetes High-fat American diet 2 hrs/week hard labor
Pimas of Mexico Normal rates of
diabetes Low-fat diet 23 hrs/week hard labor
© 2005 Prentice Hall Inc. / A Pearson Education Company / Upper Saddle River, New Jersey 07458
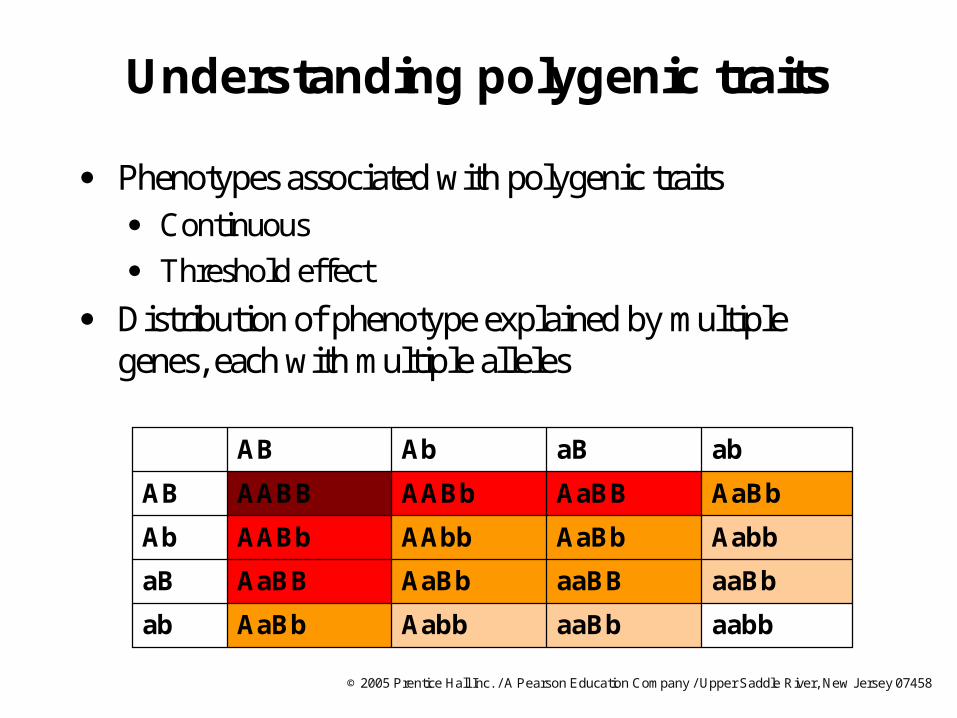
Understanding polygenic traits
Phenotypes associated with polygenic traits Continuous
Threshold effect
Distribution of phenotype explained by multiple genes, each with multiple alleles
aabbaaBbAabbAaBbab
aaBbaaBBAaBbAaBBaB
AabbAaBbAAbbAABbAb
AaBbAaBBAABbAABBAB
abaBAbAB
© 2005 Prentice Hall Inc. / A Pearson Education Company / Upper Saddle River, New Jersey 07458
0
1
2
3
4
5
6
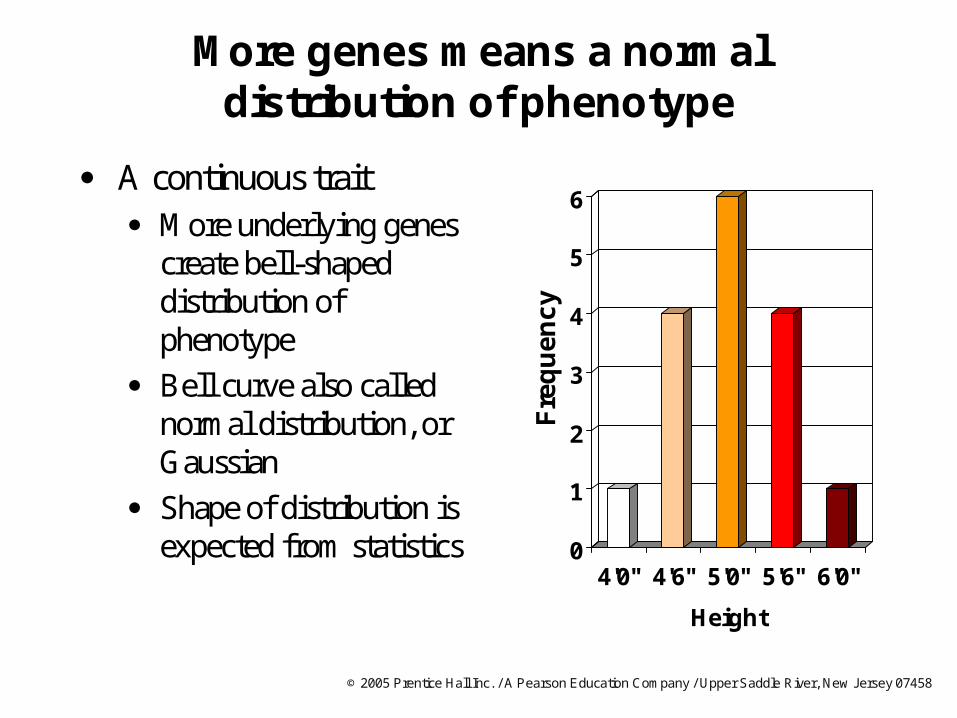
4'0" 4'6" 5'0" 5'6" 6'0"
Height
More genes means a normal distribution of phenotype
A continuous trait More underlying genes
create bell-shaped distribution of phenotype
Bell curve also called normal distribution, or Gaussian
Shape of distribution is expected from statistics
Fre
qu
enc
y
© 2005 Prentice Hall Inc. / A Pearson Education Company / Upper Saddle River, New Jersey 07458
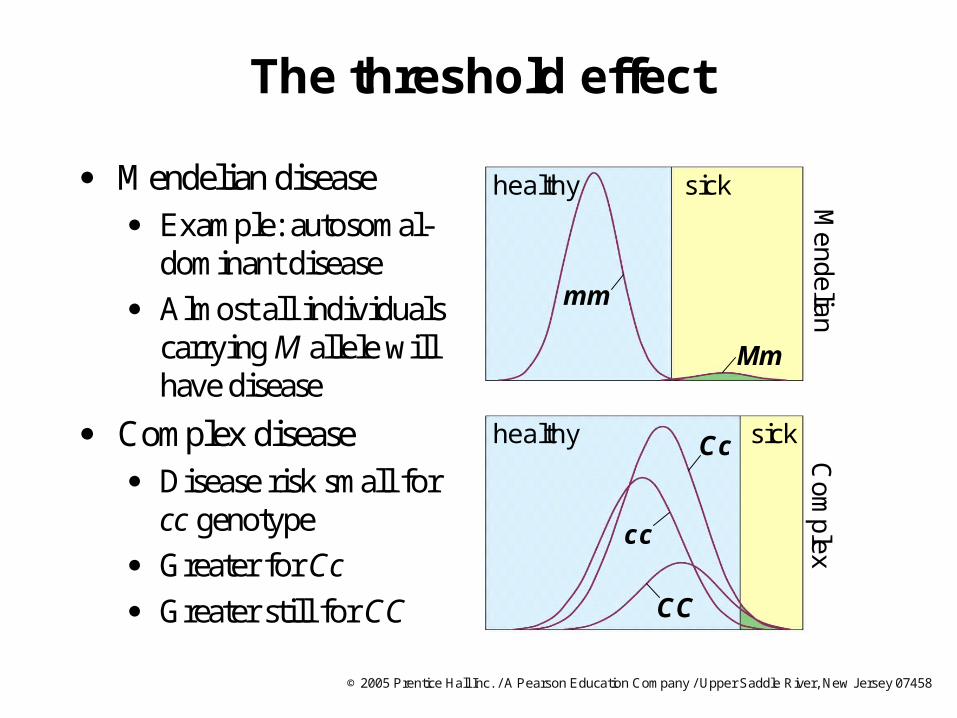
The threshold effect
Mendelian disease Example: autosomal-
dominant disease
Almost all individuals carrying M allele will have disease
Complex disease Disease risk small for
cc genotype
Greater for Cc
Greater still for CC
Me
ndelian
Com
plex
mm
Mm
Cc
cc
CC
sickhealthy
sickhealthy
© 2005 Prentice Hall Inc. / A Pearson Education Company / Upper Saddle River, New Jersey 07458
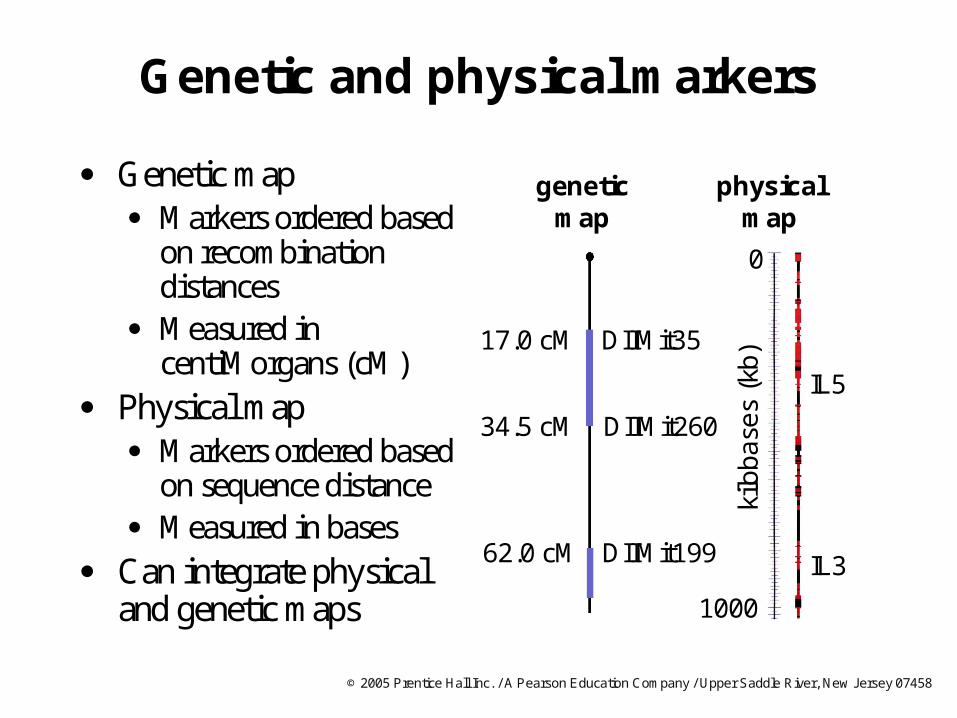
Genetic and physical markers
Genetic map Markers ordered based
on recombination distances
Measured in centiMorgans (cM)
Physical map Markers ordered based
on sequence distance Measured in bases
Can integrate physical and genetic maps
DIIMit260
0
IL3
IL5
kilo
bas
es
(kb)
1000
DIIMit3517.0 cM
34.5 cM
physicalmap
geneticmap
62.0 cM DIIMit199
© 2005 Prentice Hall Inc. / A Pearson Education Company / Upper Saddle River, New Jersey 07458
Linkage analysis
Use pedigrees from families that have the disease
Recombination occurs over a small number of generations
Gene locus is large
1 generation
© 2005 Prentice Hall Inc. / A Pearson Education Company / Upper Saddle River, New Jersey 07458
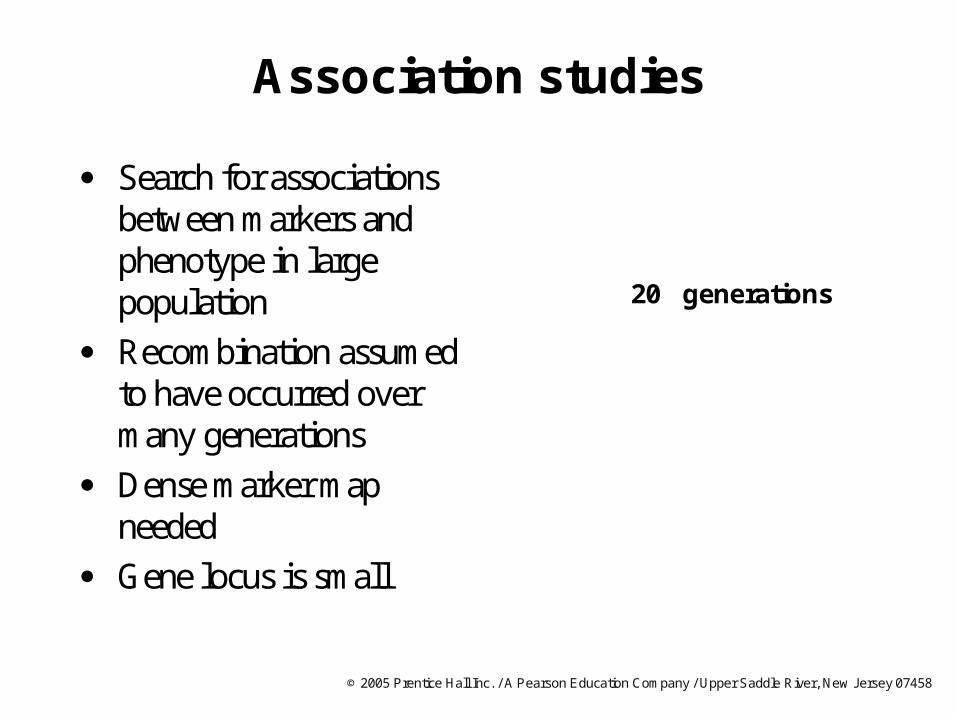
Association studies
Search for associations between markers and phenotype in large population
Recombination assumed to have occurred over many generations
Dense marker map needed
Gene locus is small
20 generations

© 2005 Prentice Hall Inc. / A Pearson Education Company / Upper Saddle River, New Jersey 07458
Strict criteria for complex-disease gene studies
Statistical significance for genomewide association or linkage No genomewide association studies to date; only
linkage Resolution of linkage insufficient for identifying gene
Fine mapping of locus Linkage disequilibrium
Analysis of the sequence Find nucleotide variants consistent with disease
phenotype Testing of candidate-gene function
Complement deficient gene to restore healthy state Circumstantial evidence
© 2005 Prentice Hall Inc. / A Pearson Education Company / Upper Saddle River, New Jersey 07458
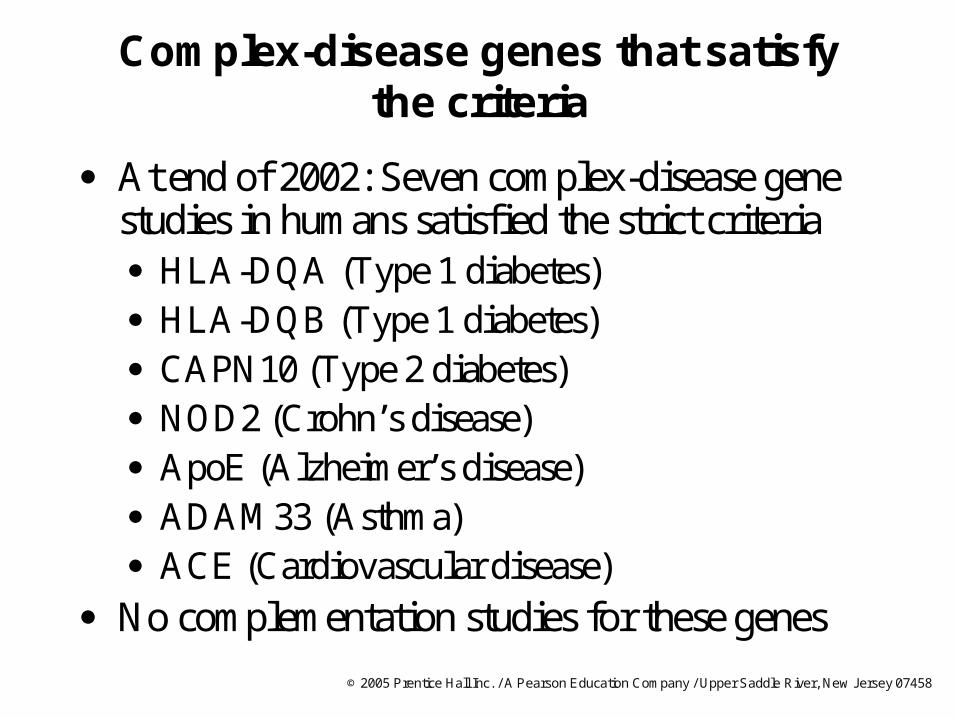
Complex-disease genes that satisfy the criteria
At end of 2002: Seven complex-disease gene studies in humans satisfied the strict criteria HLA-DQA (Type 1 diabetes) HLA-DQB (Type 1 diabetes) CAPN10 (Type 2 diabetes) NOD2 (Crohn’s disease) ApoE (Alzheimer’s disease) ADAM33 (Asthma) ACE (Cardiovascular disease)
No complementation studies for these genes
© 2005 Prentice Hall Inc. / A Pearson Education Company / Upper Saddle River, New Jersey 07458
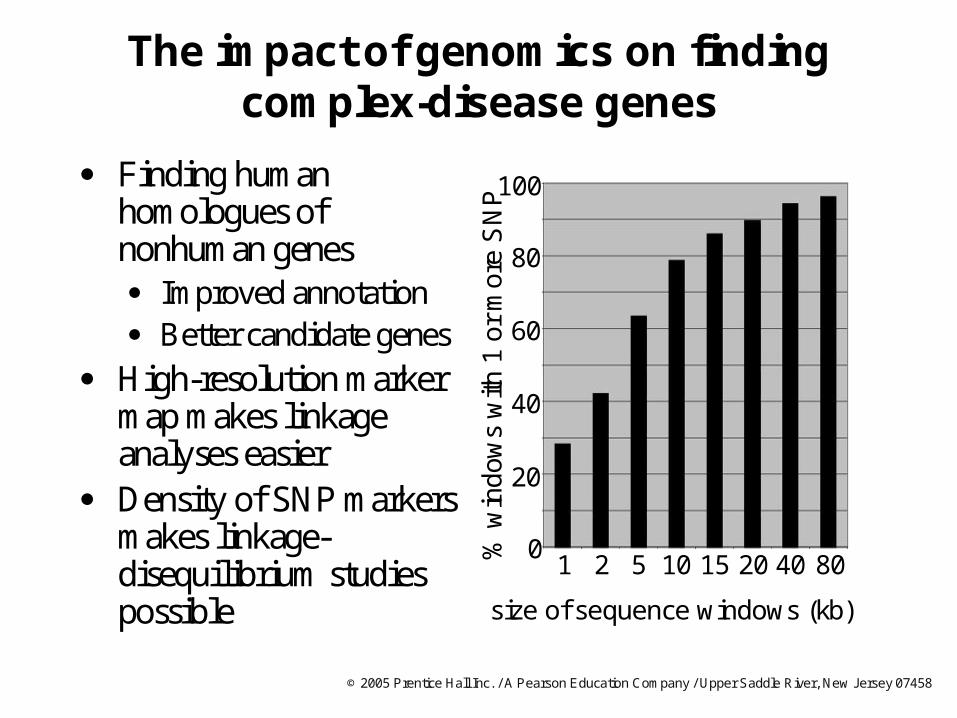
The impact of genomics on finding complex-disease genes
Finding human homologues of nonhuman genes Improved annotation Better candidate genes
High-resolution marker map makes linkage analyses easier
Density of SNP markers makes linkage-disequilibrium studies possible
100
60
40
20
0
80
% w
ind
ows
with
1 o
r m
ore
SN
P
size of sequence windows (kb)
1 2 5 10 15 20 8040
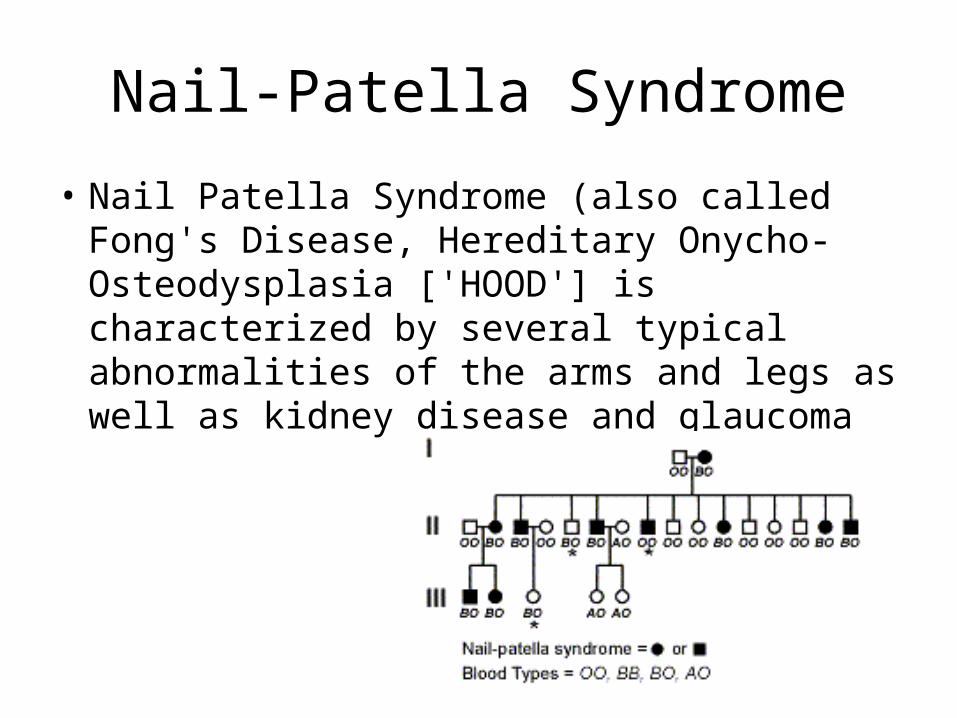
Nail-Patella Syndrome
• Nail Patella Syndrome (also called Fong's Disease, Hereditary Onycho-Osteodysplasia ['HOOD'] is characterized by several typical abnormalities of the arms and legs as well as kidney disease and glaucoma
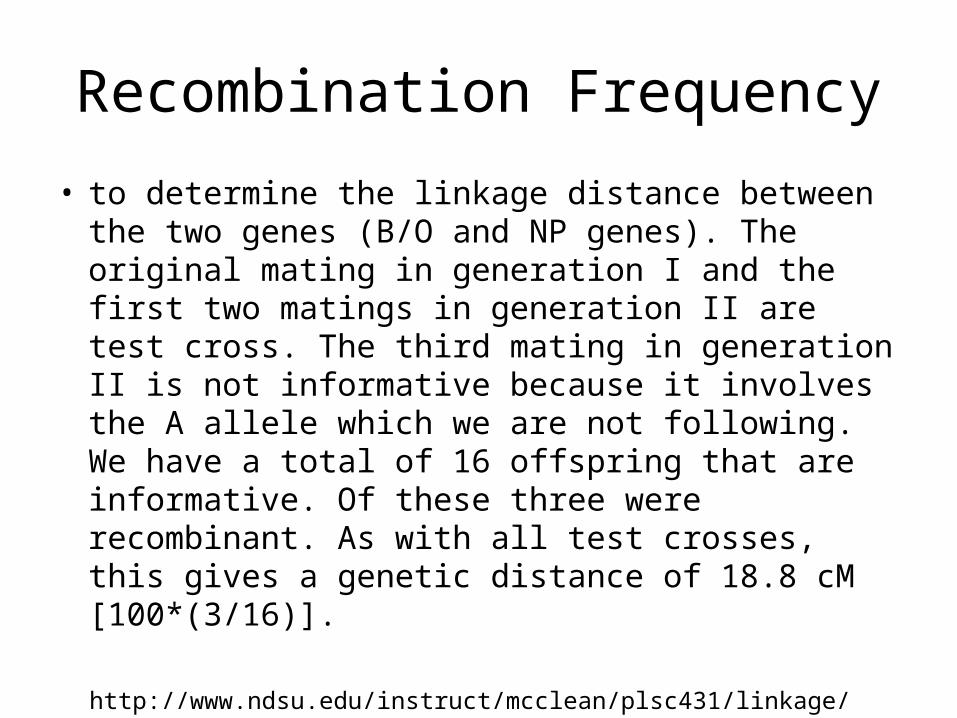
Recombination Frequency
• to determine the linkage distance between the two genes (B/O and NP genes). The original mating in generation I and the first two matings in generation II are test cross. The third mating in generation II is not informative because it involves the A allele which we are not following. We have a total of 16 offspring that are informative. Of these three were recombinant. As with all test crosses, this gives a genetic distance of 18.8 cM [100*(3/16)].
http://www.ndsu.edu/instruct/mcclean/plsc431/linkage/linkage6.htm
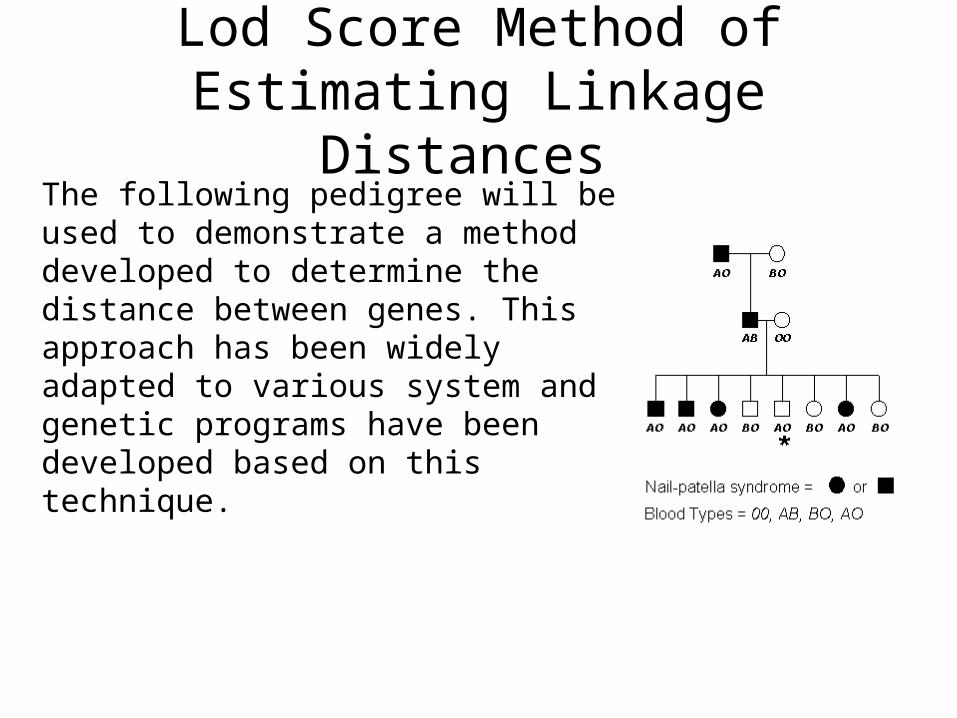
Lod Score Method of Estimating Linkage Distances
The following pedigree will be used to demonstrate a method developed to determine the distance between genes. This approach has been widely adapted to various system and genetic programs have been developed based on this technique.
Pedigree
• Even though we are working with the same two genes, nail-patella and blood type, in this pedigree the dominant allele seems to be coupled with the A blood type allele.
• Remember in the previous example, the dominant nail-patella allele was linked with the B allele. This is an important point in genetics --- not all linkages between alleles of two genes are found to be constant throughout a species.
• Why??? Because at some point in the lineage of this family, the disease (nail-patella) allele recombined and became linked to a different blood type allele. In even other lineages, the nail-patella causing allele is linked to the O blood type allele.

Recombination Frequency
• we have one recombinant among the eight progeny. This gives us a recombination frequency of 0.125 and a distance of 12.5 cM.
LOD Score Method
• developed by Newton E. Morton, and is an iterative approach that include a series of lod scores calculated from a number of proposed linkage distance.
LOD Score Method
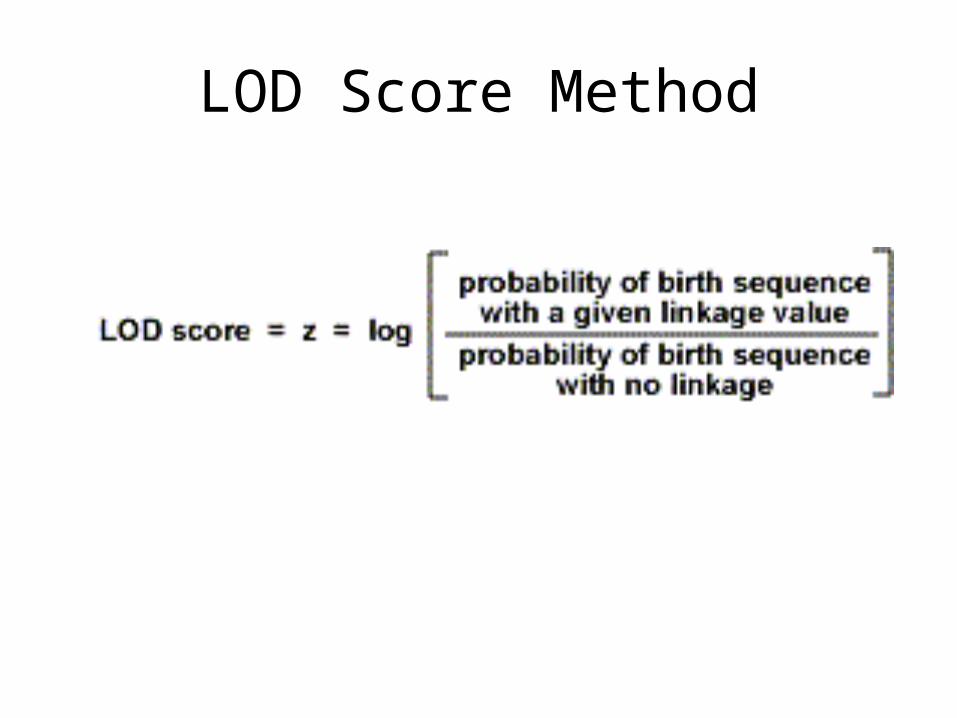
• A linkage distance is estimated, and given that estimate, the probability of a given birth sequence is calculated. That value is then divided by the probability of a given birth sequence assuming that the genes are unlinked. The log of this value is calculated, and that value is the lod score for this linkage distance estimate.
LOD Score Method
Example
• In this first birth sequence, we have an individual with a parental genotype. The probability of this event is (1 - 0.125). Because there are two parental types, this value is divided by two to give a value of 0.4375. In this pedigree we have a total of seven parental types. We also have one recombinant type. The probability of this event is 0.125 which is divided by two because two recombinant types exist.
Example
• What would the sequence of births be if these genes were unlinked?
• When two genes are unlinked the recombination frequency is 0.5. Therefore, the probability of any given genotype would be 0.25.
Linkage Probability
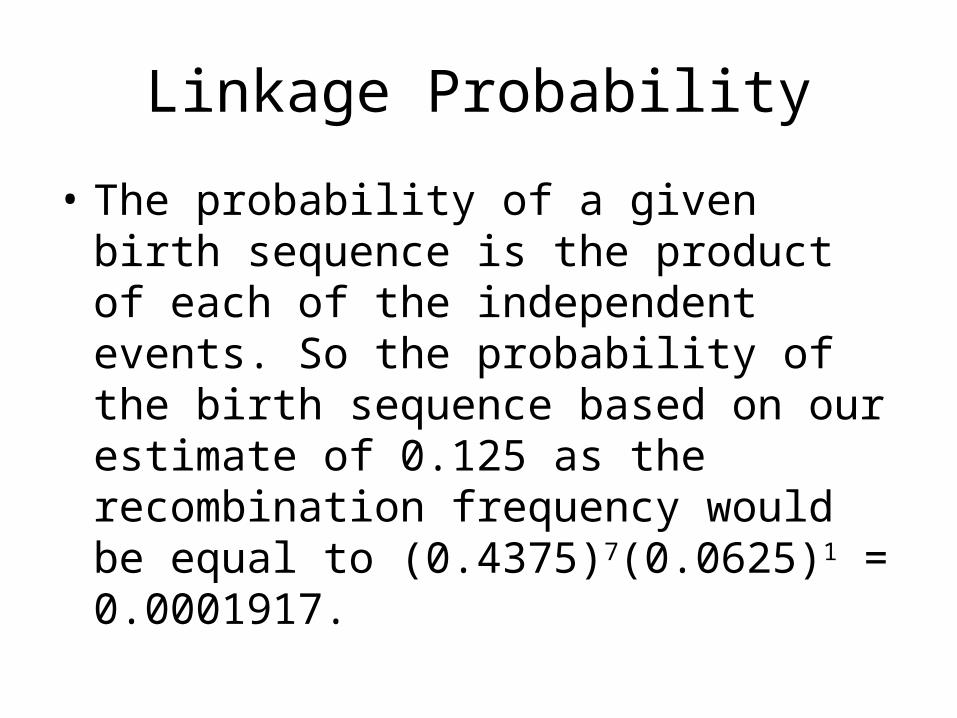
• The probability of a given birth sequence is the product of each of the independent events. So the probability of the birth sequence based on our estimate of 0.125 as the recombination frequency would be equal to (0.4375)7(0.0625)1 = 0.0001917.
Non-linkage Probability
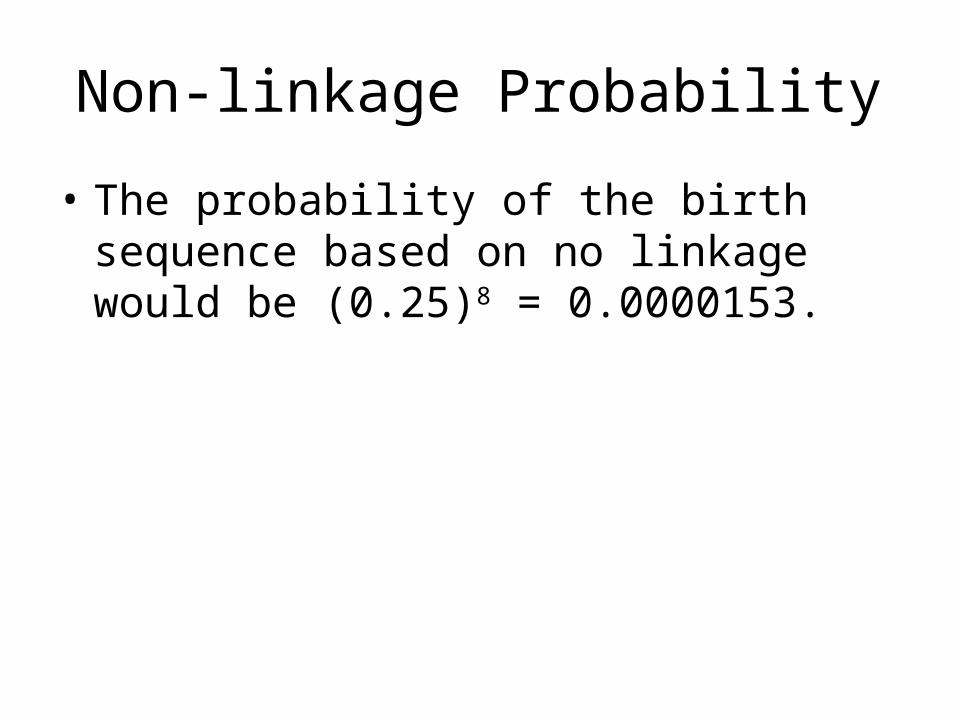
• The probability of the birth sequence based on no linkage would be (0.25)8 = 0.0000153.
Calculation of LOD score
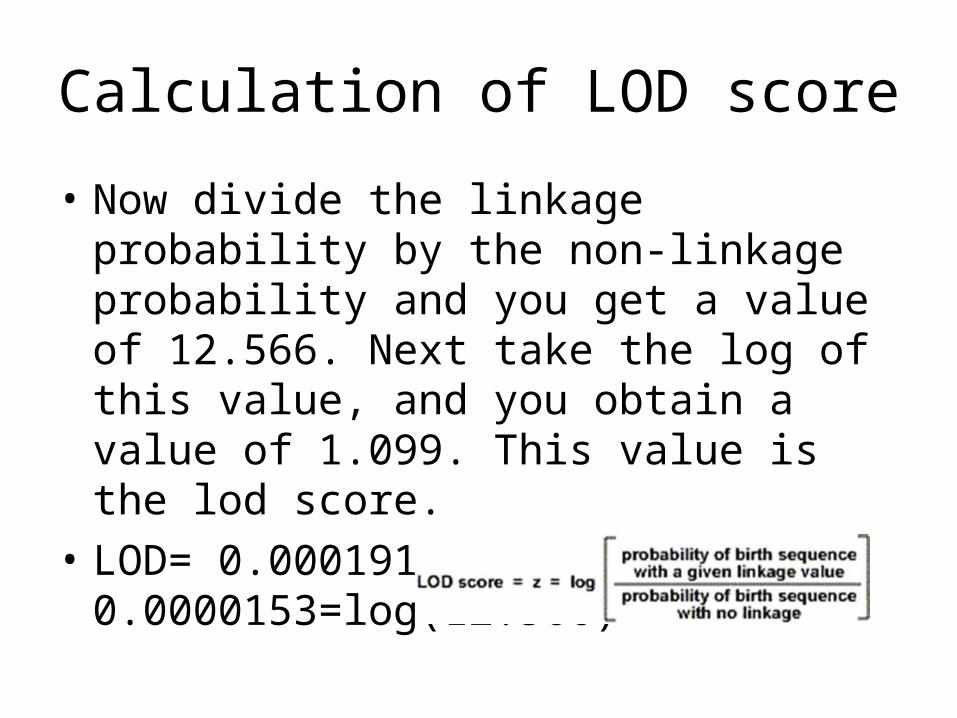
• Now divide the linkage probability by the non-linkage probability and you get a value of 12.566. Next take the log of this value, and you obtain a value of 1.099. This value is the lod score.
• LOD= 0.0001917/ 0.0000153=log(12.566)
In practice, we would like to see a lod score greater that 3.0.
What this means is that the likelihood of linkage occurring at this distance is 1000 times greater that no linkage.
© 2005 Prentice Hall Inc. / A Pearson Education Company / Upper Saddle River, New Jersey 07458
What we can learn from LD
Finding disease genes Fine mapping of genes
Genomewide association studies
Other uses Revealing the history of human populations
Understanding human origins
Studying patterns of recombination in the human genome
© 2005 Prentice Hall Inc. / A Pearson Education Company / Upper Saddle River, New Jersey 07458
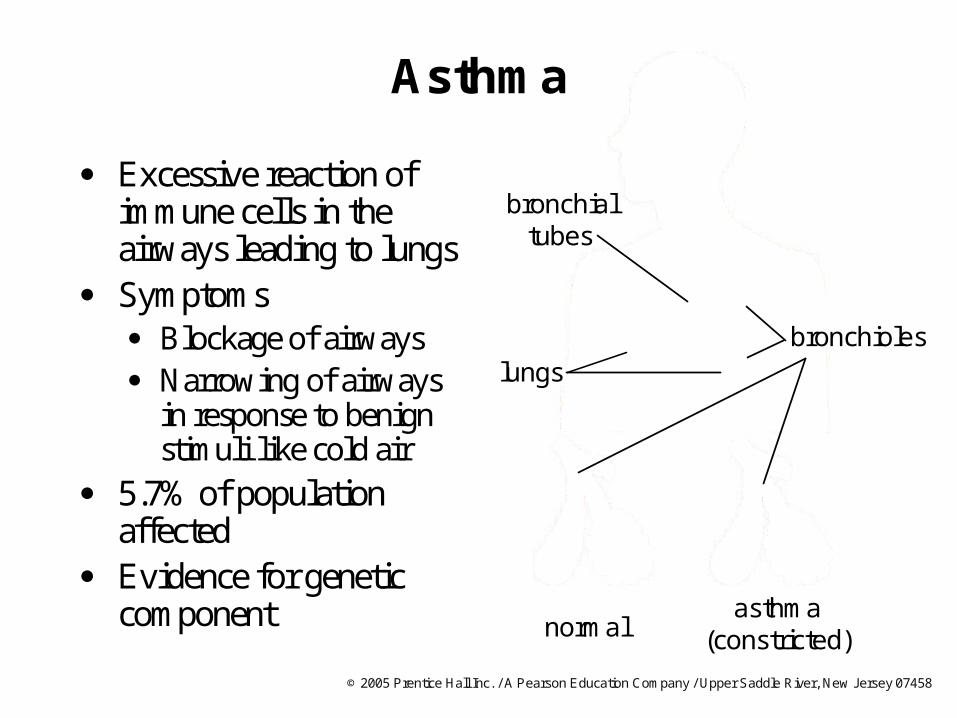
Asthma
Excessive reaction of immune cells in the airways leading to lungs
Symptoms Blockage of airways Narrowing of airways
in response to benign stimuli like cold air
5.7% of population affected
Evidence for genetic component
bronchialtubes
bronchioles
normalasthma
(constricted)
lungs
© 2005 Prentice Hall Inc. / A Pearson Education Company / Upper Saddle River, New Jersey 07458
Finding a gene associated with asthma
Use classic linkage analysis to localize disease gene to area on the chromosome
Avoid the problem of multiple etiologies by restricting disease definition
Use linkage disequilibrium to narrow down area where disease gene might be located
Look for candidate genes
Perform gene expression study to ensure that disease gene is expressed in appropriate tissues
© 2005 Prentice Hall Inc. / A Pearson Education Company / Upper Saddle River, New Jersey 07458
Linkage analysis and asthma symptoms
Begin linkage analysis with basic definition of asthma Medical diagnosis
Patient medication
Improve linkage by defining more homogeneous disease phenotype Asthma and bronchial
hyperresponsiveness
Case Control Studies
Modified from Iris A. Granek, M.D., M.S.
Case-control studies
• Search for differences in allele frequency between disease carriers (cases) and non carriers (controls) with the assumption differences in frequencies are associated with disease outcome.
• Can be applied to exposure to a chemical or a carcinogen instead of allele (genotypes).
Case Selection
• Define the source population– residents of a geographic region– hospital inpatient or clinic
• Strict case definition– inclusion criteria
Control Selection
• Same source population as the cases
• Choose the controls by random from the source population– spouses – associates– patients within the same facility– matched for certain criteria
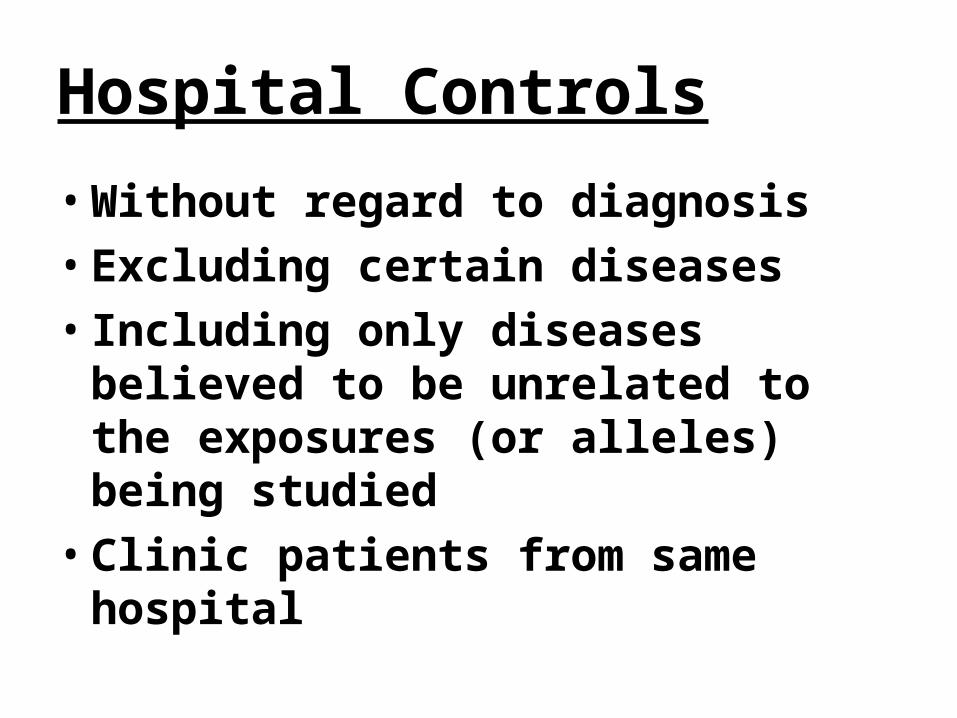
Hospital Controls
• Without regard to diagnosis
• Excluding certain diseases
• Including only diseases believed to be unrelated to the exposures (or alleles) being studied
• Clinic patients from same hospital
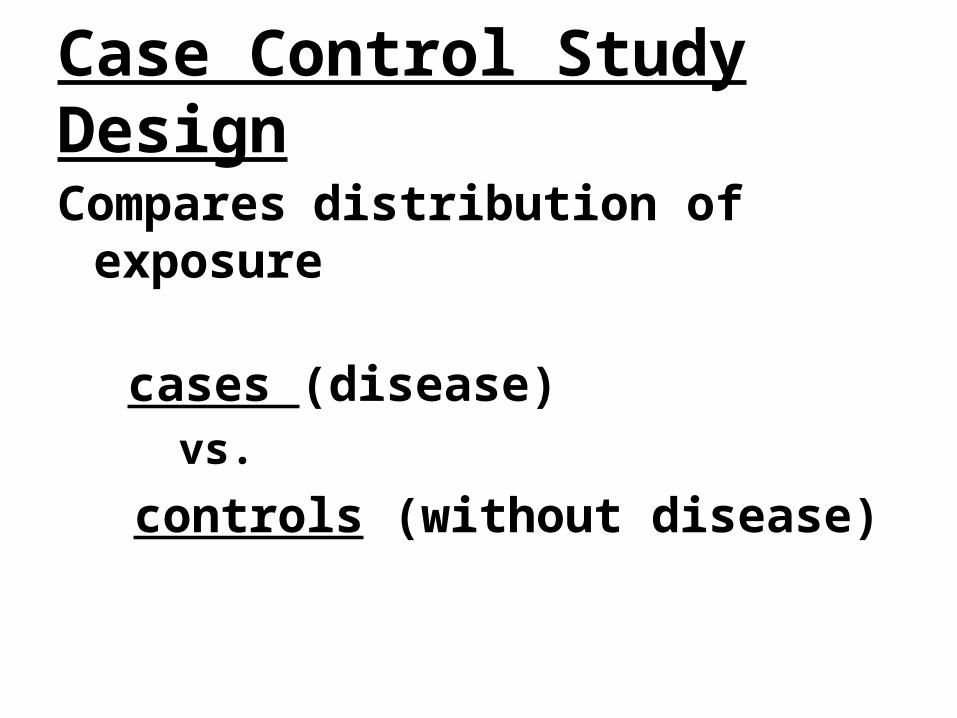
Case Control Study Design
Compares distribution of exposure
cases (disease) vs.
controls (without disease)
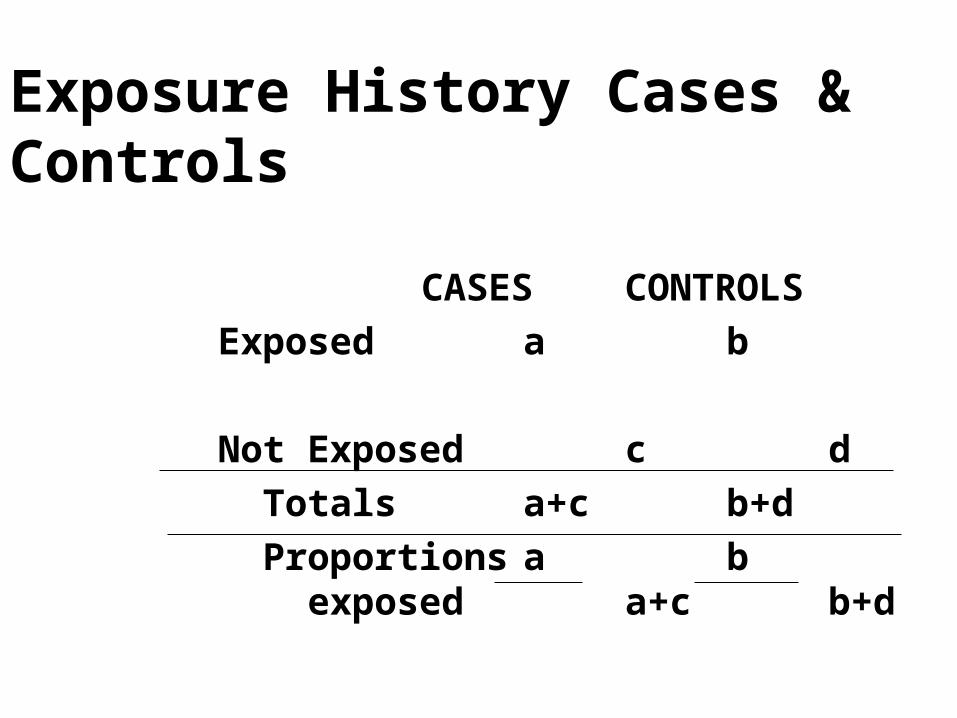
Exposure History Cases & Controls
CASES CONTROLS
Exposed a b
Not Exposed c d
Totals a+c b+d
Proportions a b exposed a+c b+d
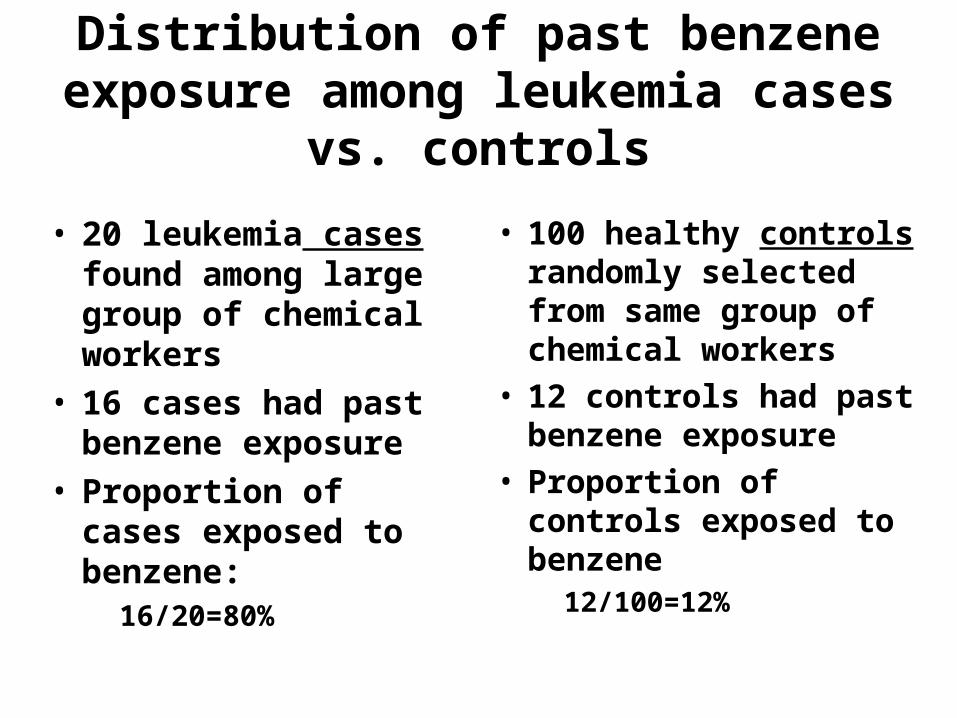
Distribution of past benzene exposure among leukemia cases vs.
controls
• 20 leukemia cases found among large group of chemical workers
• 16 cases had past benzene exposure
• Proportion of cases exposed to benzene:
16/20=80%
• 100 healthy controls randomly selected from same group of chemical workers
• 12 controls had past benzene exposure
• Proportion of controls exposed to benzene
12/100=12%
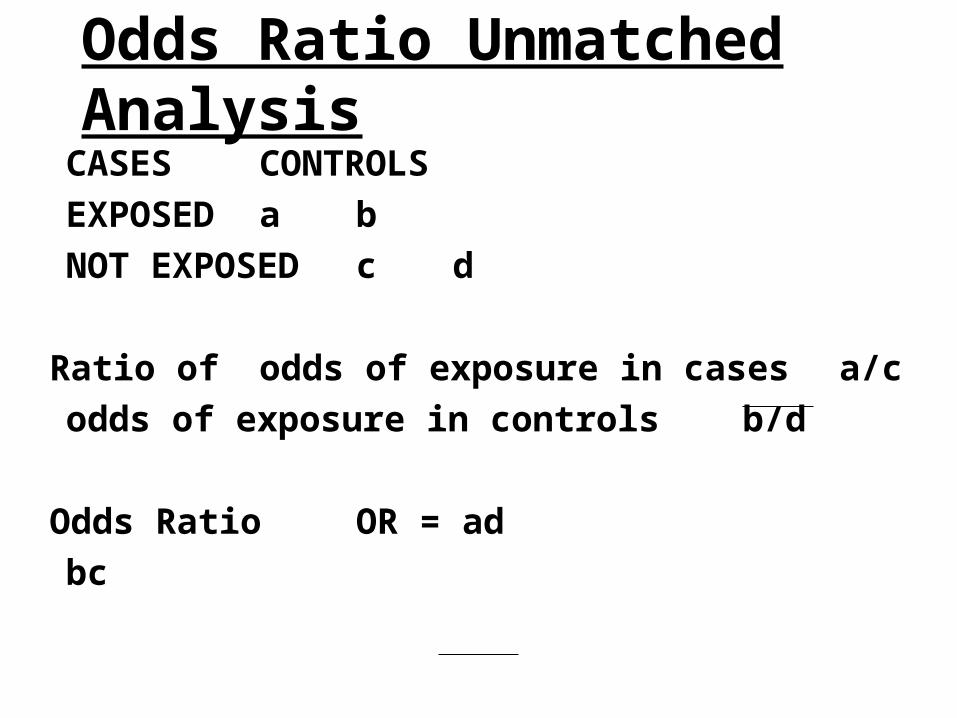
Odds Ratio Unmatched Analysis
CASES CONTROLS
EXPOSED a b
NOT EXPOSED c d
Ratio of odds of exposure in cases a/c
odds of exposure in controls b/d
Odds Ratio OR = ad
bc
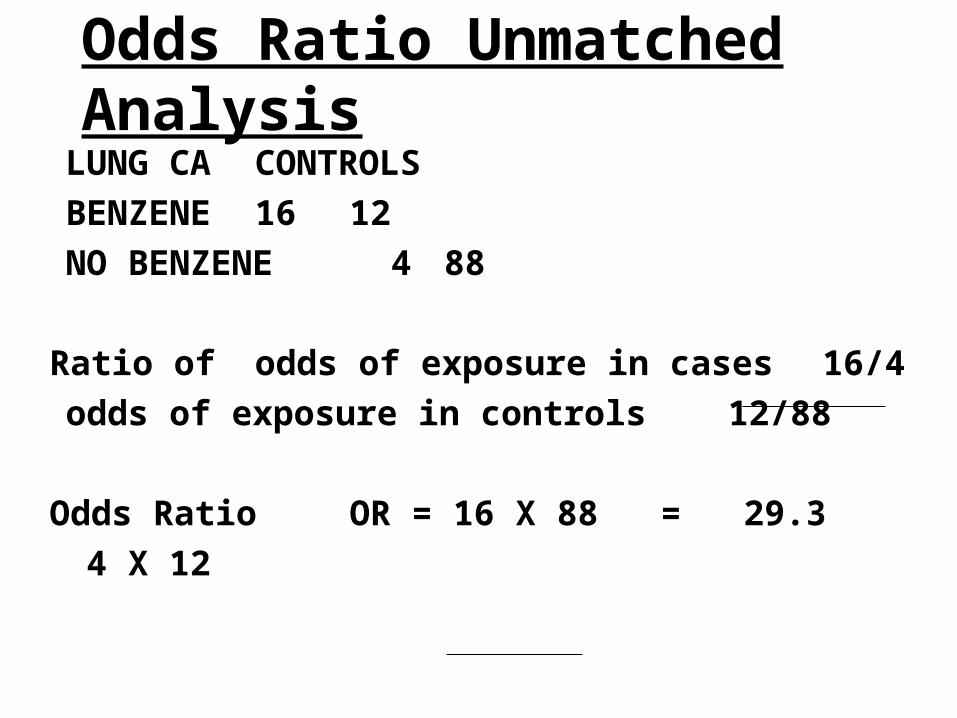
Odds Ratio Unmatched Analysis
LUNG CA CONTROLS
BENZENE 16 12
NO BENZENE 4 88
Ratio of odds of exposure in cases 16/4
odds of exposure in controls12/88
Odds Ratio OR = 16 X 88 = 29.3
4 X 12
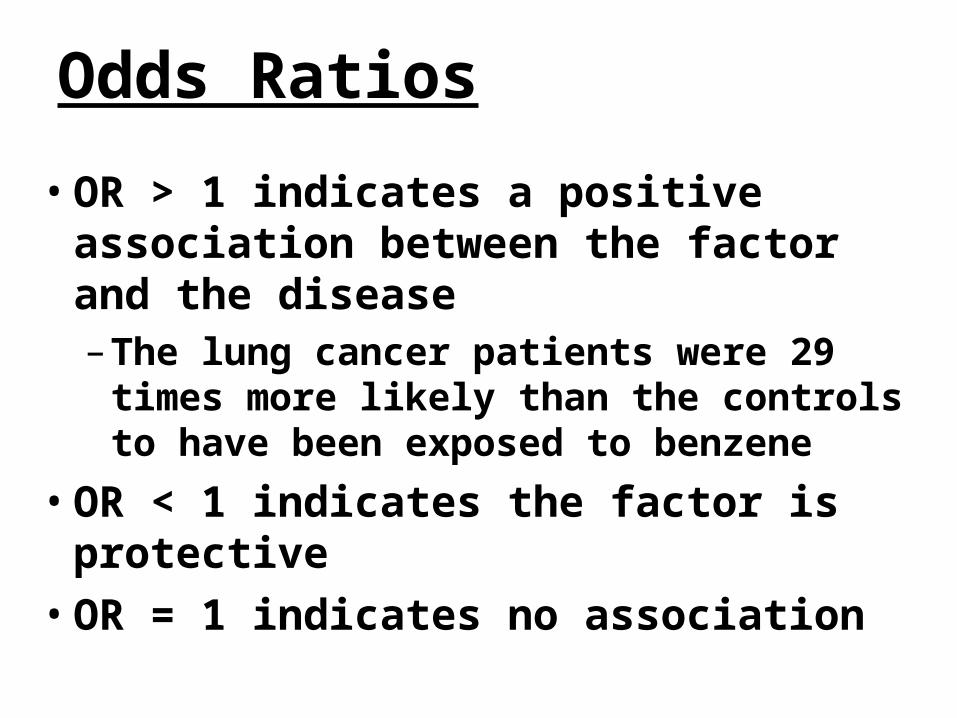
Odds Ratios
• OR > 1 indicates a positive association between the factor and the disease– The lung cancer patients were 29
times more likely than the controls to have been exposed to benzene
• OR < 1 indicates the factor is protective
• OR = 1 indicates no association
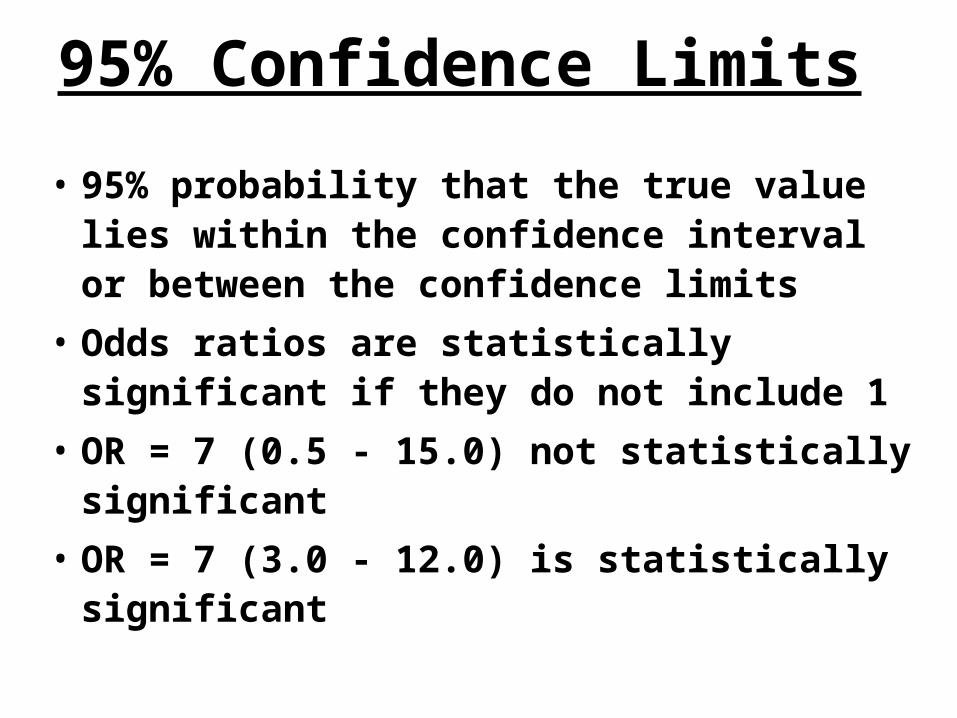
95% Confidence Limits
• 95% probability that the true value lies within the confidence interval or between the confidence limits
• Odds ratios are statistically significant if they do not include 1
• OR = 7 (0.5 - 15.0) not statistically significant
• OR = 7 (3.0 - 12.0) is statistically significant
Advantages of Case Control• Quick and Inexpensive
• Optimal for rare diseases
• Useful for diseases of long latency from exposure to disease development
• Can evaluate multiple risk factors
Bias in Case Control Studies• Bias is a systematic error in the
study that distorts the results & limits the validity of the conclusions.– Selection Bias
– Confounding
– Observation Bias (recall bias, interviewer bias, misclassification)
Selection Bias• Systematic errors arising from the way
the subjects are selected– Study subjects are selected in a way that
can misleadingly increase or decrease the magnitude of an association
• Exposure of cases differs from exposure of all cases in source population or exposure of controls selected differs from non diseased in source population
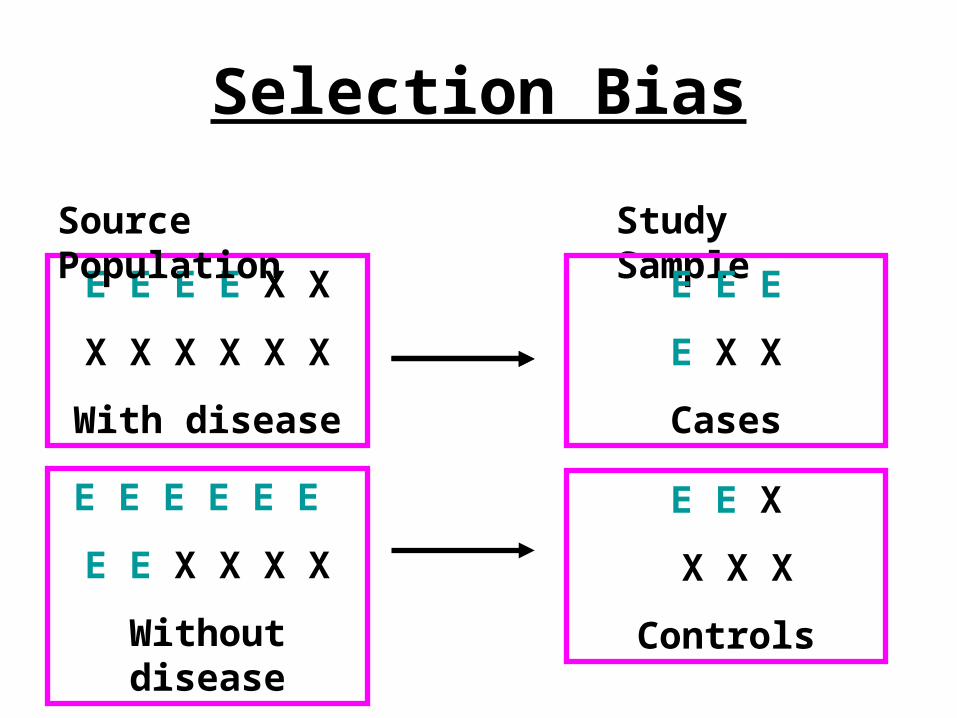
Selection Bias
E E E E X X
X X X X X X
With disease
Source Population Study Sample
E E E
E X X
Cases
E E E E E E
E E X X X X
Without disease
E E X
X X X
Controls
Confounding
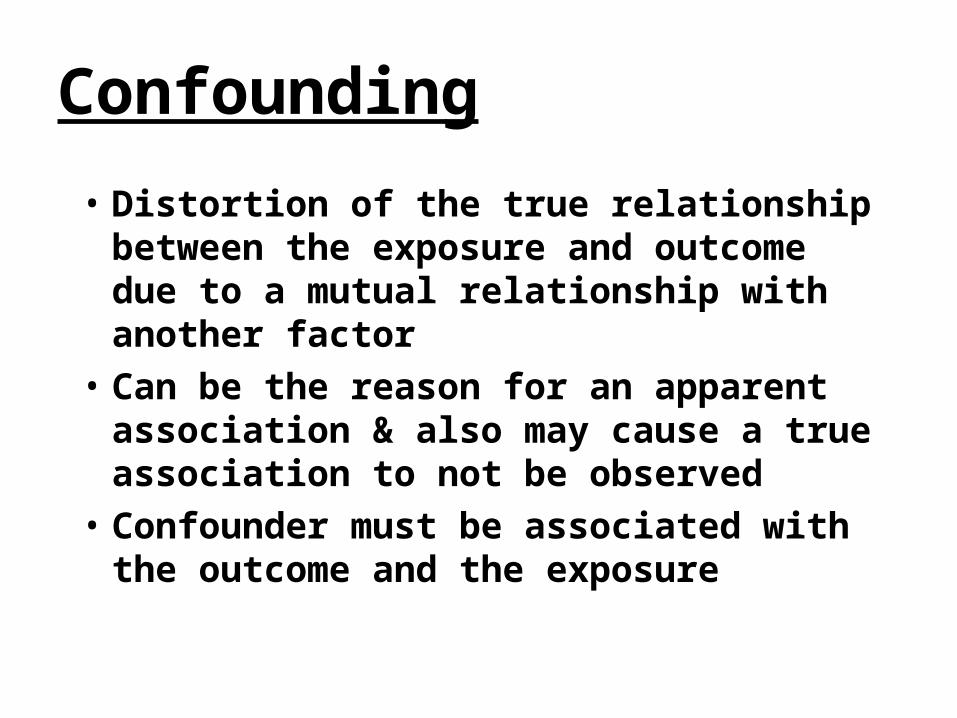
• Distortion of the true relationship between the exposure and outcome due to a mutual relationship with another factor
• Can be the reason for an apparent association & also may cause a true association to not be observed
• Confounder must be associated with the outcome and the exposure
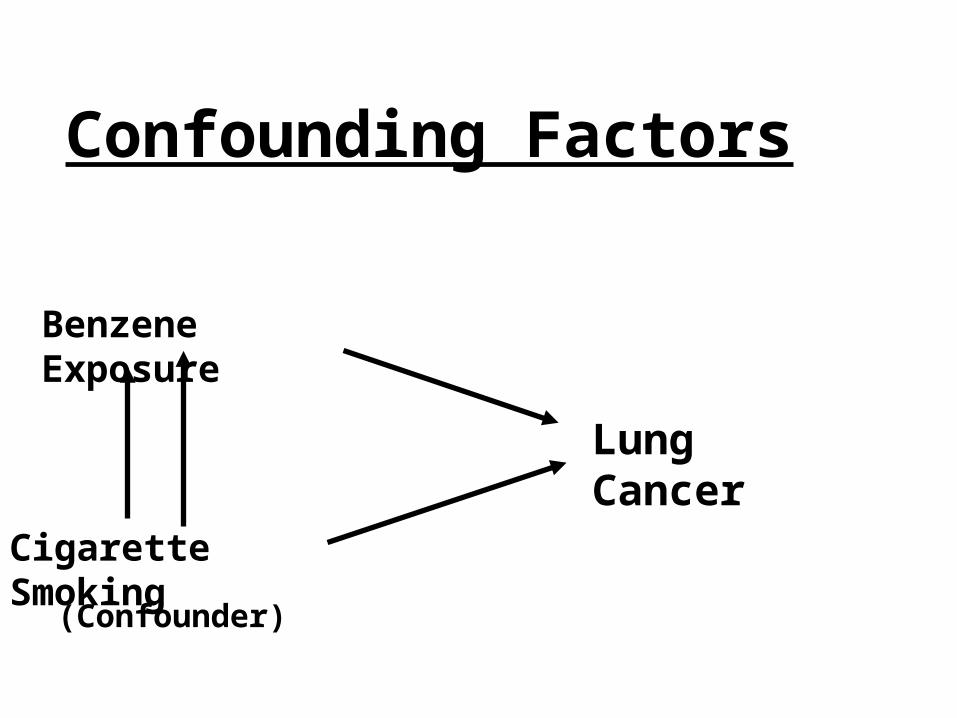
Confounding Factors
Lung Cancer
Benzene Exposure
Cigarette Smoking
(Confounder)
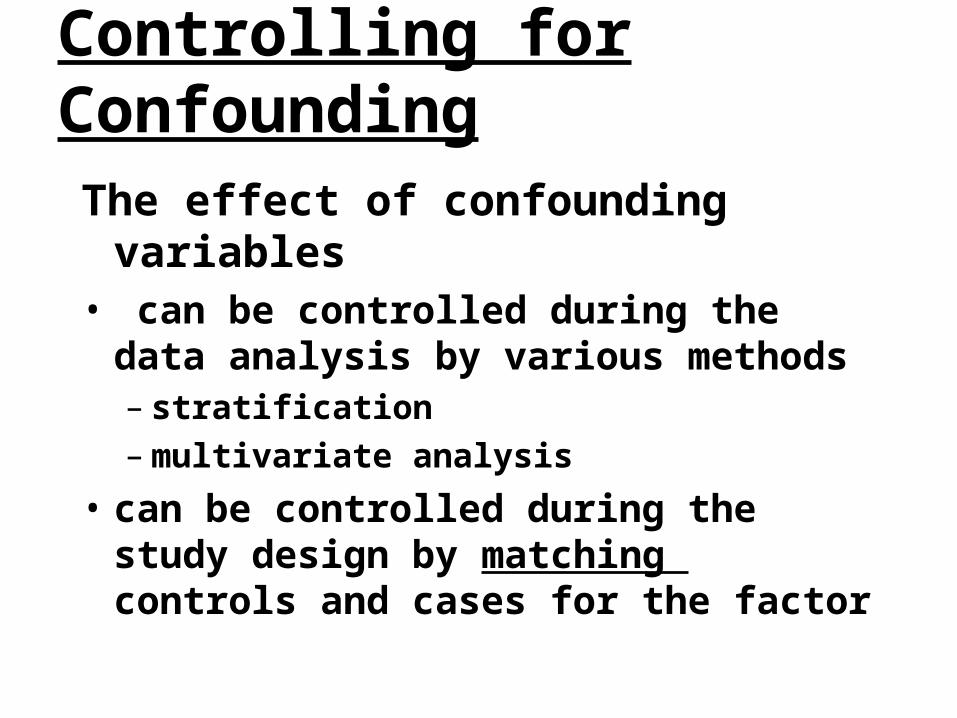
Controlling for ConfoundingThe effect of confounding
variables• can be controlled during the data
analysis by various methods– stratification– multivariate analysis
• can be controlled during the study design by matching controls and cases for the factor
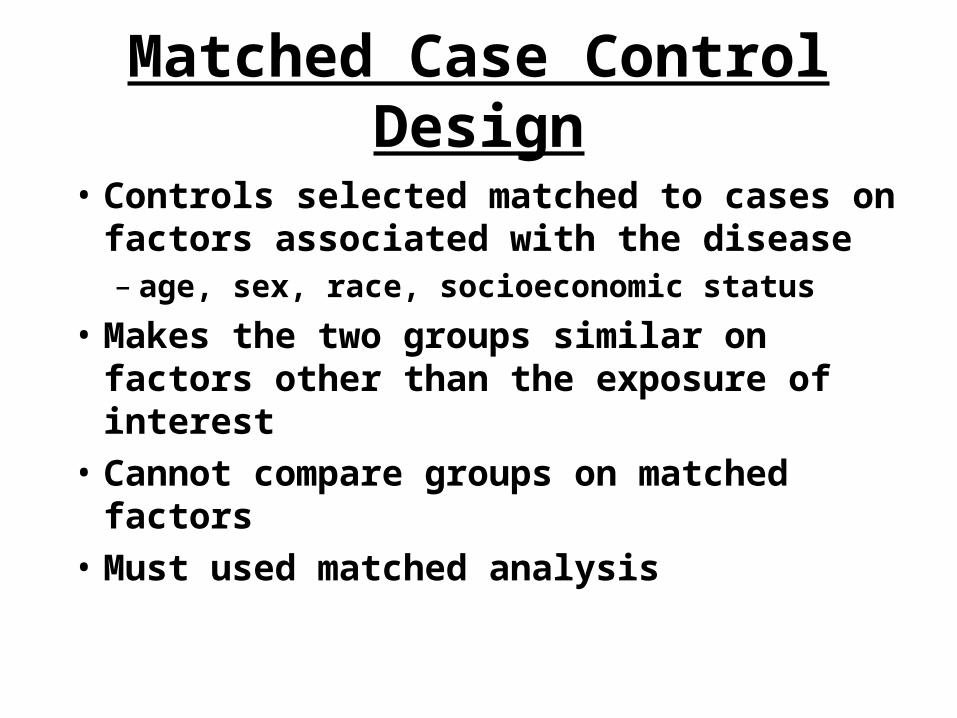
Matched Case Control Design
• Controls selected matched to cases on factors associated with the disease– age, sex, race, socioeconomic status
• Makes the two groups similar on factors other than the exposure of interest
• Cannot compare groups on matched factors
• Must used matched analysis

Observation Bias• Interviewer (data collection) bias
– keep data collection same for cases and controls
• Misclassification Bias– incorrect characterization of
exposure
• Recall Bias– recall of exposures may be
influenced by current disease status
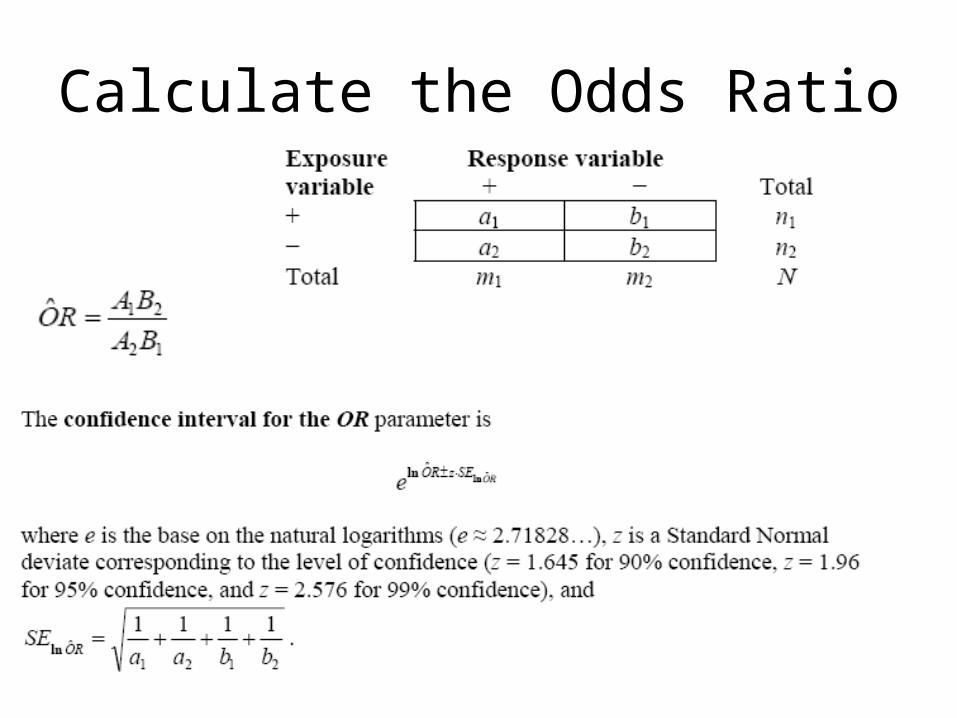
Calculate the Odds Ratio
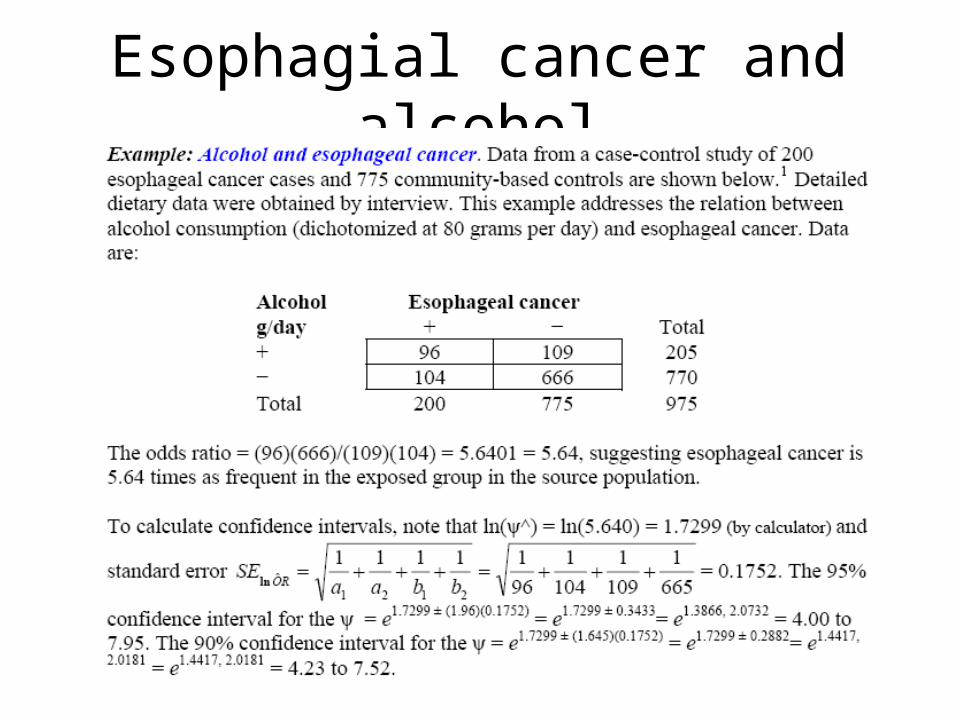
Esophagial cancer and alcohol
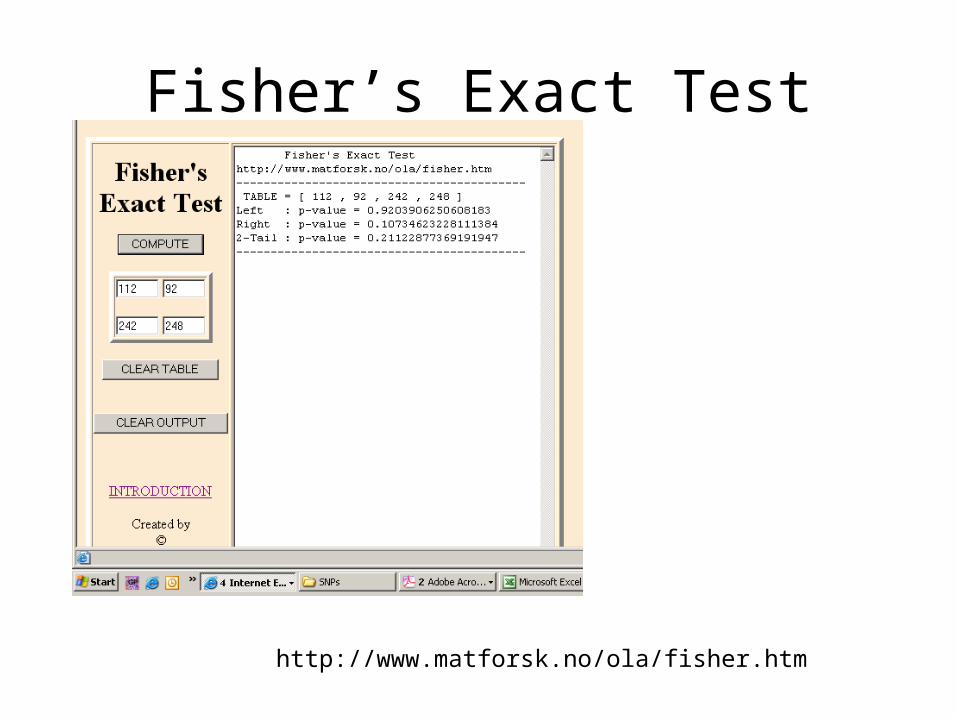
Fisher’s Exact Test
http://www.matforsk.no/ola/fisher.htm
© 2005 Prentice Hall Inc. / A Pearson Education Company / Upper Saddle River, New Jersey 07458
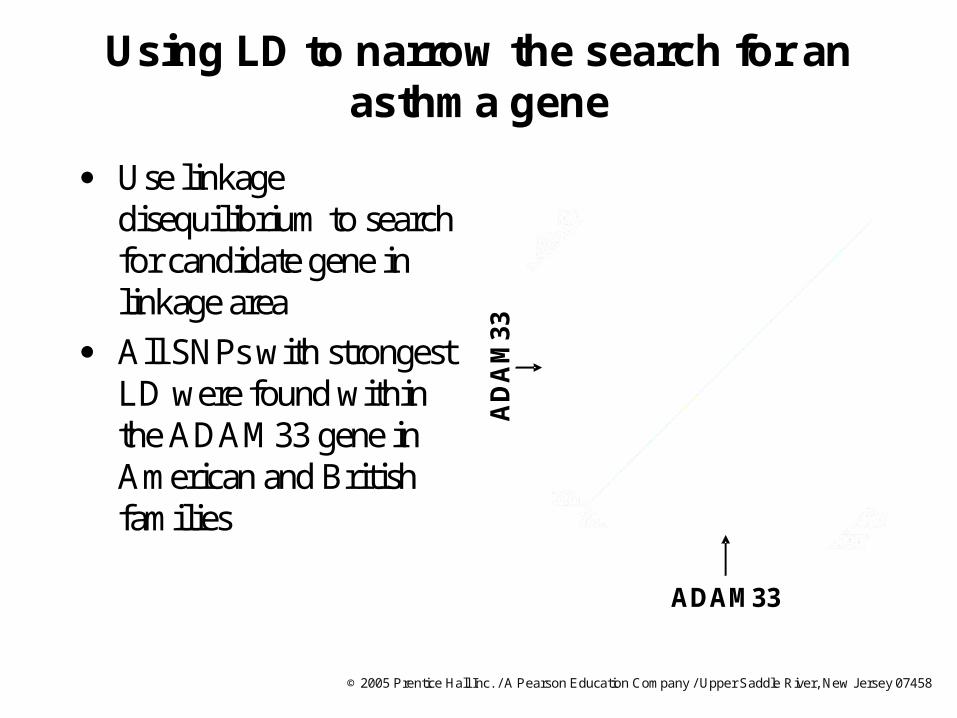
Using LD to narrow the search for an asthma gene
Use linkage disequilibrium to search for candidate gene in linkage area
All SNPs with strongest LD were found within the ADAM33 gene in American and British families
ADAM33
AD
AM
33
© 2005 Prentice Hall Inc. / A Pearson Education Company / Upper Saddle River, New Jersey 07458
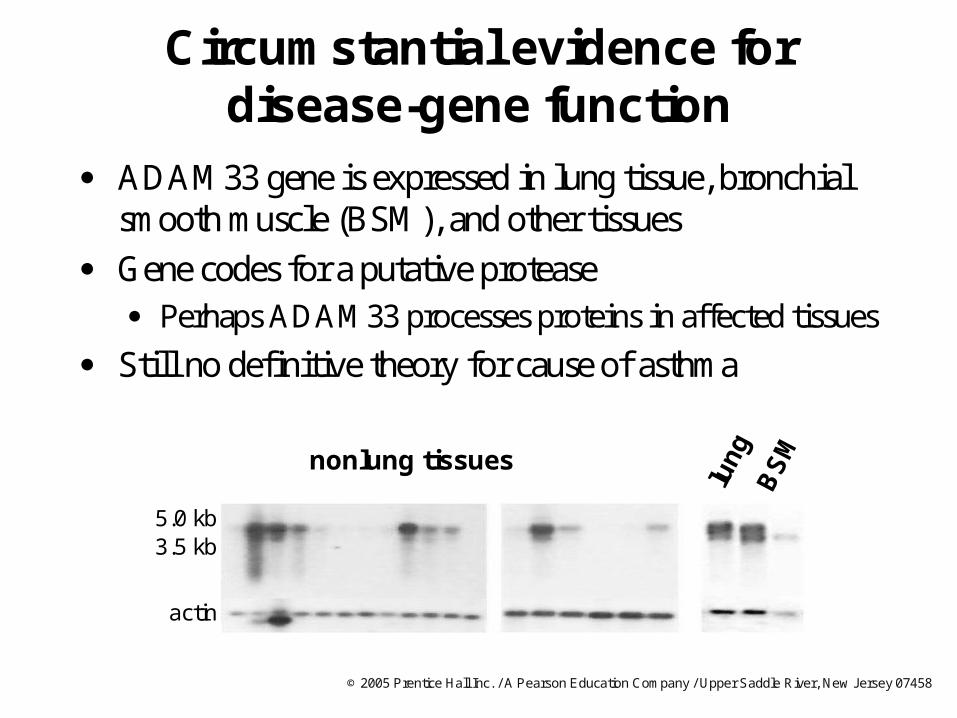
Circumstantial evidence for disease-gene function
ADAM33 gene is expressed in lung tissue, bronchial smooth muscle (BSM), and other tissues
Gene codes for a putative protease Perhaps ADAM33 processes proteins in affected tissues
Still no definitive theory for cause of asthma
nonlung tissues
lung
BS
M
3.5 kb5.0 kb
actin
© 2005 Prentice Hall Inc. / A Pearson Education Company / Upper Saddle River, New Jersey 07458
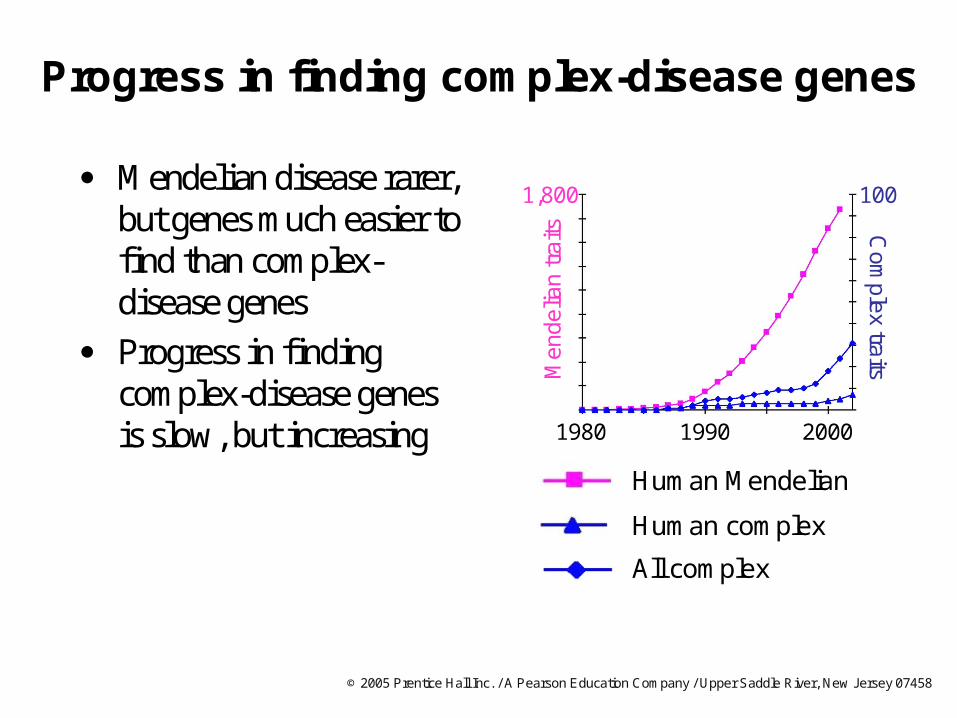
Progress in finding complex-disease genes
Mendelian disease rarer, but genes much easier to find than complex-disease genes
Progress in finding complex-disease genes is slow, but increasing
100
200019901980
1,800
Men
delia
n tr
aits C
omplex traits
Human Mendelian
All complex
Human complex

© 2005 Prentice Hall Inc. / A Pearson Education Company / Upper Saddle River, New Jersey 07458
Genomewide association studies
Based on concept of linkage disequilibrium
Basic concept Characterize SNPs in a variety of populations
Use SNP associations with disease
Presently prohibitively expensive
New technologies being developed DNA pooling
More efficient genotyping methods
© 2005 Prentice Hall Inc. / A Pearson Education Company / Upper Saddle River, New Jersey 07458
Numbers of cases and controls required for genomewide association studies
© 2005 Prentice Hall Inc. / A Pearson Education Company / Upper Saddle River, New Jersey 07458
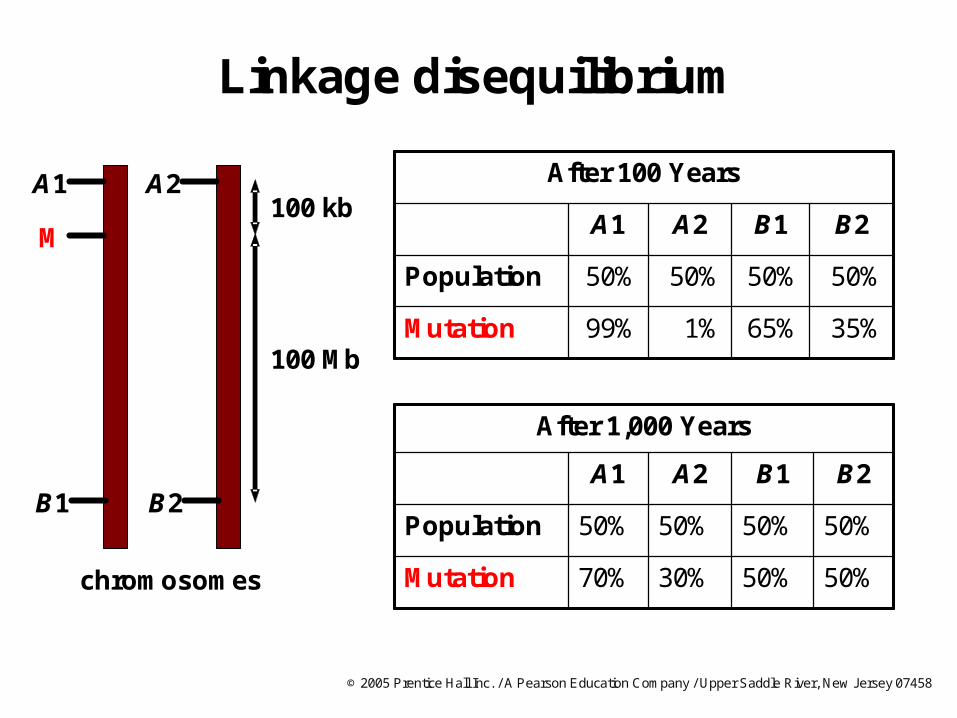
Linkage disequilibrium
chromosomes
After 100 Years
35%65%1%99%Mutation
50%50%50%50%Population
B2B1A2A1
50%50%30%70%Mutation
50%50%50%50%Population
B2B1A2A1
After 1,000 Years
A1
B1
M
100 Mb
100 kbA2
B2
© 2005 Prentice Hall Inc. / A Pearson Education Company / Upper Saddle River, New Jersey 07458
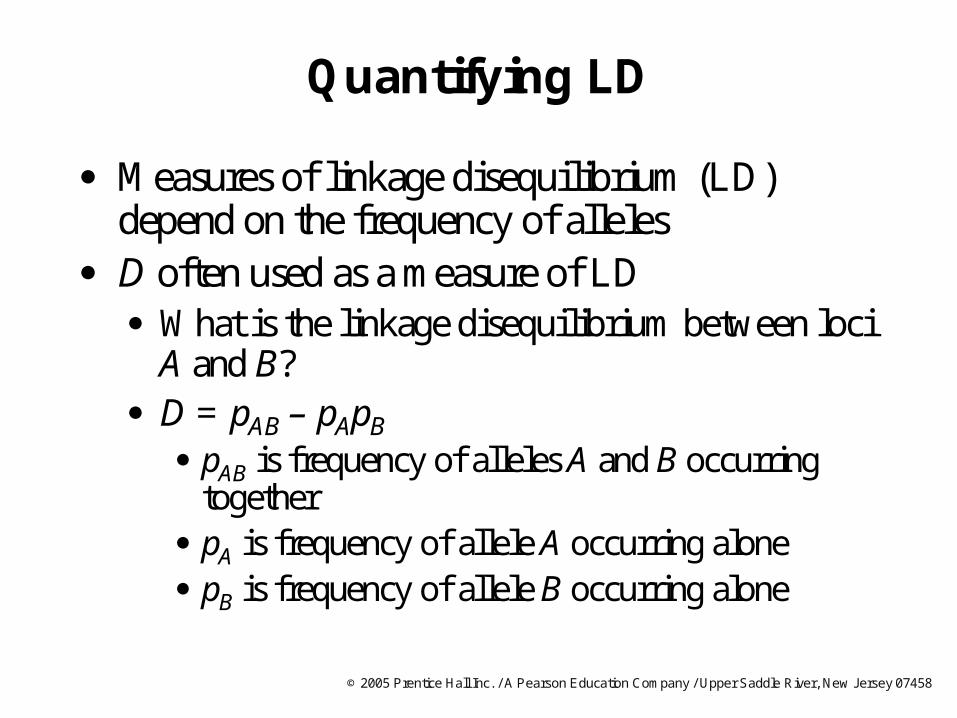
Quantifying LD
Measures of linkage disequilibrium (LD) depend on the frequency of alleles
D often used as a measure of LD What is the linkage disequilibrium between loci
A and B? D = pAB – pApB
pAB is frequency of alleles A and B occurring together
pA is frequency of allele A occurring alone pB is frequency of allele B occurring alone
© 2005 Prentice Hall Inc. / A Pearson Education Company / Upper Saddle River, New Jersey 07458
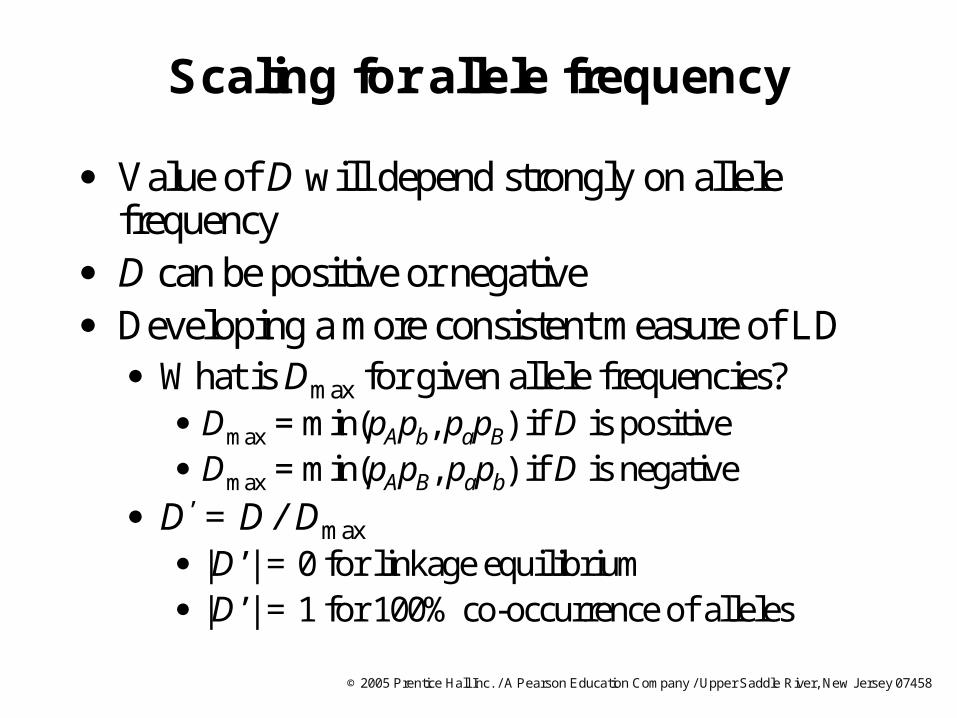
Scaling for allele frequency
Value of D will depend strongly on allele frequency
D can be positive or negative Developing a more consistent measure of LD
What is Dmax for given allele frequencies? Dmax = min(pApb, papB) if D is positive Dmax = min(pApB, papb) if D is negative
D’ = D / Dmax
|D’| = 0 for linkage equilibrium |D’| = 1 for 100% co-occurrence of alleles
© 2005 Prentice Hall Inc. / A Pearson Education Company / Upper Saddle River, New Jersey 07458
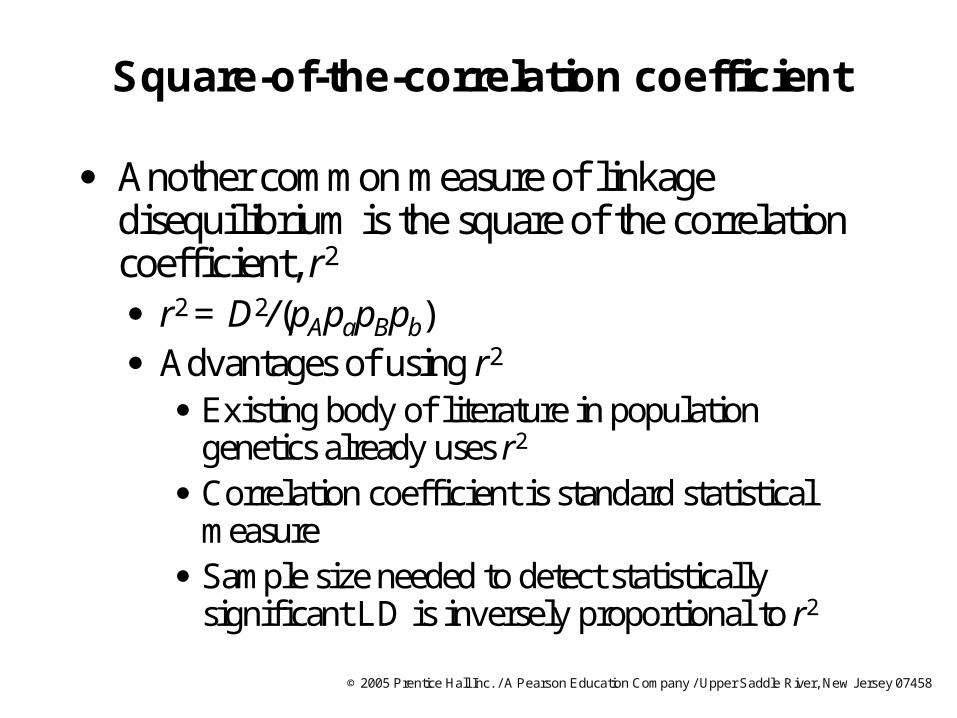
Square-of-the-correlation coefficient
Another common measure of linkage disequilibrium is the square of the correlation coefficient, r2
r2 = D2/(pApapBpb) Advantages of using r2
Existing body of literature in population genetics already uses r2
Correlation coefficient is standard statistical measure
Sample size needed to detect statistically significant LD is inversely proportional to r2
© 2005 Prentice Hall Inc. / A Pearson Education Company / Upper Saddle River, New Jersey 07458
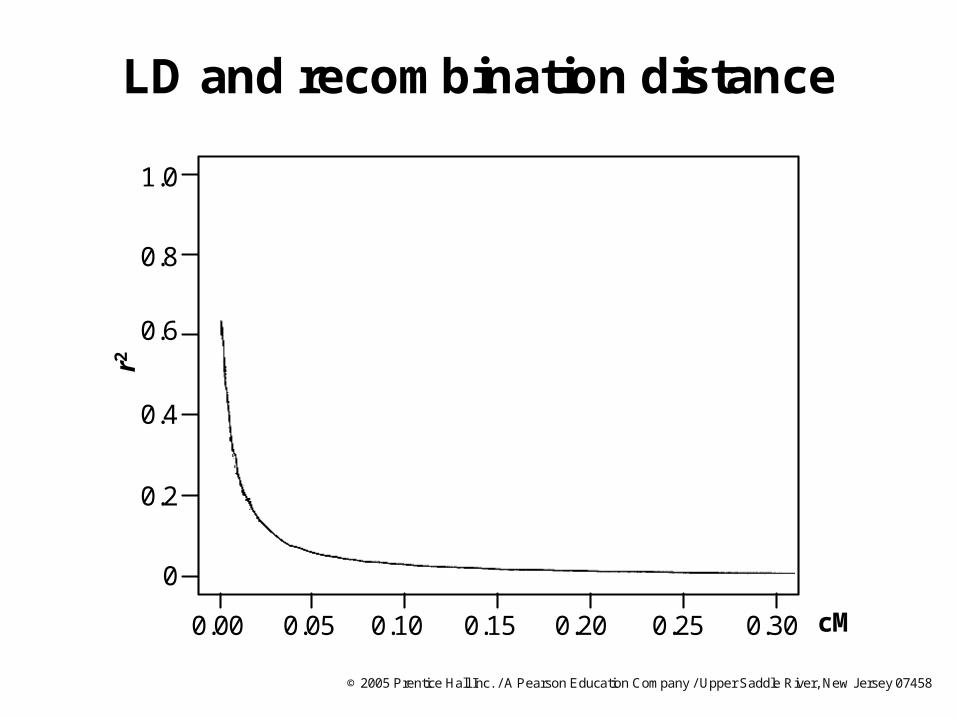
LD and recombination distance
1.0
0.8
0.2
0
0.6
0.4
r2
0.00 0.300.250.200.10 0.150.05 cM
© 2005 Prentice Hall Inc. / A Pearson Education Company / Upper Saddle River, New Jersey 07458
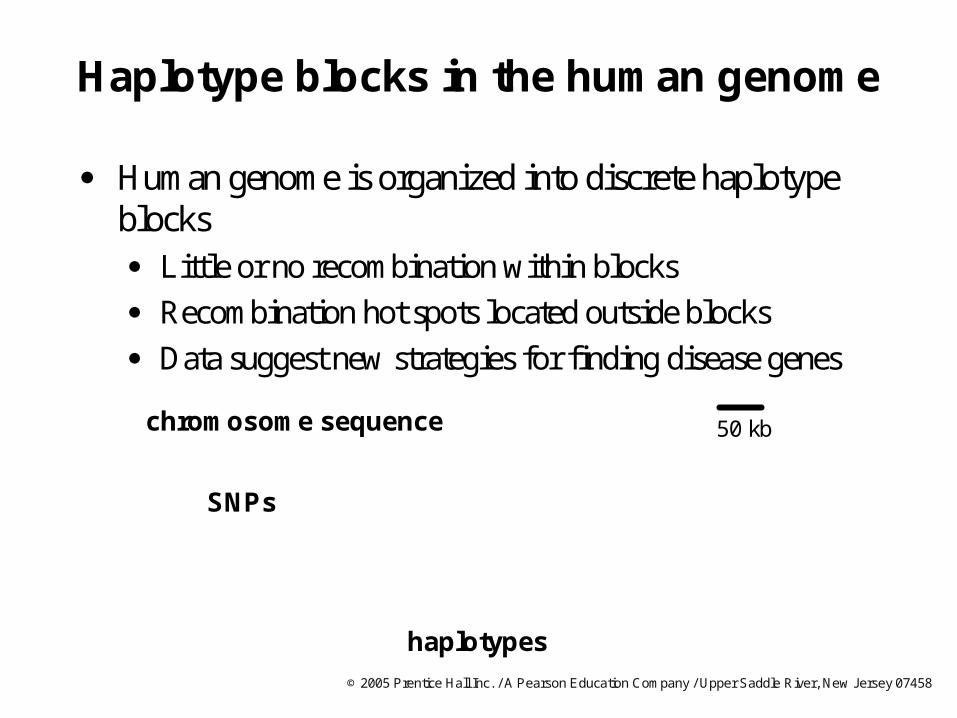
Haplotype blocks in the human genome
Human genome is organized into discrete haplotypeblocks Little or no recombination within blocks
Recombination hot spots located outside blocks
Data suggest new strategies for finding disease genes
SNPs
haplotypes
50 kbchromosome sequence
© 2005 Prentice Hall Inc. / A Pearson Education Company / Upper Saddle River, New Jersey 07458
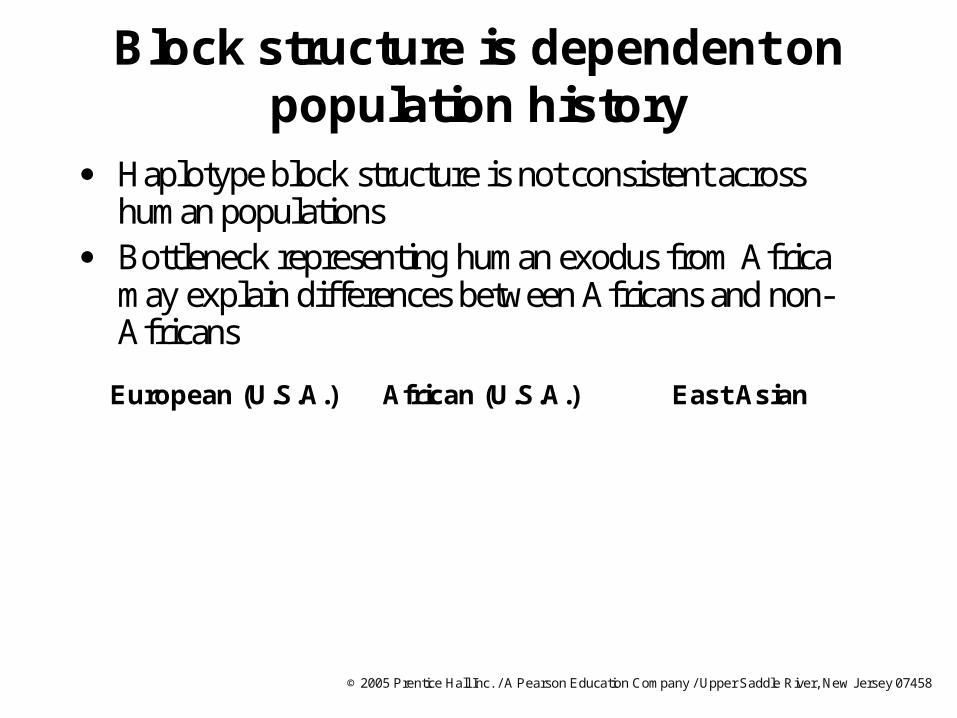
Block structure is dependent on population history
Haplotype block structure is not consistent across human populations
Bottleneck representing human exodus from Africa may explain differences between Africans and non-Africans
East AsianAfrican (U.S.A.)European (U.S.A.)
© 2005 Prentice Hall Inc. / A Pearson Education Company / Upper Saddle River, New Jersey 07458
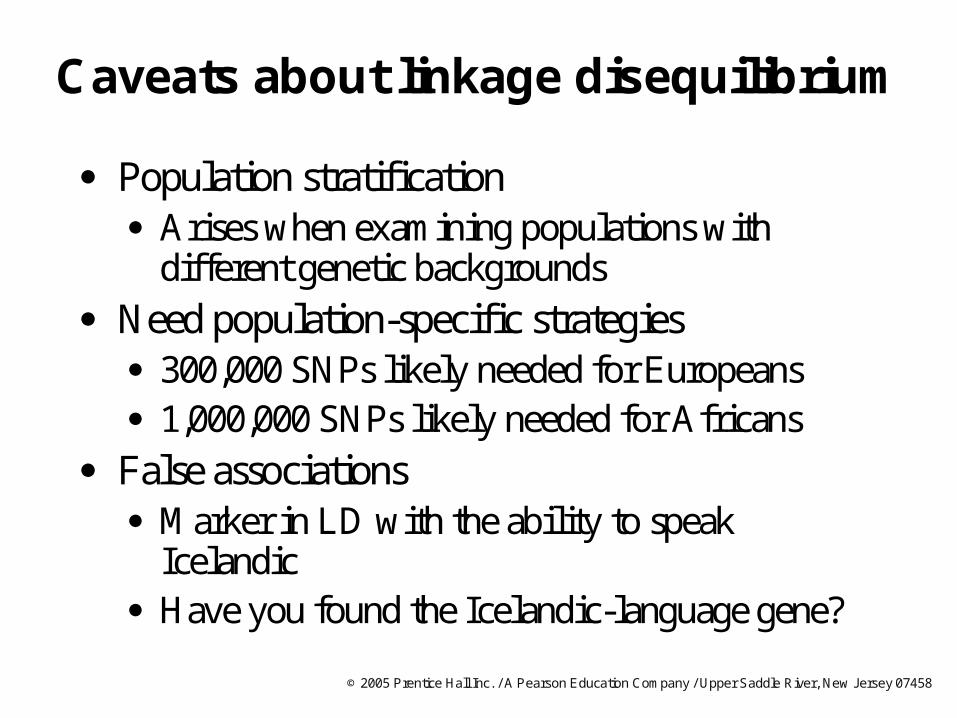
Caveats about linkage disequilibrium
Population stratification Arises when examining populations with
different genetic backgrounds
Need population-specific strategies 300,000 SNPs likely needed for Europeans 1,000,000 SNPs likely needed for Africans
False associations Marker in LD with the ability to speak
Icelandic Have you found the Icelandic-language gene?


![Comparing Substitutions - [email protected]](https://img.pdfslide.us/doc/110x75/6204ec514c89d3190e0c9265/comparing-substitutions-emailprotected.jpg)