Embed Size (px)
Citation preview
LUND UNIVERSITY
PO Box 117221 00 Lund+46 46-222 00 00
Molecular Etiology of Graves’ Disease and Associated Ophthalmopathy
Planck, Tereza
2010
Link to publication
Citation for published version (APA):Planck, T. (2010). Molecular Etiology of Graves’ Disease and Associated Ophthalmopathy. Department ofClinical Sciences, Lund University.
General rightsCopyright and moral rights for the publications made accessible in the public portal are retained by the authorsand/or other copyright owners and it is a condition of accessing publications that users recognise and abide by thelegal requirements associated with these rights.
• Users may download and print one copy of any publication from the public portal for the purpose of private studyor research. • You may not further distribute the material or use it for any profit-making activity or commercial gain • You may freely distribute the URL identifying the publication in the public portalTake down policyIf you believe that this document breaches copyright please contact us providing details, and we will removeaccess to the work immediately and investigate your claim.
Molecular Etiology of Graves’ Disease and Associated Ophthalmopathy
Academic Dissertation
Tereza Planck
Lund University Department of Clinical Sciences, Malmö, Diabetes and Endocrinology
Skåne University Hospital Malmö
With the permission of the Medical Faculty of Lund University, to be presented for public examination in the Grand Hall at the Medical Research Centre, Entrance 59, Malmö University Hospital, on December 3, 2010, at 1 p.m.
Faculty opponent Professor Laszlo Hegedüs
University of Southern Denmark Odense, Denmark
Molecular Etiology of Graves’ Disease and Associated Ophthalmopathy
Tereza Planck
Lund University Department of Clinical Sciences, Malmö, Diabetes and Endocrinology
Skåne University Hospital Malmö
The cover picture depicts a young woman with a unilateral exophthalmos and a large goitre, described in 1877. Reproduced from “A Case of Exophthalmic Goitre, With New Phenomena.” by I. Barney Yeo, BMJ, January 1, 1877, p.321, with permission from BMJ Publishing Group Ltd. © Tereza Planck 2010 Lund University, Department of Clinical Sciences, Malmö, Diabetes and Endocrinology, Skåne University Hospital Malmö, Sweden ISSN 1652-8220 ISBN 978-91-86671-24-2 Lund University, Faculty of Medicine Doctoral Dissertation Series 2010:108 Printed by Media-Tryck, Lund University, Lund, Sweden

“I am extraordinarily patient, provided I get my own way in the end.” Margaret Thatcher
To my grandmother.

7
TABLE OF CONTENTS
TABLE OF CONTENTS ___________________________________________ 7
LIST OF PUBLICATIONS _________________________________________ 9
ABBREVIATIONS _____________________________________________ 10
INTRODUCTION ______________________________________________ 13 Graves’ disease ____________________________________________________ 13
Historical notes _______________________________________________________ 13 Epidemiology_________________________________________________________ 13 Genetic analyses of complex diseases and genetics of GD ______________________ 15 Pathogenesis _________________________________________________________ 18 Clinical features_______________________________________________________ 18 Treatment____________________________________________________________ 19
Graves’ ophthalmopathy _____________________________________________ 20 Epidemiology_________________________________________________________ 20 Pathogenesis _________________________________________________________ 20 Clinical features_______________________________________________________ 23 Treatment____________________________________________________________ 25
Lymphedema ______________________________________________________ 27 Adipogenesis ______________________________________________________ 27 Thyrostimulin _____________________________________________________ 28
AIMS ______________________________________________________ 29
STUDY SUBJECTS _____________________________________________ 30 Swedish subjects ___________________________________________________ 30
GD2002 _____________________________________________________________ 30 Phenotypic characterization ______________________________________________ 30 Tissue biopsies________________________________________________________ 30
Polish subjects _____________________________________________________ 31
METHODS __________________________________________________ 32 DNA and RNA extraction ____________________________________________ 32 Reverse Transcription-Polymerase Chain Reaction (RT-PCR)________________ 32 Real-Time PCR ____________________________________________________ 32 Microarray analysis _________________________________________________ 34 Selection of SNPs __________________________________________________ 36 Genotyping _______________________________________________________ 36
8
Adipocyte cell culture _______________________________________________ 36 Statistical analysis __________________________________________________ 37
RESULTS ___________________________________________________ 39 Study I ___________________________________________________________ 39 Study II __________________________________________________________ 41 Study III__________________________________________________________ 42 Study IV__________________________________________________________ 44
Comparison of gene expression in chronic arm lymphedema and chronic GO _______ 44 Gene expression in intraorbital adipose tissue from GO patients in the active or chronic phase and healthy controls_______________________________________________ 45 Gene expression in adipose tissue from the lymphedematous and normal arms in patients with chronic arm lymphedema____________________________________________ 45
Study V __________________________________________________________ 46
DISCUSSION _________________________________________________ 49 Genes with possible roles in the etiology of GO and GD ____________________ 49 Methodology ______________________________________________________ 53 Future challenges___________________________________________________ 54
CONCLUSIONS _______________________________________________ 56
POPULÄRVETENSKAPLIG SAMMANFATTNING________________________ 57
ACKNOWLEDGEMENTS ________________________________________ 61
REFERENCES ________________________________________________ 63
9
LIST OF PUBLICATIONS
I. Lantz M, Vondrichova T, Parikh H, Frenander C, Ridderstråle M, Åsman P, Åberg M, Groop L, Hallengren B 2005 Overexpression of immediate early genes in active Graves’ ophthalmopathy. J Clin Endocrinol Metab 90:4784-4791 II. Lantz M*, Vondrichova T*, Capretz A, Nilsson E, Frenander C, Bondeson AG, Ridderstråle M, Åberg M, Åsman P, Groop L, Hallengren B 2007 Thyrostimulin (a TSH-like Hormone) expression in orbital and thyroid tissue. Thyroid 17:113-118 *these authors contributed equally to this work III. Vondrichova T, de Capretz A, Parikh H, Frenander C, Åsman P, Åberg M, Groop L, Hallengren B, Lantz M 2007 COX-2 and SCD, markers of inflammation and adipogenesis, are related to disease activity in Graves’ ophthalmopathy. Thyroid 17:511-517 IV. Planck T, Parikh H, Brorson H, Mårtensson T, Åsman P, Groop L, Hallengren B, Lantz M. Gene expression in Graves’ ophthalmopathy and arm lymphedema: similarities and differences. Submitted. V. Planck T, Sjögren M, Groop L, Hallengren B, Szymanski K, Bednarczuk T, Ploski R, Lantz M. Association of polymorphisms in CTLA4, BTG2, CYR61, ZFP36, and SCD genes with Graves’ disease and ophthalmopathy. Manuscript. Papers I-III are reproduced with permission from the publishers.
10
ABBREVIATIONS
15d-PGJ(2) 15-deoxy-(Delta12,14)-prostaglandin J(2)
ABCG1 ATP-binding cassette, sub-family G (WHITE), member 1
ACTA2 actin, alpha 2, smooth muscle aorta
ADRB2 beta-2-adrenergic receptor
AITD autoimmune thyroid disease
APOLD1 apolipoprotein L domain containing 1
bp base pairs
BTG2 B cell translocation gene 2
cAMP cyclic adenosine monophosphate
CAS clinical activity score
CD40 B cell surface antigen CD40
CD40L B cell surface antigen CD40 ligand
CI confidence interval
CNVs copy-number variants
COX1 cyclooxygenase 1
COX2 cyclooxygenase 2
CPMX1 carboxypeptidase X (M14 family), member 1
CSRNP1 cysteine-serine-rich nuclear protein 1
CTLA4 cytotoxic T lymphocyte-associated factor 4
CYR61 cysteine-rich, angiogenic inducer 61
ddNTPs dideoxynucleotide triphosphates
DNA deoxyribonucleic acid
DON dysthyroid optic neuropathy
DSP desmoplakin
DUSP1 dual specificity phosphatase 1
EGR1 early growth response 1
EUGOGO European Group on Graves’ Orbitopathy
FCRL3 Fc receptor-like 3 gene
FHL2 four and a half LIM domains 2
FOSB FBJ murine osteosarcoma viral oncogene homolog B
FOXP3 forkhead box P3
11
GAG glycosaminoglycans
GD Graves’ disease
GO Graves’ ophthalmopathy
GPA2 thyrostimulin alpha-subunit
GPB5 thyrostimulin beta-subunit
GWAS genome-wide association study
HLA human leukocyte antigen
ICAM-1 intercellular adhesion molecule-1
IEGs immediate early genes
IFNα interferon alpha
IGF-1R type 1 insulin-like growth factor receptor
IgG immunoglobulin G
IL-1β interleukin-1beta
kb kilo base pairs
LD linkage disequilibrium
MAF minor allele frequency MALDI- -TOF MS
matrix-assisted laser desorption/ionization- - time of flight mass spectrometry
MMP3 matrix metalloproteinase 3
NCBI National Center for Biotechnology Information
NSAIDs non-steroidal antiinflammatory drugs
OR odds ratio
PCR polymerase chain reaction
PPARγ peroxisome-proliferator activated receptor gamma
PTHLH parathyroid hormone-like hormone
PTPN22 protein tyrosine phosphatase 22
PTX3 pentraxin-related gene, rapidly induced by IL-1 beta
RNA ribonucleic acid
RSPO2 R-spondin 2 homolog
RT-PCR reverse transcription polymerase chain reaction
SCD stearoyl-coenzyme A desaturase
SCGB3A2 secretoglobulin family 3a member 2
SD standard deviation
SEM standard error of the mean
SFRP1 secreted frizzled-related protein 1
12
SFRP2 secreted frizzled-related protein 2
SNP single nucleotide polymorphisms
T3 trijodthyronine
T4 thyroxine
Tg thyroglobulin
TNC tenascin
TNFα tumour necrosis factor alpha
TRAb antibodies against the thyroid-stimulating hormone receptor
TSH thyroid-stimulating hormone
TSHR thyroid-stimulating hormone receptor
TTP tristetraprolin
UTR untranslated region
VEGF vascular endothelial growth factor
XCI X chromosome inactivation
ZFP36 zinc finger protein 36
β-actin beta-actin
13
INTRODUCTION
Graves’ disease
Historical notes
The first descriptions of clear associations between goitre and exophthalmos come already from the Persian physician Ibn Sina (Avicenna), who around 1000 in his most renowned work, Al-Qanoon, gave a detailed description of exophthalmos and goitre with symptoms today recognized as hyperthyroidism. The Persian physician Sayyid Ismail al-Jurjani noted the association of goitre and exophthalmos around 1100 in his Thesaurus of the Shah of Khwarazm, the major medical dictionary of its time [1, 2]. Centuries would pass before this combination of symptoms again attracted attention. Caleb Hillier Parry, a provincial Welsh physician, noted the condition in 1786. Graves' disease (GD) is named after the Irish doctor Robert James Graves, who described a case of goitre, palpitations, and exophthalmos in 1835. The German Karl Adolph von Basedow independently reported the same constellation of symptoms in 1840 and 1848 [2]. Many other early researchers contributed to our understanding of ‘Graves’ disease’, and it is, therefore, not entirely fair to call it as such.
Epidemiology
GD is the underlying cause of 50–80% of cases of hyperthyroidism [3], with an annual incidence in Sweden of 25–30/100,000 [4, 5]. It can occur at any age, but its peak incidence is between 40 and 60 years [3, 5]. GD is a complex disease that develops as a result of the interplay between genetic, endogenous and environmental factors. The disease is 5–10 times more common in women than men [3], and the female preponderance may in part be explained by hormonal effects on the autoimmune response. As with other autoimmune diseases, GD often decreases in severity during pregnancy, whereas the onset or worsening of GD is commonly seen post-partum [3]. The use of contraceptives has a protective effect against the development of GD [6, 7]. In Malmö, southern Sweden, the peak GD incidence for women is between 50 and 60 years, indicating that the post-menopausal period may increase the risk of developing the disease [5]. Fetal microchimerism, the transfer of fetal cells into the maternal circulation, and subsequent triggering of autoimmunity towards the organ in which they settle, has also been implicated in GD and other autoimmune disorders [8]. Recently, skewed X chromosome inactivation (XCI) has been suggested to partly explain the female preponderance in GD. In female mammalian cells, one of the two X chromosomes is randomly inactivated in early embryonic life and females are thus mosaics of
14
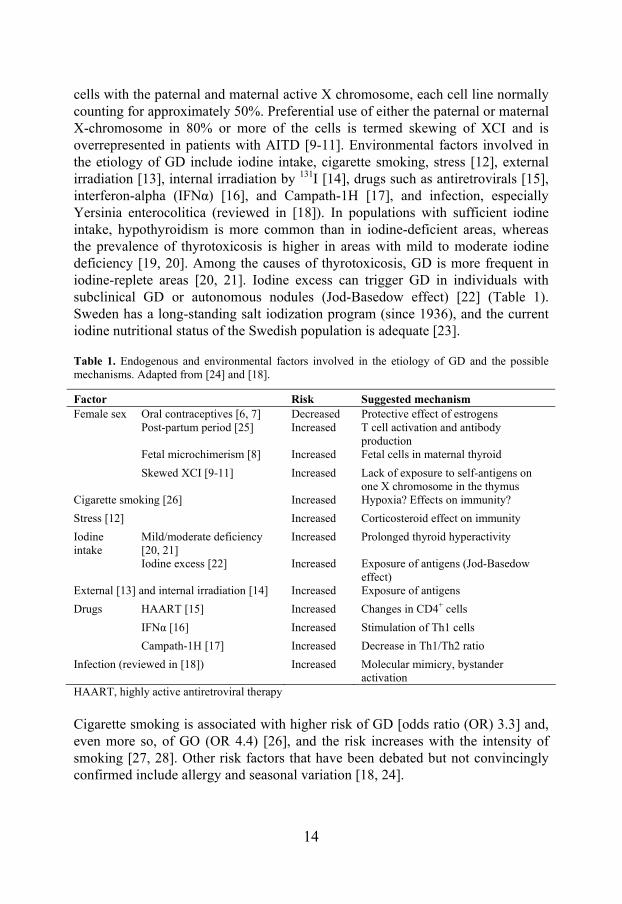
cells with the paternal and maternal active X chromosome, each cell line normally counting for approximately 50%. Preferential use of either the paternal or maternal X-chromosome in 80% or more of the cells is termed skewing of XCI and is overrepresented in patients with AITD [9-11]. Environmental factors involved in the etiology of GD include iodine intake, cigarette smoking, stress [12], external irradiation [13], internal irradiation by 131I [14], drugs such as antiretrovirals [15], interferon-alpha (IFNα) [16], and Campath-1H [17], and infection, especially Yersinia enterocolitica (reviewed in [18]). In populations with sufficient iodine intake, hypothyroidism is more common than in iodine-deficient areas, whereas the prevalence of thyrotoxicosis is higher in areas with mild to moderate iodine deficiency [19, 20]. Among the causes of thyrotoxicosis, GD is more frequent in iodine-replete areas [20, 21]. Iodine excess can trigger GD in individuals with subclinical GD or autonomous nodules (Jod-Basedow effect) [22] (Table 1). Sweden has a long-standing salt iodization program (since 1936), and the current iodine nutritional status of the Swedish population is adequate [23].
Table 1. Endogenous and environmental factors involved in the etiology of GD and the possible mechanisms. Adapted from [24] and [18].
Factor Risk Suggested mechanism Oral contraceptives [6, 7] Decreased Protective effect of estrogens Post-partum period [25]
Increased T cell activation and antibody production
Fetal microchimerism [8] Increased Fetal cells in maternal thyroid
Female sex
Skewed XCI [9-11]
Increased Lack of exposure to self-antigens on one X chromosome in the thymus
Cigarette smoking [26] Increased Hypoxia? Effects on immunity?
Stress [12] Increased Corticosteroid effect on immunity
Iodine intake
Mild/moderate deficiency [20, 21]
Increased Prolonged thyroid hyperactivity
Iodine excess [22] Increased Exposure of antigens (Jod-Basedow effect)
External [13] and internal irradiation [14] Increased Exposure of antigens
Drugs HAART [15] Increased Changes in CD4+ cells
IFNα [16] Increased Stimulation of Th1 cells
Campath-1H [17] Increased Decrease in Th1/Th2 ratio
Infection (reviewed in [18]) Increased Molecular mimicry, bystander activation
HAART, highly active antiretroviral therapy
Cigarette smoking is associated with higher risk of GD [odds ratio (OR) 3.3] and, even more so, of GO (OR 4.4) [26], and the risk increases with the intensity of smoking [27, 28]. Other risk factors that have been debated but not convincingly confirmed include allergy and seasonal variation [18, 24].
15
Genetic analyses of complex diseases and genetics of GD
Markers
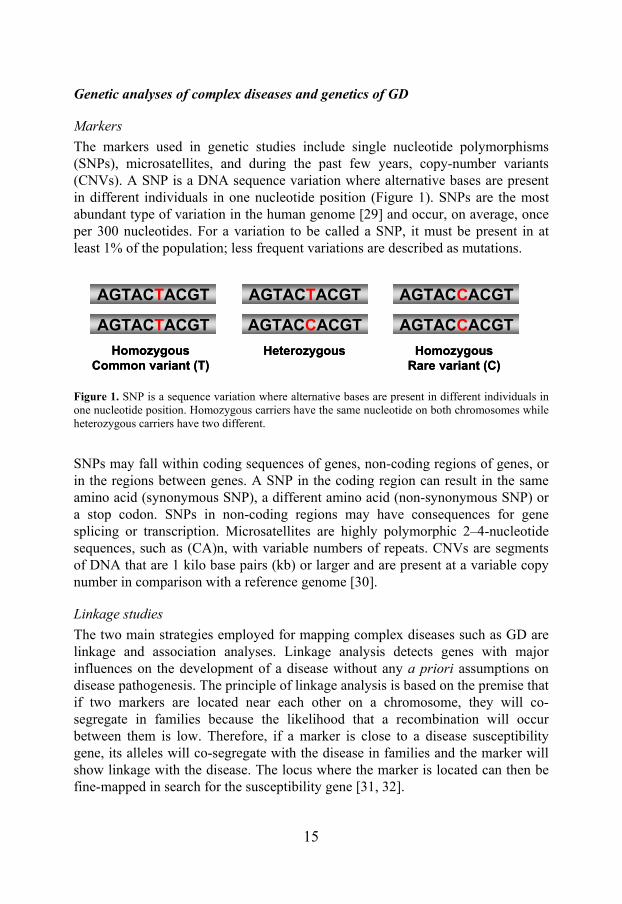
The markers used in genetic studies include single nucleotide polymorphisms (SNPs), microsatellites, and during the past few years, copy-number variants (CNVs). A SNP is a DNA sequence variation where alternative bases are present in different individuals in one nucleotide position (Figure 1). SNPs are the most abundant type of variation in the human genome [29] and occur, on average, once per 300 nucleotides. For a variation to be called a SNP, it must be present in at least 1% of the population; less frequent variations are described as mutations.
Figure 1. SNP is a sequence variation where alternative bases are present in different individuals in one nucleotide position. Homozygous carriers have the same nucleotide on both chromosomes while heterozygous carriers have two different.
SNPs may fall within coding sequences of genes, non-coding regions of genes, or in the regions between genes. A SNP in the coding region can result in the same amino acid (synonymous SNP), a different amino acid (non-synonymous SNP) or a stop codon. SNPs in non-coding regions may have consequences for gene splicing or transcription. Microsatellites are highly polymorphic 2–4-nucleotide sequences, such as (CA)n, with variable numbers of repeats. CNVs are segments of DNA that are 1 kilo base pairs (kb) or larger and are present at a variable copy number in comparison with a reference genome [30].
Linkage studies
The two main strategies employed for mapping complex diseases such as GD are linkage and association analyses. Linkage analysis detects genes with major influences on the development of a disease without any a priori assumptions on disease pathogenesis. The principle of linkage analysis is based on the premise that if two markers are located near each other on a chromosome, they will co-segregate in families because the likelihood that a recombination will occur between them is low. Therefore, if a marker is close to a disease susceptibility gene, its alleles will co-segregate with the disease in families and the marker will show linkage with the disease. The locus where the marker is located can then be fine-mapped in search for the susceptibility gene [31, 32].
AGTACTACGT
AGTACTACGT
AGTACTACGT
AGTACCACGT
AGTACCACGT
AGTACCACGT
HomozygousCommon variant (T)
Heterozygous HomozygousRare variant (C)
AGTACTACGT
AGTACTACGT
AGTACTACGT
AGTACTACGT
AGTACTACGT
AGTACCACGT
AGTACTACGT
AGTACCACGT
AGTACCACGT
AGTACCACGT
AGTACCACGT
AGTACCACGT
HomozygousCommon variant (T)
Heterozygous HomozygousRare variant (C)
16
Association studies
Association analysis is more sensitive than linkage and may detect genes contributing <5% of the total genetic contribution to a disease. However, association studies often face the problem of inability to replicate the reported positive results [33]. Association analyses are performed by comparing the frequency of an allele between patients and controls. If the allele tested is associated with the disease, then it will appear significantly more frequently in patients than in controls. The possible explanations for the existence of an association between an allele and a disease are as follows: (1) the associated allele itself is the causative genetic variant; (2) the associated allele is in linkage disequilibrium with the causative variant; and (3) the frequency in patients differs from controls not because of the investigated trait but because they belong to different populations [31].
Candidate genes
In searches for complex disease susceptibility genes, either the candidate gene approach or genome-wide screening can be applied using linkage or association. A candidate gene is a gene that, based on a priori knowledge of its biological function, is believed to play a role in the genetic susceptibility to a complex disease.
Genome-wide screening
Genome-wide screening is a powerful tool, as it enables scanning of the whole genome for a susceptibility gene without any prior assumptions of disease pathogenesis. It is performed by testing a panel of markers spanning the entire genome for linkage or association (genome-wide association study [GWAS]) with the disease [32]. Genetic markers located close to each other are inherited together more frequently than would occur by chance. This phenomenon is referred to as linkage disequilibrium (LD) and the HapMap Project has demonstrated that the human genome is organized in blocks of high LD, interspersed with spots where recombination occurs [29]. This inheritance pattern of SNPs can be used to create haplotypes, a combination of alleles on the same chromosome that are transmitted together. Tag SNPs are SNPs that are needed to describe a particular haplotype [34]. There are around 10 million SNPs, however, with the haplotype approach, variation in the entire genome can be captured by genotyping approximately 500,000 SNPs [35].
Genetics of GD
The strongest evidence for a genetic contribution to the etiology of GD comes from twin studies where the concordance in monozygotic twins was 35%, compared to 3–7% in dizygotic twins, and 79% of the susceptibility to develop
17
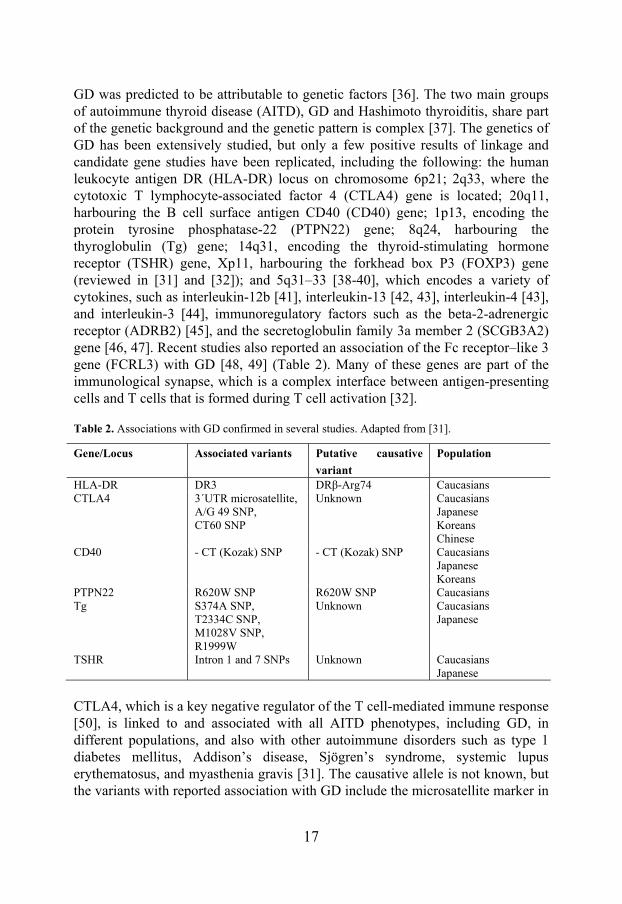
GD was predicted to be attributable to genetic factors [36]. The two main groups of autoimmune thyroid disease (AITD), GD and Hashimoto thyroiditis, share part of the genetic background and the genetic pattern is complex [37]. The genetics of GD has been extensively studied, but only a few positive results of linkage and candidate gene studies have been replicated, including the following: the human leukocyte antigen DR (HLA-DR) locus on chromosome 6p21; 2q33, where the cytotoxic T lymphocyte-associated factor 4 (CTLA4) gene is located; 20q11, harbouring the B cell surface antigen CD40 (CD40) gene; 1p13, encoding the protein tyrosine phosphatase-22 (PTPN22) gene; 8q24, harbouring the thyroglobulin (Tg) gene; 14q31, encoding the thyroid-stimulating hormone receptor (TSHR) gene, Xp11, harbouring the forkhead box P3 (FOXP3) gene (reviewed in [31] and [32]); and 5q31–33 [38-40], which encodes a variety of cytokines, such as interleukin-12b [41], interleukin-13 [42, 43], interleukin-4 [43], and interleukin-3 [44], immunoregulatory factors such as the beta-2-adrenergic receptor (ADRB2) [45], and the secretoglobulin family 3a member 2 (SCGB3A2) gene [46, 47]. Recent studies also reported an association of the Fc receptor–like 3 gene (FCRL3) with GD [48, 49] (Table 2). Many of these genes are part of the immunological synapse, which is a complex interface between antigen-presenting cells and T cells that is formed during T cell activation [32].
Table 2. Associations with GD confirmed in several studies. Adapted from [31].
Gene/Locus Associated variants Putative causative
variant
Population
HLA-DR DR3 DRβ-Arg74 Caucasians CTLA4 3´UTR microsatellite,
A/G 49 SNP, CT60 SNP
Unknown Caucasians Japanese Koreans Chinese
CD40 - CT (Kozak) SNP - CT (Kozak) SNP Caucasians Japanese Koreans
PTPN22 R620W SNP R620W SNP Caucasians Tg S374A SNP,
T2334C SNP, M1028V SNP, R1999W
Unknown Caucasians Japanese
TSHR Intron 1 and 7 SNPs Unknown Caucasians Japanese
CTLA4, which is a key negative regulator of the T cell-mediated immune response [50], is linked to and associated with all AITD phenotypes, including GD, in different populations, and also with other autoimmune disorders such as type 1 diabetes mellitus, Addison’s disease, Sjögren’s syndrome, systemic lupus erythematosus, and myasthenia gravis [31]. The causative allele is not known, but the variants with reported association with GD include the microsatellite marker in
18
the 3’ untranslated region (UTR) [51, 52]; the A/G49 (alanine/threonine) non-synonymous SNP at position 49 in exon 1 (rs231775), associated with GD in Caucasians [53-57], Japanese [58], and Koreans [59]; and the 3´ UTR CT60 SNP (rs3087243) [60]. Analysis of the -318 promoter SNP (rs5741909) showed inconsistent findings across studies [61, 62].
Pathogenesis
The hyperthyroidism of GD results from circulating immunoglobulin G (IgG) antibodies against TSHR (TRAb) produced outside and within the thyroid that bind to and activate the receptor, which leads to an increase in intracellular cyclic adenosine monophosphate (cAMP). However, not all TRAb present in GD are thyroid stimulators. According to their ability to induce the generation of intracellular cAMP, TRAb have been classified as stimulating (increasing cAMP concentrations), blocking (reducing cAMP concentrations), and neutral (with no effect on TSH binding and no effect on cAMP levels) [63]. Activation of TSHR stimulates hypertrophy and hyperplasia of the thyroid follicles, causing thyroid enlargement, visible as goitre, and increased thyroid hormone production and trijodthyronine (T3)/thyroxine (T4) ratio [3]. The blood flow to the thyroid is increased due to increased vascularisation, and vascular endothelial growth factor (VEGF) has been ascribed a central role in the thyroid angiogenesis [64]. A hallmark of the thyroid morphology in GD is the infiltration by lymphocytes, dendritic cells, and monocytes/macrophages. Intrathyroidal lymphocytes are a major source of autoantibodies and cytokines. The initiation of GD is likely to involve B cells and dendritic cells. Later, thyroid cells, in response to cytokines produced by infiltrating T cells, express adhesion and co-stimulatory molecules, as well as HLA class II molecules, and synthesize cytokines, which sustains the local autoimmune process [3].
Clinical features
The symptoms of hyperthyroidism in GD include fatigue, weight loss, palpitations, heat intolerance, tremor, sleep disturbances, increased frequency of defecation, proximal muscle weakness, mood changes, and difficulty to concentrate. Women with GD often have irregular menses, whereas men may suffer from gynecomastia, reduced libido, and erectile dysfunction. Signs include tachycardia or atrial fibrillation, resting tremor, warm, moist and smooth skin, and hyperreflexia [3, 65]. The clinical manifestations attributable to GD are diffuse goitre, GO, pretibial myxedema, and thyroid acropachy [3, 65]. The ocular engagement, GO, occurs in 25–50% GD cases [66], whereas the other extrathyroidal manifestations, pretibial myxedema (discoloured induration of the skin or non-pitting edema on the anterior aspect of the lower extremities) and thyroid acropachy (clubbing of the fingers and toes) are rare findings (<1%) [65].
19
GD, regardless of treatment, can severely impact the quality of life [67], in some cases even long time after euthyroidism has been achieved [68]. The diagnosis of GD is based on clinical symptoms and signs and laboratory findings, including suppressed serum TSH, elevated serum free T4 and/or free T3, and the presence of TRAb, which are diagnostic for GD [3, 65].The sensitivity and specificity of the TRAb assays have increased over the past 20 years [69-73], which improved the diagnosis of GD and probably contributed to the increasing reported incidence of GD [5]. Thyroid peroxidase antibodies are present in about 75% of patients with GD. The presence of GO or pretibial myxedema is sufficient to confirm the diagnosis of GD in a patient with hyperthyroidism and diffuse goitre. When in doubt, a thyroid radionuclide scan can be performed, which, in case of GD, demonstrates diffusely enhanced uptake in an enlarged thyroid [3].
Treatment
Current treatment options for GD include antithyroid drugs (thyrostatics), radioiodine, and surgery. All these treatment modalities have both advantages and disadvantages but are initially similarly effective. The relapse rate is highest after discontinuation of thyrostatics; however, approximately 50% of the patients may be spared lifelong L-thyroxin substitution [74]. Antithyroid drugs, methimazole and propylthiouracil, are used as initial treatment in the majority of patients in Europe and Asia, whereas in the USA, radioiodine is favoured [65]. The primary effect of the antithyroid drugs is interference with thyroid hormone synthesis but these medications are also believed to have immunosuppressive effects [75]. Antithyroid drugs have few serious side effects, except for agranulocytosis (1/1000); however, this rare side effect is reversible upon discontinuation of medication. Teratogenic effects of methimazole have been reported, and the drug is currently not recommended during the first trimester of pregnancy [76, 77]. The main concern with propylthiouracil is liver toxicity, especially in children [78]. Radioiodine treatment has better relapse rates but is contraindicated in pregnancy and during breast-feeding and most often results in hypothyroidism with the need of lifelong thyroid hormone substitution [65]. Radioiodine treatment also leads to increased TRAb levels, which can persist for years and in pregnant women cause fetal or neonatal hyperthyroidism [79]. A major concern is the risk of worsening or new development of GO after radioiodine treatment, especially in smokers, patients with severe hyperthyroidism, and those with high levels of TRAb [80-82], which can, however, be decreased by administration of corticosteroids and cessation of smoking [81, 83]. Surgical total or near-total thyroidectomy does not seem to have any effect on GO but carries operation risks and leads to permanent hypothyroidism. Therefore, this treatment is reserved for selected clinical situations [3, 65, 84].
20
Graves’ ophthalmopathy
Epidemiology
Graves’ ophthalmopathy, also called thyroid-associated ophthalmopathy, occurs most often in association with GD but can even develop in patients with other thyroid abnormalities [85, 86]. In 85% of cases, ocular symptoms and hyperthyroidism develop simultaneously or within 18 months of each other, although GO can both precede and follow the onset of GD [85, 87]. Of patients with GD, 25–50% develop clinically apparent GO [66]; however, subclinical abnormalities can be demonstrated by computed tomography or magnetic resonance imaging in the majority of patients [88, 89]. Severe forms of GO affect 3–5% of patients with GD [28]. GO, like GD, is more common in women than men, with estimated incidences of 16 women and 3 men per 100,000 in the USA [90]. Men and older patients tend to suffer from more severe disease [28]. Europeans have a higher risk for GO than Asians [91]. Genetic studies in GO have thus far given conflicting results. The most promising candidate, CTLA4, was associated with GO in some studies [59, 92], whereas other found no evidence for specific risk of GO beyond that conferred for GD [56, 93, 94]. Cigarette smoking is the strongest modifiable risk factor for GO, and the risk is proportional to the number of cigarettes smoked daily [95, 96]. Smokers also have higher risk of suffering from more severe forms and exhibit poorer outcomes of medical treatment [28]. The mechanism by which smoking promotes GO is not clear. Possible mechanisms include the effects of altered cytokine levels, hypoxia, superoxide radicals, and increased expression of HLA class II molecules [6]. Cigarette smoke extract in vitro increases glycosaminoglycan production by orbital fibroblasts, as well as adipogenesis in synergy with interleukin-1 [97]. Radioiodine treatment leads to the development or worsening of GO, especially in smokers and subjects with high T3 and TRAb [80-82]. Both untreated hyperthyroidism and hypothyroidism may account for progression of Graves’ ophthalmopathy [28]. Another potential trigger is trauma. GO shares some pathogenetic features with pretibial myxedema, which tends to develop at sites of trauma [98, 99]. Other possible risk factors for GO include neck irradiation [100] and drugs such as lithium [101], IFNα [102], and glitazones [103, 104] (Table 3).
Pathogenesis
The key pathogenetic processes in GO include inflammation, excess production by orbital fibroblasts of hydrophilic glycosaminoglycans (GAG) resulting in edema, adipogenesis and, at later stages, fibrosis. Adipogenesis and edema lead to increased volume of the intraorbital components, the extraocular muscles and the
21
intraorbital adipose tissue, within the limits of the bony orbit, which causes the signs and symptoms of GO [66].
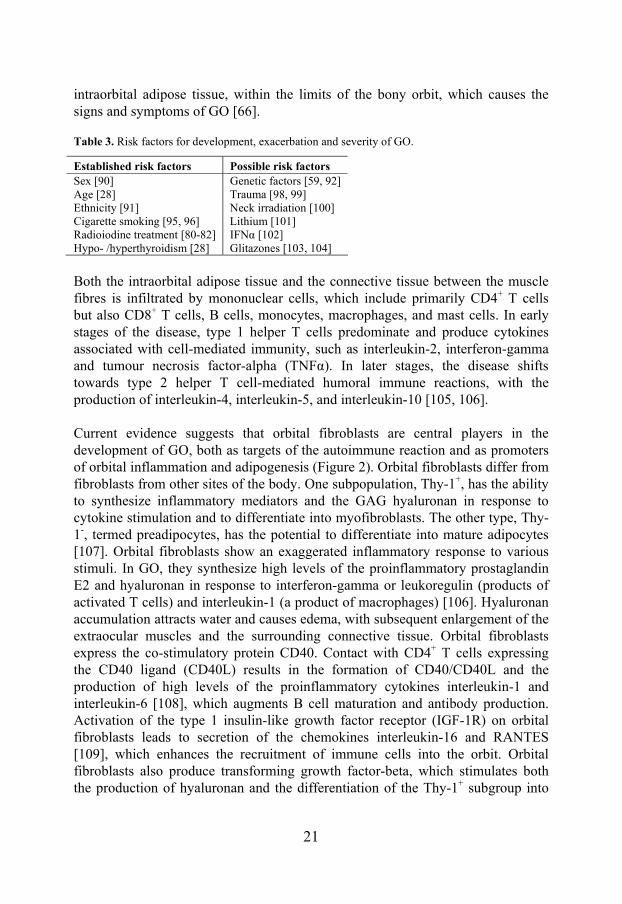
Table 3. Risk factors for development, exacerbation and severity of GO.
Established risk factors Possible risk factors Sex [90] Genetic factors [59, 92] Age [28] Trauma [98, 99] Ethnicity [91] Neck irradiation [100] Cigarette smoking [95, 96] Lithium [101] Radioiodine treatment [80-82] IFNα [102] Hypo- /hyperthyroidism [28] Glitazones [103, 104]
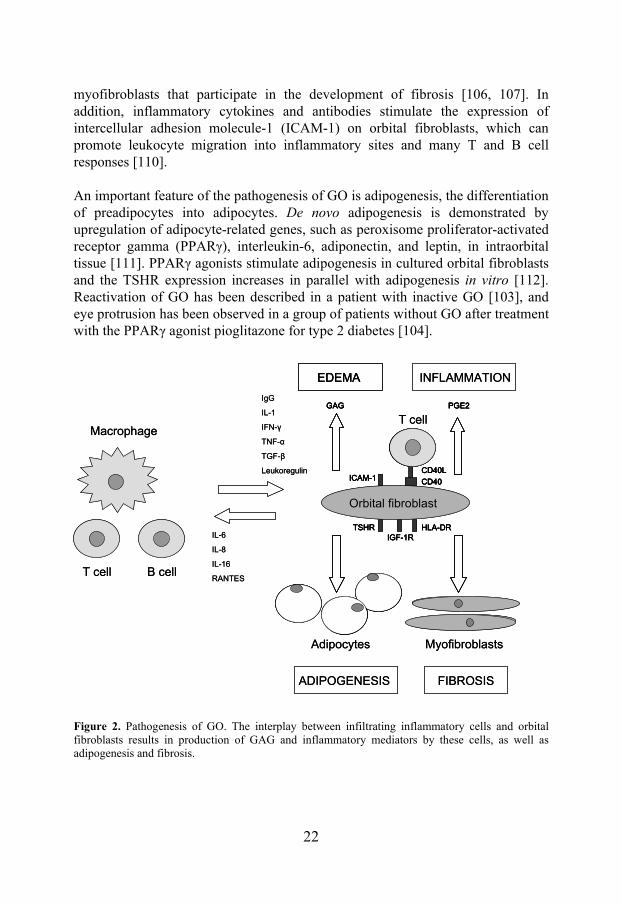
Both the intraorbital adipose tissue and the connective tissue between the muscle fibres is infiltrated by mononuclear cells, which include primarily CD4+ T cells but also CD8+ T cells, B cells, monocytes, macrophages, and mast cells. In early stages of the disease, type 1 helper T cells predominate and produce cytokines associated with cell-mediated immunity, such as interleukin-2, interferon-gamma and tumour necrosis factor-alpha (TNFα). In later stages, the disease shifts towards type 2 helper T cell-mediated humoral immune reactions, with the production of interleukin-4, interleukin-5, and interleukin-10 [105, 106]. Current evidence suggests that orbital fibroblasts are central players in the development of GO, both as targets of the autoimmune reaction and as promoters of orbital inflammation and adipogenesis (Figure 2). Orbital fibroblasts differ from fibroblasts from other sites of the body. One subpopulation, Thy-1+, has the ability to synthesize inflammatory mediators and the GAG hyaluronan in response to cytokine stimulation and to differentiate into myofibroblasts. The other type, Thy-1-, termed preadipocytes, has the potential to differentiate into mature adipocytes [107]. Orbital fibroblasts show an exaggerated inflammatory response to various stimuli. In GO, they synthesize high levels of the proinflammatory prostaglandin E2 and hyaluronan in response to interferon-gamma or leukoregulin (products of activated T cells) and interleukin-1 (a product of macrophages) [106]. Hyaluronan accumulation attracts water and causes edema, with subsequent enlargement of the extraocular muscles and the surrounding connective tissue. Orbital fibroblasts express the co-stimulatory protein CD40. Contact with CD4+ T cells expressing the CD40 ligand (CD40L) results in the formation of CD40/CD40L and the production of high levels of the proinflammatory cytokines interleukin-1 and interleukin-6 [108], which augments B cell maturation and antibody production. Activation of the type 1 insulin-like growth factor receptor (IGF-1R) on orbital fibroblasts leads to secretion of the chemokines interleukin-16 and RANTES [109], which enhances the recruitment of immune cells into the orbit. Orbital fibroblasts also produce transforming growth factor-beta, which stimulates both the production of hyaluronan and the differentiation of the Thy-1+ subgroup into
22
myofibroblasts that participate in the development of fibrosis [106, 107]. In addition, inflammatory cytokines and antibodies stimulate the expression of intercellular adhesion molecule-1 (ICAM-1) on orbital fibroblasts, which can promote leukocyte migration into inflammatory sites and many T and B cell responses [110]. An important feature of the pathogenesis of GO is adipogenesis, the differentiation of preadipocytes into adipocytes. De novo adipogenesis is demonstrated by upregulation of adipocyte-related genes, such as peroxisome proliferator-activated receptor gamma (PPARγ), interleukin-6, adiponectin, and leptin, in intraorbital tissue [111]. PPARγ agonists stimulate adipogenesis in cultured orbital fibroblasts and the TSHR expression increases in parallel with adipogenesis in vitro [112]. Reactivation of GO has been described in a patient with inactive GO [103], and eye protrusion has been observed in a group of patients without GO after treatment with the PPARγ agonist pioglitazone for type 2 diabetes [104].
Figure 2. Pathogenesis of GO. The interplay between infiltrating inflammatory cells and orbital fibroblasts results in production of GAG and inflammatory mediators by these cells, as well as adipogenesis and fibrosis.
ADIPOGENESIS FIBROSIS
IgG
IL-1
IFN-γ
TNF-α
TGF-β
Leukoregulin
IL-6
IL-8
IL-16
RANTES
ICAM-1
HLA-DRTSHRIGF-1R
PGE2GAG
CD40
CD40L
INFLAMMATIONEDEMA
T cell
T cell
B cell
Macrophage
Adipocytes Myofibroblasts
Orbital fibroblast
ICAM-1
HLA-DRTSHRIGF-1R
PGE2GAG
CD40
CD40L
ADIPOGENESIS FIBROSIS
IgG
IL-1
IFN-γ
TNF-α
TGF-β
Leukoregulin
IL-6
IL-8
IL-16
RANTES
ICAM-1
HLA-DRTSHRIGF-1R
PGE2GAG
CD40
CD40L
INFLAMMATIONEDEMAEDEMA
T cell
T cell
B cell
Macrophage
Adipocytes Myofibroblasts
Orbital fibroblast
ICAM-1
HLA-DRTSHRIGF-1R
PGE2GAG
CD40
CD40L
23
The question of autoantigens in GO is still under debate, but the fact that GO is in nearly 100% of patients associated with AITD and that the orbital tissues are infiltrated with immune and inflammatory cells suggests that it is an autoimmune disorder. Because of the close association of GO with GD, the finding of TRAb in virtually all patients with GO and the correlation of TRAb levels and disease activity [113], researchers have hypothesized that the thyroid and the orbit share the same autoantigen, TSHR. TSHR is overexpressed in orbital tissues of patients with GO compared to controls [114, 115], and its expression correlates with disease activity [116]. In orbital fibroblasts transfected with an activated mutant TSH construct, both early adipocyte differentiation and hyaluronan production was stimulated [117, 118], suggesting that TRAb ligation to TSHR on orbital fibroblasts directly contributes to the pathogenesis of GO. However, the expression of TSHR even in active disease is very low [116], and both TSHR mRNA and protein are detectable in several other tissues unrelated to GD [119, 120]. Another possible autoantigen is IGF-1R. Orbital fibroblasts in patients with GO express higher levels of IGF-1R than normal fibroblasts [121]. The presence of IGF-1R autoantibodies has been demonstrated in patients with GO. Moreover, these antibodies are able to activate orbital fibroblasts via IGF-1R and stimulate them to produce chemokines and hyaluronan [109, 122]. Intensive research has also focused on extraocular muscles as possible antigens, as antibodies against these are present in patients with GO (reviewed in [123]). However, it is still unclear if these antibodies represent a secondary phenomenon or are directly involved in the pathogenesis of GO. Why is the orbit a target for thyroid autoimmunity? One possible explanation could be a combination of the presence of antigenic structures recognized by autoreactive cells involved in AITD and features of the local environment in the orbit, such as the unique characteristics of the orbital fibroblasts or the anatomy of the orbital space. The orbital anatomy is suggested to contribute to increased intraorbital pressure and impairment of the venous and lymphatic drainage, prolonging the half-life of inflammatory cytokines and worsening the inflammation [124].
Clinical features
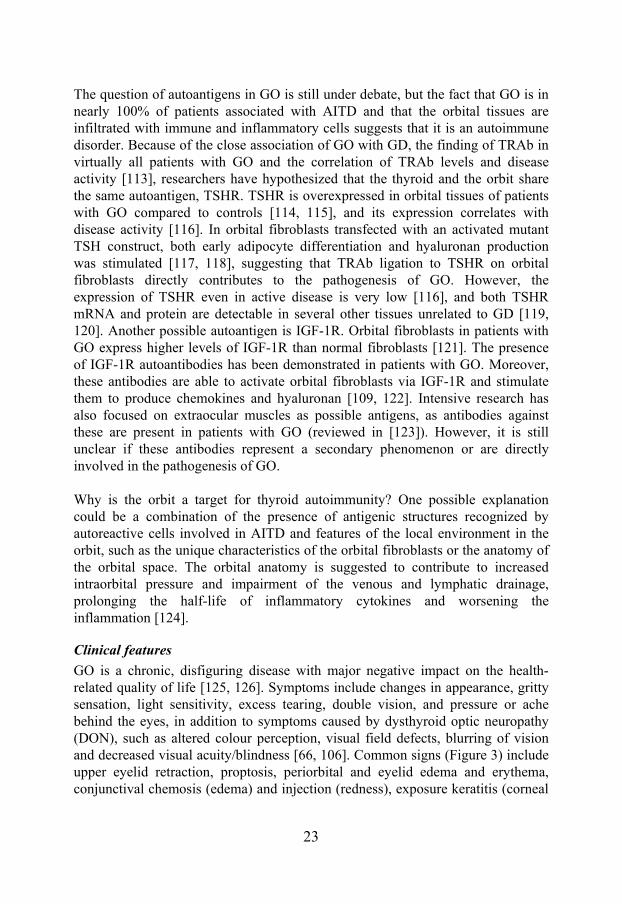
GO is a chronic, disfiguring disease with major negative impact on the health-related quality of life [125, 126]. Symptoms include changes in appearance, gritty sensation, light sensitivity, excess tearing, double vision, and pressure or ache behind the eyes, in addition to symptoms caused by dysthyroid optic neuropathy (DON), such as altered colour perception, visual field defects, blurring of vision and decreased visual acuity/blindness [66, 106]. Common signs (Figure 3) include upper eyelid retraction, proptosis, periorbital and eyelid edema and erythema, conjunctival chemosis (edema) and injection (redness), exposure keratitis (corneal
24
injury due to dryness), and extraocular muscle dysfunction [66, 106]. DON, which is diagnosed by an ophthalmologist as optical disc swelling, impaired visual acuity or colour vision, abnormal perimetry or afferent pupil defect, occurs in approximately 5% of GO patients [127].
a. b.
Figure 3. Common signs of GO, eyelid retraction (a) and conjunctival injection (b). From [128]. Courtesy of Dr. B. Hallengren and Dr. P.Åsman.
Most patients have both adipose tissue and muscle enlargement, but one or the other can predominate, and the predominance can even vary during the course of the disease. Patients under 40 years of age tend to have more fat expansion, whereas patients over 60 years of age develop more muscle hypertrophy [89]. The diagnosis of GO is based on the presence of eye signs and symptoms together with thyroid autoimmunity (hyper- or hypothyroidism and positive thyroid autoantibodies) and the exclusion of an alternative diagnosis. In some cases, such as unilateral involvement, orbital imaging might be necessary to exclude another pathology. In the context of GO, the terms ‘activity’ and ‘severity’ are often discussed. The natural course of GO includes an initial phase of worsening of symptoms and signs followed by a plateau phase without further deterioration. A phase of gradual improvement follows until the disease becomes stationary. These first three phases are referred to as the active phase and represent the period when inflammation is present [127, 129]. The final stage, in which the inflammation has resolved, is known as the inactive phase. During this phase, fibrosis may develop such that residual features, such as lid abnormality, extraocular muscle dysfunction, or proptosis, might persist. The term ‘severity’ describes the degree of functional or cosmetic deficit regardless of stage [127]. Determining the activity and severity of the disease has therapeutic implications. Immunomodulatory therapies can only be effective in the presence of inflammation during the active phase, whereas reconstructive surgery should only be performed in the inactive phase, when no further spontaneous improvement is expected. Moreover, DON develops only
25
during the active phase. In clinical practice, activity is often evaluated by the clinical activity score (CAS) described by Mourits et al. [130]. Severity is assessed by examining eyelid swelling, eyelid aperture, proptosis, eye motility, visual acuity, and colour vision. Pupil responses, the appearance of the cornea and the optic discs are also evaluated [131]. The modified NOSPECS classification was developed in 1977 [132] as a tool to grade the severity of GO. It is now generally accepted that NOSPECS is of little value in predicting outcome [127] and has been criticized for a number of other reasons [133]; however, it is still widely used as a classification instrument in clinical studies.
Treatment
The three established treatment options today include corticosteroids, orbital irradiation, and surgery. Immunosuppressants such as cyclosporine, intravenous immunoglobulin, azathioprine, and ciamexone have all been tested and proven effective in some patients with GO. However, adverse effects and high cost reduce their use to complementing corticosteroids in severe and active GO [131]. The decision whether to treat and which modality to use depends on the disease activity and severity [134]. Patients with mild disease (CAS<3) usually do not require immunosuppressive or surgical treatment and can be managed conservatively using artificial tears, lubricant ointments, sunglasses, prisms, or head elevation during sleep and the majority will improve spontaneously within 3-6 months [135]. Moderate to severe cases (CAS≥3) in the active phase benefit from immunosuppressive therapy, either with corticosteroids, orbital irradiation, or a combination of the two. Sight-threatening disease with DON and/or severe corneal damage may require decompression surgery in case the immunosuppressive therapy fails. In the inactive phase, patients do not respond to immunosuppressive treatment; however, reconstructive surgery can be considered to correct diplopia or for cosmetic reasons. Glucocorticoids have been used in the treatment of active and severe GO for 50 years and have a proven beneficial effect on soft tissue signs, ocular motility, and visual acuity, whereas the effect on proptosis is limited [136, 137]. The debated issues regarding treatment with corticosteroids include the route of administration (oral or intravenous), the dosage, and the regimen. The main disadvantage of oral steroid treatment, which typically is administered for several months, is the iatrogenic Cushing syndrome with many serious side effects. A recent meta-analysis revealed that intravenous-pulse corticosteroids have a small but statistically significant advantage in terms of CAS response compared with oral corticosteroids and cause significantly fewer adverse events [138]. Therefore, they are currently the treatment of choice [134]. The main concern with intravenous administration is the risk for rare severe adverse events reported in the literature,
26
such as liver damage [139, 140] or cardiovascular and cerebrovascular events [141]. The rationale of orbital radiotherapy in GO resides in the radiosensitivity of lymphocytes that infiltrate the orbit in GO. A meta-analysis found no advantage of radiotherapy over sham radiation regarding CAS or proptosis, but radiotherapy did affect diplopia, and the combined treatment with corticosteroids was significantly better than with either modality alone [138]. Radiotherapy is a safe treatment; however, diabetics, especially when hypertensive, are at risk of developing retinopathy [142], and in patients with known retinopathy, radiotherapy is contraindicated. Initial worsening of soft tissue inflammation is common but can be diminished with corticosteroids. Due to the numerous side effects of corticosteroid treatment, intensive research is ongoing with the aim of identifying novel therapeutic options. Somatostatin analogues have been tested to treat GO, with conflicting results. The rationale behind somatostatin use is to take advantage of the immunomodulatory effect of these drugs as well as the presence of somatostatin receptors on orbital fibroblasts [143] and the correlation of GO disease activity with the uptake of somatostatin analogues in orbital scintigrams [144]. Somatostatin analogues have a marginal advantage over placebo in moderately severe GO [138], and given their high cost, they are currently not recommended for routine treatment of GO. Novel therapeutic strategies for GO have emerged in recent years. Rituximab is an anti-CD20 monoclonal antibody causing B cell depletion and is effective in rheumatoid arthritis [145]. It has been tested in GO with promising results [146-148], and a randomized trial of this agent is ongoing [106]. Other strategies tested include targeting TNFα [149] or TNFα-receptor [150]. A recent consensus statement by the European Group on Graves’ Orbitopathy (EUGOGO) [134] aiming at improving the outcome of patients with GO emphasized the need for an evidence-based approach in treating GO; therefore, randomized clinical trials of these new potential treatments are essential. Decompression surgery is, in the active phase, reserved for severe cases of GO with serious corneal damage or DON irresponsive to medical treatment [151]. Removing the medial, lateral, or inferior orbital wall with concomitant fat removal reduces intraorbital volume. Decompression surgery provides immediate relief of the optical nerve compression and reduces the need for long-term steroid treatment but is associated with surgical risks such as sinusitis, haemorrhage, cerebrospinal fluid leak, diplopia (especially when using medial decompression), and, rarely, visual loss [152]. In the chronic phase, rehabilitative decompression surgery can reduce proptosis and eyelid displacement [153] and can be followed by squint and
27
eyelid surgery (blepharoplasty) or eyebrow plasty, aiming at restoring the patient’s appearance.
Lymphedema
The function of the lymph is to return proteins and colloids to the blood compartment. Lymphedema arises due to an imbalance between the intact capillary filtration and disturbed lymph drainage. There are two types of lymphedema: primary, which is inborn and develops without any known insult, and secondary, which is acquired and can be caused by surgery, radiotherapy, infection, inflammation, or lymphangiotrombosis [154]. According to recent findings, lymphedema seems to involve more than just passive accumulation of lymph, as complex changes also occur in the tissue surrounding the damaged lymph vessels. These changes appear to be associated with an inflammatory process [155, 156]. The lack of effective drainage of immune cells from the tissue leads to persistent inflammation [155]. Impaired lymphatic transport causes accumulation of hyaluronan, which attracts water and causes edema in the initial phases [157]. At later stages, the condition is characterized by excessive fat accumulation and fibrosis [158, 159].
Adipogenesis
It is now clear that adipose tissue is an active endocrine organ that secretes many proteins influencing energy homeostasis, immune functions, angiogenesis, coagulation, and blood pressure [160]. Recent findings also provided evidence of a link between adipogenesis and inflammation. Obesity is regarded as a state of chronic inflammation with increased expression of TNFα, C-reactive protein, interleukin-6 and plasminogen activator inhibitor-1 [161]. Chronic inflammation induces enlargement of adjacent adipose tissue, which has been proposed a mechanism for adipose tissue hypertrophy in, e.g., Crohn’s disease or lymphedema [162]. Adipogenesis is the process of maturation of mesenchymal cells into mature fat cells, adipocytes. The first step, known as determination, involves the commitment of a pluripotent mesenchymal cell to the adipocyte lineage, which results in conversion into a preadipocyte. During the following phases, the preadipocyte takes on the characteristics of a mature adipocyte [160]. In vitro, adipogenesis has been extensively studied in the mouse preadipocyte 3T3-L1 and 3T3-F442A cell lines. The first stage in the differentiation process is growth arrest at confluence. The cells undergo one or two rounds of cell division, known as the mitotic clonal
28
expansion phase, on days 1 and 2 post-confluence, with concomitant expression of immediate early genes (IEGs) [163]. IEGs are expressed within 30–60 minutes in response to mitogens, and their function is to trigger transcriptional cascades leading to the different biological phenotypes. This phase ceases simultaneously with the expression of the central regulators of adipogenesis, PPARγ and CCAAT/enhancer binding protein alpha. A second growth arrest follows on days 3–4, after which the cells enter the terminal differentiation phase on days 4–10, with expression of the genes that characterize the adipocyte phenotype, such as stearoyl-coenzyme A desaturase (SCD) and fatty acid synthase. After this, secreted products such as leptin or adiponectin are synthesized [160, 164].
Thyrostimulin
TSH belongs to the glycoprotein family of hormones together with follitropin, lutropin, and human chorionic gonadotropin. The structure of these hormones consists of a common alpha subunit, shared by all the members of the family, and a hormone-specific beta subunit. Recently, two additional human glycoprotein hormone subunit-like genes have been identified and named alpha 2 (GPA2) and beta 5 (GPB5) [165]. GPA2 and GPB5 have conserved cysteine residues, similar to those found in the well-characterized alpha and beta subunits [165]. The A2–B5 heterodimer stimulates TSHR both in vitro and in vivo in male rats [166]. In the rat, both units are expressed in a variety of tissues, including the anterior pituitary and the thyroid [165, 166], and researchers have speculated that this new hormone might have functions in thyroid biology or disease. However, unlike the TSH-beta subunit, transcription of GPB5 is not regulated by thyroid hormone, and thyrotropin-releasing hormone stimulation of primary cultures of rat pituitaries does not increase GPB5 expression [167, 168]. As GPB5 is widely distributed in Amphioxus embryos [169] and abundantly expressed in newborn mice [170], it was suggested to have a role during embryologic development. Mice overexpressing GB5 develop biochemical and clinical signs of hyperthyroidism; however, mice in which the GPB5 gene is knocked out do not exhibit a distinct phenotype [170]. In another animal study, knock-out of GPB5 resulted in moderate deviations of the hypothalamus-pituitary-thyroid axis, with more pronounced differences in juvenile mice compared to adult mice, which further supported the hypothesis that GPB5 has a role during development [171].
29
AIMS
Both GD and GO are associated with decreased quality of life. GO is a disfiguring, potentially sight-threatening condition, and is currently not preventable. The treatment options for GO are limited and associated with side effects. There are many areas that require further research including genetics, trigger factors, and the molecular pathogenesis of GD and GO, as well as novel therapeutic regimens for GO. The overall aim of this thesis was to contribute to the understanding of the molecular etiology of GD and GO. The specific aims were as follows:
I. To explore the mechanisms leading to GO by comparing gene expression in the intraorbital adipose tissue of patients with severe active GO and healthy controls.
II. To investigate a potential role for thyrostimulin in thyroid biology and disease by studying its expression in thyroid tissue of patients with multinodular goitre and GD and healthy controls, as well as in intraorbital adipose tissue of patients with GO and healthy controls.
III. To define target genes for therapeutic intervention by studying gene expression of markers of adipogenesis and inflammation during the active and chronic phase of GO and to establish an in vitro model for studying adipogenesis.
IV. To identify potential common pathogenetic mechanisms in GO and lymphedema by comparing gene expression in adipose tissue from patients with chronic GO and chronic lymphedema.
V. To investigate whether genetic variation in genes overexpressed in active GO is associated with GD and/or GO by performing a case-control study.
30
STUDY SUBJECTS
Swedish subjects
GD2002
In 2002, a biobank named GD2002 was established in Malmö, southern Sweden, where serum, plasma and buffy coat are collected and stored. Patients with a history of GD and newly diagnosed patients with GD are included in the biobank after their informed consent. The biobank now consists of approximately 400 GD patients with and without GO and contains a database with the phenotypic data, including sex, age, ethnicity, family history, medical history, and smoking habits, of each patient. Additionally, biopsies of thyroid and intraorbital adipose tissues from the patients undergoing thyroid or ophthalmopathy surgery are saved. In study V, 312 GD patients from GD2002 with (n = 86) and without (n = 226) GO as well as 621 sex and ethnicity matched controls from Malmö were included.
Phenotypic characterization
The diagnosis of GD in all studies was performed by an endocrinologist. The diagnosis was based on clinical signs and symptoms and biochemical findings including suppressed serum TSH, increased serum free T4 and/or free T3, and the presence of TRAb and/or a diffuse uptake on technetium scintigraphy. The diagnosis of GO was determined by an endocrinologist and/or an ophthalmologist based on the various clinical signs; eyelid retraction alone was not classified as GO. CAS [130] was used to assess the disease activity. Chronic lymphedema was diagnosed clinically by a senior plastic surgeon with special interest in lymphedema.
Tissue biopsies
In studies I-IV, which focused on gene expression analysis, biopsies from intraorbital adipose tissue from patients with active GO who underwent lateral decompression and from patients with chronic GO who underwent restorative eyelid surgery were used. Biopsies from intraorbital adipose tissue from individuals without thyroid disease that were operated with restorative eyelid surgery were used as controls. Patients with active GO were all diagnosed with severe GO with DON and were treated with corticosteroids prior to surgery. Patients classified with chronic GO had no change in their disease state for at least one year prior to inclusion in the study and were not treated with corticosteroids
31
before surgery. During the eyelid surgery, intraorbital tissue was collected after cleavage of the orbital septum. Therefore, although the patients with chronic GO and the controls underwent eyelid surgery, the tissue obtained was intraorbital and of the same origin as the one obtained by lateral decompression in patients with active GO. In studies I and II, subcutaneous and visceral adipose tissue was obtained during bariatric surgery. In study III, biopsies from normal thyroid tissue, thyroid tissue in multinodular toxic goitre, and thyroid tissue in GD were collected during thyroid surgery. In study IV, patients who underwent an operation for breast cancer and developed lymphedema as a complication of the treatment were included. These patients suffered from chronic lymphedema that was unsuccessfully treated with conservative measures and, subsequently, underwent liposuction of the lymphedematous arm. Subcutaneous adipose tissue was collected from the lymphedematous arm before starting liposuction and from the unaffected arm of the same individual, which served as a control. All subjects gave informed consent, and all studies were approved by the local ethics committee.
Polish subjects
In Study V, two SNPs (rs12136280 and rs3753793) were also genotyped in a Polish cohort including 562 GD patients with (n = 262) and without (n = 282, data missing in 18 individuals) GO as well as in 855 (for rs12136280) and 475 (for rs3753793) controls. The diagnostic criteria for GD and GO were the same as in the Swedish material. All subjects were Caucasians of Polish origin. No data on sex, age, ethnicity, or smoking were available for the controls.
32
METHODS
DNA and RNA extraction
DNA was extracted from whole blood using the MaxiPrep Kit (QIAGEN, Germany). All biopsies were treated with RNAlater (Ambion Inc., Austin, TX) to minimize RNA degradation. RNA was extracted with the RNeasy Mini or Midi Kit (QIAGEN, Germany). This extraction kit uses columns containing a silica membrane to which RNA binds and the contaminants are washed away. In Study IV, RNeasy MinElute Cleanup Kit (QIAGEN, Germany) was used to isolate high quantity and quality RNA suitable for subsequent microarray analysis. RNA quality and quantity were measured an Agilent 2100 Bioanalyzer and Nanodrop ND-1000, respectively.
Reverse Transcription-Polymerase Chain Reaction (RT-PCR)
PCR is a technique commonly used in molecular biology to amplify DNA. In RT-PCR, an RNA strand is first reverse transcribed into its complementary DNA (cDNA) using the enzyme reverse transcriptase, followed by amplification of cDNA using traditional or real-time PCR. In Study II, RNA was treated with DNAse (Invitrogen, UK) to eliminate genomic DNA contamination prior to cDNA synthesis. In studies I-III, cDNA was synthesised using Superscript II RNase H Reverse Transcriptase and random hexamer primers (Life Technologies, Carlsbad, CA). In studies II and IV, a QuantiTect Reverse Transcription Kit (QIAGEN, Germany) was used for cDNA synthesis. The reverse transcription step was followed by traditional PCR and gel electrophoresis in Study III and by real-time PCR in the remaining expression experiments in Studies I-IV.
Real-Time PCR
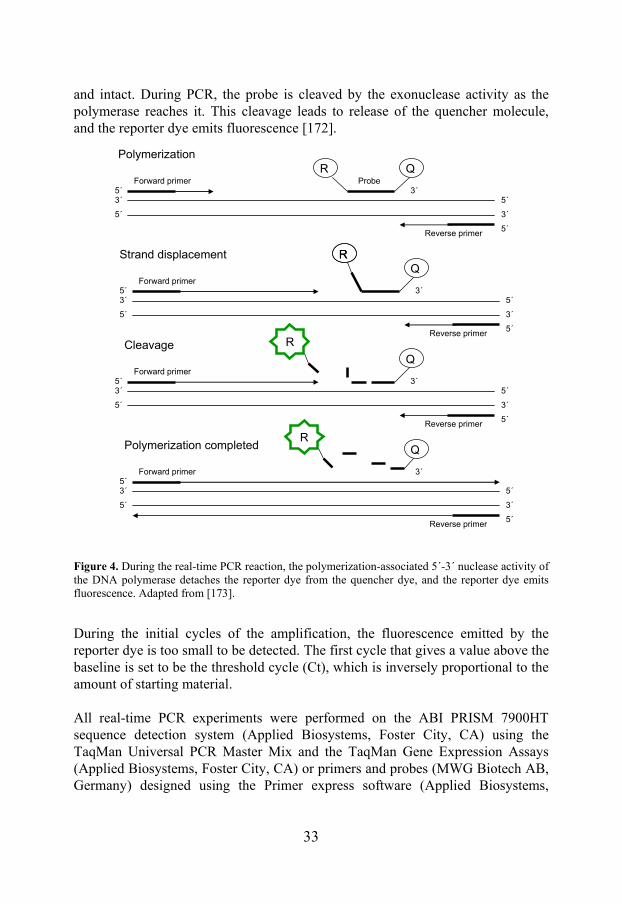
Real-time PCR is used for quantification of gene expression. In contrast to traditional PCR, it measures amplification as it occurs. It is quantitative because data are collected during the exponential phase of PCR when quantity of the PCR product is directly proportional to the amount of input DNA. The technique is based on the 5´ to 3´ exonuclease activity of the enzyme TaqDNA polymerase [172] (Figure 4). A hybridization probe that binds between two PCR primers is labelled with a fluorescent reporter dye and a quencher dye. The quencher dye prevents the reporter dye from emitting fluorescence when the probe is hybridized
33
and intact. During PCR, the probe is cleaved by the exonuclease activity as the polymerase reaches it. This cleavage leads to release of the quencher molecule, and the reporter dye emits fluorescence [172].
Figure 4. During the real-time PCR reaction, the polymerization-associated 5´-3´ nuclease activity of the DNA polymerase detaches the reporter dye from the quencher dye, and the reporter dye emits fluorescence. Adapted from [173].
During the initial cycles of the amplification, the fluorescence emitted by the reporter dye is too small to be detected. The first cycle that gives a value above the baseline is set to be the threshold cycle (Ct), which is inversely proportional to the amount of starting material. All real-time PCR experiments were performed on the ABI PRISM 7900HT sequence detection system (Applied Biosystems, Foster City, CA) using the TaqMan Universal PCR Master Mix and the TaqMan Gene Expression Assays (Applied Biosystems, Foster City, CA) or primers and probes (MWG Biotech AB, Germany) designed using the Primer express software (Applied Biosystems,
5´
3´
3´
5´
5´ 3´Forward primer
RRQ
Reverse primer5´
5´
3´
3´
5´
5´ 3´Forward primer Probe
R Q
Reverse primer5´
5´
3´
3´
5´
5´Forward primer
Reverse primer5´
5´
3´
3´
5´
5´ 3´Forward primer
Q
Reverse primer5´
R
3´
Q
Polymerization
Strand displacement
Cleavage
Polymerization completedR
34
Foster City, CA). For analysis of the gene expression data, the standard curve method was used. This method determines the amount RNA in the sample from a standard curve with known amounts of RNA [173]. To adjust for differences in the amount of starting material between samples, quantification is performed relative to an internal standard, such as a housekeeping gene, whose expression does not change in the tissue(s) studied. In Studies I-IV, cyclophilin A was used as a housekeeping gene after controlling for stable expression in all conditions investigated using the human Endogenous Control Array (Applied Biosystems, Foster City, CA). In Study II, mouse beta-actin (β-actin) was used as a housekeeping gene for expression studies in mouse 3T3-L1 preadipocytes.
Microarray analysis
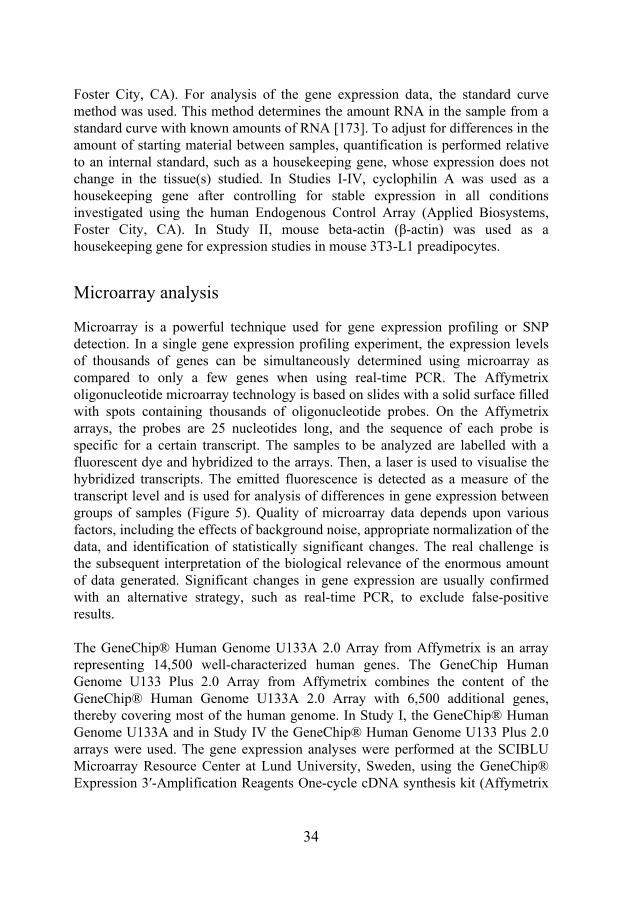
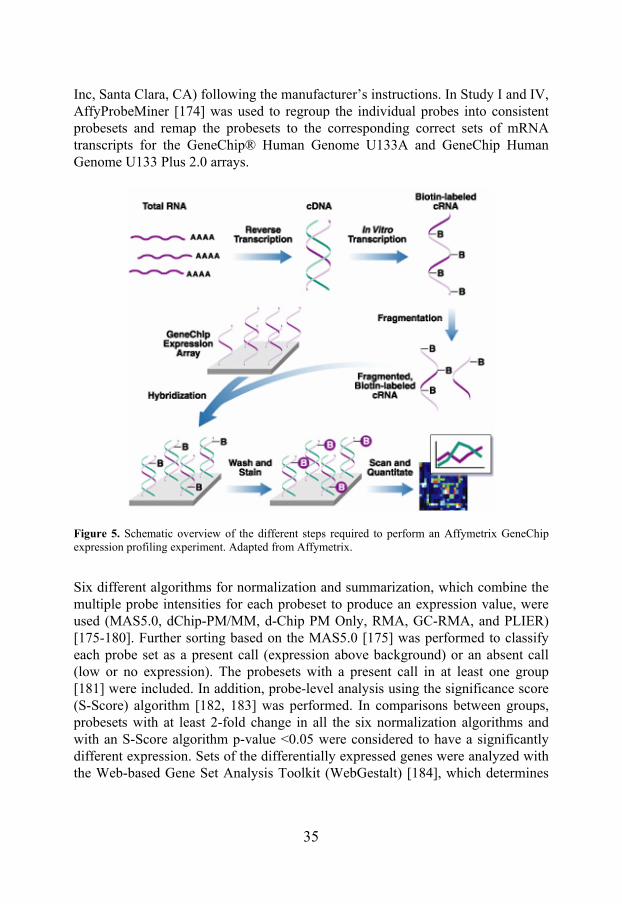
Microarray is a powerful technique used for gene expression profiling or SNP detection. In a single gene expression profiling experiment, the expression levels of thousands of genes can be simultaneously determined using microarray as compared to only a few genes when using real-time PCR. The Affymetrix oligonucleotide microarray technology is based on slides with a solid surface filled with spots containing thousands of oligonucleotide probes. On the Affymetrix arrays, the probes are 25 nucleotides long, and the sequence of each probe is specific for a certain transcript. The samples to be analyzed are labelled with a fluorescent dye and hybridized to the arrays. Then, a laser is used to visualise the hybridized transcripts. The emitted fluorescence is detected as a measure of the transcript level and is used for analysis of differences in gene expression between groups of samples (Figure 5). Quality of microarray data depends upon various factors, including the effects of background noise, appropriate normalization of the data, and identification of statistically significant changes. The real challenge is the subsequent interpretation of the biological relevance of the enormous amount of data generated. Significant changes in gene expression are usually confirmed with an alternative strategy, such as real-time PCR, to exclude false-positive results. The GeneChip® Human Genome U133A 2.0 Array from Affymetrix is an array representing 14,500 well-characterized human genes. The GeneChip Human Genome U133 Plus 2.0 Array from Affymetrix combines the content of the GeneChip® Human Genome U133A 2.0 Array with 6,500 additional genes, thereby covering most of the human genome. In Study I, the GeneChip® Human Genome U133A and in Study IV the GeneChip® Human Genome U133 Plus 2.0 arrays were used. The gene expression analyses were performed at the SCIBLU Microarray Resource Center at Lund University, Sweden, using the GeneChip® Expression 3′-Amplification Reagents One-cycle cDNA synthesis kit (Affymetrix
35
Inc, Santa Clara, CA) following the manufacturer’s instructions. In Study I and IV, AffyProbeMiner [174] was used to regroup the individual probes into consistent probesets and remap the probesets to the corresponding correct sets of mRNA transcripts for the GeneChip® Human Genome U133A and GeneChip Human Genome U133 Plus 2.0 arrays.
Figure 5. Schematic overview of the different steps required to perform an Affymetrix GeneChip expression profiling experiment. Adapted from Affymetrix.
Six different algorithms for normalization and summarization, which combine the multiple probe intensities for each probeset to produce an expression value, were used (MAS5.0, dChip-PM/MM, d-Chip PM Only, RMA, GC-RMA, and PLIER) [175-180]. Further sorting based on the MAS5.0 [175] was performed to classify each probe set as a present call (expression above background) or an absent call (low or no expression). The probesets with a present call in at least one group [181] were included. In addition, probe-level analysis using the significance score (S-Score) algorithm [182, 183] was performed. In comparisons between groups, probesets with at least 2-fold change in all the six normalization algorithms and with an S-Score algorithm p-value <0.05 were considered to have a significantly different expression. Sets of the differentially expressed genes were analyzed with the Web-based Gene Set Analysis Toolkit (WebGestalt) [184], which determines
36
the extent of over- or under-expression of sets of genes in a microarray experiment relative to a reference state.
Selection of SNPs
SNPs for Study V were selected using data from the Hap Map consortium [29]. Using the tag SNPs approach reduces the number of SNPs that must be genotyped to account for the genetic variation in a region. Therefore, the region surrounding each of the selected genes, including an extra 10 kb upstream and downstream, was analyzed by Tagger in the Haploview program [185], which provided tag SNPs for each gene. Additionally, potentially important SNPs were chosen from TAMAL (http://neoref.ils.unc.edu/tamal/) as described in [186] and from the National Center for Biotechnology Information (NCBI) SNP database (http://www.ncbi.nlm.nih.gov/SNP/). Minor allele frequency (MAF) for all SNPs was >0.05.
Genotyping
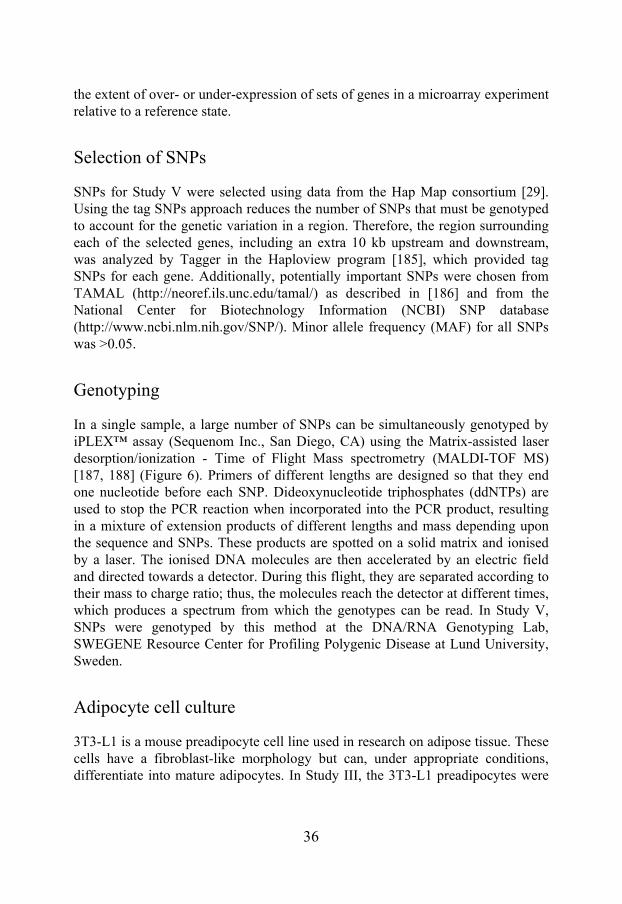
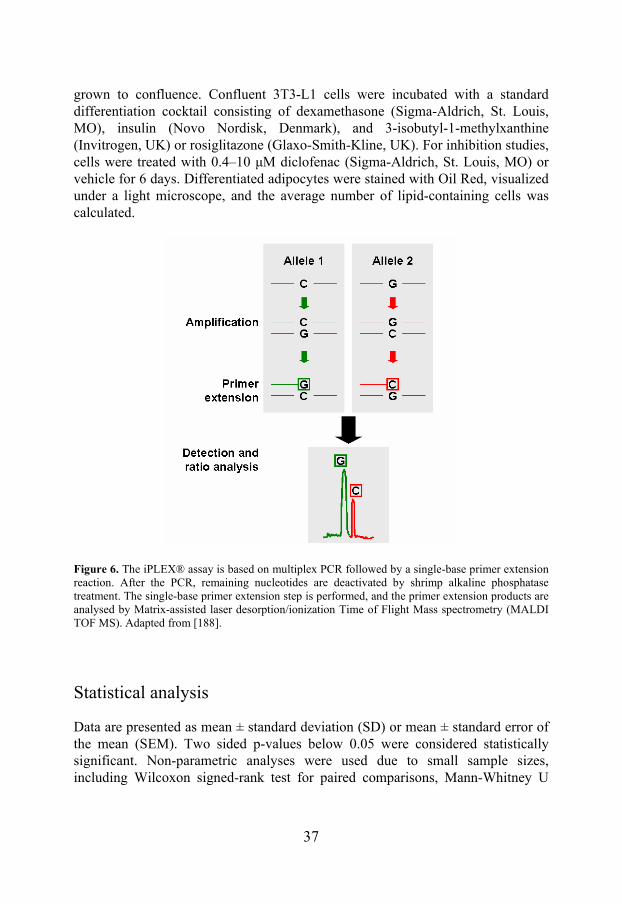
In a single sample, a large number of SNPs can be simultaneously genotyped by iPLEX™ assay (Sequenom Inc., San Diego, CA) using the Matrix-assisted laser desorption/ionization - Time of Flight Mass spectrometry (MALDI-TOF MS) [187, 188] (Figure 6). Primers of different lengths are designed so that they end one nucleotide before each SNP. Dideoxynucleotide triphosphates (ddNTPs) are used to stop the PCR reaction when incorporated into the PCR product, resulting in a mixture of extension products of different lengths and mass depending upon the sequence and SNPs. These products are spotted on a solid matrix and ionised by a laser. The ionised DNA molecules are then accelerated by an electric field and directed towards a detector. During this flight, they are separated according to their mass to charge ratio; thus, the molecules reach the detector at different times, which produces a spectrum from which the genotypes can be read. In Study V, SNPs were genotyped by this method at the DNA/RNA Genotyping Lab, SWEGENE Resource Center for Profiling Polygenic Disease at Lund University, Sweden.
Adipocyte cell culture
3T3-L1 is a mouse preadipocyte cell line used in research on adipose tissue. These cells have a fibroblast-like morphology but can, under appropriate conditions, differentiate into mature adipocytes. In Study III, the 3T3-L1 preadipocytes were
37
grown to confluence. Confluent 3T3-L1 cells were incubated with a standard differentiation cocktail consisting of dexamethasone (Sigma-Aldrich, St. Louis, MO), insulin (Novo Nordisk, Denmark), and 3-isobutyl-1-methylxanthine (Invitrogen, UK) or rosiglitazone (Glaxo-Smith-Kline, UK). For inhibition studies, cells were treated with 0.4–10 μM diclofenac (Sigma-Aldrich, St. Louis, MO) or vehicle for 6 days. Differentiated adipocytes were stained with Oil Red, visualized under a light microscope, and the average number of lipid-containing cells was calculated.
Figure 6. The iPLEX® assay is based on multiplex PCR followed by a single-base primer extension reaction. After the PCR, remaining nucleotides are deactivated by shrimp alkaline phosphatase treatment. The single-base primer extension step is performed, and the primer extension products are analysed by Matrix-assisted laser desorption/ionization Time of Flight Mass spectrometry (MALDI TOF MS). Adapted from [188].
Statistical analysis
Data are presented as mean ± standard deviation (SD) or mean ± standard error of the mean (SEM). Two sided p-values below 0.05 were considered statistically significant. Non-parametric analyses were used due to small sample sizes, including Wilcoxon signed-rank test for paired comparisons, Mann-Whitney U
38
test for unpaired comparisons, and Kruskal-Wallis one-way analysis of variance for comparing three or more groups. Normally distributed variables were analysed using analysis of variance. In Study V, logistic regression was used to estimate the odds ratios (OR). OR is a prediction of the fold change in risk due to a selected factor regarding the studied phenotype. Logistic regression allows adjustment for confounding factors such as age, gender, or ethnicity. In study V, all analyses were adjusted for age and smoking. Haplotype analysis and association testing was carried out using the Haploview program version 4.0 [185]. Statistical calculations were performed using the SPSS statistical package version 16.0 or 17.0 (SPSS, Chicago, IL, USA) and PLINK version 1.07 (http://pngu.mgh.harvard.edu/ ~purcell/plink/index.shtml) [189].
39
RESULTS
Study I
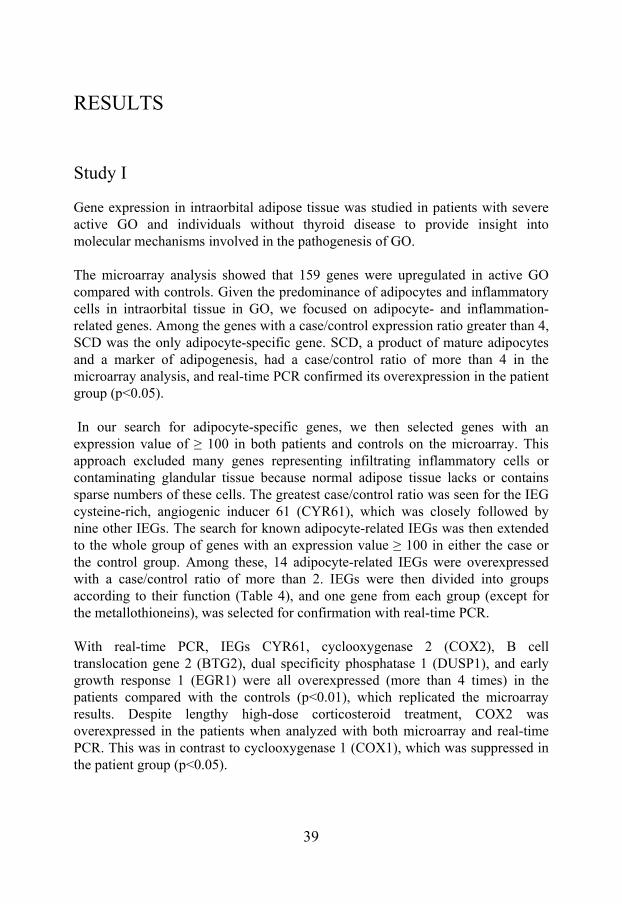
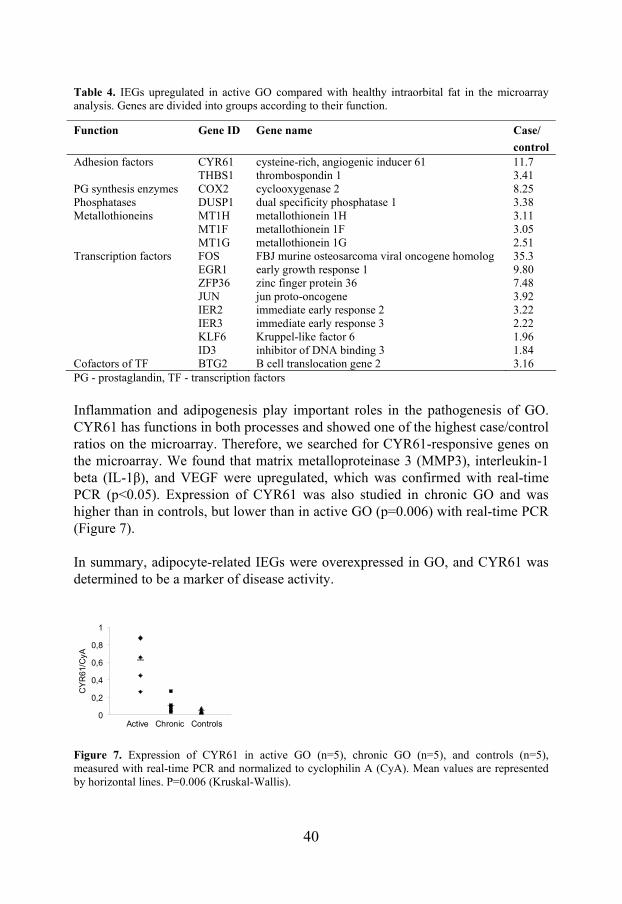
Gene expression in intraorbital adipose tissue was studied in patients with severe active GO and individuals without thyroid disease to provide insight into molecular mechanisms involved in the pathogenesis of GO. The microarray analysis showed that 159 genes were upregulated in active GO compared with controls. Given the predominance of adipocytes and inflammatory cells in intraorbital tissue in GO, we focused on adipocyte- and inflammation-related genes. Among the genes with a case/control expression ratio greater than 4, SCD was the only adipocyte-specific gene. SCD, a product of mature adipocytes and a marker of adipogenesis, had a case/control ratio of more than 4 in the microarray analysis, and real-time PCR confirmed its overexpression in the patient group (p<0.05). In our search for adipocyte-specific genes, we then selected genes with an expression value of ≥ 100 in both patients and controls on the microarray. This approach excluded many genes representing infiltrating inflammatory cells or contaminating glandular tissue because normal adipose tissue lacks or contains sparse numbers of these cells. The greatest case/control ratio was seen for the IEG cysteine-rich, angiogenic inducer 61 (CYR61), which was closely followed by nine other IEGs. The search for known adipocyte-related IEGs was then extended to the whole group of genes with an expression value ≥ 100 in either the case or the control group. Among these, 14 adipocyte-related IEGs were overexpressed with a case/control ratio of more than 2. IEGs were then divided into groups according to their function (Table 4), and one gene from each group (except for the metallothioneins), was selected for confirmation with real-time PCR. With real-time PCR, IEGs CYR61, cyclooxygenase 2 (COX2), B cell translocation gene 2 (BTG2), dual specificity phosphatase 1 (DUSP1), and early growth response 1 (EGR1) were all overexpressed (more than 4 times) in the patients compared with the controls (p<0.01), which replicated the microarray results. Despite lengthy high-dose corticosteroid treatment, COX2 was overexpressed in the patients when analyzed with both microarray and real-time PCR. This was in contrast to cyclooxygenase 1 (COX1), which was suppressed in the patient group (p<0.05).
40
Table 4. IEGs upregulated in active GO compared with healthy intraorbital fat in the microarray analysis. Genes are divided into groups according to their function.
Function Gene ID Gene name Case/
control CYR61 cysteine-rich, angiogenic inducer 61 11.7 Adhesion factors THBS1 thrombospondin 1 3.41
PG synthesis enzymes COX2 cyclooxygenase 2 8.25 Phosphatases DUSP1 dual specificity phosphatase 1 3.38
MT1H metallothionein 1H 3.11 MT1F metallothionein 1F 3.05
Metallothioneins
MT1G metallothionein 1G 2.51 FOS FBJ murine osteosarcoma viral oncogene homolog 35.3 EGR1 early growth response 1 9.80 ZFP36 zinc finger protein 36 7.48 JUN jun proto-oncogene 3.92 IER2 immediate early response 2 3.22 IER3 immediate early response 3 2.22 KLF6 Kruppel-like factor 6 1.96
Transcription factors
ID3 inhibitor of DNA binding 3 1.84 Cofactors of TF BTG2 B cell translocation gene 2 3.16 PG - prostaglandin, TF - transcription factors
Inflammation and adipogenesis play important roles in the pathogenesis of GO. CYR61 has functions in both processes and showed one of the highest case/control ratios on the microarray. Therefore, we searched for CYR61-responsive genes on the microarray. We found that matrix metalloproteinase 3 (MMP3), interleukin-1 beta (IL-1β), and VEGF were upregulated, which was confirmed with real-time PCR (p<0.05). Expression of CYR61 was also studied in chronic GO and was higher than in controls, but lower than in active GO (p=0.006) with real-time PCR (Figure 7). In summary, adipocyte-related IEGs were overexpressed in GO, and CYR61 was determined to be a marker of disease activity.
0
0,2
0,4
0,6
0,8
1
CY
R61
/CyA
Active Chronic Controls
Figure 7. Expression of CYR61 in active GO (n=5), chronic GO (n=5), and controls (n=5), measured with real-time PCR and normalized to cyclophilin A (CyA). Mean values are represented by horizontal lines. P=0.006 (Kruskal-Wallis).
41
Study II
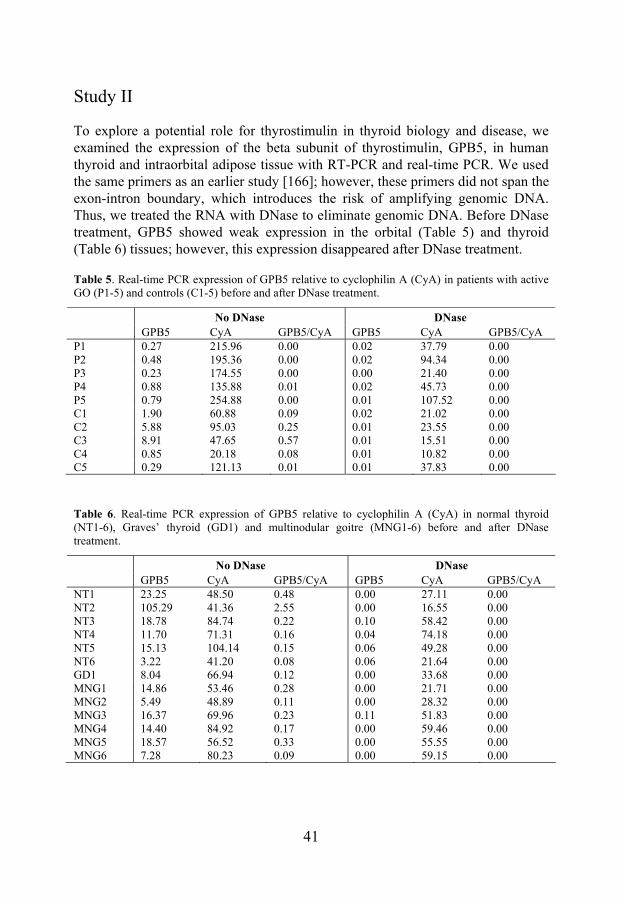
To explore a potential role for thyrostimulin in thyroid biology and disease, we examined the expression of the beta subunit of thyrostimulin, GPB5, in human thyroid and intraorbital adipose tissue with RT-PCR and real-time PCR. We used the same primers as an earlier study [166]; however, these primers did not span the exon-intron boundary, which introduces the risk of amplifying genomic DNA. Thus, we treated the RNA with DNase to eliminate genomic DNA. Before DNase treatment, GPB5 showed weak expression in the orbital (Table 5) and thyroid (Table 6) tissues; however, this expression disappeared after DNase treatment.
Table 5. Real-time PCR expression of GPB5 relative to cyclophilin A (CyA) in patients with active GO (P1-5) and controls (C1-5) before and after DNase treatment.
No DNase DNase
GPB5 CyA GPB5/CyA GPB5 CyA GPB5/CyA P1 0.27 215.96 0.00 0.02 37.79 0.00 P2 0.48 195.36 0.00 0.02 94.34 0.00 P3 0.23 174.55 0.00 0.00 21.40 0.00 P4 0.88 135.88 0.01 0.02 45.73 0.00 P5 0.79 254.88 0.00 0.01 107.52 0.00 C1 1.90 60.88 0.09 0.02 21.02 0.00 C2 5.88 95.03 0.25 0.01 23.55 0.00 C3 8.91 47.65 0.57 0.01 15.51 0.00 C4 0.85 20.18 0.08 0.01 10.82 0.00 C5 0.29 121.13 0.01 0.01 37.83 0.00
Table 6. Real-time PCR expression of GPB5 relative to cyclophilin A (CyA) in normal thyroid (NT1-6), Graves’ thyroid (GD1) and multinodular goitre (MNG1-6) before and after DNase treatment.
No DNase DNase
GPB5 CyA GPB5/CyA GPB5 CyA GPB5/CyA NT1 23.25 48.50 0.48 0.00 27.11 0.00 NT2 105.29 41.36 2.55 0.00 16.55 0.00 NT3 18.78 84.74 0.22 0.10 58.42 0.00 NT4 11.70 71.31 0.16 0.04 74.18 0.00 NT5 15.13 104.14 0.15 0.06 49.28 0.00 NT6 3.22 41.20 0.08 0.06 21.64 0.00 GD1 8.04 66.94 0.12 0.00 33.68 0.00 MNG1 14.86 53.46 0.28 0.00 21.71 0.00 MNG2 5.49 48.89 0.11 0.00 28.32 0.00 MNG3 16.37 69.96 0.23 0.11 51.83 0.00 MNG4 14.40 84.92 0.17 0.00 59.46 0.00 MNG5 18.57 56.52 0.33 0.00 55.55 0.00 MNG6 7.28 80.23 0.09 0.00 59.15 0.00
42
TSHR was used as a positive control and was expressed both before and after DNase treatment in the orbital and thyroid tissues. When a different method, which included a genomic DNA elimination step, was used for cDNA synthesis (QuantiTect Reverse Transcription Kit), we obtained the same results. In agreement with the findings in the human tissues, expression of GPB5 in a commercially available rat thyroid tissue showed expression before, but not after, DNase treatment. In conclusion, we did not detect the expression of GPB5 in intraorbital adipose tissue, normal thyroid tissue, and thyroid tissue from GD or multinodular goitre. The expression of GPB5 in rat thyroid tissue reported previously was not confirmed.
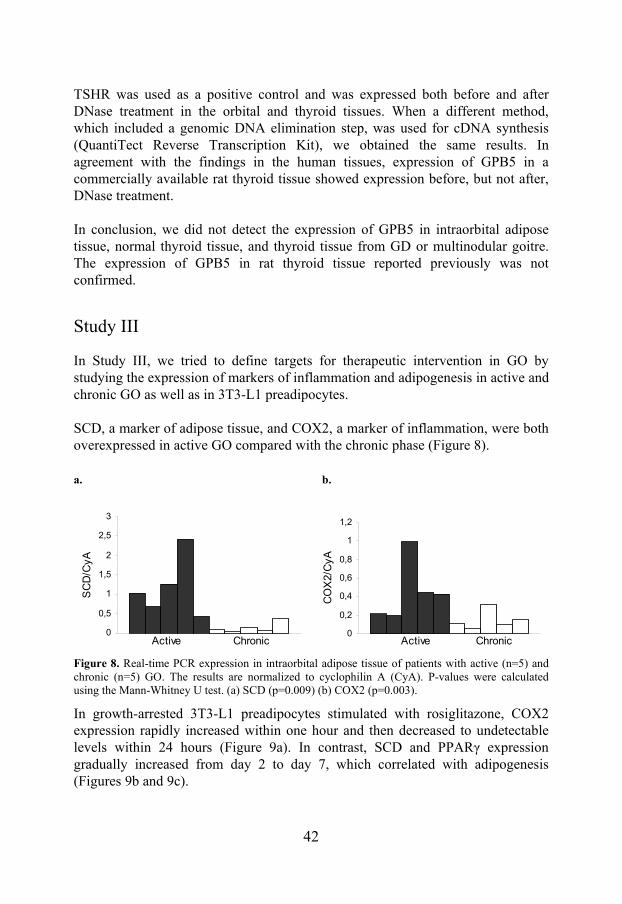
Study III
In Study III, we tried to define targets for therapeutic intervention in GO by studying the expression of markers of inflammation and adipogenesis in active and chronic GO as well as in 3T3-L1 preadipocytes. SCD, a marker of adipose tissue, and COX2, a marker of inflammation, were both overexpressed in active GO compared with the chronic phase (Figure 8). a. b.
Figure 8. Real-time PCR expression in intraorbital adipose tissue of patients with active (n=5) and chronic (n=5) GO. The results are normalized to cyclophilin A (CyA). P-values were calculated using the Mann-Whitney U test. (a) SCD (p=0.009) (b) COX2 (p=0.003).
In growth-arrested 3T3-L1 preadipocytes stimulated with rosiglitazone, COX2 expression rapidly increased within one hour and then decreased to undetectable levels within 24 hours (Figure 9a). In contrast, SCD and PPARγ expression gradually increased from day 2 to day 7, which correlated with adipogenesis (Figures 9b and 9c).
0
0,5
1
1,5
2
2,5
3
SC
D/C
yA
Chronic Active 0
0,2
0,4
0,6
0,8
1
1,2
CO
X2/
CyA
Chronic Active
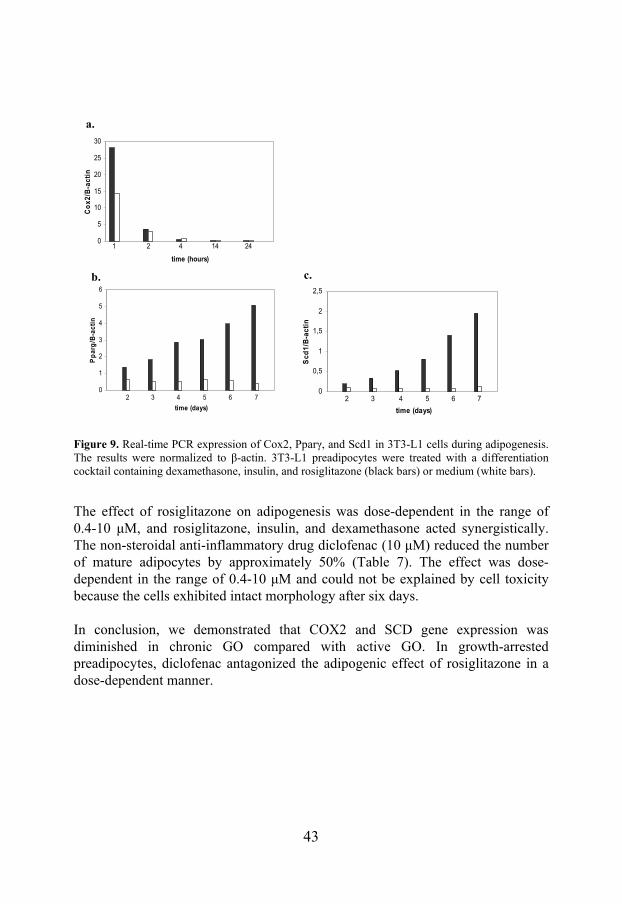
43
Figure 9. Real-time PCR expression of Cox2, Pparγ, and Scd1 in 3T3-L1 cells during adipogenesis. The results were normalized to β-actin. 3T3-L1 preadipocytes were treated with a differentiation cocktail containing dexamethasone, insulin, and rosiglitazone (black bars) or medium (white bars).
The effect of rosiglitazone on adipogenesis was dose-dependent in the range of 0.4-10 μM, and rosiglitazone, insulin, and dexamethasone acted synergistically. The non-steroidal anti-inflammatory drug diclofenac (10 μM) reduced the number of mature adipocytes by approximately 50% (Table 7). The effect was dose-dependent in the range of 0.4-10 μM and could not be explained by cell toxicity because the cells exhibited intact morphology after six days. In conclusion, we demonstrated that COX2 and SCD gene expression was diminished in chronic GO compared with active GO. In growth-arrested preadipocytes, diclofenac antagonized the adipogenic effect of rosiglitazone in a dose-dependent manner.
0
1
2
3
4
5
6
time (days)
Pp
arg
/B-a
ctin
2 3 4 5 6 7
b.
0
0,5
1
1,5
2
2,5
time (days)
Scd
1/B
-act
in
2 3 4 5 6 7
c.
0
5
10
15
20
25
30
time (hours)
Co
x2/B
-act
in
1 2 4 14 24
a.
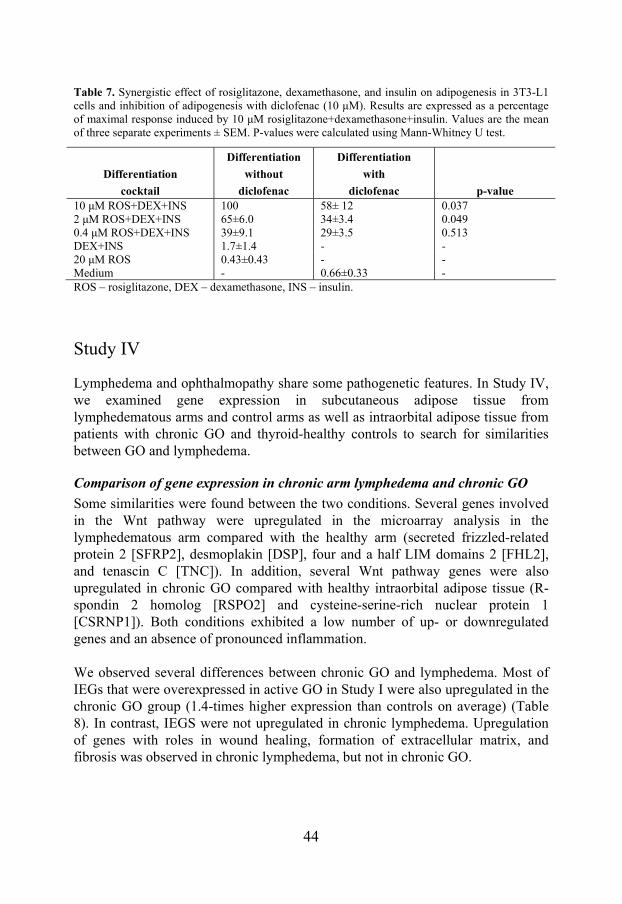
44
Table 7. Synergistic effect of rosiglitazone, dexamethasone, and insulin on adipogenesis in 3T3-L1 cells and inhibition of adipogenesis with diclofenac (10 μM). Results are expressed as a percentage of maximal response induced by 10 μM rosiglitazone+dexamethasone+insulin. Values are the mean of three separate experiments ± SEM. P-values were calculated using Mann-Whitney U test.
Differentiation
cocktail
Differentiation
without
diclofenac
Differentiation
with
diclofenac p-value 10 μM ROS+DEX+INS 100 58± 12 0.037 2 μM ROS+DEX+INS 65±6.0 34±3.4 0.049 0.4 μM ROS+DEX+INS 39±9.1 29±3.5 0.513 DEX+INS 1.7±1.4 - - 20 μM ROS 0.43±0.43 - - Medium - 0.66±0.33 - ROS – rosiglitazone, DEX – dexamethasone, INS – insulin.
Study IV
Lymphedema and ophthalmopathy share some pathogenetic features. In Study IV, we examined gene expression in subcutaneous adipose tissue from lymphedematous arms and control arms as well as intraorbital adipose tissue from patients with chronic GO and thyroid-healthy controls to search for similarities between GO and lymphedema.
Comparison of gene expression in chronic arm lymphedema and chronic GO
Some similarities were found between the two conditions. Several genes involved in the Wnt pathway were upregulated in the microarray analysis in the lymphedematous arm compared with the healthy arm (secreted frizzled-related protein 2 [SFRP2], desmoplakin [DSP], four and a half LIM domains 2 [FHL2], and tenascin C [TNC]). In addition, several Wnt pathway genes were also upregulated in chronic GO compared with healthy intraorbital adipose tissue (R-spondin 2 homolog [RSPO2] and cysteine-serine-rich nuclear protein 1 [CSRNP1]). Both conditions exhibited a low number of up- or downregulated genes and an absence of pronounced inflammation. We observed several differences between chronic GO and lymphedema. Most of IEGs that were overexpressed in active GO in Study I were also upregulated in the chronic GO group (1.4-times higher expression than controls on average) (Table 8). In contrast, IEGS were not upregulated in chronic lymphedema. Upregulation of genes with roles in wound healing, formation of extracellular matrix, and fibrosis was observed in chronic lymphedema, but not in chronic GO.
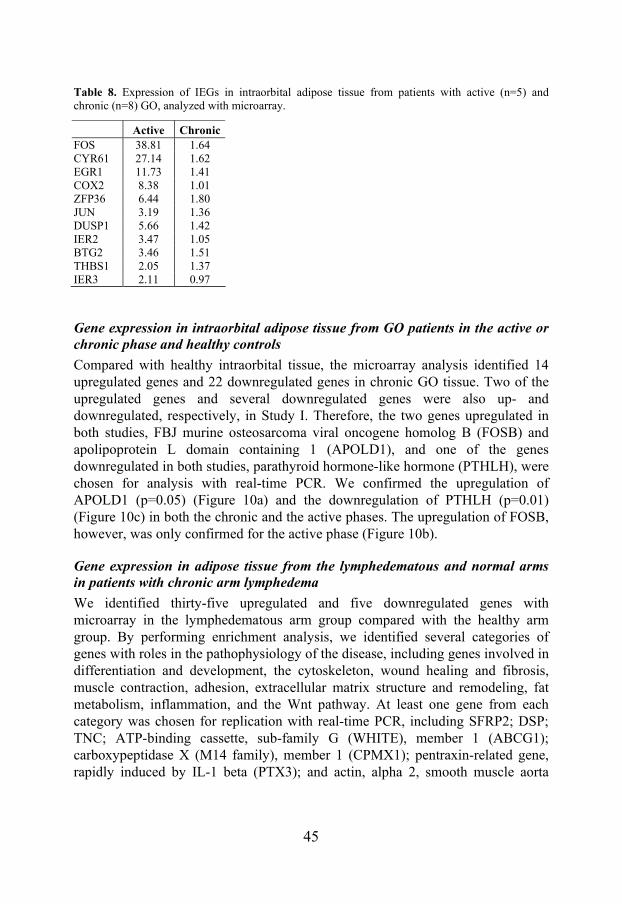
45
Table 8. Expression of IEGs in intraorbital adipose tissue from patients with active (n=5) and chronic (n=8) GO, analyzed with microarray.
Active ChronicFOS 38.81 1.64 CYR61 27.14 1.62 EGR1 11.73 1.41 COX2 8.38 1.01 ZFP36 6.44 1.80 JUN 3.19 1.36 DUSP1 5.66 1.42 IER2 3.47 1.05 BTG2 3.46 1.51 THBS1 2.05 1.37 IER3 2.11 0.97
Gene expression in intraorbital adipose tissue from GO patients in the active or chronic phase and healthy controls
Compared with healthy intraorbital tissue, the microarray analysis identified 14 upregulated genes and 22 downregulated genes in chronic GO tissue. Two of the upregulated genes and several downregulated genes were also up- and downregulated, respectively, in Study I. Therefore, the two genes upregulated in both studies, FBJ murine osteosarcoma viral oncogene homolog B (FOSB) and apolipoprotein L domain containing 1 (APOLD1), and one of the genes downregulated in both studies, parathyroid hormone-like hormone (PTHLH), were chosen for analysis with real-time PCR. We confirmed the upregulation of APOLD1 (p=0.05) (Figure 10a) and the downregulation of PTHLH (p=0.01) (Figure 10c) in both the chronic and the active phases. The upregulation of FOSB, however, was only confirmed for the active phase (Figure 10b).
Gene expression in adipose tissue from the lymphedematous and normal arms in patients with chronic arm lymphedema
We identified thirty-five upregulated and five downregulated genes with microarray in the lymphedematous arm group compared with the healthy arm group. By performing enrichment analysis, we identified several categories of genes with roles in the pathophysiology of the disease, including genes involved in differentiation and development, the cytoskeleton, wound healing and fibrosis, muscle contraction, adhesion, extracellular matrix structure and remodeling, fat metabolism, inflammation, and the Wnt pathway. At least one gene from each category was chosen for replication with real-time PCR, including SFRP2; DSP; TNC; ATP-binding cassette, sub-family G (WHITE), member 1 (ABCG1); carboxypeptidase X (M14 family), member 1 (CPMX1); pentraxin-related gene, rapidly induced by IL-1 beta (PTX3); and actin, alpha 2, smooth muscle aorta
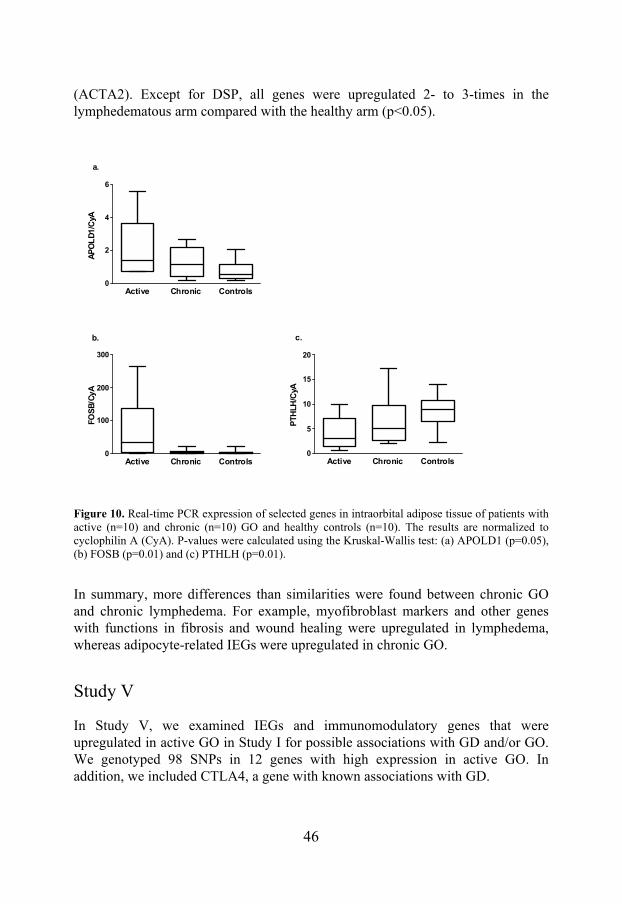
46
(ACTA2). Except for DSP, all genes were upregulated 2- to 3-times in the lymphedematous arm compared with the healthy arm (p<0.05).
Active Chronic Controls0
2
4
6
a.
AP
OL
D1/
CyA
Active Chronic Controls0
100
200
300
b.
FOS
B/C
yA
Active Chronic Controls0
5
10
15
20
c.
PTH
LH/C
yA
Figure 10. Real-time PCR expression of selected genes in intraorbital adipose tissue of patients with active (n=10) and chronic (n=10) GO and healthy controls (n=10). The results are normalized to cyclophilin A (CyA). P-values were calculated using the Kruskal-Wallis test: (a) APOLD1 (p=0.05), (b) FOSB (p=0.01) and (c) PTHLH (p=0.01).
In summary, more differences than similarities were found between chronic GO and chronic lymphedema. For example, myofibroblast markers and other genes with functions in fibrosis and wound healing were upregulated in lymphedema, whereas adipocyte-related IEGs were upregulated in chronic GO.
Study V
In Study V, we examined IEGs and immunomodulatory genes that were upregulated in active GO in Study I for possible associations with GD and/or GO. We genotyped 98 SNPs in 12 genes with high expression in active GO. In addition, we included CTLA4, a gene with known associations with GD.
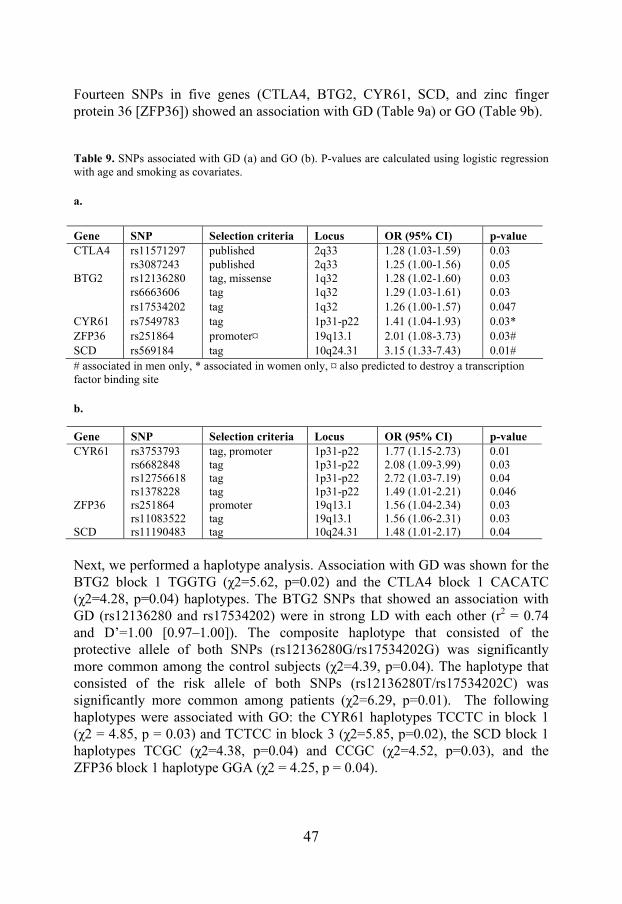
47
Fourteen SNPs in five genes (CTLA4, BTG2, CYR61, SCD, and zinc finger protein 36 [ZFP36]) showed an association with GD (Table 9a) or GO (Table 9b).
Table 9. SNPs associated with GD (a) and GO (b). P-values are calculated using logistic regression with age and smoking as covariates.
a.
# associated in men only, * associated in women only, ¤ also predicted to destroy a transcription factor binding site
b.
Next, we performed a haplotype analysis. Association with GD was shown for the BTG2 block 1 TGGTG (χ2=5.62, p=0.02) and the CTLA4 block 1 CACATC (χ2=4.28, p=0.04) haplotypes. The BTG2 SNPs that showed an association with GD (rs12136280 and rs17534202) were in strong LD with each other (r2 = 0.74 and D’=1.00 [0.97–1.00]). The composite haplotype that consisted of the protective allele of both SNPs (rs12136280G/rs17534202G) was significantly more common among the control subjects (χ2=4.39, p=0.04). The haplotype that consisted of the risk allele of both SNPs (rs12136280T/rs17534202C) was significantly more common among patients (χ2=6.29, p=0.01). The following haplotypes were associated with GO: the CYR61 haplotypes TCCTC in block 1 (χ2 = 4.85, p = 0.03) and TCTCC in block 3 (χ2=5.85, p=0.02), the SCD block 1 haplotypes TCGC (χ2=4.38, p=0.04) and CCGC (χ2=4.52, p=0.03), and the ZFP36 block 1 haplotype GGA (χ2 = 4.25, p = 0.04).
Gene SNP Selection criteria Locus OR (95% CI) p-value CTLA4 rs11571297 published 2q33 1.28 (1.03-1.59) 0.03 rs3087243 published 2q33 1.25 (1.00-1.56) 0.05 BTG2 rs12136280 tag, missense 1q32 1.28 (1.02-1.60) 0.03 rs6663606 tag 1q32 1.29 (1.03-1.61) 0.03 rs17534202 tag 1q32 1.26 (1.00-1.57) 0.047 CYR61 rs7549783 tag 1p31-p22 1.41 (1.04-1.93) 0.03* ZFP36 rs251864 promoter¤ 19q13.1 2.01 (1.08-3.73) 0.03# SCD rs569184 tag 10q24.31 3.15 (1.33-7.43) 0.01#
Gene SNP Selection criteria Locus OR (95% CI) p-value CYR61 rs3753793 tag, promoter 1p31-p22 1.77 (1.15-2.73) 0.01 rs6682848 tag 1p31-p22 2.08 (1.09-3.99) 0.03 rs12756618 tag 1p31-p22 2.72 (1.03-7.19) 0.04 rs1378228 tag 1p31-p22 1.49 (1.01-2.21) 0.046 ZFP36 rs251864 promoter 19q13.1 1.56 (1.04-2.34) 0.03 rs11083522 tag 19q13.1 1.56 (1.06-2.31) 0.03 SCD rs11190483 tag 10q24.31 1.48 (1.01-2.17) 0.04
48
We then tried to replicate our findings in a Polish population. No association between the BTG2 SNP rs12136280 and GD (OR 0.97 [0.82-1.16], p=0.75) or GO (OR 1.05 [0.82-1.33], p=0.71) was observed. In addition, the CYR61 SNP rs3753793 did not show an association with GD (OR 0.96 [0.81-1.14], p=0.62) or GO (OR 1.17 [0.89-1.53], p=0.26). We performed a meta-analysis of the Swedish and Polish studies, and the heterogeneity (I2) and p-values for Cochrane’s Q revealed significant heterogeneity between the two studies; therefore, the random effects model was applied. Neither of the SNPs showed an association with GD or GO in the combined population.
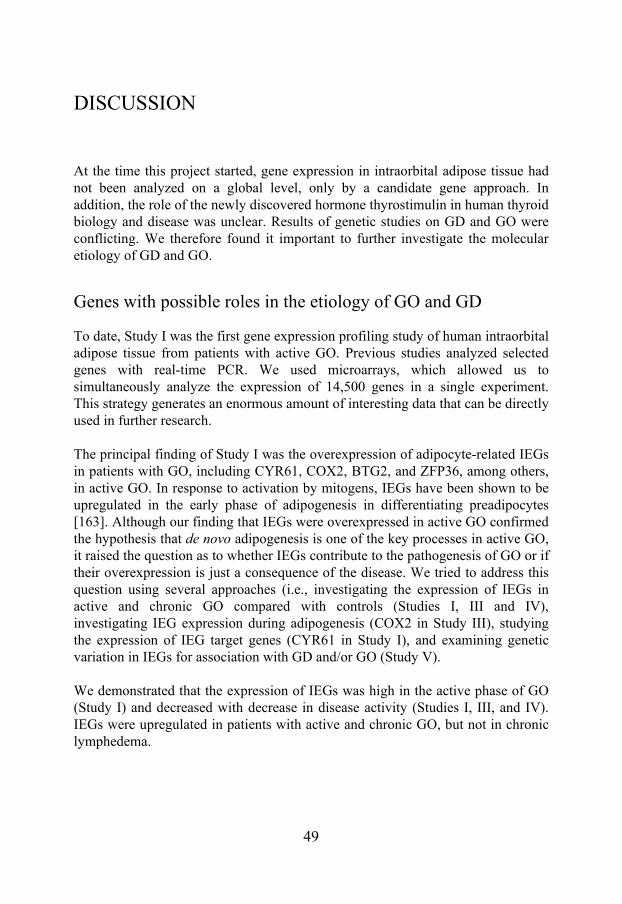
49
DISCUSSION
At the time this project started, gene expression in intraorbital adipose tissue had not been analyzed on a global level, only by a candidate gene approach. In addition, the role of the newly discovered hormone thyrostimulin in human thyroid biology and disease was unclear. Results of genetic studies on GD and GO were conflicting. We therefore found it important to further investigate the molecular etiology of GD and GO.
Genes with possible roles in the etiology of GO and GD
To date, Study I was the first gene expression profiling study of human intraorbital adipose tissue from patients with active GO. Previous studies analyzed selected genes with real-time PCR. We used microarrays, which allowed us to simultaneously analyze the expression of 14,500 genes in a single experiment. This strategy generates an enormous amount of interesting data that can be directly used in further research. The principal finding of Study I was the overexpression of adipocyte-related IEGs in patients with GO, including CYR61, COX2, BTG2, and ZFP36, among others, in active GO. In response to activation by mitogens, IEGs have been shown to be upregulated in the early phase of adipogenesis in differentiating preadipocytes [163]. Although our finding that IEGs were overexpressed in active GO confirmed the hypothesis that de novo adipogenesis is one of the key processes in active GO, it raised the question as to whether IEGs contribute to the pathogenesis of GO or if their overexpression is just a consequence of the disease. We tried to address this question using several approaches (i.e., investigating the expression of IEGs in active and chronic GO compared with controls (Studies I, III and IV), investigating IEG expression during adipogenesis (COX2 in Study III), studying the expression of IEG target genes (CYR61 in Study I), and examining genetic variation in IEGs for association with GD and/or GO (Study V). We demonstrated that the expression of IEGs was high in the active phase of GO (Study I) and decreased with decrease in disease activity (Studies I, III, and IV). IEGs were upregulated in patients with active and chronic GO, but not in chronic lymphedema.
50
CYR61 is a multifunctional gene with roles in adipogenesis, inflammation, cell proliferation, extracellular matrix production, and fibrosis [190-193]. Thus, there are numerous mechanisms by which CYR61 could contribute to the pathogenesis of GO. As an inducer of angiogenesis, CYR61 has been shown to activate a wound healing program in skin fibroblasts by inducing the expression of MMP3, VEGF, and IL-1β, among others [192]. In Study I, we demonstrated that CYR61 and the CYR61-responsive genes MMP3, VEGF, and IL-1β were overexpressed in active GO. In addition, IL-1β has been shown to upregulate COX2 in cultured orbital fibroblasts from patients with GO [194]. One of the target genes of IL-1β, COX2, was also upregulated in GO. Furthermore, four SNPs in CYR61 were associated with GO and one SNP was associated with GD in women in Study V. COX2 is the inducible cyclooxygenase isoform responsible for synthesis of proinflammatory prostaglandins [195]. COX2 may also play an important role in adipocyte differentiation because one of its products, the 15-deoxy-(delta12,14)-prostaglandin J(2) [15d-PGJ(2)], is the natural ligand of PPARγ, the key positive regulator of adipogenesis [196]. Interestingly, COX2 showed much higher expression in GO patients than controls (Study I) despite the fact that the patients had been treated with corticosteroids, which are known to decrease the expression of COX2. Therefore, patients that develop severe GO with DON despite corticosteroid treatment may represent a group that is resistant to corticosteroids. This subgroup of patients may benefit from inhibition of cyclooxygenases by non-steroidal anti-inflammatory drugs (NSAIDs) [195]. NSAIDs are an established treatment for other inflammatory conditions, such as rheumatoid arthritis [197], but little is known about their effect in GO. Only one small, uncontrolled study has previously evaluated the effect of NSAIDs in patients with GO, in which treatment with indomethacin resulted in an improvement of the clinical signs [198]. NSAIDs not only inhibit cyclooxygenases, but they also have the ability to interact with PPARγ. In contrast to other NSAIDs, diclofenac in therapeutic concentrations has the ability to bind to PPARγ and act as a competitive antagonist [199]. Thus, diclofenac may inhibit the two key processes in GO, inflammation and adipogenesis, by inhibiting COX2 and antagonizing PPARγ. The effect of diclofenac on adipogenesis in vitro was evaluated in Study III, and an inhibitory effect was demonstrated because diclofenac reduced the number of mature adipocytes by approximately 50%. Whether the drug has the same effect in patients with GO has not been investigated in this thesis project; however, based on our findings, an ongoing, randomized, multi-center trial of diclofenac has been initiated. BTG2 is a gene with anti-proliferative effects that belongs to the genes differentially expressed between resting and activated mouse T cells [200]. There are several protein families with T cell co-stimulatory properties, including the
51
CD28 family, that promote T cell proliferation. CD28 activation of CD4+ T cells has been shown to result in increased expression of genes involved in cell proliferation and a downregulation of BTG2 and other anti-proliferation genes [201]. Because BTG2 is a downstream target of CD28, it is tempting to speculate that BTG2 could be involved in the inhibition of T cell activation together with other negative regulators of activated T cells associated with GD, such as CTLA4 and PTPN22. In addition, genetic variation in BTG2 could predispose individuals to autoimmunity. Associations between BTG2 and GD were shown in Study V. All the SNPs tested were tag SNPs, which does not rule out the possibility of the causative SNP being in LD with any of the associated SNPs. Interestingly, rs12136280 in BTG2 is a coding SNP, which leads to a change of an aminoacid; thus, it is the most promising candidate. ZFP36 codes for the protein tristetraprolin (TTP) whose function is the destruction of TNFα mRNA [202]. TTP-knockout mice exhibit a severe inflammatory phenotype similar to that of transgenic mice overexpressing TNFα [203], which makes TTP an interesting functional candidate for autoimmunity. Indeed, in a genetic study of autoimmune diseases [204], the SNP ZFP36*8 was significantly associated with rheumatoid arthritis. The promoter SNP rs251864 in ZFP36 was one of the four most important variables separating cases and controls, and the haplotype consisting of rs251864-A/ZFP36*8-T increased the risk for rheumatoid arthritis. In Study V, we demonstrated an association of rs251864 with both GD in men and GO. The rs251864 SNP was predicted to destroy a transcription factor binding site [204], which could potentially alter TTP expression. In summary, adipocyte-related IEGs and their target genes were upregulated in active GO, and this upregulation decreased with decrease in disease activity. Genetic variation in IEGs was associated with GD and GO. These findings suggest a role for adipocyte-related IEGs in the etiology of GO. SCD, a marker of adipose tissue, is an enzyme that catalyzes the rate-limiting step in the synthesis of unsaturated fatty acids [205]. Mice with a targeted disruption of the Scd1 isoform have reduced body adiposity, increased insulin sensitivity and are resistant to diet-induced weight gain [206]. In addition, genetic variation in the SCD gene is associated with body-fat distribution and insulin sensitivity in Swedish men [207]. In Studies I and III, we demonstrated that SCD was overexpressed in active GO, and its expression decreased with decrease in disease activity. In differentiating preadipocytes, SCD expression gradually increased concomitantly with adipogenesis. Study V showed associations of SNPs in SCD with GD and GO. The risk variant associated with GO could potentiate adipogenesis, which is one of the key pathogenetic processes in GO. The possible link between SCD polymorphisms and GD, however, is less clear.
52
Figure 11. Expression of immediate early genes (IEGs) and stearoyl-coenzyme A desaturase (SCD) during adipogenesis in vitro.
GO and lymphedema share some pathogenetic features, such as inflammation, accumulation of hyaluronan (which attracts water and causes edema), excessive fat accumulation, and fibrosis [158, 159, 208, 209]. In Study IV, we investigated similarities and differences between the two conditions by performing the first large-scale expression profiling of chronic human lymphedema and chronic GO. Some similarities were found between chronic GO and chronic arm lymphedema, such as low activity (i.e., a low number of up- or downregulated genes) and the absence of pronounced inflammation. The main differences between GO and lymphedema seem to be the absence of active adipogenesis and the presence of fibrosis in chronic lymphedema. Patients with chronic arm lymphedema following breast cancer treatment were shown to have excess adipose tissue by volume-rendered computed tomography and dual energy X-ray absorptiometry [159]; however, we did not observe upregulation of any key genes involved in adipogenesis in lymphedema. Adipocyte-related IEGs, which were upregulated in active GO and, to a lesser degree, in chronic GO, were not upregulated in lymphedema. These results suggest that active adipogenesis ceased in chronic lymphedema, and excess adipose tissue may have resulted from active adipogenesis at earlier stages. An interesting observation is the downregulation of PTHLH in both active and chronic GO, but not in lymphedema. Unlike parathyroid hormone, which has systemic hormonal effects, PTHLH is a multifunctional protein that may have evolved to regulate local tissue functions. One function of PTHLH is the inhibition of adipogenesis [210, 211]. Therefore, downregulation of PTHLH may promote adipogenesis.
Growth arrested
preadipocytes
TerminalDifferentiation
Phase
Matureadipocytes
Clonal Expansion
Phase
Growth ArrestPhase
1-2 days 3-4 days 4-10 days
↑ IEGs
Mitogen
↑SCD
Growth arrested
preadipocytes
TerminalDifferentiation
Phase
Matureadipocytes
Clonal Expansion
Phase
Growth ArrestPhase
1-2 days 3-4 days 4-10 days
↑ IEGs↑ IEGs
Mitogen
↑SCD↑SCD
53
TSHR is overexpressed in orbital tissues of patients with active GO compared to controls [114, 115]. In orbital fibroblasts transfected with an activated mutant TSH construct, both early adipocyte differentiation and hyaluronan production was stimulated [117, 118]. We speculated that the recently discovered TSH-like hormone, thyrostimulin, could play a role as a locally acting factor in orbital adipogenesis by stimulating TSHR. However, we could not detect the expression of the beta subunit of thyrostimulin in healthy or diseased human thyroid tissue, orbital tissue or rat thyroid tissue. The negative findings in the thyroid were confirmed by others, both for the human [165, 168, 212] and the rat [168, 213], which suggested that GPB5 is probably not expressed in the thyroid. What is the role of thyrostimulin? Several studies have suggested a role during development. Indeed, GPB5 has been shown to be widely distributed in Amphioxus embryos [169] and abundantly expressed in newborn mice [170]. Juvenile euthyroid and thyrotoxic GPB5 knockout mice were found to have 25% lower serum T4 compared with wild-type, and juvenile hypothyroid GPB5 knockout mice had 2.5-times lower pituitary TSH beta expression compared with wild-type mice. These alterations were not observed in adult mice, which did not exhibit an overt endocrine phenotype [171]. Proinflammatory cytokines have been shown to induce the expression of GPB5 in a pituitary cell line [167], and a very recent study demonstrated an in vivo role for GPB5 in pituitary and hypothalamic TSHR suppression and hypothalamic deiodinase 2 induction during acute illness [214]. In summary, the current knowledge about thyrostimulin supports the hypothesis that it plays a role during development and acute illness. In addition, thyrostimulin appears to act on the pituitary or hypothalamus rather than the thyroid.
Methodology
Several methodological issues need to be discussed. In the microarray studies, no microdissection of the intraorbital adipose tissue was performed; therefore, the source of RNA was represented by several cell populations. Thus, we did not determine which cell types were responsible for the up- or downregulated genes. In addition, the microarray experiments involved a limited number of patients and controls, and the samples were pooled prior to analysis. Pooling of samples reduces the amount of RNA needed for the experiment, which is an advantage when dealing with small amounts of material, such as the control tissues in our studies. Moreover, pooling the samples lowers the costs of these expensive experiments. The disadvantage of pooled data is that genes of interest can only be selected based on the magnitude of change. When individual samples are used, genes may also be selected on the basis of the significance of changes in expression. This allows for the selection of genes that have small but statistically significant changes in abundance and eliminates genes with changes in expression
54
level that are large but not statistically significant (i.e., false-positives) [215]. We confirmed all important results, however, with at least two real-time PCR experiments. At the same time as Study I, another microarray study of GO was published [111]. We were not able to observe the overexpression of some of the genes upregulated in this study, such as secreted frizzled-related protein-1 (SFRP1). Possible explanations include the use of different control tissues (Kumar et al. used intraorbital fat biopsies from autopsied individuals) or the fact that only six out of the twenty patients in their study had been treated with corticosteroids (all patients in our study were treated with corticosteroids). In the in vitro experiments on adipogenesis, a mouse preadipocyte cell line was used, which was found to be a good model for the study of possible therapeutical targets in adipogenesis. For studies focusing specifically on preadipocytes in GO, however, cultured orbital fibroblasts may represent a more suitable model. In the Swedish case/control association study, we demonstrated associations of SNPs in CTLA4, BTG2, CYR61, ZFP36, and SCD with GD and/or GO. In the Polish material, however, we were not able to replicate the association between the BTG2 SNP rs12136280 and GD or the association of the CYR61 SNP rs3753793 with GO. Furthermore, the meta-analysis of the two studies was not significant. There may be several reasons for this discrepancy. For example, the reported associations might represent false-positive findings. Our study, which counted 312 cases and 621 controls, was in line with most association studies for GD; however, recent research has shown that larger numbers of individuals are needed to avoid false-positive results. The effect size reported in the Swedish cohort could also be overinflated because of the winners curse [216]. The Polish material, however, was not sex-matched. Moreover, adjustments for age and smoking could not be made in the Polish sample because of a lack of phenotypic data in the control group. Furthermore, results of the meta-analysis suggested heterogeneity between the populations, which means that the Polish cohort may not have been the optimal population to use for replication. In addition, the Swedish cohort had the advantage of being phenotypically well defined, the candidate genes were chosen on the basis of expression data in the same population, and the associated genes were biologically relevant for the disease. Therefore, the failure to replicate the results does not mean that our findings are untrue. Replication in a different, larger and well-characterized population, however, is required.
Future challenges
Future research in the field of GO will certainly focus on novel therapies for GO. Indeed, randomized clinical trials of promising drugs, such as rituximab, are
55
already ongoing [106]. Although the effect of smoking on GO is strong and well documented, the mechanism by which smoking influences GO is poorly investigated and should be further explored. In clinical practice, smoking cessation should become an essential part of the management of patients with GO. Regarding the genetics of AITD, it is clear that not all of the susceptibility genes have been identified. The field of genetics of complex diseases has been revolutionized by GWAS, which can scan the entire genome for association. Indeed, GWAS has been successful in other complex autoimmune diseases, such as type 1 diabetes, rheumatoid arthritis, and psoriasis [35]. So far, no full GWAS has been reported in AITD, but it will certainly be performed in the future. Except for the HLA-DR, all other loci associated with AITD had minor effects with OR values <1.5. The current dogma is that numerous common variants with small effects can cause an additive strong genetic effect on individual susceptibility. This dogma, however, is not able to explain the high prevalence of AITD in the general population due to a low frequency of the combined genotypes in the general population [32]. A better explanation than the additive model might be an interaction between the susceptibility genes and an interaction between the genes and the environment. These questions, however, remain unanswered. According to the subset effect model, a genetic variant might have a large effect in a subset of GD patients, but this effect will be diluted when testing the whole GD population or different populations [32]. Thus, we might see two parallel approaches in the future: one examining large cohorts of patients from different populations to ascertain adequate power, and a second approach studying smaller, but phenotypically well-defined, populations. Future challenges will also include investigation of the role of rare variants by next-generation sequencing of large segments of the genome. In addition, the field of epigenetics remains unexplored in AITD. All these efforts will hopefully lead to the possibility of offering individuals a genetic risk assessment and a prediction of response to medications, which will represent a truly individualized approach to the treatment of complex diseases like GD and GO.
56
CONCLUSIONS
Adipocyte-related IEGs, including CYR61, COX2, BTG2, ZFP36, EGR1, and DUSP1, were overexpressed in active GO and to a lesser degree in chronic GO, but not in chronic lymphedema. CYR61-responsive genes were also upregulated in active GO. Associations were found between SNPs in CYR61, BTG2, and ZFP36 and GD and/or GO. These findings support a role for IEGs in the pathogenesis of GO. Inflammation and adipogenesis decreased with decreased disease activity in GO, which was demonstrated by the expression patterns of COX2, CYR61, and SCD in active and chronic GO. The anti-inflammatory drug diclofenac inhibited adipogenesis in vitro. These results suggest that diclofenac may be a therapeutic alternative for GO. We were not able to detect expression of GPB5 in human healthy and diseased orbital or thyroid tissue. These findings argue against the role of thyrostimulin in human thyroid physiology and disease. In chronic arm lymphedema, the expression pattern involved upregulation of genes with roles in wound healing, formation of extracellular matrix, and fibrosis. Interestingly, genes involved in early adipogenesis, such as IEGs, were not upregulated. This finding was in contrast to GO, where adipogenesis genes were upregulated and followed the disease activity, but genes related to fibrosis were not upregulated. To summarize, we found more differences than similarities between chronic arm lymphedema and chronic GO. We replicated the previously reported association between two SNPs in CTLA4 and GD in the Swedish population. The results of the Swedish case/control study showed associations of SNPs in BTG2, CYR61, ZFP36, and SCD with GD and/or GO. In the Polish cohort, however, rs12136280 in BTG2 and rs3753793 in CYR61 were not associated with GD or GO, and the meta-analysis was not significant. The demonstrated associations need to be replicated in a larger, homogenous population before they can be considered to be true.
57
POPULÄRVETENSKAPLIG SAMMANFATTNING
Graves sjukdom är en autoimmun sjukdom som framförallt drabbar kvinnor. Antikroppar riktade mot TSH-receptorn på sköldkörteln stimulerar sköldkörteln till ökad hormonsyntes och struma. Vid Graves sjukdom förekommer ögonsymtom, så kallad endokrin oftalmopati, hos upp till en tredjedel av patienterna och 5 % utvecklar svår, synhotande oftalmopati. Symtom på oftalmopati kvarstår ofta under lång tid, ibland flera år, och upplevs som mycket handikappande. Behovet av att utveckla och pröva nya terapier är stort då de befintliga behandlingsmetoderna alla är förknippade med biverkningar. Mekanismerna bakom endokrin oftalmopati är bara delvis kända. Syftet med denna avhandling var att studera uppkomstmekanismer vid Graves sjukdom och endokrin oftalmopati på molekylär nivå för att bidra till ökad kunskap om dessa tillstånd och hitta nya behandlingsstrategier vid endokrin oftalmopati. I Studie I undersöktes vilka gener som är av betydelse för patogenesen av endokrin oftalmopati. Genuttryck i fettet bakom ögat (intraorbitalt fett) jämfördes med hjälp av microarray och realtids-PCR mellan patienter opererade för svår oftalmopati i aktiv fas och friska kontroller som genomgick ögonlocksplastik. Vi har fokuserat på gener med viktiga roller i fettbildningen, som är en nyckelprocess vid endokrin oftalmopati. Vi har identifierat 14 så kallade "immediate early genes" bland generna med mer än två gånger högre uttryck hos patienter jämfört med kontroller, däribland CYR61, COX2, BTG2, ZFP36, EGR1 och DUSP. Dessa gener har tidigare visat sig vara uppreglerade i fettbildningens tidiga fas in vitro. Även gener reglerade av CYR61 såsom MMP3, VEGF och IL-1β var uppreglerade i patientgruppen och uttrycket av CYR61 minskade i kronisk fas av oftalmopati jämfört med akut fas. Nyligen har ett nytt hormon, thyrostimulin, identifierats. Hos råtta har man visat att thyrostimulin kan aktivera TSH-receptorn både in vitro och in vivo, och således skulle kunna vara av betydelse för patogenesen av Graves sjukdom och endokrin oftalmopati. En förutsättning är dock att hormonet produceras lokalt då man inte kunnat påvisa thyrostimulin i cirkulationen. I Studie II studerades genuttryck av thyrostimulin med RT-PCR och realtids-PCR i sköldkörtel och intraorbitalt fett. Vi har inte kunnat påvisa signifikant genuttryck i sköldkörteln eller det intraorbitala fettet vare sig hos friska individer eller hos individer med Graves sjukdom, endokrin oftalmopati eller multinodös struma. Vi har inte heller kunnat bekräfta det tidigare rapporterade genuttrycket i sköldkörteln hos råtta.
58
Två viktiga patogenetiska processer vid oftalmopati är inflammation och fettbildning. I Studie III studerades genuttryck av markören för inflammation, COX2, och markören av fettbildningen, SCD, i akut och kronisk fas av oftalmopati med realtids-PCR. Vi har visat att genuttrycken av båda generna minskar i kronisk fas. Vidare har vi odlat 3T3-L1-preadipocyter, celler som har potential att differentieras till mogna fettceller. Vi har kunnat visa att COX2 uppregleras i fettbildningens tidiga fas, medan SCD uppregleras mellan dag 2 och dag 7. Läkemedlet diklofenak har antiinflammatoriska egenskaper genom sin hämning av COX1 och COX2 och har dessutom visat sig kunna interagera med fettbildningens nyckelgen, PPARγ, i terapeutiska koncentrationer. Således skulle diklofenak kunna hämma både inflammation och fettbildning som båda är viktiga processer vid endokrin oftalmopati. I ljuset av detta skulle diklofenak kunna utgöra ett behandlingsalternativ vid oftalmopati. I Studie III har vi visat att fettbildningen i 3T3-L1-celler kan hämmas med diklofenak, som minskade antal mogna celler med 50 %. Dessa resultat har genererat en pågående multicenterstudie med diklofenak som förebyggande behandling mot endokrin oftalmopati hos patienter med nydiagnostiserad Graves sjukdom. Både vid endokrin oftalmopati och lymfödem dominerar ödem, inflammation och fettbildning i tidig fas, medan fibrosutveckling förekommer i kronisk fas. Teorier finns om eventuella gemensamma patogenetiska mekanismer vid oftalmopati och lymfödem men inga studier har hittills gjorts för att bekräfta det. I Studie IV undersöktes om gemensamma patogenetiska mekanismer vid endokrin oftalmopati och lymfödem föreligger genom studier av genuttryck med microarray och realtids-PCR. Vi jämförde intraorbitalt fett från opererade patienter med endokrin oftalmopati i kronisk fas och från friska kontroller som genomgick ögonlocksplastik. Från individer som utvecklat armlymfödem efter bröstcancerbehandling har underhudsfett både från den drabbade och från den friska armen som kontroll analyserats. Vi har identifierat ett antal gener med högt uttryck i både lymfödem och oftalmopati jämfört med kontroller, med potentiellt viktiga funktioner i båda sjukdomsprocesserna. Fler skillnader än likheter förelåg mellan dessa tillstånd. "Immediate early genes", en grupp av gener som var uppreglerade i aktiv oftalmopati jämfört med friskt intraorbitalt fett i Studie I, var i mindre grad uppreglerade i kronisk oftalmopati, men inte i lymfödem jämfört med friskt underhudsfett. I lymfödem, men inte i kronisk oftalmopati, har gener med funktioner i sårläkning och fibros identifierats som uppreglerade. I Studie IV har vi också visat att PTHLH, en gen med funktioner i fettbildning, är nedreglerad både vid aktiv och vid kronisk endokrin oftalmopati vilket skulle kunna tala för ökad risk för fettbildning hos de patienter med Graves sjukdom som drabbas av oftalmopati.
59
Både omgivnings- och genetiska faktorer bidrar till utveckling av Graves sjukdom. Ett sätt att söka efter orsaker till varför Graves sjukdom utvecklas är att leta efter genetiska varianter, såsom ”single nucleotide polymorphisms” (SNPs), som ökar risken för Graves sjukdom. Ett antal gener har tidigare visat sig bidra till utvecklingen av Graves sjukdom i olika material men vad gäller endokrin oftalmopati har resultaten varit inkonklusiva varför ytterligare genetiska studier behövs. Uppbyggande av en biobank (GD2002) med serum, plasma och ”buffy coat” för RNA- och DNA-analyser pågår i Malmö sedan 2002. Kliniska data på patienter lagras kontinuerligt i en databas. I Studie V har 312 patienter med Graves sjukdom med eller utan oftalmopati från GD2002-databasen jämförts med 621 kontroller från Malmö (Malmö Kost Cancer studien) avseende 98 SNPs i 13 gener. Vi har valt att studera de gener som visade högt uttryck i aktiv oftalmopati i Studie I, däribland flera "immediate early genes". Vi har också analyserat SNPs i CTLA4, en gen som tidigare visat sig öka risken för utveckling av Graves sjukdom i andra populationer. Två SNPs i CTLA4 och ett flertal SNPs i BTG2, CYR61, ZFP36 och SCD ökade risken för utveckling av Graves sjukdom, medan SNPs i CYR61, ZFP36 och SCD ökade risken för utveckling av oftalmopati. Vi har dessutom försökt att bekräfta våra resultat genom att studera samband mellan två SNPs, en SNP i BTG2 och en SNP i CYR61, och Graves sjukdom och/eller oftalmopati, i ett Polskt material. Vi har inte kunnat bekräfta de påvisade sambanden i det Polska materialet och en metaanalys av de två studierna var inte signifikant. Det har dock visat sig att de två materialen inte är homogena och det är därför svårt att dra slutsatser om de påvisade sambanden är sanna eller falskt positiva fynd. Sammanfattningsvis har vi i denna avhandling visat att
I. ”immediate early genes” med funktioner i fettbildning och inflammation var uppreglerade vid endokrin oftalmopati men inte vid lymfödem, och deras uttryck sjönk med sjukdomsaktiviteten. SNPs i dessa gener ökade risken för Graves sjukdom och endokrin oftalmopati. Dessa fynd stödjer hypotesen att ”immediate early genes” är av betydelse för utvecklingen av endokrin oftalmopati.
II. det antiinflammatoriska läkemedlet diklofenak hämmade fettbildning in vitro och är därför en intressant terapeutisk kandidat vid endokrin oftalmopati.
III. det fanns fler skillnader än likheter mellan kronisk endokrin oftalmopati och lymfödem. Kroniskt lymfödem dominerades av fibros, medan gener med funktioner i fettbildning, såsom ”immediate early genes”, var uppreglerade vid kronisk oftalmopati.
IV. det nyupptäckta hormonet thyrostimulin inte uttrycktes i frisk eller sjuk sköldkörtel eller intraorbitalt fett hos människa, och sannolikt

60
saknar viktig roll för sköldkörtelns funktion eller uppkomst av Graves sjukdom.
V. SNPs i gener som var högt uttryckta vid endokrin oftalmopati ökade risken för utveckling av Graves sjukdom och/eller endokrin oftalmopati hos Malmös befolkning men dessa resultat måste bekräftas i ett annat material.

61
ACKNOWLEDGEMENTS
I would like to thank the following people for making the completion of this thesis possible: Mikael Lantz, my main supervisor, who introduced me to the world of science and endocrinology. You provided me with an equal share of independence and careful guidance and I enjoyed working with you very much. Bengt Hallengren, my co-supervisor and clinical mentor. Thank you for being a very pedagogical, patient and kind teacher. I have learned a lot from you. Leif Groop, my co-supervisor. I admire your enthusiasm and your ability to look at problems the way nobody else does and create an extremely inspiring working environment. Stefan Lamme and Katharina Ornstein, my bosses in the Hässleholm hospital, who have supported me throughout the years in both my clinical and scientific carrier and allowed me to use as much time as I needed for research. Anders Sjöholm, my clinical mentor. Thank you for many long and fruitful clinical and non-clinical discussions. My co-authors: Peter Åsman, Håkan Brorson, Magnus Åberg, Tuve Mårtensson, Christofer Frenander, Martin Ridderstråle, Annika de Capretz, Emma Nilsson, Anne-Greth Bondeson, Konrad Szymanski, Tomasz Bednarczuk, and Rafal Ploski, thank you for a smooth collaboration and your help with the manuscript preparations. Big thanks to all the present and past fellow PhD students. I would like to especially thank Marketa – it seems that anytime something important happened in my life in the past few years, whether it be a wedding or thesis writing, you have been involved and helped me out. I would also like to thank Lovisa for her friendship and always finding time to discuss my problems in the lab; Hemang for enormous help with the microarray data analysis and all the fun at work; and Eka for being a wonderful colleague and friend, and for making the whole house shake with her laughter. To Tina, Maja, Anna J., Yuedan, Anders, Beatrice, Caroline, Anastasia, Mozghan, Targ, Eero, Nael, Charlotta, Lina, Martins, Avinash, Emma

62
N., Johan Ho., Maria, Camilla, Fredrik, Charlotte G., and Jenny, I have both learned a lot and had great fun working with you all. The other co-workers in the lab: my room-mate Charlotte L., for uncountable discussions. Peter A. and Claes, for guidance in statistical issues; Johan Hu. for solving computer problems; June and Ulrika for assistance with administrative tasks; Margareta, Anna B., Esa, Malin S., Lena, Mona, and Malin N. for technical help; and Corrado, Marju, Olle, Valeriya, Ola, Peter O., Marloes, and Emma A., for creating a nice working environment. I am grateful to my collegues in the Hässleholm and Malmö hospitals for sharing the ups and downs of clinical work. I also want to thank my loving, caring, and generous parents, Hana & Ivan, and my sister, Anna, for always believing in me and for supporting me in whatever I set my mind to. This thesis is dedicated to my grandmother Margita. Still interested in science when almost ninety, you taught me to be stubborn and believe in my brain. It’s a pity you cannot see this book. All my friends and family, for being there for me when things don’t work and helping me keep my priorities straight. My husband’s family – Birgitta, Magnus, Maria, Erik, Axel, Amanda, and Alma, I am very glad to have become part of the clan! You give me the sense of belonging in a foreign country, help with all sorts of practical issues and, most importantly, often make me laugh! Joakim, my wonderful husband, this thesis would never be completed without your love, support, and sense of humor. My daughter Julia, thank you for being an everlasting source of joy. Finally, I must thank all of the patients that agreed to participate in our studies.
63
REFERENCES
1. Nabipour, I., et al. (2009) Avicenna, the first to describe thyroid-related orbitopathy. Thyroid. 19: 7-8
2. Lindholm, J. and P. Laurberg (2010) Hyperthyroidism, exophthalmos, and goiter: historical notes on the orbitopathy. Thyroid. 20: 291-300
3. Weetman, A.P. (2000) Graves' disease. N Engl J Med. 343: 1236-48 4. Abraham-Nordling, M., et al. (2008) Incidence of hyperthyroidism in
Stockholm, Sweden, 2003-2005. Eur J Endocrinol. 158: 823-7 5. Lantz, M., et al. (2009) Immigration and the incidence of Graves'
thyrotoxicosis, thyrotoxic multinodular goiter and solitary toxic adenoma. Eur J Endocrinol. 160: 201-6
6. Vestergaard, P., et al. (2002) Smoking as a risk factor for Graves' disease, toxic nodular goiter, and autoimmune hypothyroidism. Thyroid. 12: 69-75
7. Strieder, T.G., et al. (2003) Risk factors for and prevalence of thyroid disorders in a cross-sectional study among healthy female relatives of patients with autoimmune thyroid disease. Clin Endocrinol (Oxf). 59: 396-401
8. Ando, T., et al. (2002) Intrathyroidal fetal microchimerism in Graves' disease. J Clin Endocrinol Metab. 87: 3315-20
9. Brix, T.H., et al. (2005) High frequency of skewed X-chromosome inactivation in females with autoimmune thyroid disease: a possible explanation for the female predisposition to thyroid autoimmunity. J Clin Endocrinol Metab. 90: 5949-53
10. Ozcelik, T., et al. (2006) Evidence from autoimmune thyroiditis of skewed X-chromosome inactivation in female predisposition to autoimmunity. Eur J Hum Genet. 14: 791-7
11. Yin, X., et al. (2007) Thyroid epigenetics: X chromosome inactivation in patients with autoimmune thyroid disease. Ann N Y Acad Sci. 1110: 193-200
12. Winsa, B., et al. (1991) Stressful life events and Graves' disease. Lancet. 338: 1475-9
13. Hancock, S.L., et al. (1991) Thyroid diseases after treatment of Hodgkin's disease. N Engl J Med. 325: 599-605
14. Nygaard, B., et al. (1999) Transition of nodular toxic goiter to autoimmune hyperthyroidism triggered by 131I therapy. Thyroid. 9: 477-81
15. Gilquin, J., et al. (1998) Delayed occurrence of Graves' disease after immune restoration with HAART. Highly active antiretroviral therapy. Lancet. 352: 1907-8
16. Prummel, M.F. and P. Laurberg (2003) Interferon-alpha and autoimmune thyroid disease. Thyroid. 13: 547-51
64
17. Coles, A.J., et al. (1999) Pulsed monoclonal antibody treatment and autoimmune thyroid disease in multiple sclerosis. Lancet. 354: 1691-5
18. Tomer, Y. and A. Huber (2009) The etiology of autoimmune thyroid disease: a story of genes and environment. J Autoimmun. 32: 231-9
19. Laurberg, P., et al. (1998) Iodine intake and the pattern of thyroid disorders: a comparative epidemiological study of thyroid abnormalities in the elderly in Iceland and in Jutland, Denmark. J Clin Endocrinol Metab. 83: 765-9
20. Laurberg, P., et al. (2010) Iodine intake as a determinant of thyroid disorders in populations. Best Pract Res Clin Endocrinol Metab. 24: 13-27
21. Laurberg, P., et al. (1991) High incidence of multinodular toxic goitre in the elderly population in a low iodine intake area vs. high incidence of Graves' disease in the young in a high iodine intake area: comparative surveys of thyrotoxicosis epidemiology in East-Jutland Denmark and Iceland. J Intern Med. 229: 415-20
22. Roti, E. and E.D. Uberti (2001) Iodine excess and hyperthyroidism. Thyroid. 11: 493-500
23. Andersson, M., et al. (2009) Adequate iodine nutrition in Sweden: a cross-sectional national study of urinary iodine concentration in school-age children. Eur J Clin Nutr. 63: 828-34
24. Prummel, M.F., et al. (2004) The environment and autoimmune thyroid diseases. Eur J Endocrinol. 150: 605-18
25. Stagnaro-Green, A., et al. (1992) A prospective study of lymphocyte-initiated immunosuppression in normal pregnancy: evidence of a T-cell etiology for postpartum thyroid dysfunction. J Clin Endocrinol Metab. 74: 645-53
26. Vestergaard, P. (2002) Smoking and thyroid disorders--a meta-analysis. Eur J Endocrinol. 146: 153-61
27. Holm, I.A., et al. (2005) Smoking and other lifestyle factors and the risk of Graves' hyperthyroidism. Arch Intern Med. 165: 1606-11
28. Wiersinga, W.M. and L. Bartalena (2002) Epidemiology and prevention of Graves' ophthalmopathy. Thyroid. 12: 855-60
29. (2003) The International HapMap Project. Nature. 426: 789-96 30. Feuk, L., et al. (2006) Structural variation in the human genome. Nat Rev
Genet. 7: 85-97 31. Jacobson, E.M. and Y. Tomer (2007) The genetic basis of thyroid
autoimmunity. Thyroid. 17: 949-61 32. Tomer, Y. (2010) Genetic susceptibility to autoimmune thyroid disease:
past, present, and future. Thyroid. 20: 715-25 33. Colhoun, H.M., et al. (2003) Problems of reporting genetic associations
with complex outcomes. Lancet. 361: 865-72 34. Johnson, G.C., et al. (2001) Haplotype tagging for the identification of
common disease genes. Nat Genet. 29: 233-7
65
35. Hindorff, L.A., et al. A Catalog of Published Genome-Wide Association Studies. Available at: www.genome.gov/gwastudies. Accessed September 29, 2010.
36. Brix, T.H., et al. (2001) Evidence for a major role of heredity in Graves' disease: a population-based study of two Danish twin cohorts. J Clin Endocrinol Metab. 86: 930-4
37. Davies, T.F. (2007) Really significant genes for autoimmune thyroid disease do not exist--so how can we predict disease? Thyroid. 17: 1027-9
38. Sakai, K., et al. (2001) Identification of susceptibility loci for autoimmune thyroid disease to 5q31-q33 and Hashimoto's thyroiditis to 8q23-q24 by multipoint affected sib-pair linkage analysis in Japanese. Hum Mol Genet. 10: 1379-86
39. Akamizu, T., et al. (2003) Association study of autoimmune thyroid disease at 5q23-q33 in Japanese patients. J Hum Genet. 48: 236-42
40. Jin, Y., et al. (2003) Genome-wide scan of Graves' disease: evidence for linkage on chromosome 5q31 in Chinese Han pedigrees. J Clin Endocrinol Metab. 88: 1798-803
41. Hiromatsu, Y., et al. (2006) Interleukin-12B gene polymorphism does not confer susceptibility to Graves' ophthalmopathy in Japanese population. Endocr J. 53: 753-9
42. Hiromatsu, Y., et al. (2005) Interleukin-13 gene polymorphisms confer the susceptibility of Japanese populations to Graves' disease. J Clin Endocrinol Metab. 90: 296-301
43. Yang, Y., et al. (2005) Association study between the IL4, IL13, IRF1 and UGRP1 genes in chromosomal 5q31 region and Chinese Graves' disease. J Hum Genet. 50: 574-82
44. Chu, X., et al. (2009) Polymorphisms in the interleukin 3 gene show strong association with susceptibility to Graves' disease in Chinese population. Genes Immun. 10: 260-6
45. Chu, X., et al. (2009) Polymorphisms in the ADRB2 gene and Graves disease: a case-control study and a meta-analysis of available evidence. BMC Med Genet. 10: 26
46. Simmonds, M.J., et al. (2010) Confirmation of association of chromosome 5q31-33 with United Kingdom Caucasian Graves' disease. Thyroid. 20: 413-7
47. Song, H.D., et al. (2009) Functional SNPs in the SCGB3A2 promoter are associated with susceptibility to Graves' disease. Hum Mol Genet. 18: 1156-70
48. Burton, P.R., et al. (2007) Association scan of 14,500 nonsynonymous SNPs in four diseases identifies autoimmunity variants. Nat Genet. 39: 1329-37
49. Kochi, Y., et al. (2005) A functional variant in FCRL3, encoding Fc receptor-like 3, is associated with rheumatoid arthritis and several autoimmunities. Nat Genet. 37: 478-85
66
50. Teft, W.A., et al. (2006) A molecular perspective of CTLA-4 function. Annu Rev Immunol. 24: 65-97
51. Yanagawa, T., et al. (1995) CTLA-4 gene polymorphism associated with Graves' disease in a Caucasian population. J Clin Endocrinol Metab. 80: 41-5
52. Kotsa, K., et al. (1997) A CTLA-4 gene polymorphism is associated with both Graves' disease and autoimmune hypothyroidism. Clin Endocrinol (Oxf). 46: 551-4
53. Donner, H., et al. (1997) CTLA4 alanine-17 confers genetic susceptibility to Graves' disease and to type 1 diabetes mellitus. J Clin Endocrinol Metab. 82: 143-6
54. Heward, J.M., et al. (1999) The development of Graves' disease and the CTLA-4 gene on chromosome 2q33. J Clin Endocrinol Metab. 84: 2398-401
55. Braun, J., et al. (1998) CTLA-4 promoter variants in patients with Graves' disease and Hashimoto's thyroiditis. Tissue Antigens. 51: 563-6
56. Villanueva, R., et al. (2000) Limited genetic susceptibility to severe Graves' ophthalmopathy: no role for CTLA-4 but evidence for an environmental etiology. Thyroid. 10: 791-8
57. Nithiyananthan, R., et al. (2002) Polymorphism of the CTLA-4 gene is associated with autoimmune hypothyroidism in the United Kingdom. Thyroid. 12: 3-6
58. Yanagawa, T., et al. (1997) CTLA4 gene polymorphism confers susceptibility to Graves' disease in Japanese. Thyroid. 7: 843-6
59. Park, Y.J., et al. (2000) Polymorphism in the promoter and exon 1 of the cytotoxic T lymphocyte antigen-4 gene associated with autoimmune thyroid disease in Koreans. Thyroid. 10: 453-9
60. Ueda, H., et al. (2003) Association of the T-cell regulatory gene CTLA4 with susceptibility to autoimmune disease. Nature. 423: 506-11
61. Chistiakov, D.A., et al. (2006) Genetic analysis and functional evaluation of the C/T(-318) and A/G(-1661) polymorphisms of the CTLA-4 gene in patients affected with Graves' disease. Clin Immunol. 118: 233-42
62. Heward, J.M., et al. (1998) No evidence for allelic association of a human CTLA-4 promoter polymorphism with autoimmune thyroid disease in either population-based case-control or family-based studies. Clin Endocrinol (Oxf). 49: 331-4
63. Michalek, K., et al. (2009) TSH receptor autoantibodies. Autoimmun Rev. 9: 113-6
64. Ramsden, J.D. (2000) Angiogenesis in the thyroid gland. J Endocrinol. 166: 475-80
65. Brent, G.A. (2008) Clinical practice. Graves' disease. N Engl J Med. 358: 2594-605
66. Bahn, R.S. and A.E. Heufelder (1993) Pathogenesis of Graves' ophthalmopathy. N Engl J Med. 329: 1468-75
67
67. Abraham-Nordling, M., et al. (2005) Graves' disease: a long-term quality-of-life follow up of patients randomized to treatment with antithyroid drugs, radioiodine, or surgery. Thyroid. 15: 1279-86
68. Fahrenfort, J.J., et al. (2000) Long-term residual complaints and psychosocial sequelae after remission of hyperthyroidism. Psychoneuroendocrinology. 25: 201-11
69. Shewring, G. and B.R. Smith (1982) An improved radioreceptor assay for TSH receptor antibodies. Clin Endocrinol (Oxf). 17: 409-17
70. Costagliola, S., et al. (1999) Second generation assay for thyrotropin receptor antibodies has superior diagnostic sensitivity for Graves' disease. J Clin Endocrinol Metab. 84: 90-7
71. Smith, B.R., et al. (2004) A new assay for thyrotropin receptor autoantibodies. Thyroid. 14: 830-5
72. Yoshimura Noh, J., et al. (2008) Evaluation of a new rapid and fully automated electrochemiluminescence immunoassay for thyrotropin receptor autoantibodies. Thyroid. 18: 1157-64
73. Pedersen, I.B., et al. (2010) Assays for thyroid-stimulating hormone receptor antibodies employing different ligands and ligand partners may have similar sensitivity and specificity but are not interchangeable. Thyroid. 20: 127-33
74. Torring, O., et al. (1996) Graves' hyperthyroidism: treatment with antithyroid drugs, surgery, or radioiodine--a prospective, randomized study. Thyroid Study Group. J Clin Endocrinol Metab. 81: 2986-93
75. Cooper, D.S. (2005) Antithyroid drugs. N Engl J Med. 352: 905-17 76. Karlsson, F.A., et al. (2002) Severe embryopathy and exposure to
methimazole in early pregnancy. J Clin Endocrinol Metab. 87: 947-9 77. Mandel, S.J. and D.S. Cooper (2001) The use of antithyroid drugs in
pregnancy and lactation. J Clin Endocrinol Metab. 86: 2354-9 78. Cooper, D.S. and S.A. Rivkees (2009) Putting propylthiouracil in
perspective. J Clin Endocrinol Metab. 94: 1881-2 79. Zimmerman, D. (1999) Fetal and neonatal hyperthyroidism. Thyroid. 9:
727-33 80. Tallstedt, L., et al. (1992) Occurrence of ophthalmopathy after treatment
for Graves' hyperthyroidism. The Thyroid Study Group. N Engl J Med. 326: 1733-8
81. Bartalena, L., et al. (1998) Relation between therapy for hyperthyroidism and the course of Graves' ophthalmopathy. N Engl J Med. 338: 73-8
82. Traisk, F., et al. (2009) Thyroid-associated ophthalmopathy after treatment for Graves' hyperthyroidism with antithyroid drugs or iodine-131. J Clin Endocrinol Metab. 94: 3700-7
83. Bartalena, L., et al. (1989) Use of corticosteroids to prevent progression of Graves' ophthalmopathy after radioiodine therapy for hyperthyroidism. N Engl J Med. 321: 1349-52
84. Werga-Kjellman, P., et al. (2001) Surgical treatment of hyperthyroidism: a ten-year experience. Thyroid. 11: 187-92
68
85. Marcocci, C., et al. (1989) Studies on the occurrence of ophthalmopathy in Graves' disease. Acta Endocrinol (Copenh). 120: 473-8
86. Bartley, G.B., et al. (1996) Clinical features of Graves' ophthalmopathy in an incidence cohort. Am J Ophthalmol. 121: 284-90
87. Wiersinga, W.M., et al. (1988) Temporal relationship between onset of Graves' ophthalmopathy and onset of thyroidal Graves' disease. J Endocrinol Invest. 11: 615-9
88. Enzmann, D.R., et al. (1979) Appearance of Graves' disease on orbital computed tomography. J Comput Assist Tomogr. 3: 815-9
89. Forbes, G., et al. (1986) Ophthalmopathy of Graves' disease: computerized volume measurements of the orbital fat and muscle. AJNR Am J Neuroradiol. 7: 651-6
90. Bartley, G.B., et al. (1995) The incidence of Graves' ophthalmopathy in Olmsted County, Minnesota. Am J Ophthalmol. 120: 511-7
91. Tellez, M., et al. (1992) Graves' ophthalmopathy in relation to cigarette smoking and ethnic origin. Clin Endocrinol (Oxf). 36: 291-4
92. Vaidya, B., et al. (1999) Cytotoxic T lymphocyte antigen-4 (CTLA-4) gene polymorphism confers susceptibility to thyroid associated orbitopathy. Lancet. 354: 743-4
93. Allahabadia, A., et al. (2001) MHC class II region, CTLA4 gene, and ophthalmopathy in patients with Graves' disease. Lancet. 358: 984-5
94. Zaletel, K., et al. (2002) The influence of the exon 1 polymorphism of the cytotoxic T lymphocyte antigen 4 gene on thyroid antibody production in patients with newly diagnosed Graves' disease. Thyroid. 12: 373-6
95. Hagg, E. and K. Asplund (1987) Is endocrine ophthalmopathy related to smoking? Br Med J (Clin Res Ed). 295: 634-5
96. Thornton, J., et al. (2007) Cigarette smoking and thyroid eye disease: a systematic review. Eye (Lond). 21: 1135-45
97. Cawood, T.J., et al. (2007) Smoking and thyroid-associated ophthalmopathy: A novel explanation of the biological link. J Clin Endocrinol Metab. 92: 59-64
98. Fatourechi, V. (2005) Pretibial myxedema: pathophysiology and treatment options. Am J Clin Dermatol. 6: 295-309
99. Rapoport, B., et al. (2000) Elephantiasic pretibial myxedema: insight into and a hypothesis regarding the pathogenesis of the extrathyroidal manifestations of Graves' disease. Thyroid. 10: 685-92
100. Jackson, R., et al. (1979) Ophthalmopathy after neck irradiation therapy for Hodgkin's disease. Cancer Treat Rep. 63: 1393-5
101. Byrne, A.P. and W.J. Delaney (1993) Regression of thyrotoxic ophthalmopathy following lithium withdrawal. Can J Psychiatry. 38: 635-7
102. Villanueva, R.B. and N. Brau (2002) Graves' ophthalmopathy associated with interferon-alpha treatment for hepatitis C. Thyroid. 12: 737-8
69
103. Starkey, K., et al. (2003) Peroxisome proliferator-activated receptor-gamma in thyroid eye disease: contraindication for thiazolidinedione use? J Clin Endocrinol Metab. 88: 55-9
104. Dorkhan, M., et al. (2006) Treatment with a thiazolidinedione increases eye protrusion in a subgroup of patients with type 2 diabetes. Clin Endocrinol (Oxf). 65: 35-9
105. Pappa, A., et al. (2000) T cells and fibroblasts in affected extraocular muscles in early and late thyroid associated ophthalmopathy. Br J Ophthalmol. 84: 517-22
106. Bahn, R.S. (2010) Graves' ophthalmopathy. N Engl J Med. 362: 726-38 107. Koumas, L., et al. (2003) Thy-1 expression in human fibroblast subsets
defines myofibroblastic or lipofibroblastic phenotypes. Am J Pathol. 163: 1291-300
108. Sempowski, G.D., et al. (1998) Human orbital fibroblasts are activated through CD40 to induce proinflammatory cytokine production. Am J Physiol. 274: C707-14
109. Pritchard, J., et al. (2003) Immunoglobulin activation of T cell chemoattractant expression in fibroblasts from patients with Graves' disease is mediated through the insulin-like growth factor I receptor pathway. J Immunol. 170: 6348-54
110. Heufelder, A.E. and R.S. Bahn (1992) Graves' immunoglobulins and cytokines stimulate the expression of intercellular adhesion molecule-1 (ICAM-1) in cultured Graves' orbital fibroblasts. Eur J Clin Invest. 22: 529-37
111. Kumar, S., et al. (2005) Gene expression profiling of orbital adipose tissue from patients with Graves' ophthalmopathy: a potential role for secreted frizzled-related protein-1 in orbital adipogenesis. J Clin Endocrinol Metab. 90: 4730-5
112. Valyasevi, R.W., et al. (2002) Stimulation of adipogenesis, peroxisome proliferator-activated receptor-gamma (PPARgamma), and thyrotropin receptor by PPARgamma agonist in human orbital preadipocyte fibroblasts. J Clin Endocrinol Metab. 87: 2352-8
113. Gerding, M.N., et al. (2000) Association of thyrotrophin receptor antibodies with the clinical features of Graves' ophthalmopathy. Clin Endocrinol (Oxf). 52: 267-71
114. Starkey, K.J., et al. (2003) Adipose thyrotrophin receptor expression is elevated in Graves' and thyroid eye diseases ex vivo and indicates adipogenesis in progress in vivo. J Mol Endocrinol. 30: 369-80
115. Bahn, R.S., et al. (1998) Thyrotropin receptor expression in Graves' orbital adipose/connective tissues: potential autoantigen in Graves' ophthalmopathy. J Clin Endocrinol Metab. 83: 998-1002
116. Wakelkamp, I.M., et al. (2003) TSH-R expression and cytokine profile in orbital tissue of active vs. inactive Graves' ophthalmopathy patients. Clin Endocrinol (Oxf). 58: 280-7
70
117. Zhang, L., et al. (2006) Biological effects of thyrotropin receptor activation on human orbital preadipocytes. Invest Ophthalmol Vis Sci. 47: 5197-203
118. Zhang, L., et al. (2009) Thyrotropin receptor activation increases hyaluronan production in preadipocyte fibroblasts: contributory role in hyaluronan accumulation in thyroid dysfunction. J Biol Chem. 284: 26447-55
119. Dutton, C.M., et al. (1997) Thyrotropin receptor expression in adrenal, kidney, and thymus. Thyroid. 7: 879-84
120. Paschke, R., et al. (1994) Presence of nonfunctional thyrotropin receptor variant transcripts in retroocular and other tissues. J Clin Endocrinol Metab. 79: 1234-8
121. Smith, T.J. (2003) The putative role of fibroblasts in the pathogenesis of Graves' disease: evidence for the involvement of the insulin-like growth factor-1 receptor in fibroblast activation. Autoimmunity. 36: 409-15
122. Smith, T.J. and N. Hoa (2004) Immunoglobulins from patients with Graves' disease induce hyaluronan synthesis in their orbital fibroblasts through the self-antigen, insulin-like growth factor-I receptor. J Clin Endocrinol Metab. 89: 5076-80
123. Lahooti, H., et al. (2010) Pathogenesis of thyroid-associated ophthalmopathy: does autoimmunity against calsequestrin and collagen XIII play a role? Clin Ophthalmol. 4: 417-25
124. Stan, M.N. and R.S. Bahn (2010) Risk factors for development or deterioration of Graves' ophthalmopathy. Thyroid. 20: 777-83
125. Terwee, C., et al. (2002) Long-term effects of Graves' ophthalmopathy on health-related quality of life. Eur J Endocrinol. 146: 751-7
126. Wiersinga, W.M., et al. (2004) Effects of Graves' ophthalmopathy on quality of life. J Endocrinol Invest. 27: 259-64
127. Dickinson, A.J. and P. Perros (2001) Controversies in the clinical evaluation of active thyroid-associated orbitopathy: use of a detailed protocol with comparative photographs for objective assessment. Clin Endocrinol (Oxf). 55: 283-303
128. Hallengren, B. and P. Åsman (2002) Endokrin Oftalmopati. State of the Art. Socialstyrelsen.
129. Mourits, M.P., et al. (1997) Clinical activity score as a guide in the management of patients with Graves' ophthalmopathy. Clin Endocrinol (Oxf). 47: 9-14
130. Mourits, M.P., et al. (1989) Clinical criteria for the assessment of disease activity in Graves' ophthalmopathy: a novel approach. Br J Ophthalmol. 73: 639-44
131. Graves' Orbitopathy: A Multidisciplinary Approach., ed. W.M. Wiersinga, Kahaly, G.J. 2007, Basel: Karger.
132. Werner, S.C. (1977) Modification of the classification of the eye changes of Graves' disease. Am J Ophthalmol. 83: 725-7
71
133. Frueh, B.R. (1992) Why the NOSPECS classification of Graves' eye disease should be abandoned, with suggestions for the characterization of this disease. Thyroid. 2: 85-8
134. Bartalena, L., et al. (2008) Consensus statement of the European group on Graves' orbitopathy (EUGOGO) on management of Graves' orbitopathy. Thyroid. 18: 333-46
135. Perros, P. and P. Kendall-Taylor (1998) Natural history of thyroid eye disease. Thyroid. 8: 423-5
136. Prummel, M.F., et al. (1993) Randomized double-blind trial of prednisone versus radiotherapy in Graves' ophthalmopathy. Lancet. 342: 949-54
137. Abalkhail, S., et al. (2003) The use of corticosteroids versus other treatments for Graves' ophthalmopathy: a quantitative evaluation. Med Sci Monit. 9: CR477-83
138. Stiebel-Kalish, H., et al. (2009) Treatment modalities for Graves' ophthalmopathy: systematic review and metaanalysis. J Clin Endocrinol Metab. 94: 2708-16
139. Le Moli, R., et al. (2007) Determinants of liver damage associated with intravenous methylprednisolone pulse therapy in Graves' ophthalmopathy. Thyroid. 17: 357-62
140. Marino, M., et al. (2004) Acute and severe liver damage associated with intravenous glucocorticoid pulse therapy in patients with Graves' ophthalmopathy. Thyroid. 14: 403-6
141. Lendorf, M.E., et al. (2009) Cardiovascular and cerebrovascular events in temporal relationship to intravenous glucocorticoid pulse therapy in patients with severe endocrine ophthalmopathy. Thyroid. 19: 1431-2
142. Wakelkamp, I.M., et al. (2004) Orbital irradiation for Graves' ophthalmopathy: Is it safe? A long-term follow-up study. Ophthalmology. 111: 1557-62
143. Pasquali, D., et al. (2000) Somatostatin receptor gene expression and inhibitory effects of octreotide on primary cultures of orbital fibroblasts from Graves' ophthalmopathy. J Mol Endocrinol. 25: 63-71
144. Gerding, M.N., et al. (1999) Octreotide-scintigraphy is a disease-activity parameter in Graves' ophthalmopathy. Clin Endocrinol (Oxf). 50: 373-9
145. Edwards, J.C. and G. Cambridge (2006) B-cell targeting in rheumatoid arthritis and other autoimmune diseases. Nat Rev Immunol. 6: 394-403
146. El Fassi, D., et al. (2006) Treatment-resistant severe, active Graves' ophthalmopathy successfully treated with B lymphocyte depletion. Thyroid. 16: 709-10
147. Salvi, M., et al. (2009) Rituximab treatment in a patient with severe thyroid-associated ophthalmopathy: effects on orbital lymphocytic infiltrates. Clin Immunol. 131: 360-5
148. El Fassi, D., et al. (2009) Treatment of Graves' disease with rituximab specifically reduces the production of thyroid stimulating autoantibodies. Clin Immunol. 130: 252-8
72
149. Durrani, O.M., et al. (2005) Infliximab: a novel treatment for sight-threatening thyroid associated ophthalmopathy. Orbit. 24: 117-9
150. Paridaens, D., et al. (2005) The effect of etanercept on Graves' ophthalmopathy: a pilot study. Eye (Lond). 19: 1286-9
151. Wakelkamp, I.M., et al. (2005) Surgical or medical decompression as a first-line treatment of optic neuropathy in Graves' ophthalmopathy? A randomized controlled trial. Clin Endocrinol (Oxf). 63: 323-8
152. Soares-Welch, C.V., et al. (2003) Optic neuropathy of Graves disease: results of transantral orbital decompression and long-term follow-up in 215 patients. Am J Ophthalmol. 136: 433-41
153. Baldeschi, L., et al. (2006) Early versus late orbital decompression in Graves' orbitopathy: a retrospective study in 125 patients. Ophthalmology. 113: 874-8
154. Mortimer, P.S. (1998) The pathophysiology of lymphedema. Cancer. 83: 2798-802
155. Olszewski, W.L., et al. (1990) Immune cells in peripheral lymph and skin of patients with obstructive lymphedema. Lymphology. 23: 23-33
156. Tabibiazar, R., et al. (2006) Inflammatory manifestations of experimental lymphatic insufficiency. PLoS Med. 3: e254
157. Rockson, S.G. (2001) Lymphedema. Am J Med. 110: 288-95 158. Ryan, T.J. and D. De Berker (1995) The interstitium, the connective tissue
environment of the lymphatic, and angiogenesis in human skin. Clin Dermatol. 13: 451-8
159. Brorson, H., et al. (2009) Breast cancer-related chronic arm lymphedema is associated with excess adipose and muscle tissue. Lymphat Res Biol. 7: 3-10
160. Rosen, E.D. and O.A. MacDougald (2006) Adipocyte differentiation from the inside out. Nat Rev Mol Cell Biol. 7: 885-96
161. Dandona, P., et al. (2004) Inflammation: the link between insulin resistance, obesity and diabetes. Trends Immunol. 25: 4-7
162. Sadler, D., et al. (2005) Changes in adipocytes and dendritic cells in lymph node containing adipose depots during and after many weeks of mild inflammation. J Anat. 207: 769-81
163. Inuzuka, H., et al. (1999) Differential regulation of immediate early gene expression in preadipocyte cells through multiple signaling pathways. Biochem Biophys Res Commun. 265: 664-8
164. Rosen, E.D. (2002) The molecular control of adipogenesis, with special reference to lymphatic pathology. Ann N Y Acad Sci. 979: 143-58; discussion 188-96
165. Hsu, S.Y., et al. (2002) Evolution of glycoprotein hormone subunit genes in bilateral metazoa: identification of two novel human glycoprotein hormone subunit family genes, GPA2 and GPB5. Mol Endocrinol. 16: 1538-51
73
166. Nakabayashi, K., et al. (2002) Thyrostimulin, a heterodimer of two new human glycoprotein hormone subunits, activates the thyroid-stimulating hormone receptor. J Clin Invest. 109: 1445-52
167. Suzuki, C., et al. (2009) Inflammatory cytokines regulate glycoprotein subunit beta5 of thyrostimulin through nuclear factor-kappaB. Endocrinology. 150: 2237-43
168. Nagasaki, H., et al. (2006) Differential expression of the thyrostimulin subunits, glycoprotein alpha2 and beta5 in the rat pituitary. J Mol Endocrinol. 37: 39-50
169. Dos Santos, S., et al. (2009) Distinct expression patterns of glycoprotein hormone-alpha2 and -beta5 in a basal chordate suggest independent developmental functions. Endocrinology. 150: 3815-22
170. Macdonald, L.E., et al. (2005) Resistance to diet-induced obesity in mice globally overexpressing OGH/GPB5. Proc Natl Acad Sci U S A. 102: 2496-501
171. van Zeijl, C.J., et al. (2010) Transient hypothyroxinemia in juvenile glycoprotein hormone subunit B5 knock-out mice. Mol Cell Endocrinol. 321: 231-8
172. Holland, P.M., et al. (1991) Detection of specific polymerase chain reaction product by utilizing the 5'----3' exonuclease activity of Thermus aquaticus DNA polymerase. Proc Natl Acad Sci U S A. 88: 7276-80
173. Applied Biosystems Application note: Absolute Quantitation Using Standard Curve Assay Getting Started Guide for the 7900HT Fast System. Part Number 4364014 Rev. B 08/2005.
174. Liu, H., et al. (2007) AffyProbeMiner: a web resource for computing or retrieving accurately redefined Affymetrix probe sets. Bioinformatics. 23: 2385-90
175. Gautier, L., et al. (2004) affy--analysis of Affymetrix GeneChip data at the probe level. Bioinformatics. 20: 307-15
176. Li, C. and W. Hung Wong (2001) Model-based analysis of oligonucleotide arrays: model validation, design issues and standard error application. Genome Biol. 2: RESEARCH0032
177. Li, C. and W.H. Wong (2001) Model-based analysis of oligonucleotide arrays: expression index computation and outlier detection. Proc Natl Acad Sci U S A. 98: 31-6
178. Irizarry, R.A., et al. (2003) Summaries of Affymetrix GeneChip probe level data. Nucleic Acids Res. 31: e15
179. Irizarry, R.A., et al. (2003) Exploration, normalization, and summaries of high density oligonucleotide array probe level data. Biostatistics. 4: 249-64
180. Wu, Z. and R.A. Irizarry (2005) Stochastic models inspired by hybridization theory for short oligonucleotide arrays. J Comput Biol. 12: 882-93
181. McClintick, J.N. and H.J. Edenberg (2006) Effects of filtering by Present call on analysis of microarray experiments. BMC Bioinformatics. 7: 49
74
182. Zhang, L., et al. (2002) A new algorithm for analysis of oligonucleotide arrays: application to expression profiling in mouse brain regions. J Mol Biol. 317: 225-35
183. Kennedy, R.E., et al. (2006) SScore: an R package for detecting differential gene expression without gene expression summaries. Bioinformatics. 22: 1272-4
184. Zhang, B., et al. (2005) WebGestalt: an integrated system for exploring gene sets in various biological contexts. Nucleic Acids Res. 33: W741-8
185. Barrett, J.C., et al. (2005) Haploview: analysis and visualization of LD and haplotype maps. Bioinformatics. 21: 263-5
186. Hemminger, B.M., et al. (2006) TAMAL: an integrated approach to choosing SNPs for genetic studies of human complex traits. Bioinformatics. 22: 626-7
187. Jurinke, C., et al. (2004) MALDI-TOF mass spectrometry: a versatile tool for high-performance DNA analysis. Mol Biotechnol. 26: 147-64
188. Oeth, P., et al. (2007) iPLEX Assay: Increased Plexing Efficiency and Flexibility for MassARRAY System Through Single Base Primer Extension with Mass-Modified Terminators. SEQUENOM Application note. Doc. No. 8876-006, R05
189. Purcell, S., et al. (2007) PLINK: a tool set for whole-genome association and population-based linkage analyses. Am J Hum Genet. 81: 559-75
190. Kireeva, M.L., et al. (1996) Cyr61, a product of a growth factor-inducible immediate-early gene, promotes cell proliferation, migration, and adhesion. Mol Cell Biol. 16: 1326-34
191. Lau, L.F. and S.C. Lam (1999) The CCN family of angiogenic regulators: the integrin connection. Exp Cell Res. 248: 44-57
192. Chen, C.C., et al. (2001) The angiogenic factor Cyr61 activates a genetic program for wound healing in human skin fibroblasts. J Biol Chem. 276: 47329-37
193. Yeger, H. and B. Perbal (2007) The CCN family of genes: a perspective on CCN biology and therapeutic potential. J Cell Commun Signal. 1: 159-64
194. Wang, H.S., et al. (1996) Leukoregulin induction of prostaglandin-endoperoxide H synthase-2 in human orbital fibroblasts. An in vitro model for connective tissue inflammation. J Biol Chem. 271: 22718-28
195. Vane, J.R., et al. (1998) Cyclooxygenases 1 and 2. Annu Rev Pharmacol Toxicol. 38: 97-120
196. Tontonoz, P. and B.M. Spiegelman (2008) Fat and beyond: the diverse biology of PPARgamma. Annu Rev Biochem. 77: 289-312
197. Rao, P. and E.E. Knaus (2008) Evolution of nonsteroidal anti-inflammatory drugs (NSAIDs): cyclooxygenase (COX) inhibition and beyond. J Pharm Pharm Sci. 11: 81s-110s
198. Amemiya, T. (1982) [Long-term indomethacin treatment of ophthalmopathies after Basedow disease in general practice]. Klin Monbl Augenheilkd. 181: 286-9
75
199. Adamson, D.J., et al. (2002) Diclofenac antagonizes peroxisome proliferator-activated receptor-gamma signaling. Mol Pharmacol. 61: 7-12
200. Terra, R., et al. (2008) Tissue-specific expression of B-cell translocation gene 2 (BTG2) and its function in T-cell immune responses in a transgenic mouse model. Int Immunol. 20: 317-26
201. Chan, V.S., et al. (2006) Sonic hedgehog promotes CD4+ T lymphocyte proliferation and modulates the expression of a subset of CD28-targeted genes. Int Immunol. 18: 1627-36
202. Lai, W.S., et al. (1999) Evidence that tristetraprolin binds to AU-rich elements and promotes the deadenylation and destabilization of tumor necrosis factor alpha mRNA. Mol Cell Biol. 19: 4311-23
203. Taylor, G.A., et al. (1996) A pathogenetic role for TNF alpha in the syndrome of cachexia, arthritis, and autoimmunity resulting from tristetraprolin (TTP) deficiency. Immunity. 4: 445-54
204. Carrick, D.M., et al. (2006) Genetic variations in ZFP36 and their possible relationship to autoimmune diseases. J Autoimmun. 26: 182-96
205. Kim, Y.C. and J.M. Ntambi (1999) Regulation of stearoyl-CoA desaturase genes: role in cellular metabolism and preadipocyte differentiation. Biochem Biophys Res Commun. 266: 1-4
206. Ntambi, J.M., et al. (2002) Loss of stearoyl-CoA desaturase-1 function protects mice against adiposity. Proc Natl Acad Sci U S A. 99: 11482-6
207. Warensjo, E., et al. (2007) Polymorphisms in the SCD1 gene: associations with body fat distribution and insulin sensitivity. Obesity (Silver Spring). 15: 1732-40
208. Kumar, S., et al. (2004) Evidence for enhanced adipogenesis in the orbits of patients with Graves' ophthalmopathy. J Clin Endocrinol Metab. 89: 930-5
209. Bahn, R.S. (2003) Clinical review 157: Pathophysiology of Graves' ophthalmopathy: the cycle of disease. J Clin Endocrinol Metab. 88: 1939-46
210. Chan, G.K., et al. (2001) PTHrP inhibits adipocyte differentiation by down-regulating PPAR gamma activity via a MAPK-dependent pathway. Endocrinology. 142: 4900-9
211. Menuki, K., et al. (2008) Climbing exercise enhances osteoblast differentiation and inhibits adipogenic differentiation with high expression of PTH/PTHrP receptor in bone marrow cells. Bone. 43: 613-20
212. Okada, S.L., et al. (2006) A glycoprotein hormone expressed in corticotrophs exhibits unique binding properties on thyroid-stimulating hormone receptor. Mol Endocrinol. 20: 414-25
213. Li, C., et al. (2004) Distribution of thyrostimulin in the rat: an immunohistochemical study. Endocr Regul. 38: 131-42
214. van Zeijl, C., et al. (2010) Increased pituitary GPB5 mRNA expression during acute illness is associated with suppressed TSHR mRNA expression in the pituitary and hypothalamus. Abstract OC-040 at the International Thyroid Congress, Paris.

76
215. (2004) Affymetrix Technical Note. Sample Pooling for Microarray Analysis: A Statistical Assessment of Risks and Biases.
216. Lohmueller, K.E., et al. (2003) Meta-analysis of genetic association studies supports a contribution of common variants to susceptibility to common disease. Nat Genet. 33: 177-82


![Molecular Etiology of Graves’ Disease and Associated ...lup.lub.lu.se/search/ws/files/3961034/1712429.pdf · subclinical GD or autonomous nodules (Jod-Basedow effect) [22] (Table](https://img.pdfslide.us/doc/110x75/5e095b7090ecdb568e32cdb7/molecular-etiology-of-gravesa-disease-and-associated-luplublusesearchwsfiles3961034.jpg)