Embed Size (px)
Citation preview

Volume 56, Number 4, 2002 APPLIED SPECTROSCOPY 4490003-7028 / 02 / 5604-0449$2.00 / 0q 2002 Society for Applied Spectroscopy
Molecular Emission Spectroscopy as a Potential DiagnosticTool in Plasma-Assisted Incineration
JULIE FILION, RICHARD J. MUNZ, and ERIC D. SALIN*Plasma Technology Research Centre, Department of Chemical Engineering, McGill University, 3610 University, Montreal, Quebec,Canada, H3A 2B2 (R.J.M.); Department of Chemistry, McGill University, 801 Sherbrooke West, Montreal, Quebec, Canada,H3A 2K6 (E.D.S.); and Department of Chemical Engineering, McGill University, 3610 University, Montreal, Quebec, Canada,H3A 2B2 (presently at Merck Frosst Canada & Co.) (J.F.)
This paper reports on a simple analytical procedure used to dem-onstrate the technical feasibility of adaptive plasma-assisted incin-eration. APAI is a novel concept that addresses current dif� cultiesin the treatment of hazardous organic waste. It features continualoptimization of a plasma afterburner’s operating conditions forcost-effective destruction of persistent contaminants under variablefeed loads. Hence, on-line composition monitoring is a key elementof the process. A diagnostic method was speci� cally developed foran experimental model system that required optical measurementsfrom the jet of a 25–kW induction plasma torch. The method usedphotodiode array detection of visible emission from the Swan bandsystem of C2 to track the destruction of organic compounds. Thisrapid, simple, and inexpensive procedure proved adequate for dem-onstration purposes.
Index Headings: Swan bands; Thermal plasma; Hazardous waste;Incineration; Optimization.
INTRODUCTION
Conventional incineration is a long-established methodof treating hazardous materials. It has prevailed in wastemanagement practice thanks to its general applicability,simplicity, and low cost. Yet recent scienti� c evidencehas brought into question the safety of conventional ther-mal treatment operations.1 A major point of contention isthe toxicological hazard of organic pollutants released byincinerators, including compounds of the polychlorinateddibenzo dioxin and furan classes. 2 The public has showngrowing concern over the impact of incineration facilitieson human health and the environment. These factors,combined with increasingly strict environmental regula-tions, have prompted interest in the development of al-ternative waste treatment methods.
The shortcomings of conventional incineration relate,in part, to the properties of fuel combustion environ-ments. In well-mixed systems, oxidation rates are limitedby thermodynamic and stoichiometric constraints on tem-perature and oxygen concentration. Complete combustionof organic materials is a challenge in the presence ofpersistent contaminants such as halogenated aromatic hy-drocarbons (e.g., PCBs). Partial oxidation has been linkedto the formation of dioxins and furans in incinerators.3,4
This problem is compounded by variability in the wastematerial. Incinerators normally operate at � xed condi-tions of temperature and residence time. Following achange in target temperature or throughput, stabilizationat a new steady state can take up to half an hour. Becauseof this high thermal inertia, incineration processes cannot
Received 26 July 2001; accepted 7 December 2001.* Author to whom correspondence should be sent.
respond rapidly to changes in feed composition. When asmall fraction of contaminant is non-homogeneously dis-persed in a large matrix, such as in contaminated soil,precautionary over-treatment impairs the cost-ef� ciencyof the operation.
Adaptive Plasma-Assisted Incineration. Incinerationgenerally involves two thermal treatment stages. The pri-mary stage is typically a rotary kiln through which solidsand sludge travel over several minutes. The kiln temper-ature allows complete volatilization and/or combustion ofthe organic fraction of the waste. At the exit, an ashysolid residue is collected and the gas stream proceeds toa high-temperature secondary chamber called the after-burner. The purpose of the afterburner is to promote com-plete combustion by providing supplemental fuel and air.Heat transfer rates are crucial in the operation of this unit,where the residence time is on the order of seconds.When appropriate, liquid organic waste is introduced atthis stage.5
The concept of adaptive plasma-assisted incineration(APAI) proposes the use of industrial-scale thermal plas-ma jets as an alternative to combustion heat sources. Thecharacteristic properties of atmospheric-pressure plas-mas—intense power dissipation, molecular dissociation,and ionization—create conditions of high temperatureand reactivity. These conditions are conducive to a com-plete decomposition of organic compounds, includingpersistent pollutants.6,7 The short response time of plasmadevices facilitates prompt response to disturbances. Flex-ibility in the composition of the plasma gas provides con-trol over the chemistry of the system.
Plasma technology is a developing � eld with high cap-ital investment and operating costs. In general, thermalplasma processes have not proved to be viable alterna-tives to combustion processes. However, thermal plasmaheating at the afterburner stage could improve the safetyand effectiveness of existing facilities. To this effect,APAI combines a conventional primary-stage incineratorwith an air plasma afterburner with adaptive capabilities.The system is designed to respond cost-effectively to var-iations in waste treatment requirements. The plasma heatinput and gas composition are manipulated independentlyto control the temperature and chemistry of the after-burner environment. Adaptability is built-in through on-line composition monitoring and continual optimizationof the afterburner conditions. A rapid and reliable com-position assessment method is essential in APAI.
The work presented in this paper was part of a researchproject that demonstrated the technical feasibility of

450 Volume 56, Number 4, 2002
FIG. 1. APAI schematic � owsheet.
FIG. 2. Model system induction plasma generator.APAI on a laboratory-scale model system. The experi-mental model differed considerably from a pilot scaleAPAI prototype in both technology and con� guration. Inan industrial-scale process, a dc plasma reactor would beused. Mass spectrometry would be the ideal detectionmethod, but infrared spectroscopy may also be applica-ble. The development of an optical monitoring procedureadapted to this system exempli� es the diagnostic poten-tial of low-resolution emission spectra acquired usingsimple, low-cost instrumentation. For demonstration pur-poses, emission spectrometry was an adequate substitutefor more sophisticated methods.
EXPERIMENTAL
Model System and Instrumentation. Figure 1 is a� owsheet diagram for the envisioned APAI process. The� rst thermal treatment stage, a conventional oil- or gas-� red kiln, would be followed by an air plasma afterburnerwith additional oxygen input. The afterburner gas com-position would be assessed by spectroscopy. A feedbackoptimization loop would control two essential variablesfor waste destruction: temperature (through power input)and oxygen content. The off-gas would proceed to stan-dard gas cleaning equipment for removal of acid gasesand particulate matter.
Figure 2 is a schematic diagram of the experimentalmodel system. Due to design constraints, dc torches thatcan operate on oxidizing gases are unavailable at the lab-oratory scale. For this reason, the demonstration used aninductively coupled plasma torch (Tafa Technologies Inc.,model 56, 25 kW) powered by a radio frequency gener-ator (Lepel High Frequency Laboratories, model32*30MC). Up to 30 kW of recti� ed (dc) plate powerwas available to the oscillator, which supplied 4 MHz acpower to a six-turn induction coil 5.1 cm in diameter.The total gas � ow rate in the torch varied from 54 to 57slpm.
A prototype unit, as compared to a laboratory scalesystem, would run on air and supplemental oxygen. Inour case, the plasma gas was a mixture of argon andoxygen. In order to simulate the presence of incompletecombustion products in the afterburner feed, a non-toxicorganic compound (propane) was added to the plasma gasin proportions up to 0.2 mol% (0.3% was used for trialsbut destabilized the plasma and was not used in laterexperiments). The visible part of the jet acted as a modelreaction zone. The extent of propane destruction wasmonitored through visible region emission measurements.
The feedback loop shown in Fig. 1 was implementedmanually.
Light from the plasma was projected onto an imagingplate by an achromatic lens doublet. The plate wasmounted on a translation stage and � tted with an optical� ber termination nut. At unity magni� cation, the rangeof motion of the � ber tip on the plate covered the entireimage of the plasma jet. The optical channel was a single� ber of fused silica about 10 m in length. The � ber was200 mm in diameter and its cone of acceptance includedthe solid angle subtended by the imaging system. Thelatter solid angle was narrow (high imaging F-number),which justi� ed the assumption of uniform light collectionacross the depth of the three-dimensional source.
The far end of the optical � ber met a two-lens colli-mating assembly that focused the light onto the entranceslit of a monochromator (Jobin–Yvon THR-1000, f /8,one-meter focal length). The spectrometer was equippedwith an 1800 grooves/mm grating, which brought the re-ciprocal linear dispersion close to 0.5 nm/mm and the slitwidth-limited resolution slightly above 0.02 nm (using a20-mm-wide slit). Experimental determination of the fullwidth at half-maximum (FWHM) gave 0.02 nm.
After wavelength separation, the light was directed toone of two detectors: a photomultipier tube (HamamatsuR928 PMT) for high-resolution scans or a UV-enhancedintensi� ed photodiode array (Princeton Instruments IRY-700S). This optical multichannel array (OMA) containedabout 700 active diodes (23 mm effective width) placed25 mm apart. The theoretical resolution was equivalent to3–3.5 diodes, or ø0.04 nm; this � gure was con� rmed byexperimental measurements of the FWHM.
Optical Diagnostic Method. Photodiode arrays allowrapid and simultaneous measurement of correlated fea-tures (e.g., analyte signals and continuum emission fromadjacent regions of the spectrum) without moving parts.This makes photodiode array detection the preferredchoice for industrial applications where speed, stability,durability, and simplicity of use are important.8
The model system presented a visible plasma jet ame-nable to visible emission spectroscopy. Hence, a simplemethod was developed for detecting incomplete combus-tion as inferred from the presence of C2 molecular frag-ments. We assumed that complete destruction of an or-ganic compound would result in momentary conversionof all atoms in the tail of the plasma jet to an atomic

APPLIED SPECTROSCOPY 451
FIG. 3. Geometry of the plasma jet.
FIG. 4. Swan band emission spectrum.
form. This would be indicated by a lack of Swan bandemission. As mentioned before, a different approachwould be used to assess the ef� uent gas composition inan APAI afterburner prototype (mass or infrared spec-troscopy). The experimental diagnostic method, based onintegrated intensity measurements from the OMA, reliedon the emission spectrum of excited C2 species, speci� -cally the Swan rotational-vibrational y(0,0) band at509.8–516.5 nm. The disappearance of Swan bands withincreasing plasma power and/or oxygen content corre-sponded to the decomposition of molecules containingtwo or more carbon atoms.9–13
The validity of this diagnostic method depended ontwo conditions. First, a correlation must exist betweenthe intensity of Swan emission by excited C2 species andthe population of C2 in the ground state. Second, thermalexcitation at the observation point must be suf� cientlyhigh for C2 fragments to emit Swan bands characteristicof rotational equilibrium. In the model system, these twoconditions were met as the states of the observed tran-sitions satis� ed a near-equilibrium assumption.14 Operat-ing at atmospheric pressure promoted the dominance ofcollisional processes and the equilibration of excitedstates. Other studies on the spatial distribution of ground-and excited-state C2 molecules point to a direct corre-spondence between the lack of Swan emission and theabsence of C2 fragments or species.15,16
Assuming steady concentration and temperature pro-� les within the plasma jet, a single observation point wasadequate for feedback optimization. This assumption wasacceptable near the nozzle, where the � ow assumed anori� ce jet pro� le. Downstream and on the sides, the jetvaried in shape with operating conditions. The intensetriangular core of the jet depicted in Fig. 3 offered max-imal reproducibility and signal-to-noise ratio.
The lateral position of the observation point was cho-sen on the basis of Abel integral computations for sim-
ulated radial property pro� les. Measurements from thecentral axis of the jet were shown to be more intense andmore sensitive to concentration than other lateral posi-tions, independently of the radial emission pro� le as-sumed. Centerline measurements included contributionsfrom all radial positions and thus minimized the risk ofinformation loss with changes in jet property distribu-tions. The position of the observation point down thecentral axis of the jet was empirically set to 0.5 cm down-stream of the nozzle to maximize light transmission.
Optimization Procedure. One disadvantage of usingan induction plasma was the interaction between gascomposition, load impedance, plate power, and couplingef� ciency. In the model system, the preferred manipulat-ed variables—dissipated power and oxidizing potential—were neither independent nor directly controllable. Themost reproducible way to vary plasma power and oxi-dizing potential was to manipulate the following: (1) theplate current, assuming constant plate voltage and ther-mal ef� ciency over a limited range; and (2) the � ow rateof oxygen mixed into the constant argon supply to thetorch.
The optimization process aimed at balancing two de-pendent variables: destruction ef� ciency, inferred fromspectroscopy, and operating cost, determined by the pow-er/oxygen input. The objective was to approach a pre-determined level of destruction ef� ciency (target level)at the minimum cost possible. A destruction ef� ciencyvalue below the target represented under-treatment; oneabove the target, over-treatment. The criterion to be op-timized was de� ned as a function of the dependent var-iables. Its mathematical formulation re� ected two objec-tives: improving destruction of the contaminant in under-treatment cases and minimizing costs in over-treatmentcases. Optimizing this indicator provided a cost-ef� cientpath to the destruction ef� ciency target. The process wasguided by optimization programs written by the experi-menter using gradient-based and Simplex algorithms.14
RESULTS AND DISCUSSION
De� nition of an Optical Indicator. Figure 4 showsthe green/blue emission spectrum of a commercial ana-lytical inductively coupled plasma torch (2 kW ICP) run-ning on argon and propane. The y(0, 0) Swan band of C 2
(band head located at 516.5 nm) is prominent in the ab-
452 Volume 56, Number 4, 2002
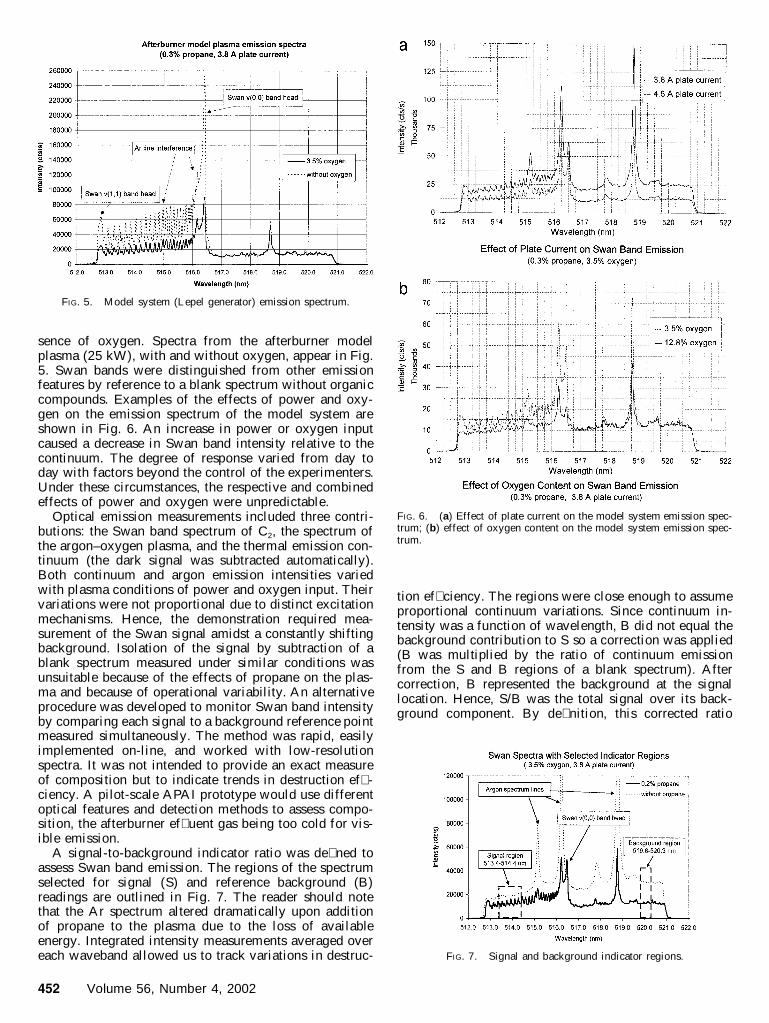
FIG. 5. Model system (Lepel generator) emission spectrum.
FIG. 6. (a) Effect of plate current on the model system emission spec-trum; (b) effect of oxygen content on the model system emission spec-trum.
FIG. 7. Signal and background indicator regions.
sence of oxygen. Spectra from the afterburner modelplasma (25 kW), with and without oxygen, appear in Fig.5. Swan bands were distinguished from other emissionfeatures by reference to a blank spectrum without organiccompounds. Examples of the effects of power and oxy-gen on the emission spectrum of the model system areshown in Fig. 6. An increase in power or oxygen inputcaused a decrease in Swan band intensity relative to thecontinuum. The degree of response varied from day today with factors beyond the control of the experimenters.Under these circumstances, the respective and combinedeffects of power and oxygen were unpredictable.
Optical emission measurements included three contri-butions: the Swan band spectrum of C2, the spectrum ofthe argon–oxygen plasma, and the thermal emission con-tinuum (the dark signal was subtracted automatically).Both continuum and argon emission intensities variedwith plasma conditions of power and oxygen input. Theirvariations were not proportional due to distinct excitationmechanisms. Hence, the demonstration required mea-surement of the Swan signal amidst a constantly shiftingbackground. Isolation of the signal by subtraction of ablank spectrum measured under similar conditions wasunsuitable because of the effects of propane on the plas-ma and because of operational variability. An alternativeprocedure was developed to monitor Swan band intensityby comparing each signal to a background reference pointmeasured simultaneously. The method was rapid, easilyimplemented on-line, and worked with low-resolutionspectra. It was not intended to provide an exact measureof composition but to indicate trends in destruction ef� -ciency. A pilot-scale APAI prototype would use differentoptical features and detection methods to assess compo-sition, the afterburner ef� uent gas being too cold for vis-ible emission.
A signal-to-background indicator ratio was de� ned toassess Swan band emission. The regions of the spectrumselected for signal (S) and reference background (B)readings are outlined in Fig. 7. The reader should notethat the Ar spectrum altered dramatically upon additionof propane to the plasma due to the loss of availableenergy. Integrated intensity measurements averaged overeach waveband allowed us to track variations in destruc-
tion ef� ciency. The regions were close enough to assumeproportional continuum variations. Since continuum in-tensity was a function of wavelength, B did not equal thebackground contribution to S so a correction was applied(B was multiplied by the ratio of continuum emissionfrom the S and B regions of a blank spectrum). Aftercorrection, B represented the background at the signallocation. Hence, S/B was the total signal over its back-ground component. By de� nition, this corrected ratio

APPLIED SPECTROSCOPY 453
TABLE I. S/B indicator ratio and its relative standard deviation.a
Ip (A)C3H8
% O2
0.0%
S/B RSD
0.1%
S/B RSD
0.2%
S/B RSD
0.3%
S/B RSD
3.83.84.64.6
3.512.83.5
12.8
1.001.001.001.00
0.3%0.6%0.3%0.4%
1.081.031.051.02
0.7%1.3%0.7%0.5%
1.321.101.161.07
1.1%1.1%0.8%0.8%
1.651.201.361.12
1.1%0.8%1.1%0.6%
a There were three replicates of each measurement.
equaled unity in the absence of Swan emission and wasgreater than one otherwise.
The assumption of � xed proportionality between con-tinuum emission levels in the two regions was veri� ed:the value of the correction factor was uniform over thewhole range of power and oxygen input. This factor ap-plied in off-center regions of the plasma jet, indicatingthe insensitivity of the S/B indicator ratio to changes inthe size and shape of the plasma jet.
Table I shows the indicator ratio and its relative stan-dard deviation (RSD) at different input conditions andpropane loads. The � rst column of data contains blankmeasurements (0.0% propane). Overall, the ratio had astandard deviation of the order of 1%. In time-stabilitytests, measurements spaced in time had standard devia-tions similar to those of rapid consecutive measurements.Hence any drift in the ratio was minimal.
Uncertainty Analysis. The light transmission and de-tection procedure was not a dominant source of error. Theposition of the spectrometer grating was reproducible.Drift in the correspondence between wavelength and pho-todiode array pixels was negligible. Because the indicatorwas a ratio of intensities measured simultaneously froma single source, it was insensitive to � icker as well as tovariations in detector response or light transmission ef-� ciency. Replicate measurements were taken for a rangeof input settings in a randomized order to con� rm thereproducibility of the input conditions. Variability in theinput did not exceed variability in optical properties at� xed settings, as the RSD of these measurements re-mained on the order of 1%.
A limit of detectable change was de� ned for S/B. Theminimum signi� cant change in S/B was assumed equalto a con� dence factor times the standard deviation.
D(S /B)min 5 ks(S/B ) (1)
The minimum detectable change being expressed in rel-ative terms, the RSD of either signal or blank measure-ments could be used. A value of 1% was estimated basedon Table I. At the chosen con� dence level of 95.5%, k5 2, the relative error in S/B was 2%.
The S/B method assumed a proportional variation ofSwan and continuum emissivities with changes in oper-ating conditions. It was known that local signal (S) andbackground (B) intensities could respond differently totemperature variations. This potential source of error wasnot critical in the present application because no � xedcorrelation could be de� ned between signals and absoluteC2 concentrations. In the feedback process, the C2 signalwas driven down to undetectable levels by correctivechanges in power and/or oxygen input, leading to a cost-effective route traced by the optimization algorithm.14,17
CONCLUSION
Swan band emission observation with a simple, low-resolution photodiode array-based spectrometer providedan excellent method for monitoring a simulated large-scale plasma-based destruction process. Rapid opticalfeedback allowed adaptive algorithms to be tested effec-tively, and multi-spectral capability permitted subtractionof a background that altered dramatically under differentconditions. The optical detection method was speci� callyadapted to the model system where measurements tookplace within the visible plasma jet. It is understood thatan APAI prototype would infer the composition of theafterburner ef� uent gas from optical signals outside thevisible spectrum. For laboratory-scale evaluation, thetechnique used here proved signi� cantly more affordablethan either the FT-IR or atmospheric pressure mass spec-trometry that would be used in a larger scale system.
ACKNOWLEDGMENTS
The authors wish to acknowledge the � nancial support of the NaturalSciences and Engineering Research Council of Canada (NSERC) andof Quebec’s Fondation pour la formation de chercheurs et l’aide a larecherche (FCAR) through research grants and scholarships.
1. G. H. Eduljee, ‘‘Organic Micropollutant Emission from Waste In-cineration’’, in Issues in Environmental Science and Technology:(2) Waste Incineration and the Environment, R. E. Hester and R.M. Harrison, Eds. (Royal Society of Chemistry, UK, 1995).
2. R. M. Harrison, ‘‘Chemistry of the Troposphere’’, in Pollution:Causes, Effects and Control, R. M. Harrison, Ed. (Royal Societyof Chemistry, UK, 1996), 3rd ed., Chap. 8.
3. S. J. Harrad, ‘‘The Environmental Behaviour of Toxic OrganicChemicals’’, in Pollution: Causes, Effects and Control, R. M. Har-rison, Ed. (Royal Society of Chemistry, UK, 1996), 3rd ed., Chap.16.
4. P. T. Williams, ‘‘Pollutants from Incineration: an Overview’’, inIssues in Environmental Science and Technology: (2) Waste Incin-eration and the Environment, R. E. Hester and R. M. Harrison,Eds. (Royal Society of Chemistry, UK, 1995).
5. C. R. Brunner, Incineration Systems Handbook (Incinerator Con-sultants Inc., Reston, VA, 1996).
6. Q. Y. Han, Q. D. Zhuang, J. V. R. Heberlein, and W. Tormanen,‘‘Thermal Plasma Destruction of Hazardous Waste with Simulta-neous Production of Valuable Coproducts’’, in Emerging Technol-ogies in Waste Management V, D. W. Tedder and F. G. Pohland,Eds. (ASC Symposium Series 607, American Chemical Society,Washington, D.C., 1995), Chap. 11.
7. V. Ramasam y, T.-Z. Li, K. Saito, C. J. Cremers, and V. Majidi, Haz.Waste Haz. Mater. 13, 131 (1996).
8. D. S. Malchow, ‘‘Industrial Process Control with Array Spectros-copy’’, SPIE Conference on Instrumentation used in Spectroscopy,Process Control, and Color Measuremen t (1992).
9. G. Herzberg, Spectra of Diatomic Molecules (van Nostrand, NJ,1950).
10. R. W. B. Pearse and A. G. Gaydon, The Identi� cation of MolecularSpectra (Chapman and Hall, London, 1965), 3rd ed.
11. S. Pellerin, K. Musiol, O. Motret, B. Pokrzywka, and J. Chapelle,J. Phys. D: Appl. Phys. 29, 2850 (1996).

454 Volume 56, Number 4, 2002
12. J. G. Phillips and S. P. Davis, Berkeley Analyses of Molecular Spec-tra: The Swan System of the C 2 Molecule/The Spectrum of the HgHMolecule (University of California Press, Berkeley and Los An-geles, 1968).
13. S. Green� eld, H. McD. McGeachin, and P. B. Smith, ICP Infor-mation Newsletter 2, 167 (1976).
14. J. Filion, Ph.D. thesis, McGill University, Montreal, Canada (2000).
15. A. N. Goyette, J. E. Lawler, L. W. Anderson, D. M. Gruen, T. G.McCauley, D. Zhou, and A. R. Krauss, Plasma Sources Sci. Tech-nol. 7, 149 (1998).
16. S. W. Reeve and W. A. Weimer, J. Vac. Sci. Technol. A 13, 359(1995).
17. J. Filion, R. J. Munz, and E. D. Salin, Can. J. Chem. Eng. 79, 612(2001).