Embed Size (px)
Citation preview

Molecular Dynamics Simulations of the Shock Response of the Energetic Materials Pentaerythritol Tetranitrate and Hexahydro-1,3,5-
Trinitro-1,3,5-s-Triazine
A Dissertation Presented to the Faculty
of the Graduate School of the
University of Missouri-Columbia
In Partial Fulfillment
of the Requirements of the Degree
Doctor of Philosophy
By
Reilly M. Eason
Prof. Thomas D. Sewell, Dissertation Supervisor
May 2016

The undersigned, appointed by the Dean of The Graduate School, have examined the
dissertation entitled:
Molecular Dynamics Simulations of the Shock Response of the Energetic Materials Pentaerythritol Tetranitrate and Hexahydro-1,3,5-Trinitro-1,3,5-s-
Triazine
Presented by Reilly Michael Eason
A candidate for the degree Doctor of Philosophy
And hereby certify that, in their opinion, it is worthy of acceptance.
Professor Thomas D. Sewell
Professor Donald L. Thompson
Professor John E. Adams
Professor Carol A. Deakyne
Professor Stephen A. Montgomery-Smith
Acknowledgements
I would like to thank the following people, all of whom contributed in no small way to me being where I am today:
My parents, Mike and Judy Eason, obviously deserve the largest amount of
thanks. They always pushed me to set high standards and to constantly be better than
good enough. Without their constant support I would not have achieved even a fraction of
what I have accomplished to this point.
I would like to thank all of my committee members in general for listening to my
presentations, offering feedback, and challenging me with questions that forced me to
critically think about the research I was doing. Individually, a thanks is due to Dr. Adams
and Dr. Deakyne for being excellent teachers and always ready to answer a question
regardless of whether I was a student of theirs or not. Thank you to Dr. Montgomery-
Smith for making math so interesting that I wanted to sit in his classes just to hear him
lecture. Thank you to Dr. Thompson for playing quite a large role in me considering
graduate school and in my acceptance at Mizzou; and for helping me to quickly learn that
giving facile answers to hard questions is not an option.
Two individuals from my undergraduate studies at Union University deserve
special mention. Dr. Charles Baldwin, who originally lit the fire under me to be more
than just an average student. Dr. Michael Salazar, without whom it is doubtful that I
would have ever attended graduate school. Even near the end of my undergraduate
studies I still wasn’t quite certain what I planned to do for a career. Dr. Salazar made me
ii

realize how much I enjoyed Physical Chemistry and provided the inspiration for me to
pursue an advanced degree in the field.
No student who goes through graduate school in the Chemistry Department would
survive without the assistance of Jerry Brightwell. I long ago lost count of the number of
times he has taken care of paperwork or administrative issues for me. Thank you Ali
Siavosh-Haghighi for answering all of my dumb computer related questions when I first
started doing research. Thanks to Jamin Perry for providing countless hours of discussion
throughout graduate school.
It is always customary to thank one’s graduate advisor but in this case a simple
thank you does not feel sufficient. Outside of my parents, I don’t believe any person has
had more profound of an impact on my life than Dr. Thomas Sewell. I could not have
asked for a better mentor for my journey through graduate school. I will always be
grateful for the lessons I learned from him and in my professional career I already find
myself applying the principles I learned from him.
iii

TABLE OF CONTENTS
Acknowledgements ii
List of Figures vii
List of Tables ix
Chapter 1: A Brief Introduction to Energetic Materials 1
1.1 Material Response 1
1.2. Energetic Materials 2
1.3 Shock Waves 4
1.3.1 Continuity Equations 4
1.3.2 Deformation 6
1.4 Historical Analysis and Data 9
1.4.1 Experimental Studies 9
1.4.2 Simulations 12
1.5 Predictive Capability Goals 14
1.6 Thesis Outline_______________________________________________________16
Chapter 2: Molecular Dynamics: Basic Principles and Applications to the Study of Energetic Materials 20
2.1 Molecular Dynamics Methodology 20
2.2 Force Fields Overview 24
2.3 Potentials Used in This Work 27
2.3.1 RDX Force Field 27
2.3.2 PETN Force Field 34
iv

Chapter 3: Shock-Induced Inelastic Deformation in Oriented Crystalline Pentaerythritol Tetranitrate (PETN) 42
3.1 Introduction 42
3.2 Methods 47
3.3 Results and Discussion for the 3D Systems 50
3.3.1 Relative Molecular Displacements 50
3.3.2 Spatial Profiles of Intermolecular and Intramolecular Temperatures 55
3.3.3 Dihedral Angle Distributions in Unshocked and Shocked Material 58
3.4 Results and Discussion for the Quasi-2D System 61
3.4.1 Relative Molecular Displacements in Regions A-D 64
3.4.2 Kinetic Energy Time Histories in Regions A-D 65
3.4.3 Rotational Order in Regions A-D 67
3.4.4 Time Scales for Re-Establishing the Maxwell-Boltzmann Distribution of Kinetic Energy Behind the Shock 70
3.5 Conclusions 76
Chapter 4: Molecular Dynamics Simulations of the Collapse of a Cylindrical Pore in the Energetic Material α-RDX 82
4.1 Introduction 82
4.2 Methods 90
4.3 Results and Discussion 94
4.3.1 Snapshots of Center-of-Mass Positions and Local Velocity Fields 94
4.3.2 Rotational Order During Collapse 101
4.3.3 Temperature and Longitudinal Pressure 107
4.4 Conclusions 114
v

Chapter 5: Conclusions and Future Work 119
Vita 123
vi
LIST OF FIGURES
Chapter 1
Figure 1.1 Example of the unit cell structure of a bcc atomic system 8
Chapter 2
Figure 2.1 Molecular connectivity of a molecule of PETN 25
Figure 2.2 Isothermal linear and volumetric compression curves of RDX calculated using the Smith Potential at T = 298K 31
Figure 2.3 Linear and volumetric coefficients of RDX obtained from NPT simulations at P = 1 atm compared to experimental values 32
Figure 2.4 Hugoniot locus in the us-up plane for RDX shocked normal to (100) 34
Figure 2.5 Isothermal linear and volumetric compression curves for PETN obtained from NPT simulations at T = 298 K 37
Figure 2.6 Linear and volumetric coefficients of thermal expansion for PETN calculated from NPT simulations at P = 1 atm compared to experimental values 38
Figure 2.7 PETN Hugoniot locus in the us-up plane at initial temperature T0 = 300K and pressure P0 = 1 atm compared to experiment 39
Chapter 3
Figure 3.1 Depictions of PETN crystal 45
Figure 3.2 Relative molecular displacements at times of maximum compression 52
Figure 3.3 Orthographic projections of the piston s and flexible slabs at the times of maximum compression in the 3D systems 54
Figure 3.4 Instantaneous spatial profiles for intermolecular and intramolecular temperatures 57
Figure 3.5 Distributions of CCON dihedral angles 60
Figure 3.6 Distributions of CONO dihedral angles 62
vii

Figure 3.7 Orthographic projection of the piston and flexible slab for the quasi-2D shock at the instant of maximum compression 63
Figure 3.8 Relative molecular displacements for the quasi-2D [100] shock projected into the (001) plane at the time of maximum compression 65
Figure 3.9 Time histories of total kinetic energies, expressed in temperature units, for molecules determined to be elastically (blue) and inelastically (red) displaced at the time of maximum compression in the quasi-2D [100] shock 67
Figure 3.10 Time histories of the orientational order parameter P2(t) for molecules determined to be elastically (blue) and inelastically (red) displaced at the time of maximum compression in the quasi-2D [100] shock 68
Figure 3.11 Normalized histograms of atomic kinetic energies for [100]-shocked PETN material 73
Figure 3.12 Normalized histograms of molecular center-of-mass kinetic energies for [100]-shocked material 74
Chapter 4
Figure 4.1 An RDX molecule and snapshot of the molecular center-of-mass locations in the simulation cell prior to shock 92
Figure 4.2 Snapshots of molecular centers of mass and velocity fields during pore collapse at three instants of time for the 1.0 km·s-1 95
Figure 4.3 Snapshots of molecular centers of mass and velocity fields during pore collapse at three instants of time for the 2.0 km·s-1 98
Figure 4.4 Snapshots of molecular centers of mass and velocity fields during pore collapse at three instants of time for the 3.0 km·s-1 100
Figure 4.5 Rotational autocorrelation functions during and after pore collapse 103
Figure 4.6 Rotational-vibrational temperatures just after pore closure and at the time of maximum compression 109
Figure 4.7 Spatial profiles of temperature and longitudinal stress parallel to the shock direction 111
viii

ix
LIST OF TABLES
Chapter 2
Table 2.1 Lattice parameters and volume for a single unit cell of RDX 31
Table 2.2 Lattice parameters and volume for a single unit cell of PETN 36
Chapter 4
Table 4.1 Rotational time constants for RDX 105

Chapter 1: A Brief Introduction to Energetic Materials
Chapter 1: A Brief Introduction to Energetic Materials
1.1 Material Response
A detailed understanding of how a material responds to some external stimulus is
necessary to fully understand how that material functions. Responses to strong stimuli are
generally complex processes involving chemical, mechanical, and thermodynamic
changes to the system. Here, a mechanical response refers to an applied force producing a
change in the structure of the material through non-chemical rearrangement of the
constituent atoms and molecules. The thermodynamic response involves the conversion
of mechanical energy to thermal energy, or heat, along with how the thermal energy is
distributed throughout the material. Chemical response refers to the redistribution of
electrons among atoms along with the associated breaking and forming of bonds. These
responses are by no means independent from each other but instead are highly inter-
connected with one response type affecting all others in some manner.
Information on material response is vital in a variety of fields. Prescription
medications are pressed into pellets at high pressures; therefore, an understanding of the
response of the molecules is required to ensure that there is not a change in the structure
of the active ingredients. Hoses in automobiles are made of rubber compounds that are
composite materials consisting of polymer, fillers, plasticizers, and special purpose
ingredients. The rubber materials are subjected to high temperatures and aggressive
fluids; the engineer must be certain that the hose will maintain its integrity in this extreme
environment. Explosives are extremely energetic and potentially dangerous materials that
are also a composite material. A thorough understanding of how an explosive responds to
1

Chapter 1: A Brief Introduction to Energetic Materials
stimulus is vital to the evaluation of the safety and performance of that explosive. This
work will be concerned with the primary energetic ingredients in explosives and the
response of these ingredients to strong impacts.
1.2 Energetic Materials
Energetic materials (EM) are the key active ingredients in explosives responsible
for the signature energy release achieved upon detonation. The typical EM is usually an
organic crystal that often contains some type of nitro functionality. Some examples of
energetic materials are pentaerythritol tetranitrate (PETN), hexahydro-1,3,5-trinitro-
1,3,5-s-triazine (RDX), octahydro-1,3,5,7-tetranitro-1,3,5,7-tetrazocine (HMX), 2,4,6-
trinitrotoluene (TNT), and 2,4,6-triamino-1,3,5-trinitrobenzene (TATB). Explosive
formulations are usually a composite material consisting of energetic materials,
plasticizers, bonding agents, and fillers. The term plastic bonded explosive (PBX) is often
used to label these composite materials. Explosives are often divided into two classes
based on sensitivity: primary and secondary. Primary explosives require only a very
small amount of external stimulus and are initiated fairly easily. Secondary explosives are
less sensitive than primary explosives and require a greater amount of stimulus to initiate
detonation. Energetic materials are distinguished by the fact that they store large amounts
of potential energy in conjunction with the capability to release this stored energy very
rapidly. Release of stored potential energy occurs when detonation is initiated in the
material.
Detonation in an EM is often initiated by generation of a shock wave that travels
through the material causing mechanical deformations and large jumps in the
2

Chapter 1: A Brief Introduction to Energetic Materials
thermodynamic properties, including temperature and stress. Sufficiently high
temperatures and stresses can cause chemical reactions that lead to a detonation wave in
the material.1 The initiation-to-detonation transition in EMs is an extremely complex
process that is not currently fully understood. A better understanding of EM shock
response would lead to safety and performance improvements during real-world
applications of explosives.
The very characteristics that make energetic materials useful also serve to impede
easy access to a complete understanding of the initiation-to-detonation process. Initiation
processes occur across extremely small spatial and temporal scales, angstrom distances
and femtosecond times, which are difficult to satisfactorily resolve with currently
available experimental techniques. Further complications arise due to the destructive
effect associated with energy release that makes analysis difficult. Thus, purely
experimental methods are not able to provide the full range of information needed to
achieve a complete understanding of detonation.
Computer simulations are able to augment experimental data by examining shock
wave phenomena on spatial and temporal scales that are difficult to resolve through
experimental methods alone. Simulations at the mesoscale (0.1 – 1,000 µm) make use of
hydrodynamic simulation codes to model an energetic material as a continuum system.
Hydrocodes require an equation of state for the reactants and products to predict thermo-
mechanical properties in a sample of material. Even smaller than the mesoscale is the
atomic scale, which is within the domain of Molecular Dynamics (MD) simulations.
Molecular dynamics simulations use classical equations of motion to compute the
3

Chapter 1: A Brief Introduction to Energetic Materials
trajectories of the individual atoms, providing a time history of atomic positions and
velocities from which various thermo-mechanical properties can be calculated.
There are different strengths and weaknesses associated with each method making
the choice of appropriate method dependent upon the phenomenon of interest to be
studied. The ideal goal is to combine information from simulations (both MD and
hydrocodes) with experimental data to be able to describe all the dynamic processes from
the microscale to the macroscale involved in the initiation-to-detonation transition in an
energetic material. This work will focus on the application of molecular dynamics to the
study of energetic materials and how this information contributes to the current
knowledge base of energetic materials.
1.3 Shock waves
1.3.1 Continuity Equations
It is useful to establish some basic theoretical principles associated with the
continuum description of shock waves in energetic materials. Once detonation is
achieved in an energetic material, a shock wave travels through the material causing a
change in the thermodynamic properties. Mathematically, a shock wave can be regarded
as a discontinuity in the gradient of the flow variables (density, velocity, pressure, and
energy). The jumps in the flow variables that occur across the discontinuity are described
by the equations of continuity2
(1.1)
4

Chapter 1: A Brief Introduction to Energetic Materials
(1.2)
(1.3)
where ρ is the density, p is the pressure, u is the velocity, and ε is the internal energy. The
subscript 1 denotes shocked material “behind the shock front” and the subscript 0 denotes
un-shocked material “in front of the shock.”
It is possible to relate equations 1.1 – 1.3 to some useful physical explanations.
Equation 1.1 is the conservation of mass which states that the mass flow into the
discontinuity is equal to the mass flow out of the discontinuity. Equation 1.2 is the
conservation of momentum flux density; simple rearrangement to
(1.4)
indicates that the change in momentum across a plane is due to the pressure on that plane.
Equation 1.3 expresses the conservation of energy and states that the increase in the
internal (ε) and kinetic (u2/2) energies is due to the work done by the pressure forces.
Another useful equation is the Hugoniot relation which defines an equation of
state for the energy as a function of pressure and specific volume on each side of the
discontinuity. The Hugoniot is the locus of final states available to the system dependent
upon the given initial set of conditions (pressure, density, volume). The Hugoniot energy
equation is given by
(1.5)
The Hugoniot locus can be depicted in various forms but is often shown in the p-V plane
or in the us – up plane (or shock wave velocity and particle velocity plane). One is thus
5

Chapter 1: A Brief Introduction to Energetic Materials
able to predict the final shock wave velocity us when the initial particle velocity up is
known. Another useful relation that can be derived from the Hugoniot equation is the
Rankine-Hugoniot shock pressure
(1.6)
This relation allows determination of the shock pressure when one knows the initial
density, initial piston velocity, and shock velocity.
Continuum scale computer simulations make use of the continuity equations and
equations of state to propagate a system forward in time. However, MD simulations such
as those performed in this work usually do not explicitly include the continuity equations
in the propagation calculations (although mention must be made of special “Hugoniostat”
methods3-5 used in MD that drive the system to a specific point on the Hugoniot locus).
Instead the importance of the continuity equations is realized during the post-simulation
analysis of data where the shock wave produces much different properties in the shocked
material compared to unshocked material.6,7 The effect of these jumps in temperature and
stress on the molecular scale response of the material is the primary concern in this work.
1.3.2 Deformation
Strong stresses on a material can result in a structural rearrangement as the atoms
or molecules undergo translational and orientational motion relative to each other;
additionally, in the case of molecules, changes in molecular conformation can occur. At
low stresses an elastic response is probable in which atoms will move closer or farther
apart depending upon whether the stress is compressive or tensile in nature, respectively
6

Chapter 1: A Brief Introduction to Energetic Materials
(removal of the stress will result in atoms returning to their original lattice positions).
Plastic, or inelastic, deformation occurs once enough stress is applied to the system to
exceed the elastic limit. Plastic deformation is essentially an irreversible movement of
atoms in the material (removal of the stress will not result in the atoms returning to their
original lattice positions).
Deformation is affected by any pre-existing defects in the material that disrupt the
perfect lattice structure. There are several types of defects that can occur, including but
not limited to chemical impurities, vacancies, voids, interstitial atoms/molecules, stacking
faults, grain boundaries, and dislocations.8,9 This work will primarily be concerned with
dislocation defects that occur in previously defect-free crystals and with crystals that
contain void regions. A vacancy defect is one in which a atom/molecule is missing from a
lattice site. Void defects are volumes of space in the material where groups of atoms or
molecules are missing. Dislocations are regions in the crystal where planes of atoms or
molecules are displaced from each other relative to the perfect crystal lattice structure.
The glide of dislocations is referred to as slip, which occurs along a defined plane called
the slip plane. A slip plane in conjunction with a slip direction defines a slip system. For
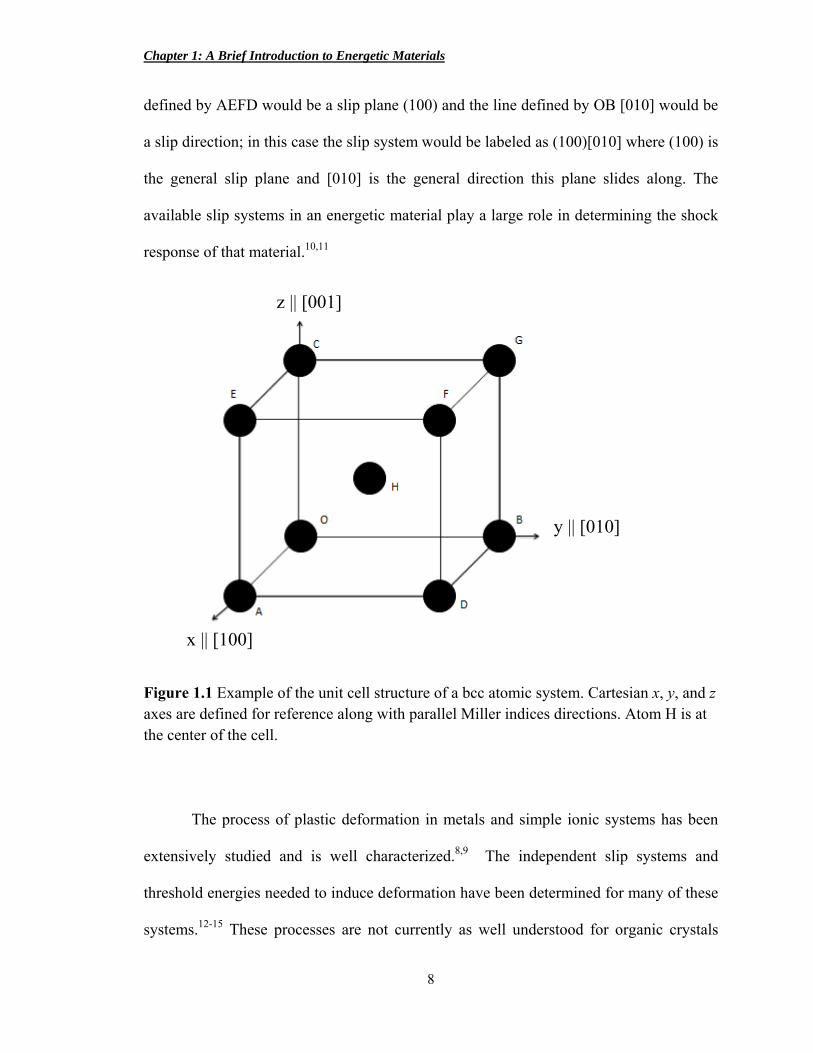
example, refer to the simple representation of a body-centered unit cell in Figure 1.1. (A
quick note on notation used here: Miller indices are used to label planes and directions,
with parentheses indicating a general plane, e.g. (100), and brackets indicating a general
direction, e.g. [100]. The Cartesian frame used in the studies here is such that [100] is
parallel to x, [010] is parallel to y, and [001] is parallel to z. The notation for planes in our
Cartesian reference frame is as follows: (100) is normal to the [100] direction, (010) is
normal to the [010] direction, and (001) is normal to the [001] direction.) The plane
7
Chapter 1: A Brief Introduction to Energetic Materials
defined by AEFD would be a slip plane (100) and the line defined by OB [010] would be
a slip direction; in this case the slip system would be labeled as (100)[010] where (100) is
the general slip plane and [010] is the general direction this plane slides along. The
available slip systems in an energetic material play a large role in determining the shock
response of that material.10,11
z || [001]
y || [010]
x || [100]
Figure 1.1 Example of the unit cell structure of a bcc atomic system. Cartesian x, y, and z axes are defined for reference along with parallel Miller indices directions. Atom H is at the center of the cell.
The process of plastic deformation in metals and simple ionic systems has been
extensively studied and is well characterized.8,9 The independent slip systems and
threshold energies needed to induce deformation have been determined for many of these
systems.12-15 These processes are not currently as well understood for organic crystals
8

Chapter 1: A Brief Introduction to Energetic Materials
such as energetic materials due in large part to a much more complicated lattice structure.
Even when considering materials that are not highly reactive, such as sucrose, there is
still a gap in the knowledge base.16 Metals have only the 3N degrees of freedom
associated with translational motion whereas organic crystals possess those 3N
translational degrees of freedom along with far more additional degrees of freedom
associated with rotational and vibrational motions of the molecules. Organic crystals
have a more complex chemical environment with a variety of atom types containing
different electronic structures which lead to more complicated particle-particle
interactions.
1.4 Historical analysis and data
1.4.1 Experimental
Much effort has been invested in the study of explosives since even the early
discovery of the energetic effects of black powder centuries ago.17 An exhaustive list of
even just the experimental work done over the past few decades is far beyond the scope
of this work (see for example, SCCM proceedings18 and International Detonation
Symposium proceedings19); instead mention will be made of some of the important
studies that are relevant to the concepts explored in this work. The primary methods of
experimental study have focused on the use of engineering-oriented techniques with the
goal of characterizing sensitivity and performance of a given explosive.20
Deformation processes play a key role in determining the sensitivity of
explosives; therefore much emphasis is placed on understanding the localized plastic
9

Chapter 1: A Brief Introduction to Energetic Materials
response of energetic materials, especially in knowing the available slip systems for a
given material. Hardness indentation methods in conjunction with topography techniques,
such as atomic force microscopy, are often used to identify the dominant slip systems in
crystals of energetic materials.21-24 An indenter is pressed into a chosen surface
orientation of crystal material producing a load-depth curve from which information
about elastic-plastic response can be obtained. Scanning the indentation with a
topography technique such as AFM provides information about the slip systems activated
during plastic deformation from the indentation. For example, this method has been used
to identify slip systems in two materials studied in this thesis, PETN and RDX.25
Recently, nanoindentation has been combined with MD studies to obtain hardness values,
elastic moduli, and dynamic coefficient of friction of deformation for various surfaces of
RDX.26
It was mentioned previously that explosives can be categorized as primary or
secondary based on the relative sensitivity of the explosive. Special emphasis has been
placed on learning what characteristics of a material determine sensitivity. Impact
sensitivity is often assessed by drop weight tests in which a weight is dropped onto a
sample of explosive with the height of the initial release point varied to obtain an H50
value (the height at which the impact triggers an observable decomposition of the
explosive 50% of the time). Attempts have been made to correlate H50 values with some
structural or chemical properties to understand what determines sensitivity in an energetic
material. A few examples of properties for which this has been attempted include
electrostatic potential,27 oxygen balance and nitro group charge,28 crystal size,29 and bond
dissociation energies.30 Even though the drop weight tests can give a relative ranking of
10
Chapter 1: A Brief Introduction to Energetic Materials
impact sensitivity, the method is not without flaws. Mathieu31 points out the H50 values
are sensitive to factors beyond just chemical composition and recommends gap tests as a
more reliable measure of sensitivity, although the increased difficulty performing the test
means less experimental information is available for analysis. The large amount of
readily available H50 values means that much insight can still be gained by correlating
structural and chemical properties to this relative sensitivity ranking.
Plate impact experiments are a technique where a thin sample of material is
impacted with a flyer plate in order to generate a planar shock wave. This technique can
then be coupled with other analysis methods to gather information on the shock response
of the material. Velocity interferometer system for any reflector (VISAR) is a flyer plate
method from which is obtained a profile of surface velocity as a function of time.32 The
velocity profile can be used to obtain useful information, such as when a transition from
an elastic wave to a plastic wave occurs in a shocked crystal,32 or to identify differences
in the response of crystals that are shocked along different orientations.33,34 Examples of
plate impact methods in conjunction with spectroscopy analysis include emission
spectroscopy to determine decomposition pathways in shocked energetic materials,34,35
Raman spectroscopy to study phase changes in shocked crystals36 and crystals
compressed in a diamond anvil cell,37 and ultrasound spectroscopy to determine elastic
constants.38
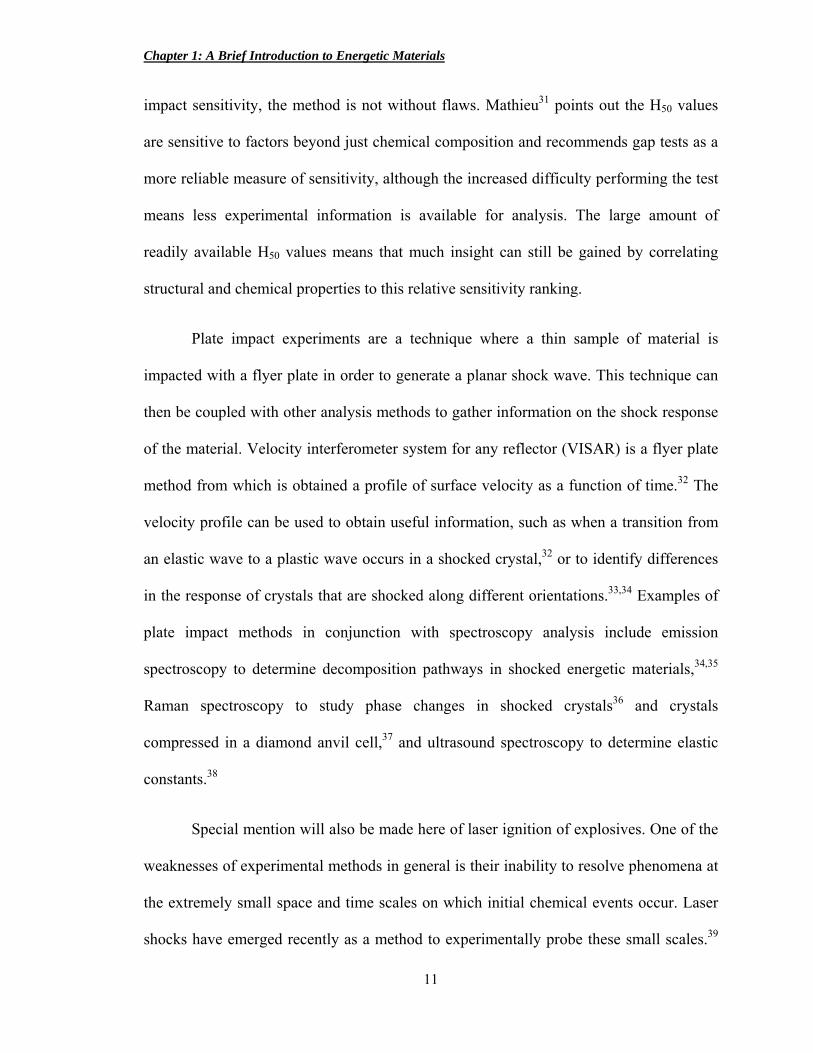
Special mention will also be made here of laser ignition of explosives. One of the
weaknesses of experimental methods in general is their inability to resolve phenomena at
the extremely small space and time scales on which initial chemical events occur. Laser
shocks have emerged recently as a method to experimentally probe these small scales.39
11
Chapter 1: A Brief Introduction to Energetic Materials
Initial work using laser shocks on metal films was able to produce shock wave rise times
of less than 6.25 ps for shock fronts that were only a few tens of lattice spacings in
length.40 Subsequent studies have continued to resolve short time scale events in laser
driven shocks on metal films.41
The works referenced in the preceding paragraphs are a very small sampling of
the experimental data available for energetic materials. The studies mentioned here are
intended as examples to highlight the ideas of sensitivity, deformation, and shock
response which are of greatest concern in this work. The interested reader is referred to
the reviews by Armstrong and Elban23 and Bouma et al.42 for a more complete listing of
experimental works.
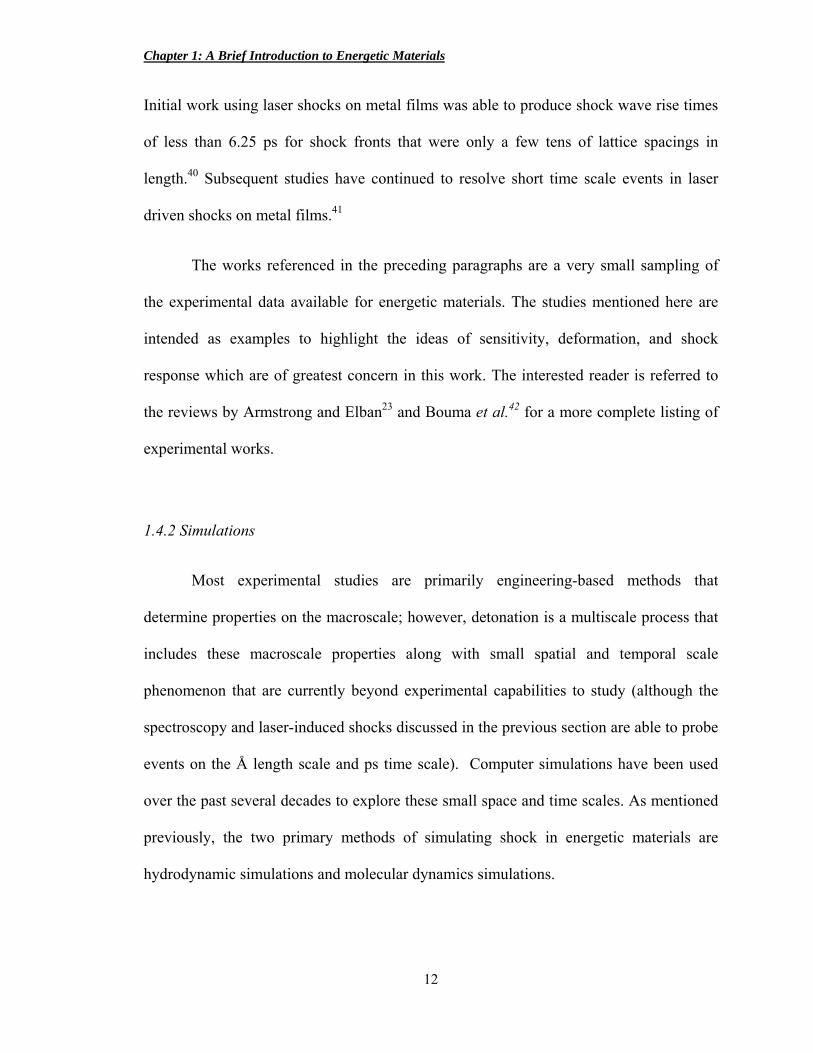
1.4.2 Simulations
Most experimental studies are primarily engineering-based methods that
determine properties on the macroscale; however, detonation is a multiscale process that
includes these macroscale properties along with small spatial and temporal scale
phenomenon that are currently beyond experimental capabilities to study (although the
spectroscopy and laser-induced shocks discussed in the previous section are able to probe
events on the Å length scale and ps time scale). Computer simulations have been used
over the past several decades to explore these small space and time scales. As mentioned
previously, the two primary methods of simulating shock in energetic materials are
hydrodynamic simulations and molecular dynamics simulations.
12
Chapter 1: A Brief Introduction to Energetic Materials
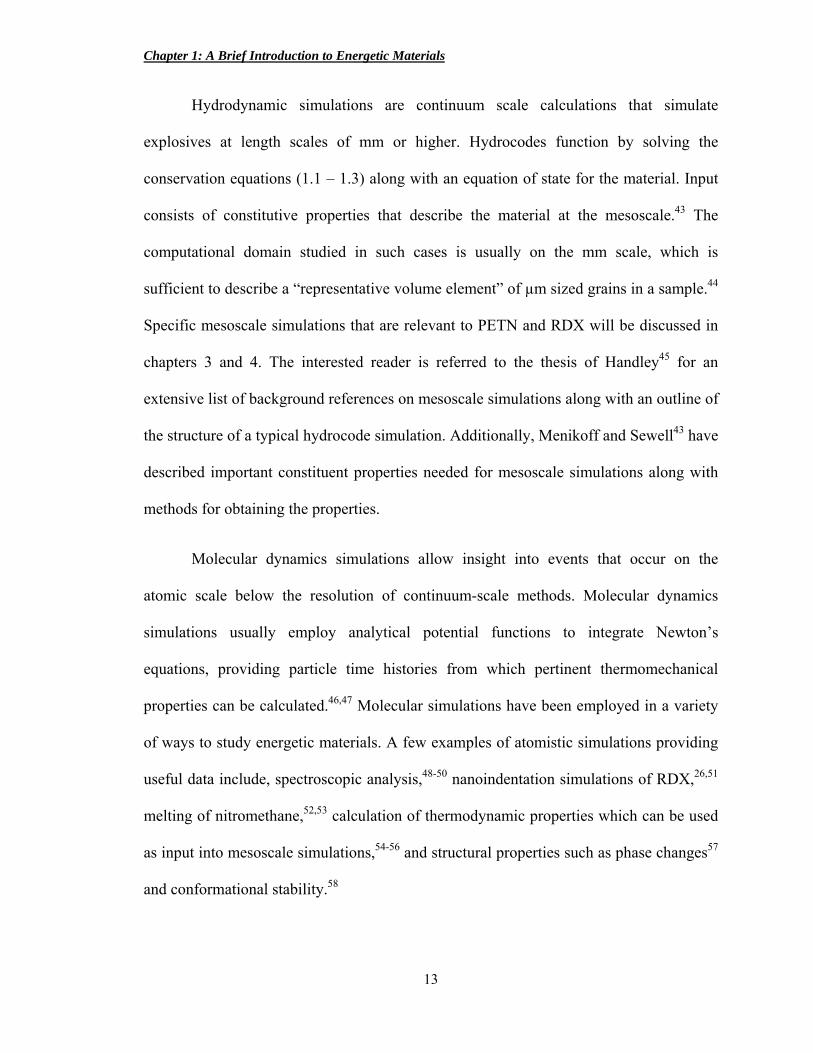
Hydrodynamic simulations are continuum scale calculations that simulate
explosives at length scales of mm or higher. Hydrocodes function by solving the
conservation equations (1.1 – 1.3) along with an equation of state for the material. Input
consists of constitutive properties that describe the material at the mesoscale.43 The
computational domain studied in such cases is usually on the mm scale, which is
sufficient to describe a “representative volume element” of µm sized grains in a sample.44
Specific mesoscale simulations that are relevant to PETN and RDX will be discussed in
chapters 3 and 4. The interested reader is referred to the thesis of Handley45 for an
extensive list of background references on mesoscale simulations along with an outline of
the structure of a typical hydrocode simulation. Additionally, Menikoff and Sewell43 have
described important constituent properties needed for mesoscale simulations along with
methods for obtaining the properties.
Molecular dynamics simulations allow insight into events that occur on the
atomic scale below the resolution of continuum-scale methods. Molecular dynamics
simulations usually employ analytical potential functions to integrate Newton’s
equations, providing particle time histories from which pertinent thermomechanical
properties can be calculated.46,47 Molecular simulations have been employed in a variety
of ways to study energetic materials. A few examples of atomistic simulations providing
useful data include, spectroscopic analysis,48-50 nanoindentation simulations of RDX,26,51
melting of nitromethane,52,53 calculation of thermodynamic properties which can be used
as input into mesoscale simulations,54-56 and structural properties such as phase changes57
and conformational stability.58
13

Chapter 1: A Brief Introduction to Energetic Materials
The first example of MD application to a shock-wave like phenomenon is
attributed to a study of radiation cascade damage in 1960.59 Holian contributed greatly to
much of the pioneering early work on computer simulations of shock waves.60-63 The
initial work consisted of shock waves in 1D chains60 followed shortly thereafter by
shocks in 3D systems.61,63 Good agreement was even found between the thermodynamic
variables of an argon-like system calculated from MD and Navier-Stokes continuum
mechanics.62
The focus of the present studies is on shock waves in molecular energetic
materials, a topic that has seen increased MD application over the past couple of decades
as more powerful computational resources became available allowing for simulations
employing more complicated molecular descriptions. An in-depth discussion of computer
simulations of shock waves will be deferred to later chapters to place them in context of
specific projects.
1.5 Predictive capability goals
The goal of energetic material research is centered on the ideas of safety and
performance, in other words the development of explosives that are not easily triggered in
accident scenarios and that reliably produce the desired energy release at the appropriate
time following an intended stimulus. A prime example of increased safety and
performance is the evolution of nitroglycerin usage when it was first developed.17,64 Pure
nitroglycerin is extremely unstable and resulted in many deaths due to accidental
detonation during handling. The development of blasting caps and mixing with
diatomaceous earth produced the much safer material known as dynamite. This goal has
14
Chapter 1: A Brief Introduction to Energetic Materials
not changed for present-day explosive development and application. The desire is to
eliminate unintentional detonation while at the same time still producing a strong energy
release.
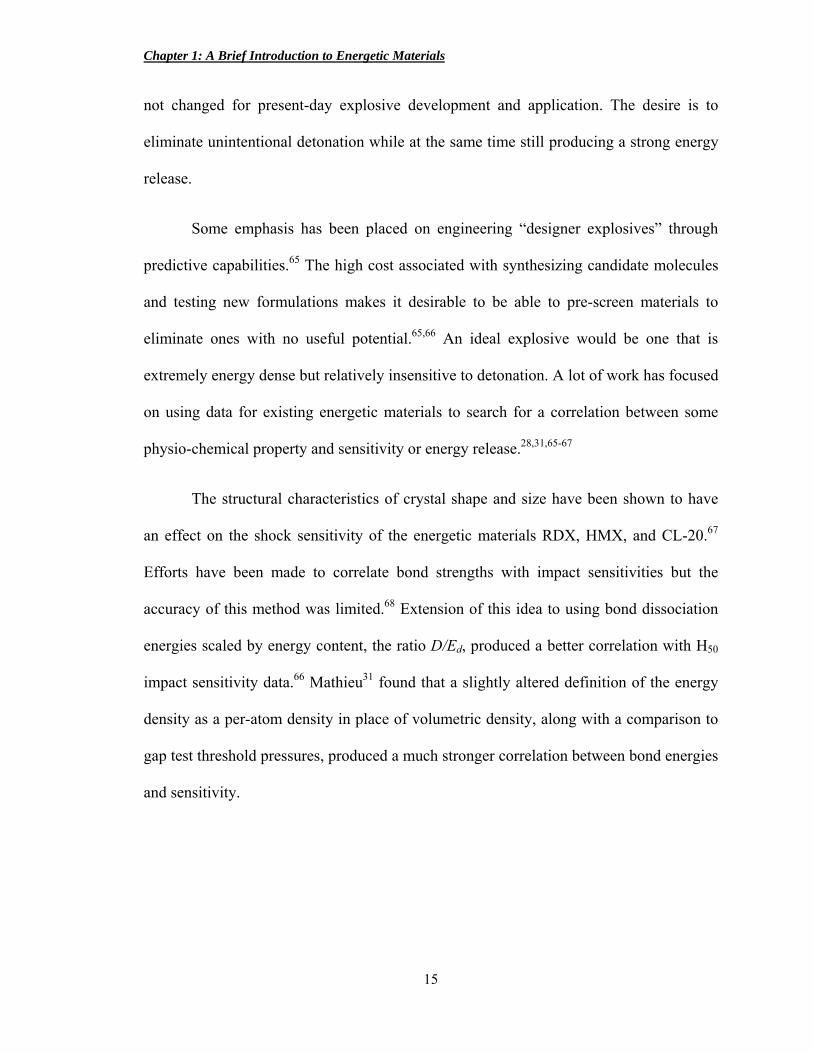
Some emphasis has been placed on engineering “designer explosives” through
predictive capabilities.65 The high cost associated with synthesizing candidate molecules
and testing new formulations makes it desirable to be able to pre-screen materials to
eliminate ones with no useful potential.65,66 An ideal explosive would be one that is
extremely energy dense but relatively insensitive to detonation. A lot of work has focused
on using data for existing energetic materials to search for a correlation between some
physio-chemical property and sensitivity or energy release.28,31,65-67
The structural characteristics of crystal shape and size have been shown to have
an effect on the shock sensitivity of the energetic materials RDX, HMX, and CL-20.67
Efforts have been made to correlate bond strengths with impact sensitivities but the
accuracy of this method was limited.68 Extension of this idea to using bond dissociation
energies scaled by energy content, the ratio D/Ed, produced a better correlation with H50
impact sensitivity data.66 Mathieu31 found that a slightly altered definition of the energy
density as a per-atom density in place of volumetric density, along with a comparison to
gap test threshold pressures, produced a much stronger correlation between bond energies
and sensitivity.
15
Chapter 1: A Brief Introduction to Energetic Materials
1.6 Thesis Outline
Background information was presented in this chapter on important concepts
needed to understand the function of energetic materials. Specifically, the importance of
understanding the response of energetic materials, the challenges associated with
obtaining that information, and the goal of enhanced predictive capability were all
highlighted. The rest of this thesis will focus on the use of molecular dynamics
simulations to gain insight into the mechanical response of shocked PETN and RDX at
the atomic scale. Chapter 2 will discuss the method of molecular dynamics along with the
details for application to PETN and RDX. In chapter 3, anisotropic shock deformation of
PETN is studied in the context of explaining orientation-dependent detonation initiation
thresholds observed in experimental studies. Shock induced void collapse as a potential
source of hot spots in RDX is discussed in chapter 4. Chapter 5 will identify deficiencies
in the current studies and possibilities for future work.
16
Chapter 1: A Brief Introduction to Energetic Materials
References
(1) Menikoff, R. Combustion Theory and Modelling 2006, 10, 1003. (2) Zel'dovich, Y. B.; Raizer, Y. P. Physics of Shock Waves and High‐Temperature
Hydrodynamic Phenomena; Dover Publications, Inc., 2002. (3) Maillet, J. B.; Mareschal, M.; Soulard, L.; Ravelo, R.; Lomdahl, P. S.; Germann, T. C.;
Holian, B. L. Physical Review E 2000, 63, 016121. (4) Ravelo, R.; Holian, B. L.; Germann, T. C.; Lomdahl, P. S. Physical Review B 2004, 70,
014103. (5) Bedrov, D.; Hooper, J. B.; Smith, G. D.; Sewell, T. D. The Journal of Chemical Physics
2009, 131, 034712. (6) Hardy, R. J. The Journal of Chemical Physics 1982, 76, 622. (7) Root, S.; Hardy, R. J.; Swanson, D. R. The Journal of Chemical Physics 2003, 118, 3161. (8) Hull, D.; Bacon, D. J. Introduction to Dislocations; Third ed.; Pergamon Press: New York,
1984. (9) Hirth, J. P.; Lothe, J. Theory of Dislocations; John Wiley & Sons: New York, 1982. (10) Groves, G. W.; Kelly, A. Philosophical Magazine 1963, 8, 877. (11) Kocks, U. F. Philosophical Magazine 1964, 10, 187. (12) Duesbery, M. S.; Vitek, V. Acta Materialia 1998, 46, 1481. (13) Ismail‐Beigi, S.; Arias, T. A. Physical Review Letters 2000, 84, 1499. (14) Cawkwell, M. J.; Nguyen‐Manh, D.; Woodward, C.; Pettifor, D. G.; Vitek, V. Science 2005,
309, 1059. (15) Bringa, E. M.; Caro, A.; Wang, Y.; Victoria, M.; McNaney, J. M.; Remington, B. A.; Smith,
R. F.; Torralva, B. R.; Van Swygenhoven, H. Science 2005, 309, 1838. (16) Ramos, K. J.; Bahr, D. F. Journal of Materials Research 2007, 22, 2037. (17) Anderson, K. J. MRS Bulletin 1989, 14, 84. (18) In 2013 Shock Compression of Condensed Matter Conference Proceedings; Collins, G.,
Moore, D. S., Yoo, C. S., Eds. Seattle, WA, 2013. (19) In International Detonation Symposium Proceedings. (20) Armstrong, R. W. Rev. Adv. Mater. Sci. 2009, 19, 13. (21) Ramos, K. J.; Hooks, D. E.; Bahr, D. F. Philosophical Magazine 2009, 89, 2381. (22) Elban, W. L.; Hoffsommer, J. C.; Armstrong, R. W. J Mater Sci 1984, 19, 552. (23) Armstrong, R. W.; Elban, W. L. Materials Science and Technology 2006, 22, 381. (24) Jing, Y.; Zhang, Y.; Blendell, J.; Koslowski, M.; Carvajal, M. T. Crystal Growth & Design
2011, 11, 5260. (25) Gallagher, H. G.; Halfpenny, P. J.; Miller, J. C.; Sherwood, J. N.; Tabor, D. Philosophical
Transactions of the Royal Society of London. Series A: Physical and Engineering Sciences 1992, 339, 293.
(26) Weingarten, N. S.; Sausa, R. C. The Journal of Physical Chemistry A 2015, 119, 9338. (27) Rice, B. M.; Hare, J. J. The Journal of Physical Chemistry A 2002, 106, 1770. (28) Cao, C.; Gao, S. The Journal of Physical Chemistry B 2007, 111, 12399. (29) Armstrong, R. W.; Coffey, C. S.; DeVost, V. F.; Elban, W. L. Journal of Applied Physics
1990, 68, 979. (30) Rice, B. M.; Sahu, S.; Owens, F. J. Journal of Molecular Structure: THEOCHEM 2002, 583,
69. (31) Mathieu, D. The Journal of Physical Chemistry A 2012, 116, 1794. (32) Barker, L. M.; Hollenbach, R. E. Journal of Applied Physics 1972, 43, 4669. (33) Hooks, D. E.; Ramos, K. J.; Martinez, A. R. Journal of Applied Physics 2006, 100, 024908.
17

Chapter 1: A Brief Introduction to Energetic Materials
(34) Dang, N. C.; Dreger, Z. A.; Gupta, Y. M.; Hooks, D. E. The Journal of Physical Chemistry A 2010, 114, 11560.
(35) Dreger, Z. A.; Gruzdkov, Y. A.; Gupta, Y. M.; Dick, J. J. The Journal of Physical Chemistry B 2001, 106, 247.
(36) Patterson, J. E.; Dreger, Z. A.; Gupta, Y. M. The Journal of Physical Chemistry B 2007, 111, 10897.
(37) Dreger, Z. A.; Gupta, Y. M. The Journal of Physical Chemistry B 2007, 111, 3893. (38) Schwarz, R. B.; Hooks, D. E.; Dick, J. J.; Archuleta, J. I.; Martinez, A. R. Journal of Applied
Physics 2005, 98. (39) Bourne, N. K. Proceedings of the Royal Society of London. Series A: Mathematical,
Physical and Engineering Sciences 2001, 457, 1401. (40) Gahagan, K. T.; Moore, D. S.; Funk, D. J.; Rabie, R. L.; Buelow, S. J.; Nicholson, J. W.
Physical Review Letters 2000, 85, 3205. (41) Whitley, V. H.; McGrane, S. D.; Eakins, D. E.; Bolme, C. A.; Moore, D. S.; Bingert, J. F.
Journal of Applied Physics 2011, 109. (42) Bouma, R. H. B.; van der Heijden, A. E. D. M.; Sewell, T.; Thompson, D. L. In Numerical
Simulations; Awrejcewicz, J., Ed.; InTech: 2011, p 29. (43) Menikoff, R.; Sewell, T. D. Combustion Theory and Modelling 2002, 6, 103. (44) Baer, M. R. Thermochimica Acta 2002, 384, 351. (45) Handley, C. Numerical Modeling of two HMX‐based plastic‐bonded explosives at the
mesoscale, St. Andrews University, 2011. (46) Allen, M. P.; Tildesley, D. J. Computer Simulation of Liquids; Oxford University Press:
New York, 1987. (47) Frenkel, D.; Smit, B. Understanding Molecular Simulation: From Algorithms to
Applications; First ed.; Academic Press: San Diego, 2002. (48) Strachan, A. The Journal of Chemical Physics 2004, 120, 1. (49) Piryatinski, A.; Tretiak, S.; Sewell, T. D.; McGrane, S. D. Physical Review B 2007, 75,
214306. (50) Pereverzev, A.; Sewell, T. D. The Journal of Chemical Physics 2011, 134, 014513. (51) Chen, Y. C.; Nomura, K. I.; Kalia, R. K.; Nakano, A.; Vashishta, P. Applied Physics Letters
2008, 93. (52) Agrawal, P. M.; Rice, B. M.; Thompson, D. L. The Journal of Chemical Physics 2003, 119,
9617. (53) Zheng, L.; Luo, S. N.; Thompson, D. L. The Journal of Chemical Physics 2006, 124, 154504. (54) Bedrov, D.; Smith, G. D.; Sewell, T. D. Chemical Physics Letters 2000, 324, 64. (55) Zaoui, A.; Sekkal, W. Solid State Communications 2001, 118, 345. (56) Sewell, T. D.; Menikoff, R.; Bedrov, D.; Smith, G. D. The Journal of Chemical Physics 2003,
119, 7417. (57) Munday, L. B.; Chung, P. W.; Rice, B. M.; Solares, S. D. The Journal of Physical Chemistry
B 2011, 115, 4378. (58) Mathew, N.; Picu, R. C. The Journal of Chemical Physics 2011, 135, 024510. (59) Gibson, J. B.; Goland, A. N.; Milgram, M.; Vineyard, G. H. Physical Review 1960, 120,
1229. (60) Holian, B. L.; Straub, G. K. Physical Review B 1978, 18, 1593. (61) Holian, B. L.; Straub, G. K. Physical Review Letters 1979, 43, 1598. (62) Holian, B. L.; Hoover, W. G.; Moran, B.; Straub, G. K. Physical Review A 1980, 22, 2798. (63) Holian, B. L. Physical Review A 1988, 37, 2562. (64) Anderson, K. J. MRS Bulletin 1989, 14, 63.
18

Chapter 1: A Brief Introduction to Energetic Materials
19
(65) Rice, B. M.; Byrd, E. F. C. Journal of Materials Research 2006, 21, 2444. (66) Fried, L. E.; Manaa, M. R.; Pagoria, P. F.; Simpson, R. L. Annual Review of Materials
Research 2001, 31, 291. (67) van der Heijden, A. E. D. M.; Bouma, R. H. B.; van der Steen, A. C. Propellants, Explosives,
Pyrotechnics 2004, 29, 304. (68) Politzer, P.; Murray, J. S. Journal of Molecular Structure 1996, 376, 419.

Chapter 2: Molecular Dynamics: Basic Principles and Application to Energetic Materials
Chapter 2: Molecular Dynamics: Basic Principles and Application to Energetic Materials 2.1 Molecular dynamics simulations methodology
Molecular Dynamics is a simulation method in which particle motion is
determined by the laws of classical mechanics.1,2 Particles are moved forward in time by
a numerical integration scheme that solves the classical equations of motion in either
Newtonian, Hamiltonian, or Lagrangian form; for example, the equation of motion in
Newtonian form is
(2.1)
Equation 2.1 is the essential requirement for calculating a classical trajectory. Starting
with initial phase space coordinates (positions and momenta) and knowledge of the
potential energy surface for a system of particles, one can use Equation 2.1 to calculate
the forces on the particles and predict their phase space coordinates at some later time.
Trajectory integration is fundamentally solving an initial value problem by finite
difference methods. There are a wide variety of finite difference algorithms available for
solution of the differential equations such as predictor-corrector methods, the Runge-
Kutta-Gill3 integrator, or various forms of the Verlet4 algorithm. There are many
additional algorithms available to integrate equations of motion,5,6 with those listed
providing a few of the more well-known and commonly used examples. When choosing
an integrator, one desires a method that is both accurate and efficient. Accuracy refers to
tracing a path through phase space as closely as possible to the true trajectory while
efficiency refers to a low computational demand. All simulations performed in this work
employed the velocity version7 of the Verlet algorithm, which has demonstrated both
20
Chapter 2: Molecular Dynamics: Basic Principles and Application to Energetic Materials
accuracy and efficiency.8 Trajectory integration yields the phase space coordinates of the
system as a function of time starting from a given set of initial conditions; from this data
one can calculate thermal and mechanical properties relevant to the phenomenon being
studied. Given access to forces, a molecular dynamics “experiment” can conceptually be
thought to proceed in three major steps:
1) Initial conditions selection
2) Trajectory integration
3) Analysis
Initial conditions refers to the initial positions of atoms in space to define a
simulation cell along with specification of appropriate parameters for running the
simulation. For liquids, the construction can be crudely accomplished simply by random
placement of particles inside the simulation cell at a density matching the liquid state,
while taking care to prevent any atomic overlap. Simulation cell construction of a solid
can be accomplished by taking the atomic coordinates of a single unit cell from
crystallographic data and replicating additional unit cells along the crystal axes until the
desired simulation cell dimensions are reached. Simulation cell edge lengths on the order
of a few tens to hundreds of Å are sufficient for calculating elastic constants;9,10 lattice
parameters and isothermal compression curves;10 examining vibrational mode
excitation;11 or studying stress-induced phase transitions.12 Performing shock simulations
requires sizes that are on the order of hundreds to thousands of Å to allow sufficient time
for events such as deformation occurring behind the shock front to evolve.13,14
21

Chapter 2: Molecular Dynamics: Basic Principles and Application to Energetic Materials
Sizes on the order of thousands of Å on a side are the largest possible for
molecularly complex substances with currently available computing power. These
dimensions are much too small to be representative of real macroscopic materials.
Periodic boundary conditions are used to partially overcome the problem of size
limitations.1 The constructed simulation cell is the central cell with replica images
existing on a periodic lattice in three dimensions. If a molecule crosses one face of the
cell a replica image molecule enters the corresponding face on the other side of the cell.
In this manner a bulk macroscopic material is simulated. Careful consideration must go
into any cell construction to avoid unrealistic artifacts in the results that are the product of
the setup. For example, finite-size effects can occur when using simulation cell sizes that
are too small even if PBCs are used. Initial atomic velocities must also be selected to go
along with the Cartesian coordinates; a random sampling of velocities from the Maxwell
distribution at the desired temperature is appropriate for initial assignment, though this is
usually followed by some amount of equilibration. However, random velocity sampling
is not appropriate for all simulations, for example, selective vibrational excitation, in
which case a specific amount of energy is assigned to one or more specific local or
normal vibrational modes.11,15-17
An appropriate integration timestep Δt must be chosen to update the system from
time t to t + Δt. The smaller the timestep the more steps required to advance the
simulation by a given amount, which means more time-consuming force calculations
must be performed. In this regard, the larger the timestep, the better. However, a timestep
that is too large will not properly resolve the short time scale phenomena occurring in the
simulation (e.g. X-H bond vibrations) and will result in inaccurate solutions to the
22

Chapter 2: Molecular Dynamics: Basic Principles and Application to Energetic Materials
equations of motion. It is best to choose a timestep based on the highest frequency
characteristic motion in the simulation. The highest frequency motion for all studies in
this dissertation is the C-H bond vibration with a frequency of about 3000 cm-1, which
gives a vibrational period of about 11 fs. Thus, a timestep no greater than 1 fs is ever used
in these simulations to allow for at least 10 timesteps per C-H vibrational period. Such a
large timestep was only used for equilibration calculations. Smaller timesteps of 0.1 and
0.2 fs are used during the production segments of the simulations so that there are at least
50 timesteps per C-H vibrational period.
Construction of a simulation cell for a crystalline material using the previously
described replication technique results in a perfect crystal with all atoms positioned at
their lattice sites based on the reference structure. Finite temperature materials exhibit
thermal fluctuations of molecular locations and orientations, and intra-molecular
displacements. Thermal equilibration is performed on the simulation cell to obtain a
sample more representative of the fluctuations at a given pressure and temperature.
Equilibration is performed in a statistical mechanical ensemble18 appropriate for studying
the process of interest. In a given ensemble certain external parameters are held constant
while others are allowed to vary. The most commonly used ensembles used in the present
studies are the NVT ensemble, the NPT ensemble, and the microcanonical (NVE)
ensemble. (Note that the italicized letters denote parameters that are held constant. For
example, N is the number of particles, V is the simulation cell volume, P is the simulation
cell pressure, T is the temperature in the cell, and E is the total energy in the cell.)
Once a steady-fluctuating state corresponding to the thermodynamic conditions of
interest has been achieved it is then appropriate to perform the production simulation.
23

Chapter 2: Molecular Dynamics: Basic Principles and Application to Energetic Materials
Data for subsequent analysis is collected during this portion of the simulation to calculate
properties of interest from the time-dependent position and velocity data. The details of
data collection and analysis will vary depending on the problem being studied. These
details will be provided where appropriate in later sections.
2.2 Force fields overview
Trajectory integration is carried out by calculating the forces on all atoms as a
function of position to predict positions at some later time. Specification of initial
Cartesian coordinates and velocities was summarized previously; determination of
subsequent positions and velocities requires knowledge of the forces acting on each
particle as a function of the relative positions of all particles in the system. From
Equation 2.1 it is apparent that the forces on a particle can be calculated through the use
of a potential function. A force field is essentially a mathematical representation of the
potential energy surface for a system of interacting particles. The potential energy for
each particle prescribes how that particle interacts with all other particles in the system.
Some of the earliest computer simulations using force fields for condensed phases
were of simple atomic systems such as noble gases.4,19 The lack of molecular complexity
for simple atomic systems makes describing the potential energy surface comparatively
simple due to intramolecular many-body terms being unnecessary and the sufficiency, to
a first approximation, of using simple pairwise terms to describe all interatomic
interactions between the particles.
24

Chapter 2: Molecular Dynamics: Basic Principles and Application to Energetic Materials
Molecular force fields require more complicated terms to describe particle
interactions than do simple atomic systems due to the need to account for two- and many-
body covalent intramolecular bonded interactions in addition to the non-covalent “non-
bonded” interactions. Covalent (or bonded) interactions include covalent bonds, three-
center angles, torsional angles, and improper dihedrals. The atoms and connectivity of a
molecule of PETN are presented in Figure 2.1. As examples, the atoms labeled C1 and
C2 define a chemical bond; C1, C2, and H7 define a three-body angle; the sequence C1,
C2, O3, and N6 define a torsional angle. Improper dihedrals are generally defined to
maintain planarity among a group of atoms and are measured as an out-of-plane wag. For
example; the atoms O4, O5, and N6 define one plane while O3, N6, and O5 define
another plane; the improper dihedral is the angle between these two planes.
Figure 2.1 Molecular connectivity of a molecule of PETN. Note that the figure is not representative of the 3-dimensional spatial arrangement of PETN.
25

Chapter 2: Molecular Dynamics: Basic Principles and Application to Energetic Materials
Non-bonded terms are needed to describe the interactions between atoms that are not
connected by one of the previously described coordinate types. Examples of such non-
bonded terms include Couloumbic interactions between atomic partial charges and van
der Waals interactions. Atoms N20 and O5 in Figure 2.1 are an example of atoms that are
not directly bonded but potentially can still interact via non-bonded interactions.
Typically, non-bonded interactions are applied to atoms in the same molecule but
separated by three or more covalent bonds and to all atoms belonging to different
molecules. The total potential energy for any given atom in the system (assuming no
external forces) is then the sum of the bonded plus non-bonded terms
(2.2)
Ideally, a developed force field would be parameterized in a manner that allows
atoms of a given type to be transferred from one molecule to another with no loss of
accuracy in the molecular description. One would then be able to more easily compare
and contrast conclusions drawn from different molecular systems. Unfortunately, this
cross-system generalization is not easily achieved due to the complicated, highly variable
environments in molecular systems with different molecular flexibility, reactivity, and
lattice structures. Attempts have been made to develop generalized force fields, in some
cases including chemical reactivity, such as CHARMM,20 AIREBO,21 and ReaxFF22 that
can be applied to any number of different molecular systems with varying degrees of
success. However, the general nature of these force field results in difficulties describing
the complex physics and chemistry that occur over the wide temperature and pressure
ranges that are often of interest for energetic materials.
26

Chapter 2: Molecular Dynamics: Basic Principles and Application to Energetic Materials
Molecular force fields are usually developed by adjusting parameters in analytical
potential functions to the results of quantum chemistry calculations, experiments, and
using input from preceding force fields. These potential functions describe the bonded
and non-bonded interactions in Equation 2.2 in various levels of detail. Typically, the
required computational resources scale upward as the number of defined interactions
increases since more time consuming force calculations are required. Molecular force
fields can be non-reactive and rigid molecule, non-reactive and partially or fully flexible,
or reactive; with the level of computational power increasing accordingly. The increase in
computational resource demand with higher levels of detail is also due to more
complicated functions being used to describe the forces on the particles. The bottleneck
step in a MD simulation is the calculation of the forces. Thus, if the number of particle
interactions that must be described by a potential function is increased then the
computational cost of individual force calculations that must be performed per time step
will increase resulting in an overall increase in the amount of computer time necessary
for a simulation.
2.3 Potentials used in this work
2.3.1 RDX force field
This focus of the research presented here is simulations of shock waves in the
energetic materials α-hexahydro-1,3,5-trinitro-1,3,5-s-triazine (RDX, see Figure 4.1) and
pentaerythritol tetranitrate (PETN, see Figure 3.1). Therefore, potentials needed to be
chosen that accurately describe these molecules at temperatures and pressures well away
from standard ambient conditions of 300 K and 1 atm. All simulations of RDX performed
27
Chapter 2: Molecular Dynamics: Basic Principles and Application to Energetic Materials
in this work used a fully flexible, non-reactive nitramine potential developed by Smith
and Bharadwaj23 (hereafter referred to as the “Smith potential”). The potential used for
RDX was developed for another closely related energetic material, octahydro-1,3,5,7-
tetranitro-1,3,5,7-tetrazocine HMX. The force field was developed by fitting parameters
obtained from quantum chemistry calculations of molecular geometries and
conformational energies to analytical potential functions. A special emphasis was placed
on accurately reproducing dihedral displacements and out-of-plane deformations when
parameterizing this force field. Partial atomic charges centered on the atoms were used to
describe charge influenced interactions in the molecules. Bedrov et al.24 validated the
potential for HMX by calculating and comparing to experimental data the unit cell lattice
parameters, coefficients of thermal expansion, and heats of sublimation; in addition,
Sewell et al.25 calculated the bulk modulus and elastic constants. Bedrov, Smith, and
Sewell26,27 then employed the potential to calculate from simulations previously
unreported values of the shear viscosity coefficient and thermal conductivity of liquid
HMX.
Cawkwell et al.13 subsequently determined that RDX is also accurately described
by the potential. Munday et al.12 independently validated the use of the force field for
RDX in simulations of the high-pressure phase transition between the α and γ crystal
polymorphs. Precedence for the transferability of a potential between RDX and HMX
had been previously established by Sorescu, Rice, and Thompson for the case of rigid
molecules. They developed an intermolecular potential for RDX28 described by pairwise
Buckingham (exp-6) plus charges atom-atom interactions for prediction of condensed
phase properties; follow-up studies found this potential to accurately predict the space
28

Chapter 2: Molecular Dynamics: Basic Principles and Application to Energetic Materials
group and lattice parameters of HMX.29 Given the structural similarities between HMX
and RDX it is not surprising that the force fields are transferable; both molecules are
heterocyclic rings containing the same nitramine (N-NO2) group functionality with the
difference being that HMX is an eight-member ring (a cyclic tetramer of CH2N2O2) and
RDX is a six-member ring (a cyclic trimer of CH2N2O2).
The functional form of the potential used for both RDX and PETN is given by
(2.3)
(2.4)
(2.5)
(2.6)
(2.7)
where covalent bonds (eq. 2.3), three-body angles (eq. 2.4), and improper torsions (eq.
2.6) are approximated as harmonic oscillators; four-body dihedral angles are
approximated by a sum of cosines (eq. 2.5); and non-bonded interactions are represented
as a Buckingham plus Couloumb term (eq. 2.7).
This force field was implemented in the Large-scale Atomic/Molecular Massively
Parallel Simulator (LAMMPS)30 molecular dynamics code. LAMMPS is a large-scale
parallel MD code that is free and open-source. A different functional form had to be used
in place of Equation 2.5 for the force field implementation in LAMMPS. The functional
form in Equation 2.5 is not present in the LAMMPS code therefore the function used was
, (2.8)
29
Chapter 2: Molecular Dynamics: Basic Principles and Application to Energetic Materials
where the force constants An in Equation 2.8 were solved in terms of the force constants k
in Equation 2.5. The functional forms are equivalent.
Once the potential for RDX was chosen, it was necessary to validate the
implementation of the force field in LAMMPS. For this purpose, unit cell lattice
parameters (Table 2.1), isothermal compression curves (Figure 2.2), coefficients of
thermal expansion (Figure 2.3), and the Hugoniot locus in the (shock velocity, particle
velocity) plane (Figure 2.4) were calculated and compared to experimental data.
The calculated lattice parameters compare favorably to the experimental values
reported by Choi and Prince,31 with the largest percentage error being about 2.4% in the a
lattice parameter. All supercell constructions of RDX in this dissertation used our
calculated lattice parameters of a = 1.3498 nm, b = 1.1553, and c = 1.0564 nm. The
lattice parameter calculations in this research and by Cawkwell et al.13 were performed
using the same force field in LAMMPS. The slight difference in values can be attributed
to the fix npt settings used in LAMMPS. Cawkwell et al.13 used the iso setting in which
all three diagonal components of the pressure tensor are coupled together (conditions of
hydrostatic pressure); while this research used the aniso setting in which the three
diagonal components are allowed to vary independently of each other using separate
barostats for each.
Shock waves impose a strong uniaxial compression on the material, even “weak”
shocks achieve pressures on the order of 1 – 2 GPa, (or about 10,000 – 20,000 atm)
making it necessary to test the potential at high pressures. Isothermal compression curves
were calculated up to pressures of about 9 GPa and are presented in Figure 2.2. There is
good agreement between our curve and the experimental data of Olinger, Roof, and
30

Chapter 2: Molecular Dynamics: Basic Principles and Application to Energetic Materials
Table 2.1 Lattice parameters (units of Å) and volume (units of Å3) for a single unit cell of RDX calculated at T = 300K and P = 1 atm.
Lattice Parameter
Experiment31 Cawkwell13 This work Percentage Errora
a 13.182 13.400 13.498 2.4% b 11.574 11.517 11.553 0.2% c 10.709 10.623 10.564 1.4% V 1633.856 1639.424 1647.375 0.8%
a) Percentage error is between experimental values and this work and was calculated as
Figure 2.2. Isothermal linear and volumetric compression curves of RDX calculated using the Smith potential at T = 298 K. Black dots represent simulation data points while red diamonds are experimental data of Olinger, Roof, and Cady.32
31
Chapter 2: Molecular Dynamics: Basic Principles and Application to Energetic Materials
Cady.32 The discontinuity in the experimental compression curves at about 4.5 GPa is
thought to be the result of a phase transition from α-RDX to γ-RDX.12,33,34 This phase
transition is not observed in our hydrostatic compression simulations up to pressures of 9
GPa. Munday et al.12 have also observed that the Smith potential does not reproduce the
phase transition under hydrostatic compression but that it is observed during uniaxial
compression along the c-axis and when depressurizing starting from the γ-polymorph.
Considering that the Smith potential reproduces the phase transition under conditions of
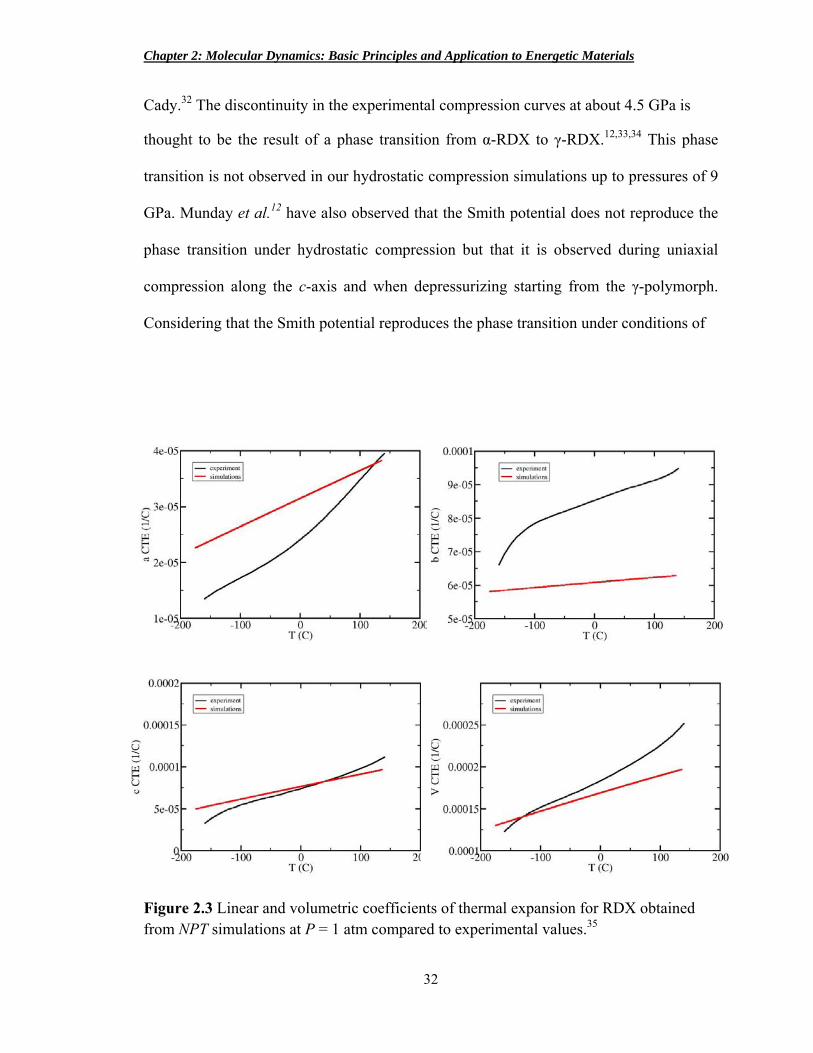
Figure 2.3 Linear and volumetric coefficients of thermal expansion for RDX obtained from NPT simulations at P = 1 atm compared to experimental values.35
32
Chapter 2: Molecular Dynamics: Basic Principles and Application to Energetic Materials
uniaxial compression and that the shocks studied in this research initially impart
conditions of uniaxial compression, we are satisfied with the isothermal compression
results from our simulations.
Linear and volumetric coefficients of thermal expansion were calculated and
compared to experiment (Figure 2.3). The coefficient of thermal expansion ( )
was calculated by performing an NPT simulation in which the temperature setting was
increased at a constant rate to obtain the volume as a function of temperature. The
volume was plotted versus temperature and the slope of the line was taken as dV/dT.
Multiplying this slope by the reciprocal of the temperature-dependent volume produces
the curves presented in Figure 2.3. The linear and volumetric coefficients of thermal
expansion obtained from our simulations reproduce fairly well the experimental values.35
The Hugoniot locus is presented in the us-up plane in Figure 2.4. As discussed in
Chapter 1, the Hugoniot is the locus of final states available given an initial set of
thermodynamic conditions. The result in Figure 2.4 is the shock wave velocity achieved
given an initial piston velocity. The Hugoniot locus obtained from the simulations
compares favorably to available experimental data.36 In general, the agreement between
thermo-mechanical properties calculated from our simulations and experiment, while not
outstanding, is sufficient to give us confidence that the Smith nitramine force field was
properly implemented in LAMMPS.
33

Chapter 2: Molecular Dynamics: Basic Principles and Application to Energetic Materials
Figure 2.4 Hugoniot locus in the us-up plane for RDX shocked normal to the (100) plane. Initial Temperature T0 = 300 K and Pressure P0 = 1 atm. Red line is from LASL Explosive Property Data.36
2.3.2 PETN force field
The principles applied in the selection and validation of a force field for RDX
were also applied to PETN. Several force fields are available for PETN but Borodin et
al.10 note that there are deficiencies in some predicted properties from these force fields,
including the pressure dependence of unit cell lengths, heat of sublimation, heat of fusion,
elastic constants, and bulk modulus. Borodin et al.10 developed a potential for PETN that
overcame these deficiencies and could reliably be used for simulations of shock
compression. This force field for the nitrate ester PETN uses the same functional forms to
describe particle interactions as the nitramine force field23 used for RDX and was
developed using a similar methodology. Once again covalent bonds, three-body angles,
and out-of-plane bends (improper dihedrals) are approximated as harmonic oscillators
34

Chapter 2: Molecular Dynamics: Basic Principles and Application to Energetic Materials
while four-body dihedral angles are represented as a sum of cosine terms. Non-bonded
interactions are also still approximated by a Buckingham-plus-Coulomb potential with
fixed partial charges centered on the atoms. The form of the potential is the same as that
in Equations 2.3 – 2.7, with the force constants and equilibrium distances now changed to
parameterize conformational energies and molecular geometries of PETN. Borodin et
al.10 validated the force field by calculating and comparing to experimental data the
lattice parameters, isothermal compression curves, heat of sublimation and melting point,
and the second-order elastic tensor.
The same thermodynamic and mechanical properties calculated to verify the RDX
force field implementation were also calculated to validate the implementation of the
PETN force field. The lattice parameters calculated from our implementation of the
PETN force field are presented in Table 2.2. Note that PETN crystallizes into a tetragonal
space group so that the a and b lattice parameters are equal to each other; therefore, only
the a lattice parameter is usually reported. There is good agreement among parameters
reported by the original force field authors,10 the experimental values,37 and this work.
All supercell constructions of PETN in this work used our calculated lattice parameters of
a = 0.9362 nm and c = 0.6847 nm.
Isothermal compression curves up to 11 GPa calculated from our simulations are
compared to those calculated by Borodin et al.10 and experimental values from Conant et
al.37 in Figure 2.5. Our results agree well with the experimental data and previous
simulations, which gives confidence in the current implementation. A comparison of
linear and volumetric coefficients of thermal expansion from our simulations and
experimental data35 is presented in Figure 2.6. Our values are in good agreement with the
35

Chapter 2: Molecular Dynamics: Basic Principles and Application to Energetic Materials
experimental values for the temperature interval presented, indicating an accurate
reproduction of the volume change as a function of temperature. Finally, the Hugoniot
locus in the us-up plane is presented in Figure 2.7 where data from our simulations are
compared to experimental data from Dick.38 The good agreement indicates that the shock
wave velocities produced in the present simulations are close to shock front velocities
achieved for similar impact strengths in physical experiments on PETN.
Table 2.2 Lattice parameters for PETN (units of Å).
Lattice Parameter
Experiment37 Borodin10 This work Percent Errora
a 9.38 9.34 9.362 0.2% c 6.71 6.86 6.847 2.0% V 590.38 598.44 600.12 1.6%
a) Percentage error as defined in the footnote to Table 2.1
36

Chapter 2: Molecular Dynamics: Basic Principles and Application to Energetic Materials
(a)
(b)
(c)
Figure 2.5 Isothermal linear and volumetric compression curves for PETN calculated from our simulations. at T = 298 K For reference, compare to curves calculated from experiment39 and Borodin et al10 simulations.
37

Chapter 2: Molecular Dynamics: Basic Principles and Application to Energetic Materials
(a)
(b)
(c)
Figure 2.6 Linear and volumetric coefficients of thermal expansion for PETN calculated from NPT simulations at P = 1 atm compared to experimental values.35
38

Chapter 2: Molecular Dynamics: Basic Principles and Application to Energetic Materials
Figure 2.7 PETN Hugoniot locus in the us-up plane at initial temperature T0 = 300K and pressure P0 = 1 atm compared to experiment.38 All simulation data here was obtained from shocks traveling normal to the (100) plane. Here, 50 × 3 × 3 and 100 × 5 × 5 indicates the number of times the unit cell was replicated along the a, b, and c directions, repectively, to give the size of the computational domain.
39
Chapter 2: Molecular Dynamics: Basic Principles and Application to Energetic Materials
References
(1) Allen, M. P.; Tildesley, D. J. Computer Simulation of Liquids; Oxford University Press: New York, 1987.
(2) Frenkel, D.; Smit, B. Understanding Molecular Simulation: From Algorithms to Applications; First ed.; Academic Press: San Diego, 2002.
(3) Gill, S. Mathematical Proceedings of the Cambridge Philosophical Society 1951, 47, 96. (4) Verlet, L. Physical Review 1967, 159, 98. (5) Gear, C. W. The Numerical Integration of Ordinary Differential Equations of Various
Orders, Argonne National Laboratory, 1966. (6) van Gunsteren, W. F.; Berendsen, H. J. C. Molecular Physics 1977, 34, 1311. (7) Swope, W. C.; Andersen, H. C.; Berens, P. H.; Wilson, K. R. The Journal of Chemical
Physics 1982, 76, 637. (8) Hairer, E.; Lubich, C.; Wanner, G. Acta Numerica 2003, 12, 399. (9) Sewell, T. D.; Bennett, C. M. Journal of Applied Physics 2000, 88, 88. (10) Borodin, O.; Smith, G. D.; Sewell, T. D.; Bedrov, D. The Journal of Physical Chemistry B
2007, 112, 734. (11) Pereverzev, A.; Sewell, T. D. The Journal of Chemical Physics 2011, 134, 014513. (12) Munday, L. B.; Chung, P. W.; Rice, B. M.; Solares, S. D. The Journal of Physical Chemistry
B 2011, 115, 4378. (13) Cawkwell, M. J.; Sewell, T. D.; Zheng, L.; Thompson, D. L. Physical Review B 2008, 78,
014107. (14) He, L.; Sewell, T. D.; Thompson, D. L. The Journal of Chemical Physics 2011, 134, 124506. (15) Agrawal, P. M.; Thompson, D. L.; Raff, L. M. The Journal of Chemical Physics 1994, 101,
9937. (16) Rivera‐Rivera, L. A.; Siavosh‐Haghighi, A.; Sewell, T. D.; Thompson, D. L. Chemical Physics
Letters 2014, 608, 120. (17) Rivera‐Rivera, L. A.; Wagner, A. F.; Sewell, T. D.; Thompson, D. L. Journal of Chemical
Physics 2015, 142, 1. (18) McQuarrie, D. A. Statistical Mechanics; University Science Books: Sausalito, CA, 2000. (19) Rahman, A. Physical Review 1964, 136, A405. (20) Brooks, B. R.; Bruccoleri, R. E.; Olafson, B. D.; States, D. J.; Swaminathan, S.; Karplus, M.
Journal of Computational Chemistry 1983, 4, 187. (21) Stuart, S. J.; Tutein, A. B.; Harrison, J. A. The Journal of Chemical Physics 2000, 112, 6472. (22) van Duin, A. C. T.; Dasgupta, S.; Lorant, F.; Goddard, W. A. The Journal of Physical
Chemistry A 2001, 105, 9396. (23) Smith, G. D.; Bharadwaj, R. K. The Journal of Physical Chemistry B 1999, 103, 3570. (24) Bedrov, D.; Ayyagari, C.; Smith, G.; Sewell, T.; Menikoff, R.; Zaug, J. Journal of Computer‐
Aided Materials Design 2001, 8, 77. (25) Sewell, T. D.; Menikoff, R.; Bedrov, D.; Smith, G. D. The Journal of Chemical Physics 2003,
119, 7417. (26) Bedrov, D.; Smith, G. D.; Sewell, T. D. The Journal of Chemical Physics 2000, 112, 7203. (27) Bedrov, D.; Smith, G. D.; Sewell, T. D. Chemical Physics Letters 2000, 324, 64. (28) Sorescu, D. C.; Rice, B. M.; Thompson, D. L. The Journal of Physical Chemistry B 1997,
101, 798. (29) Sorescu, D. C.; Rice, B. M.; Thompson, D. L. The Journal of Physical Chemistry B 1998,
102, 6692. (30) Plimpton, S. Journal of Computational Physics 1995, 117, 1.
40

Chapter 2: Molecular Dynamics: Basic Principles and Application to Energetic Materials
41
(31) Choi, C. S.; Prince, E. Acta Crystallographica Section B 1972, 28, 2857. (32) Olinger, B.; Roof, B.; Cady, H. H. In Comportement des Milieux Denses sous Hautes
Pressions Dynamiques; Comisariat a l'Energie Atomique: Paris, 1978. (33) Davidson, A. J.; Oswald, I. D. H.; Francis, D. J.; Lennie, A. R.; Marshall, W. G.; Millar, D. I.
A.; Pulham, C. R.; Warren, J. E.; Cumming, A. S. CrystEngComm 2008, 10, 162. (34) Patterson, J. E.; Dreger, Z. A.; Gupta, Y. M. The Journal of Physical Chemistry B 2007, 111,
10897. (35) Cady, H. H. Journal of Chemical & Engineering Data 1972, 17, 369. (36) LASL Explosive Property Data; Gibbs, T. R.; Popolato, A., Eds.; University of California
Press, Berkley, 1980. (37) Conant, J. W.; Cady, H. H.; Ryan, R. R.; Yarnell, J. L.; Newsam, J. M. The Atom Positions of
Pentaerythritol Tetranitrate (PETN) Determined by X‐Ray and by Neutron Diffraction, Los Alamos National Labs, 1979.
(38) Dick, J. J.; Mulford, R. N.; Spencer, W. J.; Pettit, D. R.; Garcia, E.; Shaw, D. C. Journal of Applied Physics 1991, 70, 3572.
(39) Olinger, B.; Halleck, P. M.; Cady, H. H. The Journal of Chemical Physics 1975, 62, 4480.

Chapter 3: Shock-Induced Inelastic Deformation in Oriented Crystalline Pentaerythritol Tetranitrate (PETN)
Chapter 3: Shock-Induced Inelastic Deformation in Oriented Crystalline Pentaerythritol Tetranitrate (PETN)a
3.1 Introduction
Molecular energetic materials (EMs) are usually organic crystals with structures that
often, but not always, contain nitro groups; for example, nitroaromatics, nitrate esters,
and nitramines. They are the primary ingredient in propellant or plastic-bonded explosive
formulations (PBXs), with the ideal PBX being one that combines high energy density
with thermal and mechanical stability sufficient to render it safe to handle but sensitive
enough to be reliably detonated under a well-defined mechanical stimulus.1 The
sensitivity of an explosive is closely related to its response to an applied dynamic or
thermal stress. This response is strongly affected by material heterogeneities such as
crystal defects or interfaces.2-4 Under dynamic load such heterogeneities can result in
localized volumes of material with large thermal energies or high stress concentrations;
these are referred to as hot spots and are generally thought to facilitate initiation and
detonation of energetic materials.5-10
Responses to shocks can generally be classified as elastic or inelastic. An elastic
deformation is one for which, neglecting the increase of temperature associated with the
shock, an essentially reversible compression of the material occurs. Inelastic (or plastic)
deformation involves an irreversible displacement or rearrangement of molecules in the
material as a result of, for example, the glide of dislocations or shear band formation. The
a: Original publication – Eason, R.M., Sewell, T.D. Journal of Physical Chemistry C 2011, 116, 2226
42

Chapter 3: Shock-Induced Inelastic Deformation in Oriented Crystalline Pentaerythritol Tetranitrate (PETN)
mechanisms of plastic deformation in crystalline metals are well understood both
experimentally and theoretically.3,11-15 However, this knowledge is not as complete for
organic crystals.16-18 Full understanding of the mechanisms of plastic deformation or
other stress-induced changes in molecular materials is complicated by the presence of
orientational (rotational) and internal (intramolecular) degrees of freedom that are not
present in metals.19
There have been numerous theoretical studies of condensed phase energetic materials
including nitromethane,20-28 octahydro-1,3,5,7-tetranitro-1,3,5,7-tetrazocine (HMX),29-33
hexahydro-1,3,5-trinitro-1,3,5-triazine (RDX),34-41 1,3,5-triamino-2,4,6-trinitrobenzene
(TATB),42,43 and pentaerythritol tetranitrate (PETN),44-53 among others54. These include
studies based on static electronic structure,28,42,43,54 molecular dynamics (MD) simulations
using empirical or electronic-structure-based force fields,23,27,55 and ones based on coarse-
grained, particle-based methods.48,56,57 Recent review articles summarize much of this
work.19,58 In the following we focus on MD simulations of mechanical deformation of
energetic materials under dynamic loading.
Thompson and coworkers20,21 have developed a nonreactive, flexible-molecule force
field for nitromethane for use in MD simulations. The force field has been validated
against a wide variety of experimental data.20,59-61 Thompson and co-workers26,27 have
used this force field to study structural relaxation and energy partitioning following shock
excitation for seven different crystal orientations. Smith and Bharadwaj29 (SB) have
developed a fully-flexible, nonreactive force field for HMX that has been used to predict
unit cell parameters, coefficients of thermal expansion, heats of sublimation,62 and elastic
43
Chapter 3: Shock-Induced Inelastic Deformation in Oriented Crystalline Pentaerythritol Tetranitrate (PETN)
properties32 of all three pure HMX polymorphs; and temperature-dependent thermal
conductivity30 and shear viscosity31 of the liquid. Jaramillo et al.33 characterized the
shock-induced plastic deformation in -HMX at the atomic level by calculating relative
nearest-neighbor molecular displacements and intramolecular and intermolecular
temperatures. The SB HMX force field has been shown36-41 to be transferable to RDX
and has been used in several recent studies of the response of RDX to various kinds of
mechanical loading.36,38,39 Cawkwell et al.36 observed the formation of nanoscale shear
bands for shocks propagating along [100]. They obtained radial distribution functions,
rotational order parameters, and distributions of different intramolecular conformations to
characterize the amount of shock-induced translational, orientational, and intramolecular
disorder. Subsequently, Cawkwell et al.38 and Ramos et al.39 performed simulations for
shock waves propagating normal to (111) and (021); they observed the homogeneous
nucleation and spread of stacking faults above a well-defined shock threshold. The results
of the (111) simulations were used to interpret an observed abrupt change in the shock
response from a two-wave structure to a nearly overdriven response.38 Based on the
analysis of the (111) simulations Ramos et al.39 predicted that a similar behavior should
be expected for shocks in (021)-oriented RDX, a result that was confirmed
experimentally.
Dick and coworkers44,63-65 have performed extensive studies on the shock loading of
oriented single crystals of PETN (see Figure 3.1 for structure). In those studies it was
observed that the threshold shock strength for initiation of detonation in PETN exhibits a
strong dependence on the orientation of the crystal relative to the shock direction. The
44

Chapter 3: Shock-Induced Inelastic Deformation in Oriented Crystalline Pentaerythritol Tetranitrate (PETN)
material was found to be sensitive to shocks propagating along [110] and [001] directions
but relatively insensitive to shocks propagating along any other direction studied.63
Dick64 proposed the steric hindrance model to explain this observed initiation anisotropy.
are those for which there exist readily accessible slip systems that serve to relieve the
shear stresses imparted by shock wave passage, whereas for sensitive orientations the
lack of available slip systems leads to hindered shear. The inability to relieve shear
stresses leads to close intermolecular contacts that facilitate bond breaking and
subsequent reactions.64 Dick and Ritchie44 used molecular mechanics to model shear in
five different slip systems in PETN. They found that slip in sensitive directions resulted
Figure 3.1. Depictions of PETN crystal. (a) Unit cell viewed down the [001] axis; (b) unit cell viewed down the [100] axis. Atoms colors are: carbon, cyan; nitrogen, blue, oxygen, red; hydrogen, green. (c) Covalent atomic connectivity and numbering scheme used in the simulations.
45
Chapter 3: Shock-Induced Inelastic Deformation in Oriented Crystalline Pentaerythritol Tetranitrate (PETN)
The steric hindrance model states that shock orientations insensitive to shock initiation in
higher potential energy barriers compared to those for slip in insensitive directions.
However, attempts to extend the steric hindrance model to other energetic materials have
not been quite as successful.66,67 Cawkwell et al.38 argued that PETN presents a special
case due to its high symmetry compared to the other energetic materials that have been
studied.
Subsequent studies on PETN have been performed to attempt to expand on the steric
hindrance model originally proposed by Dick. Gruzdkov and Gupta45 examined the
polarity of the different molecular conformers that could possibly form as a result of
shear stress along different directions. They proposed that shocks propagating along
sterically hindered sensitive directions result in polar conformers that stabilize transition
states, leading to increased reaction rates. They argued that because shear is not sterically
hindered along insensitive orientations no polar conformations would result from shock
passage.45 Zybin and coworkers49,50 have used the ReaxFF reactive force field to
determine the primary PETN reaction products resulting from shock compression49 and
rapid compression and shear.50 They determined that breaking of the O-NO2 bond to
yield NO2 is the principal primary reaction that occurs following strong shock loading
along the [100] direction.49 In the compress-and-shear simulations Zybin et al. first
uniaxially compressed and then imposed large shear strains to activate potential slip
systems corresponding to sensitive and insensitive orientations.50 They observed a higher
temperature and stress jump for the sensitive orientations that they attributed to the close
intermolecular contacts that arise for those cases. Recently, ReaxFF has been used in
46

Chapter 3: Shock-Induced Inelastic Deformation in Oriented Crystalline Pentaerythritol Tetranitrate (PETN)
shock simulations of PETN containing spherical voids in which an enhanced chemical
reactivity was observed compared to defect-free crystals.68
In this chapter we report MD simulations of shock waves in crystalline PETN using a
mechanically accurate but nonreactive force field.69 The objective is to characterize in
atomic detail the mechanical deformation processes that occur on ~20 ps time scales
(shock propagation distances of ~0.1 micron) for supported shocks with Rankine-
Hugoniot shock pressures PR-H ~ 9 GPa. Simulations were performed for shocks
propagating along [001] and [100] crystal directions, which are known
experimentally63,64 to be, respectively, relatively sensitive and insensitive to shock
initiation. The use of a nonreactive force field is justifiable given that, for shock input
stresses comparable to those studied here, measured shock propagation distances required
for detonation initiation are several millimeters.63,64
3.2 Methods
All simulations were performed using the LAMMPS70 code in conjunction with the
nonpolarizable, nonreactive, flexible-molecule force field for alkyl nitrates developed by
Borodin et al.69 In this force field covalent bond stretches, three-center angles, and out-
of-plane bends are approximated as harmonic oscillators; torsional motions are modeled
using cosine expansions parameterized to reproduce energies and geometries for dihedral
conformations obtained from quantum chemistry calculations; and nonbonded pair
interactions, including intramolecular terms for atoms separated by three or more
covalent bonds, are described by Buckingham-plus-Coulomb potentials with fixed partial
47

Chapter 3: Shock-Induced Inelastic Deformation in Oriented Crystalline Pentaerythritol Tetranitrate (PETN)
atomic charges located on the nuclei. The force field accurately predicts the lattice
parameters and crystal structure, heat of sublimation and melting point, linear and
volumetric isothermal compression curves, and the second-order elastic tensor at room
temperature and atmospheric pressure.69 The Borodin et al. force field was used without
modification except that the particle-particle particle-mesh (PPPM71) algorithm was used
with precision parameter 110-6 to evaluate both the electrostatic and the dispersion
interactions; the cutoff distance for repulsive pair terms was 11.0 Å. Calculated lattice
parameters for T = 298 K and atmospheric pressure are a = b = 9.362 Å and c = 6.847 Å,
compared to the values a = b = 9.34 Å and c = 6.86 Å reported by Borodin et al.69 and the
experimental values72 a = b = 9.3776 Å and c = 6.7075 Å.
Simulations were performed for supported planar shock waves propagating parallel to
[100] and [001] crystal directions, which correspond to insensitive and sensitive shock
directions respectively.63 Shock waves were generated using a reverse-ballistic
configuration in which an oriented, thermally equilibrated crystalline slab of flexible
molecules impacts from the right with impact speed |Up| onto a stationary, rigid piston
comprised of crystalline material with the same orientation, initially commensurate with
and contiguous to the flexible slab. Together the piston and flexible slab comprised 120
unit cells along the shock direction and 20 unit cells along the transverse directions; that
is, supercell sizes of 120a × 20b × 20c for the [100] shock and 20a × 20b × 120c for the
[001] shock. Hereafter we refer to these supercells as the 3D systems. An additional
shock along [100] was simulated using a supercell of size 120a × 120b × 6c (including
48

Chapter 3: Shock-Induced Inelastic Deformation in Oriented Crystalline Pentaerythritol Tetranitrate (PETN)
the piston); we refer to this supercell as the quasi-2D system. The computational
procedure detailed below was applied consistently for all three simulations.
All trajectory integration was performed using the velocity Verlet integrator. Three-
dimensional periodic boundary conditions were used in all cases; a 200 Å gap was
introduced at the right-hand end of each system along the shock direction to minimize
interactions between the left-hand end of the piston and the right-hand end of the flexible
slab. Following introduction of the gap but prior to shock loading, equilibration of the
entire system at T = 298 K was accomplished in two stages. First, five ps of isochoric-
isoergic (NVE) trajectory integration was performed using a 0.5 fs time step during which
the atomic velocities were scaled every 50 fs to yield the total kinetic energy predicted by
classical equipartition, Ek = T/2. Concurrently, completely new atomic velocities
were selected every picosecond from the Maxwell distribution corresponding to T = 298
K; the purpose of this was to efficiently eliminate breathing motions parallel to the shock
direction that resulted from introduction of the two free surfaces. Next, the system was
simulated for 20 ps in the isothermal-isochoric (NVT) ensemble at T = 298 K using the
Nosé-Hoover thermostat with a 0.5 fs time step and a thermostat relaxation time constant
of 100 fs.
The shock simulations were performed in the NVE ensemble using a 0.1 fs time step.
A rigid, stationary piston was created at the left-hand end of the system by setting to zero
and fixing at zero the forces and velocities of all atoms in the first five unit cells along the
shock direction. The remaining material comprised a flexible slab consisting of 92000
molecules for the 3D systems and 165600 molecules for the quasi-2D system. A velocity
49
Chapter 3: Shock-Induced Inelastic Deformation in Oriented Crystalline Pentaerythritol Tetranitrate (PETN)
Up = -1.0 km·s-1 along the shock direction was added to the thermal velocity of each atom
of the flexible slab, leading to a shock wave propagating from left to right. Shock wave
transit times across the flexible slab were approximately 22.0 ps and 16.0 ps,
respectively, for the shocks propagating along [100] and [001]. Shock-front absorbing
boundary conditions (SFABCs) as implemented by Cawkwell et al.36 were used in the
quasi-2D simulation to extend the total shock simulation time to 45.0 ps; the second
piston required in the SFABC method was created from the region of the flexible slab
corresponding to the five rightmost crystal unit cells along the [100] direction.
3.3 Results and Discussion for the 3D Systems
3.3.1 Relative Molecular Displacements
Inelastic deformation at the molecular scale was characterized by calculating
relative displacements of nearest-neighbor molecular centers of mass using the method
described by Jaramillo et al.33 . Relative molecular displacements (RMDs) are defined
by:
, (1)
where i and j are first- and second-nearest-neighbor molecules in the unshocked
tetragonal crystal structure; rij(0) is the vector between centers of mass of those molecules
at some reference time t=0, which we define as the time the shock wave was initiated in
the flexible slab; and rij(t) is the corresponding vector at some later analysis time t, which
in the present study is the time of maximum compression. In order to accurately calculate
Δij it is necessary to account for the uniaxial compression of the material due to passage
50

Chapter 3: Shock-Induced Inelastic Deformation in Oriented Crystalline Pentaerythritol Tetranitrate (PETN)
of the elastic shock front. This was accomplished by determining the compression ratio
l/l0 along the shock direction and subtracting it vectorially from rij(0); l/l0 values for the
[100] and [001] shocks were determined to be 0.797 and 0.799, respectively.
Components of the RMDs calculated at the times of maximum compression for the
[001] and [100] shocks are shown in Figures 3.2(a)-(b) and 3.2(c)-(d), respectively. In all
cases the abscissa corresponds to the shock direction. The two ordinates for a given shock
correspond to the transverse directions; that is, the RMDs are projected into (010) and
(100) planes for shocks propagating along [001], and (001) and (010) planes for shocks
propagating along [100]. For shock propagation along [001] (Figures 3.2(a)-(b)) the
RMDs in both planes cluster around zero, suggesting that only elastic compression has
occurred in the material. By contrast, while [001] components of RMDs for the [100]
shock are clustered relatively close to zero (Figure 3.2d), significant displacements are
observed for [100] and [010] components (Figures 3.2(c)-(d)), meaning that relatively
large translational displacements have occurred. Although the data in Figure 3.2c are
noisy, they are predominately distributed along 45 angles relative to the shock direction
and correspond to displacements in <110> crystal planes. Combined with the results in
Figure 3.2d, we conclude that the dominant slip system activated for the [100] shock is
110 11 1 . This is in agreement with the previous prediction by Dick and Ritchie44
based on molecular mechanics simulations using the AMBER73 force field.
The results in Figure 3.2 are consistent with expectations from the steric hindrance
model.64 For the impact strength considered, shocks along the sensitive [001] direction
51

Chapter 3: Shock-Induced Inelastic Deformation in Oriented Crystalline Pentaerythritol Tetranitrate (PETN)
do not activate any slip systems that would relieve the shear stress imparted by the shock
(at least, not on the time scale and space scale of the present simulations, which were
a
dc
b
Figure 3.2. Relative molecular displacements at times of maximum compression. Panels (a) and (b): Projections into the (010) and (100) planes, respectively, for the [001] shock. Panels (c) and (d): Projections into the (001) and (010) planes, respectively, for the [100] shock.
52

Chapter 3: Shock-Induced Inelastic Deformation in Oriented Crystalline Pentaerythritol Tetranitrate (PETN)
performed for crystals with no pre-existing defects). Therefore, little or no inelastic
deformation should occur, consistent with the results in Figures 3.2(a)-(b). By contrast,
shocks along the insensitive [100] direction do activate a slip system that relieves the
shock-induced shear stresses, leading to the inelastic deformation that is evident in
Figures 3.2(c)-(d).
It is interesting to contrast the results obtained here with those reported by Jaramillo
et al.33 for (100)-oriented -HMX shocked into the two-wave region. Specifically,
whereas the results for (100)-oriented -HMX exhibited clear localization of the
molecular displacements that could be mapped to well-defined Burgers vectors
12 101 and 1
2 101 , the wide spread of the molecular displacements in our calculations,
while largely localized to <110> planes, does not allow unambiguous determination of a
Burgers vector. This is discussed further in Sec. 3.4.1 in connection with results for the
quasi-2D system.
The results of the RMD analysis provide a useful, albeit approximate basis for
distinguishing molecules that have undergone only elastic compression from those that
have undergone inelastic displacement. Specifically, based on the RMDs in a given plane
at the time of maximum compression, individual molecules were classified as having
undergone:
(a) elastic compression if rΔij < 2.15 Å
(b) inelastic displacement if rΔij ≥ 2.15 Å.
Figure 3.3 contains snapshots of the 3D systems for [001] and [100] shocks (panels
(a) and (b), respectively) at the times of maximum compression. Only molecular centers
53

Chapter 3: Shock-Induced Inelastic Deformation in Oriented Crystalline Pentaerythritol Tetranitrate (PETN)
of mass are shown. Elastically-compressed molecules are shown in blue while those
deemed to have undergone inelastic displacements are colored red. Note that whereas for
the [001] shock (Figure 3.3a) only elastic compression has occurred, for the [100] shock
(Figure 3.3b) there are two distinct regions in the shocked material; a region of elastic
compression immediately behind the shock front and a region further to the left in which
plasticity is developing. Therefore, for the shock strength considered the (100)-oriented
crystal is clearly in the two-wave elastic-plastic region of the shock Hugoniot locus.
Because the two waves propagate at different speeds, it is not appropriate to regard as
stationary a spatiotemporal reference frame centered on the shock front.
Elastic Region
[100]
[010]
[001]
[100]
b
a
Plastic Region
FIGURE 3.3. Orthographic projections of the pistons and flexible slabs at the times of maximum compression in the 3D systems. (a) [001] shock; (b) [100] shock. Only molecular centers of mass are shown. Elastically-compressed and inelastically-displaced molecules are colored blue and red, respectively
54

Chapter 3: Shock-Induced Inelastic Deformation in Oriented Crystalline Pentaerythritol Tetranitrate (PETN)
3.3.2 Spatial Profiles of Intermolecular and Intramolecular Temperatures
Spatially-resolved kinetic energies, expressed in temperature units for ease of
presentation and henceforth referred to as temperatures (with reasonable justification, as
discussed below in Sec. 3.4.4), were partitioned into translational and ro-vibrational
components using the method due to Strachan and Holian.74 The local velocity ui of a
molecule i is defined in terms of its own velocity and the velocities uj of neighboring
molecules and is given by
u i
w(rij )u jj
w(rij )
j
. (2)
The weighting function w(rij) is the same monotonically decreasing function of rij=|ri – rj|
as used by Strachan and Holian:74
w(r) f (r)4
1 f (r)4 if r ≤ R (3)
w(r) 0 if r > R
where f(R) = (r – R)/σ. We used parameter values R = 28.086 Å (three times the a unit
cell length) and σ = 0.9362 Å (one-tenth the a unit cell length) in eq 3. The local
molecular velocity is then used to define an intermolecular temperature
3
2k T i
inter
1
2M jw(rij ) u j u i
2
j
w(rij )
j
(4)
where Mj is the total mass of the molecule and k is Boltzmann’s constant.
55

Chapter 3: Shock-Induced Inelastic Deformation in Oriented Crystalline Pentaerythritol Tetranitrate (PETN)
Intramolecular temperatures were calculated using the method originally described by
Strachan and Holian74 as implemented by Jaramillo et al.33 The intramolecular
temperature is given by
3
2Ni
atkTiintra
1
2m j (u j ui
c.m.)2
j1
Niat
(5)
where is the number of rotational and vibrational degrees of freedom, uj is the velocity
of atom j, and uic.m. is the center-of-mass velocity of molecule i containing atom j. The
average local vibrational temperature in the neighborhood of molecule i is then given by
Niat
. T i
intra
w(rij )Tjj
w(rij )
j
(6)
Instantaneous spatial profiles of the temperature measures defined in equations 4 and
6 are shown in Figure 3.4 at 5.0 ps intervals starting from t = 0. Results for the
intermolecular and intramolecular temperatures for the [001] shock are shown in panels
(a) and (b), respectively; corresponding quantities for the [100] shock are shown in panels
(c) and (d). The rapid initial rise and subsequent decrease in intermolecular temperature
(panels (a) and (c)) confirms expectations that energy from the shock wave is initially
distributed principally among the lattice modes of the crystal. The intermolecular
temperature for the [001] shock (panel (a)) decreases essentially monotonically toward
the long-time value over a distance of approximately 650 Å. By contrast, the
intermolecular temperature for the [100] shock (panel (c)) decreases from the maximum
value associated with initial shock passage; reaches, for post-shock time t = 20.0 ps
56
Chapter 3: Shock-Induced Inelastic Deformation in Oriented Crystalline Pentaerythritol Tetranitrate (PETN)
c d
a b
Figure 3.4. Instantaneous spatial profiles for intermolecular (eq 4, panels (a) and (c)) and intramolecular (eq 6, panels (b) and (d)) temperatures at 5.0 ps intervals starting from the time of shock initiation in the flexible slabs (t = 0). Panels (a) and (b): [001] shock; panels (c) and (d): [100] shock.
(purple curve), a local minimum at a distance about 300 Å behind the shock front; and
subsequently exhibits an increase of ~75 K during evolution of the plastic wave. The
intramolecular temperatures increase monotonically for both shock orientations; no
transient excitation is observed. The intramolecular temperature for the [001] shock
(panel (b)) exhibits an initial rise over a distance of approximately 50 Å with little
57

Chapter 3: Shock-Induced Inelastic Deformation in Oriented Crystalline Pentaerythritol Tetranitrate (PETN)
additional increase for increasing distances behind the shock front. The intramolecular
temperature for the [100] shock (panel (d)) rises initially over a distance comparable to
that for the [001] shock, although the value of the initial rise is about 30 K lower than that
in the [001] shock. However, the intramolecular temperature for the [100] shock also
increases during the evolution of the plastic wave such that the final intramolecular
temperatures for the two shocks are nearly equal by the times of maximum compression.
Note that complete equilibration between the intermolecular and intramolecular
temperatures has not been established for either shock orientation by the respective times
of maximum compression; in both cases the two temperature measures differ by 20-30 K.
Overall, the qualitative features of the temperature profiles for the two shocks are
consistent with the steric hindrance model, for which a split wave is anticipated in the
[100] shock (insensitive orientation) but not in the [001] shock (sensitive orientation).
3.3.3. Dihedral Angle Distributions in Unshocked and Shocked Material
Distributions of CCON and CONO dihedral angles were calculated to assess the
differences in intramolecular distortion caused by the shock waves; these internal
coordinates are of particular interest due to the floppy nature of the PETN molecule (see
Figure 1). There are four CCON and eight CONO dihedral angles per molecule. Results
for the CCON and CONO dihedrals are presented in Figures 3.5 and 3.6, respectively. In
both figures panel (a) corresponds to unshocked material and panel (b) to material in the
[001] shock; panels (c) and (d) are for the [100] shock and correspond, respectively, to
58

Chapter 3: Shock-Induced Inelastic Deformation in Oriented Crystalline Pentaerythritol Tetranitrate (PETN)
elastically-compressed and inelastically-displaced molecules. Results in panels (b)-(d)
were obtained at the times of maximum compression for the respective shocks.
The CCON dihedral angles are essentially trans in the unshocked crystal (peaks at
±180° in Figure 3.5a). Comparing panels (a) and (b), shock loading along [001] leads to
modest splitting of the trans peak into two peaks with unequal amplitudes and shifted
toward smaller angles by about 20°; no new peaks emerge. Shocking along [100] leads to
greater changes in the CCON dihedral distributions (panels (c) and (d)). The main peak
still corresponds to the trans CCON dihedral both for the elastically-compressed and
inelastically-displaced molecules (panels (c) and (d), respectively). In both cases new
broad peaks emerge, centered about ±90°; the amplitudes of these peaks for the
inelastically-displaced molecules are much larger than for the elastically-compressed
ones. Based on these results we conclude that the CCON dihedrals in [100]-shocked
PETN crystal rotate with less hindrance than those in [001]-shocked crystal. The less
hindered dihedral rotation about C-O bonds for shocks along the [100] direction
compared to the [001] direction could play a role in facilitating slip in shocked (100)-
oriented PETN as part of the mechanism for relieving the shock-induced shear stresses.
Each H2C-O-NO2 moiety in PETN has one cis and one trans CONO dihedral in the
equilibrium crystal structure. Using the systematic atomic numbering scheme shown in
Figure 3.1c these are readily distinguished as shown in Figure 3.6a, which contains
independently normalized probability distributions for the cis and trans CONO dihedrals
in the unshocked crystal. Shock loading along [001] has very little effect on the
distributions at the instant of maximum compression (Figure 3.6b); the distributions are
59

Chapter 3: Shock-Induced Inelastic Deformation in Oriented Crystalline Pentaerythritol Tetranitrate (PETN)
ba
dc
Figure 3.5. Distributions of CCON dihedral angles. (a) Unshocked material (equivalent for both shock orientations); (b) [001] shock; (c) and (d) [100] shock: molecules determined to have undergone (c) elastic compression and (d) inelastic displacement. Results in (b)-(d) correspond to instants of maximum compression in the respective simulations.
noticeably broadened, but all CONO dihedrals remain essentially cis or trans and there is
no evidence for rotation of the NO2 group. That is, there are no initially cis dihedrals that
have become trans at the end of the simulation or vice versa. The situation is different for
the [100] shock; while most CONO dihedrals at the time of maximum compression are
60
Chapter 3: Shock-Induced Inelastic Deformation in Oriented Crystalline Pentaerythritol Tetranitrate (PETN)
either cis or trans, the distribution exhibits nonzero probability for all angles in the
domain. Moreover, a number of initially trans CONO dihedrals have become cis by the
time of maximum compression and vice versa, indicating that NO2 rotation does occur
for molecules involved in inelastic deformation events.
3.4 Results and Discussion for the Quasi-2D System
Finite-size effects in the (001) plane are apparent in Figure 3.3b, which corresponds
to the 3D shock along [100]. However, tests performed for simulation cells with sizes
ranging from 120a × 20b × 5c to 120a × 20b × 20c confirmed that the defects generated
filled the [001] zone irrespective of the thickness of the cell along the [001] direction. On
this basis, a [100] shock simulation was performed using the 120a × 120b × 6c quasi-2D
slab to eliminate any possible finite-size effects in the (001) plane and allow for more
thorough characterization of the shock-induced inelastic deformation. The SFABC
method as applied by Cawkwell et al.36 was used in order to extend the length of the
simulation time in the compressed state.
The overall results for the relative molecular displacements (RMDs) obtained for the
quasi-2D system were similar to those presented for the 3D [100] shock in Figures 3.2(c)-
(d). Likewise, the intermolecular and intramolecular temperatures were nearly identical to
those presented in Figures 3.4(c)-(d). Therefore, results for those quantities obtained for
the quasi-2D system are not shown. The same approach used to construct Figure 3.3
based on classification of individual molecules as either elastically compressed or
inelastically displaced at the instant of maximum compression was used to generate
61
Chapter 3: Shock-Induced Inelastic Deformation in Oriented Crystalline Pentaerythritol Tetranitrate (PETN)
ba
dc
Figure 3.6. As in Figure 3.5 except results for CONO dihedral angles are shown. Green and black histograms correspond to molecules initially in cis and trans conformations, respectively.
Figure 3.7, where it is evident that finite-size effects in the (001) plane have been
essentially, if not completely, eliminated; no defects propagate across the entire vertical
dimension of the cell, approximately equal numbers of defects appear in (110) and (110)
planes, and several nascent detached defects are apparent toward the left-hand end of the
quiescent elastically-compressed region. Four subvolumes of material within the inelastic
62

Chapter 3: Shock-Induced Inelastic Deformation in Oriented Crystalline Pentaerythritol Tetranitrate (PETN)
deformation zone were selected for more detailed analysis; these are denoted as regions
A, B, C, and D in Figure 3.7.
A
B
D
C
[100]
[010]
Figure 3.7. Orthographic projection of the piston and flexible slab for the quasi-2D shock at the instant of maximum compression. Elastically compressed and inelastically displaced molecules are colored blue and red, respectively. Regions A, B, C, and D are discusses in greater detail in connection with Figures 3.8 – 3.10.
63
Chapter 3: Shock-Induced Inelastic Deformation in Oriented Crystalline Pentaerythritol Tetranitrate (PETN)
3.4.1 Relative Molecular Displacements in Regions A-D
Relative molecular displacements for the molecules in each region at the time of
maximum compression were calculated in the same manner as described in Sec. 3.3.1 and
are presented in Figures 3.8(a)-(d) for regions A-D, respectively. For region A there are
clusters of points centered about (±8, ±9) Å. Those displacements correspond closely to
lattice lengths a and b in the compressed material, suggesting that the inelastically-
displaced molecules in region A have undergone a full dislocation. For region B the
displacements are clustered around ( 6, ±7) Å, which implies that the defect in question
is a partial dislocation. Because the displacements in inelastically-displaced molecules in
region B did not change significantly even after ~23 ps of additional trajectory
integration using SFABCs, we conclude that the partial dislocation is a metastable
stacking fault. The displacements obtained for region C are not strongly localized to any
particular region, presumably due to the large number of defects that intersect in that
region. Finally, in Region D there is localization of points around ( 6, ±7) Å indicating a
stacking fault similar to that observed in Region B. Additional clustering of
displacements in region D also occurs around (±2.5, ±2.5) Å suggesting that the
propagation of the second plane of deformation has been halted due to intersection with
the first one (see Figure 3.7 or trajectory animation).
64

Chapter 3: Shock-Induced Inelastic Deformation in Oriented Crystalline Pentaerythritol Tetranitrate (PETN)
Region B
Region A
Region C Region D
Figure 3.8. Relative molecular displacements for the quasi-2D [100] shock projected into the (001) plane at the time of maximum compression. Regions A, B, C, and D are defined in Figure 3.7.
3.4.2 Kinetic Energy Time Histories in Regions A-D
Time histories of total kinetic energies, expressed in temperature units using the
equipartition theorem T = 2Ek/(3Nk), were calculated separately for elastically-
compressed and inelastically-displaced molecules in each region (see Figure 3.9). Note
that in contrast to Figure 3.4, the ordinates in Figure 3.9 are labeled Kinetic Energy (with
65

Chapter 3: Shock-Induced Inelastic Deformation in Oriented Crystalline Pentaerythritol Tetranitrate (PETN)
units of degrees Kelvin) rather than Temperature, because of the net center-of-mass
velocity in each region prior to shock passage. That is, the high apparent temperatures
(total kinetic energies) at short times are due to the -1.0 km·s-1 impact velocity assigned
to the entire flexible slab at the beginning of the simulation; the sharp drops in kinetic
energy in Figure 3.9 occur at the times the shock front passes through a given region,
after which it is reasonable to discuss the results in terms of temperature. Passage of the
elastic precursor wave leads to an initial shock heating to about 375 K in all cases,
followed by increases in temperature due to passage of the plastic wave through the
material.
The temperature of the inelastically-displaced molecules in regions A and B rises
from 375 K to about 460 K in a time span of 4 ps followed by a slower cooling to a final
temperature of about 425 K. The increase is due to the conversion of potential energy to
kinetic energy during the localized slip process and the cooling is due to the subsequent
energy equilibration with the surroundings. Region C exhibits a slower rate of heating
than the other regions but settles at a higher final temperature (~450 K). The slower rate
in region C is a result of the less-localized deformation, while the higher temperature
overall arises due to the greater net plastic deformation in that region. Region D exhibits
an initial rise in temperature as the process of slip begins. The increase ceases at a
temperature of about 420 K when the intersection of the planes of deformation halts the
growth of both slip zones.
66
Chapter 3: Shock-Induced Inelastic Deformation in Oriented Crystalline Pentaerythritol Tetranitrate (PETN)
Region A
Region C Region D
Region B
Figure 3.9. Time histories of total kinetic energies, expressed in temperature units, for molecules determined to be elastically (blue) and inelastically (red) displaced at the time of maximum compression in the quasi-2D [100] shock. Regions A, B, C, and D are defined in Fig. 3.7. SFABCs were applied at t = 22.0 ps.
3.4.3 Rotational Order in Regions A-D
Time histories for a rotational order parameter P2(t) were calculated separately for
elastically-compressed and inelastically-displaced molecules in each region to
characterize the amount of rotational (dis)order resulting from shock wave passage
(Figure 3.10). The order parameter is given by
67

Chapter 3: Shock-Induced Inelastic Deformation in Oriented Crystalline Pentaerythritol Tetranitrate (PETN)
P2(t)
1
N
1
2[3( ˆ n i(0) ˆ n i(t))
2 1]i1
N
(8)
where N is the number of molecules, is the unit vector between specified atoms at t
= 0, and
ˆ n i(0)
ˆ n i(t) is the corresponding unit vector at analysis time t. Four vectors were
defined per molecule corresponding to those between the central carbon atom and each of
the four carbon atoms covalently bonded to it (see Figure 3.1c). Each vector was treated
Region A Region B
Region C Region D
Figure 3.10. Time histories of the orientational order parameter P2(t) for molecules
determined to be elastically (blue) and inelastically (red) displaced at the time of maximum compression in the quasi-2D [100] shock. Regions A, B, C, and D are defined in Figure 3.7. SFABCs were applied at t = 22.0 ps.
68

Chapter 3: Shock-Induced Inelastic Deformation in Oriented Crystalline Pentaerythritol Tetranitrate (PETN)
as an independently varying quantity; results in Figure 3.10 are arithmetic averages of eq
8 calculated separately for each vector. (We note that this definition does not account for
symmetry-equivalent molecular orientations in the crystal structure.) The time t = 0 was
taken to be the time at which shock was initiated in the system.
Results for P2(t) are shown in Figure 3.10. The first drop in the value of P2 for each
region is associated with passage of the elastic wave while the second drop results from
passage of the slower plastic wave. In all cases except that for region C, for which
relatively widespread inelastic deformation occurs, the results for molecules classified as
elastically compressed are very similar.
Examination of trajectory animations for Regions A and B (see original paper)
reveals that the molecules in the slip planes become rotationally disordered during slip
and then largely recover after slip has completed. This is corroborated by the behavior of
P2(t) seen for these regions in Figures 3.10(a)-(b). Both regions exhibit a loss of
rotational order during passage of the plastic wave during slip followed by recovery to
near pre-plastic-wave order after the process of slip has finished. A possible explanation
for why region A appears to recover less order asymptotically than region B is the
abovementioned failure to account for symmetry-equivalent orientations in the definition
used for P2(t); this is currently being investigated. Region C exhibits the greatest amount
of disorder among the regions examined. This is reasonable due to the intersection of
several zones of deformation that results in a generalized plastic flow in this region. By
contrast, a smaller amount of disorder occurs in Region D than for the other regions.
Examination of the trajectory animation (see original paper) shows that the slip
69

Chapter 3: Shock-Induced Inelastic Deformation in Oriented Crystalline Pentaerythritol Tetranitrate (PETN)
displacement is interrupted by the intersection of the two planes of deformation, which in
turn decreases the probability of molecular rotation.
3.4.4 Time Scales for Re-Establishing the Maxwell-Boltzmann Distribution of Kinetic
Energies Behind the Shock
In Secs. 3.3.2 and 3.4.2 the kinetic energies, partitioned in various ways, were
expressed in temperature units; this was done for convenience. Those quantities should
not necessarily be associated with an assumption of local thermal equilibrium in the
material insofar as they are based only on the average kinetic energy and not the
distribution of kinetic energy, which may not be Maxwell-Boltzmann distributed in the
instants following shock wave passage. This point has been discussed by Klimenko and
Dremin75,76 in connection with MD simulations of shock waves in Lennard-Jones
“argon”. In the following we present normalized distributions of instantaneous atomic
and molecular center-of-mass kinetic energies, calculated for several molecular layers
near the shock front in the quasi-2D system for a phase space point close to the time of
maximum compression. The purpose is to address the question of whether, for the
conditions immediately behind the quasi-2D [100] shock studied here, the kinetic
energies are in fact Maxwell-Boltzmann distributed; or, if they are not, to estimate the
distance over which the Maxwell-Boltzmann distribution is recovered. The normalized
Maxwell-Boltzmann (MB) distribution for kinetic energy is given by77
P(Ek ) 2Ek
(kT)3 expEk
kT
(9)
70

Chapter 3: Shock-Induced Inelastic Deformation in Oriented Crystalline Pentaerythritol Tetranitrate (PETN)
where P(Ek) is the probability of kinetic energy Ekkis Boltzmann’s constant, and T is
temperature.
The PETN unit cell contains two molecules with centers of mass separated by a
distance a/2 along the [100] crystal direction. Based on this, for the [100] shock we
define molecular layers in the (100) plane such that there are two layers per unit cell. For
the quasi-2D system, this corresponds to 120 × 6 = 720 molecules (20880 atoms) per
layer. Assignment of a particular molecule to a given layer was based on the ideal crystal
structure; this is sufficient for the analysis presented here because we only consider post-
shock times for which relative molecular displacements are small. For the calculation of
instantaneous atomic kinetic energies (referred to hereafter as AKEs) in a given layer the
instantaneous center-of-mass velocity of that entire layer was removed, after which the
kinetic energy for the ith atom in the layer was computed using atomEk,i = mivi·vi/2 where
mi is the atomic mass and vi is the velocity vector. For the calculation of instantaneous
molecular center-of-mass kinetic energies (referred to hereafter as CMKEs) in a given
layer the center-of-mass velocity of that entire layer was removed, after which the CMKE
of the jth molecule was computed using cmEk,j = Mvcm,j·vcm,j/2 where M is the molecular
mass and vcm,j is the molecular center-of-mass velocity.
Normalized histograms of the AKEs and CMKEs are presented in Figures 3.11 and
3.12, respectively. Also shown in Figures 3.11 and 3.12 are the Maxwell-Boltzmann
distributions obtained in two ways: (1) by using the “temperature” calculated from the
appropriate instantaneous kinetic energy; and (2) by fitting the histogram data directly to
eq 9, for which the temperature T is the only parameter. The panels in Figure 3.11
71

Chapter 3: Shock-Induced Inelastic Deformation in Oriented Crystalline Pentaerythritol Tetranitrate (PETN)
correspond to material five molecular layers in front of the shock front (Figure 3.11a),
material in the layer containing the shock front (Figure 3.11b), and material one layer
behind the shock front (Figure 3.11c). The panels in Figure 3.12 correspond to material
five layers in front of the shock front (Figure 3.12a), material in the shock front (Figure
3.12b), and material one and two layer behind the shock front (Figures 3.12c and 3.12d,
respectively).
Prior to shock excitation the AKEs (Figure 3.11a) and CMKEs (Figure 3.12a) clearly
are distributed according to the MB distribution; the temperatures predicted using
equipartition and from direct fit of the histogram data to eq 9 agree to within 3 K and 9 K
for the AKEs and CMKEs, respectively. For the case of AKEs this is also true in the
layer containing the shock front, the layer immediately behind it (Figures 3.11b and
3.11c, respectively), and all other layers further behind the shock that were examined; the
equipartition-based and MB-fitted temperatures are both 384 K in the layer containing the
shock front and both 383 K in the first layer behind the shock front. Given a shock
velocity of 4.89 km·s-1 and a molecular layer thickness of approximately 3.8 Å, we
conclude that – for the 8.7 GPa shock strength considered – re-establishment of the
Maxwell-Boltzmann distribution of atomic kinetic energies occurs on a time scale less
than 80 fs. (For reference, the vibrational period of a C-H bond in PETN is approximately
11 fs.)
72

Chapter 3: Shock-Induced Inelastic Deformation in Oriented Crystalline Pentaerythritol Tetranitrate (PETN)
a
b
c
Figure 3.11. Normalized histograms of atomic kinetic energies for [100]-shocked material: (a) five molecular layers in front of the shock front, (b) in the layer containing the shock front, and (c) one molecular layer behind the shock front. Blue curves are Maxwell-Boltzmann distributions (eq 9) with the temperature defined in terms of the average kinetic energy in a given layer. Red curves are fits of eq 9 directly to the histogram data, with temperature as the only fitting parameter.
73

Chapter 3: Shock-Induced Inelastic Deformation in Oriented Crystalline Pentaerythritol Tetranitrate (PETN)
b
c
a
d
Figure 3.12. Normalized histograms of molecular center-of-mass kinetic energies for [100]-shocked material: (a) five molecular layers in front of the shock front, (b) in the layer containing the shock front, (c) one molecular layer behind the shock front, and (d) two layers behind the shock front. Blue curves are Maxwell-Boltzmann distributions (eq 9) with the temperature defined in terms of the average kinetic energy in a given layer. Red curves are fits of eq 9 to the histogram data, with temperature as the only fitting parameter. Note that abscissa and ordinate scales vary from one panel to the next.
The result for the CMKEs is considerably different. As already noted, prior to shock
passage the distribution of those energies is entirely consistent with the MB distribution
(Figure 3.12a). However, in the molecular layer containing the shock front (Figure 3.12b)
and the first layer behind the shock (Figure 3.12c) there is a major discrepancy between
74

Chapter 3: Shock-Induced Inelastic Deformation in Oriented Crystalline Pentaerythritol Tetranitrate (PETN)
the “temperatures” predicted based on equipartition and those corresponding to best fits
of the CMKE data to the MB distribution; for the layer containing the shock front the
equipartition-based value (800 K) is much lower than the best fit to eq 9 (1861 K). The
MB distributions obtained using the equipartition-based temperatures (blue curves) do
not even approximately mirror the simulation data. The best-fit MB distributions (red
curves) are in much better agreement with the data, although in both Figure 3.12b and
3.12c there appears to be a region of decreased probability at Ek ~ 2.510-20 J that is
inconsistent with the MB distribution at any temperature. (It is possible that this is an
artifact of the relatively small number of particles used to generate the histograms.) In the
second layer behind the shock front the CMKE distribution is approximately MB-
distributed (Figure 3.12d); temperature predictions based on equipartition and the best fit
to eq 9 are 554 K and 557 K, respectively. It is important to note, however, that while the
CMKEs for this layer and ones further behind the shock are approximately MB
distributed (increasingly so with increasing distance behind the shock), not all of them
yield as close agreement between the two temperature measures as is shown in Figure
3.12d.
From the results in Figure 3.11 we conclude that, for the case studied here,
equipartition among AKEs occurs within about 80 fs of shock wave passage and from
Figure 3.12 that the analogous process among CMKEs occurs on a time scale just a few
to several times larger. However, from Figures 3.11, 3.12, and 3.4 it is also clear that
those two partitionings of energy come to overall thermal equilibrium comparatively
75
Chapter 3: Shock-Induced Inelastic Deformation in Oriented Crystalline Pentaerythritol Tetranitrate (PETN)
quite slowly – time scales of approximately tens of ps – such that, to a good
approximation, they can be treated as weakly interacting subsystems.
3.5 Conclusions
Molecular dynamics simulations of shock propagation in oriented crystalline PETN
along directions known to exhibit relatively high ([001]) and low ([100]) detonation
initiation sensitivities yield results that are generally consistent with the steric hindrance
model proposed by Dick and co-workers.64 The simulations were performed using the
mechanically accurate, nonpolarizable form of the nonreactive force field developed by
Borodin et al.69 For shock pressures PR-H ~ 9 GPa and pre-shock temperature T = 298 K
in initially defect-free crystal, shock propagation along [001] results in a single
compressive wave; whereas shock propagation along [100] results in homogeneous
nucleation and spread of numerous defect structures in the [001] zone of the crystal and
consequently a two-wave elastic-plastic wave structure along the [100] direction.
Analysis of relative molecular center-of-mass displacements at the time of maximum
compression in the crystal provides atomic-level views of the deformation processes and
allows approximate classification of individual molecules as being either elastically
compressed or inelastically displaced.
Spatial profiles of intermolecular and intramolecular temperature were calculated for
both crystal orientations. Shock passage leads to large transient excitation of the
intermolecular degrees of freedom. Excitation of intramolecular motions occurs more
slowly and without transient overheating. Passage of the plastic wave through material in
76
Chapter 3: Shock-Induced Inelastic Deformation in Oriented Crystalline Pentaerythritol Tetranitrate (PETN)
the [100] shock leads to secondary heating of both intermolecular and intramolecular
modes.
Distributions of CCON and CONO dihedral angles calculated in unshocked crystal
and at the times of maximum compression reveal torsional defects induced by shock
passage along [100] but not [001]. In the [100] shock new peaks centered at ±90° emerge
in the distribution of CCON dihedrals, which initially are all trans, and cis-trans
isomerization of CONO dihedral angles occurs in some of the inelastically-displaced
molecules. These observations are qualitatively consistent with the notion of more
hindered shear in the sensitive [001] direction.
A simulation of a [100] shock in a quasi-2D system designed to minimize finite-size
effects in the transverse direction [010] was performed to provide greater insight into the
kinds of shock-induced defect structures that occur in the crystal. The results revealed
several types of deformation processes in the plastic zone including full dislocations,
stacking faults, intersecting slip zones, and regions of more generalized plastic flow.
Subregions of material containing these defects were identified for additional study.
Specifically, time histories for total kinetic energy (expressed in temperature units) and
rotational order were calculated in each identified region, with results obtained separately
for molecules determined to be inelastically displaced versus elastically compressed.
Maximum temperatures were higher for molecules that were inelastically displaced. Loss
of rotational order occurs during dislocation slip but is nearly completely recovered
within a few tens of ps.
77

Chapter 3: Shock-Induced Inelastic Deformation in Oriented Crystalline Pentaerythritol Tetranitrate (PETN)
For the [100] shock strength considered here, PR-H[100] = 8.7 GPa, distributions of
atomic kinetic energies calculated for molecularly-thin layers of material located in and
just behind the shock front remain in local thermal equilibrium during the shock heating
process; that is, they remain Maxwell-Boltzmann distributed on all time scales greater
than ~80 fs . By contrast, molecular center-of-mass kinetic energies do not remain in
local thermal equilibrium during the shock rise. Distribution functions for that quantity
calculated in the shock front exhibit pronounced deviations from the Maxwell-Boltzmann
distribution that persist for a few to several molecular layers (i.e., a few hundred to
several hundred fs) behind the shock front.
78

Chapter 3: Shock-Induced Inelastic Deformation in Oriented Crystalline Pentaerythritol Tetranitrate (PETN)
References
(1) Bottaro, J. In Overviews of Recent Research on Energetic Materials; Shaw, R. W., Brill, T. B., Thompson, D. L., Eds.; World Scientific Publishing Co. Pte. Ltd.: 2005; Vol. 16, p 501.
(2) Hirth, J. P.; Lothe, J. Theory of Dislocations; John Wiley & Sons: New York, 1982. (3) Hull, D.; Bacon, D. J. Introduction to Dislocations; Third ed.; Pergamon Press: New York,
1984. (4) Armstrong, R. W. Rev. Adv. Mater. Sci. 2009, 19, 13. (5) Sandusky, H. W.; Glancy, B. C.; Carlson, D. W.; Elban, W. L.; Armstrong, R. W. J.
Propulsion 1991, 7. (6) Holian, B. L.; Germann, T. C.; Maillet, J. B.; White, C. T. Physical Review Letters 2002, 89,
285501. (7) Tran, L.; Udaykumar, H. S. Journal of Propulsion and Power 2006, 22, 947. (8) Tran, L.; Udaykumar, H. S. Journal of Propulsion and Power 2006, 22, 959. (9) Menikoff, R. Combustion Theory and Modelling 2006, 10, 1003. (10) Hu, Y.; Brenner, D. W.; Shi, Y. The Journal of Physical Chemistry C 2011, 115, 2416. (11) Duesbery, M. S.; Vitek, V. Acta Materialia 1998, 46, 1481. (12) Ismail‐Beigi, S.; Arias, T. A. Physical Review Letters 2000, 84, 1499. (13) Schiotz, J.; Jacobsen, K. W. Science 2003, 301, 1357. (14) Bringa, E. M.; Caro, A.; Wang, Y.; Victoria, M.; McNaney, J. M.; Remington, B. A.; Smith,
R. F.; Torralva, B. R.; Van Swygenhoven, H. Science 2005, 309, 1838. (15) Cawkwell, M. J.; Nguyen‐Manh, D.; Woodward, C.; Pettifor, D. G.; Vitek, V. Science 2005,
309, 1059. (16) Ramos, K. J.; Bahr, D. F. Journal of Materials Research 2007, 22, 2037. (17) Ramos, K. J.; Hooks, D. E.; Bahr, D. F. Philosophical Magazine 2009, 89, 2381. (18) Lei, L.; Koslowski, M. Philosophical Magazine 2011, 91, 865 (19) Rice, B. M.; Sewell, T. D. In Static Compression of Energetic Materials; First ed.; Peiris, S.
M., Piermarini, G. J., Eds.; Springer‐Verlag: 2008, p 330. (20) Sorescu, D. C.; Rice, B. M.; Thompson, D. L. The Journal of Physical Chemistry B 2000,
104, 8406. (21) Agrawal, P. M.; Rice, B. M.; Thompson, D. L. The Journal of Chemical Physics 2003, 119,
9617. (22) Zheng, L.; Luo, S. N.; Thompson, D. L. The Journal of Chemical Physics 2006, 124, 154504. (23) Desbiens, N.; Bourasseau, E.; Maillet, J. B. Molecular Simulation 2007, 33, 1061. (24) Hervouet, A.; Desbiens, N.; Bourasseau, E.; Maillet, J. B. The Journal of Physical
Chemistry B 2008, 112, 5070. (25) Desbiens, N.; Bourasseau, E.; Maillet, J. B.; Soulard, L. Journal of Hazardous Materials
2009, 166, 1120. (26) Siavosh‐Haghighi, A.; Dawes, R.; Sewell, T. D.; Thompson, D. L. The Journal of Chemical
Physics 2009, 131, 064503. (27) He, L.; Sewell, T. D.; Thompson, D. L. The Journal of Chemical Physics 2011, 134, 124506. (28) Slough, W.; Perger, W. F. Chemical Physics Letters 2010, 498, 97. (29) Smith, G. D.; Bharadwaj, R. K. The Journal of Physical Chemistry B 1999, 103, 3570. (30) Bedrov, D.; Smith, G. D.; Sewell, T. D. Chemical Physics Letters 2000, 324, 64. (31) Bedrov, D.; Smith, G. D.; Sewell, T. D. The Journal of Chemical Physics 2000, 112, 7203.
79

Chapter 3: Shock-Induced Inelastic Deformation in Oriented Crystalline Pentaerythritol Tetranitrate (PETN)
(32) Sewell, T. D.; Menikoff, R.; Bedrov, D.; Smith, G. D. The Journal of Chemical Physics 2003,
119, 7417. (33) Jaramillo, E.; Sewell, T. D.; Strachan, A. Physical Review B 2007, 76, 064112. (34) Strachan, A.; van Duin, A. C. T.; Chakraborty, D.; Dasgupta, S.; Goddard III, W. A. Physical
Review Letters 2003, 91, 098301. (35) Strachan, A.; Kober, E. M.; van Duin, A. C. T.; Oxgaard, J.; Goddard III, W. A. The Journal
of Chemical Physics 2005, 122, 054502. (36) Cawkwell, M. J.; Sewell, T. D.; Zheng, L.; Thompson, D. L. Physical Review B 2008, 78,
014107. (37) Bedrov, D.; Hooper, J. B.; Smith, G. D.; Sewell, T. D. The Journal of Chemical Physics
2009, 131, 034712. (38) Cawkwell, M. J.; Ramos, K. J.; Hooks, D. E.; Sewell, T. D. Journal of Applied Physics 2010,
107, 063512. (39) Ramos, K. J.; Hooks, D. E.; Sewell, T. D.; Cawkwell, M. J. Journal of Applied Physics 2010,
108, 066105. (40) Munday, L. B.; Chung, P. W.; Rice, B. M.; Solares, S. D. The Journal of Physical Chemistry
B 2011, 115, 4378. (41) Mathew, N.; Picu, R. C. 2011. (42) Byrd, E. F. C.; Rice, B. M. The Journal of Physical Chemistry C 2007, 111, 2787. (43) Budzevich, M. M.; Landerville, A. C.; Conroy, M. W.; Lin, Y.; Oleynik, I. I.; White, C. T.
2010. (44) Dick, J. J.; Ritchie, J. P. Journal of Applied Physics 1994, 76, 2726. (45) Gruzdkov, Y. A.; Gupta, Y. M. The Journal of Physical Chemistry A 2000, 104, 11169. (46) Winey, J. M.; Gupta, Y. M. Journal of Applied Physics 2001, 90, 1669. (47) Winey, J. M.; Gupta, Y. M. Journal of Applied Physics 2010, 107, 103505. (48) Gee, R. H.; Wu, C.; Maiti, A. Applied Physics Letters 2006, 89, 021919. (49) Budzien, J.; Thompson, A. P.; Zybin, S. V. The Journal of Physical Chemistry B 2009, 113,
13142. (50) Zybin, S. V.; Goddard III, W. A.; Xu, P.; van Duin, A. C. T.; Thompson, A. P. Applied Physics
Letters 2010, 96, 081918. (51) Piryatinski, A.; Tretiak, S.; Sewell, T. D.; McGrane, S. D. Physical Review B 2007, 75,
214306. (52) Velizhanin, K. A.; Kilina, S.; Sewell, T. D.; Piryatinski, A. The Journal of Physical Chemistry
B 2008, 112, 13252. (53) Pereverzev, A.; Sewell, T. D. The Journal of Chemical Physics 2011, 134, 014513. (54) Perger, W. F.; Vutukuri, S.; Dreger, Z. A.; Gupta, Y. M.; Flurchick, K. Chemical Physics
Letters 2006, 422, 397. (55) Herring, S. D.; Germann, T. C.; Grønbech‐Jensen, N. Physical Review B 2010, 82, 214108. (56) Lynch, K.; et al. Modelling and Simulation in Materials Science and Engineering 2009, 17,
015007. (57) Izvekov, S.; Chung, P. W.; Rice, B. M. The multiscale coarse‐graining method: Assessing
its accuracy and introducing density dependent coarse‐grain potentials; AIP, 2010; Vol. 133.
(58) Bouma, R. H. B.; van der Heijden, A. E. D. M.; Sewell, T.; Thompson, D. L. In Numerical Simulations; Awrejcewicz, J., Ed.; InTech: 2011, p 29.
(59) Jones, W. M.; Giauque, W. F. Journal of the American Chemical Society 1947, 69, 983.
80

Chapter 3: Shock-Induced Inelastic Deformation in Oriented Crystalline Pentaerythritol Tetranitrate (PETN)
81
(60) McCullough, J. P.; Scott, D. W.; Pennington, R. E.; Hossenlopp, I. A.; Waddington, G. Journal of the American Chemical Society 1954, 76, 4791.
(61) Trevino, S. F.; Prince, E.; Hubbard, C. R. Refinement of the structure of solid nitromethane; AIP, 1980; Vol. 73.
(62) Bedrov, D.; Ayyagari, C.; Smith, G.; Sewell, T. D.; Menikoff, R.; Zaug, J. Journal of Computer‐Aided Materials Design 2001, 8, 77.
(63) Dick, J. J. Applied Physics Letters 1984, 44, 859. (64) Dick, J. J.; Mulford, R. N.; Spencer, W. J.; Pettit, D. R.; Garcia, E.; Shaw, D. C. Journal of
Applied Physics 1991, 70, 3572. (65) Dick, J. J. Journal of Applied Physics 1997, 81, 601. (66) Dick, J. J.; Hooks, D. E.; Menikoff, R.; Martinez, A. R. Journal of Applied Physics 2004, 96,
374. (67) Hooks, D. E.; Ramos, K. J.; Martinez, A. R. Journal of Applied Physics 2006, 100, 024908. (68) Shan, T. R.; Thompson, A. P. Journal of Physics: Conference Series 2014, 500, 172009. (69) Borodin, O.; Smith, G. D.; Sewell, T. D.; Bedrov, D. The Journal of Physical Chemistry B
2007, 112, 734. (70) Plimpton, S. Journal of Computational Physics 1995, 117, 1. (71) Hockney, R. W.; Eastwood, J. W. Computer Simulations Using Particles; McGraw‐Hill:
New York, 1981. (72) Conant, J. W.; Cady, H. H.; Ryan, R. R.; Yarnell, J. L.; Newsam, J. M. The Atom Positions of
Pentaerythritol Tetranitrate (PETN) Determined by X‐Ray and by Neutron Diffraction, Los Alamos National Labs, 1979.
(73) Perlman, D. A.; Case, D. A.; Caldwell, J. C.; Seibel, G. L.; Singh, U. C.; Weiner, P.; Kollman, P. A. University of California, San Francisco, 1991.
(74) Strachan, A.; Holian, B. L. Physical Review Letters 2005, 94, 014301. (75) Klimenko, V. Y.; Dremin, A. N. Sov. Phys. Dokl. 1979, 24, 984. (76) Klimenko, V. Y.; Dremin, A. N. Sov. Phys. Dokl. 1980, 25, 288. (77) McQuarrie, D. A. Statistical Mechanics; University Science Books: Sausalito, California,
2000.

Chapter 3: Shock-Induced Inelastic Deformation in Oriented Crystalline Pentaerythritol Tetranite (PETN)
Chapter 4: Molecular Dynamics Simulations of the Collapse of a
Cylindrical Pore in the Energetic Material -RDXa
4.1 Introduction
The role of hot spots in the initiation of detonation in solid energetic materials has
been of interest since their existence was proposed by Bowden and Yoffe.1 Hot spots are,
in essence, localized regions of high temperature and pressure in a material that serve as
nucleation sites for initiating and possibly sustaining rapid chemistry. Whether a hot spot
will grow or quench depends on a sensitive balance between energy release due to local
physical and chemical processes and energy transport away from the hot spot due to
various dissipation mechanisms.2 Bowden and Yoffe identified critical hot spots as
having sizes of 0.1–10 μm, lifetimes of 0.1–10 ms, and temperatures greater than 700 K.1
Tarver et al.3 developed chemical kinetic decomposition models of 1,3,5,7-
tetranitroperhydro-1,3,5,7-tetrazocine (HMX) and 1,3,5-triamino-2,4,6,-trinitrobenzene
(TATB) to estimate the critical conditions for hot spots in those materials. They estimated
sizes in the μm range and temperatures above 700 K, similar to the values proposed by
Bowden and Yoffe.
Accurate determination of hot spot critical parameters is difficult due to the small
spatio-temporal scale and difficulty in defining exactly what constitutes a hot spot in a
given material under a given loading condition. Field4 provides a list summarizing works
that identify several possible sources of hot spots including pore collapse5,6, adiabatic
a: Original publication – Eason, R. M., Sewell, T.D. Journal of Dynamic Behavior of Materials 2015, 1, 423
82

Chapter 4: Molecular Dynamics Simulations of the Collapse of a Cylindrical Pore in the Energetic
Material -RDX
shear bands7, dislocation pileups8, and friction9. Further insights into the multi-scale
interactions between shock waves, defects and interfaces, and the resulting energy
localization are essential to forming a more complete understanding of complex
detonation initiation processes. Furthermore, the integral role of hot spots in detonation
initiation provides strong motivation for understanding the dominant formation
mechanisms for a given kind of material and loading scenario.
The relationship between pore collapse and the generation of hot spots has
received considerable attention. Bourne, Field, and co-workers10-13 have employed high-
speed photography to characterize cavity collapse processes in 12% by weight mixtures
of gelatin in water and ammonium nitrate/sodium nitrate emulsions for pores ranging in
diameter from 3 to 12 mm. They used photoluminescence to identify areas where reaction
occurred during collapse, and determined that the principal ignition mechanism is the
ejection of material from the upstream wall of the pore to form a hydrodynamic jet that
impacts the downstream wall. Swantek and Austin14 extended the work of Bourne and
Field by supplementing high-speed photography results with data from particle image
velocimetry measurements of the collapse of 3 mm diameter cylindrical cavities arranged
in various array structures in a mixture of agarose and glycerol gradient buffer. For pores
aligned parallel to the impact direction the velocity fields exhibited a defracted wave
structure from the upstream pore that partially shielded, and slowed, the collapse of the
downstream pore. The collapse was faster when the pores were arranged in a staggered
pattern. Dattelbaum et al.15 mixed solid silica beads and microballoons into liquid
nitromethane to act as micron-scale hot spot sources. While both types of nitromethane
mixtures were more sensitive compared to the pure liquid, the effect was larger when
83

Chapter 4: Molecular Dynamics Simulations of the Collapse of a Cylindrical Pore in the Energetic
Material -RDX
hollow microballoons were used. This was attributed to the pore collapse that occurred
after shock passage.
The mm-scale pores mentioned in the preceding paragraph are orders of
magnitude larger than the ones that exist in a real composite explosive.16-18 Direct
experimental observation of pore collapse in real explosives is extremely difficult due to
the high strain rates and small spatio-temporal scales over which pore collapse occurs,
and because the phenomena of interest occur in the bulk of an optically impenetrable
material. Computer simulations provide a practical approach for elucidating the details of
pore collapse with essentially arbitrary spatial and temporal resolution. Hydrocodes are
appropriate for and widely applied to continuum-scale problems. Menikoff19 has
simulated shock-induced pore collapse in HMX and emphasized the importance of mesh
resolution and correct dissipative mechanisms for accurate predictions of the tail regions
of hot spot mass fraction and temperature distributions. Ball et al.20 used computational
fluid dynamics to simulate the experimental setup of Bourne and Field.21 They obtained
agreement between the locations of hot gas predicted by their simulations and the areas of
luminescence seen in the Bourne and Field experiment. Tran and Udaykumar22,23
simulated pore collapse for both reactive and inert cases in a material with mechanical
properties similar to HMX. They reported the pressures, temperatures, and ratios of
internal energy to kinetic energy observed during the collapse of a 5 μm diameter pore.
The formation of a hydrodynamic jet was found to be responsible for the greatest increase
in internal energy. Jackson et al.24 have recently developed a model for which the goal is
to reproduce data from sensitivity tests to gain a better understanding of the factors that
determine material sensitivity. They used parameters from micro-scale simulations as
84

Chapter 4: Molecular Dynamics Simulations of the Collapse of a Cylindrical Pore in the Energetic
Material -RDX
input to macro-scale simulations in which shocks produced by the collapse of hot spots
were strengthened by interacting with downstream hot spots where ignition had begun
but not completed.
Barton et al.25 have developed a crystal-level model of defect-containing HMX
that incorporates strain localization to predict heat generation from pore collapse. Austin
et al.26,27 recently developed a reactive model that includes anisotropic, thermoelastic-
viscoplastic response to study the temperature localization that results from shock-
induced collapse of a 1 µm diameter pore in β-HMX. They considered shocks normal to
the ( ) plane in the P21/c space group setting and a shock pressure of 9.4 GPa. They
determined that the dominant deformation mechanism was shear bands that nucleate at
and grow away from the pore. The model was found to be insensitive to initial crystal
orientation but was sensitive to the temperature-dependent liquid viscosity, which was
found to affect the extent of chemical reactions in the liquid shear band regions. Most
simulations of pore collapse consider idealized spherical pores in 3-D or cylindrical pores
with the cylinder axis oriented normal to the shock direction in 2-D. However, Levesque
and Vitello28 analyzed temperature maps obtained from continuum simulations of
shocked-induced pore collapse in TATB containing other pore morphologies and
determined that higher temperatures are achieved for certain oriented non-spherical pore
shapes including elliptical, cylindrical, and conical.
Two limitations of continuum-scale models are the fundamental inability to
resolve features that occur on the molecular scale and the associated requirement to
formulate and parameterize physical models that effectively capture the sub-scale
85

Chapter 4: Molecular Dynamics Simulations of the Collapse of a Cylindrical Pore in the Energetic
Material -RDX
physical phenomena. At the other extreme, molecular dynamics (MD) simulations can be
used to study materials with atomic-scale resolution, but typically only for sub-micron
space and sub-nanosecond time scales. (This statement applies to the situation studied
here, wherein molecular systems are described using empirical all-atom potential energy
functions that include intramolecular flexibility and long-range intermolecular
interactions but not chemical reactivity; for reactive potentials the simulation domains are
typically much smaller.) However, MD simulations can still provide useful information
concerning the mechanisms involved in nano-scale pore collapse processes. For example,
Holian et al.29, employing MD simulations of ejecta release and recompression across a
planar gap in a Lennard-Jones system, determined that vaporization of material into the
pore during collapse and the subsequent PV work involved in recompressing the vapor
was responsible for the extreme heating that occurs in hot spots. Hatano30 posited that
temperature alone is not sufficient to quantify the amount of chemistry occurring in
simulations of pore collapse and supplemented temperature profiles with a measure of the
number of energetic collisions in the pore (normalized by initial pore volume). He
performed simulations on 3-D Lennard-Jones systems containing cuboid-shaped pores of
varying size and found that increased cross-sectional area normal to the shock direction
increases the number of energetic intermolecular collisions whereas longer pore length
parallel to the shock direction increases the peak temperature resulting from the collapse.
Shi and Brenner31 reported 2-D MD simulations of the collapse of nanometer-scale
square pores in nitrocubane crystals in which they observed the jetting commonly seen at
larger scales in experiments and continuum simulations. Mintmire et al.32 performed MD
simulations of cylindrical pore collapse in a model diatomic material in which the
86

Chapter 4: Molecular Dynamics Simulations of the Collapse of a Cylindrical Pore in the Energetic
Material -RDX
mechanism of collapse was found to vary with shock strength. Strong shocks resulted in a
turbulent collapse that produced vibrational excitation in the molecules initially near the
pore. Herring et al.33 performed MD shock simulations using a reactive potential on
systems of diatomic molecules for samples that contained pores of various sizes and
arrangements. Increasing pore size was found to lower the minimum piston velocity
needed to initiate detonation, reduce the time to detonation, and increase the extent of
reaction in the samples. Shan and Thompson performed MD simulations with the ReaxFF
reactive force field34,35 to study the effect of 3-D spherical pore collapse on reactivity of
pentaerythritol tetranitrate (PETN)36 and ammonium nitrate/fuel oil (ANFO).37 At an
impact velocity of Up = 2.0 km·s-1 along the [110] direction in PETN, which is
insufficient to initiate widespread chemistry in a defect-free crystal on the ≈10.9 ps time
scale of their simulations, Shan and Thompson observed collapse of a 20.0 nm spherical
pore produced enhanced chemical reactivity compared to defect-free PETN.36 Shocks
propagating along [100] in ammonium nitrate containing a 10.0 nm diameter spherical
inclusion filled with fuel oil resulted in enhanced reactivity compared to defect-free
ammonium nitrate. The highest temperatures were found to occur at the interface
between the ammonium nitrate and the fuel oil.37
The energetic material 1,3,5-trinitroperhydro-1,3,5-triazine (RDX, see Figure
4.1(a)) has been widely studied both experimentally38-45 and theoretically.35,46-52 There are
four known polymorphs of RDX, denoted α53, β54, ε55, and γ56. The -phase is the stable
form at room temperature and atmospheric pressure and has received the most study.
Hooks and co-workers examined -RDX (hereafter, RDX) shock response using impact
experiments,38 identified deformation mechanisms using nanoindentation,39 and studied
87

Chapter 4: Molecular Dynamics Simulations of the Collapse of a Cylindrical Pore in the Energetic
Material -RDX
decomposition using time-resolved emission spectroscopy.40 Munday et al.57 calculated
generalized stacking fault energy surfaces using MD simulations to identifylikely
cleavage planes and slip planes to predict whether a given slip system will be brittle or
ductile. Results obtained for the (010)[100], (021)[100], and (011)[100] slip planes were
in good agreement with experiment. For the (010)[001] system, the authors predicted
brittle response whereas experiments39,58 indicate this is a slip system. Theoretical
calculations of Peierls stresses from atomic simulations to rank activated slip systems in
RDX show agreement with the anisotropic plastic deformation response observed in
experiment.59 Strachan et al.35 employed the ReaxFF34 reactive force field to perform
computer simulations on the thermal decomposition of RDX crystals. They observed an
Arrhenius temperature dependence of the calculated characteristic reaction time.
Sewell and co-workers41,47-49 used MD simulations to identify and characterize
plastic deformation mechanisms in single crystals of RDX subjected to shock waves
propagating normal to the (100), (111), and (021) crystal planes. Cawkwell et al.47
reported the formation of nano-scale shear bands for shocks propagating normal to (100).
Cawkwell et al.49 performed MD simulations in an attempt to explain an anomalous
elastic-plastic response in the measured shock profiles for (111)-oriented RDX reported
by Hooks et al.38, and determined that this response resulted from a hardening effect
created by the homogeneous nucleation of partial dislocation loops in the crystal at a
well-defined shock strength. Ramos et al.41 predicted using MD and verified
experimentally using plate-impact experiments that a similar anomalous response would
be obtained for shocks in (021)-oriented RDX due to commonalities in the slip systems
activated by shocks on the (111) and (021) crystal planes. All of the shocks studied by
88
Chapter 4: Molecular Dynamics Simulations of the Collapse of a Cylindrical Pore in the Energetic
Material -RDX
Sewell and co-workers41,47-49 were performed using a non-reactive force field at low
impact strengths; Rankine-Hugoniot shock pressures PRH ranging from 1.34 to 9.7 GPa,
similar to those that might exist in accident scenarios. Nomura et al.51 examined stronger
impact strengths (UP = 1.0 and 3.0 kms-1) using MD simulations with the ReaxFF force
field to study shock propagation in (100)-oriented RDX that contained an initially 8 nm
diameter spherical pore. They reported shock-induced vibrational excitation leading to
bond breakage and the formation of NO2, N2, and H2O in the vicinity of the pore
collapse. They also reported an impact-strength-dependent pinning/de-pinning effect on
the shock front due to passage over the pore surface and subsequent collapse.
In this study we performed MD simulations of pore collapse in (100)-oriented -
RDX for the case of shock wave passage over an initially 35 nm diameter cylindrical
pore with the cylinder axis aligned parallel to the [010] crystal direction in the
orthorhombic crystal (see Figure 4.1). Impact velocities Up = 1.0 kms-1, 2.0 kms-1, and
3.0 kms-1, corresponding to nominal shock pressures Ps = 9.71, 24.00, and 42.48 GPa in
defect-free crystal, were considered as representative of weak, moderate, and strong
shocks. Our main interest is in characterizing the nature of material flow, the nature and
extent of energy and pressure localization, and molecular-scale disorder induced by the
shock. The force field used for this work is non-reactive. Neglect of chemistry is
reasonable at the lower shock pressures but is a gross approximation for the strong shock.
Nevertheless, the qualitative information on material flow and energy localization as a
function of impact strength is still a useful contribution to the knowledge base for pore
collapse in an anisotropic molecular crystal.
89

Chapter 4: Molecular Dynamics Simulations of the Collapse of a Cylindrical Pore in the Energetic
Material -RDX
4.2 Methods
All simulations were performed using the Large-scale Atomic/Molecular
Massively Parallel Simulator (LAMMPS)60 code in conjunction with the fully flexible
non-reactive nitramine force field developed by Smith and Bharadwaj (S-B)61,62. Three-
dimensional periodic boundary conditions were used in all cases. Potentials for covalent
bonds, three-center angles, and improper dihedrals are represented as harmonic functions.
Dihedral potentials are represented by a sum of cosine terms. Non-bonded interactions
are described by the Buckingham-plus-Coulomb potential with fixed atomic partial
charges located on the nuclei. The non-bonded interactions apply to all intermolecular
atom pairs as well as intramolecular atom pairs separated by three or more covalent
bonds within a molecule (often called 1-4 interactions). A 1.0 nm cutoff was used for the
repulsion terms and the real part of the dispersion and electrostatic interactions. Long-
range interactions were evaluated with the particle-particle particle-mesh (PPPM)63
algorithm with the relative RMS error in the forces set to 1×10⁻⁴. While the S-B force
field was originally developed for HMX, the methods by which it was formulated and
parameterized were such that it should also be applicable to RDX; and Cawkwell et al.47
and Munday et al.50 determined that this is the case for both - and -RDX. We obtained
(300 K, 1 atm) lattice parameters a = 1.3498 nm, b = 1.1554 nm, and c = 1.0564 nm
based on simulations for a 3-D periodic 4a×4b×5c supercell in the isostress-isothermal
(NT) ensemble in which separate barostats were applied to each lattice direction and the
cell overall was treated as triclinic. (The thermostat and barostat coupling parameters
were set to 100.0 and 100.0 fs, respectively.) These lattice parameters compare well with
the experimental values53 a = 1.320 nm, b = 1.160 nm, and c = 1.072 nm; the values a =
90

Chapter 4: Molecular Dynamics Simulations of the Collapse of a Cylindrical Pore in the Energetic
Material -RDX
1.3400 nm, b = 1.1517 nm, and c = 1.0623 nm reported by Cawkwell et al.47; and a =
1.345 nm, b = 1.153 nm, and c = 1.053 nm reported by Munday et al.50 for the same
conditions. The calculated lattice parameters we obtained were used in the construction
of all supercells described below.
Shock waves were generated in a reverse-ballistic configuration by impacting
from the right with speed Up a thermalized slab of flexible molecules (hereafter the
flexible slab) onto a rigid, stationary piston composed of the same material (the piston).
This results in a shock wave that propagates from left to right through the flexible slab
with shock speed Us = Uw + Up, where Uw is the speed of the wave measured in the frame
of the stationary piston. Impact speeds Up = 1.0 kms-1, 2.0 kms-1, and 3.0 kms-1 were
studied. Corresponding shock pressures, calculated using the Rankine-Hugoniot relation
Ps = 0UsUp, where 0 is the pre-shock density of the crystal, were Ps = 9.71, 24.00, and
42.48 GPa, respectively. These pressures are within 1.94% of the longitudinal stress
components Pxx calculated directly from the atomic stress tensor for defect-free crystal.
The supercell for the shock simulations was obtained by replicating the crystal
unit cell by factors of 120, 3, and 135 along the , , and crystal directions,
respectively, then adding a 20.0 nm vacuum pad parallel to the crystal direction. The
purpose of the vacuum pad is to minimize interactions between the piston (which is
created after equilibration just prior to initiation of the shock) and right-hand side of the
flexible slab across the periodic boundary along . We aligned the , or [100], crystal
direction with the x-axis; the , or [010], crystal direction with the y-axis; and the , or
[001], crystal direction with the z-axis. The size of the resulting slab of material,
91

Chapter 4: Molecular Dynamics Simulations of the Collapse of a Cylindrical Pore in the Energetic
Material -RDX
excluding the vacuum, was approximately 162.0 nm × 3.5 nm × 142.6 nm (see Figure
4.1(b)). Justification for using a simulation cell that is thin along [010] comes from
c
a b
(b)
C4
I
IIIII
IV
V
VI
(a)
Figure 4.1. (a) An RDX molecule. Carbon is cyan, nitrogen is dark blue, oxygen is red, and hydrogen is black. Atoms N1 and C4 are used to define the vector discussed in Section III.B. (b) Snapshot of the molecular center-of-mass locations in the simulation cell prior to shock. The colored regions around the pore surface and inside the black square define sets of molecules for which properties are monitored during collapse. In the chosen frame of reference the red, green, and purple arrows define angles of 45°, 90°, and 135°, respectively, with the horizontal pore centerline that points toward the piston. The inset at the top right depicts concentric half-annuli around the pore surface that are also tracked as functions of time and provide a complementary view of the collapse. There is no relation between colors used in the main panel and those used in the inset.
previous studies47 where it was shown that, for shocks along [100], using a simulation
cell that is thin along [010] does not lead to appreciable finite-size effects. A 35.0 nm
diameter cylindrical pore with the cylinder axis aligned parallel to [010] was introduced
by removing all molecules with center of mass within 17.5 nm of the midpoint of the slab
in the x and z directions. Following the thermalization procedure described in the
92

Chapter 4: Molecular Dynamics Simulations of the Collapse of a Cylindrical Pore in the Energetic
Material -RDX
following paragraph, molecules in the first three unit cells (≈4.0 nm) from the left end of
the simulation cell were defined as belonging to the piston and all others as belonging to
the flexible slab.
The simulation cell construction described in the preceding paragraph was used as
the starting point for all three shock simulations. Different pseudorandom number seeds
were used for each simulation. A 10.0 ps equilibration was performed in the isochoric-
isoergic (NVE) ensemble using a 0.5 fs time step. During this equilibration instantaneous
velocity re-scaling to yield total kinetic energy Ek corresponding to “300 K” (based on Ek
= 3NT/2, where N is the number of atoms and is the Boltzmann constant), was applied
every 50.0 fs and complete velocity re-selection from the 300K Maxwell distribution was
performed every 1.0 ps. The purpose of the velocity re-selection in addition to velocity
scaling was to damp out the “breathing motion” along [100] that results from introducing
the free surfaces. Next, 20.0 ps of Nosé-Hoover isochoric-isothermal (NVT) equilibration
was performed using a 0.5 fs time step with the thermostat coupling parameter set to
100.0 fs. Finally, starting from the phase space point at the end of the NVT equilibration,
the shock wave was initiated by zeroing (and holding at zero) the velocities of atoms
belonging to the piston and adding the impact velocity vector (-Up, 0, 0) to the
instantaneous velocities of the atoms in the flexible slab. The shock simulations were
performed in the NVE ensemble using a 0.2 fs time step.
4.3 Results and Discussion
4.3.1 Snapshots of Molecular Center-of-Mass Positions and Local Velocity Fields
93

Chapter 4: Molecular Dynamics Simulations of the Collapse of a Cylindrical Pore in the Energetic
Material -RDX
Molecular center-of-mass positions, recorded at 0.2 ps intervals during the shock
simulations, were used to monitor the progress of the shock. Snapshots of material in the
vicinity of the pore at selected instants are shown for the 1.0 kms-1 shock in Figures
4.2(a,c,e), the 2.0 kms-1 shock in Figures 4.3(a,c,e), and the 3.0 kms-1 shock in Figures
4.4(a,c,e). For each shock strength the snapshots correspond to times: (a) during collapse
approximately halfway to pore closure; (c) immediately after pore closure; and (e) at the
time of maximum compression (that is, when the leading edge of the shockwave, which
is curved immediately after passage over the pore, reaches the right-hand end of the
sample). Only the upper halves of the simulation cells are shown due to symmetry about
the equator of the pore. The colors in the snapshots correspond to those in Figure 4.1(b),
which also serves as a reference for the positions of molecules prior to shock passage.
The colored regions on the pore surface and inside the black square in the main panel of
Figure 4.1(b) designate sets of molecules that will be the focus of much of the analysis
and are labeled as follows: the ejection point (blue, Set I); ±45° to the centerline of the
pore (red, Set II); the upper and lower poles of the pore (green, Set III); ±135° to the Set
V); and bulk material away from the pore (Set VI). These regions were used to
characterize the response of material as a function of initial position on the pore surface.
The inset in the top-right corner of Figure 4.1(b) contains a second scheme for coloring
the molecules that highlights different aspects of the collapse. The molecules in both
94

Chapter 4: Molecular Dynamics Simulations of the Collapse of a Cylindrical Pore in the Energetic
Material -RDX
(a) t = 22.0 ps (b) t = 22.0 ps
(c) t = 24.0 ps (d) t = 24.0 ps
(e) t = 29.6 ps (f) t = 29.6 ps
Figure 4.2. Left, panels (a), (c), and (e): Snapshots of molecular centers of mass during pore collapse at three instants of time for the 1.0 kms-1 shock. Colors correspond to those shown in Figure 1(b) and illustrate the qualitative features of the mass flow during collapse. Right, panels (b), (d), and (f): Velocity fields for the same instants of time as in the left column. Units for the velocity vector are Å·fs-1. Times are relative to the instant when the shock is initiated. Only the upper half of the simulation is cell is shown and the view is restricted material in the vicinity of the pore.
95

Chapter 4: Molecular Dynamics Simulations of the Collapse of a Cylindrical Pore in the Energetic
Material -RDX
representations retain their color-ID during the simulations and thus convey qualitative
centerline of the pore (purple, Set IV); the stagnation region or downstream wall (black,
information about the nature of overall material deformation during collapse. There is no
relationship between the colors used in the two representations. Where appropriate
below, averaging over symmetry-equivalent regions of material above and below the
equator was performed to improve the statistics.
Local velocity fields, calculated at the same instants as shown in panels (a,c,e) of
Figures 4.2-4.4, are shown in panels (b,d,f) of those figures and are used to convey
instantaneous flow on the microscopic scale. The velocity fields were calculated in an
Eulerian frame by dividing the simulation cell into a 3-D grid of smaller cells in the (x-z)
plane. The width and height for each cell are equal to the lattice spacing in the
corresponding direction, that is, 1.3498 nm along the x-axis and 1.0564 nm along the z-
axis, and the depth extends all the way through the sample in the y-direction. Entire
molecules were assigned to the cells based on their instantaneous center-of-mass
positions. The x- and z- components of the center-of-mass velocity, vx and vz,
respectively, were calculated for the material in each cell at a given instant of time and
plotted as a vector, with the origin of a given vector located at the geometric center of the
corresponding cell.
Many of the experiments and simulations referenced in the Introduction observed
a hydrodynamic response during pore collapse, characterized by the focusing of upstream
wall material into a fluid-like jet directed along the centerline of the pore. The collapse
resulting from the weakest shock we studied (1.0 kms-1, Figure 4.2) shows no signs of jet
formation and is dominated by convergence of mainly upstream-side wall material
96

Chapter 4: Molecular Dynamics Simulations of the Collapse of a Cylindrical Pore in the Energetic
Material -RDX
toward the centerline and downstream wall (Figures 4.2(a,c,e)). In terms of the sets of
molecules identified in Figure 4.1(b), the collapse is led by material in Set II flowing into
the pore at an angle of approximately 45° to the horizontal. Material initially located in
the ejection zone (Set I) initially lags behind but accelerates as the collapse progresses
such that ‘frontier’ molecules in Sets I and II arrive at the downstream wall at
approximately the same time. Although material in the vicinity of the upstream side of
the pore shows signs of intense plastic deformation (i.e., translational disorder), note the
persistence of regions of local crystallinity (i.e., relatively high translational order) in
some of the material located between Sets I and II throughout the collapse. Velocities in
the vicinity of the collapse zone (Figures 4.2(b,d,f)) are close to zero confirming that net
translational motion (local mass flow) has halted shortly after collapse. At the time of
maximum compression the ‘translational strain’ in the defined sets of molecules initially
located at the pore surface is greatest for Sets II and III (red and green, respectively) and
least for Set V (black).
The moderate shock (2.0 kms-1, Figure 4.3) results in stronger material focusing
during collapse compared to the result obtained for the weak shock case. The molecular
velocities of the ejection zone (Set I) and Set II are more strongly oriented along a
common axis parallel to the shock direction (Figure 4.3(b)). The material initially in the
pole region (Set III) flows toward the centerline with the upstream wall material,
producing an enhanced focusing of material with a large component of motion parallel to
the centerline. Regions of vorticity are evident in the velocity field during collapse
(Figures 4.3(b) and 4.3(d)) as material in Sets III and IV flow toward the centerline after
entrainment with ejection zone material. The impact of the ejection zone material on to
97

Chapter 4: Molecular Dynamics Simulations of the Collapse of a Cylindrical Pore in the Energetic
Material -RDX
(a) t = 15.2 ps (b) t = 15.2 ps
(c) t = 16.8 ps (d) t = 16.8 ps
(e) t = 24.0 ps (f) t = 24.0 ps
Figure 4.3. As in Figure 4.2, but for the 2.0 kms-1 impact.
98

Chapter 4: Molecular Dynamics Simulations of the Collapse of a Cylindrical Pore in the Energetic
Material -RDX
the downstream wall is much stronger than for the weak shock, resulting in more
significant deformation of downstream wall material (Figure 4.3(e)). A subsequent flow
develops in the vicinity of the impact zone (Figure 4.3(d)) that has stagnated by the time
of maximum compression as evidenced by velocities that are near zero in Figure 4.3(f).
The strong shock (3.0 kms-1, Figure 4.4) exhibits an even stronger focusing of
material along the pore centerline. Ejection of molecules in Set I with high velocities
(Figure 4.4(b)) in conjunction with convergence of the flow of most of the upstream wall
material parallel to the horizontal centerline of the pore causes the near-pore material to
involute and form a jet (Figures 4.4(a,c)). Compared to the weaker shocks, impact
produces a much more severe deformation of the downstream wall material that severely
displaces molecules away from a well-ordered crystalline state (Figure 4.4(e)). After pore
closure, persistent following flow exists along with regions of vortex-like motion
centered on the lobes that pinch shut to complete collapse (Figure 4.4(f)).
As expected, snapshots and velocity fields suggest mechanisms of collapse that
depend on the initial impact strength. Weak shock passage results in pore collapse via a
visco-plastic flow of material that largely ceases when the pore pinches shut, with little
penetration of material into the downstream region or residual vorticity in the inflow
regions. The moderate shock results in more focusing of the upstream wall material with
early signs of jet formation and some amount of penetration into the downstream wall.
By contrast, the strong shock focuses material and velocities along the pore centerline
strongly enough to create a hydrodynamic jet that penetrates significantly into the
downstream wall along with considerable vorticity in the inflow region. The greater
focusing of material with increasing impact strength should result in a greater deposition
99

Chapter 4: Molecular Dynamics Simulations of the Collapse of a Cylindrical Pore in the Energetic
Material -RDX
(a) t = 11.0 ps (b) t = 11.0 ps
(c) t = 12.6 ps (d) t = 12.6 ps
(e) t = 19.6 ps (f) t = 19.6 ps
Figure 4.4. As in Figure 4.2, but for the 3.0 kms-1 impact.
100

Chapter 4: Molecular Dynamics Simulations of the Collapse of a Cylindrical Pore in the Energetic
Material -RDX
of energy at the stagnation zone, leading to the formation of an intense mechanical hot
spot.
4.3.2 Rotational Order During Collapse
Time autocorrelation functions for a time-dependent vector, defined individually
in the lab frame for each molecule, were calculated for the molecules in Sets I-V to
quantify the extent of molecular rotational motion induced by pore collapse as a function
of initial location at the pore surface, and for molecules in Set VI as a point of reference
for molecules far from the pore. To calculate the autocorrelation functions, for each
molecule m in a given set the unit vector that points from the ring nitrogen atom N1
to carbon atom C4 (see Figure 4.1(a)) was monitored as a function of time t. The time
autocorrelation function (ACF) of for molecule m was calculated as
, (1)
where t' is a particular time origin, τ is the positive time lag from that time origin, T is the
total interval of time observed (2.0 ps per time window, as elaborated below), and Δt is
the spacing between successive data points. All time origins t' within a given time
window are treated as equivalent. The range of is [-1,+1] and for a liquid the
long-time value should approach zero. The ACF for the molecules in a given set
(I-VI) was defined as the arithmetic average of over all M molecules assigned to
that set:
. (2)
101
Chapter 4: Molecular Dynamics Simulations of the Collapse of a Cylindrical Pore in the Energetic
Material -RDX
The analysis was performed separately for contiguous 2.0 ps time windows starting at the
instant when the shock wave reached the upstream pore wall and continuing until the
time of maximum compression. The results are presented in Figure 4.5, where the dashed
vertical lines denote the approximate times of pore closure. Additionally, the ACFs
presented in Figure 4.5 were fit to the exponential function,
, (3)
to obtain the characteristic rotational time constant that defines an approximate time
scale on which, on average, the molecules in a particular region lose memory of their
initial orientation within a given 2.0 ps time window. Smaller corresponds to faster
rotational disordering. Values of are presented in Table 1 for four selected 2.0 ps time
windows for each shock strength. These time constants are not intended as rigorous
metrics for rotational diffusion in RDX but instead provide a consistent method for
comparing the different extents of rotational motion at different locations and time
windows during collapse for the different impact strengths.
In the results from Section 4.3.1 it was seen that passage of the weak shock wave
(1.0 kms-1 impact) collapses the pore in a visco-plastic manner characterized by
convergence of mainly upstream wall material along the centerline. The molecular-scale
rotational motion as characterized by the autocorrelation function during collapse (Figure
4.5(a)) is consistent with this observation. Molecules in Sets II and III along the upstream
wall (red and green curves, respectively) are ejected into the pore at about a |45°| angle to
the direction of shock propagation (see Figures 4.2(a) and 4.2(b)) producing strong
molecular torques that cause increased rotational motion of the molecules in these sets.
102
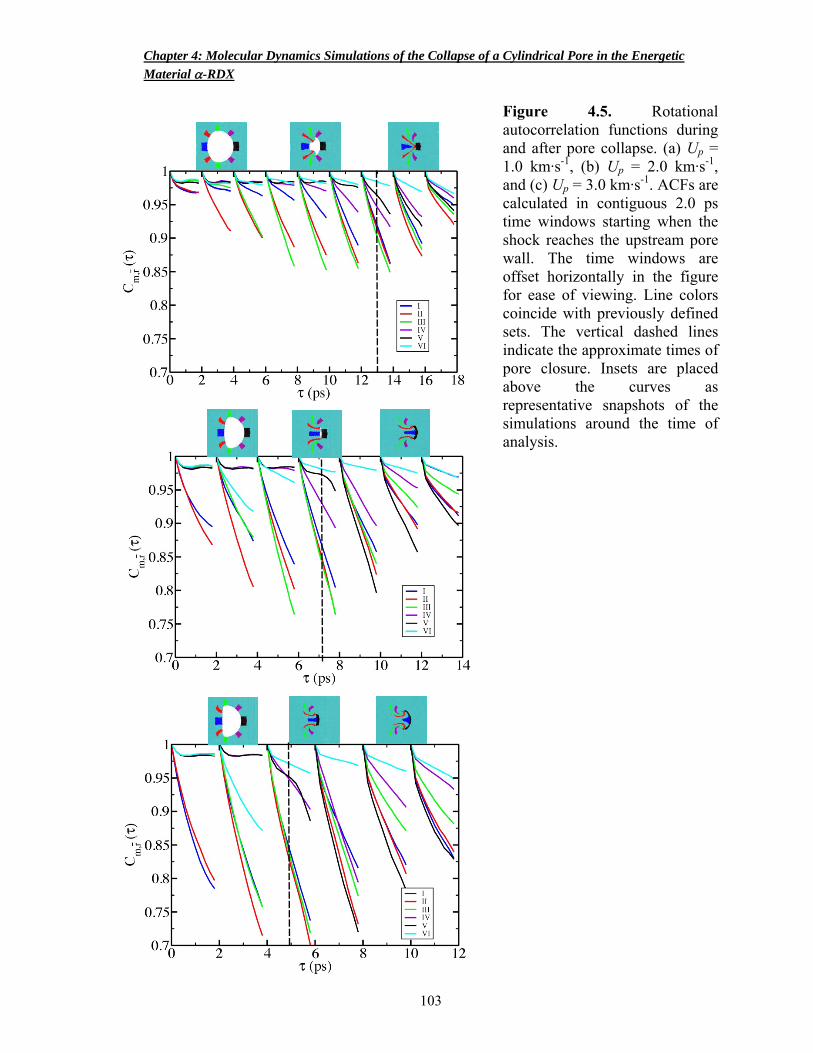
Chapter 4: Molecular Dynamics Simulations of the Collapse of a Cylindrical Pore in the Energetic
Material -RDX
Figure 4.5. Rotational autocorrelation functions during and after pore collapse. (a) Up = 1.0 km·s-1, (b) Up = 2.0 km·s-1, and (c) Up = 3.0 km·s-1. ACFs are calculated in contiguous 2.0 ps time windows starting when the shock reaches the upstream pore wall. The time windows are offset horizontally in the figure for ease of viewing. Line colors coincide with previously defined sets. The vertical dashed lines indicate the approximate times of pore closure. Insets are placed above the curves as representative snapshots of the simulations around the time of analysis.
103
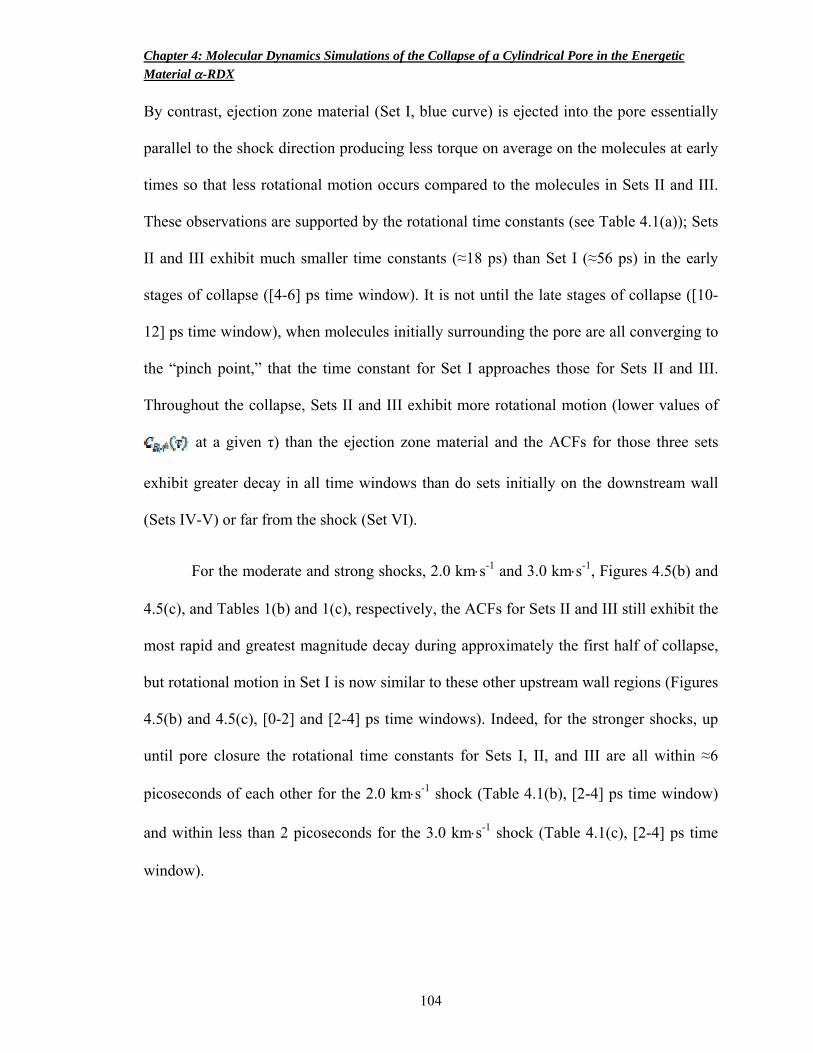
Chapter 4: Molecular Dynamics Simulations of the Collapse of a Cylindrical Pore in the Energetic
Material -RDX
By contrast, ejection zone material (Set I, blue curve) is ejected into the pore essentially
parallel to the shock direction producing less torque on average on the molecules at early
times so that less rotational motion occurs compared to the molecules in Sets II and III.
These observations are supported by the rotational time constants (see Table 4.1(a)); Sets
II and III exhibit much smaller time constants (≈18 ps) than Set I (≈56 ps) in the early
stages of collapse ([4-6] ps time window). It is not until the late stages of collapse ([10-
12] ps time window), when molecules initially surrounding the pore are all converging to
the “pinch point,” that the time constant for Set I approaches those for Sets II and III.
Throughout the collapse, Sets II and III exhibit more rotational motion (lower values of
at a given τ) than the ejection zone material and the ACFs for those three sets
exhibit greater decay in all time windows than do sets initially on the downstream wall
(Sets IV-V) or far from the shock (Set VI).
For the moderate and strong shocks, 2.0 kms-1 and 3.0 kms-1, Figures 4.5(b) and
4.5(c), and Tables 1(b) and 1(c), respectively, the ACFs for Sets II and III still exhibit the
most rapid and greatest magnitude decay during approximately the first half of collapse,
but rotational motion in Set I is now similar to these other upstream wall regions (Figures
4.5(b) and 4.5(c), [0-2] and [2-4] ps time windows). Indeed, for the stronger shocks, up
until pore closure the rotational time constants for Sets I, II, and III are all within ≈6
picoseconds of each other for the 2.0 kms-1 shock (Table 4.1(b), [2-4] ps time window)
and within less than 2 picoseconds for the 3.0 kms-1 shock (Table 4.1(c), [2-4] ps time
window).
104

Chapter 4: Molecular Dynamics Simulations of the Collapse of a Cylindrical Pore in the Energetic
Material -RDX
Table 4.1. Rotational time constants for RDX. Units are ps. Time windows coincide with those presented in Figure 5. Dashes in the table indicate curves in Figure 5 that are not well described by an exponential decay.
(a) Up = 1.0 km·s-1
Time Window
Set [4 – 6] [10 – 12] [12 – 14] [16 – 18]
I 55.6 15.6 12.8 40.0
II 17.9 12.7 12.7 25.0
III 18.2 11.8 11.4 31.2
IV --- 31.2 22.2 50.0
V --- --- 30.3 33.3
VI --- --- --- 62.5
(b) Up = 2.0 km·s-1
Time Window
Set [2 – 4] [6 – 8] [8 – 10] [12 – 14]
I 14.5 8.6 12.8 22.7
II 8.3 7.0 9.9 23.3
III 14.1 6.9 10.8 37.0
IV --- 16.7 17.0 66.7
V --- 45.4 8.4 18.5
VI 21.7 --- --- 66.7
(c) Up = 3.0 km·s-1
Time Window
Set [2 – 4] [4 – 6] [6 – 8] [10 – 12]
I 6.7 6.1 9.6 10.8
II 5.4 5.4 6.0 11.5
III 6.5 5.6 7.4 15.9
IV --- 18.9 7.9 30.3
V --- 17.9 5.7 10.6
VI 13.5 --- --- 40
105

Chapter 4: Molecular Dynamics Simulations of the Collapse of a Cylindrical Pore in the Energetic
Material -RDX
Results to the right of the vertical dashed lines in Figure4.5 are for times between
initial pore closure and maximum compression. From the simulation snapshots and
velocity fields shown in Figures 4.2-4.4 it is clear that material ejected from the upstream
wall stagnates quickly upon impacting the downstream wall for the weak shock, with
little further mass flow once the pore has closed; whereas increasing amounts of post-
closure flow (penetration) of the upstream wall material into the downstream wall occurs
for the moderate and strong shocks. The material stagnation in the vicinity of the collapse
zone for the weak shock case is apparent in the autocorrelation function (Figure 4.5(a)).
Immediately following collapse ([12-14] ps time window), the collapse zone material
(Sets I-V) does not rotationally disorder to a much greater degree than material far from
the pore (Set VI) that has mainly only been uniaxially compressed and heated by the
shock. By the time of maximum compression ([16-18] ps time window), rotational
motion has mostly stagnated throughout the sample.
The collapse-zone regions (Sets I-V) in the moderate shock case (Figure 4.5(b)
and Table 4.1(b)) exhibit more rotational motion after collapse than for the weak shock. It
was observed in connection with Figure 4.3 that although there is some degree of
focusing for the moderate shock case, the focusing is not strong enough to result in a
well-formed jet. While there is some penetration into the downstream wall, rotational
motion has largely ceased by the time of maximum compression similar to the weak
shock (Figure 4.5(b), [12-14] ps time window). It should also be noted that the
temperature and pressure are higher in the vicinity of the collapse zone compared to
material away from the pore (see Section 4.3.3). The higher temperature (higher kinetic
energy) in conjunction with structure disruption due to penetration of the downstream
106

Chapter 4: Molecular Dynamics Simulations of the Collapse of a Cylindrical Pore in the Energetic
Material -RDX
wall will favor increased rotational motion. However, the higher pressure from
compression will serve to reduce the amount of rotational motion. These competing
factors probably explain why the results far from the pore (Set VI) are almost
quantitatively similar at long times for the two weaker shocks.
Increased rotational motion after pore closure is observed for the strong shock
case compared to the two weaker shocks (see Figure 4.5(c) and Table 4.1(c)). The
rotational time constants for collapse zone material (Sets I – III) immediately after
collapse for the 1.0 kms-1 and 2.0 kms-1 shocks are in the 10 – 13 ps range whereas for
the 3.0 kms-1 shock smaller time constants in the 6 – 10 ps range are obtained. There is
also evidence in the autocorrelation function for the strong shock of considerable
rotational motion at the time of maximum compression (Figure 4.5(c), Table 1(c) [10-12]
ps time window). This result is the combined effect of the heating, jet penetration, and
persistent high-strain mass flow in the strong shock case.
4.3.3 Temperature and Longitudinal Pressure
Intramolecular (i.e., rotational-vibrational) temperatures and longitudinal pressure
components Pxx were calculated as functions of location in the sample for several instants
of time during pore collapse using the same Eulerian grid described in Section 4.3.1. The
intramolecular temperatures, hereafter temperatures, were calculated using a previously
described method.64 The atomic stress tensor for all atoms was saved at 0.2 ps intervals
during the simulation, and pressures were then calculated from the longitudinal
component of the atomic stress tensor, Pxx = -σxx, for all atoms in a given Eulerian grid
107

Chapter 4: Molecular Dynamics Simulations of the Collapse of a Cylindrical Pore in the Energetic
Material -RDX
cell at a given time. Figure 4.6 contains color maps of temperature for all three shock
pressures at two times of interest: immediately after initial pore closure (left-hand
column) and at the time of maximum compression (right-hand column). Results for the
weak, intermediate, and strong shock are shown in the upper, middle, and lower rows
(panels (a) and (b), (c) and (d), and (e) and (f), respectively). Figure 4.7 contains profiles
of temperature (left-hand column) and longitudinal pressure component Pxx (right-hand
column) along the shock direction, for material within 5.0 nm of the horizontal centerline,
at four different instants after the collapse: when the pore first closes (black solid curves),
the time of maximum compression (blue solid curves), and two intermediate times
(redand green dashed curves). Figure 4.6 provides a qualitative overall description of the
temperature distribution in the material whereas Figure 4.7 provides a more quantitative
measure of the peak temperature and longitudinal pressure achieved and how those
quantities evolve along the centerline as the collapse occurs.
The temperature maps for the weak shock just after pore closure and at the time of
maximum compression are shown in Figures 4.6(a) and 4.6(b), respectively, and the
corresponding temperature and longitudinal pressure profiles along the centerline at those
times are shown as black and blue solid curves, respectively, in Figures 4.7(a) and 4.7(b).
Peak temperatures of ≈1500 K and pressures of ≈22 GPa are achieved in the vicinity of
the collapse zone within about 1 ps of closure (dashed red curves); corresponding
temperature and longitudinal pressure values away from the pore are ≈400 K and
approximately ≈9.8 GPa. From the temperature map, heating is limited to a relatively
small area in the vicinity of the stagnation point (see Figures 4.6(a) and 4.6(b)); and after
modest heating during the first ps after closure, the temperature profile remains relatively
108
Chapter 4: Molecular Dynamics Simulations of the Collapse of a Cylindrical Pore in the Energetic
Material -RDX
Figure 4.6. Rotational-vibrational temperatures just after pore closure (left column, panels (a), (c), and (e)) and at the time of maximum compression (right column, panels (b), (d), and (f)) for Up = 1.0 km·s-1 (top row), 2.0 km·s-1 (middle row), and 3.0 km·s-1 (bottom row). Note that the temperature scale differs for each impact strength. The white line in panel (a) depicts the initial pore diameter, 35 nm, and is intended merely as a visual aid.
109

Chapter 4: Molecular Dynamics Simulations of the Collapse of a Cylindrical Pore in the Energetic
Material -RDX
constant in the time that elapses between initial pore closure and maximum compression
of the system 4.4 ps later (see Figure 4.7(a)).
In contrast to the temperature profiles for the weak shock, the longitudinal
pressure profiles (see Figure 4.7(b)) broaden and decrease in amplitude quickly after pore
closure. At the time of initial closure (25.2 ps, black solid curve) there is a narrow
pressure spike. Pressure waves reflecting from the stagnation point increase the pressure
slightly (red dashed curve), after which the two waves quickly decrease in amplitude as
they move forward and backward through the material. The 13 GPa peak pressure at the
time of maximum compression (blue solid curve value at ≈110 nm) is higher than the
pressure of 9.71 GPa expected from shock compression in the defect-free crystal of RDX.
Presumably, this pressure overshoot would decay to the nominal shock pressure should
the simulation time be extended.
Pore collapse resulting from the moderate shock has a greater effect on heating
material surrounding the collapse zone than for the weak shock case. Once again a
localized region of higher temperatures is visible just after collapse (Figure 4.6(c)).
However, in contrast to the result discussed above for the weak shock, in this case
temperature at maximum compression (Figure 4.6(d)) exhibits a profile that has evolved
considerably since initial closure. The area of the hotter material has increased from
Figure 4.6(c) to 4.6(d) and a “fan” is visible between the shock wave and the collapse
zone in Figure 4.6(d). The peak temperature along the centerline is ≈2000 K (Figure 4.7c)
and remains fairly constant in time. However, in contrast to the weak shock case, here the
peak broadens considerably over that same time interval. The causes for this are a
combination of convection and redistribution of energy from the molecular translational
110

Chapter 4: Molecular Dynamics Simulations of the Collapse of a Cylindrical Pore in the Energetic
Material -RDX
111
(b)
(a)
(c) (d)
(e) (f)
Figure 4.7. Spatial profiles of temperature (left column) and longitudinal stress (right column) parallel to the shock direction. The results are for a strip of material located within 5 nm of the horizontal centerline of the simulation cell for three different impact speeds Up. Panels (a) and (b): Up = 1.0 km·s-1; panels (c) and (d) 2.0 km·s-1; panels (e) and (f): 3.0 km·s-1. Lines are colored according to elapsed time, in ps, since initiation of the shock, with the shortest (black) and longest (blue) elapsed times depicted using solid curves and the intermediate times (red and green) depicted using dashed curves.
Chapter 4: Molecular Dynamics Simulations of the Collapse of a Cylindrical Pore in the Energetic
Material -RDX
degrees of freedom in the flow to intramolecular kinetic energy in the stagnated region.
A secondary compressive wave centered on the collapse zone is visible in the
pressure profiles (Figure 4.7d). Similar to the 1.0 kms-1 impact case, pressure waves that
quickly decrease in amplitude are reflected from the stagnation point. The peak pressure
value in Figure 4.7(d) at the time of maximum compression is ≈25 GPa, which is close to
the Rankine-Hugoniot shock pressure of 24.00 GPa, but much less than the peak
pressure, ≈55 GPa, at the time of initial pore closure 4.7 ps earlier.
The evolution of the temperature distribution becomes much more pronounced
when considering the strong shock wave generated by the 3.0 kms-1 impact (Figures
4.6(e) and 4.6(f)). Similar to the moderate shock case, an arc of localized heating is
visible just after collapse (Figure 4.6(e)) corresponding to recompression and partial
stagnation of molecules against the downstream pore wall. Additionally, there are two
lobes of heated material located just above and below the centerline and ≈10 nm behind
the leading edge of the stagnation region. These lobes coincide with the small vortex
regions generated near the end of pore closure (Figure 4.4(d)). The temperature
distribution changes noticeably in the time interval between cavity closure and maximum
compression, with the collapse zone material convecting heat to surrounding material.
Once again, the temperature peak broadens in the time interval between closure and
maximum compression (Figure 4.7(e)). An initial narrow peak at about 3100 K, just after
closure at 13 ps, is visible that broadens considerably with increasing time after closure.
The increased peak broadening is attributed to increased amounts of convection due to
112

Chapter 4: Molecular Dynamics Simulations of the Collapse of a Cylindrical Pore in the Energetic
Material -RDX
the greater penetration of the downstream wall and more translational kinetic energy from
the stronger shock that is redistributed into intramolecular energy.
As for the intermediate shock strength, a secondary compression wave is evident
in the pressure profiles for the strong shock case (Figure 4.7(f)). An initial pressure spike
to ≈80 GPa is visible shortly after closure at 13 ps. Reflected waves originating at the
stagnation point travel out through the material recompressing the system. Once again,
the amplitude of the reflected waves decreases quickly as they travel through the system.
The peak pressure at maximum compression is ≈45 GPa, which compares to the
calculated Rankine-Hugoniot shock pressure of 42.48 GPa. (The peak located near the
piston at 19.6 ps is taken to be an artifact of the fast traveling wave reflecting off of the
piston.)
Ideally one would like to monitor the samples for longer times to determine
whether or to what extent pore collapse affects the long-time structural properties.
However, the time scale available in the current studies is limited by the shock wave
reaching the right-hand side of the sample. Shock front absorbing boundary conditions
have been employed in previous studies47,65 to extend the amount of simulation time
available for data analysis. However, the SFABC method is not suitable for the current
simulations due to the numerous secondary waves in the material that arise due to
reflections from the piston and the pore surfaces, which would severely complicate
analysis and interpretation of the results.
113
Chapter 4: Molecular Dynamics Simulations of the Collapse of a Cylindrical Pore in the Energetic
Material -RDX
4.4 Conclusions
The shock-induced collapse of a 35 nm diameter cylindrical pore in the energetic
crystal -RDX was observed for three different impact velocities using molecular
dynamics simulations. For the 1.0 km·s-1 shock, the pore collapses in a visco-plastic
manner wherein net translational motion ceases after collapse and there is little
convection of heat to material away from the collapse zone. The collapse at 2.0 km·s-1
exhibits more focusing along the pore centerline than does the 1.0 km·s-1 shock. Material
focusing results in a greater amount of downstream wall penetration following impact.
The stronger penetration produces more molecular rotation during and after collapse
along with a greater amount of energy convection to material away from the initial
collapse zone.
For the 3.0 km·s-1 shock, an enhanced focusing of material occurs along the pore
centerline that is sufficient to produce a fluid-like jet structure during collapse. The jet
causes a greater deposition of mechanical energy at the downstream wall leading to much
higher temperatures achieved in the collapse zone. Jet penetration into the downstream
wall upon impact leads to the development of a following flow after closure.
Translational kinetic energy in this inflow region is redistributed to intramolecular kinetic
energy and is spread to surrounding material through convection. Critical-size hot spots
remain beyond the current computational capabilities of MD simulations. However,
simulations on the atomic scale such as those presented in this work can provide insight
into the fundamental collapse mechanism of pores in energetic materials. This
information, in combination with continuum-scale models and experimental data, can aid
114

Chapter 4: Molecular Dynamics Simulations of the Collapse of a Cylindrical Pore in the Energetic
Material -RDX
the development of a more complete understanding of the role of pore collapse in hot
spot generation.
115
Chapter 4: Molecular Dynamics Simulations of the Collapse of a Cylindrical Pore in the Energetic
Material -RDX
References
(1) Bowden, F. P.; Yoffe, A. D. Initiation and Growth of Explosion in Liquids and Solids; Cambridge, 1952.
(2) Handley, C. Numerical Modeling of two HMX‐based plastic‐bonded explosives at the mesoscale, St. Andrews University, 2011.
(3) Tarver, C. M.; Chidester, S. K.; Nichols, A. L. The Journal of Physical Chemistry 1996, 100, 5794.
(4) Field, J. E. Accounts of Chemical Research 1992, 25, 489. (5) Bowden, F. P.; McOnie, M. P. Proceedings of the Royal Society of London. Series A.
Mathematical and Physical Sciences 1967, 298, 38. (6) Coley, G. D.; Field, J. E. Proceedings of the Royal Society of London. A. Mathematical and
Physical Sciences 1973, 335, 67. (7) Winter, R. E.; Field, J. E. Proceedings of the Royal Society of London. A. Mathematical
and Physical Sciences 1975, 343, 399. (8) Coffey, C. S. Physical Review B 1981, 24, 6984. (9) Bowden, F. P.; Gurton, O. A. Proceedings of the Royal Society of London. Series A.
Mathematical and Physical Sciences 1949, 198, 337. (10) Dear, J. P.; Field, J. E.; Walton, A. J. Nature 1988, 332, 505. (11) Bourne, N. K.; Field, J. E. Proceedings of the Royal Society of London. Series A:
Mathematical and Physical Sciences 1991, 435, 423. (12) Bourne, N. K.; Field, J. E. Proceedings of the Royal Society of London. Series A:
Mathematical, Physical and Engineering Sciences 1999, 455, 2411. (13) Bourne, N. K.; Milne, A. M. Proceedings of the Royal Society of London. Series A:
Mathematical, Physical and Engineering Sciences 2003, 459, 1851. (14) Swantek, A. B.; Austin, J. M. Journal of Fluid Mechanics 2010, 649, 399. (15) Dattelbaum, D. M.; Sheffield, S. A.; Stahl, D. B.; Dattelbaum, A. M.; Trott, W.; Engelke, R.
In Fourteenth Symposium (International) on Detonation 2010. (16) Stoltz, C. A.; Mason, B. P.; Hooper, J. Journal of Applied Physics 2010, 107. (17) Mang, J. T.; Hjelm, R. P.; Francois, E. G. Propellants, Explosives, Pyrotechnics 2010, 35, 7. (18) Mang, J. T.; Hjelm, R. P. Propellants, Explosives, Pyrotechnics 2011, 36, 439. (19) Menikoff, R. AIP Conference Proceedings 2004, 706, 393. (20) Ball, G. J.; Howell, B. P.; Leighton, T. G.; Schofield, M. J. Shock Waves 2000, 10, 265. (21) Bourne, N. K.; Field, J. E. Journal of Fluid Mechanics 1992, 244, 225. (22) Tran, L.; Udaykumar, H. S. Journal of Propulsion and Power 2006, 22, 947. (23) Tran, L.; Udaykumar, H. S. Journal of Propulsion and Power 2006, 22, 959. (24) Jackson, T. L.; Buckmaster, J. D.; Zhang, J.; Anderson, M. J. Combustion Theory and
Modelling 2015, 19, 347. (25) Barton, N. R.; Winter, N. W.; Reaugh, J. E. Modelling and Simulation in Materials Science
and Engineering 2009, 17, 035003. (26) Austin, R. A.; Barton, N. R.; Howard, W. M.; Fried, L. E. Journal of Physics: Conference
Series 2014, 500, 052002. (27) Austin, R. A.; Barton, N. R.; Reaugh, J. E.; Fried, L. E. Journal of Applied Physics 2015, 117,
185902. (28) Levesque, G. A.; Vitello, P. Propellants, Explosives, Pyrotechnics 2015, 40, 303. (29) Holian, B. L.; Germann, T. C.; Maillet, J. B.; White, C. T. Physical Review Letters 2002, 89,
285501.
116

Chapter 4: Molecular Dynamics Simulations of the Collapse of a Cylindrical Pore in the Energetic
Material -RDX
(30) Hatano, T. Physical Review Letters 2004, 92, 015503. (31) Shi, Y.; Brenner, D. W. The Journal of Physical Chemistry C 2008, 112, 6263. (32) Mintmire, J. W.; Robertson, D. H.; White, C. T. Physical Review B 1994, 49, 14859. (33) Herring, S. D.; Germann, T. C.; Grønbech‐Jensen, N. Physical Review B 2010, 82, 214108. (34) van Duin, A. C. T.; Dasgupta, S.; Lorant, F.; Goddard III, W. A. The Journal of Physical
Chemistry A 2001, 105, 9396. (35) Strachan, A.; Kober, E. M.; van Duin, A. C. T.; Oxgaard, J.; Goddard III, W. A. The Journal
of Chemical Physics 2005, 122, 054502. (36) Shan, T. R.; Thompson, A. P. Journal of Physics: Conference Series 2014, 500, 172009. (37) Thompson, A. P.; Shan, T. R. Journal of Physics: Conference Series 2014, 500, 052046. (38) Hooks, D. E.; Ramos, K. J.; Martinez, A. R. Journal of Applied Physics 2006, 100, 024908. (39) Ramos, K. J.; Hooks, D. E.; Bahr, D. F. Philosophical Magazine 2009, 89, 2381. (40) Dang, N. C.; Dreger, Z. A.; Gupta, Y. M.; Hooks, D. E. The Journal of Physical Chemistry A
2010, 114, 11560. (41) Ramos, K. J.; Hooks, D. E.; Sewell, T. D.; Cawkwell, M. J. Journal of Applied Physics 2010,
108, 066105. (42) Doherty, R. M.; Watt, D. S. Propellants, Explosives, Pyrotechnics 2008, 33, 4. (43) Infante‐Castillo, R.; Pacheco‐Londoño, L. C.; Hernández‐Rivera, S. P. Journal of Molecular
Structure 2010, 970, 51. (44) Elban, W. L.; Hoffsommer, J. C.; Armstrong, R. W. J Mater Sci 1984, 19, 552. (45) Patterson, J. E.; Dreger, Z. A.; Gupta, Y. M. The Journal of Physical Chemistry B 2007, 111,
10897. (46) Shi, Y.; Brenner, D. W. The Journal of Physical Chemistry B 2008, 112, 14898. (47) Cawkwell, M. J.; Sewell, T. D.; Zheng, L.; Thompson, D. L. Physical Review B 2008, 78,
014107. (48) Bedrov, D.; Hooper, J. B.; Smith, G. D.; Sewell, T. D. The Journal of Chemical Physics
2009, 131, 034712. (49) Cawkwell, M. J.; Ramos, K. J.; Hooks, D. E.; Sewell, T. D. Journal of Applied Physics 2010,
107, 063512. (50) Munday, L. B.; Chung, P. W.; Rice, B. M.; Solares, S. D. The Journal of Physical Chemistry
B 2011, 115, 4378. (51) Nomura, K.; Kalia, R. K.; Nakano, A.; Vashishta, P. Appl. Phys. Lett. 2007, 91, 183109. (52) Mathew, N.; Picu, R. C. The Journal of Chemical Physics 2011, 135, 024510. (53) Choi, C. S.; Prince, E. Acta Crystallographica Section B 1972, 28, 2857. (54) Millar, D. I. A.; Oswald, I. D. H.; Francis, D. J.; Marshall, W. G.; Pulham, C. R.; Cumming, A.
S. Chemical Communications 2009, 562. (55) Millar, D. I. A.; Oswald, I. D. H.; Barry, C.; Francis, D. J.; Marshall, W. G.; Pulham, C. R.;
Cumming, A. S. Chemical Communications 2010, 46, 5662. (56) Davidson, A. J.; Oswald, I. D. H.; Francis, D. J.; Lennie, A. R.; Marshall, W. G.; Millar, D. I.
A.; Pulham, C. R.; Warren, J. E.; Cumming, A. S. CrystEngComm 2008, 10, 162. (57) Munday, L. B.; Solares, S. D.; Chung, P. W. Philosophical Magazine 2012, 92, 3036. (58) Gallagher, H. G.; Halfpenny, P. J.; Miller, J. C.; Sherwood, J. N.; Tabor, D. Philosophical
Transactions of the Royal Society of London. Series A: Physical and Engineering Sciences 1992, 339, 293.
(59) Mathew, N.; Picu, C. R.; Chung, P. W. The Journal of Physical Chemistry A 2013, 117, 5326.
(60) Plimpton, S. Journal of Computational Physics 1995, 117, 1.
117

Chapter 4: Molecular Dynamics Simulations of the Collapse of a Cylindrical Pore in the Energetic
Material -RDX
118
(61) Smith, G. D.; Bharadwaj, R. K. The Journal of Physical Chemistry B 1999, 103, 3570. (62) Bedrov, D.; Ayyagari, C.; Smith, G.; Sewell, T.; Menikoff, R.; Zaug, J. Journal of Computer‐
Aided Materials Design 2001, 8, 77. (63) Hockney, R. W.; Eastwood, J. W. Computer Simulations Using Particles; McGraw‐Hill:
New York, 1981. (64) Eason, R. M.; Sewell, T. D. The Journal of Physical Chemistry C 2011, 116, 2226. (65) Bolesta, A. V.; Zheng, L.; Thompson, D. L.; Sewell, T. D. Physical Review B 2007, 76,
224108.
Chapter 5: Conclusions
Chapter 5: Conclusions
A complete understanding of the shock to initiation to detonation process in
energetic materials will require analysis from multiple disciplines
(chemistry/physics/engineering/materials science/computer science) across a wide range
of temporal and spatial scales. Emphasis must be placed on comprehending how
information from each of these disciplines contributes to the knowledge base of energetic
material response. What we seek, in addition to understanding the phenomena on
particular space and time scales, is the development of verified methods and validated
models that provide a robust predictive capability based on sound physics, chemistry,
numerical simulations, and other fundamental disciplines. The focus of the research in
this thesis has been on two energetic materials, PETN and RDX, studied at the atomic
scale with the aid of molecular dynamics simulations. Both projects were attempts to
provide insight at the Å to µm length scale and femtosecond to picosecond time scale to
events that have been observed at larger scales.
In the case of PETN, an orientation dependent shock response had been observed
previously by experimental methods. A “steric hindrance model” was proposed to explain
the dependence of detonation sensitivity on crystal orientation, whereby insensitive
orientations were able to relieve shock-imparted stresses through slip while sensitive
orientations were sterically hindered from relieving shock stresses. The theoretical results
presented in Chapter 3 agree well with the experimentally based steric hindrance model.
Relative molecular displacements were calculated as a metric to quantify the amount of
displacement that occurs for crystals of PETN when shocked along a specific direction.
119

Chapter 5: Conclusions
The results obtained from relative molecular displacement and temperature calculations
for a shock propagating along the sensitive [001] direction are consistent with only elastic
compression of the material, whereas the results for shock propagating along the
insensitive [100] direction are consistent with plastic deformation of the material. This is
an example of the ability of Molecular Dynamics simulations to make contact with and
then extend a description of events observed experimentally at the macroscale.
Shocks in defect-containing RDX were examined in Chapter 4. The shock-
induced collapse of pores in energetic materials has been often studied due to the fact that
pores are potential sites of “hot spot” formation that can lead to ignition and potentially
acceleration and spread of chemistry in energetic materials. As discussed in the
introduction to Chapter 4, much of the analysis on pore collapse up to this point has been
performed at the micron to millimeter scale using experimental methods and continuum
scale simulations. It is only within the past few years that MD simulations have been
applied to pore collapse for energetic materials. This work presents some initial steps into
the study of shock-induced pore collapse in RDX. Results were obtained that were
largely consistent with previous experimental and continuum-scale studies. A visco-
plastic and a hydrodynamic collapse response were observed depending on the initial
impact strength. The visco-plastic response resulted in very little energy localization and
minimal long-term effect on the surrounding material. However, the hydrodynamic
response produced a jet that localized energy at the downstream wall and resulted in
enhanced temperatures and pressures upon impact.
There are obviously areas that can be improved on for the models, simulations,
and analysis presented in this work. One rather important approximation throughout these
120

Chapter 5: Conclusions
studies has been the neglect of chemistry due to the use of a non-reactive force field. The
error introduced by this approximation has been assumed to be minimal (or, in the
simulations of strong shock in RDX, simply ignored) due to the short time scale of the
events being studied and the fact that we were primarily concerned with the mechanical
response of materials being studied. However, it would still prove useful to quantify just
how much of an effect the approximation has on the results. Performing simulations with
a reactive force field such as ReaxFF is one possibility. However, as mentioned earlier,
the primary concern in our studies has been with the mechanical response of shocked
energetic materials, and that the Smith force field was specifically chosen for the ability
to predict accurate thermo-mechanical properties. Modification of the Smith force field to
include reactivity would also not be a simple task but there are minor tweaks that could
offer insight. For example, use of a Morse potential in place of the harmonic term would
be a more realistic representation of a chemical bond. Once sufficient vibrational energy
is distributed into the intramolecular modes then bond rupture would occur; this would
help provide information on when our approximation neglecting chemistry begins to
break down. However, this would need to be done within such a framework that the
simulation would stop when the first reaction occurred, because the forces would become
unrealistic if bond lengths were large but other covalent forces (angles, dihedrals,
impropers) were retained and if the effect of breaking one bond on the local electronic
structure in molecules was neglected.
The PETN case considered only perfect crystals whereas real world materials will
always contain defects. It would be interesting to analyze the effect that the presence of
defects will have on the observed elastic/plastic responses. Furthermore, only two
121

Chapter 5: Conclusions
different orientations were studied in this work; the sensitive [001] direction and the
insensitive [100] direction. Further analysis can be performed to determine if the same
qualitative features are observed for the other sensitive orientation, [110], and all other
orientations that are insensitive. The RDX case did consider defects but current
computational capabilities do not allow simulations of pores at sizes that are thought to
be dominant in producing critical hot spots. As computational power increases in the
future it will be interesting to consider larger pores that are perhaps closer to those
present in real world materials. Additionally, the RDX study was a first step along the
path of studying pores in energetic materials at the atomic scale using molecular
dynamics, most of the results presented were largely of a qualitative nature. The
simulated trajectories still contain huge amounts of information that have yet to be
explored. There is a wealth of information that can be gathered by application of more
rigorous metrics to characterize the energy localization and stress deposition that results
from pore collapse.
The studies presented in this thesis are an example of theoretical analysis at the
atomic scale being able to supplement and provide insight into events that are observed at
the macroscale. The force fields used were parameterized largely with data obtained from
quantum chemistry calculations, simulations were performed using computer codes based
on classical dynamics, and then analysis was performed with the results being compared
to available experimental data. This is in keeping with the theme put forth in Chapter 1 of
coupling analysis of energetic materials across multiple scales to reach a more complete
understanding of the shock to initiation to detonation process.
122

Chapter 5: Conclusions
123
Vita
Reilly Michael Eason was born June 28, 1983 in Jackson, Tennessee to Mike and
Judy Eason. He started pursuit of a bachelor’s degree in Chemistry at Union University in
2004 and it was there that Dr. Michael Salazar inspired a love of Physical Chemistry.
With the aid of Dr. Salazar, Reilly was accepted into the doctoral program at the
University of Missouri. There he began working for Dr. Thomas Sewell in the field of
Theoretical Chemistry. He obtained his Ph.D. in the Spring of 2016 and currently works
as the chemist for Fluid Routing Solutions.