Embed Size (px)
Citation preview
Molecular Dynamics Simulation of Sintering and Surface Premeltingof Silver Nanoparticles
H. A. Alarifi1, M. Atis2, C. Özdoğan3, A. Hu1,+, M. Yavuz1,3 and Y. Zhou1
1Department of Mechanical and Mechatronics Engineering, Centre for Advanced Material Joining, University of Waterloo,200 University Avenue West, Waterloo, Ontario N2L 3G1, Canada2Department of Physics, Nevsehir University, 2000 Evler, 50300 Nevsehir, Turkey3Department of Materials Science and Engineering, Çankaya University, Yenimahalle, 06810 Ankara, Turkey
Sintering of Ag nanoparticles (NPs) is increasingly being used as a driving mechanism for joining in the microelectronics industry. Wetherefore performed molecular dynamics simulations based on the embedded atom method (EAM) to study pressureless sintering kinetics of twoAg NPs in the size range of (4 to 20 nm), and sintering of three and four Ag NPs of 4 nm diameter. We found that the sintering process passedthrough three main stages. The first was the neck formation followed by a rapid increase of the neck radius at 50K for 20 nm particles and at10K for smaller NPs. The second was characterized by a gradual linear increase of the neck radius to particle radius ratio as the temperature ofthe sintered structure was increased to the surface premelting point. Different than previous sintering studies, a twin boundary was formed duringthe second stage that relaxed the sintered structure and decreased the average potential energy (PE). The third stage of sintering was a rapidshrinkage during surface premelting of the sintered structure. Based on pore geometry, densification occurred during the first stage for three 4 nmparticles and during the second stage for four 4 nm particles. Sintering rates obtained by our simulation were higher than those obtained bytheoretical models generally used for predicting sintering rates of microparticles. [doi:10.2320/matertrans.MD201225]
(Received December 17, 2012; Accepted April 3, 2013; Published May 25, 2013)
Keywords: molecular dynamics, silver nanoparticles, sintering, shrinkage, densification, twin boundary
1. Introduction
Ag nanoparticles (NPs) have been extensively used fordevelopment of lead free soldering materials,1) wire bond-ing2) and in construction of nano scale devices.3) Some ofthese applications require the Ag NPs to sinter in order toachieve joining with other structures. Generally, sintering ofNPs occurs at much lower temperatures than microparticlesand might be driven by more than one mechanism such assurface diffusion, grain boundary diffusion, lattice diffusion,mechanical rotation, plastic deformation, and evaporation-condensation.4)
In prior work, sintering studies on NPs were numericallyperformed on Au,5,6) Cu6,7) and Ni8) and experimentally onZrO2
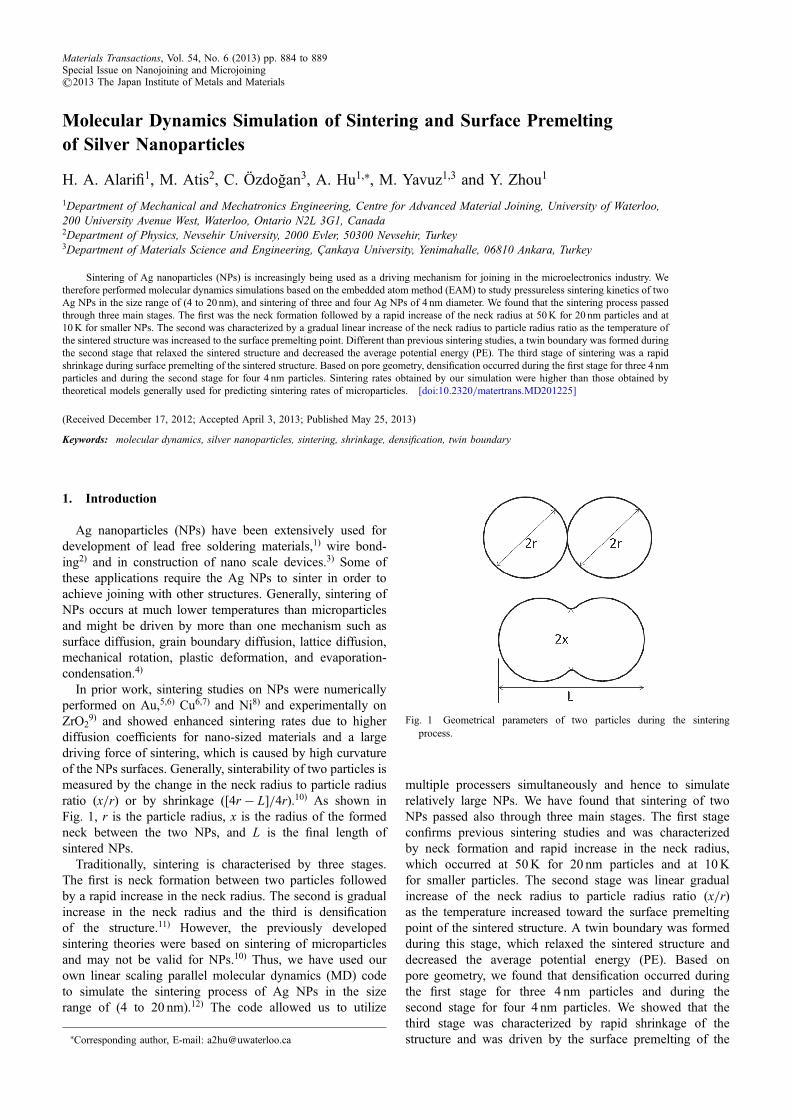
9) and showed enhanced sintering rates due to higherdiffusion coefficients for nano-sized materials and a largedriving force of sintering, which is caused by high curvatureof the NPs surfaces. Generally, sinterability of two particles ismeasured by the change in the neck radius to particle radiusratio (x/r) or by shrinkage ([4r ¹ L]/4r).10) As shown inFig. 1, r is the particle radius, x is the radius of the formedneck between the two NPs, and L is the final length ofsintered NPs.
Traditionally, sintering is characterised by three stages.The first is neck formation between two particles followedby a rapid increase in the neck radius. The second is gradualincrease in the neck radius and the third is densificationof the structure.11) However, the previously developedsintering theories were based on sintering of microparticlesand may not be valid for NPs.10) Thus, we have used ourown linear scaling parallel molecular dynamics (MD) codeto simulate the sintering process of Ag NPs in the sizerange of (4 to 20 nm).12) The code allowed us to utilize
multiple processers simultaneously and hence to simulaterelatively large NPs. We have found that sintering of twoNPs passed also through three main stages. The first stageconfirms previous sintering studies and was characterizedby neck formation and rapid increase in the neck radius,which occurred at 50K for 20 nm particles and at 10Kfor smaller particles. The second stage was linear gradualincrease of the neck radius to particle radius ratio (x/r)as the temperature increased toward the surface premeltingpoint of the sintered structure. A twin boundary was formedduring this stage, which relaxed the sintered structure anddecreased the average potential energy (PE). Based onpore geometry, we found that densification occurred duringthe first stage for three 4 nm particles and during thesecond stage for four 4 nm particles. We showed that thethird stage was characterized by rapid shrinkage of thestructure and was driven by the surface premelting of the
Fig. 1 Geometrical parameters of two particles during the sinteringprocess.
+Corresponding author, E-mail: [email protected]
Materials Transactions, Vol. 54, No. 6 (2013) pp. 884 to 889Special Issue on Nanojoining and Microjoining©2013 The Japan Institute of Metals and Materials
sintered structure. Our results showed higher sintering ratesthan those predicted by previous theoretical models formicroparticles.
2. Theoretical Methods
2.1 Computational methodsThe Ag atoms in each NPs were arranged based on FCC
truncated Marks decahedra (Dh) structure that defines planes(100) and (111) as surface facets.13) The simulation of thesintering process of the NPs was based on the Voter-Chenversion14) of the embedded atom method (EAM) potential.15)
We implemented Hamming forth order predictor correctorwith a step size of 2 femto seconds, which was found to beprecise enough to guarantee conservation of the total kineticenergy (KE) within an accuracy range of 0.030.15%. Priorto heating, each NP was relaxed at 300K (room temperature)for 20 pico seconds. The initial velocities of atoms in the NPswere generated according to the Maxwell-Boltzmann dis-tribution. The temperature of the system was calculated viathe equibarition theorem. Heating of NPs was then graduallyapplied by increasing the average KE of all atoms based onthe ratio between the target temperature and the presenttemperature. The holding time of the structure at eachtemperature was 20 ps.
The temperature of the structure was calculated by thefollowing equation
T ¼ 2hEkikð3N � 6Þ ð1Þ
where k is the Boltzmann constant, Ek is the total kineticenergy of the atoms in the NP, and N is total number of atomsin the NP. The heating process was started at 10K and thenperiodic heating with a temperature step of 50K was appliedto the sintered structures in a range of temperatures (50 to1675K) except for the range of (825 to 1275K) in which thetemperature step was reduced to 10K to capture the effect ofsurface premelting on the sintering behavior. The initialtemperature in this range is less than the surface premeltingtemperature of a 4 nm particle (977K), while the final ishigher than the melting point of the bulk (1235K).16) Atomicarrangements of the NPs during the heating process wereshown by plotting three atomic planes at the center ofsintered structure.
2.2 Analytical methodsSintering can be driven by various mechanisms such as
surface diffusion, grain boundary diffusion, and latticediffusion. Diffusion coefficients of NPs are size and temper-ature dependent and can be calculated by the followingequation.17)
Dðr; T Þ ¼ Doð1Þ exp �Eð1ÞRT
exp�2Svibð1Þ
3R
1
r
ro� 1
26664
37775
26664
37775 ð2Þ
where r is the NP radius, T is the temperature, Do(¨) is thebulk pre-exponential constant, which is equal to (Do(¨) =5 © 103m2/s) for surface diffusion, (Do(¨) = 1.2 © 10¹5
m2/s) for grain boundary diffusion, and (Do(¨) = 4.4 ©
10¹5m2/s) for volume diffusion,18) E(¨) is bulk activationenergy and is equal to (E(¨) = 2.661 © 105 J/mol),(E(¨) = 9 © 104 J/mol), and (E(¨) = 18.5 © 104 J/mol)for surface diffusion, grain boundary diffusion, and latticediffusion, respectively,18) Svib(¨) is the vibrational compo-nent of melting entropy of the bulk and is equal to 7.98J/mol.K,19) ro is the radius of NP at which all atoms arelocated on the surface and is equal to 0.96 nm for Ag,20) andR is the universal gas constant (8.314 J/mol.K).
Rates of sintering can be determined based on the changein neck radius to particle radius ratio (x/r), which can becalculated by the following equation:21)
x
r¼ Bt
rm
� �1=n
ð3Þ
where t is the sintering holding time, B is a temperaturedependent sintering function, the values of n and m varybased on the sintering diffusion mechanism. If sintering isdriven by surface diffusion, eq. (3) becomes
x
r
� �surf
¼ 4:17¤Ds£ sv�t
r4RT
� �1=6
ð4Þ
where ¤ is the surface layer thickness and is estimated as0.3 nm for Ag,18) Ds is the surface diffusion coefficientcalculated by eq. (2), £sv is the bulk solid-vapor interfacialsurface energy and is estimated as 1.14 J/m2 for Ag,22)
and ³ is the molar volume (10.3 cm3/mol for Ag). Ifsintering is driven by grain boundary diffusion, eq. (3)becomes
x
r
� �gb
¼ 32wDgb£ sv�t
r4RT
� �1=6
ð5Þ
where w is the grain boundary width and is estimated as0.5 nm for Ag,18) and Dgb is the grain boundary diffusioncoefficient, which can be calculated by eq. (2). For latticediffusion sintering, eq. (3) becomes
x
r
� �1¼ 42:05D1£ sv�t
r3RT
� �1=4:78
ð6Þ
where Dl is the lattice diffusion coefficient calculated byeq. (2).
3. Results and Discussion
Figure 2 shows average potential energy (PE) values andatomic plots during heating of two 4 nm particles. It can beclearly seen that the PE curve in Fig. 2(a) passed throughthree stages. A gradual increase in the average PE valuesduring the first stage was followed a by higher rate ofincrease during the second stage. During the third stage,the rate of increase in the PE values significantly decreasedbut was still slightly higher than the first stage. The first, thesecond, and the third stage are associated with solid phase,melting process, and liquid phase, respectively.16) The atomicarrangements during the sintering process are shown inFig. 2(b) and are of three (111) atomic planes at the centerof the sintered structure. Crystallographic directions of½�101� and [110] are represented by blue and red arrows,respectively. Plot A in Fig. 2(b) shows the initial config-uration at which the two particles were separated by 0.3 nm
Molecular Dynamics Simulation of Sintering and Surface Premelting of Silver Nanoparticles 885
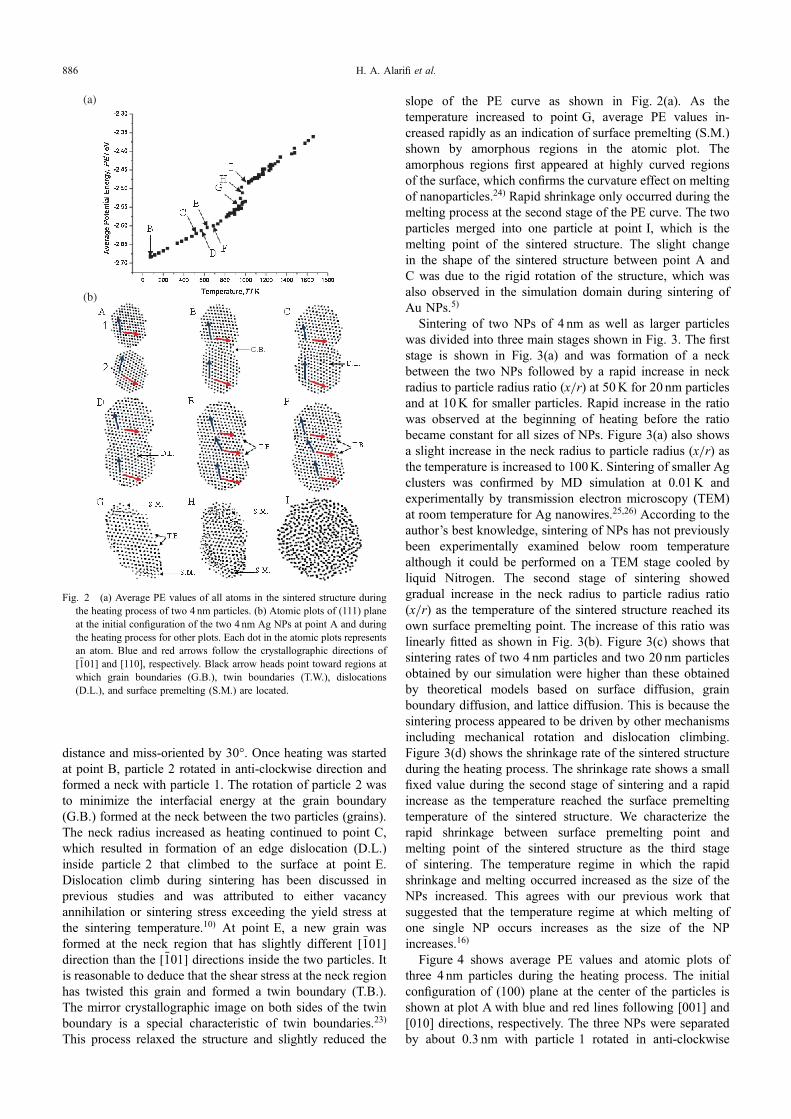
distance and miss-oriented by 30°. Once heating was startedat point B, particle 2 rotated in anti-clockwise direction andformed a neck with particle 1. The rotation of particle 2 wasto minimize the interfacial energy at the grain boundary(G.B.) formed at the neck between the two particles (grains).The neck radius increased as heating continued to point C,which resulted in formation of an edge dislocation (D.L.)inside particle 2 that climbed to the surface at point E.Dislocation climb during sintering has been discussed inprevious studies and was attributed to either vacancyannihilation or sintering stress exceeding the yield stress atthe sintering temperature.10) At point E, a new grain wasformed at the neck region that has slightly different ½�101�direction than the ½�101� directions inside the two particles. Itis reasonable to deduce that the shear stress at the neck regionhas twisted this grain and formed a twin boundary (T.B.).The mirror crystallographic image on both sides of the twinboundary is a special characteristic of twin boundaries.23)
This process relaxed the structure and slightly reduced the
slope of the PE curve as shown in Fig. 2(a). As thetemperature increased to point G, average PE values in-creased rapidly as an indication of surface premelting (S.M.)shown by amorphous regions in the atomic plot. Theamorphous regions first appeared at highly curved regionsof the surface, which confirms the curvature effect on meltingof nanoparticles.24) Rapid shrinkage only occurred during themelting process at the second stage of the PE curve. The twoparticles merged into one particle at point I, which is themelting point of the sintered structure. The slight changein the shape of the sintered structure between point A andC was due to the rigid rotation of the structure, which wasalso observed in the simulation domain during sintering ofAu NPs.5)
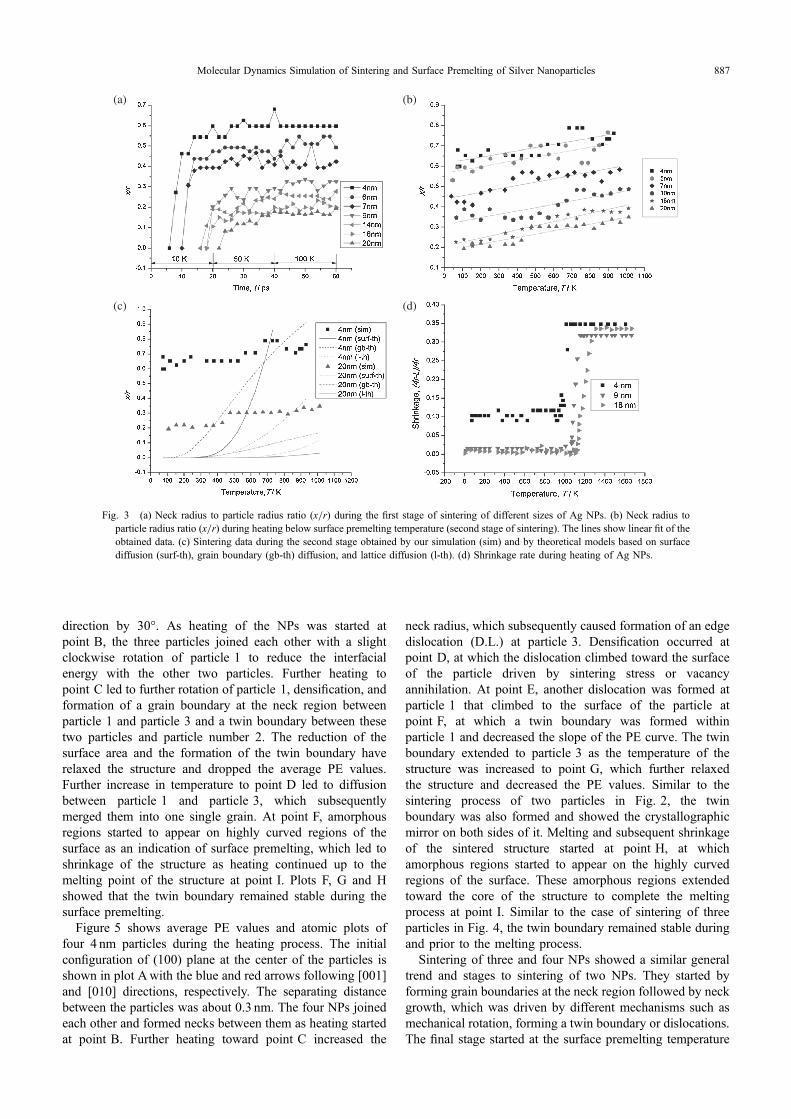
Sintering of two NPs of 4 nm as well as larger particleswas divided into three main stages shown in Fig. 3. The firststage is shown in Fig. 3(a) and was formation of a neckbetween the two NPs followed by a rapid increase in neckradius to particle radius ratio (x/r) at 50K for 20 nm particlesand at 10K for smaller particles. Rapid increase in the ratiowas observed at the beginning of heating before the ratiobecame constant for all sizes of NPs. Figure 3(a) also showsa slight increase in the neck radius to particle radius (x/r) asthe temperature is increased to 100K. Sintering of smaller Agclusters was confirmed by MD simulation at 0.01K andexperimentally by transmission electron microscopy (TEM)at room temperature for Ag nanowires.25,26) According to theauthor’s best knowledge, sintering of NPs has not previouslybeen experimentally examined below room temperaturealthough it could be performed on a TEM stage cooled byliquid Nitrogen. The second stage of sintering showedgradual increase in the neck radius to particle radius ratio(x/r) as the temperature of the sintered structure reached itsown surface premelting point. The increase of this ratio waslinearly fitted as shown in Fig. 3(b). Figure 3(c) shows thatsintering rates of two 4 nm particles and two 20 nm particlesobtained by our simulation were higher than these obtainedby theoretical models based on surface diffusion, grainboundary diffusion, and lattice diffusion. This is because thesintering process appeared to be driven by other mechanismsincluding mechanical rotation and dislocation climbing.Figure 3(d) shows the shrinkage rate of the sintered structureduring the heating process. The shrinkage rate shows a smallfixed value during the second stage of sintering and a rapidincrease as the temperature reached the surface premeltingtemperature of the sintered structure. We characterize therapid shrinkage between surface premelting point andmelting point of the sintered structure as the third stageof sintering. The temperature regime in which the rapidshrinkage and melting occurred increased as the size of theNPs increased. This agrees with our previous work thatsuggested that the temperature regime at which melting ofone single NP occurs increases as the size of the NPincreases.16)
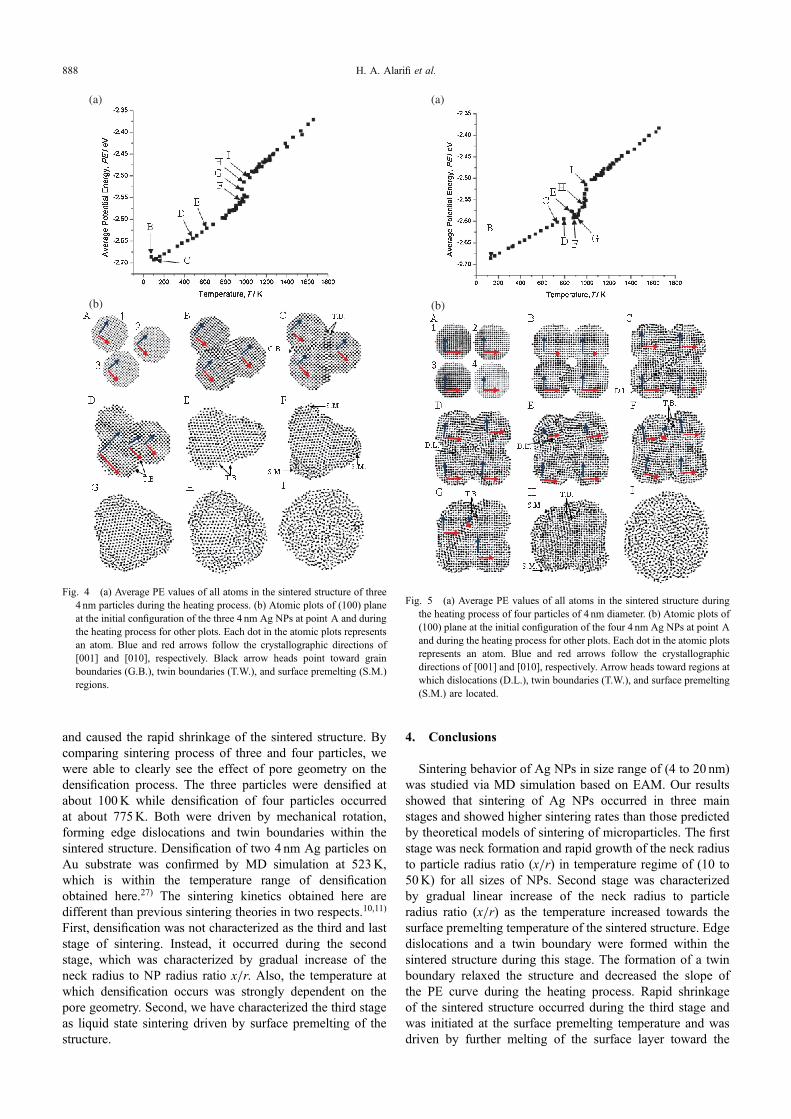
Figure 4 shows average PE values and atomic plots ofthree 4 nm particles during the heating process. The initialconfiguration of (100) plane at the center of the particles isshown at plot A with blue and red lines following [001] and[010] directions, respectively. The three NPs were separatedby about 0.3 nm with particle 1 rotated in anti-clockwise
(a)
(b)
Fig. 2 (a) Average PE values of all atoms in the sintered structure duringthe heating process of two 4 nm particles. (b) Atomic plots of (111) planeat the initial configuration of the two 4 nm Ag NPs at point A and duringthe heating process for other plots. Each dot in the atomic plots representsan atom. Blue and red arrows follow the crystallographic directions of½�101� and [110], respectively. Black arrow heads point toward regions atwhich grain boundaries (G.B.), twin boundaries (T.W.), dislocations(D.L.), and surface premelting (S.M.) are located.
H. A. Alarifi et al.886
direction by 30°. As heating of the NPs was started atpoint B, the three particles joined each other with a slightclockwise rotation of particle 1 to reduce the interfacialenergy with the other two particles. Further heating topoint C led to further rotation of particle 1, densification, andformation of a grain boundary at the neck region betweenparticle 1 and particle 3 and a twin boundary between thesetwo particles and particle number 2. The reduction of thesurface area and the formation of the twin boundary haverelaxed the structure and dropped the average PE values.Further increase in temperature to point D led to diffusionbetween particle 1 and particle 3, which subsequentlymerged them into one single grain. At point F, amorphousregions started to appear on highly curved regions of thesurface as an indication of surface premelting, which led toshrinkage of the structure as heating continued up to themelting point of the structure at point I. Plots F, G and Hshowed that the twin boundary remained stable during thesurface premelting.
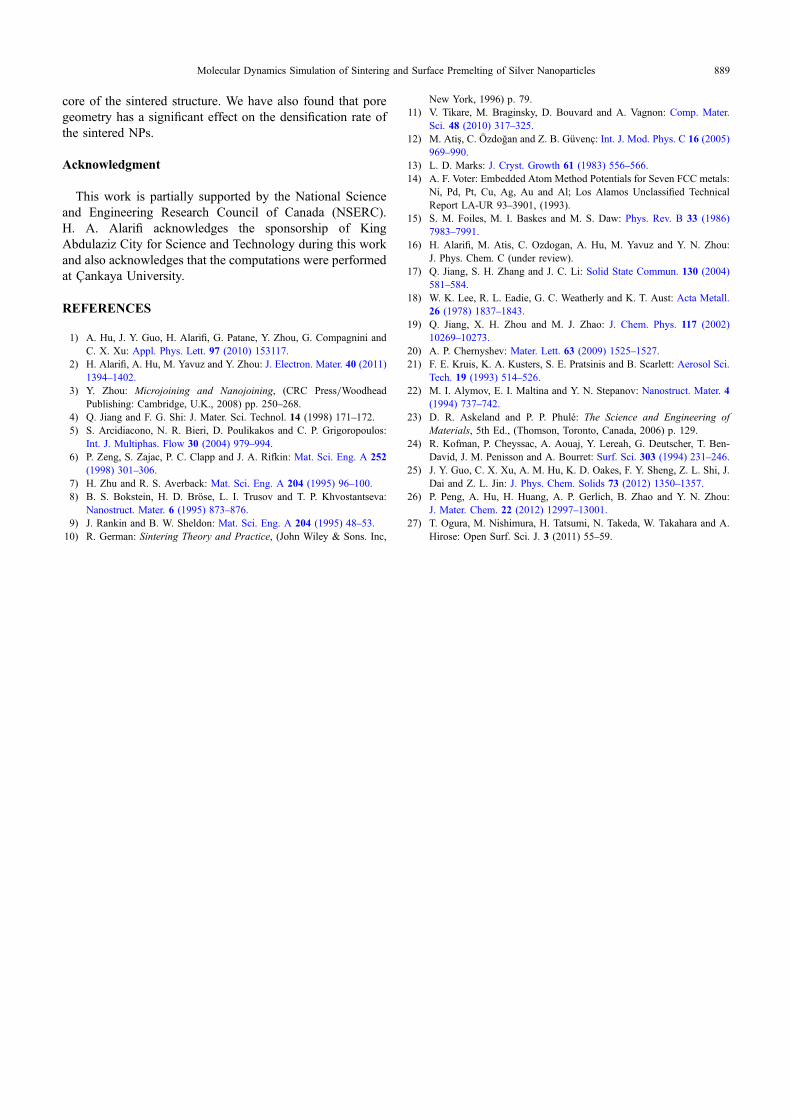
Figure 5 shows average PE values and atomic plots offour 4 nm particles during the heating process. The initialconfiguration of (100) plane at the center of the particles isshown in plot Awith the blue and red arrows following [001]and [010] directions, respectively. The separating distancebetween the particles was about 0.3 nm. The four NPs joinedeach other and formed necks between them as heating startedat point B. Further heating toward point C increased the
neck radius, which subsequently caused formation of an edgedislocation (D.L.) at particle 3. Densification occurred atpoint D, at which the dislocation climbed toward the surfaceof the particle driven by sintering stress or vacancyannihilation. At point E, another dislocation was formed atparticle 1 that climbed to the surface of the particle atpoint F, at which a twin boundary was formed withinparticle 1 and decreased the slope of the PE curve. The twinboundary extended to particle 3 as the temperature of thestructure was increased to point G, which further relaxedthe structure and decreased the PE values. Similar to thesintering process of two particles in Fig. 2, the twinboundary was also formed and showed the crystallographicmirror on both sides of it. Melting and subsequent shrinkageof the sintered structure started at point H, at whichamorphous regions started to appear on the highly curvedregions of the surface. These amorphous regions extendedtoward the core of the structure to complete the meltingprocess at point I. Similar to the case of sintering of threeparticles in Fig. 4, the twin boundary remained stable duringand prior to the melting process.
Sintering of three and four NPs showed a similar generaltrend and stages to sintering of two NPs. They started byforming grain boundaries at the neck region followed by neckgrowth, which was driven by different mechanisms such asmechanical rotation, forming a twin boundary or dislocations.The final stage started at the surface premelting temperature
(a) (b)
(c) (d)
Fig. 3 (a) Neck radius to particle radius ratio (x/r) during the first stage of sintering of different sizes of Ag NPs. (b) Neck radius toparticle radius ratio (x/r) during heating below surface premelting temperature (second stage of sintering). The lines show linear fit of theobtained data. (c) Sintering data during the second stage obtained by our simulation (sim) and by theoretical models based on surfacediffusion (surf-th), grain boundary (gb-th) diffusion, and lattice diffusion (l-th). (d) Shrinkage rate during heating of Ag NPs.
Molecular Dynamics Simulation of Sintering and Surface Premelting of Silver Nanoparticles 887
and caused the rapid shrinkage of the sintered structure. Bycomparing sintering process of three and four particles, wewere able to clearly see the effect of pore geometry on thedensification process. The three particles were densified atabout 100K while densification of four particles occurredat about 775K. Both were driven by mechanical rotation,forming edge dislocations and twin boundaries within thesintered structure. Densification of two 4 nm Ag particles onAu substrate was confirmed by MD simulation at 523K,which is within the temperature range of densificationobtained here.27) The sintering kinetics obtained here aredifferent than previous sintering theories in two respects.10,11)
First, densification was not characterized as the third and laststage of sintering. Instead, it occurred during the secondstage, which was characterized by gradual increase of theneck radius to NP radius ratio x/r. Also, the temperature atwhich densification occurs was strongly dependent on thepore geometry. Second, we have characterized the third stageas liquid state sintering driven by surface premelting of thestructure.
4. Conclusions
Sintering behavior of Ag NPs in size range of (4 to 20 nm)was studied via MD simulation based on EAM. Our resultsshowed that sintering of Ag NPs occurred in three mainstages and showed higher sintering rates than those predictedby theoretical models of sintering of microparticles. The firststage was neck formation and rapid growth of the neck radiusto particle radius ratio (x/r) in temperature regime of (10 to50K) for all sizes of NPs. Second stage was characterizedby gradual linear increase of the neck radius to particleradius ratio (x/r) as the temperature increased towards thesurface premelting temperature of the sintered structure. Edgedislocations and a twin boundary were formed within thesintered structure during this stage. The formation of a twinboundary relaxed the structure and decreased the slope ofthe PE curve during the heating process. Rapid shrinkageof the sintered structure occurred during the third stage andwas initiated at the surface premelting temperature and wasdriven by further melting of the surface layer toward the
(a)
(b)
Fig. 4 (a) Average PE values of all atoms in the sintered structure of three4 nm particles during the heating process. (b) Atomic plots of (100) planeat the initial configuration of the three 4 nm Ag NPs at point A and duringthe heating process for other plots. Each dot in the atomic plots representsan atom. Blue and red arrows follow the crystallographic directions of[001] and [010], respectively. Black arrow heads point toward grainboundaries (G.B.), twin boundaries (T.W.), and surface premelting (S.M.)regions.
(a)
(b)
Fig. 5 (a) Average PE values of all atoms in the sintered structure duringthe heating process of four particles of 4 nm diameter. (b) Atomic plots of(100) plane at the initial configuration of the four 4 nm Ag NPs at point Aand during the heating process for other plots. Each dot in the atomic plotsrepresents an atom. Blue and red arrows follow the crystallographicdirections of [001] and [010], respectively. Arrow heads toward regions atwhich dislocations (D.L.), twin boundaries (T.W.), and surface premelting(S.M.) are located.
H. A. Alarifi et al.888
core of the sintered structure. We have also found that poregeometry has a significant effect on the densification rate ofthe sintered NPs.
Acknowledgment
This work is partially supported by the National Scienceand Engineering Research Council of Canada (NSERC).H. A. Alarifi acknowledges the sponsorship of KingAbdulaziz City for Science and Technology during this workand also acknowledges that the computations were performedat Çankaya University.
REFERENCES
1) A. Hu, J. Y. Guo, H. Alarifi, G. Patane, Y. Zhou, G. Compagnini andC. X. Xu: Appl. Phys. Lett. 97 (2010) 153117.
2) H. Alarifi, A. Hu, M. Yavuz and Y. Zhou: J. Electron. Mater. 40 (2011)13941402.
3) Y. Zhou: Microjoining and Nanojoining, (CRC Press/WoodheadPublishing: Cambridge, U.K., 2008) pp. 250268.
4) Q. Jiang and F. G. Shi: J. Mater. Sci. Technol. 14 (1998) 171172.5) S. Arcidiacono, N. R. Bieri, D. Poulikakos and C. P. Grigoropoulos:
Int. J. Multiphas. Flow 30 (2004) 979994.6) P. Zeng, S. Zajac, P. C. Clapp and J. A. Rifkin: Mat. Sci. Eng. A 252
(1998) 301306.7) H. Zhu and R. S. Averback: Mat. Sci. Eng. A 204 (1995) 96100.8) B. S. Bokstein, H. D. Bröse, L. I. Trusov and T. P. Khvostantseva:
Nanostruct. Mater. 6 (1995) 873876.9) J. Rankin and B. W. Sheldon: Mat. Sci. Eng. A 204 (1995) 4853.10) R. German: Sintering Theory and Practice, (John Wiley & Sons. Inc,
New York, 1996) p. 79.11) V. Tikare, M. Braginsky, D. Bouvard and A. Vagnon: Comp. Mater.
Sci. 48 (2010) 317325.12) M. Atiş, C. Özdoğan and Z. B. Güvenç: Int. J. Mod. Phys. C 16 (2005)
969990.13) L. D. Marks: J. Cryst. Growth 61 (1983) 556566.14) A. F. Voter: Embedded Atom Method Potentials for Seven FCC metals:
Ni, Pd, Pt, Cu, Ag, Au and Al; Los Alamos Unclassified TechnicalReport LA-UR 933901, (1993).
15) S. M. Foiles, M. I. Baskes and M. S. Daw: Phys. Rev. B 33 (1986)79837991.
16) H. Alarifi, M. Atis, C. Ozdogan, A. Hu, M. Yavuz and Y. N. Zhou:J. Phys. Chem. C (under review).
17) Q. Jiang, S. H. Zhang and J. C. Li: Solid State Commun. 130 (2004)581584.
18) W. K. Lee, R. L. Eadie, G. C. Weatherly and K. T. Aust: Acta Metall.26 (1978) 18371843.
19) Q. Jiang, X. H. Zhou and M. J. Zhao: J. Chem. Phys. 117 (2002)1026910273.
20) A. P. Chernyshev: Mater. Lett. 63 (2009) 15251527.21) F. E. Kruis, K. A. Kusters, S. E. Pratsinis and B. Scarlett: Aerosol Sci.
Tech. 19 (1993) 514526.22) M. I. Alymov, E. I. Maltina and Y. N. Stepanov: Nanostruct. Mater. 4
(1994) 737742.23) D. R. Askeland and P. P. Phulé: The Science and Engineering of
Materials, 5th Ed., (Thomson, Toronto, Canada, 2006) p. 129.24) R. Kofman, P. Cheyssac, A. Aouaj, Y. Lereah, G. Deutscher, T. Ben-
David, J. M. Penisson and A. Bourret: Surf. Sci. 303 (1994) 231246.25) J. Y. Guo, C. X. Xu, A. M. Hu, K. D. Oakes, F. Y. Sheng, Z. L. Shi, J.
Dai and Z. L. Jin: J. Phys. Chem. Solids 73 (2012) 13501357.26) P. Peng, A. Hu, H. Huang, A. P. Gerlich, B. Zhao and Y. N. Zhou:
J. Mater. Chem. 22 (2012) 1299713001.27) T. Ogura, M. Nishimura, H. Tatsumi, N. Takeda, W. Takahara and A.
Hirose: Open Surf. Sci. J. 3 (2011) 5559.
Molecular Dynamics Simulation of Sintering and Surface Premelting of Silver Nanoparticles 889


![LOW-TEMPERATURE SINTERING AND MICROWAVE DIELECTRIC ...€¦ · and promotes the densification by liquid phase sintering [12-14]. However, over sintering would cause abnormal grain](https://img.pdfslide.us/doc/110x75/5fb3b4a9e5540561916e2940/low-temperature-sintering-and-microwave-dielectric-and-promotes-the-densification.jpg)