Embed Size (px)
Citation preview
Molecular Dynamics of Apo-Adenylate Kinase: A Principal Component Analysis
Hongfeng Lou and Robert I. Cukier*Department of Chemistry and the QuantitatiVe Biology Modeling InitiatiVe, Michigan State UniVersity,East Lansing, Michigan 48824
ReceiVed: March 30, 2006; In Final Form: May 1, 2006
Adenylate kinase fromE. coli (AKE) is studied with molecular dynamics. AKE undergoes large-scale motionsof its Lid and AMP-binding domains when its open form closes over its substrates, AMP and Mg2+-ATP.The third domain, the Core, is relatively stable during closing. The resulting trajectory is analyzed with aprincipal component analysis method that decomposes the atom motions into modes ordered by their decreasingcontributions to the total protein fluctuation. Simulations at 303 K (normalT) and 500 K (highT) reveal thatat both temperatures the first thee modes account for 70% of the total fluctuation. The residues that contributethe most to these three modes are concentrated in the Lid and AMP-binding domains. Analysis of the normalT modes indicates that the Lid and AMP-binding domains sample a broad distribution of conformationsindicating that AKE is designed to provide its substrates with a large set of conformations. The highT resultsshow that the Lid initially closes toward the Core. Subsequently, the Lid rotates to a new stable conformationthat is different from what is observed in the substrate-bound AKE. These results are discussed in the contextof experimental data that indicate that adenylate kinases do sample more than one conformational state insolution and that each of these conformational states undergoes substantial fluctuations. A pair of residues issuggested for labeling that would be useful for monitoring distance fluctuations by energy transfer experiments.
1. Introduction
Protein kinases catalyze phosphate transfer reactions.1 Ade-nylate kinase (AK) catalyzes the reversible transformation
AKs are composed of three domains: Core, Lid, and AMP-binding (AMP-bd) domains (Figure 1). In the absence ofsubstrates, AKs are in an open form. In the presence of ATP,AMP, and Mg2+, the Lid and AMP-bd undergo major confor-mational rearrangements, resulting in the enzyme closing to formthe ternary complex and expelling waters to prevent ATP andAMP hydrolysis.2 Extensive kinetic studies of the reaction haveshown that it occurs by a random bi-bi mechanism, wherebythe substrates can bind to one isoform while the products bindto another isoform of the enzyme.3 In this case, it leads to thesuggestion that the apo form ofE. coli adenylate kinase (apo-AKE) can exist in at least two conformations, such that oneform of the enzyme can bind Mg2+-ATP and AMP and theother Mg2+-ADP and ADP.3 In addition, other work4,5 suggeststhat each of these forms of the enzyme produces its ownsubensemble of conformers. NMR studies also support theexistence of a conformational ensemble for the apo-enzyme.6
Evidence from crystallographic studies2 and energy transferexperiments7 shows that binding AMP is associated with aninitial conformational change and binding the next substrate,usually modeled with a binary substrate mimic AP5A (ATP andAMP linked by a fifth phosphate group), results in formationof the final closed, catalytically competent form. The transitionfrom apo (open) to closed form requires large motions of AK;
in particular, the Lid and Amp-bd domains must translate androtate extensively in order to close the interdomain cleft.2
A few molecular dynamics (MD) simulations of AK haveappeared previously. A 300 ps study of AK complexed withAP5A was carried out in the gas and solvated states.8 A numberof residues that would be candidates for strong interaction witha Mg2+ ion were proposed in this study. We simulated theternary complex by creating a model for Mg2+-ATP and AMPand found that the complex was stable during the MD trajectoryin a conformation that would permit phosphoryl transfer by anassociative mechanism.9 A weighted masses molecular dynamicsmethod was used to explore the nature of the open conforma-
* Corresponding author: Professor R. I. Cukier, Department of Chem-istry, Michigan State University, East Lansing, MI 48224-1322. E-mail:[email protected]. Phone: 517-355-9715 (x 263). Fax: 517-353-1793.
Mg2+-ATP + AMP S Mg2+-ADP + ADP (1.1)
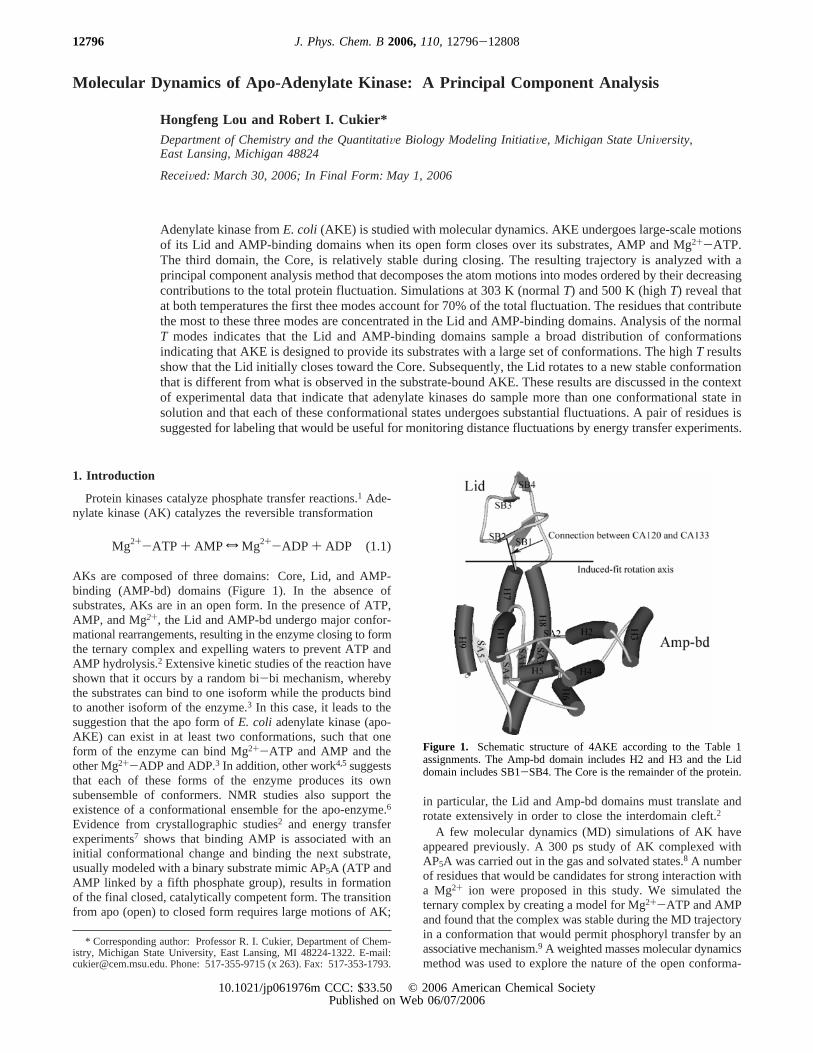
Figure 1. Schematic structure of 4AKE according to the Table 1assignments. The Amp-bd domain includes H2 and H3 and the Liddomain includes SB1-SB4. The Core is the remainder of the protein.
12796 J. Phys. Chem. B2006,110,12796-12808
10.1021/jp061976m CCC: $33.50 © 2006 American Chemical SocietyPublished on Web 06/07/2006
tions of apo-AK that could be reached starting from a numberof closed form (with different bound substrates) crystallographicstructures.10 AKE also has been analyzed from the point of viewof the Gaussian network model (GNM).11 The GNM representsa protein as an elastic network with the CA atoms taken asnodes. The nodes within a cutoff radius are connected by springsof a common force constant. A GNM analysis of apo-AKEpoints to the Lid and Amp-bd domains as the ones with thelargest fluctuations.
When substrates bind to proteins, a recurring theme is thatof induced fit whereby the substrates are largely responsiblefor the protein conformational changes. On the other hand, itmay be that protein fluctuations are responsible for setting upconformations that are predisposed to capture substrates to yieldthe final substrate-bound structure.12-15 In this work, we useMD to investigate the apo form ofE. coli adenylate kinase(AKE) with the goal of investigating large-scale domainmotions. MD simulations rely on thermal fluctuations to exploreconfiguration space and therefore, if there are substantial barriersto certain regions of configuration space, they will not besampled on a typical MD time scale. Consequently, in additionto simulations at 303 K we also run MD at 500 K to accelerateexploration of configuration space.
Extracting information about large-scale motions, such asthose corresponding to domain movements, from a MD trajec-tory is not straightforward. Garcia16,17 and Berendsen and co-workers18 developed methods, which are applications of prin-cipal component analysis19 (PCA), that attempt to decomposethe 3N protein degrees of freedom into a small set of modes,p,that capture much of the overall atom fluctuation of the proteinand a large remaining set, 3N - p, that describes small more-or-less Gaussian fluctuations. There are a number of examples20-26
where this separation is obtained, and it leads to a reduced spacedescription of the important protein motions.
To the extent that the open form of AK is “susceptible” tomotions that describe closing, the PCA method may be able toreveal those closing motions. While one cannot expect openAK to close on the MD time scale, nor would it, most likely,close in the absence of substrates, it may be that the PCA willreveal directions of motion that are indicative of the closingpath required to entrain its substrates.
Domain closure in AKE has been studied by time-resolveddynamic nonradiative excitation energy transfer.7 When pairsof residues selected to probe the dynamics of AKE are labeled,distance distributions that reflect the conformational spaceexploration can be monitored. The apo-enzyme was found tohave a broad distance distribution, with a mean and width around30 Å, between Ala55, a residue in the AMP-bd domain andV169, in helix 8, which is below the Lid (see Figure 1). Thewidth of this distribution indicates that apo-AKE samples a verylarge conformational ensemble in solution. From their data, theyalso infer that the rate of conformational transitions is small ona nanosecond time scale, in part motivating our highTsimulations. We attempt to correlate the results of our simula-tions with these studies and, where possible, suggest otherresidue pairs that could provide additional information aboutAKE dynamics.
2. Methodology
Molecular Dynamics.The MD simulations were carried outwith the Sander module of Amber 7.027 at two temperatures,303 K, which will be referred to as normalT, and 500 K,referred to as highT, both for 6 ns. The Amber 94 force fieldwas used.28 For the electrostatic energies and forces, the PME
method29 was applied with a direct-space cutoff of 9.0 Å, aEwald coefficient of 0.30768, and a 80× 80 × 80 reciprocalspace grid. The starting configuration was the apo form of theE. coli adenylate kinase30 (PDB code 4AKE). The dimer’s chainA was used. The 4AKE crystal structure coordinates were putinto a cubic box of side 79.659 Å with 15 012 water moleculesadded. Four Na+ cations were added to neutralize the system,far away from the protein and also from each other. Allsimulations are done with only hydrogen-containing bondsconstrained by SHAKE,31 a temperature coupling time of 0.5ps and pressure coupling time of 2.0 ps.32 Because of crystalstrains, a small step size (0.2 fs) was first used to relax thesystem for 2 ps at 200 K, followed by normal 2 fs steps for 50ps of equilibration under NVT to bring the temperature from200 to 303 K. Then, it was equilibrated under NPT for 150 psto bring it back to the normal density. After equilibration underNPT, 6 ns of simulation under NVT at 303 K were done andall data were collected. After the first nanosecond under NVTat 303 K, the system was heated at a 50 K per 100 ps rate underNVT until 500 K, and then another 100 ps at 500 K was carriedout, followed by the 6 ns production run at 500 K under NVT.
Principal Component Analysis. A principal componentanalysis19 diagonalizes the covariance matrixσij ) ⟨δRiδRj⟩ ofthe atom fluctuationsδRi from their trajectory-averaged⟨...⟩values, whereδRi ) Ri - ⟨Ri⟩ andRi ) {xi, yi, zi} denotes theCartesian components of theith atom. It decomposes theconfiguration pointr3N(t) ) (x1(t), y1(t), ..., zN(t))T as
where themi are the (orthonormal) eigenvectors of the cova-riance matrix and the corresponding eigenvalues are denotedasλi
2. In the rotated Cartesian coordinate basis defined by themi (i ) 1, 2, ..., 3N), the largest eigenvalue captures the largestfraction of the root-mean-square fluctuation (RMSF), the secondlargest the next largest fraction of the RMSF, etc. Ordering theeigenvalues from large to small leads, in favorable cases, to asmall set of modes that capture most of the protein’s fluctuation.PCA is not restricted to harmonic motions; it can describecollective transitions between structures that differ greatly. Notethat thepi(t) defined by eq 2.1 are projections on the configura-tions r3N versus projections on the deviationsδr3N(t) ) r3N(t)- ⟨r3N(t)⟩ from the trajectory average.
The contribution of atomj to the ith mode’s fluctuation isobtained from
The mij ) {mi
jx, mijy, mi
jz} will be referred to ascomponentVectorsof the jth atom for theith mode. The total RMSF2 canbe decomposed as
The productλiComponentij ≡ R-Componenti
j is the contributionof atom j in modei to the total fluctuation of the protein. Thismakes it possible to compare the importance of an atom acrossdifferent modes; thus, we have termed it the relative contributionor R-Component. The time evolution of theith mode is given
r3N(t) ) ∑i)1
3N
[r3N(t)‚mi]mi ) ∑i)1
3N
pi(t)mi (2.1)
|mij| ) x(mi
jx)2 + (mijy)2 + (mi
jz)2 ≡ Componentij
RMSF2 ) ∑i
λi2 ) ∑
i
λi2mi‚mi ) ∑
i∑
j
λi2(mi
jxmijx +
mijymi
jy + mijzmi
jz) ) ∑i
∑j
(λi Componentij)2 ≡
∑i∑
j
(R-Componentij)2 (2.2)
Molecular Dynamics of Apo-Adenylate Kinase J. Phys. Chem. B, Vol. 110, No. 25, 200612797
by pi(t) as introduced in eq 2.1. By examining the subspacespanned by displacements of the first few modes, one gets anidea of whether the system is constrained in one conformationalstate or not. To examine the time course of the displacement ofatom j in the ith mode, eq 2.1 is used in the form
PCA is a linear transformation conventionally applied to thefluctuations in the Cartesian coordinates.33 The atom dynamics
corresponding to theith mode,r ij(t), cannot describe a finite
rotation of the atoms. Indeed, any linear transformation willhave this feature as is evident from eq 2.3, because vectormi
j
points in a fixed direction. This feature also implies that thebond vectors predicted from one mode are not of fixed length.Indeed, consider the bond vectorb(t) ) r i
j+1(t) - r ij(t) between
atomsj + 1 andj. Then
and, because (mij+1 - mi
j) is a constant vector, the magnitudeb(t) ) |b(t)| must change with time. The change in bond lengthswill usually be modest because, on average,|mi
j| ∼ 1/x3N.However, when (pi(t) - pi(0)) has a significant excursion, as ina conformational change, the bond length change can benoticeable. Of course, if a sufficient number of terms areincluded in the mode sum in eq 2.1, the correct atom locationswill be regenerated and the distortion will vanish.
The PCA method orders the modes starting from the one withlargest eigenvalue. An implication of this decomposition is that
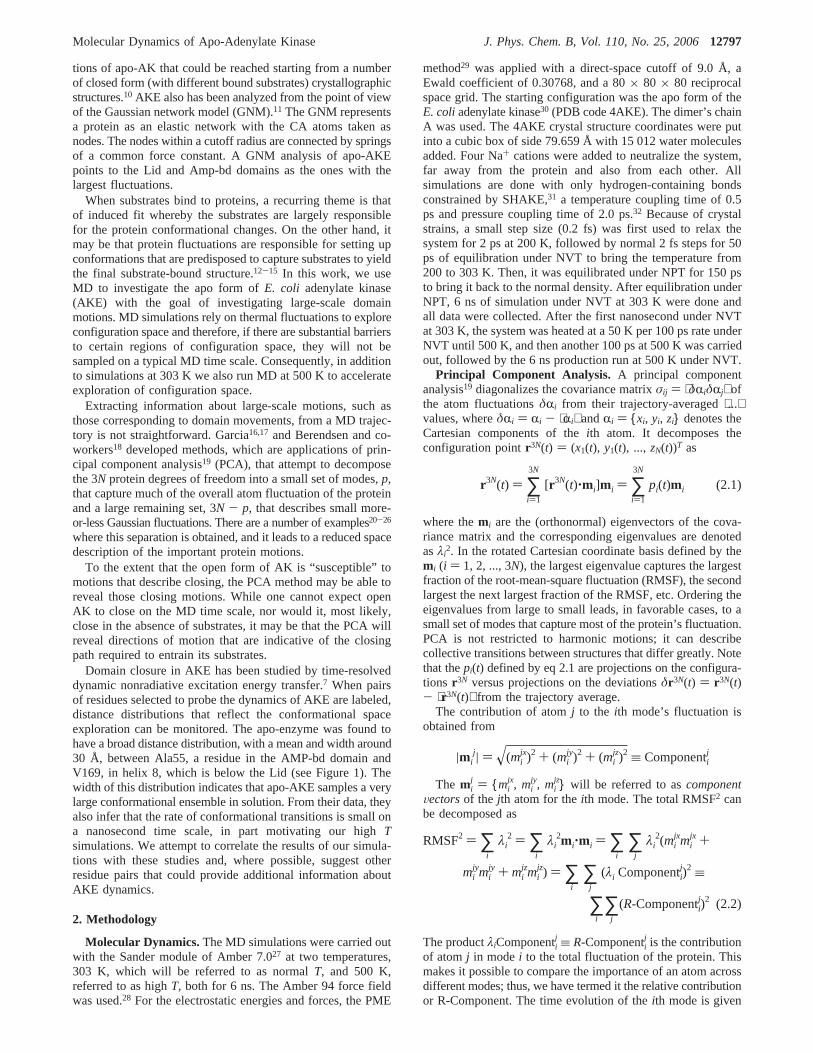
Figure 2. RMSD of CA atoms fit on the X-ray structure CA atomsfor normal (303 K) and highT (500 K).
Figure 3. Residue RMSF of residues obtained from superimposingthe MD snapshots on the 4AKE Core and from theB factors, relatedby B factor ) (8π2/3)RMSF2.37
TABLE 1: Secondary Structure Assignment for apo-AKE(4AKE)a
helixinitialresidue
terminalresidue strand
initialresidue
terminalresidue strand
initialresidue
terminalresidue
H1 13 24 SA1 2 7 SB1 123 126H2 31 40 SA2 27 29 SB2 131 134H3 44 54 SA3 81 84 SB3b 144 146H4 61 73 SA4 105 110 SB4b 151 154H6 90 98 SA5 192 197H6 90 98H7 113 121H8 161 184H9 202 213
a Assignment of secondary structure from pdb bank 4AKE for chainA. b These two beta strands are not present in the pdb bank assignmentof 4AKE, while it is in 1AKE and also in Mu¨ller et al.’s assignment.30
r ij(t) ) r i
j(0) + (pi(t) - pi(0))mij (2.3)
TABLE 2: Pearson Correlation Coefficients between theTwo Simulation RMSFs and the RMSF Calculated from theB Factorsa
whole protein AMP-bd Lid
highT/B factorb 0.81 0.62 0.54normalT/B factorb 0.72 0.40 0.54highT/normalT 0.77 0.62 0.40
a The RMSF are based on superposition on the Core CA atom.b Bfactor denotes an RMSF calculated from the X-ray structureB factors,whereB factor ) (8π2/3)RMSF2.37
Figure 4. RMSD from the crystal structure of domains Lid, Core,and Amp-bd with different superpositions.
b(t) ) b(0) + (pi(t) - pi(0))(mij+1 - mi
j) (2.4)
12798 J. Phys. Chem. B, Vol. 110, No. 25, 2006 Lou and Cukier
the largest eigenvalue mode corresponds to the slowest motion,and so forth. Thus, it is important to consider the convergenceof the first few modes with the length of the simulation. Thisissue has been addressed by Amadei and co-workers34 and byHess;35,36 they suggest various tests for convergence. Amadeiand co-workers34 introduced a root-mean-square inner product(RMSIP) measure
that is the overlap of a subset ofn modes, where the modes areobtained from different time intervals taken from the totaltrajectory. For example, time intervalst′ could be taken fromthe second half of the trajectory starting from the end and theother intervals of lengtht taken from the first half of thetrajectory starting from the beginning.34 Convergence can beassessed in this manner. Furthermore, the (converged) degreeof overlap with respect to a random vector’s projection onto a
subspace (dimensionm) of the full space (dimensionM) wasanalytically obtained.34 It provides a measure for what valuesof the RMSIP calculated from trajectory data can be consideredsufficiently large to be statistically nonrandom. All the overlapspresented here are sufficiently large to not correspond to arandom vector’s subspace projection. For sampling from a fullyequilibrated, sufficiently long trajectory, the RMSIP measuremust, of course, converge to RMSIP) 1. Hess also introducedan RMSIP measure35 and another one that involves theeigenvalues in addition to eigenvectors.36
Before the diagonalization of the covariance matrix is carriedout, we first remove the overall translational and rotationalmotion of the protein by superimposing all the trajectorysnapshots onto the Core CA atoms of the X-ray structure. TheCore is defined as residues (1-29, 60-121 and 160-214),leaving the Amp-bd domain as (30-59) and the Lid domain as(122-159).
3. Results and Discussion
A. Stability of the Simulation. The root-mean-squaredeviations (RMSDs) from the crystal structure for the twosimulations are presented in Figure 2. For normalT, the proteinhas overall a quite stable structure in terms of the RMSD; thisindicates that for the normalT (303 K) simulation the proteinstays around one major conformation that, in terms of RMSD,is about 2.5 Å away from the X-ray structure. For highT (500K), the protein deviates more significantly from the X-raystructure. As will be shown below, the first deviation (0 to 620ps) is due to a Lid closure motion. The second major change,between 2360 and 3798 ps, will be traced, by the PCA, to aconformational change in the highT simulation.
As shown in Figure 3, the residue RMSF for normal and highT are systematically larger than those obtained from theBfactors,37 with the differences concentrated in the Lid (120-159) and AMP-bd (30-60) domains and the differences betweennormal and highT also concentrated in these regions. This mayindicate that the X-ray-structure is more constrained due tocrystallization forces.38 The similarity in terms of the Pearsoncorrelation coefficient is summarized in Table 2. The highT
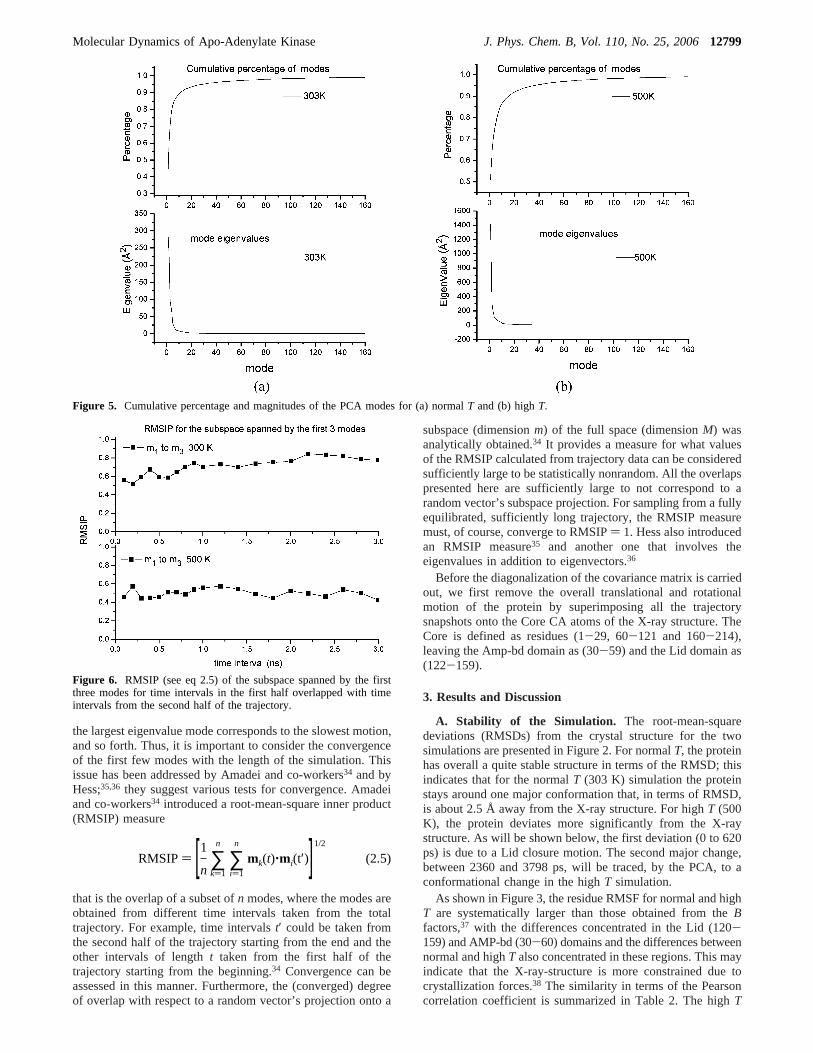
Figure 5. Cumulative percentage and magnitudes of the PCA modes for (a) normalT and (b) highT.
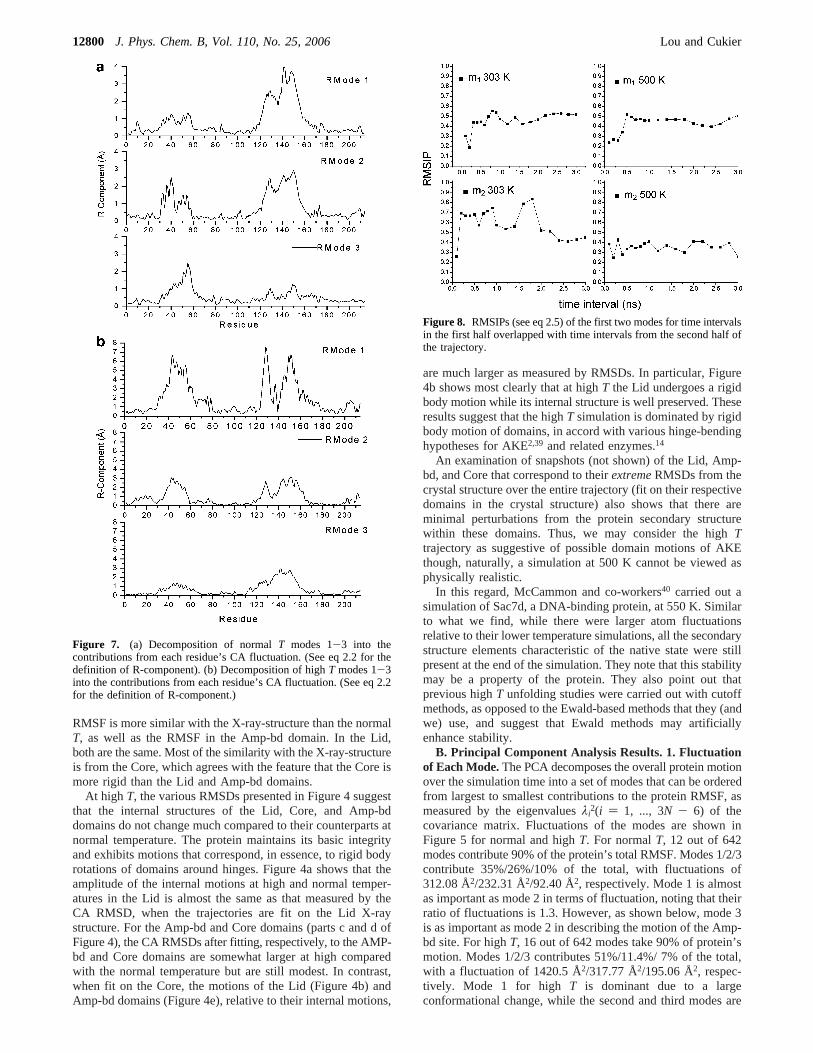
Figure 6. RMSIP (see eq 2.5) of the subspace spanned by the firstthree modes for time intervals in the first half overlapped with timeintervals from the second half of the trajectory.
RMSIP) [1n ∑k)1
n
∑i)1
n
mk(t)‚mi(t′)]1/2
(2.5)
Molecular Dynamics of Apo-Adenylate Kinase J. Phys. Chem. B, Vol. 110, No. 25, 200612799
RMSF is more similar with the X-ray-structure than the normalT, as well as the RMSF in the Amp-bd domain. In the Lid,both are the same. Most of the similarity with the X-ray-structureis from the Core, which agrees with the feature that the Core ismore rigid than the Lid and Amp-bd domains.
At high T, the various RMSDs presented in Figure 4 suggestthat the internal structures of the Lid, Core, and Amp-bddomains do not change much compared to their counterparts atnormal temperature. The protein maintains its basic integrityand exhibits motions that correspond, in essence, to rigid bodyrotations of domains around hinges. Figure 4a shows that theamplitude of the internal motions at high and normal temper-atures in the Lid is almost the same as that measured by theCA RMSD, when the trajectories are fit on the Lid X-raystructure. For the Amp-bd and Core domains (parts c and d ofFigure 4), the CA RMSDs after fitting, respectively, to the AMP-bd and Core domains are somewhat larger at high comparedwith the normal temperature but are still modest. In contrast,when fit on the Core, the motions of the Lid (Figure 4b) andAmp-bd domains (Figure 4e), relative to their internal motions,
are much larger as measured by RMSDs. In particular, Figure4b shows most clearly that at highT the Lid undergoes a rigidbody motion while its internal structure is well preserved. Theseresults suggest that the highT simulation is dominated by rigidbody motion of domains, in accord with various hinge-bendinghypotheses for AKE2,39 and related enzymes.14
An examination of snapshots (not shown) of the Lid, Amp-bd, and Core that correspond to theirextremeRMSDs from thecrystal structure over the entire trajectory (fit on their respectivedomains in the crystal structure) also shows that there areminimal perturbations from the protein secondary structurewithin these domains. Thus, we may consider the highTtrajectory as suggestive of possible domain motions of AKEthough, naturally, a simulation at 500 K cannot be viewed asphysically realistic.
In this regard, McCammon and co-workers40 carried out asimulation of Sac7d, a DNA-binding protein, at 550 K. Similarto what we find, while there were larger atom fluctuationsrelative to their lower temperature simulations, all the secondarystructure elements characteristic of the native state were stillpresent at the end of the simulation. They note that this stabilitymay be a property of the protein. They also point out thatprevious highT unfolding studies were carried out with cutoffmethods, as opposed to the Ewald-based methods that they (andwe) use, and suggest that Ewald methods may artificiallyenhance stability.
B. Principal Component Analysis Results. 1. Fluctuationof Each Mode.The PCA decomposes the overall protein motionover the simulation time into a set of modes that can be orderedfrom largest to smallest contributions to the protein RMSF, asmeasured by the eigenvaluesλi
2(i ) 1, ..., 3N - 6) of thecovariance matrix. Fluctuations of the modes are shown inFigure 5 for normal and highT. For normalT, 12 out of 642modes contribute 90% of the protein’s total RMSF. Modes 1/2/3contribute 35%/26%/10% of the total, with fluctuations of312.08 Å2/232.31 Å2/92.40 Å2, respectively. Mode 1 is almostas important as mode 2 in terms of fluctuation, noting that theirratio of fluctuations is 1.3. However, as shown below, mode 3is as important as mode 2 in describing the motion of the Amp-bd site. For highT, 16 out of 642 modes take 90% of protein’smotion. Modes 1/2/3 contributes 51%/11.4%/ 7% of the total,with a fluctuation of 1420.5 Å2/317.77 Å2/195.06 Å2, respec-tively. Mode 1 for high T is dominant due to a largeconformational change, while the second and third modes are
Figure 7. (a) Decomposition of normalT modes 1-3 into thecontributions from each residue’s CA fluctuation. (See eq 2.2 for thedefinition of R-component). (b) Decomposition of highT modes 1-3into the contributions from each residue’s CA fluctuation. (See eq 2.2for the definition of R-component.)
Figure 8. RMSIPs (see eq 2.5) of the first two modes for time intervalsin the first half overlapped with time intervals from the second half ofthe trajectory.
12800 J. Phys. Chem. B, Vol. 110, No. 25, 2006 Lou and Cukier
comparable to the first and second mode for normalT in termsof their size of fluctuation.
The first three modes account for∼70% of the totalfluctuation at both temperatures. It is important to check thatthese large magnitude, and therefore slow, modes are reasonablyconverged for the simulation length. One method of convergencecheck, developed by Amadei and co-workers34 and by Hess,35
measures the root-mean-square inner product (RMSIP) of PCAmodes obtained from one part of the trajectory projected ontoanother part of the trajectory. Figure 6 displays the overlap ofthe subspace spanned by the first three modes (n ) 3 in eq 2.5)obtained from time intervals of varying lengths, as describedin the Methodology section. The results for the normal tem-perature are reasonably converged, though not fully reaching
unity. For high temperature, it is clear that the simulation isnot long enough for convergence. In view of the transitionbehavior of the high-temperature simulation for the RMSD (seeFigure 2) convergence is not expected for this length ofsimulation.
2. Atom Fluctuations for Modes 1-3. The contributions tothe RMSF, denoted as R-components (see eq 2.2), from eachresidue CA for the first three modes for normal and highT areshown in parts a and b of Figure 7, respectively. Note that, asdefined in eq 2.2, the R-Componenti
j incorporates the corre-spondingλi value. Thus, the R-components permit comparisonof fluctuations across different modes. For normalT, mode 1has two major regions, spanning, respectively, residues 30-60that contain the Amp-bd and 120-160 that contain the Liddomain. There are three peaks in the Lid, with the highest atLys141 having R-component 4.07 Å. In the Amp-bd domain,the highest peak, at Lys40, has an R-component of 1.29 Å. Thus,the contribution of the Lid is about 9 times that of the Amp-bdin terms of the highest peak, and fluctuations of the Lid dominatethe mode 1 motion. In mode 2, there are three prominent regions,spanning residues 30-45, 45-60, and 120-160. For these threeregions, the contributions to the fluctuations of mode 2 arealmost equally important. In mode 3, only the AMP-bd regioncontributes significantly to the fluctuation, spanning residues30-60 with a peak of 2.50 Å at Ala55. Because the R-component plots put the fluctuations in the different modes onthe same scale, one can conclude that the contribution to thefluctuation of the Amp-bd domain is about four times as largein mode 2 as in mode 1, with a peak of 2.5 Å at Lys 40 inmode 2 and 1.4 Å at Ala 55 in mode 1. In mode 3, the sameregion contributes to the fluctuation as much as the correspond-ing one in mode 2 with an R-component peak of 2.48 Å atAla55. However, the contribution of the Lid from mode 2, with
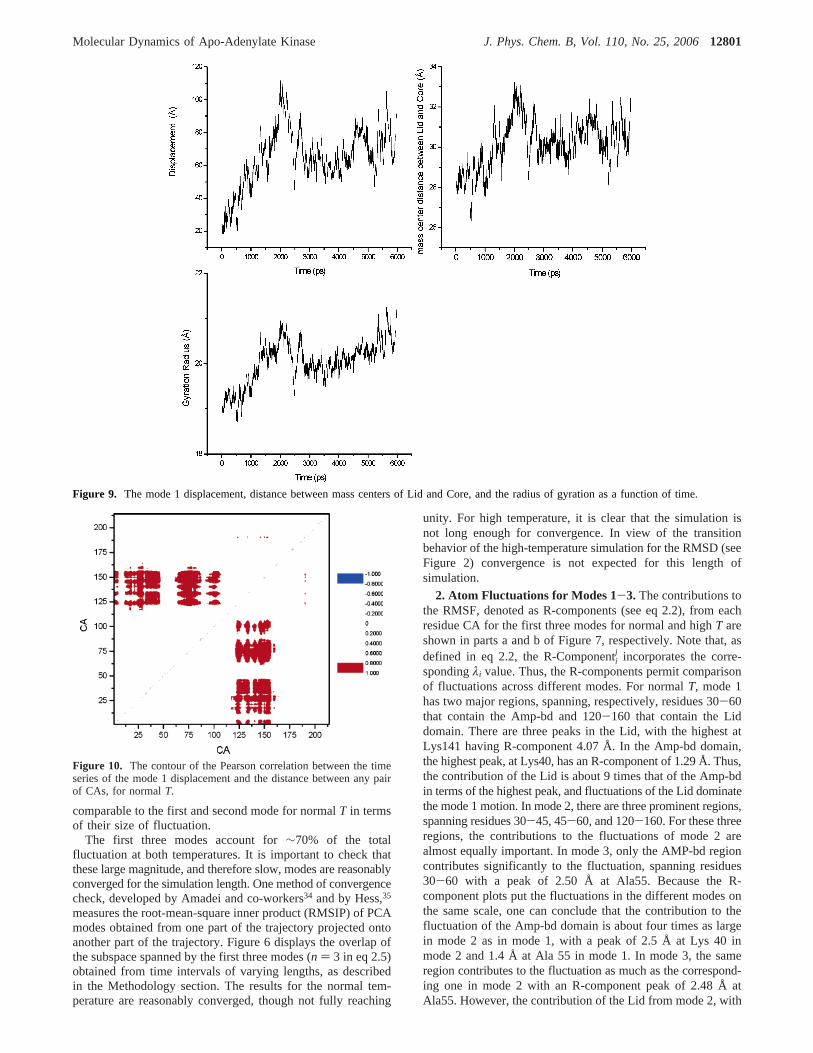
Figure 9. The mode 1 displacement, distance between mass centers of Lid and Core, and the radius of gyration as a function of time.
Figure 10. The contour of the Pearson correlation between the timeseries of the mode 1 displacement and the distance between any pairof CAs, for normalT.
Molecular Dynamics of Apo-Adenylate Kinase J. Phys. Chem. B, Vol. 110, No. 25, 200612801
a peak of 2.9 Å at Gly150, is about 58% of the one from mode1 with its peak of 4.0 Å at Lys141, while the contribution ofthe Lid from mode 3 is ignorable. In short, for normalT, interms of fluctuations, mode 1 is suitable to describe the Lid’smotion, while mode 2 describes a collective motion of the Lidand Amp-bd domains. Moreover, mode 3 describes the motionof the Amp-bd domain, and this is the only significantcontribution to this mode.
The motion described by mode 3 may be related to the firststep in the induced-fit movements proposed by Schulz.2 In theirscheme, based on a comparison of apo, AMP-bound and AP5A-bound crystal structures, the first conformational change isdominated by a closing motion of the AMP-bd domain towardthe Lid. Sinev et al. studied the large domain movements inAKE by measuring the distance distribution between Ala55 andVal169 with time-resolved dynamic nonradiative excitationenergy transfer.7 In the MD simulation, Ala55 has its largestfluctuation in the third mode, while Val169 has no bigfluctuation in any of the major modes. (Of course, a largedistance fluctuation can be consistent with a significant motionby only one residue of the pair.) Thus, the motion described bymode 3 is consistent with the experimental results.
The simulation also suggests that a residue pair better directedto featuring Lid motions would be Lys40 and Lys141. Theseresidues have peak R-Components in mode 1 (and are alsoprominent in mode 2). However, in contrast with mode 1, thecorrelation between the distance between these two residues and
the displacement of mode 2 is close to zero. These mode 1 and2 motions are more important, at least in terms of fluctuationsize, than that of mode 3.
For high T, mode 1 has three equally important regionsspanning residues 30-60, 120-139, and 140-160 with peaksof 6.78 Å at Ser43, 7.53 Å at Pro128, and 6.78 Å at Glu151.Mode 2 has two regions spanning residues 30-59 and 115-168 with peaks of 3.11 Å at GLY42 and 2.65 Å at Pro128 and3.15 Å at Glu151. Two important regions are identified in mode3; regions spanning residues 28-73 and 108-168 with the laterbeing more significant. Comparing the magnitudes of theR-components across the different modes suggests that the mode1 is dominant not only in the Lid but also in the Amp-bd domain.Thus, this mode represents the major motion for highT. Thedata in parts a and b of Figure 7 indicate that the Amp-bd andLid domains tend to move more collectively at the higherT.
As pointed out by Amadei and co-workers,34 the individualeigenvectors may not be converged for finite time simulations.Thus, we have calculated the RMSIP of eq 2.5 (withn ) 1)between a particular eigenvector from the analysis of the last 3ns of the trajectory and the one it overlaps the most, selectedfrom the first three eigenvectors{m1, m2, m3}, from the first 3ns, evaluated over various time subintervals. Figure 8 showsthat the RMSPs for the first two vectors for both temperaturesare not approaching unity over the nanosecond time scale.Despite the lack of convergence, the functional motions impliedby these modes are still of interest. They must be interpretedas holding over a limited time range and not true equilibriumresults. For the third mode at 500 K, the convergence is evenweaker, and we do not discuss it further.
3. The Characterization of Four Modes for Normal andHigh T. Mode 1, Normal T. Mode 1 for normalT is dominatedby fluctuations in the Lid region. In a proposed mechanism ofthe ATP-AMP reaction,2, first the AMP-bd domain partly closes,which is associated with the binding of AMP. Then, there is alarge motion of the Lid, along with additional AMP-bd domainmotion to bind the substrates (AMP and MgATP) and exclude(most) waters from the active site. From the X-ray structure of4AKE, one may infer that the radius of gyration of this proteinshould have a strong dependence on the Lid’s position relativeto the Core.
Figure 9 displays time series of the displacement of mode 1,the distance between the Lid and Core mass centers (based onthe atoms in the respective regions), and the radius of gyration.It is clear that these three quantities are strongly correlated, witha Pearson correlation coefficient of 0.91 between the mode 1displacement and the radius of gyration and 0.92 between the
Figure 11. Stereoview of snapshots of the CA atom projection of mode 1, for normalT.
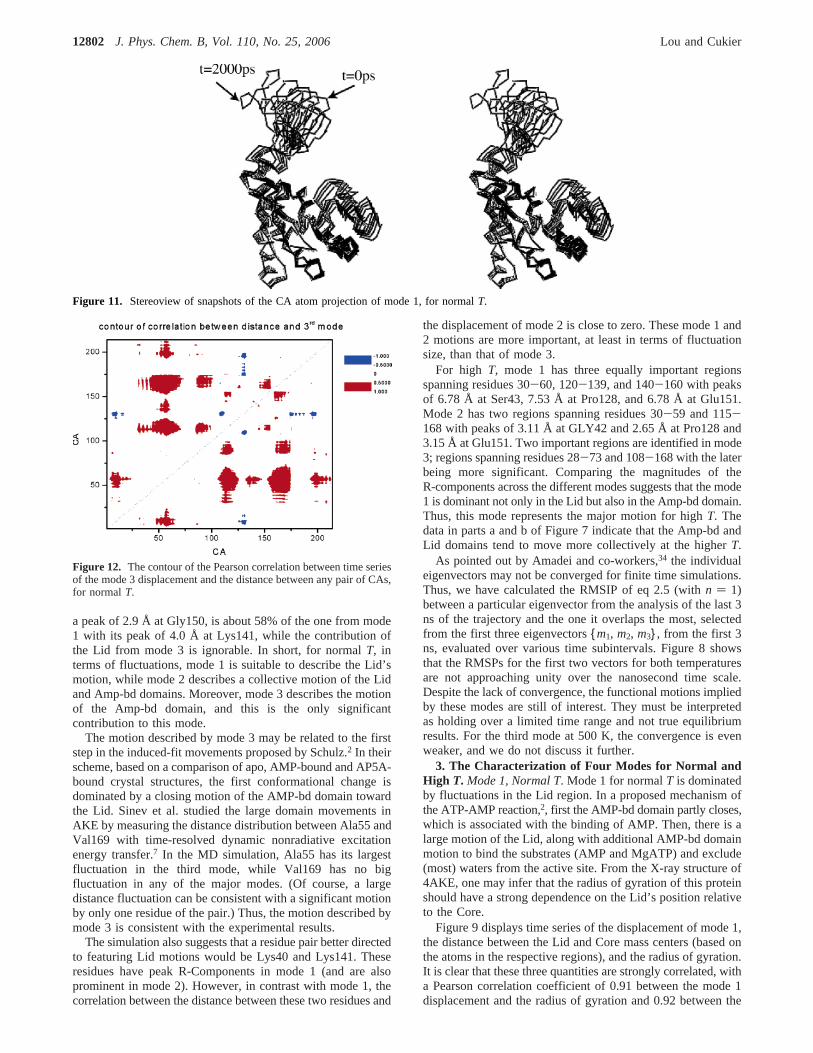
Figure 12. The contour of the Pearson correlation between time seriesof the mode 3 displacement and the distance between any pair of CAs,for normalT.
12802 J. Phys. Chem. B, Vol. 110, No. 25, 2006 Lou and Cukier
mode 1 displacement and the mass center distance of Lid andCore regions. This roughly shows that the mode 1 motion isrelated to the closing or opening of the Lid. From the time courseof the center of mass distance, the Lid first opens up until around2 ns; after that a closure follows and then the distance beginsto fluctuate around 30 Å. The standard deviation of the masscenter distance is 1.20 Å with minimum of 26.34 Å andmaximum at 33.23 Å.
Figure 10 presents a contour plot of the Pearson correlationcoefficients between the time series of the mode 1 displacement,p1(t), and the distances between any pair of CAs. Correlationcoefficients bigger than 0.8 are found between the Lid (122-159) and regions spanning residues 15-47, 65-89, 96-106,as well as the region around residue 190. Residues 15-47containR-helix 1, R-helix 2, â-strand SA2, and loops betweenthem. Residues 65-89 containR-helix 4,R-helix 5, andâ-strandSA3. Residues 96-106 define the loop betweenâ-strand SA3andR-helix 6. These three regions represent the neighborhoodand part of the Amp-bd domain. The residues around residue190are at the end ofR-helix 8. The correlation pattern confirmsthat mode 1 characterizes fluctuations in the Lid-to-Amp-bddomain distances.
The lack of correlation of the distance between residues 55and 169 with the displacement of mode 1 again suggests thatthe probe residue selection in the energy transfer experiment7
is not appropriate to capture the motion described by mode 1.The strong correlation of distances between residues in the range15-47 and Lid residues (whose motion dominates mode 1) withmode 1, reinforces our suggestion of the choice of residue pairLys40 and Lys141 as a probe for AKE’s dominant motion.
In Figure 11, snapshots of the CA coordinates from mode 1are displayed for normalT. The pattern shows how the Lid andAmp-bd domains move relative to each other.
Mode 3, Normal T.Mode 3 mainly involves the Amp-bdregion, as indicated in Figure 7a. Medium correlation is foundbetween some CA distance pairs and the mode 3 displacement,as mapped in the contour in Figure 12. The region spanningresidues 53-63 (loop region) has medium correlation withregions spanning residues 5-15 (first loop and part ofR-helix1), 108-124 (R-helix 7 and part of a loop), 133-147 (SB4and the loop between SB3 and SB4), 153-174 (a loop andR-helix 8), and 197-214 (R-helix 9 and the last loop).
The medium correlation found between residue pairs in theranges 53-63 and 153-174 with mode 3 shows that the Sinevet al.7 choice of residue pair (55 and 169) is a good indicator
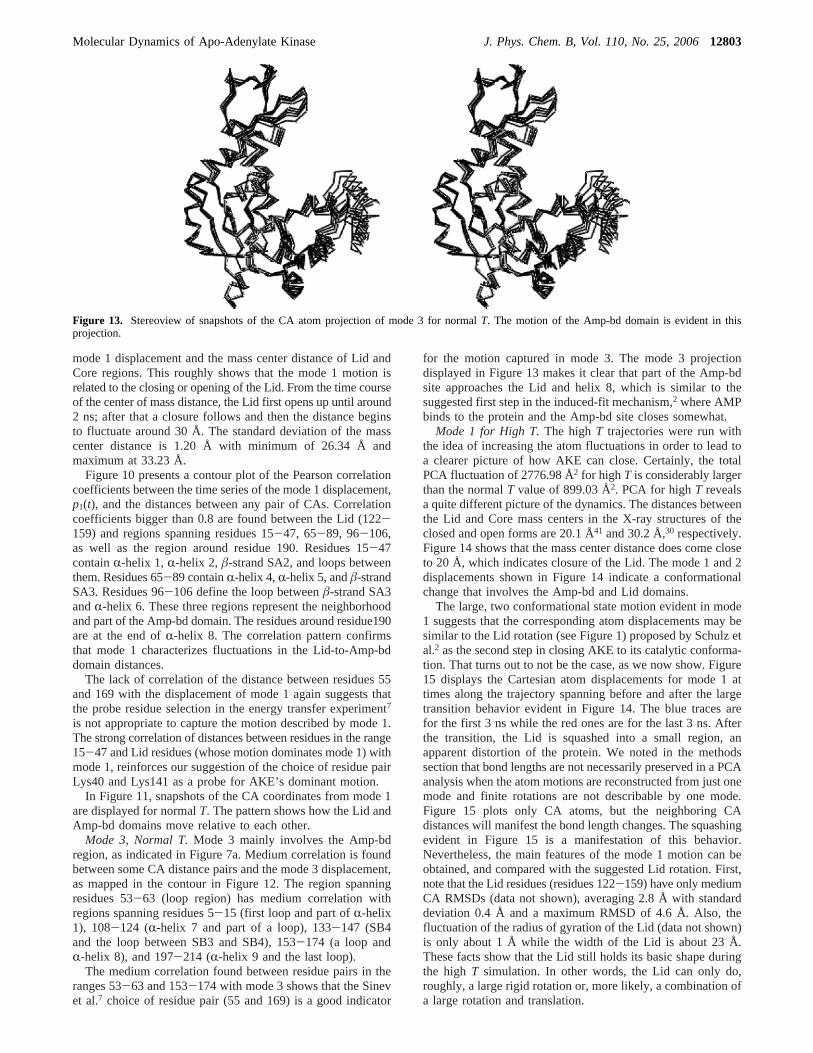
for the motion captured in mode 3. The mode 3 projectiondisplayed in Figure 13 makes it clear that part of the Amp-bdsite approaches the Lid and helix 8, which is similar to thesuggested first step in the induced-fit mechanism,2 where AMPbinds to the protein and the Amp-bd site closes somewhat.
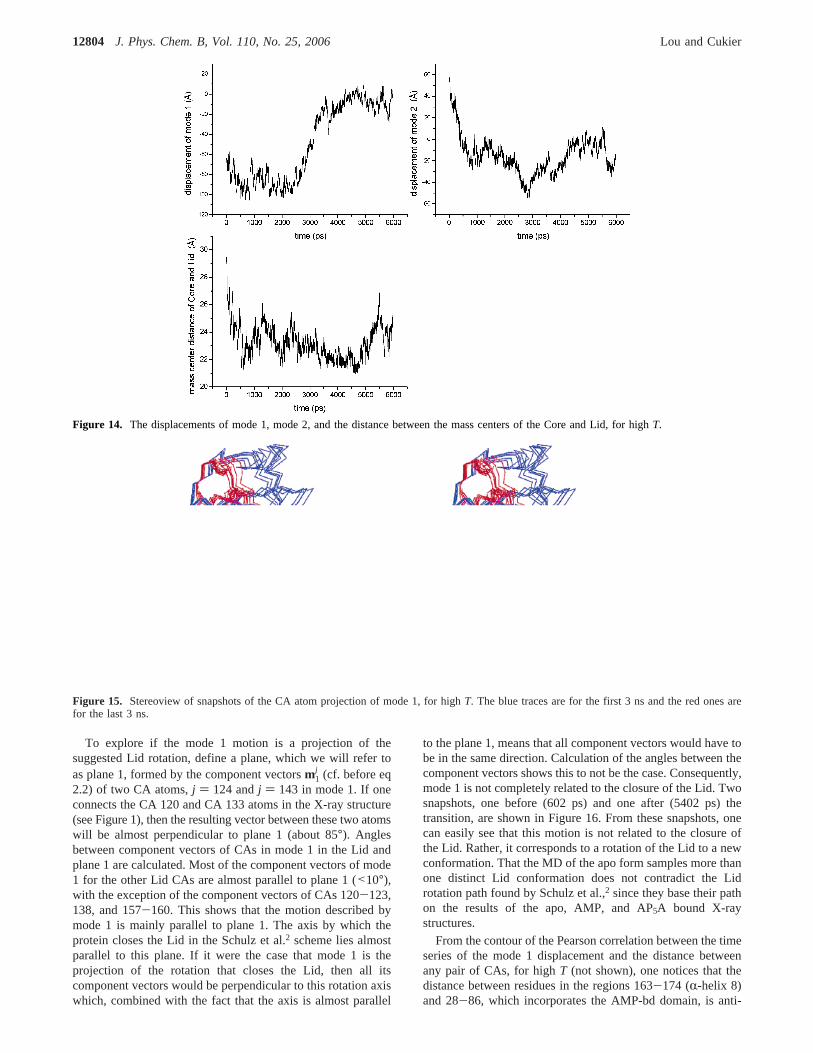
Mode 1 for High T.The highT trajectories were run withthe idea of increasing the atom fluctuations in order to lead toa clearer picture of how AKE can close. Certainly, the totalPCA fluctuation of 2776.98 Å2 for highT is considerably largerthan the normalT value of 899.03 Å2. PCA for highT revealsa quite different picture of the dynamics. The distances betweenthe Lid and Core mass centers in the X-ray structures of theclosed and open forms are 20.1 Å41 and 30.2 Å,30 respectively.Figure 14 shows that the mass center distance does come closeto 20 Å, which indicates closure of the Lid. The mode 1 and 2displacements shown in Figure 14 indicate a conformationalchange that involves the Amp-bd and Lid domains.
The large, two conformational state motion evident in mode1 suggests that the corresponding atom displacements may besimilar to the Lid rotation (see Figure 1) proposed by Schulz etal.2 as the second step in closing AKE to its catalytic conforma-tion. That turns out to not be the case, as we now show. Figure15 displays the Cartesian atom displacements for mode 1 attimes along the trajectory spanning before and after the largetransition behavior evident in Figure 14. The blue traces arefor the first 3 ns while the red ones are for the last 3 ns. Afterthe transition, the Lid is squashed into a small region, anapparent distortion of the protein. We noted in the methodssection that bond lengths are not necessarily preserved in a PCAanalysis when the atom motions are reconstructed from just onemode and finite rotations are not describable by one mode.Figure 15 plots only CA atoms, but the neighboring CAdistances will manifest the bond length changes. The squashingevident in Figure 15 is a manifestation of this behavior.Nevertheless, the main features of the mode 1 motion can beobtained, and compared with the suggested Lid rotation. First,note that the Lid residues (residues 122-159) have only mediumCA RMSDs (data not shown), averaging 2.8 Å with standarddeviation 0.4 Å and a maximum RMSD of 4.6 Å. Also, thefluctuation of the radius of gyration of the Lid (data not shown)is only about 1 Å while the width of the Lid is about 23 Å.These facts show that the Lid still holds its basic shape duringthe highT simulation. In other words, the Lid can only do,roughly, a large rigid rotation or, more likely, a combination ofa large rotation and translation.
Figure 13. Stereoview of snapshots of the CA atom projection of mode 3 for normalT. The motion of the Amp-bd domain is evident in thisprojection.
Molecular Dynamics of Apo-Adenylate Kinase J. Phys. Chem. B, Vol. 110, No. 25, 200612803
To explore if the mode 1 motion is a projection of thesuggested Lid rotation, define a plane, which we will refer toas plane 1, formed by the component vectorsm1
j (cf. before eq2.2) of two CA atoms,j ) 124 andj ) 143 in mode 1. If oneconnects the CA 120 and CA 133 atoms in the X-ray structure(see Figure 1), then the resulting vector between these two atomswill be almost perpendicular to plane 1 (about 85°). Anglesbetween component vectors of CAs in mode 1 in the Lid andplane 1 are calculated. Most of the component vectors of mode1 for the other Lid CAs are almost parallel to plane 1 (<10°),with the exception of the component vectors of CAs 120-123,138, and 157-160. This shows that the motion described bymode 1 is mainly parallel to plane 1. The axis by which theprotein closes the Lid in the Schulz et al.2 scheme lies almostparallel to this plane. If it were the case that mode 1 is theprojection of the rotation that closes the Lid, then all itscomponent vectors would be perpendicular to this rotation axiswhich, combined with the fact that the axis is almost parallel
to the plane 1, means that all component vectors would have tobe in the same direction. Calculation of the angles between thecomponent vectors shows this to not be the case. Consequently,mode 1 is not completely related to the closure of the Lid. Twosnapshots, one before (602 ps) and one after (5402 ps) thetransition, are shown in Figure 16. From these snapshots, onecan easily see that this motion is not related to the closure ofthe Lid. Rather, it corresponds to a rotation of the Lid to a newconformation. That the MD of the apo form samples more thanone distinct Lid conformation does not contradict the Lidrotation path found by Schulz et al.,2 since they base their pathon the results of the apo, AMP, and AP5A bound X-raystructures.
From the contour of the Pearson correlation between the timeseries of the mode 1 displacement and the distance betweenany pair of CAs, for highT (not shown), one notices that thedistance between residues in the regions 163-174 (R-helix 8)and 28-86, which incorporates the AMP-bd domain, is anti-
Figure 14. The displacements of mode 1, mode 2, and the distance between the mass centers of the Core and Lid, for highT.
Figure 15. Stereoview of snapshots of the CA atom projection of mode 1, for highT. The blue traces are for the first 3 ns and the red ones arefor the last 3 ns.
12804 J. Phys. Chem. B, Vol. 110, No. 25, 2006 Lou and Cukier
correlated (<-0.8). This shows that the AMP-bd site approachesHelix 8 when the transition in the Lid occurs, as is apparent inFigure 15. Thus, the Lid rotation and the AMP-bd motions arecorrelated.
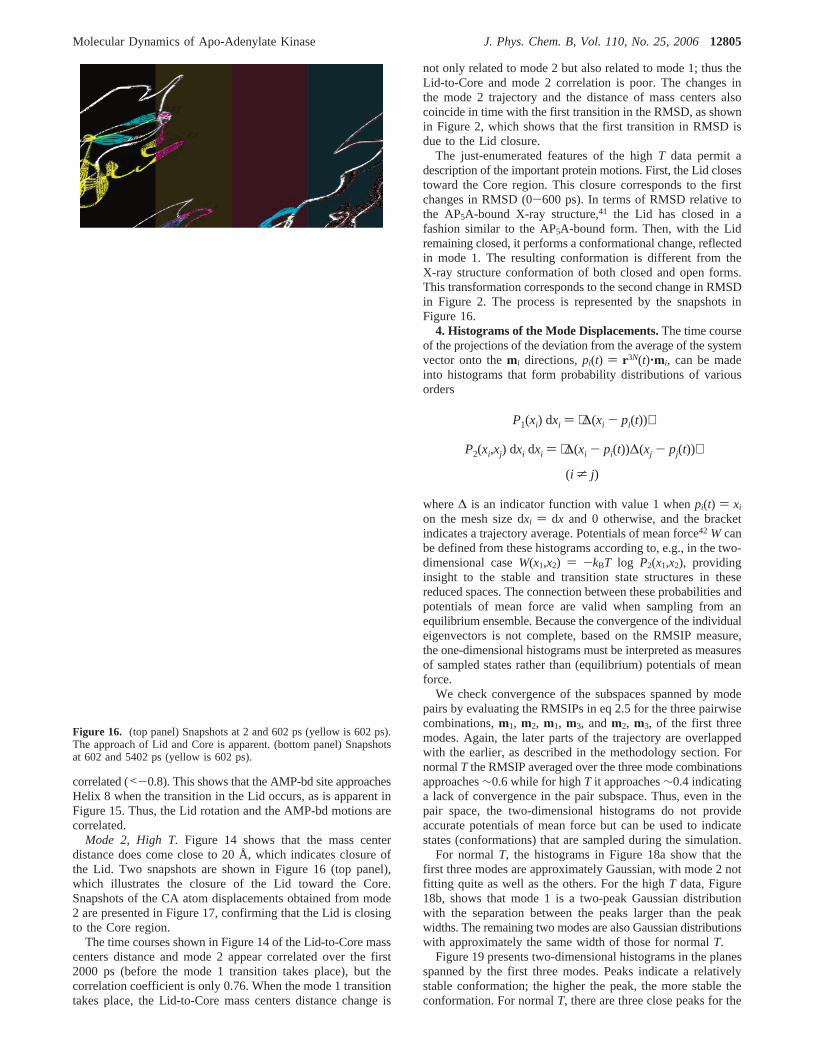
Mode 2, High T.Figure 14 shows that the mass centerdistance does come close to 20 Å, which indicates closure ofthe Lid. Two snapshots are shown in Figure 16 (top panel),which illustrates the closure of the Lid toward the Core.Snapshots of the CA atom displacements obtained from mode2 are presented in Figure 17, confirming that the Lid is closingto the Core region.
The time courses shown in Figure 14 of the Lid-to-Core masscenters distance and mode 2 appear correlated over the first2000 ps (before the mode 1 transition takes place), but thecorrelation coefficient is only 0.76. When the mode 1 transitiontakes place, the Lid-to-Core mass centers distance change is
not only related to mode 2 but also related to mode 1; thus theLid-to-Core and mode 2 correlation is poor. The changes inthe mode 2 trajectory and the distance of mass centers alsocoincide in time with the first transition in the RMSD, as shownin Figure 2, which shows that the first transition in RMSD isdue to the Lid closure.
The just-enumerated features of the highT data permit adescription of the important protein motions. First, the Lid closestoward the Core region. This closure corresponds to the firstchanges in RMSD (0-600 ps). In terms of RMSD relative tothe AP5A-bound X-ray structure,41 the Lid has closed in afashion similar to the AP5A-bound form. Then, with the Lidremaining closed, it performs a conformational change, reflectedin mode 1. The resulting conformation is different from theX-ray structure conformation of both closed and open forms.This transformation corresponds to the second change in RMSDin Figure 2. The process is represented by the snapshots inFigure 16.
4. Histograms of the Mode Displacements.The time courseof the projections of the deviation from the average of the systemvector onto themi directions,pi(t) ) r3N(t)‚mi, can be madeinto histograms that form probability distributions of variousorders
where∆ is an indicator function with value 1 whenpi(t) ) xi
on the mesh size dxi ) dx and 0 otherwise, and the bracketindicates a trajectory average. Potentials of mean force42 Wcanbe defined from these histograms according to, e.g., in the two-dimensional caseW(x1,x2) ) -kBT log P2(x1,x2), providinginsight to the stable and transition state structures in thesereduced spaces. The connection between these probabilities andpotentials of mean force are valid when sampling from anequilibrium ensemble. Because the convergence of the individualeigenvectors is not complete, based on the RMSIP measure,the one-dimensional histograms must be interpreted as measuresof sampled states rather than (equilibrium) potentials of meanforce.
We check convergence of the subspaces spanned by modepairs by evaluating the RMSIPs in eq 2.5 for the three pairwisecombinations,m1, m2, m1, m3, andm2, m3, of the first threemodes. Again, the later parts of the trajectory are overlappedwith the earlier, as described in the methodology section. FornormalT the RMSIP averaged over the three mode combinationsapproaches∼0.6 while for highT it approaches∼0.4 indicatinga lack of convergence in the pair subspace. Thus, even in thepair space, the two-dimensional histograms do not provideaccurate potentials of mean force but can be used to indicatestates (conformations) that are sampled during the simulation.
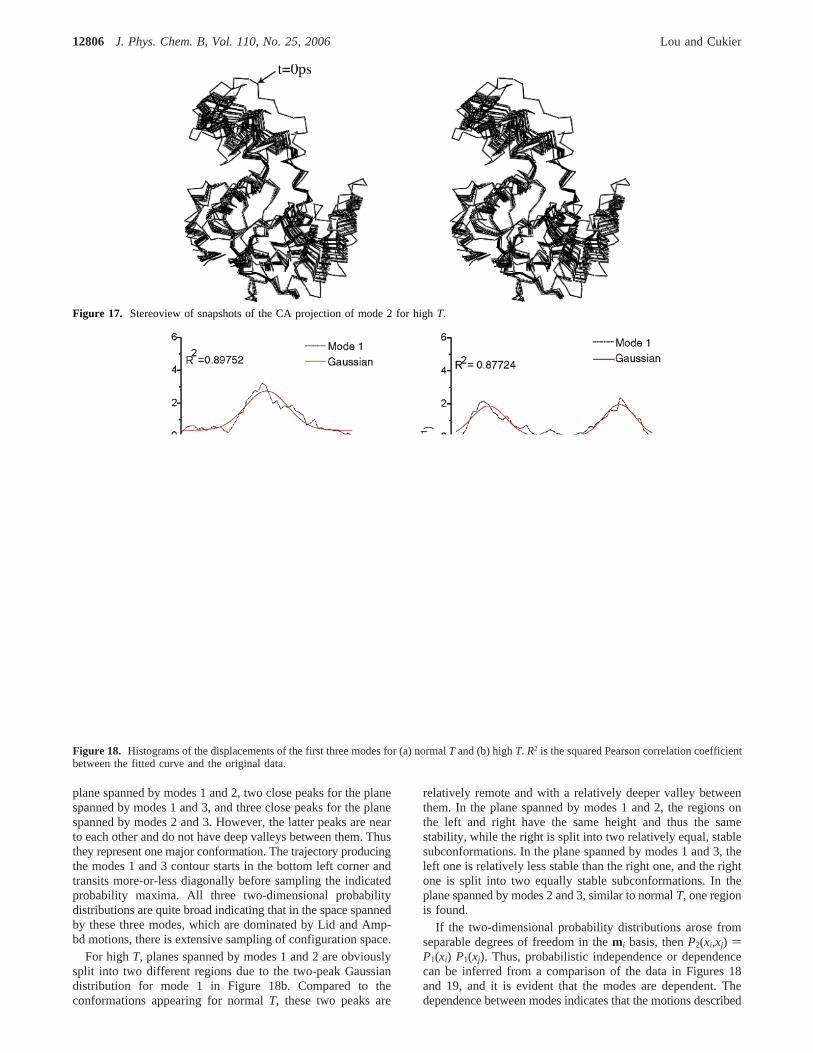
For normalT, the histograms in Figure 18a show that thefirst three modes are approximately Gaussian, with mode 2 notfitting quite as well as the others. For the highT data, Figure18b, shows that mode 1 is a two-peak Gaussian distributionwith the separation between the peaks larger than the peakwidths. The remaining two modes are also Gaussian distributionswith approximately the same width of those for normalT.
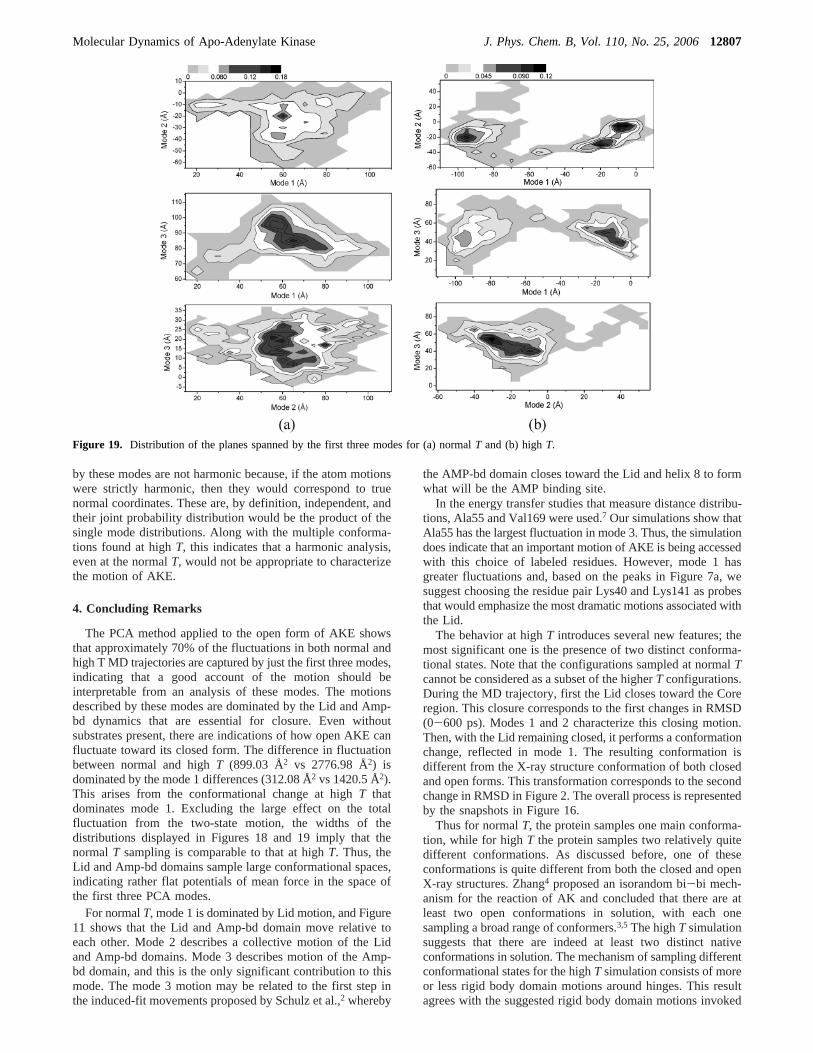
Figure 19 presents two-dimensional histograms in the planesspanned by the first three modes. Peaks indicate a relativelystable conformation; the higher the peak, the more stable theconformation. For normalT, there are three close peaks for the
Figure 16. (top panel) Snapshots at 2 and 602 ps (yellow is 602 ps).The approach of Lid and Core is apparent. (bottom panel) Snapshotsat 602 and 5402 ps (yellow is 602 ps).
P1(xi) dxi ) ⟨∆(xi - pi(t))⟩
P2(xi,xj) dxi dxi ) ⟨∆(xi - pi(t))∆(xj - pj(t))⟩
(i * j)
Molecular Dynamics of Apo-Adenylate Kinase J. Phys. Chem. B, Vol. 110, No. 25, 200612805
plane spanned by modes 1 and 2, two close peaks for the planespanned by modes 1 and 3, and three close peaks for the planespanned by modes 2 and 3. However, the latter peaks are nearto each other and do not have deep valleys between them. Thusthey represent one major conformation. The trajectory producingthe modes 1 and 3 contour starts in the bottom left corner andtransits more-or-less diagonally before sampling the indicatedprobability maxima. All three two-dimensional probabilitydistributions are quite broad indicating that in the space spannedby these three modes, which are dominated by Lid and Amp-bd motions, there is extensive sampling of configuration space.
For highT, planes spanned by modes 1 and 2 are obviouslysplit into two different regions due to the two-peak Gaussiandistribution for mode 1 in Figure 18b. Compared to theconformations appearing for normalT, these two peaks are
relatively remote and with a relatively deeper valley betweenthem. In the plane spanned by modes 1 and 2, the regions onthe left and right have the same height and thus the samestability, while the right is split into two relatively equal, stablesubconformations. In the plane spanned by modes 1 and 3, theleft one is relatively less stable than the right one, and the rightone is split into two equally stable subconformations. In theplane spanned by modes 2 and 3, similar to normalT, one regionis found.
If the two-dimensional probability distributions arose fromseparable degrees of freedom in themi basis, thenP2(xi,xj) )P1(xi) P1(xj). Thus, probabilistic independence or dependencecan be inferred from a comparison of the data in Figures 18and 19, and it is evident that the modes are dependent. Thedependence between modes indicates that the motions described
Figure 17. Stereoview of snapshots of the CA projection of mode 2 for highT.
Figure 18. Histograms of the displacements of the first three modes for (a) normalT and (b) highT. R2 is the squared Pearson correlation coefficientbetween the fitted curve and the original data.
12806 J. Phys. Chem. B, Vol. 110, No. 25, 2006 Lou and Cukier
by these modes are not harmonic because, if the atom motionswere strictly harmonic, then they would correspond to truenormal coordinates. These are, by definition, independent, andtheir joint probability distribution would be the product of thesingle mode distributions. Along with the multiple conforma-tions found at highT, this indicates that a harmonic analysis,even at the normalT, would not be appropriate to characterizethe motion of AKE.
4. Concluding Remarks
The PCA method applied to the open form of AKE showsthat approximately 70% of the fluctuations in both normal andhigh T MD trajectories are captured by just the first three modes,indicating that a good account of the motion should beinterpretable from an analysis of these modes. The motionsdescribed by these modes are dominated by the Lid and Amp-bd dynamics that are essential for closure. Even withoutsubstrates present, there are indications of how open AKE canfluctuate toward its closed form. The difference in fluctuationbetween normal and highT (899.03 Å2 vs 2776.98 Å2) isdominated by the mode 1 differences (312.08 Å2 vs 1420.5 Å2).This arises from the conformational change at highT thatdominates mode 1. Excluding the large effect on the totalfluctuation from the two-state motion, the widths of thedistributions displayed in Figures 18 and 19 imply that thenormalT sampling is comparable to that at highT. Thus, theLid and Amp-bd domains sample large conformational spaces,indicating rather flat potentials of mean force in the space ofthe first three PCA modes.
For normalT, mode 1 is dominated by Lid motion, and Figure11 shows that the Lid and Amp-bd domain move relative toeach other. Mode 2 describes a collective motion of the Lidand Amp-bd domains. Mode 3 describes motion of the Amp-bd domain, and this is the only significant contribution to thismode. The mode 3 motion may be related to the first step inthe induced-fit movements proposed by Schulz et al.,2 whereby
the AMP-bd domain closes toward the Lid and helix 8 to formwhat will be the AMP binding site.
In the energy transfer studies that measure distance distribu-tions, Ala55 and Val169 were used.7 Our simulations show thatAla55 has the largest fluctuation in mode 3. Thus, the simulationdoes indicate that an important motion of AKE is being accessedwith this choice of labeled residues. However, mode 1 hasgreater fluctuations and, based on the peaks in Figure 7a, wesuggest choosing the residue pair Lys40 and Lys141 as probesthat would emphasize the most dramatic motions associated withthe Lid.
The behavior at highT introduces several new features; themost significant one is the presence of two distinct conforma-tional states. Note that the configurations sampled at normalTcannot be considered as a subset of the higherT configurations.During the MD trajectory, first the Lid closes toward the Coreregion. This closure corresponds to the first changes in RMSD(0-600 ps). Modes 1 and 2 characterize this closing motion.Then, with the Lid remaining closed, it performs a conformationchange, reflected in mode 1. The resulting conformation isdifferent from the X-ray structure conformation of both closedand open forms. This transformation corresponds to the secondchange in RMSD in Figure 2. The overall process is representedby the snapshots in Figure 16.
Thus for normalT, the protein samples one main conforma-tion, while for highT the protein samples two relatively quitedifferent conformations. As discussed before, one of theseconformations is quite different from both the closed and openX-ray structures. Zhang4 proposed an isorandom bi-bi mech-anism for the reaction of AK and concluded that there are atleast two open conformations in solution, with each onesampling a broad range of conformers.3,5 The highT simulationsuggests that there are indeed at least two distinct nativeconformations in solution. The mechanism of sampling differentconformational states for the highT simulation consists of moreor less rigid body domain motions around hinges. This resultagrees with the suggested rigid body domain motions invoked
Figure 19. Distribution of the planes spanned by the first three modes for (a) normalT and (b) highT.
Molecular Dynamics of Apo-Adenylate Kinase J. Phys. Chem. B, Vol. 110, No. 25, 200612807
in AKE originally, based on an examination of several closedand the open form crystal structures,2,30 though the particularmotions seen in the MD are not the same as those suggested inthe crystal structure studies. The specifics of these domainmotions are of course influenced by the bound ligands and,therefore, comparison with the ligand free simulations can onlybe qualitative.
The RMSIP analysis shows that, especially for highT, a 6ns simulation is not long enough to converge the results for allthe modes. Thus, the generated data do not correspond to atrajectory describing equilibrium fluctuations. This is certainlyto be expected for the highT simulation where a largeconformational transition is observed. For the normalT, lackof convergence indicates that as the simulation progresses, newstates may be sampled. Also, the proportions of states sampledthat are separated by relatively high barriers (measured by thesimulation time scale) can be evolving. These features are ofcourse endemic to protein simulations, with their rough energylandscapes. The dominant PCA modes reflect the longer timescale motions and, while standard measures of convergence suchas the total protein potential energy might appear converged,other measures such as the first few PCA modes may not beconverged.
Acknowledgment. This work is supported by the NIH(Grant No. GM62790).The simulations were carried out on theQuantitative Biology and Modeling Initiative and the MichiganCenter for Biological Information Linux clusters at MichiganState University.
References and Notes
(1) Walsh, C.Enzymatic reaction mechanisms; W. H. Freeman: SanFrancisco, CA, 1979.
(2) Schulz, G. E.; Muller, C. W.; Diederichs, K.J. Mol. Biol. 1990,213, 627-630.
(3) Sheng, X. R.; Li, X.; Pan, X. M.J. Biol. Chem.1999, 274, 22238.(4) Zhang, H. J.; Sheng, X. R.; Niu, W. D.; Pan, X. M.; Zhou, J. M.
J. Biol. Chem.1998, 273, 7448.(5) Han, Y.; Li, X.; Pan, X. M.FEBS Lett.2002, 528, 161.(6) Burlacu-Miron, S.; Gilles, A. M.; Popescu, A.; Barzu, O.; Craescu,
C. T. Eur. J. Biochem.1999, 264, 765.(7) Sinev, M. A.; Sineva, E. V.; Ittah, V.; Haas, E.Biochemistry1996,
35, 6425.(8) Kern, P.; Brunne, R. M.; Folkers, G.J. Comput.-Aided Mol. Des.
1994, 8, 367.(9) Krishnamurthy, H.; Lou, H. F.; Kimple, A.; Vieille, C.; Cukier, R.
I. Proteins2005, 58, 88.(10) Elamrani, S.; Berry, M. B.; Phillips, G. N.; McCammon, J. A.
Proteins: Struct., Funct., Genet.1996, 25, 79.(11) Temiz, N. A.; Meirovitch, E.; Bahar, I.Proteins2004, 57, 468.
(12) Gerstein, M.; Lesk, A. M.; Chothia, C.Biochemistry1994, 33, 6739.(13) Kumar, S.; Sham, Y. Y.; Tsai, C.-J.; Nussinov, R.Biophys. J.2001,
80, 2439.(14) Hayward, S.J. Mol. Biol. 2004, 339, 1001.(15) Eisenmesser, E. Z.; Bosco, D. A.; Akke, M.; Kern, D.Science2002,
295, 1520.(16) Garcı´a, A. E.Phys. ReV. Lett. 1992, 68, 2696.(17) Garcı´a, A. E.; Blumenfeld, R.; Hummer, G.; Krumhansl, J. A.
Physica D1997, 107, 225.(18) Amadei, A.; Linssen, A. B. M.; Berendsen, H. J. C.Proteins:
Struct., Funct., Genet.1993, 17, 412.(19) Cox, T. F.; Cox, M. A. A.Multidimensional scaling, 2nd ed.;
Chapman & Hall: Boca Raton, FL, 2001.(20) Romo, T. D.; Clarage, J. B.; Sorensen, D. C.; Phillips, G. N.
Proteins: Struct., Funct., Genet.1995, 22, 311.(21) Wlodek, S. T.; Clark, T. W.; Scott, L. R.; McCammon, J. A.J.
Am. Chem. Soc.1997, 119, 9513.(22) Creveld, L. D.; Amadei, A.; van Schaik, R. C.; Pepermans, H. A.
M.; de Vlieg, J.; Berendsen, H. J. C.Proteins: Struct., Funct., Genet.1998,33, 253.
(23) Arcangeli, C.; Bizzarri, A. R.; Cannistraro, S.Biophys. Chem.2001,92, 183.
(24) Garcia, A. E.; Sanbonmatsu, K. Y.Proteins: Struct., Funct., Genet.2001, 42, 345.
(25) Grottesi, A.; Ceruso, M.-A.; Colosimo, A.; DiNola, A.Proteins:Struct., Funct., Genet.2002, 46, 287.
(26) Teodoro, M. L.; Phillips, G. N.; Kavraki, L. E.J. Comput. Biol.2003, 10, 617.
(27) Case, D. A.; Pearlman, D. A.; Caldwell, J. W.; III, T. E. C.; Wang,J.; Ross, W. S.; Simmerling, C. L.; Darden, T. A.; Merz, K. M.; Stanton,R. V.; Cheng, A. L.; Vincent, J. J.; Crowley, M.; Tsue, V.; Gohlke, H.;Radmer, R.; Duan, Y.; Pitera, J.; Massova, I.; Seibel, G. L.; Singh, C.;Weiner, P.; Kollman, P. A. AMBER7; University of California: SanFrancisco, 2002.
(28) Cornell, W. D.; Cieplak, P.; Bayly, C. I.; Gould, I. R.; Merz, K.M.; Ferguson, D. M.; Spellmeyer, D. C.; Fox, T.; Caldwell, J. W.; Kollman,P. A. J. Am. Chem. Soc.1996, 118, 2309.
(29) Essmann, U.; Perera, L.; Berkowitz, M. L.; Darden, T.; Lee, H.;Pedersen, G. L.J. Chem. Phys.1995, 103, 8577.
(30) Muller, C. W.; Schlauderer, G. J.; Reinstein, J.; Schulz, G. E.Structure1996, 4, 147.
(31) Ryckaert, J. P.; Ciccotti, G.; Berendsen, H. J. C.J. Comput. Phys.1977, 23, 327.
(32) Berendsen, H. H. C.; Postma, J. P. M.; Gunsteren, W. F.; DiNola,A.; Haak, J. R.J. Chem. Phys.1984, 81, 3684.
(33) Elmaci, N.; Berry, R. S.J. Chem. Phys.1999, 110, 10606.(34) Amadei, A.; Ceruso, M. A.; Di Nola, A.Proteins: Struct., Funct.,
Genet.1999, 36, 419.(35) Hess, B.Phys. ReV. E 2000, 62, 8438.(36) Hess, B.Phys. ReV. E 2002, 65, 031910.(37) McCammon, A.; Harvey, S. C.Dynamics of proteins and nucleic
acids; Cambridge University Press: Cambridge, 1987.(38) Hunenberger, P. H.; Mark, A. E.; Vangunsteren, W. F.J. Mol. Biol.
1995, 252, 492.(39) Gerstein, M.; Schulz, G.; Chothia, C.J. Mol. Biol.1993, 229, 494.(40) de Bakker, P. I. W.; Hunenberger, P. H.; McCammon, J. A.J. Mol.
Biol. 1999, 285, 1811.(41) Muller, C. W.; Schulz, G. E.J. Mol. Biol. 1992, 224, 159.(42) Kirkwood, J. G.J. Chem. Phys.1935, 3, 300.
12808 J. Phys. Chem. B, Vol. 110, No. 25, 2006 Lou and Cukier