Embed Size (px)
Citation preview
PLEASE SCROLL DOWN FOR ARTICLE
This article was downloaded by:On: 20 January 2011Access details: Access Details: Free AccessPublisher Taylor & FrancisInforma Ltd Registered in England and Wales Registered Number: 1072954 Registered office: Mortimer House, 37-41 Mortimer Street, London W1T 3JH, UK
Molecular Crystals and Liquid CrystalsPublication details, including instructions for authors and subscription information:http://www.informaworld.com/smpp/title~content=t713644168
Dielectric Studies of Three Liquid Crystals HBT, E8 and PCH-1132B. Bahadurab; R. K. Sarnaa; V. G. Bhidea
a National Physical Laboratory, New Delhi, India b Data Images Inc., Ottawa, Ontario, Canada
First published on: 01 August 1982
To cite this Article Bahadur, B. , Sarna, R. K. and Bhide, V. G.(1982) 'Dielectric Studies of Three Liquid Crystals HBT, E8and PCH-1132', Molecular Crystals and Liquid Crystals, 88: 1, 151 — 165To link to this Article: DOI: 10.1080/00268948208072593URL: http://dx.doi.org/10.1080/00268948208072593
Full terms and conditions of use: http://www.informaworld.com/terms-and-conditions-of-access.pdf
This article may be used for research, teaching and private study purposes. Any substantial orsystematic reproduction, re-distribution, re-selling, loan or sub-licensing, systematic supply ordistribution in any form to anyone is expressly forbidden.
The publisher does not give any warranty express or implied or make any representation that the contentswill be complete or accurate or up to date. The accuracy of any instructions, formulae and drug dosesshould be independently verified with primary sources. The publisher shall not be liable for any loss,actions, claims, proceedings, demand or costs or damages whatsoever or howsoever caused arising directlyor indirectly in connection with or arising out of the use of this material.

Mol. Cryst. Liq. Cryst., 1982, Vol. 88, pp. 151-165
@ 1982 Gordon and Breach, Science Publishers, Inc. Printed in the United States of America
0026-894 1/82/8801-0 15 1/$06.50/0
Dielectric Studies of Three Liquid Crystals HBT, E8 and PCH-1132 t B. BAHADUR,$ R. K. SARNA and V. G. BHIDE National Physical Laboratory, Hillside Road, New Delhi-110012, India
(Received April 3. 1981: in final form February 18, 1982)
The dielectric behavior of a Schiff base N-@-Hexyloxybenzy1idene)-p-toluidine (HBT) and two technologically important mixtures, Es and PCH-1132, are reported in the radio frequency region. The value of the mean dielectric constant increases by -5% on going from the nematic to the isotropic phase in the case of EB and PCH-1132. This may per- haps be due to antiferroelectric arrangement of the molecules in the nematic phase. These mesogens show unusual dielectric behavior and exhibit positive anisotropy at lower frequencies and negative dielectric anisotropy above a critical frequency termed as isotropic frequency. The isotropic frequency is found to be temperature dependent. All these nematogens exhibit single relaxation in the radio frequency region which is due to hindered rotation of the molecules under nematic potential. The relaxation frequencies are 3.98 MHz (at 61.4'C), 2.27 MHz (at 34.3"C). 1.87 MHz (at 33°C) in case of HBT, En and PCH-I 132 respectively. The activation energy is found to be 16.7 KCaVmole. 14.6 KCal/mole and 16.1 KCaVmole for HBT, En and PCH-I I32 respectively. In smectic B phase of HBT, the dipolar orientations are found to be somewhat "locked" similar to that in solids. The inversion of the sign of dielectric anisotropy in SB phase of HBT is also discussed.
INTRODUCTION
The recent applications of liquid crystals in various types of electro- optical devices have stimulated the investigations on dielectric behav- ior of liquid crystals.'-4 The dielectric studies of liquid crystals not only provide useful information about the molecular structure, intermolecu-
t A part of Ph.D. thesis of R. K. Sarna, Delhi University 1981. $ Present address: Data Images Inc., 1283 Algoma Road, Ottawa, Ontario, Canada
KIB 3W7.
151
Downloaded At: 11:28 20 January 2011
152 B. BAHADUR, R. K. SARNA and V. G. BHIDE
lar forces and molecular dynamics5 but also provide useful clues re- lated to the display performance such as threshold and operating volt- ages, switching times, operating and isotropic frequencies etc.'-' Dielectric studies are therefore important from basic as well as applied points of view. In this paper we are reporting dielectric studies on three mesogens HBT, Es and PCH-1132. E8 and PCH-1132 are stable liquid crystal mixtures and are being used for liquid crystal digital displays. The dielectric studies on HBT are expected to provide some information on the smectic B phase which is not very well understood as yet.
EXPERIMENTAL
HBT was procured from WS. E. Merck (Germany) and was further purified before use.6 Ea and PCH-1132 were procured respectively from M/S. BDH (England) and E. Merck (Germany) in purest form.3 The transition temperatures and the corresponding phases were con- firmed using a polarizing microscope and D.S.C. These are listed below
HBT N-@-Hexyloxybenzylidene)-p-toluidine6 73 rc Solid 1- Nematic+Isotropic
Ea (an eutectic mixture of three cyanobiphenyls and one cyanoterphenyl)'
Solid-Nematic- Isotropic
PCH-1132 (an eutectic mixture of three cyanophenyl cyclohexanes and one
-12°C
cyanobiphenyl cyclohexane).' - 6 T W C Solid=Nematic=Isotropic
The dielectric permittivity (0') and loss (e") of these liquid crystals (HBT, E8 and PCH-1132) were measured using G.R. Scheering bridge 716C in frequency range 1-100 KHz and using Wayne Kerr R.F. bridge B602 along with G.R. tuned amplifier null detector 1232A and fre- quency mixer 1232 in frequency range 100 K-3.5 MHz. The dielectric cell was essentially a parallel plate capacitor (effective capacity -14.5
Downloaded At: 11:28 20 January 2011
DIELECTRIC STUDIES OF HBT. Es AND PCH-1132 I53
pF) consisting of two gold plated circular copper electrodes separated by a teflon spacer of thickness -300 pm. For measuring c i and 4, the alignment of the liquid crystal was achieved by a uniform magnetic field of 5-6 KGauss, a field strength much above the saturation value. The temperature control of the cell was better than f0.2”C.
The temperature variation of the effective capacity of the cell was monitored. The capacity of the cell was found to be fairly constant up to 2 MHz and hence no correction was required up to this frequency. In higher frequency side errors can arise due to small resistence and in- ductance (mainly contributed by long connecting leads and empty space of the cell in series with the dielectric cell. The contribution due to series resistance R, was negligible as with our R, -4 I f 2 and capacity -200 pF (for the cell filled with E, or PCH-1132), (R,C)-’ 10 MHz, the highest frequency which can be utilized with the bridge. However the contribution of the inductance L to the total impedence, which is negligible at low frequencies, becomes more and more significant at higher frequencies (i.e. above 2 MHz) and bridge balances at signifi- cantly higher values than the actual capacity of the cell. The measured value Cp is related to the actual capacity, C, by the relation
cp=c 1 + x 2 - 7 ( Q 7 where x is w/w* , a* = (LC)-’”, Q = R -and other symbols have their usual meanings.’ d was assumed to remain constant in the fre- quency range studied (i.e. up to 4 MHz) and using above relation a cor- rection was applied to get the correct values of oil.
The loss factor was evaluated by subtracting the conductance of empty cell (i.e. filled with air) from the conductance of the cell filled with liquid crystal material. This procedure thus eliminates the losses due to Rs and L.’ However, this loss factor, measured from the actual conductance of the dielectric material, contains dielectric as well as d.c. conduction losses. The dielectric loss was evaluated by subtracting d.c. conduction loss from the total loss of the dielectric materiaL5
The absolute accuracy of dielectric constant and loss measurements using a Wayne-Kerr bridge were -2% and -5% respectively, while the relative accuracy was found to be much better. The accuracy of static dielectric constant measurements using Scheering bridge was still better i.e. the absolute accuracy was -1% and relative accuracy was better than -0.2%.
Downloaded At: 11:28 20 January 2011
154
RESULTS AND DISCUSSIONS
B. BAHADUR, R. K. SARNA and V. C. BHIDE
45-
t I
0 I- 2 !- 07 z 0
4.0
a
3.5- L! K I- u w _I w n
3.0
The behavior of dielectric permittivity will be discussed in two parts (i) the temperature variation of the static dielectric permittivity and (ii) the dielectric dispersion in the liquid crystals.
-
-
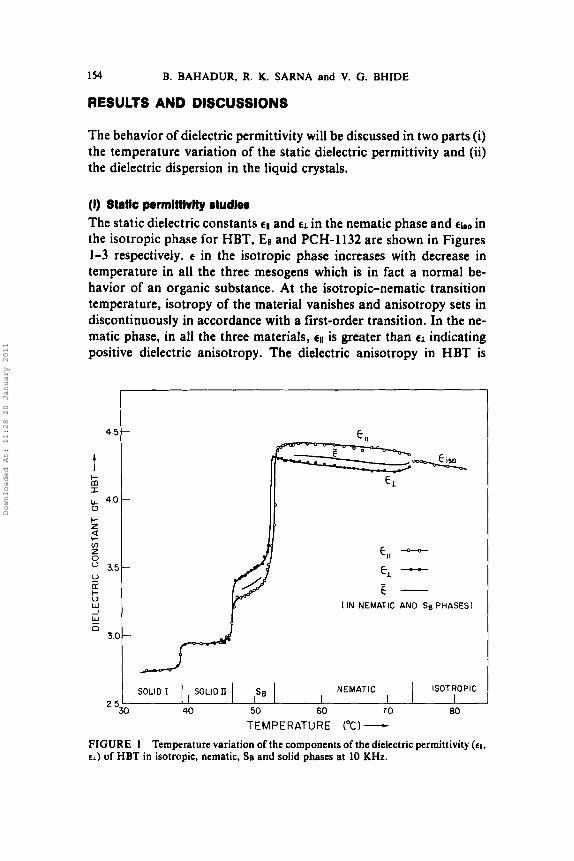
(I) Static pormlttlvlty studio8 The static dielectric constants €11 and €1 in the nematic phase and in the isotropic phase for HBT, En and PCH-1132 are shown in Figures 1-3 respectively. e in the isotropic phase increases with decrease in temperature in all the three mesogens which is in fact a normal be- havior of an organic substance. At the isotropic-nematic transition temperature, isotropy of the material vanishes and anisotropy sets in discontinuously in accordance with a first-order transition. In the ne- matic phase, in all the three materials, tll is greater than CI indicating positive dielectric anisotropy. The dielectric anisotropy in HBT is
SOLID 1 SOLlDn SB NEMATIC ISOTROPIC I I I
E* - c -
Y IN NEMATIC AND SB PHASES1
Downloaded At: 11:28 20 January 2011
DIELECTRIC STUDIES OF HBT, Es AND PCH-1132 155
I kHz ,I0 kHz
- I kHz, 10 kHz ,100 kHz
N E MATlC lS0TROPIC I I 1 1 I
20 30 40 50 60 70 80 TEMPERATURE ("C 1 -
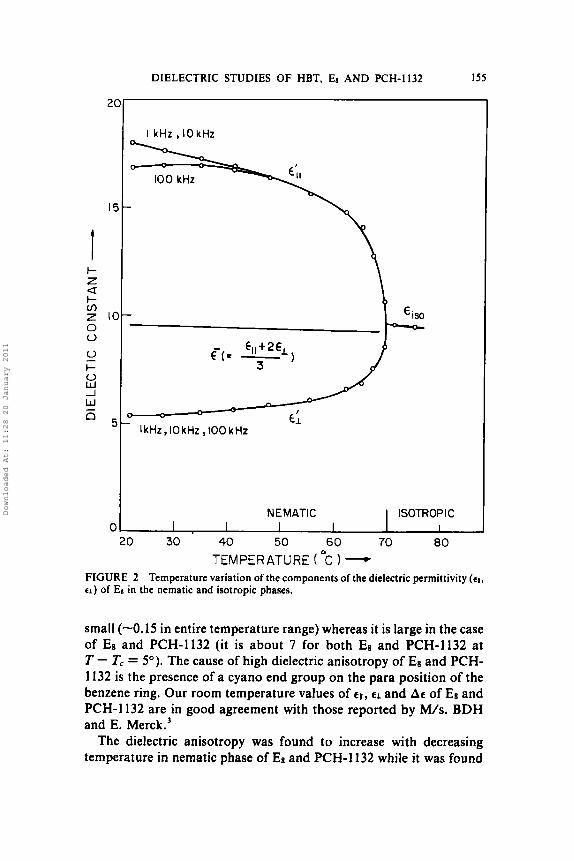
FIGURE 2 Temperature variation of the components of the dielectric permittivity (ell, 61) of Ea in the nematic and isotropic phases.
small (-0.15 in entire temperature range) whereas it is large in the case of E8 and PCH-1132 (it is about 7 for both E8 and PCH-1132 at T - T, = 5'). The cause of high dielectric anisotropy of E8 and PCH- 1132 is the presence of a cyano end group on the para position of the benzene ring. Our room temperature values of €11, €1 and Ac of En and PCH-1132 are in good agreement with those reported by M/s. BDH and E. Merck.'
The dielectric anisotropy was found to increase with decreasing temperature in nematic phase of EE and PCH-1132 while it was found
Downloaded At: 11:28 20 January 2011
156
20
15
t & 10
I- z a
0 0
0
W J W
- b
E 5
C
B. BAHADUR, R. K. SARNA and V. G. BHIDE
I kHz , 10 kHz
100 kHz
I kHz,lOkHz, 100 kHz
NEMATIC ISOTROPIC I I I I 1
20 30 40 50 60 70 80 TEMPERATURE ( "C 1 -
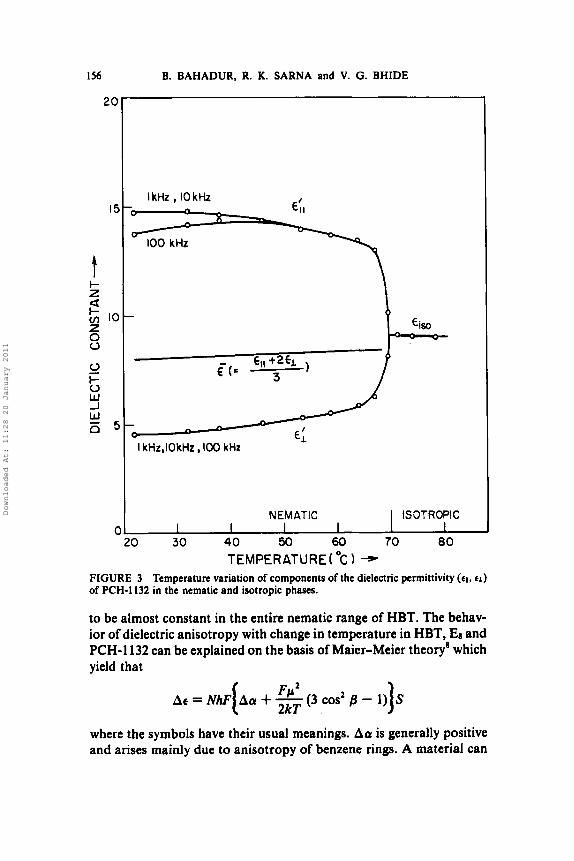
FIGURE 3 Temperature variation of components of the dielectric permittivity (en, e l ) of PCH-I 132 in the nematic and isotropic phases.
to be almost constant in the entire nematic range of HBT. The behav- ior of dielectric anisotropy with change in temperature in HBT, En and PCH-1132 can be explained on the basis of Maier-Meier theory* which yield that
FPZ Ae = NhF Aa 4- - (3 60s' B - 1))s 2kT ,
where the symbols have their usual meanings. Aa is generally positive and arises mainly due to anisotropy of benzene rings. A material can
Downloaded At: 11:28 20 January 2011
DIELECTRIC STUDIES OF HBT, El AND PCH-1132 157
be of high positive dielectric anisotropy if the dipolar contribution (Fp2/2kT)(3 cod p - 1) is large and positive. For materials of negative dielectric anisotropy or very small positive dielectric anisotropy this term is negative. In case of PCH-1132 and En, which have high positive Ac, the SIT dependence of dipole contribution to Ac is predominant and is additive to S A a . Consequently Ac increases with decreasing temperature. On the other hand in HBT, where Ae = -0.15, the aniso- tropy of induced polarization is approximately equal to that of orienta- tional polarization. Just below nematic-isotropic temperature, the temperature dependence of S is most important and increases with de- creasing temperature. At lower temperature, the counteracting SIT dependence of the orientational polarization predominates and hence we get almost constant Ac.
Another observation of importance is that the value of the mean di- electric constant increases by -5% on going from nematic to isotropic phase in case of En and PCH-1132 (Figures 2 and 3). This difference in eho and?G = [EII + 2cr]/3 in nematic phase) at TNI, nematic-isotropic transition temperature, in highly polar En and PCH-1132 may be due to antiferroelectric short range order of the molecules in the nematic phase as proposed by Chandrasekhar er d 9 A similar trend is observed in case of HBT too but the difference in Z at TALI and t h is very small which is due to weak polarity of HBT.
We will now discuss the temperature variation of dielectric permit- tivity in the smectic B phase of HBT. The observations were recorded on a sample cooled to SB phase in the presence of magnetic field (-6-8 KG). From the Figure 1 it is clear that values of €11 and EL both fall rap- idly on cooling from nematic to SB phase, the decrease being more in t~
compared to EL. One can easily observe that 5 in SB phase of HBT is considerably less than that of nematic and isotropic phases. This indi- cates that dipolar orientations in SB phase are not free as in liquids but are somewhat "locked" similar to that in the solids. Moreover, the temperature variation of 5 in SB phase resembles to that of solid phase. A partial contribution to this decrease in the value of 5 in SB phase compared to nematic phase may be attributed to the increase in the number of pairs of antiparallel oriented dipoles in SB phase than ne- matic phase. However, the change in 5 is very large (-25%) and cannot be accounted only by this. On going to the solid state, a further de- crease in 5 is observed at SB-solid I1 transition which may be due to further locking of the permanent dipoles. A small decrease in c is ob- served during solid I1 to solid I transition. In solid I phase c decreases with decrease in temperature which is the normal behavior of solids.
Downloaded At: 11:28 20 January 2011
158 B. BAHADUR, R. K. SARNA and V. G. BHIDE
4.8
t 4.6 I-
4.4 a z s 4.2 0 E I- 4.0 0
kl
!3 ; 3.8 3.6
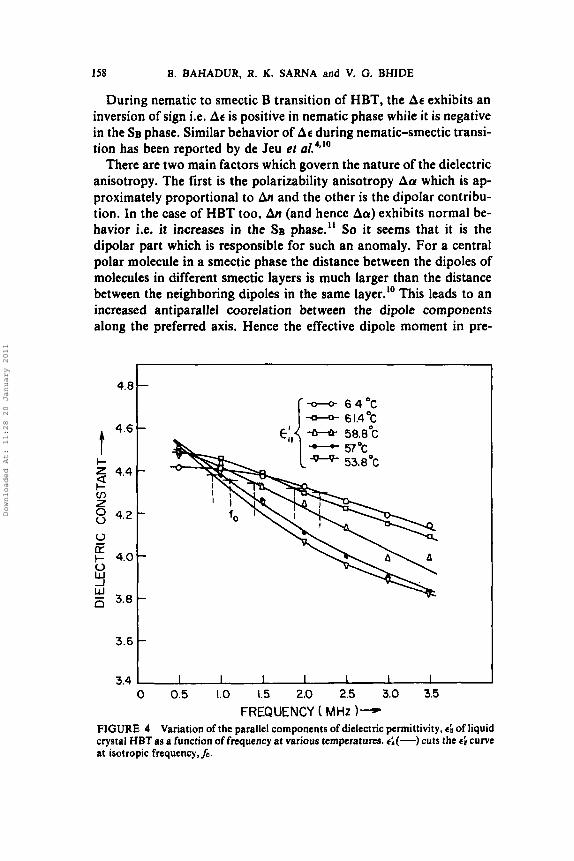
During nematic to smectic B transition of HBT, the At exhibits an inversion of sign i.e. At is positive in nematic phase while it is negative in the SB phase. Similar behavior of At during nematic-smectic transi- tion has been reported by de Jeu et U I .~~"
There are two main factors which govern the nature of the dielectric anisotropy. The first is the polarizability anisotropy Aa which is ap- proximately proportional to An and the other is the dipolar contribu- tion. In the case of HBT too, An (and hence Aa) exhibits normal be- havior i.e. it increases in the SB phase." So it seems that it is the dipolar part which is responsible for such an anomaly. For a central polar molecule in a smectic phase the distance between the dipoles of molecules in different smectic layers is much larger than the distance between the neighboring dipoles in the same layer.'' This leads to an increased antiparallel coorelation between the dipole components along the preferred axis. Hence-the effective dipole moment in pre-
-
-
-
-
-
-
-
3.4 I 1 I I 1 I I 0 0.5 1.0 1.5 2.0 2.5 3.0 3.5
FREQUENCY MHz 1 - t FIGURE 4 Variation of the parallel components.of dielectric permittivity. 4 of liquid crystal HBT as a function of frequency at various temperatures. &(-)cuts the 4 curve at isotropic frequency,jo.
Downloaded At: 11:28 20 January 2011
DIELECTRIC STUDIES OF HBT, Es AND PCH-1132 I59
16.-
14
12
t z $
l- 10- z a
0
2 I- 0 2 4 - - n
2-
-
-
6-
0 0 0.5 1.0 1.5 2.0 2.5 3.0 3.5
FREQUENCY ( MHz 1-
f0
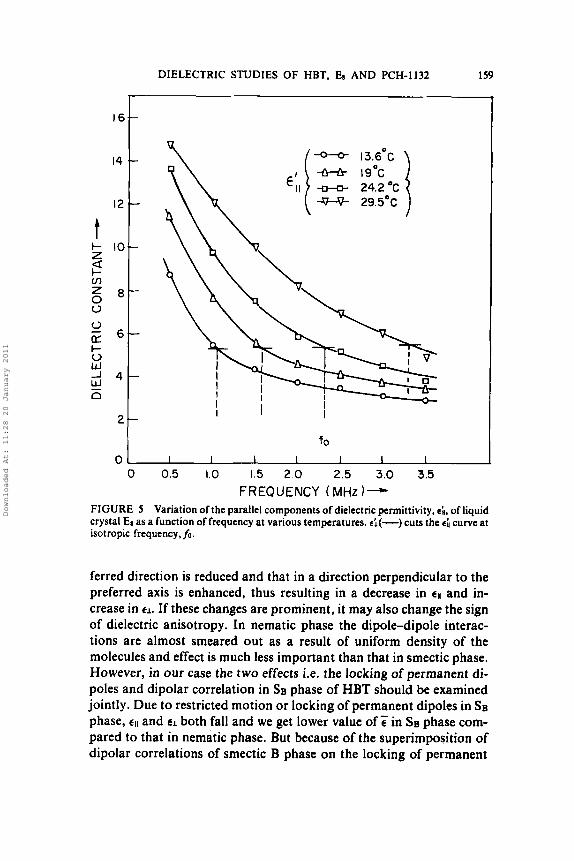
FIGURE 5 Variation of the parallel components of dielectric permittivity, ti, of liquid crystal Ea as a function of frequency at various temperatures. el(-) cuts the ti curve at isotropic frequency, A.
ferred direction is reduced and that in a direction perpendicular to the preferred axis is enhanced, thus resulting in a decrease in €11 and in- crease in €1. If these changes are prominent, it may also change the sign of dielectric anisotropy. In nematic phase the dipole-dipole interac- tions are almost smeared out as a result of uniform density of the molecules and effect is much less important than that in smectic phase. However, in our case the two effects i.e. the locking of permanent di- poles and dipolar correlation in SB phase of HBT should be examined jointly. Due to restricted motion or locking of permanent dipoles in SB phase, and €1 both fall and we get lower value of r in SB phase com- pared to that in nematic phase. But because of the superimposition of dipolar correlations of smectic B phase on the locking of permanent
Downloaded At: 11:28 20 January 2011
160 B. BAHADUR, R. K. SARNA and V. G. BHIDE
14
t 1 2 - I-
l 0 - 2 s v) Z
0 I- cr 0 W -I W 5
2 -
-
6 -
4-
01 I I I I 1 I I 0 0.5 1.0 1.5 2.0 2.5 3.0 3.5
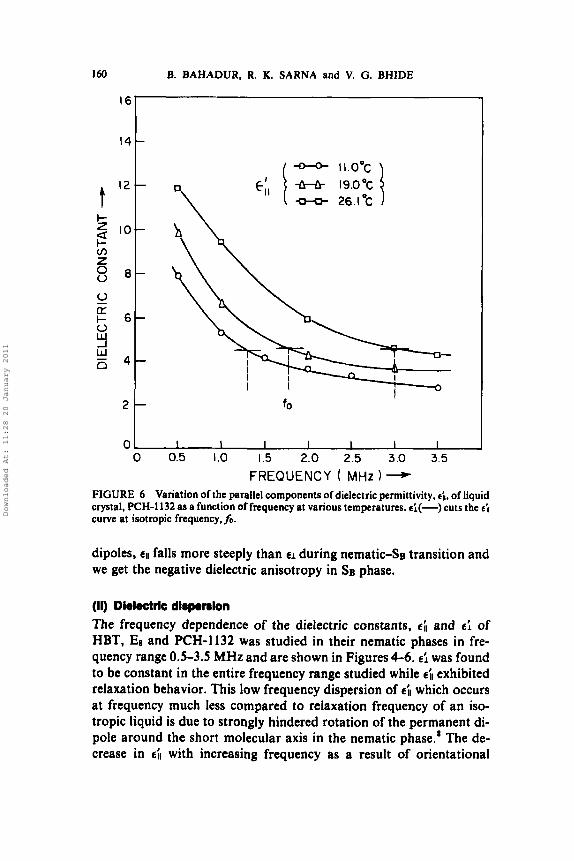
FREQUENCY ( MHz 1- FIGURE 6 Variation of the parallel components of dielectric permittivity, ei , of liquid crystal, PCH-1132 as a function of frequency at various temperatures. ci(-) cuts the ti curve at isotropic frequency,fo.
dipoles, CII falls more steeply than CI during nematic-SB transition and we get the negative dielectric anisotropy in SB phase.
(11) Dielectric dl$poHnion The frequency dependence of the dielectric constants, cif and ei of HBT, Ee and PCH-1132 was studied in their nematic phases in fre- quency range 0.5-3.5 MHz and are shown in Figures 4-6. e: was found to be constant in the entire frequency range studied while ejl exhibited relaxation behavior. This low frequency dispersion of ell which occurs at frequency much less compared to relaxation frequency of an iso- tropic liquid is due to strongly hindered rotation of the permanent di- pole around the short molecular axis in the nematic phase.* The de- crease in eil with increasing frequency as a result of orientational
Downloaded At: 11:28 20 January 2011
DIELECTRIC STUDIES OF HBT, En AND PCH-1132 161
061 ~~, ~
0 4 i = 04 I = W
0 2
0 34 36 38 40 42 44 46 34 36 38 40 42 44 46
Ef; - c:, -
W
0 2 0 2
'34 36 38 4 0 4 2 44 46
6,- E;, - FIGURE 7 and (d) 64°C.
relaxation process led to the value less than e'l at higher frequen- cies in all the three liquid crystals. Thus the dielectric anisotropy, Ae, changed its sign from positive to negative at higher frequency side. The dielectric isotropic frequencyfo, (the frequency at which eil = d) was found to increase with increase in temperature. The inversion of the sign of the dielectric anisotropy of Ee and PCH-1132 may make them suitable for use in two frequency mode operation to shorten the decay time of the di~play.~, '~~ ' ' The activation energy can be evaluated from the plot of logfo vs 1/T.
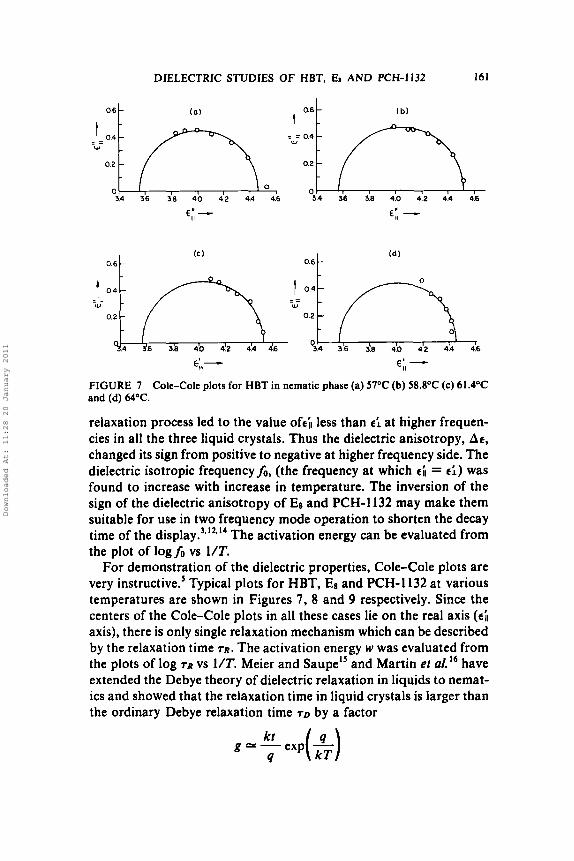
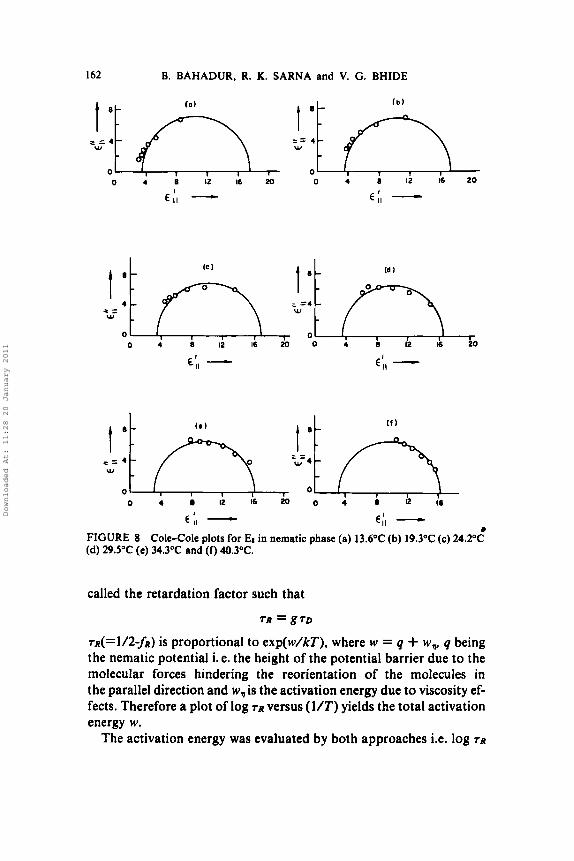
For demonstration of the dielectric properties, Cole-Cole plots are very instructive.' Typical plots for HBT, Es and PCH-1132 at various temperatures are shown in Figures 7, 8 and 9 respectively. Since the centers of the Cole-Cole plots in all these cases lie on the real axis (41 axis), there is only single relaxation mechanism which can be described by the relaxation time TR. The activation energy w was evaluated from the plots of log TR vs 1/T. Meier and Saupe" and Martin et a1.I6 have extended the Debye theory of dielectric relaxation in liquids to nemat- ics and showed that the relaxation time in liquid crystals is larger than the ordinary Debye relaxation time TO by a factor
Cole-Cole plots for HBT in nematic phase (a) 57°C (b) 58.8"C (c) 61.4"C
g = - kt exp( L) 4 kT
Downloaded At: 11:28 20 January 2011
162 B. BAHADUR, R. K. SARNA and V. G. BHIDE
8 1 f"\ ,!-;I -w- 4
t = = 4 W
0 0 4 12 1 6 x ) O 4 a 12 I6
€ ; I - €:I - b
FIGURE 8 Cole-Cole plots for En in nematic phase (a) 13.6"C (b) 19.3OC (c) 24.2"C (d) 29.5"C (e) 34.3% and (f) 40.3OC.
called the retardation factor such that
TR = g T D
TR(=1 /2 - fR) is proportional to exp(w/kT), where w = q + w , q being the nematic potential i. e. the height of the potential barrier due to the molecular forces hindering the reorientation of the molecules in the parallel direction and w, is the activation energy due to viscosity ef- fects. Therefore a plot of log TR versus (VT) yields the total activation energy w.
The activation energy was evaluated by both approaches i.e. log TR
Downloaded At: 11:28 20 January 2011

DIELECTRIC STUDIES OF HBT, En AND PCH-1132 163
0 4 8 12 16 0 4 8 12 16
€I, - Ef, - FIGURE 9 Cole-Cole plots for PCH-1132 in the nematic phase (a) 1 l0C (b) 19OC (c) 26.1OC and (d) 40.6”C.
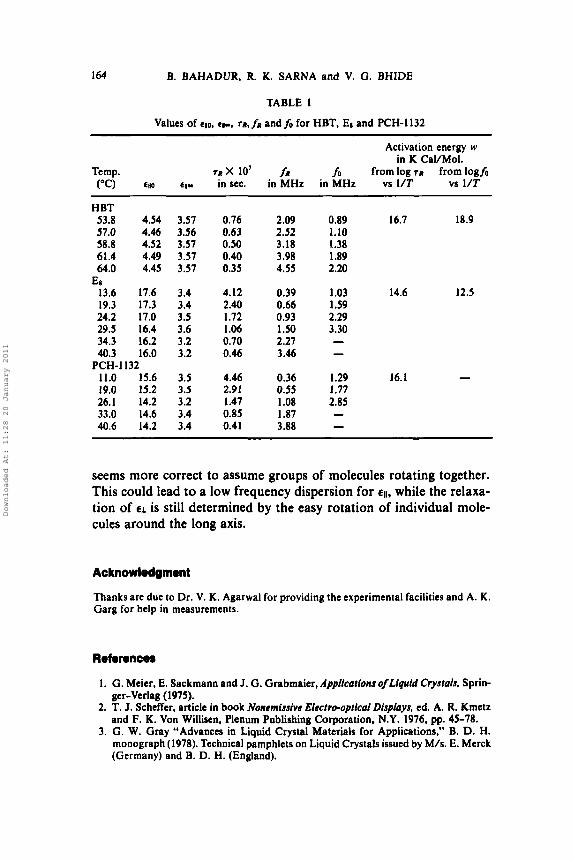
vs l/Tand logfo vs 1/Tin case of HBT and EE while only by log TR vs 1/T in case of PCH-1132 as sufficient points were not available for di- electric isotropic frequency. Both these approaches (Table I) give nearly the same value. The values of limiting dielectric permittivity at low frequency ( q o ) , the extrapolated permittivity at high frequency (ells) obtained from Cole-Cole plot and relaxation time TR obtained from Cole-Cole equation for €11 of HBT, EE and PCH-1132 at various temperatures are also given in Table I.
The physical interpretation of the energy barrier leading to the re- tardation factor g is not very clear. Some workers’,’’ have made an at- tempt to identify whether a group of molecules is rotating together or an individual molecule is rotating and is hindered in its rotation around a transverse axis because of the nematic order. Baessler et aI.” found it plausible that a rotation around a transverse axis is determined more by the short range order than by the nematic (long range) order. We feel that such a rotation will always be associated with local disorder which in turn could lead to rotation of other molecules and therefore it
Downloaded At: 11:28 20 January 2011
164 B. BAHADUR, R. K. SARNA and V. G. BHIDE
TABLE I
Values of CHO, el-, TR, fR andfo for HBT, E, and PCH-1132
Activation energy w in K CaVMol.
Temp. TR x 10’ fR fo from log ra from logfo (“C) cuo CU- in KC. in MHz in MHz vs 1/T vs 1/T
HBT 53.8 4.54 3.57 0.76 2.09 0.89 16.7 18.9 57.0 4.46 3.56 0.63 2.52 1.10 58.8 4.52 3.57 0.50 3.18 1.38 61.4 4.49 3.57 0.40 3.98 1.89 64.0 4.45 3.57 0.35 4.55 2.20
13.6 17.6 3.4 4.12 0.39 1.03 14.6 19.3 17.3 3.4 2.40 0.66 1.59 24.2 17.0 3.5 1.72 0.93 2.29 29.5 16.4 3.6 1.06 1 .so 3.30 34.3 16.2 3.2 0.70 2.27 - 40.3 16.0 3.2 0.46 3.46 - 11.0 15.6 3.5 4.46 0.36 1.29 16.1 - 19.0 15.2 3.5 2.91 0.55 1.77 26.1 14.2 3.2 1.47 1.08 2.85 33.0 14.6 3.4 0.85 1.87 - 40.6 14.2 3.4 0.41 3.88 -
E8
PCH-I 132
12.5
seems more correct to assume groups of molecules rotating together. This could lead to a low frequency dispersion for €11, while the relaxa- tion of EL is still determined by the easy rotation of individual mole- cules around the long axis.
Acknowledgment
Thanks are due to Dr. V. K. Agarwal for providing the experimental facilities and A. K. Garg for help in measurements.
Reference8
1. G. Meier, E. Sackmann and J. G. Grabmaier, Applications oflipquid Crystals, Spin- ger-Verlag (1975).
2. T. J. Scheffer, article in book Nonemissive Elcctro-optical Displays. cd. A. R. Kmetz and F. K. Von Willisen. Plenum Publishing Corporation, N.Y. 1976, pp. 45-78.
3. G. W. Gray “Advances in Liquid Crystal Materials for Applications,” B. D. H. monograph (1978). Technical pamphlets on Liquid Crystals issued by M/s. E. Merck (Germany) and B. D. H. (England).
Downloaded At: 11:28 20 January 2011
DIELECTRIC STUDIES OF HBT, Ea AND PCH-1132 165
4. W. H. de Jeu, “Dielectric Permittivity of Liquid Crystals,” Solid State Physics Suppl. 14. 109 (1978).
5. N. E. Hill, W. E. Vaugan. A. H. Price and M. Davis, Dielectric Properties andMolec- ular Behaviour, Von Nostrand Reinhold Co., London (1969). C. P. Smyth Dielecrric Behaviour and Srructure, McGraw Hill, N.Y. (1955).
6. B. Bahadur, J. Chem. Phys.. 67,3272 (1977). 7. W. H. de Jeu and Th. W. Lathouwers. Mol. Cryst. Liq. Cryst., 26,225 (1974). 8. W. Maier and G. Meier, Z. Naturforch., 16~. 262 (1961). 9. S. Chandrasekhar, “Liquid Crystals,’’ Rep. Prog. Phys., 39, 613 (1976). 10. W. H. de Jeu, W. J. A. Goosens and P. Bordewijk, J. Chem. Phys., 61,1985 (1974). 11. R. K. Sarna, B. Bahadur and V. G. Bhide, Mole. Crysr. Liq. Cryst., 51, 117 (1979). 12. C. J. Gerritsma, C. Z. Von Doom and P. Van Zanten, Phys. Lett.. 44,263 (1974). 13. W. Haase and D. Potwch, Mol. Cryst. Liq. Cryst., 38, 77 (1977). 14. E. Merck, Data Sheet on Licristal 108$; G . K. Gupta, V. K. Agarwal and B. Ba-
IS. G. Meir and A. Saupe, Mol. Cryst. Liq. Cryst., 1, 515 (1966). 16. A. J. Martin, G. Meier and A. Saupe, Symp. Firad Soc., 5 , 119 (1971). 17. H. Baessler, R. B. Beard and M. M. Labes, J. Chem. Phys., 52, 2292 (1970).
hadur, J. Chem. Phys., 71,5290 (1979).
Downloaded At: 11:28 20 January 2011


![P2041 [Total No. of Pages : 2 [5059]-646 - dypietambi.com COMP 2012.pdfTotal No. of Questions : 12] [Total No. of Pages : 2 [5059]-645 ! " P2040. " 3 / $ $ ! "](https://img.pdfslide.us/doc/110x75/5e69af20afe4db6564470c8a/p2041-total-no-of-pages-2-5059-646-comp-2012pdf-total-no-of-questions.jpg)


![Molecular Crystals and Liquid Crystals Electromechanical ...repository.ias.ac.in/20876/1/20876.pdf36/[966] N. V. MADHUSUDANA, R. PRATIBHA AND H. P. PADMINI of two liquid crystals which](https://img.pdfslide.us/doc/110x75/6127e489284f7143e9408e6e/molecular-crystals-and-liquid-crystals-electromechanical-36966-n-v-madhusudana.jpg)