Embed Size (px)
Citation preview
Bioenergetics I
Professor Michael Chorney
Susquehanna MAGNET
January 27, 2014
LO’s
• Discuss the first two laws of
thermodynamics
• Describe entropy and Gibbs free energy
• Explain why ATP is so important to life
• Discuss the activated carriers critical for
electron and atom transfer
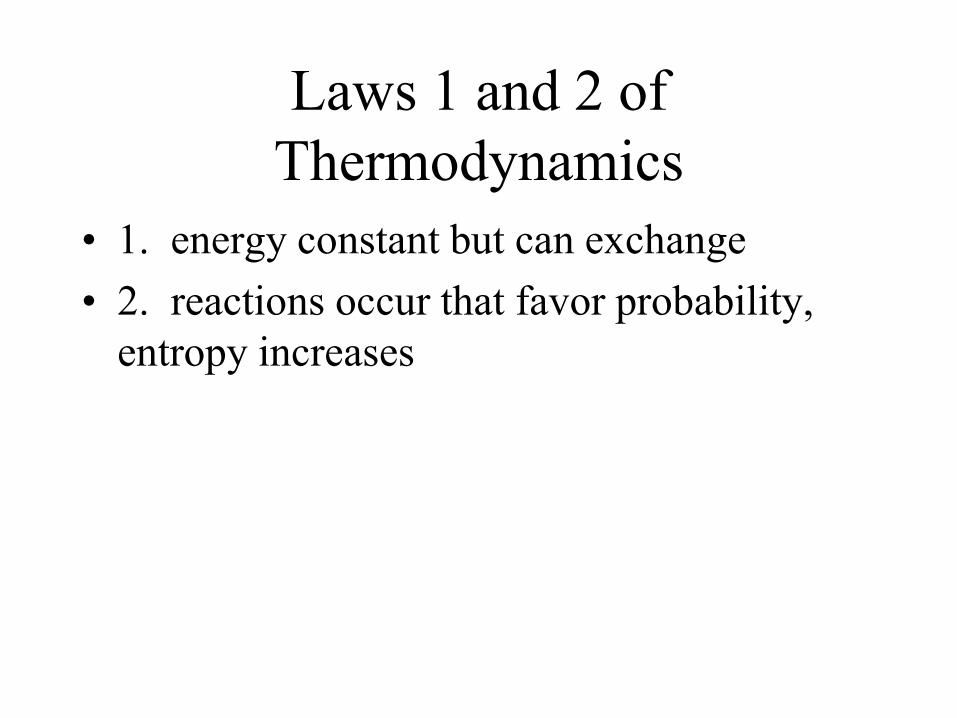
Laws 1 and 2 of
Thermodynamics
• 1. energy constant but can exchange
• 2. reactions occur that favor probability,
entropy increases
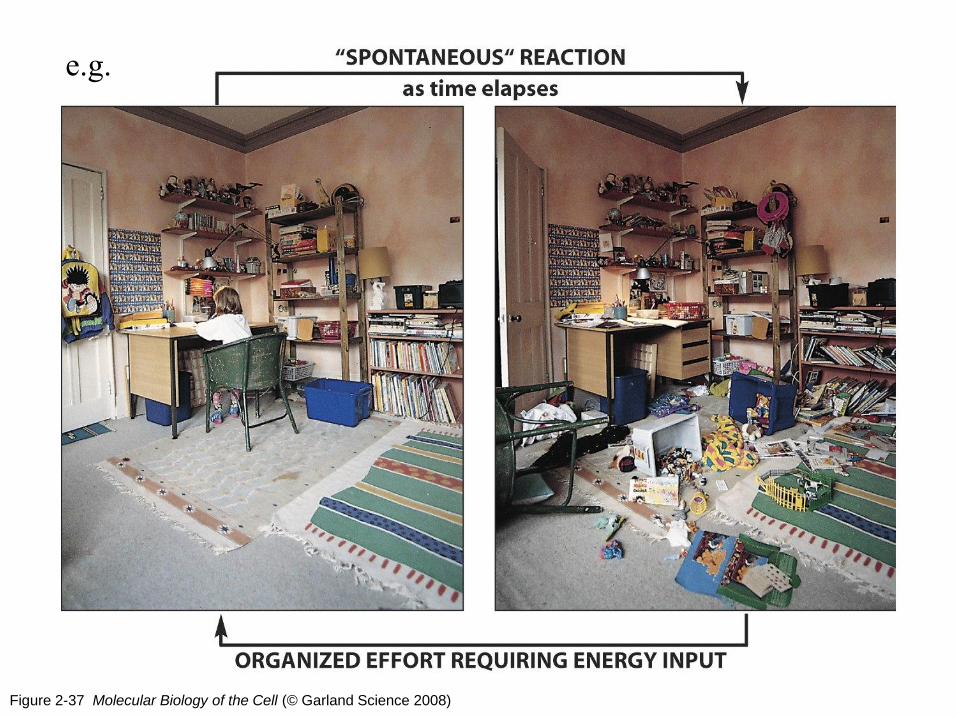
Figure 2-37 Molecular Biology of the Cell (© Garland Science 2008)
e.g.
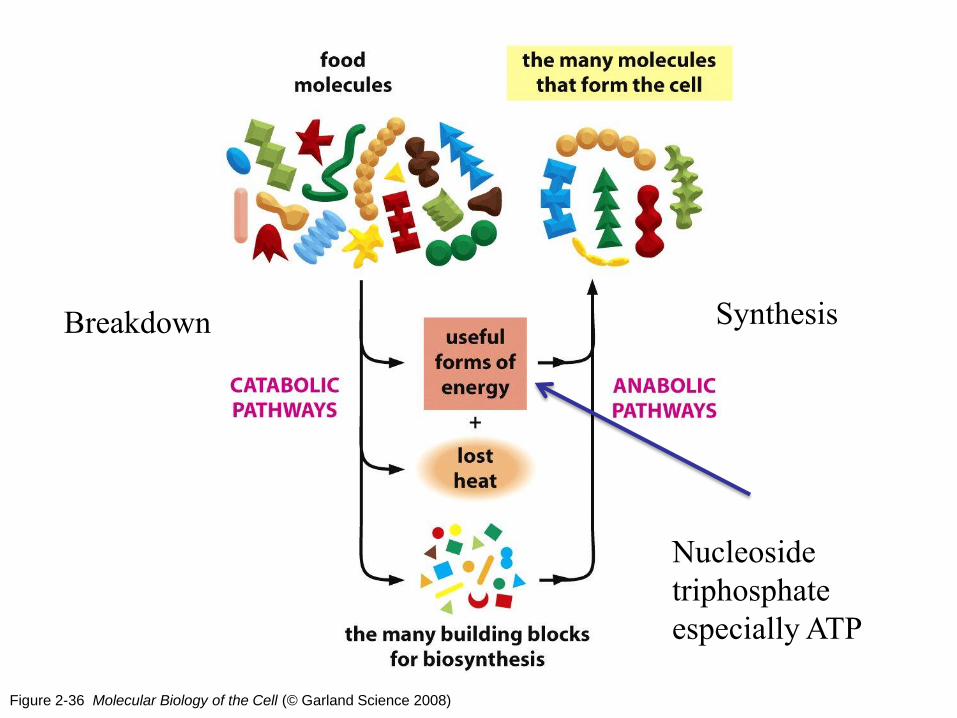
Figure 2-36 Molecular Biology of the Cell (© Garland Science 2008)
Breakdown Synthesis
Nucleoside
triphosphate
especially ATP
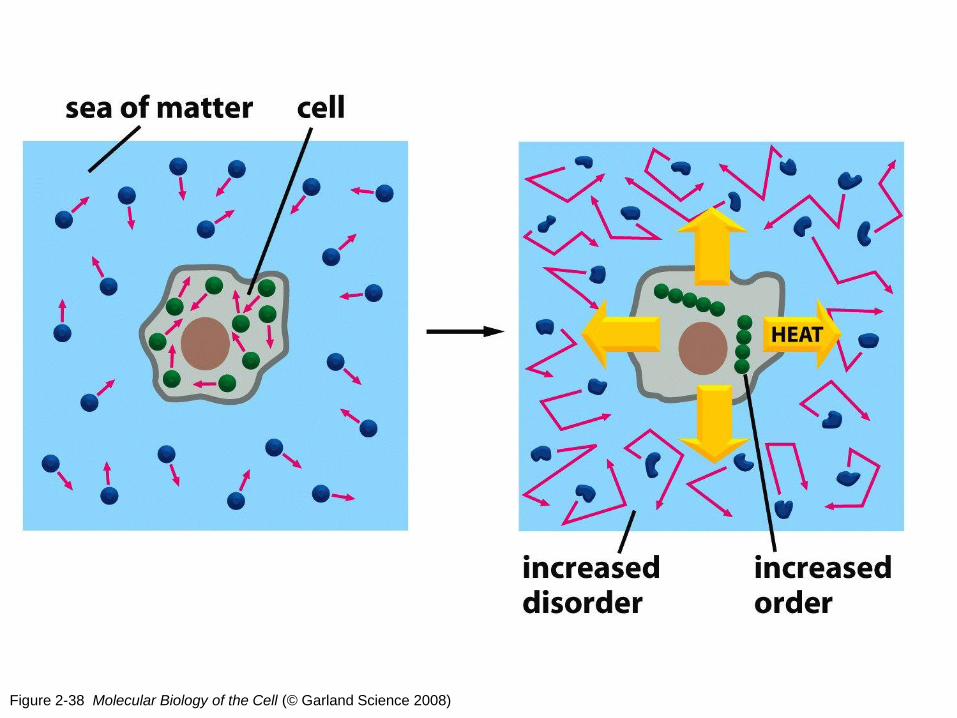
Figure 2-38 Molecular Biology of the Cell (© Garland Science 2008)
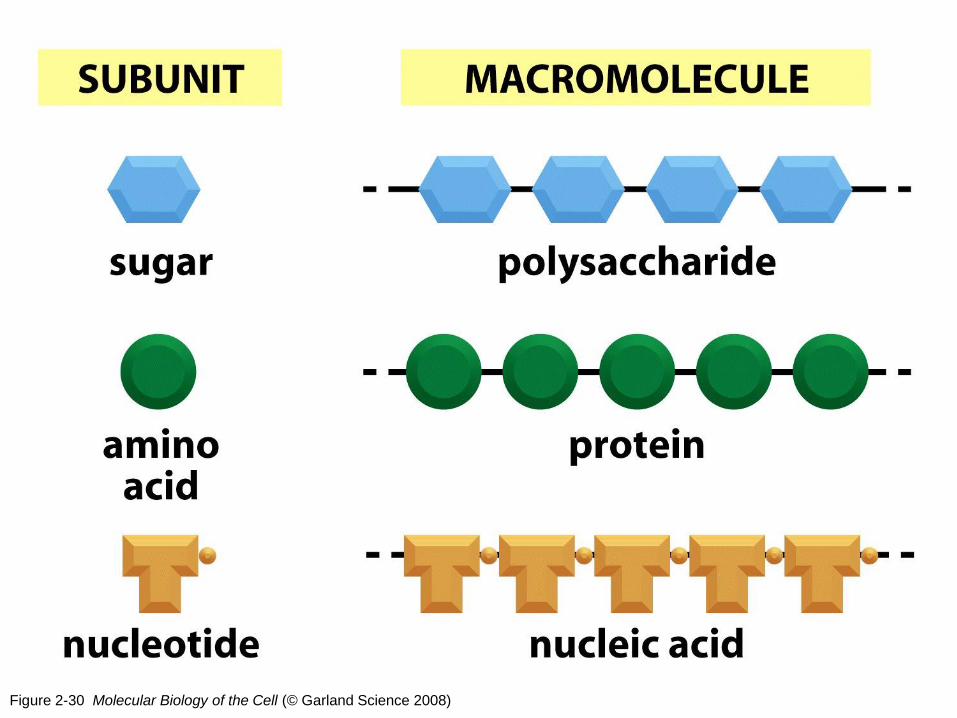
Figure 2-30 Molecular Biology of the Cell (© Garland Science 2008)
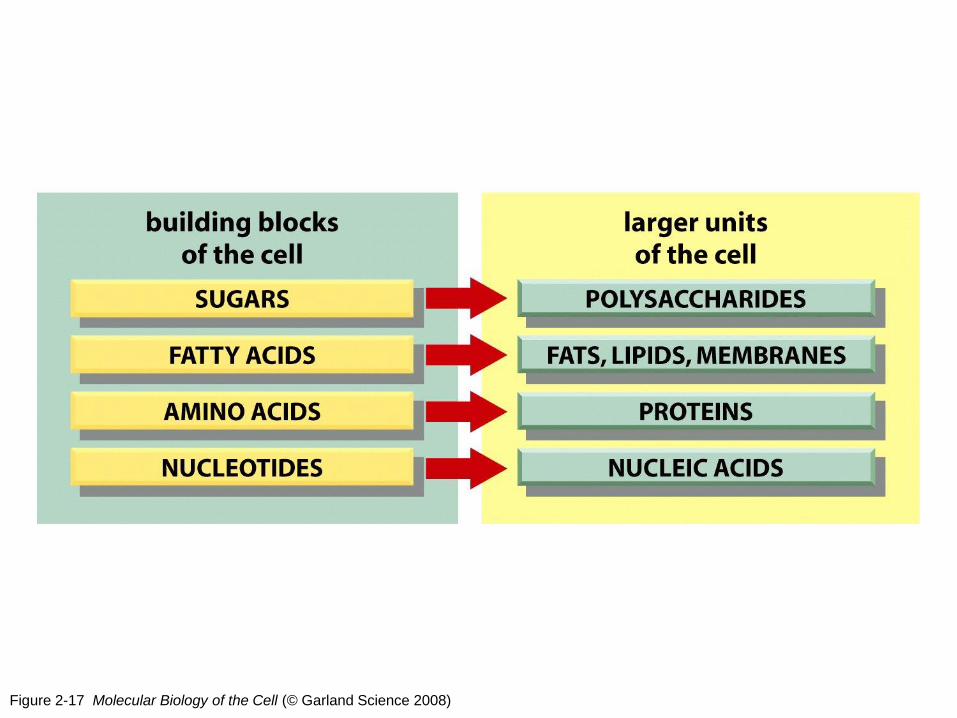
Figure 2-17 Molecular Biology of the Cell (© Garland Science 2008)
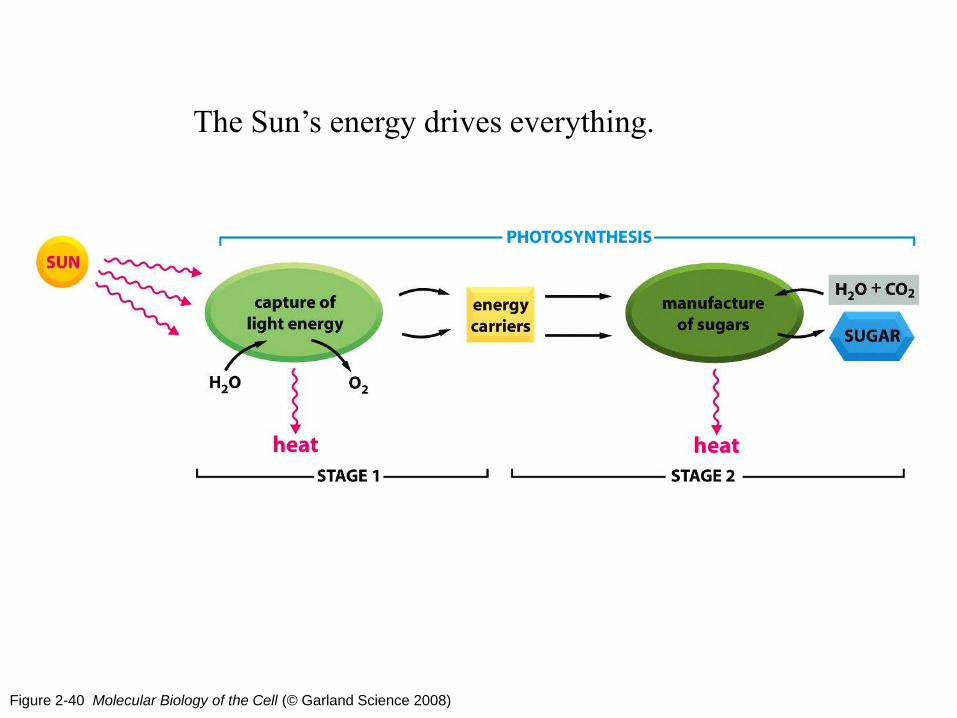
Figure 2-40 Molecular Biology of the Cell (© Garland Science 2008)
The Sun’s energy drives everything.
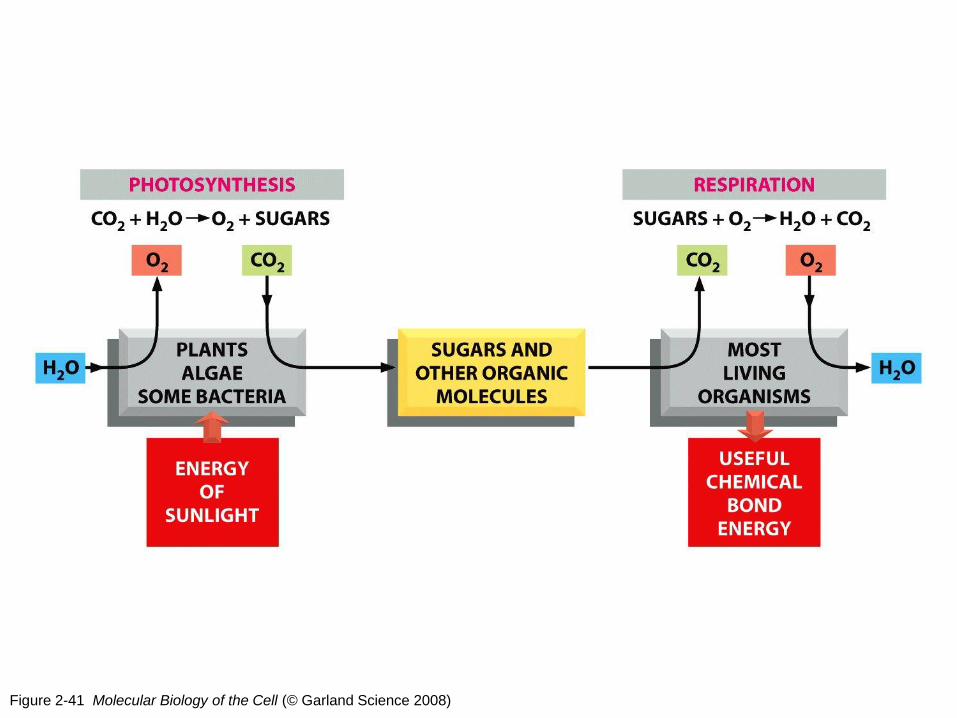
Figure 2-41 Molecular Biology of the Cell (© Garland Science 2008)
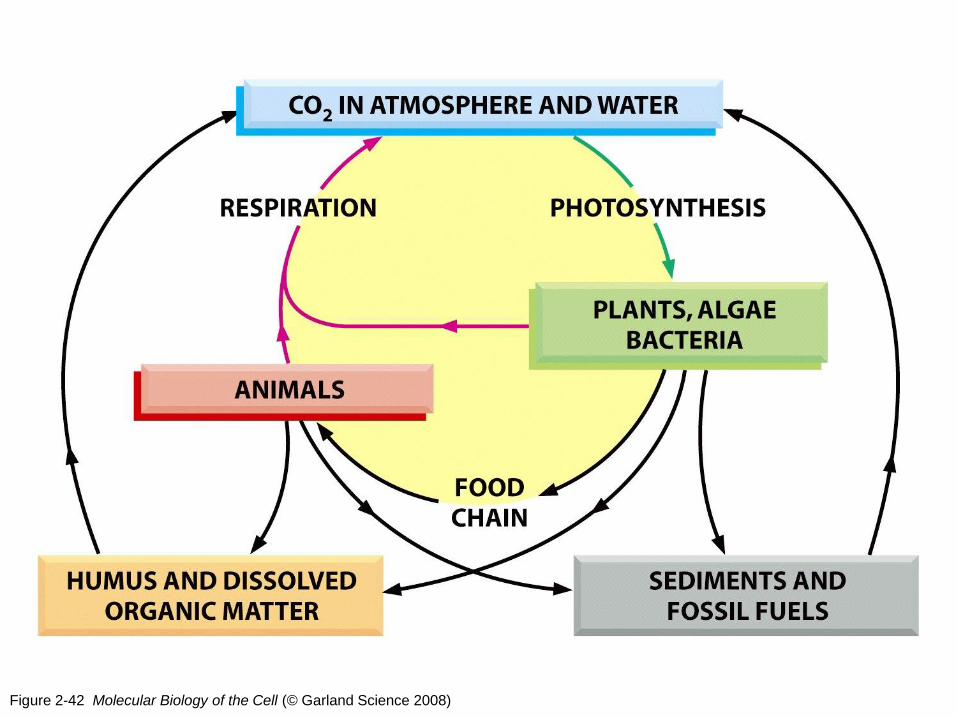
Figure 2-42 Molecular Biology of the Cell (© Garland Science 2008)

Gibb’s Free Energy of a Reaction
<1 exergonic, spontaneous, energy released
0
>1 endergonic, unfavorable, energy required
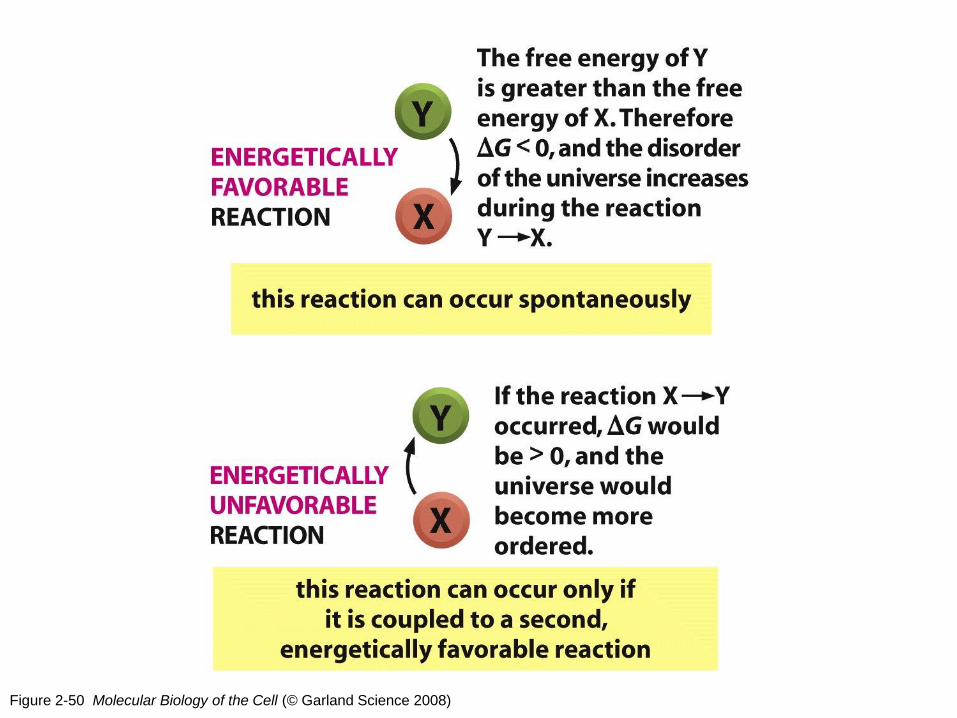
Figure 2-50 Molecular Biology of the Cell (© Garland Science 2008)
The cell creates order through a myriad of
unfavorable reactions coupled to favorable
reactions through the exploitation of activated
carriers like ATP and others
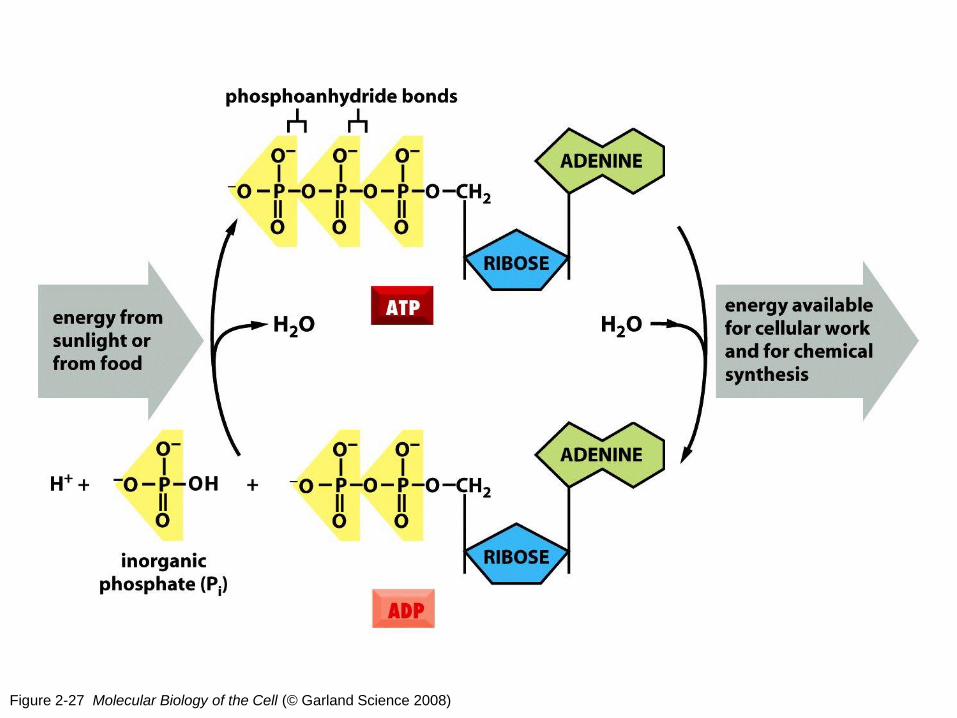
Figure 2-27 Molecular Biology of the Cell (© Garland Science 2008)
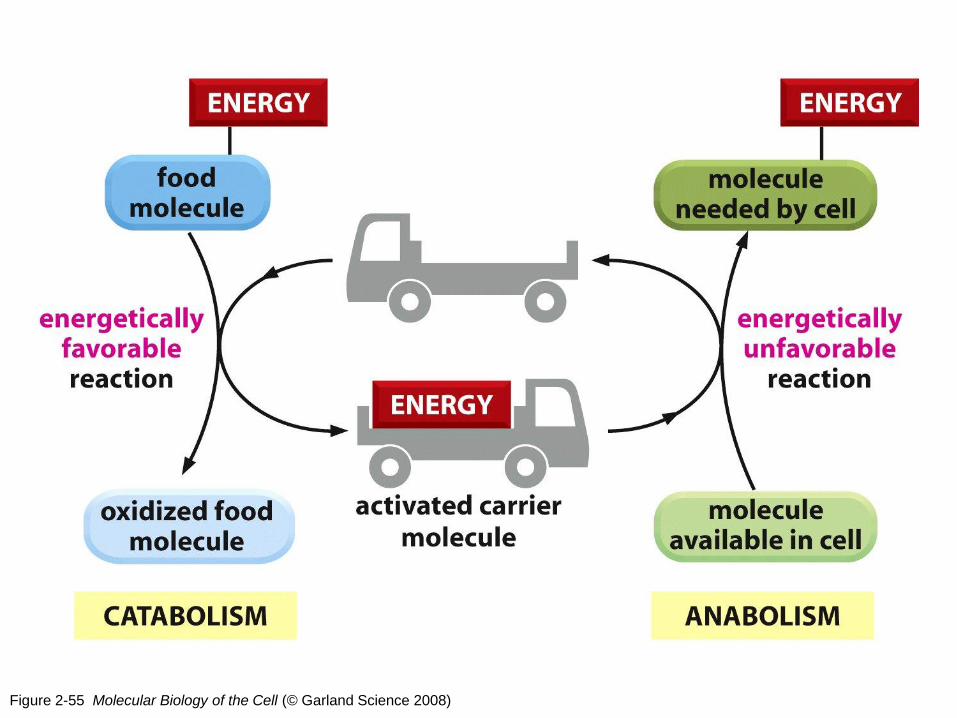
Figure 2-55 Molecular Biology of the Cell (© Garland Science 2008)
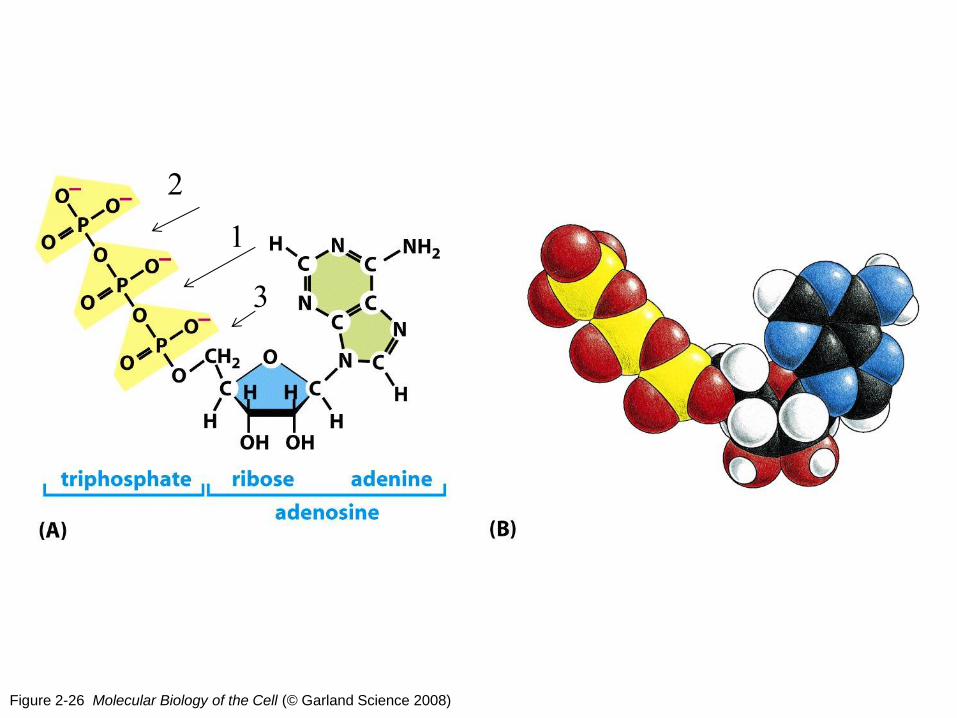
Figure 2-26 Molecular Biology of the Cell (© Garland Science 2008)
1
2
3
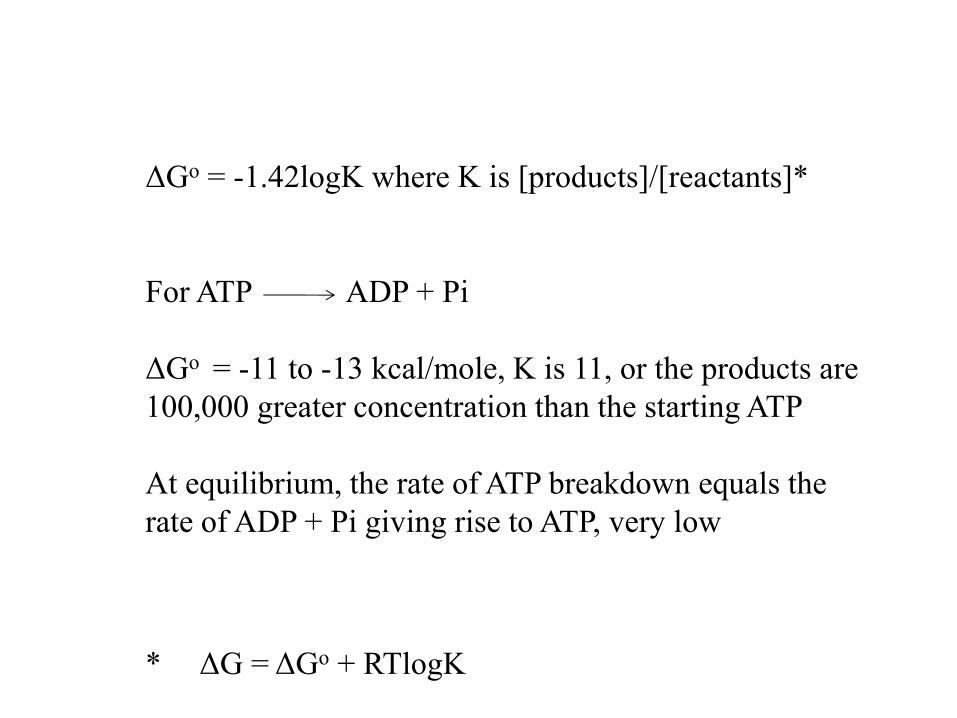
ΔGo = -1.42logK where K is [products]/[reactants]*
For ATP ADP + Pi
ΔGo = -11 to -13 kcal/mole, K is 11, or the products are
100,000 greater concentration than the starting ATP
At equilibrium, the rate of ATP breakdown equals the
rate of ADP + Pi giving rise to ATP, very low
* ΔG = ΔGo + RTlogK
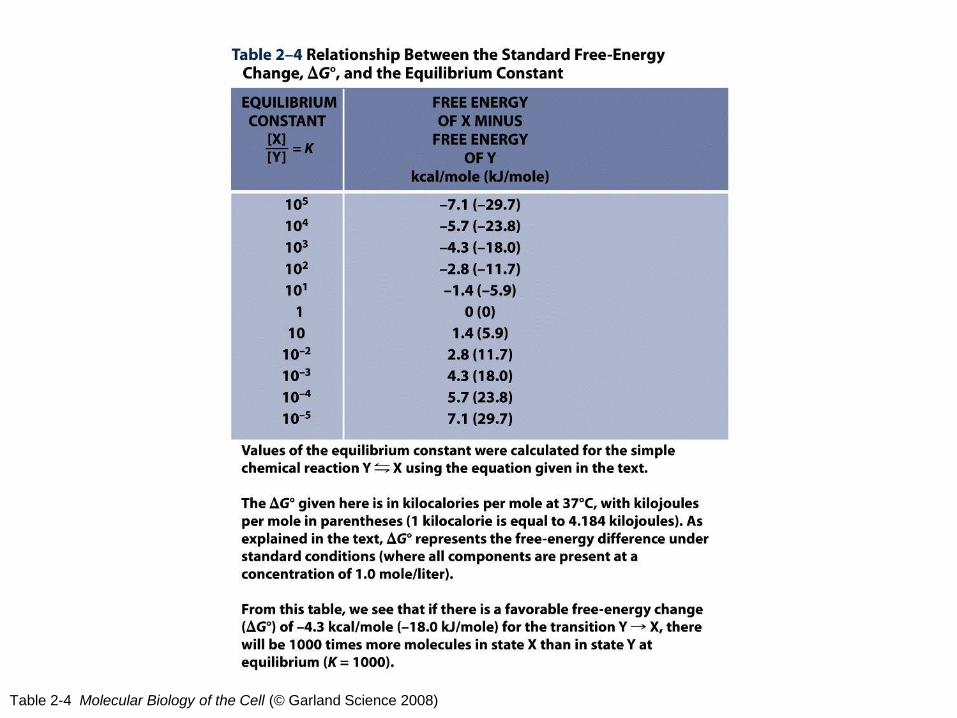
Table 2-4 Molecular Biology of the Cell (© Garland Science 2008)
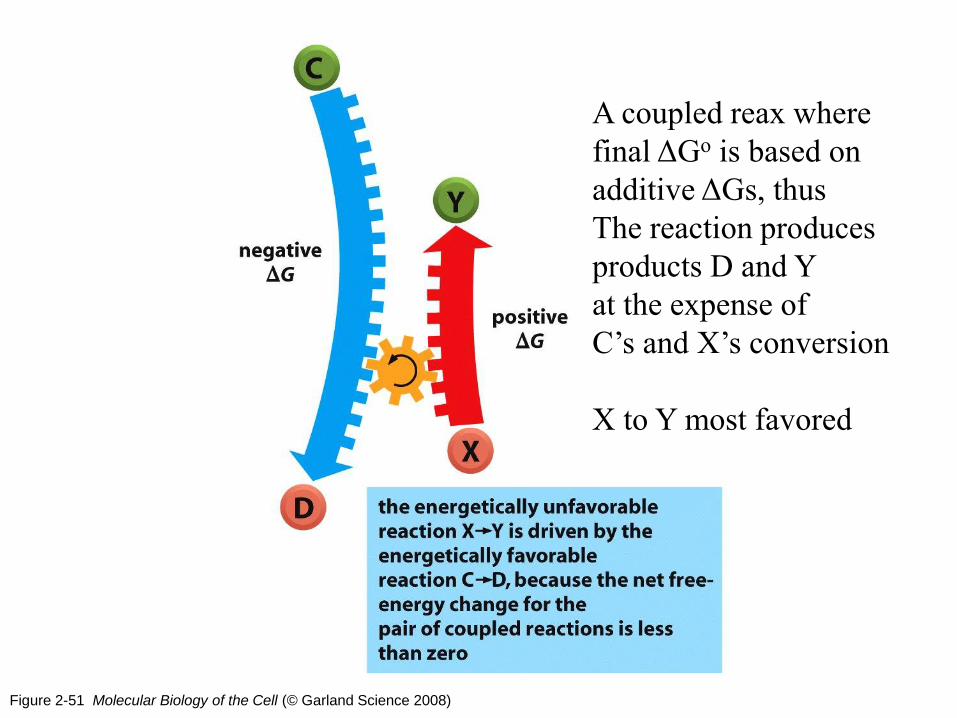
Figure 2-51 Molecular Biology of the Cell (© Garland Science 2008)
A coupled reax where
final ΔGo is based on
additive ΔGs, thus
The reaction produces
products D and Y
at the expense of
C’s and X’s conversion
X to Y most favored

Figure 2-54 Molecular Biology of the Cell (© Garland Science 2008)
Note the change in
Equilibria denoted by the
arrows
If X to Y is slow, but Y to Z fast, the sequential reax’s deplete X, Y
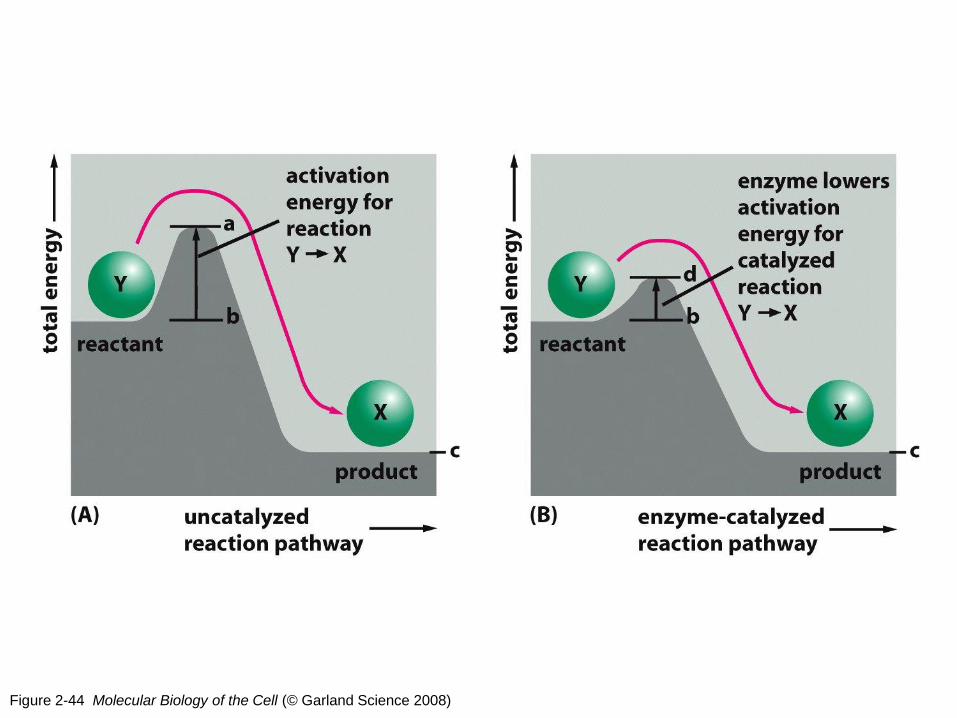
Figure 2-44 Molecular Biology of the Cell (© Garland Science 2008)
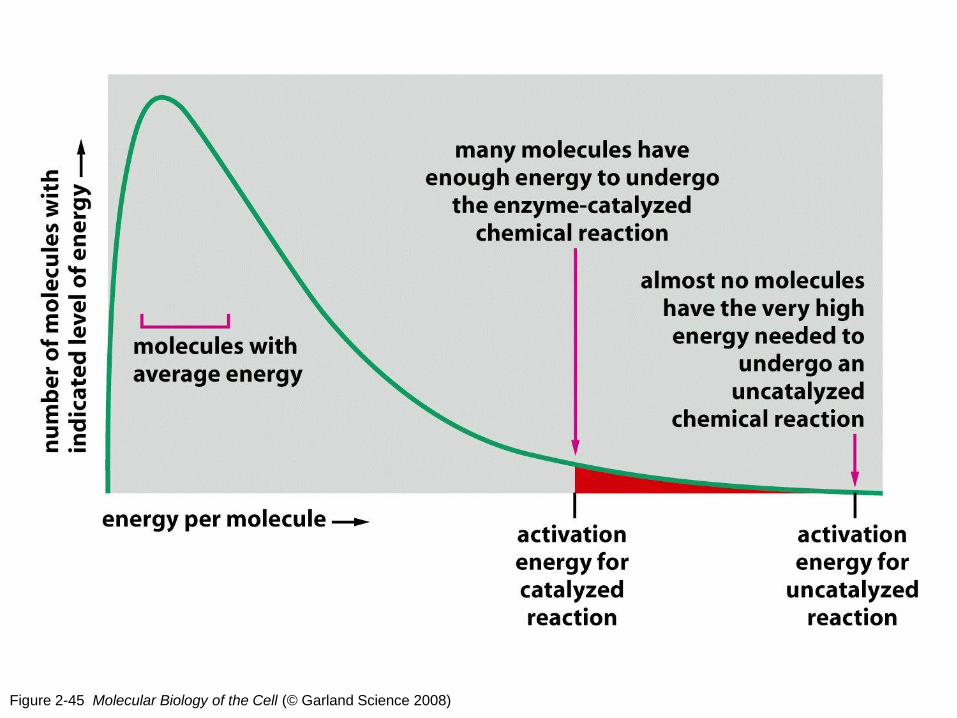
Figure 2-45 Molecular Biology of the Cell (© Garland Science 2008)
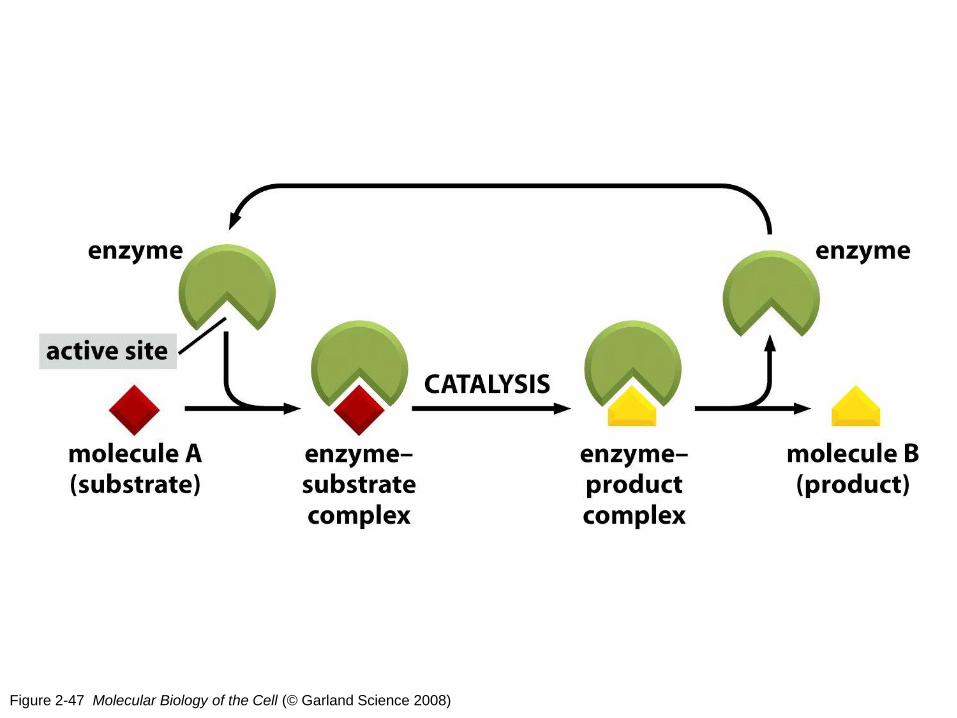
Figure 2-47 Molecular Biology of the Cell (© Garland Science 2008)
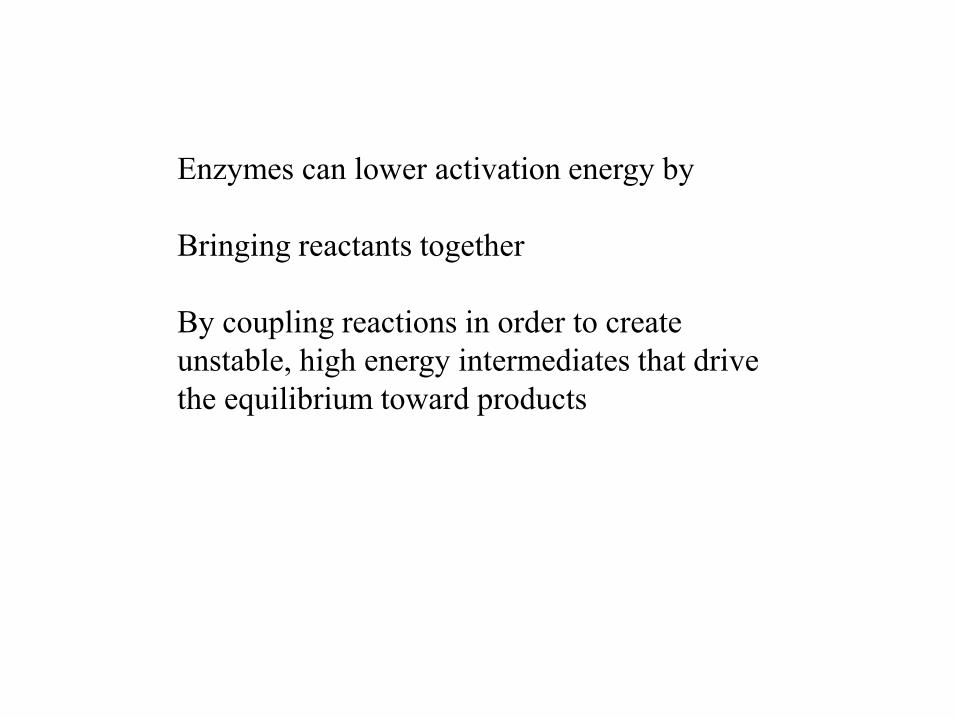
Enzymes can lower activation energy by
Bringing reactants together
By coupling reactions in order to create
unstable, high energy intermediates that drive
the equilibrium toward products
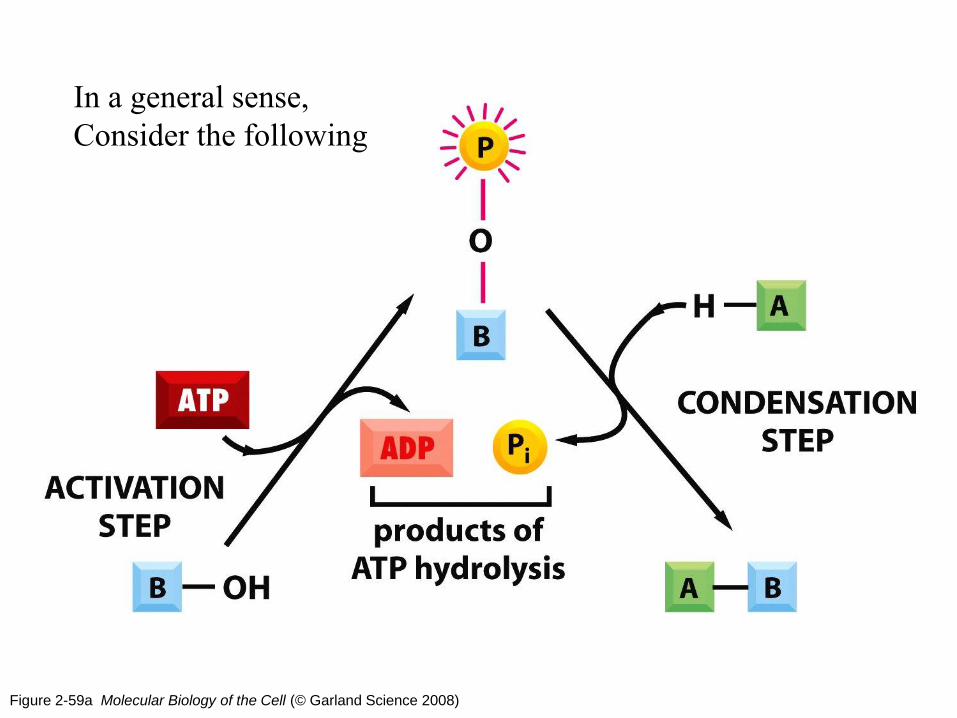
Figure 2-59a Molecular Biology of the Cell (© Garland Science 2008)
In a general sense,
Consider the following
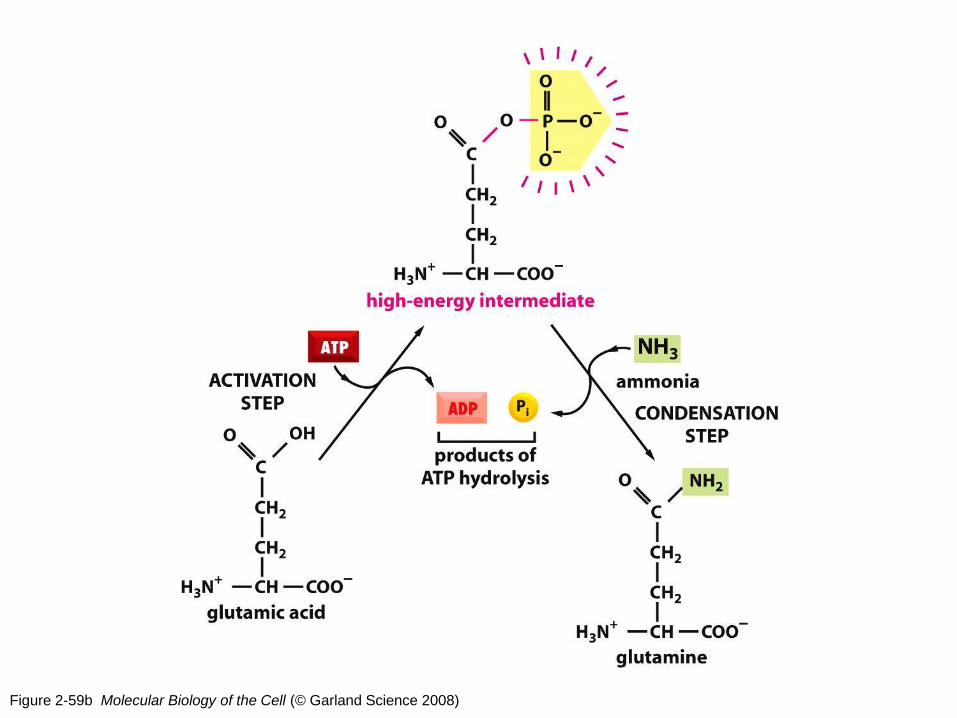
Figure 2-59b Molecular Biology of the Cell (© Garland Science 2008)
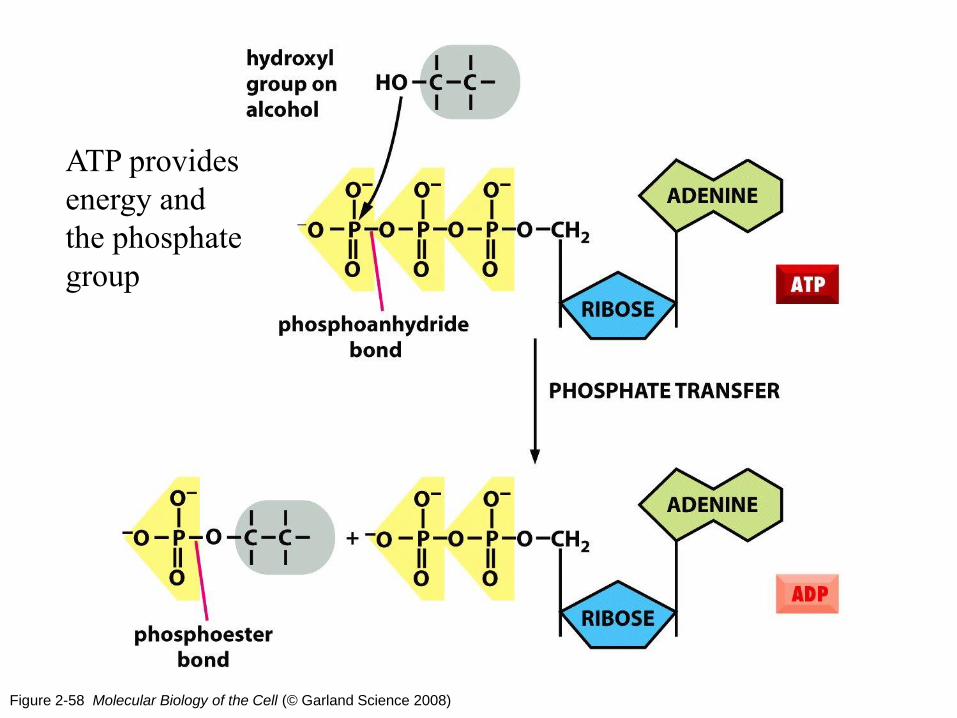
Figure 2-58 Molecular Biology of the Cell (© Garland Science 2008)
ATP provides
energy and
the phosphate
group
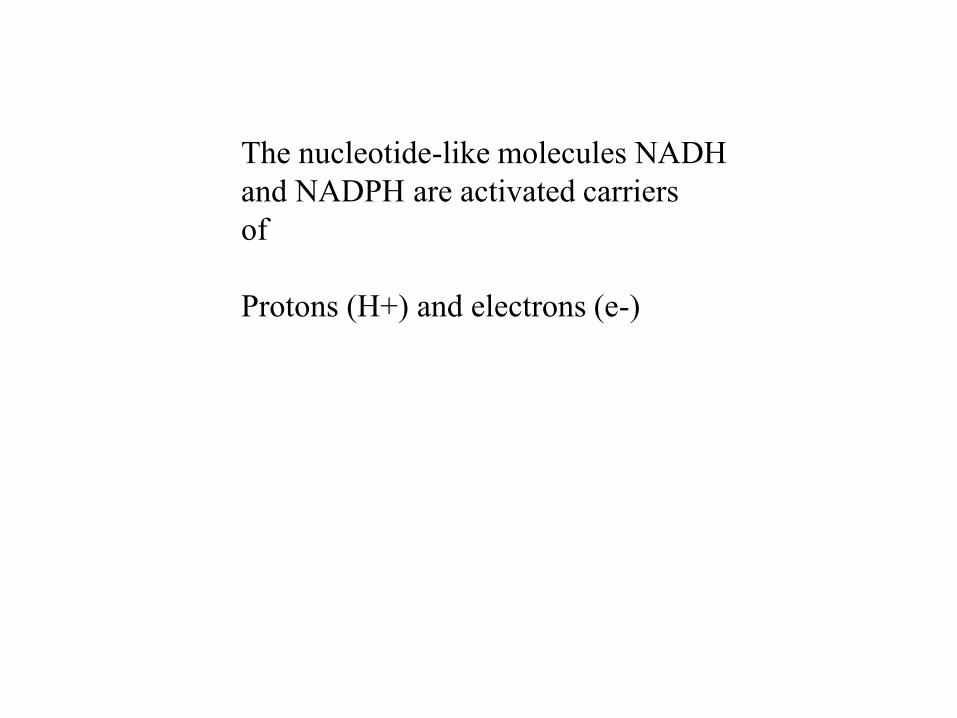
The nucleotide-like molecules NADH
and NADPH are activated carriers
of
Protons (H+) and electrons (e-)
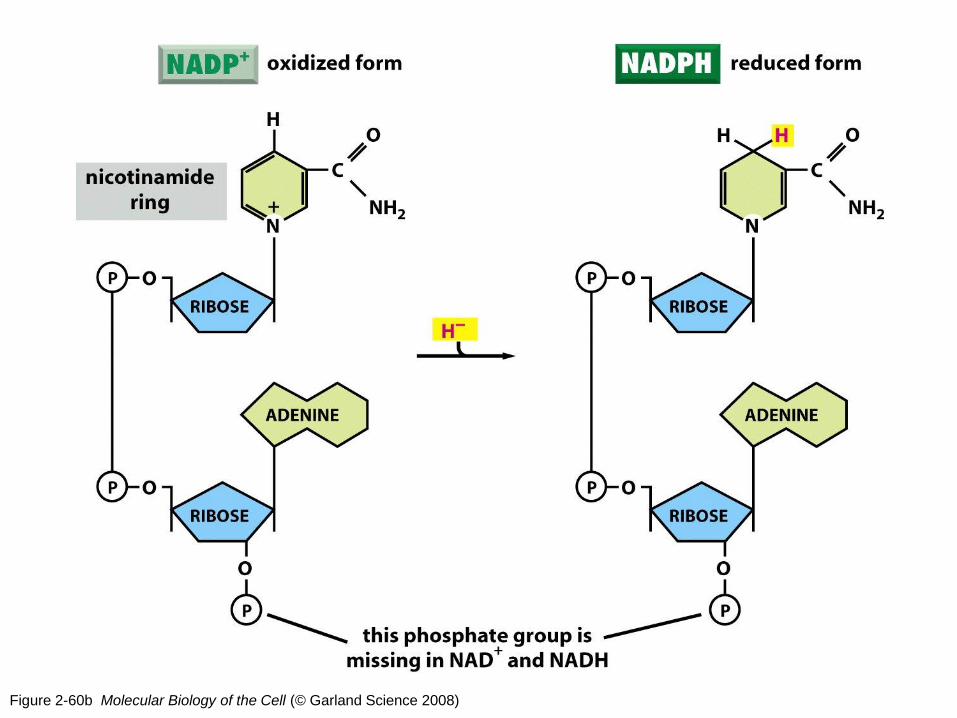
Figure 2-60b Molecular Biology of the Cell (© Garland Science 2008)
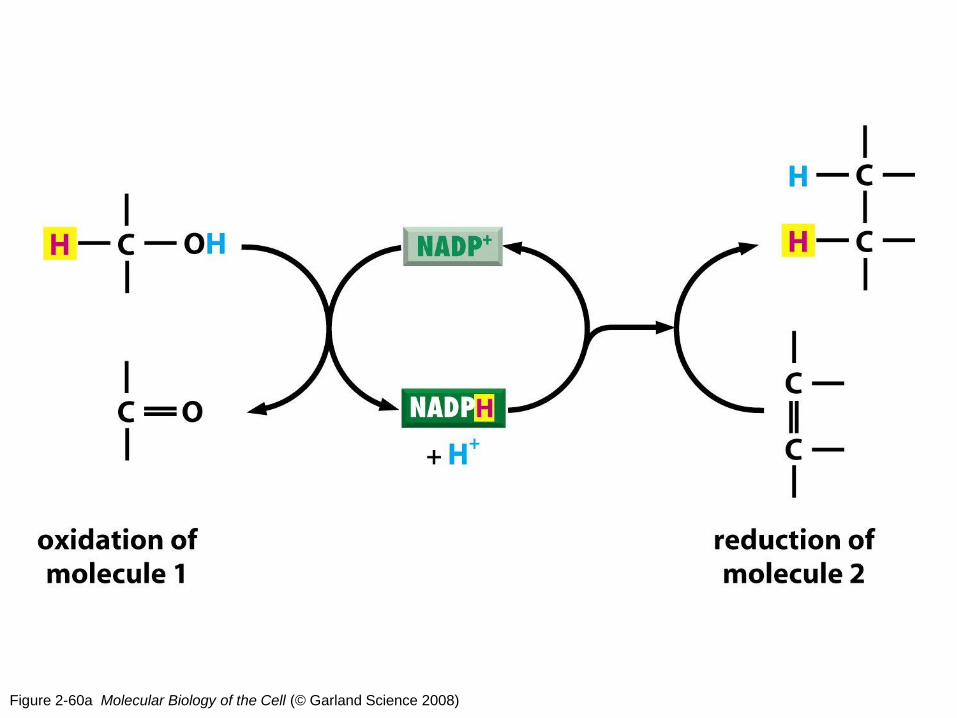
Figure 2-60a Molecular Biology of the Cell (© Garland Science 2008)
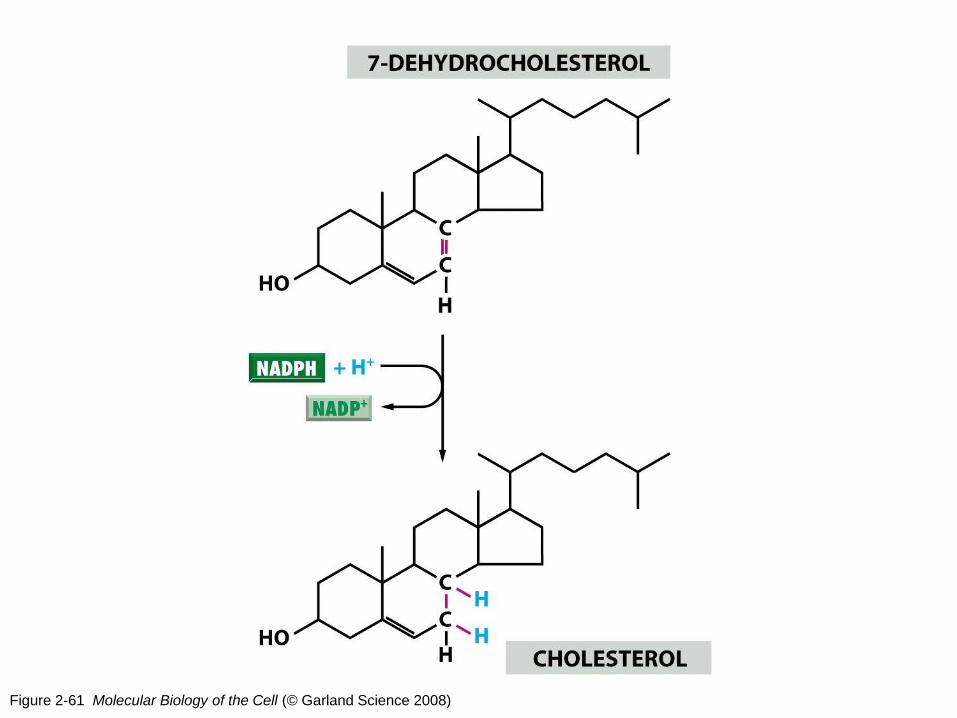
Figure 2-61 Molecular Biology of the Cell (© Garland Science 2008)
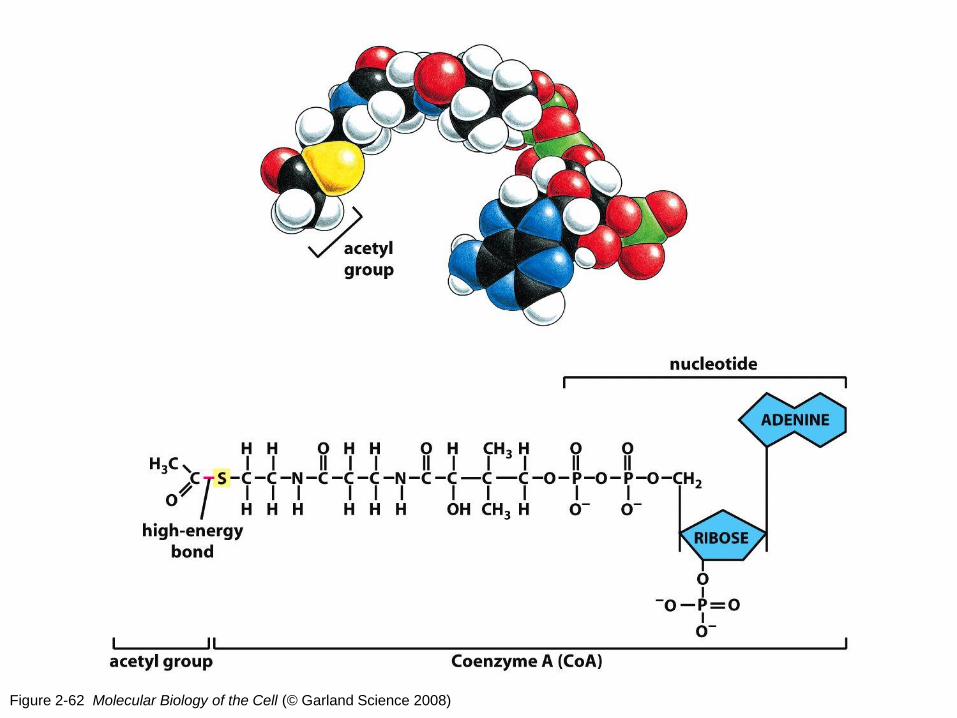
Figure 2-62 Molecular Biology of the Cell (© Garland Science 2008)
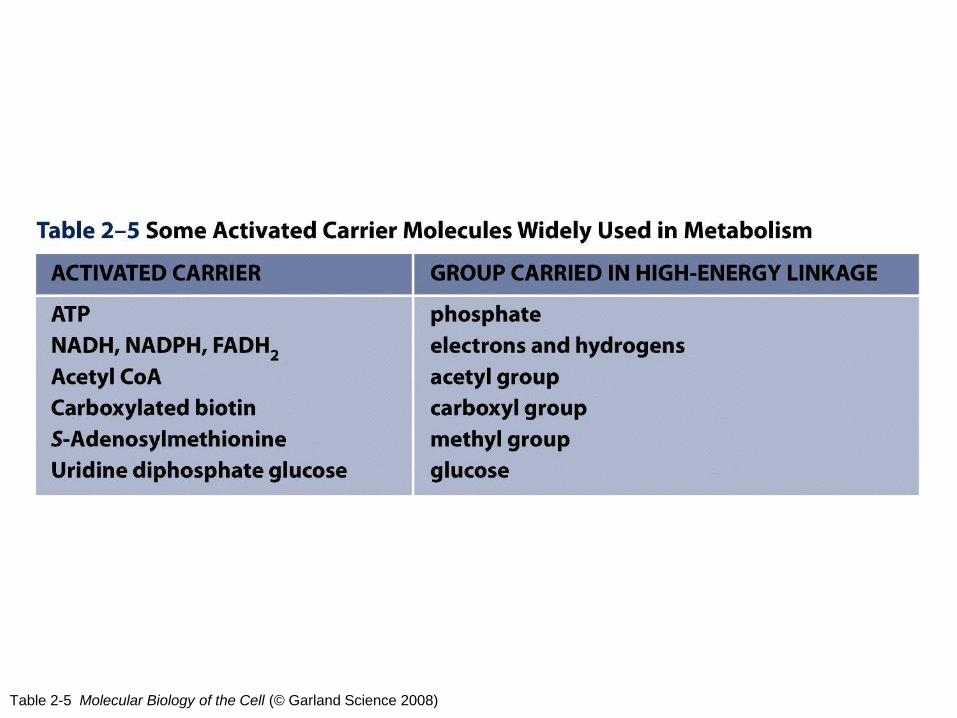
Table 2-5 Molecular Biology of the Cell (© Garland Science 2008)
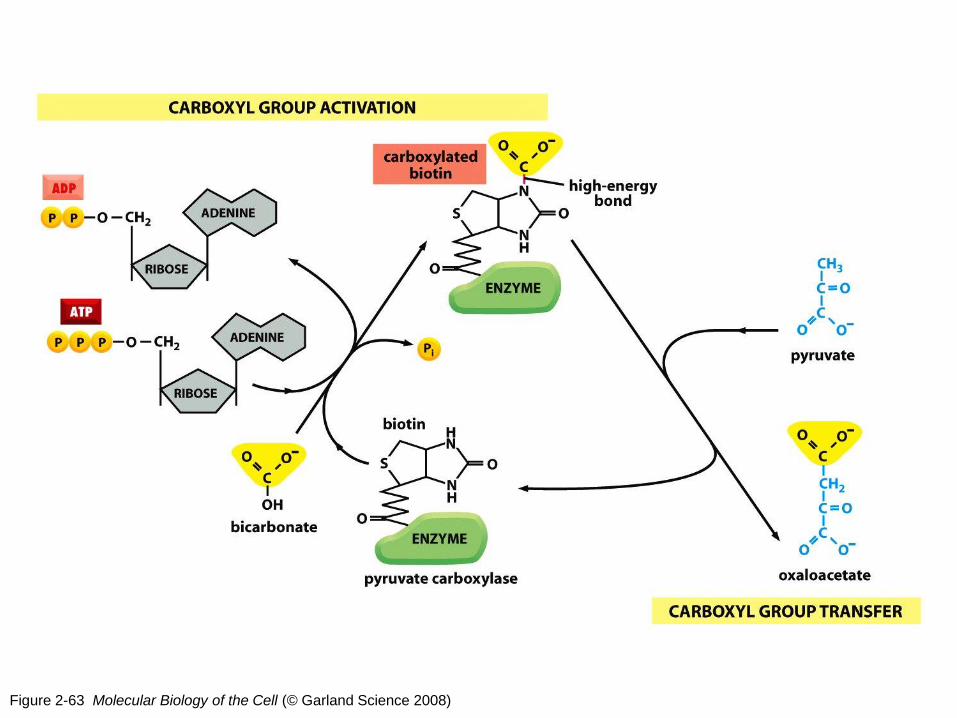
Figure 2-63 Molecular Biology of the Cell (© Garland Science 2008)
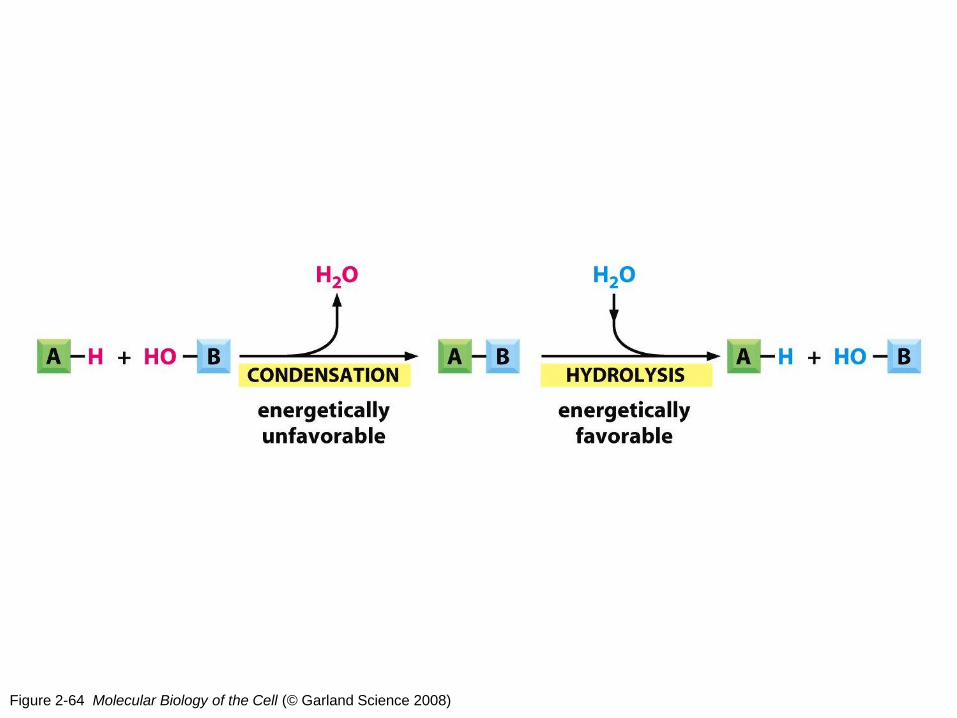
Figure 2-64 Molecular Biology of the Cell (© Garland Science 2008)
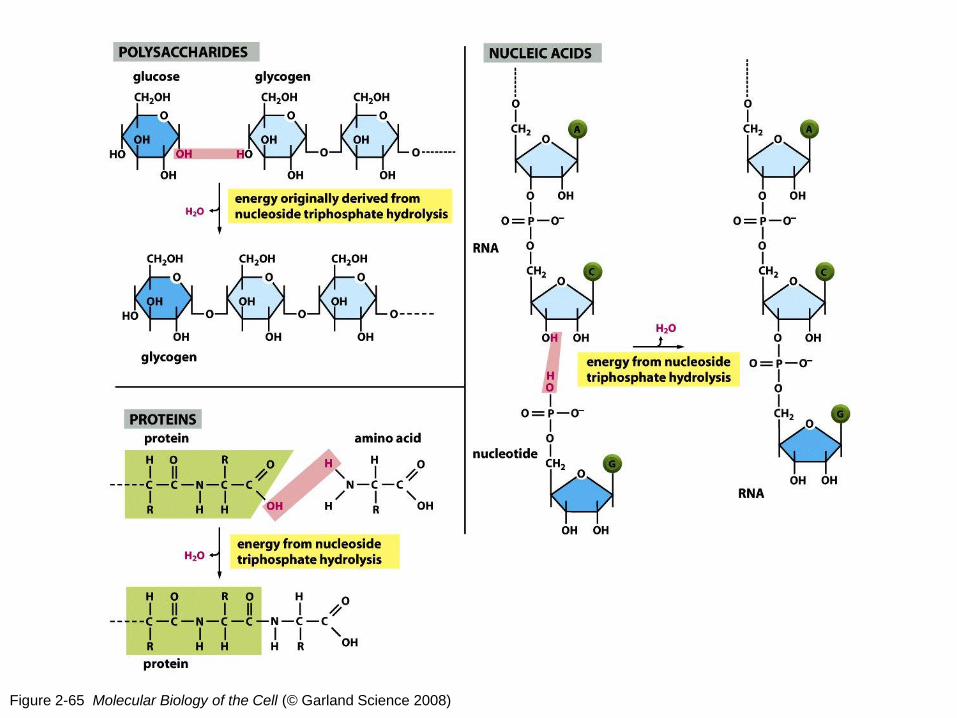
Figure 2-65 Molecular Biology of the Cell (© Garland Science 2008)
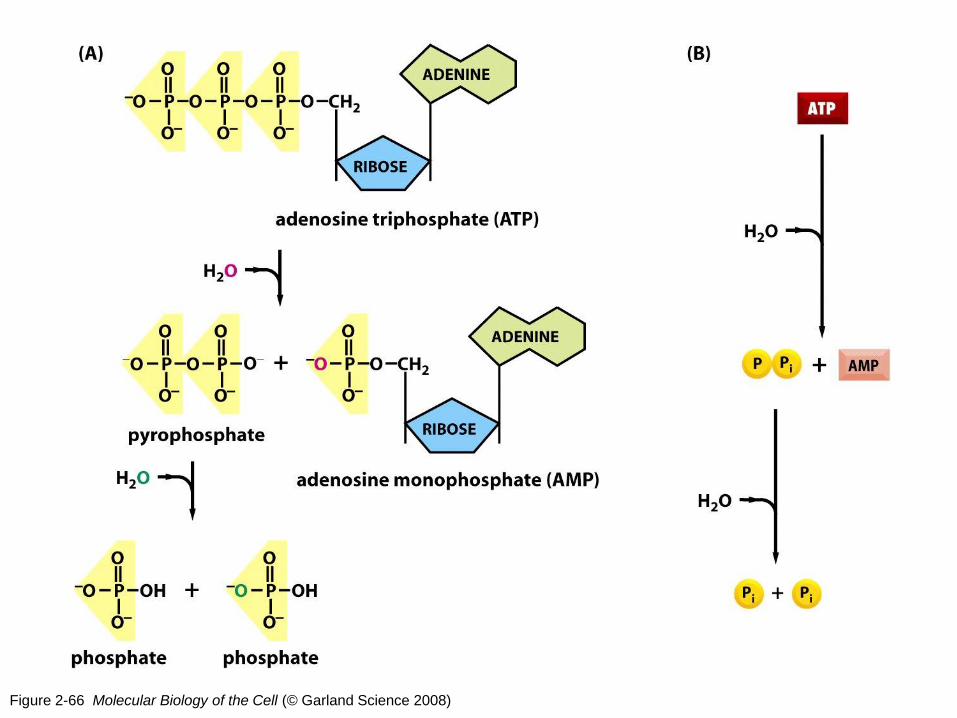
Figure 2-66 Molecular Biology of the Cell (© Garland Science 2008)

Figure 2-67 Molecular Biology of the Cell (© Garland Science 2008)
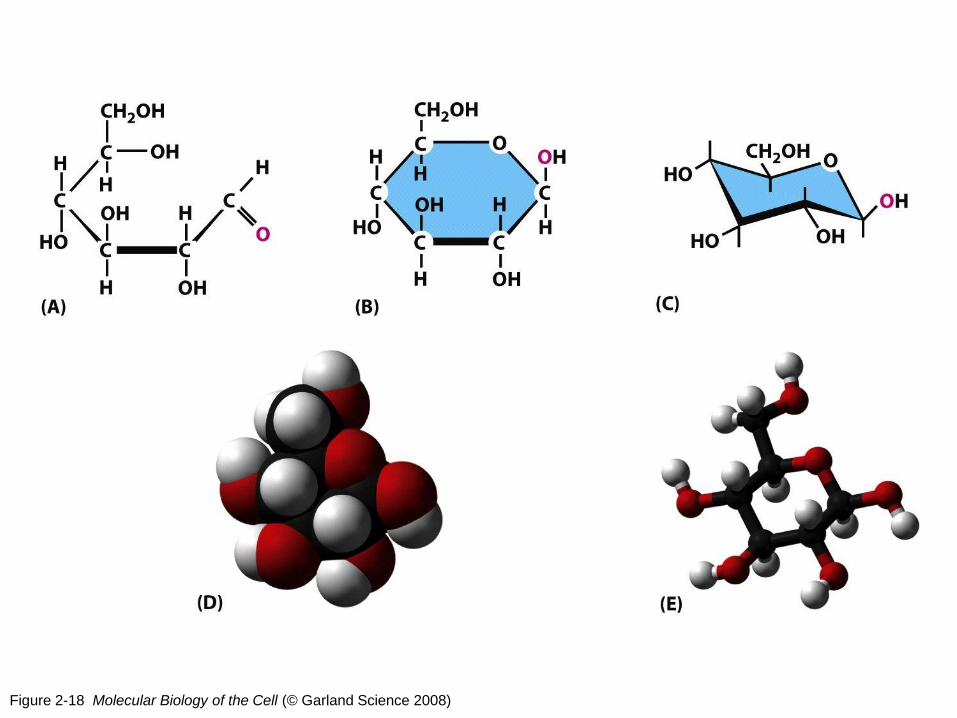
Figure 2-18 Molecular Biology of the Cell (© Garland Science 2008)
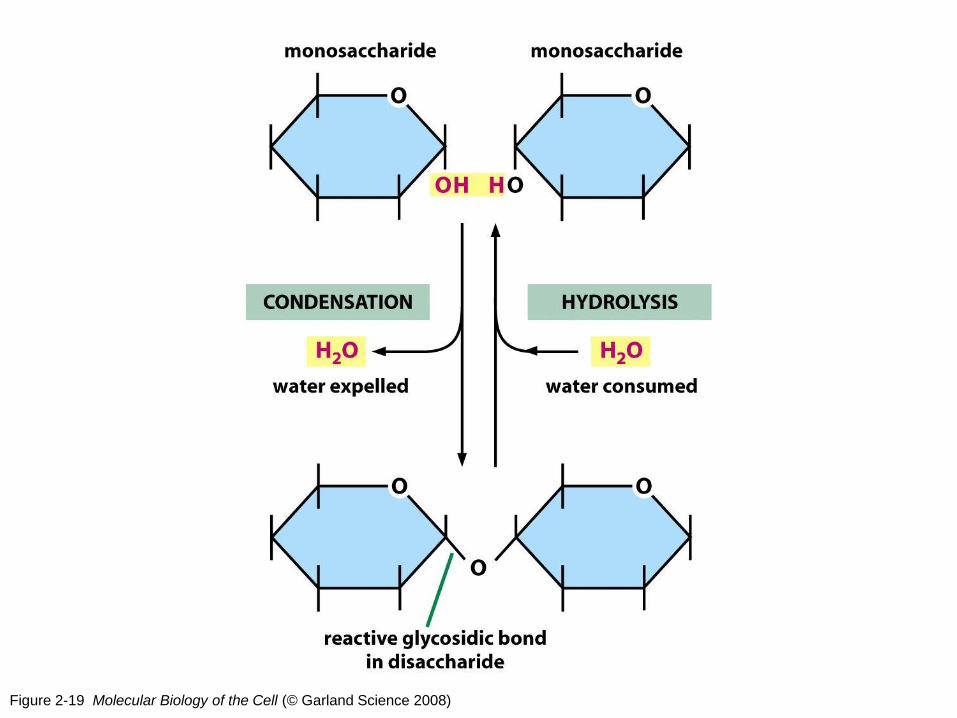
Figure 2-19 Molecular Biology of the Cell (© Garland Science 2008)
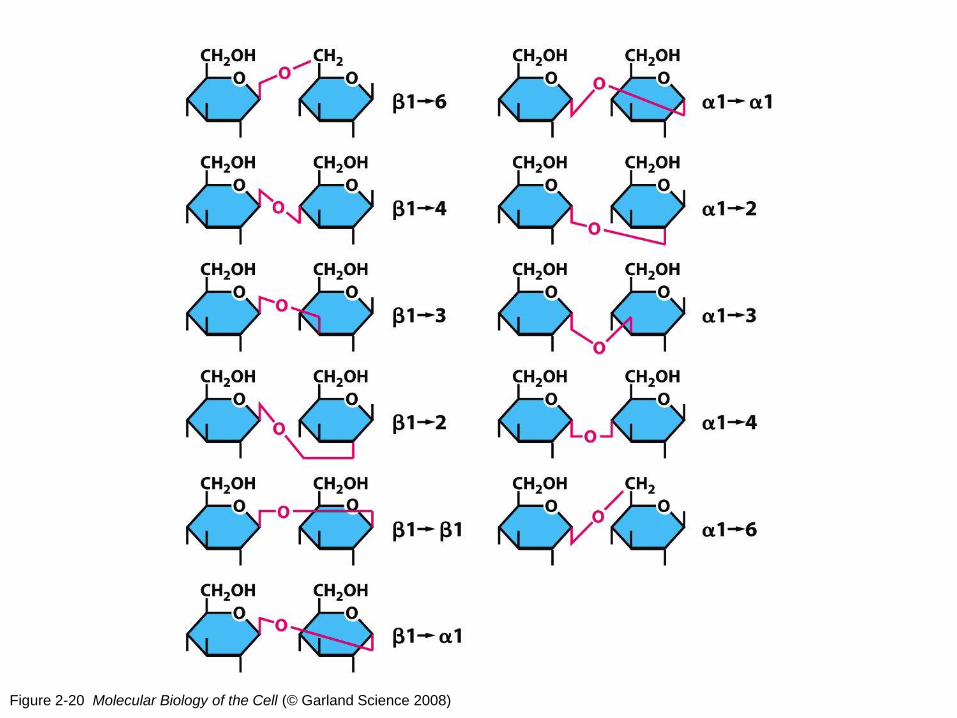
Figure 2-20 Molecular Biology of the Cell (© Garland Science 2008)
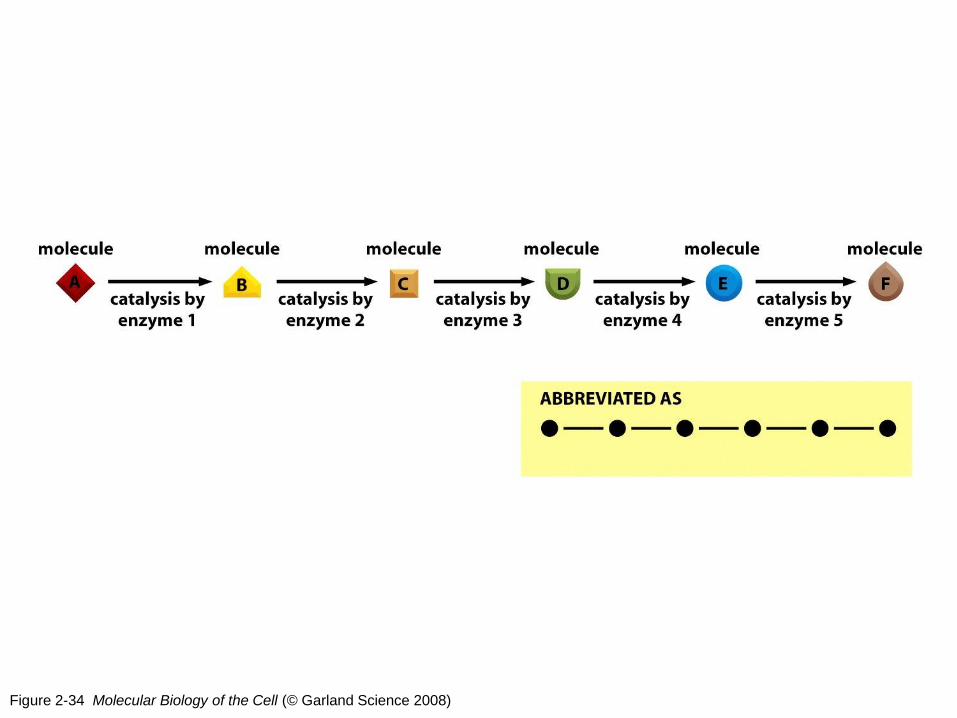
Figure 2-34 Molecular Biology of the Cell (© Garland Science 2008)
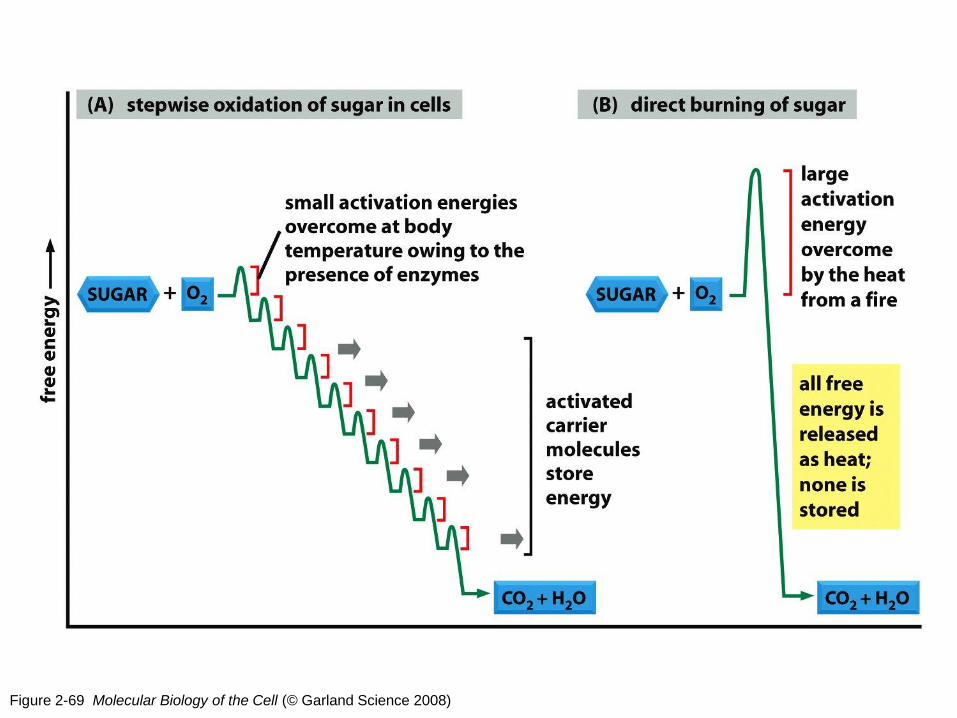
Figure 2-69 Molecular Biology of the Cell (© Garland Science 2008)
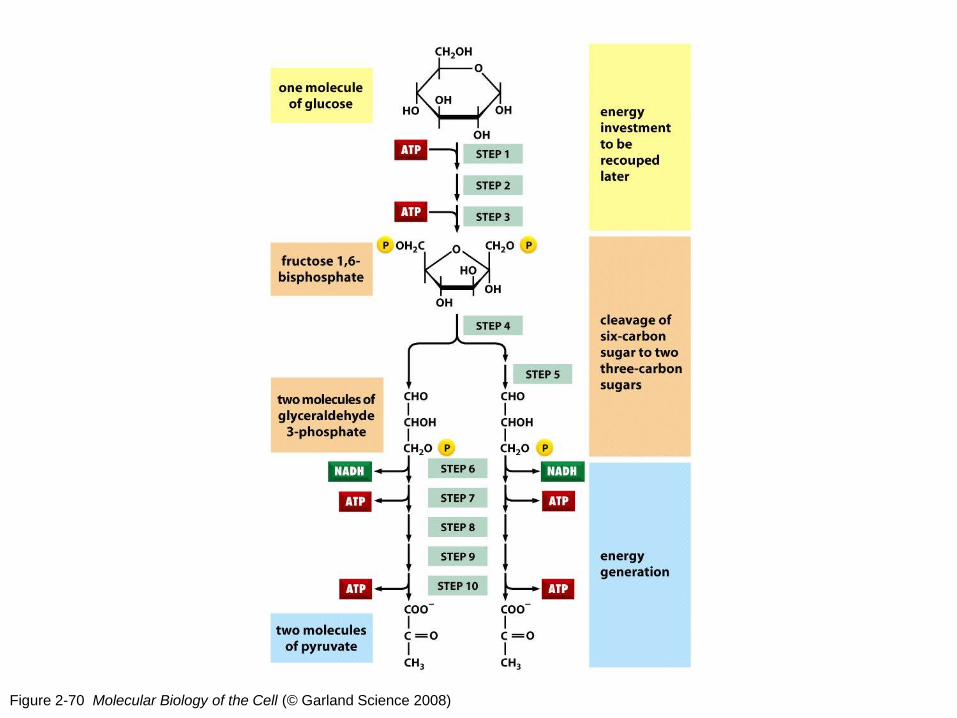
Figure 2-70 Molecular Biology of the Cell (© Garland Science 2008)
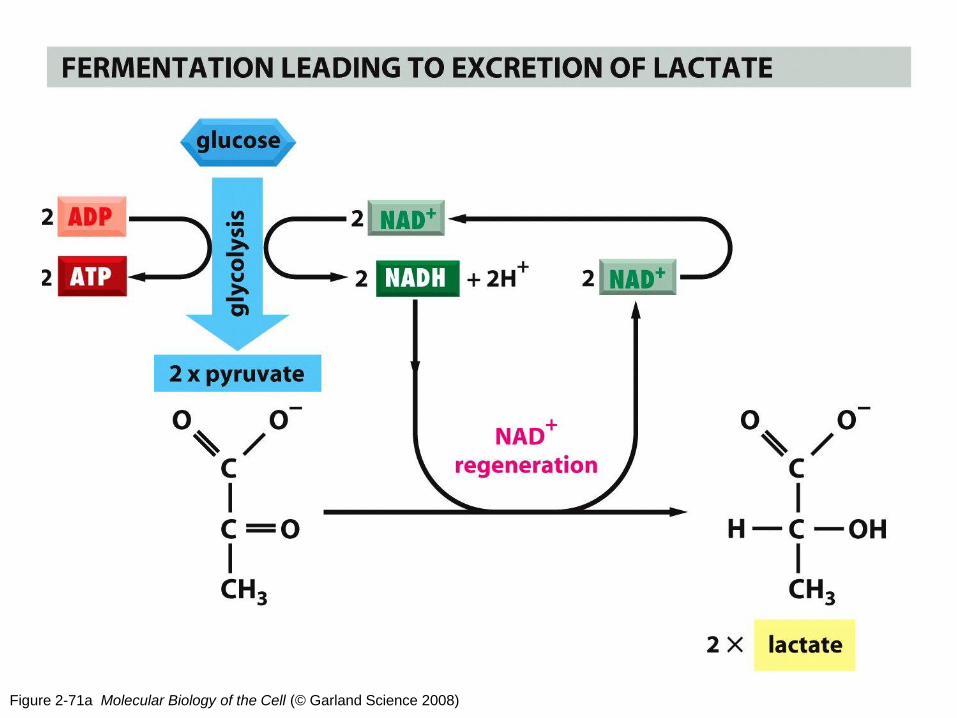
Figure 2-71a Molecular Biology of the Cell (© Garland Science 2008)
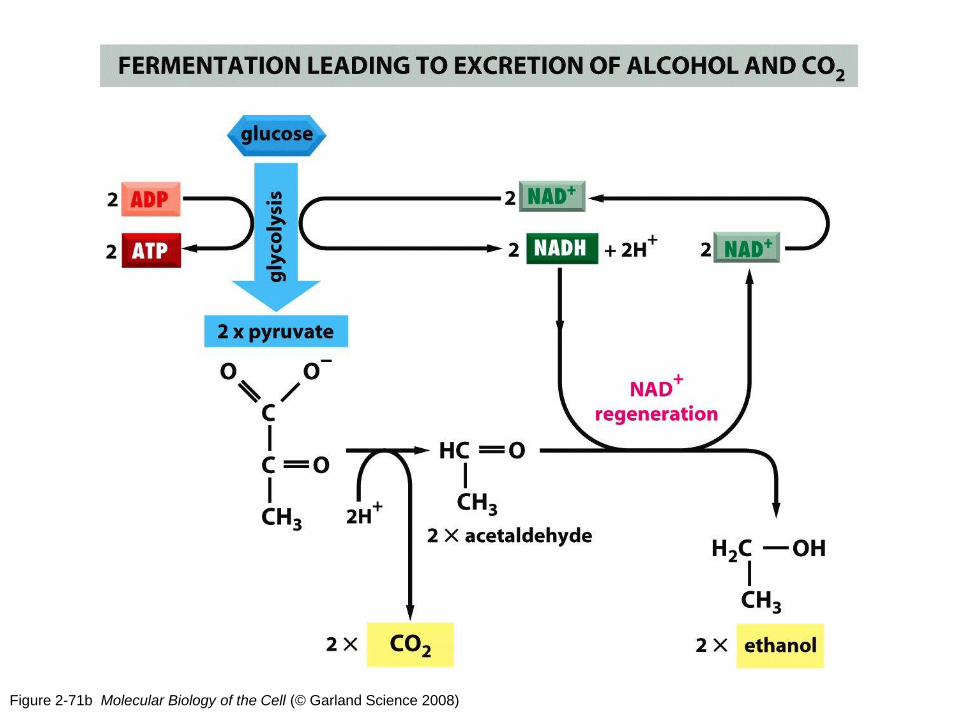
Figure 2-71b Molecular Biology of the Cell (© Garland Science 2008)
Case study
A young boy is diagnosed with von Gierke’s disease.
What is this, what is the clinical picture? What is the defect?
What product builds up?
What pathway(s) can the latter product filter into?
What is glycogen and glycogenolysis?