Embed Size (px)
Citation preview
1
Molecular Basis of Bacterial Formaldehyde Sensing
This thesis is submitted to the University of Manchester for the degree of PhD in the Faculty of Life Sciences
2012
JAMES ROSS LAW
2
Declaration ................................................................................................................................................... 6
Abstract ......................................................................................................................................................... 6
Copyright statement ................................................................................................................................. 7
Acknowledgements ................................................................................................................................... 8
Abbreviations .............................................................................................................................................. 9
1 Introduction ............................................................................................................................ 10
1.1 Transcription in bacteria ....................................................................................................... 10
1.2 Transcription Regulation ....................................................................................................... 13 1.2.1 Transcription Factors ........................................................................................................................................... 13 1.2.2 Other mechanisms of transcription regulation ......................................................................................... 28
1.3 Formaldehyde – Toxicity, origins, and detoxification mechanisms ........................ 32
1.4 Regulation of Formaldehyde detoxification in bacteria .............................................. 45
1.5 Overall Aims and Objectives .................................................................................................. 50
2 Materials and Methods ........................................................................................................ 51
2.1 Materials ....................................................................................................................................... 51 2.1.1 Chemicals and Reagents ...................................................................................................................................... 51 2.1.2 Enzymes and other proteins .............................................................................................................................. 51 2.1.3 Oligonucleotides ...................................................................................................................................................... 52 2.1.4 Bacterial strains ....................................................................................................................................................... 53 2.1.5 Plasmid Vectors ....................................................................................................................................................... 54 2.1.6 Growth Media ........................................................................................................................................................... 54
2.2 Molecular Biology Methods ................................................................................................... 55 2.2.1 Isolation of E.coli genomic DNA ........................................................................................................................ 55 2.2.2 Isolation of Bacillus subtilis DNA ...................................................................................................................... 55 2.2.3 Isolation of the hxlR2 gene and its promoter region from Bacillus cereus AH818 .................... 56 2.2.4 Polymerase Chain Reaction ................................................................................................................................ 56 2.2.5 DNA purification...................................................................................................................................................... 56 2.2.6 Restriction endonuclease digestions ............................................................................................................. 57 2.2.7 Gel extraction of DNA ............................................................................................................................................ 57 2.2.8 Agarose Gel Electrophoresis .............................................................................................................................. 57 2.2.9 Ligation cloning ....................................................................................................................................................... 57 2.2.10 “Non-ligation dependent cloning” cloning ............................................................................................. 58 2.2.11 Preparation of competent cells ................................................................................................................... 58 2.2.12 Transformation of E. coli with plasmids ................................................................................................. 58 2.2.13 Plasmid Extraction ........................................................................................................................................... 58 2.2.14 Protein Expression Trials .............................................................................................................................. 59 2.2.15 SDS-PAGE Analysis ........................................................................................................................................... 59 2.2.16 Site-Directed Mutagenesis ............................................................................................................................ 60 2.2.17 Deletion of the KanR cassette from E. coli ∆frmR ............................................................................... 60 2.2.18 Lysogenisation of E. coli ∆frmR∆KanR .................................................................................................... 60
2.3 Protein Production and Purification .................................................................................. 61 2.3.1 Large Scale Growth for protein production ................................................................................................ 61 2.3.2 Cell Lysis and extraction ...................................................................................................................................... 61 2.3.3 Nickel Affinity Purification ................................................................................................................................. 61 2.3.4 Purification of FrmR and FrmRC36S .............................................................................................................. 62 2.3.5 Protein Concentration Estimation .................................................................................................................. 63
3
2.4 In vitro biochemical and biophysical characterisation methods ............................. 63 2.4.1 Mass-Spectrometry ................................................................................................................................................ 63 2.4.2 Multi-Angle Light Scattering .............................................................................................................................. 64 2.4.3 Circular Dichroism (CD)....................................................................................................................................... 65 2.4.4 Electropheric Mobility Shift Assays (EMSAs) ............................................................................................. 66 2.4.5 Fluorescence Spectroscopy ................................................................................................................................ 67 2.4.6 In vivo experiments using the PGFPR plasmid .......................................................................................... 68 2.4.7 In vivo experiments using the pKanRR plasmid ....................................................................................... 68
2.5 Bioinformatic analysis ............................................................................................................. 70 2.5.1 General Use of Databases .................................................................................................................................... 70 2.5.2 BLAST searches ....................................................................................................................................................... 70 2.5.3 Sequence alignments ............................................................................................................................................. 70 2.5.4 Secondary structure prediction........................................................................................................................ 71 2.5.5 DNA binding residue prediction ...................................................................................................................... 71
2.6 X-Ray Crystallography ............................................................................................................. 73 2.6.1 Background ............................................................................................................................................................... 73 2.6.2 X-Ray Crystallisation Trials ................................................................................................................................ 76 2.6.3 Data Collection ......................................................................................................................................................... 77 2.6.4 Data Processing ....................................................................................................................................................... 77 2.6.5 Molecular Replacement ....................................................................................................................................... 77 2.6.6 Model building, Refinement and validation ................................................................................................ 78 2.6.7 Analysis of the dimer interface ......................................................................................................................... 78
3 Cloning, Purification and Biophysical Characterisation of Bacterial Transcription Factors Implicated in Formaldehyde Sensing ........................................... 79
3.1 Introduction ................................................................................................................................ 79
3.2 Aims and Objectives ................................................................................................................. 79
3.3 Phylogenetic distribution of known TFs of FDP ............................................................. 81 3.3.1 Distribution of the two component systems from Paracoccus denitrificans and Rhodobacter sphaeroides .................................................................................................................................................................................. 81 3.3.2 Phylogenetic distribution of HxlR and HxlR-pCER270 .......................................................................... 81 3.3.3 Phylogenetic distribution of AdhR .................................................................................................................. 83 3.3.4 Phylogenetic distribution of FrmR .................................................................................................................. 83 3.3.5 Summary ..................................................................................................................................................................... 84
3.4 Molecular cloning ...................................................................................................................... 84 3.4.1 Molecular cloning of the frmR gene from E.coli ......................................................................................... 85 3.4.2 Molecular cloning of the hxlR1 gene from Bacillus subtilis ................................................................... 88 3.4.3 Molecular cloning of the hxlR2 gene from Bacillus cereus AH818 .................................................... 89
3.5 Protein Expression Trials ....................................................................................................... 90 3.5.1 Expression trials using pET24b-frmR-His, pET15b-His-frmR and pET15b-frmR ....................... 90 3.5.2 hxlR Expression using pET24b-hxIR1-His .................................................................................................... 91 3.5.3 Expression of HxlR2-His from pET24b-hxlR2-His .................................................................................... 92
3.6 Protein Purification .................................................................................................................. 92 3.6.1 Purification of FrmR-His ...................................................................................................................................... 93 3.6.2 Purification of FrmR .............................................................................................................................................. 93 3.6.3 Purification of HxlR1-His ..................................................................................................................................... 96 3.6.4 Purification of HxlR2-His ..................................................................................................................................... 97
3.7 Protein Size Determination Using Mass Spectroscopy ................................................ 98 3.7.1 Mass spectrometry of FrmR-His ...................................................................................................................... 98 3.7.2 Mass spectrometry of FrmR ............................................................................................................................... 99 3.7.3 Mass spectrometry of HxlR1-His ..................................................................................................................... 99 3.7.4 Mass spectrometry of HxlR2-His ................................................................................................................... 100
4
3.8 Protein Size Determination Multi Angle Light Scattering (MALS) ........................ 101 3.8.1 MALS analysis of FrmR-His .............................................................................................................................. 101 3.8.2 MALS and Size Exclusion Chromatography analysis of FrmR .......................................................... 102 3.8.3 MALS analysis of HxlR1 ...................................................................................................................................... 104 3.8.4 MALS analysis of HxlR2-His ............................................................................................................................. 105
3.9 Secondary structure determination ................................................................................ 106 3.9.1 Secondary Structure prediction of FrmR-His ........................................................................................... 106 3.9.2 Secondary structure prediction of FrmR.................................................................................................... 107 3.9.3 Secondary Structure prediction of HxlR1-His .......................................................................................... 108
3.10 Summary and Discussion..................................................................................................... 109
4 Crystal Structure Determination of FrmR and HxlR ................................................ 111
4.1 Introduction ............................................................................................................................. 111
4.2 Aims and Objectives .............................................................................................................. 111
4.3 Crystallization .......................................................................................................................... 112 4.3.1 Crystallization of FrmR-His and FrmR ........................................................................................................ 112 4.3.2 Crystallization of FrmRC36S ............................................................................................................................ 112 4.3.3 Crystallisation of HxlR1-His ............................................................................................................................. 113 4.3.4 Crystallisation of HxlR2-His ............................................................................................................................. 113
4.4 Diffraction Data Collection .................................................................................................. 114 4.4.1 Data Collection on FrmRC36S crystals ........................................................................................................ 115 4.4.2 Data Collection of HxlR2-His crystals .......................................................................................................... 115
4.5 Data Processing ....................................................................................................................... 117 4.5.1 FrmRC36S ................................................................................................................................................................ 118 4.5.2 HxlR2-His.................................................................................................................................................................. 118
4.6 Phase determination by Molecular Replacement (MR)............................................ 119 4.6.1 Molecular replacement for FrmRC36S ........................................................................................................ 120 4.6.2 Molecular replacement of HxlR2-His ........................................................................................................... 121
4.7 Model building and refinement ......................................................................................... 122 4.7.1 Model improvement and refinement of FrmRC36S .............................................................................. 122 4.7.2 Model improvement and refinement of HxlR2-His ............................................................................... 123
4.8 Validation of model structures .......................................................................................... 124 4.8.1 Crystal structure of HxlR2-His ........................................................................................................................ 125
4.9 Comparison of both HxlR2-His structures .................................................................... 127
4.10 Comparison with other structures ................................................................................... 128
4.11 A comparison between chain A and chain B in HxlR2-His ....................................... 128
4.12 Secondary structure and domain organisation ........................................................... 129
4.13 B-factor analysis of HxlR2-His ........................................................................................... 130
4.14 Analysis of the HxlR2-His dimer interface .................................................................... 133
4.15 Analysis of the DNA-binding domain ............................................................................... 136
4.16 Discussion of formaldehyde sensing by HxlR2 ............................................................ 139
4.17 Discussion ................................................................................................................................. 142
5 In vitro and in vivo functional characterisation of FrmR and HxlR ................... 144
5.1 Introduction ............................................................................................................................. 144
5.2 Aims and objectives ............................................................................................................... 146
5
5.3 In vitro analysis of the FrmR:frmRAB promoter interaction .................................. 148 5.3.1 A Non-Competitive Electrophoretic Mobility Shift Assay (EMSA) reveals that FrmR-His does not bind the frmRAB operator .......................................................................................................................................... 148 5.3.2 A Non-Competitive EMSA shows that FrmR binds to the frmRAB operator .............................. 149 5.3.3 The effect of formaldehyde on formation of the FrmR:frmRAB promoter complex ............... 150 5.3.4 Analysis of the specificity of FrmR:frmRAB promoter interaction and its dependence on formaldehyde using EMSA ................................................................................................................................................. 151
5.4 Construction of an in vivo FrmR-reporter system ...................................................... 153 5.4.1 Construction of the frmRAB-KanR and the frmRAB-GFP inserts ...................................................... 153 5.4.2 Construction of an E. coli ∆frmR strain ....................................................................................................... 155 5.4.3 Construction of the E. coli ∆frmR (DE3) strain ........................................................................................ 156
5.5 In vivo studies of FrmR function ........................................................................................ 157 5.5.1 Initial characterisation of the pGFPR reporter system......................................................................... 158 5.5.2 Initial characterisation of the pKanRR reporter system ...................................................................... 159
5.6 In vivo analysis of the properties of selected FrmR mutants .................................. 161 5.6.1 Prediction of the FrmR DNA-binding residues ........................................................................................ 161 5.6.2 Experimental analysis of putative FrmR DNA-binding mutants ..................................................... 162 5.6.3 Summary of FrmR alanine mutants .............................................................................................................. 163
5.7 Probing the FrmR formaldehyde sensing mechanism .............................................. 165
5.8 In vitro analysis of FrmRC36S ............................................................................................ 170 5.8.1 EMSA experiments with FrmRC36S and the frmRAB promoter ...................................................... 171
5.9 Analysis of the DNA binding properties of HxlR2-His ............................................... 172
5.10 Assessing the effect of formaldehyde on HxlR1 .......................................................... 175 5.10.1 Fluorescence Spectroscopy ........................................................................................................................ 175
5.11 Discussion ................................................................................................................................. 176
6 Discussion, Conclusions and Future work .................................................................. 179
Appendix ........................................................................................................................................ 186
A1: Cloning strategies.......................................................................................................................... 186
A1.1 Cloning strategy for the construction of pET15b-His-frmR, pET24bfrmR-His and pET15b-frmR .......................................................................................................................................... 187
A1.2 Cloning Strategy for the construction of pET24b-hxlR1-His ....................................... 191
A1.3 Cloning Strategy for the construction of pET24b-hxlR2-His ....................................... 192
A1.4 Cloning Strategy for the construction of the pKanRR and pGFPR reporter system ..................................................................................................................................................................... 195
A1.5 Cloning Strategy for the construction of the E.coli K12∆frmR∆KanR (DE3) strain ..................................................................................................................................................................... 197
References ..................................................................................................................................... 198
6
Declaration
No portion of the work referred to in the thesis has been submitted in support of an application
for another degree or qualification of this or any other university or other institute of learning.
Abstract
Formaldehyde is a highly toxic molecule; despite this, it is produced in the cells of all living
organisms as a by-product of metabolic pathways. Consequently, several pathways have
evolved throughout life in order to detoxify cellular formaldehyde. These pathways need to be
regulated within the cell and this study sets out to determine how these pathways are regulated
in particular bacteria. Several approaches are taken to achieve this. Known or predicted
transcription factors that regulate formaldehyde detoxification pathways from particular
organisms are considered. These proteins are called FrmR (E. coli), HxlR1 (Bacillus subtilis), and
HxlR2 (Bacillus Cereus).
The transcription factors are cloned and purified using molecular biology techniques. The
proteins are subject to biophysical characterisation i.e. size and secondary structure
composition. Additionally, the X-ray crystal structure of HxlR2 is determined and significant
progress is made towards determining the structure of FrmR. Interactions of these transcription
factors towards their target DNA sequences are studied along with the effect that formaldehyde
has on these interactions.
A reporter system is constructed that enables the behaviour of FrmR to be studied in vivo.
Residues that are likely to play important roles in DNA recognition by this regulator are
identified. Additionally, this reporter system identifies a residue that is essential for
formaldehyde sensing by this protein. Overall, some significant insights into how these
transcription factors carry out their biological function are established.
7
Copyright statement
i. The author of this thesis (including any appendices and/or schedules to this thesis) owns
certain copyright or related rights in it (the “Copyright”) and s/he has given The University of
Manchester certain rights to use such Copyright, including for administrative purposes.
ii. Copies of this thesis, either in full or in extracts and whether in hard or electronic copy, may be
made only in accordance with the Copyright, Designs and Patents Act 1988 (as amended) and
regulations issued under it or, where appropriate, in accordance with licensing agreements
which the University has from time to time. This page must form part of any such copies made.
iii. The ownership of certain Copyright, patents, designs, trade marks and other intellectual
property (the “Intellectual Property”) and any reproductions of copyright works in the thesis,
for example graphs and tables (“Reproductions”), which may be described in this thesis, may
not be owned by the author and may be owned by third parties. Such Intellectual Property and
Reproductions cannot and must not be made available for use without the prior written
permission of the owner(s) of the relevant Intellectual Property and/or Reproductions.
iv. The ownership of certain Copyright, patents, designs, trade marks and other intellectual
property (the “Intellectual Property”) and any reproductions of copyright works in the thesis,
for example graphs and tables (“Reproductions”), which may be described in this thesis, may
not be owned by the author and may be owned by third parties. Such Intellectual Property and
Reproductions cannot and must not be made available for use without the prior written
permission of the owner(s) of the relevant Intellectual Property and/or Reproductions.

8
Acknowledgements
I would like to thank the BBSRC for funding this project. I would also like to thank Professor
David Leys for giving me the opportunity to undertake this research and for his continued help
and advice throughout. Thank you to members of the research group who have offered their
help during my time here. In particular, thanks to Dr Mark Dunstan for the valued time and help
offered to me; this was much appreciated.
I would like to thank all my chums from the enzymology group for making this a very enjoyable
time. Thanks to my parents; Bobby and Norman Law for their continued input……of pounds into
my bank account! I could not have done it without you. Thank you to Emma Cartwright for her
sustained efforts to provide me with other things to stress about. This project may have ruined
me otherwise! I would like to thank anyone who is a friend of mine.
9
Abbreviations
AdhR HTH-type transcriptional regulator AdhR APS Ammonium Persulphate ASA Accessible Surface Area ATP Adenosine triphosphate AU Asymmetric Unit BLAST Basic Local Alignment Search Tool bp Base Pair C1-FFL Coherent type 1 feed forward loop CbnR LysR-type regulatory protein CbnR CD Circular Dichroism ChiP Chromatin immunoprecipitation CsoR Copper-sensing transcriptional repressor
CsoR CueR HTH-type transcriptional regulator CueR DMGO Dymethylglycine oxidase DMSO Dimethyl Sulphoxide DNA Deoxyribonucleic Acid DOR Dense overlapping regulon DskA DnaK suppressor protein DskA E. coli Escherichia coli EC Elongation complex EDTA Ethylenediaminetetraacetic acid EMSA Electropheric Mobility Shift Assay FA Formaldehyde FAD Flavin adenine dinucleotide Fae Formaldehyde activating enzyme FDH Formaldehyde dehydrogenase FDP Formaldehyde detoxification pathway FFL Feed forward loop FGH S-formylglutathione hydrolase FIS Factor for inversion stimulation FLP Flippase recombinase FrmR Transcriptional repressor frmR FRT Flippase recognition target GalR HTH-type transcriptional regulator GalR GFP Green Fluorescent Protein GSH Glutathione GSH-FDH Glutathione dependent formaldehyde
dehydrogenase GSH-FDP Glutathione dependent formaldehyde
detoxification pathway H4MPT Tetrahydromethanopterin HGT Horizontal Gene Transfer HK Histidine Kinase HMGSH S-hydroxymethylglutathione HPS 3-hexulose-6-phosphate synthase HTH Helix-turn-Helix HU Histone-like bacterial DNA-binding protein
HU HU DNA-binding protein HU HxlR HTH-type transcriptional activator HxlR HypR Transcriptional regulator HypR I1-FFL Incoherent type-1 feed forward loop IPTG Isopropyl β-D-1-thiogalactopyranoside ITC Initial transcribing complex KanR Kanamycin resistance gene LB Luria-Bertani
LS Light scattered LTTR LysR-type transcription regulator MAD Multi-wavelength anomalous dispersion MALS Multi-Angle Light Scattering MIR Multiple isomorphic replacement MR Molecular replacement MSA Multiple sequence alignment MSH Mycothiol NAD/NADH Nicotinamide adenine dinucleotide NAP Nucleoid Associated Protein NAR Negative auto regulation NEB New England Biolabs NIG National BioResource Project OD Optical Density OMPDC orotidine 5’- monophosphate
decarboxylase OmpR Transcriptional regulatory protein
OmpR PAR Positive auto regulation PCR Polymerase chain reaction PDB Protein Data Bank PEG Polyethylene glycol PHI 6-phospho-3-hexuloisomerase Poly(I)•Poly(C) Poly(deoxyinosinic-deoxycytidylic) acid
sodium salt ppb Part per billion ppGpp/pppGpp Guanosine tetapentaphosphate/
Guanosine pentaphosphate PSI-BLAST Position-Specific Iterative BLAST RCF Relative centrifugal force rcnR Transcriptional repressor rcnR RI Refractive index signal RMSD Route mean squared deviation RNA Ribonucleic Acid RNAP RNA polymerase ROS Reactive oxygen species RR Response regulator RuMP Ribulose monophosphate pathway SAD Single-wavelength anomalous
dispersion SDS Sodium dodecyl sulfate SDS-PAGE SDS-Polyacrylamide gel electrophoresis SEC Size exclusion chromatography SECC SEC column SIM Single input module SmtB Transcriptional repressor smtB SOM Self-organising Map TEMED tetramethylethylenediamine TF Transcription Factor TFBS Transcription Factor Binding Site THF Tetrahydrofolate TOF Time of flight TRN Transcriptional regulatory network UAS Upstream activating sequence UV Ultra Violet wHTH Winged- Helix-turn-Helix WT Wilde type YodB HTH-type transcriptional regulator
YodB
10
1 Introduction
This introduction first discusses transcription regulation in bacteria. This is followed by a
description of the biological context of formaldehyde detoxification. Then, the details that are
currently known with regard to the regulation of formaldehyde detoxification in bacteria are
discussed.
1.1 Transcription in bacteria
Transcription is the process that copies the genetic code from a DNA sequence into a
corresponding molecule of RNA. The resulting RNA molecule can subsequently be translated to
produce a corresponding protein. The concentration of these RNA transcripts within the cell
often governs how much of the corresponding protein will be produced. Control over the
transcription rate of particular genes therefore relates to a control of concentration of the
corresponding protein. This provides a means for organisms to control metabolic pathways by
regulating gene transcription via responses to particular stimuli.1 Although the process of
transcription in bacteria and eukaryotes displays significant similarities, they are also distinctly
different.2 Here we will only consider transcription in bacteria.
DNA transcription is initiated at a promoter site, which is a stretch of DNA in the chromosome
containing defined structural elements. For example, a standard promoter in E. coli (i.e.
transcribed by 70- see below) contains two conserved sequences: 5’-TTGACA-3’ at
approximately 35 base pairs upstream of the transcription start site and 5’-TATAAT-3’ at
approximately 10 base pairs upstream of the transcription start site; these are known as the -35
region and -10 region respectively. In between the -10 and -35 regions is a spacer region of
DNA of 17±1 base pairs. Typically promoters will deviate slightly from these conserved
sequences; in the absence of external factors the amount of transcription from a promoter
(termed promoter strength) depends largely on how similar it is to the consensus. In addition to
the -10, -35 and spacer region a promoter may contain other structural elements such as an UP
element which is usually an A/T rich DNA sequence from approximately -40 to -65. Another
promoter element that is sometimes found is an ‘Upstream activating sequence’ (UAS) from
approximately -40 to -150. UASs can contain sequences that induce a degree of bending in the
promoter DNA as well as protein binding sites. A schematic of a standard E. coli promoter is
shown in Figure 1-1. Structural elements of the promoter are known as cis-regulatory elements,
whereas external factors that affect transcription but are not part of the promoter are termed
11
trans-regulatory elements. In bacteria, one promoter typically controls the transcription of
several adjacent genes; collectively known as an operon. Operons are thus transcribed in one
transcriptional unit and tend to contain genes that perform a related function.3,4,5
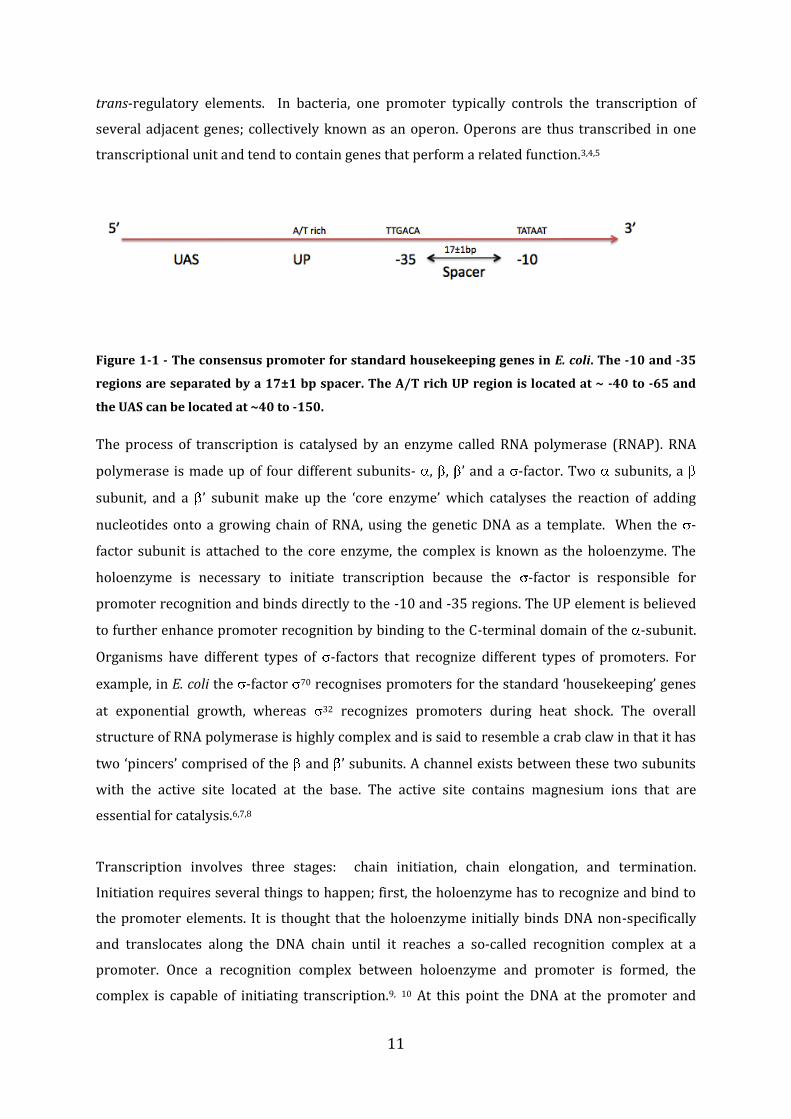
Figure 1-1 - The consensus promoter for standard housekeeping genes in E. coli. The -10 and -35
regions are separated by a 17±1 bp spacer. The A/T rich UP region is located at ~ -40 to -65 and
the UAS can be located at ~40 to -150.
The process of transcription is catalysed by an enzyme called RNA polymerase (RNAP). RNA
polymerase is made up of four different subunits- , , ’ and a -factor. Two subunits, a
subunit, and a ’ subunit make up the ‘core enzyme’ which catalyses the reaction of adding
nucleotides onto a growing chain of RNA, using the genetic DNA as a template. When the -
factor subunit is attached to the core enzyme, the complex is known as the holoenzyme. The
holoenzyme is necessary to initiate transcription because the -factor is responsible for
promoter recognition and binds directly to the -10 and -35 regions. The UP element is believed
to further enhance promoter recognition by binding to the C-terminal domain of the -subunit.
Organisms have different types of -factors that recognize different types of promoters. For
example, in E. coli the -factor 70 recognises promoters for the standard ‘housekeeping’ genes
at exponential growth, whereas 32 recognizes promoters during heat shock. The overall
structure of RNA polymerase is highly complex and is said to resemble a crab claw in that it has
two ‘pincers’ comprised of the and ’ subunits. A channel exists between these two subunits
with the active site located at the base. The active site contains magnesium ions that are
essential for catalysis.6,7,8
Transcription involves three stages: chain initiation, chain elongation, and termination.
Initiation requires several things to happen; first, the holoenzyme has to recognize and bind to
the promoter elements. It is thought that the holoenzyme initially binds DNA non-specifically
and translocates along the DNA chain until it reaches a so-called recognition complex at a
promoter. Once a recognition complex between holoenzyme and promoter is formed, the
complex is capable of initiating transcription.9, 10 At this point the DNA at the promoter and
12
transcription start site is still in the double helical form, and the holoenzyme-promoter complex
is known as a closed complex. The next step in initiation is an isomerisation from the closed
complex to an open complex which is facilitated by the subunit. The open complex contains
12 2bp of DNA that has been separated or “melted” and occurs between +3 and -13 of the
transcription start site.11 Once the two DNA strands have melted, the template strand is
threaded into the active site channel of RNAP.12 Once created, the open complex is quite stable
and the next step of chain initiation can take place. The next step is transcription initiation in
which the first phosphodiester bond of the RNA chain is formed; the 5’ nucleotide is usually a
purine and normally adenine rather than guanine. RNAP binds two nucleotides which are
complementary to that of the DNA template at the transcription start site and forms a
phosphodiester bond between them. Only nucleotides that are complementary to the DNA
template can be added because the reaction is catalysed via base pairing. 13
Once the first phosphodiester bond is formed, RNAP continues joining successive nucleotides
using the genetic DNA as a template. Usually this process carries on until about 10 nucleotides
have been transcribed; these transcripts are then released from the enzyme and this procedure
is normally repeated many times. This is known as abortive initiation and at this point, the
holoenzyme is still intact and bound to the promoter elements; the complex at this stage is
called an “initial transcribing complex” (ITC). In order for the ITC to be converted into a stable
“elongating complex” (EC), RNAP needs to escape from the promoter. Eventually this will
happen in a process known as promoter clearance. Here, it is thought the -factor dissociates
from RNAP and the EC continues transcribing the template DNA.14
The transcription process is now at the elongation stage and the EC is stable and can continue
transcribing for many thousands of bps. The EC contains a heteroduplex of approximately 9bp
between the RNA strand and the template DNA. Transcription elongation is not continuous but
is characterized by pauses, which play an important role in transcription regulation. Several
factors can cause pausing such as the interaction of RNAP with secondary structures formed in
the RNA transcript. Regulator proteins called “transcription elongation factors” can also
influence pausing as well as particular DNA sequences that make pausing more likely.15
The last stage of transcription is chain termination which involves the stopping of RNA
synthesis, release of the RNA transcript and detachment of RNAP from the DNA strand. One
mechanism of termination that has been proposed is that RNAP is pushed forward in the 5’-3’
direction by an external force without the addition of nucleotides. The heteroduplex is therefore
shortened at both ends, which is thought to destabilize the EC leading to termination of
13
transcription.16 In E. coli this external force mostly comes from two sources: the first occurs at
particular “terminator sites” where there is a palindromic G/C rich region; when this region is
transcribed, the RNA has the capacity to form hairpin structures which induce the forward
translocation of the EC. The other source of external force comes from the helicase protein Rho.
Rho binds to RNA and translocates along it in the 5’-3’ direction using energy from ATP
hydrolysis. This process is thought to provide the force to push the EC forward.17,18 The
sequences and mechanism of how RNAP dissociates from template DNA and how the RNA
transcript is released remain unclear. The RNA transcript can then be translated at a ribosome
to produce the encoded proteins.
1.2 Transcription Regulation
As one of the early key steps towards protein synthesis, transcription is extensively regulated
within the cell. Transcription regulation refers to how a cell controls which genes are
transcribed and to what extent they are transcribed. Despite some level of regulation occurring
at the elongation stage, most appears to be conducted at the initiation stage. Regulation at the
initiation stage is provided via several factors.13
1.2.1 Transcription Factors
In order to regulate gene transcription in a very specific manner, bacteria use proteins known
as transcription factors (TFs). TF based regulation is the main way in which organisms maintain
control over transcription. However, the overall level of transcription from a promoter may be
influenced by a combination of factors. TFs can either decrease or increase transcription from a
promoter; a TF that decreases transcription is known as a repressor and a TF that increases
transcription is known as an activator. Some TFs can alter between repressor and activator
function depending on circumstances. Transcription from each operon within the genome is
usually regulated by one or more TF and TFs often regulate their own transcription (known as
autoregulation). TFs are usually DNA binding proteins that bind DNA at specific locations
usually at or near their target promoters; these binding sites are termed “Transcription factor
binding sites” (TFBSs). Once a TF is bound to its TFBS there are several ways in which it can
control transcription. 19
The binding of TFs to TFBSs is specific, which means that the TF has a higher binding affinity
towards its TFBS than the genomic DNA proximal to it. TFs contain a structural motif that
enables them to recognize and bind to specific DNA sequences. In bacteria, the DNA-binding
14
motif is usually a helix-turn-helix motif, which is ubiquitous in bacterial proteomes and plays a
key role in transcription regulation. The HTH motif is also present, though to a lesser extent, in
eukaryotes. It has been speculated that the HTH motif is one of the oldest structural motifs in
life and that all HTH containing proteins evolved from a common ancestor.20 A representative
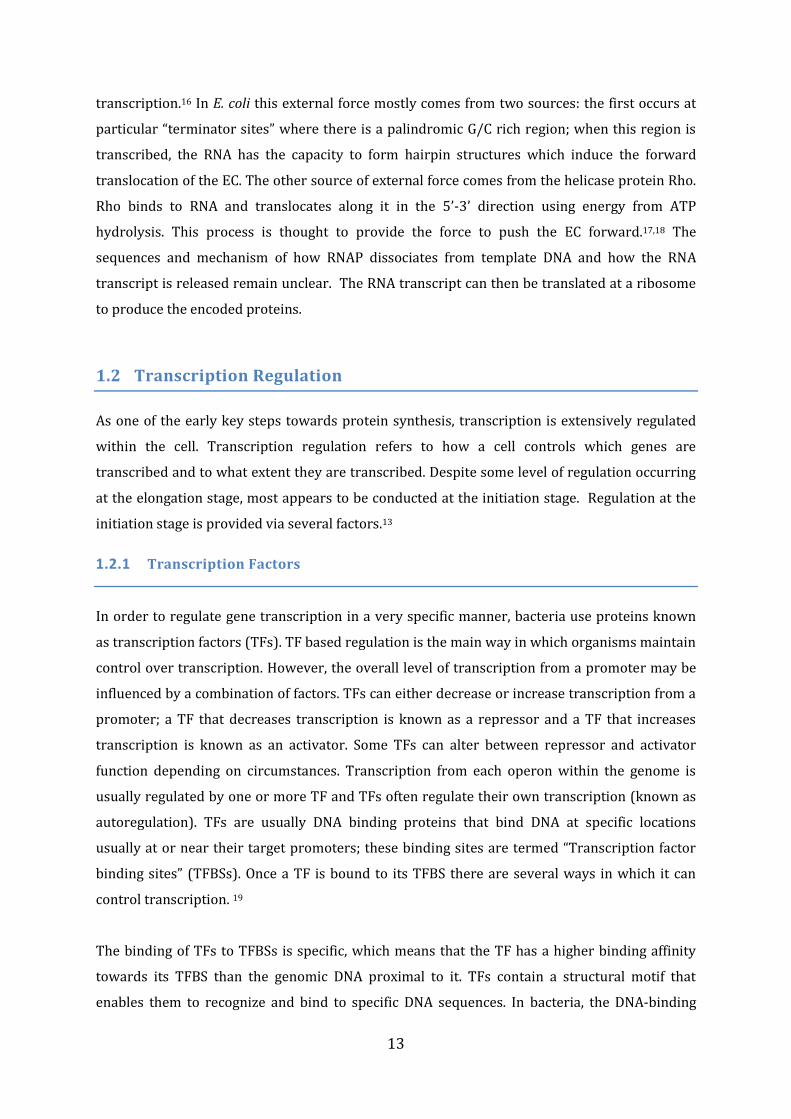
structure of the HTH motif is shown in Figure 1-2; it is composed of a three -helix bundle ( 1,
2 3) with a conserved turn between 2 and 3. 3 is known as the recognition helix and makes
contacts to base pairs in the major groove of DNA, with 2 stabilizing the interaction. Hydrogen
bonds are made between residues of the recognition helix and functional groups of exposed
bases in the major groove. (Figure 1-2) 21
Figure 1-2- X-ray determined structure of the Helix-turn-Helix motif from the lac repressor in
complex with its operator DNA. DNA is shown in purple. 1, 2 and 3 are shown in orange red
and blue respectively. Hydrogen bonds are shown in green and side chains that make contacts to
the base pairs in the major groove are coloured brown.
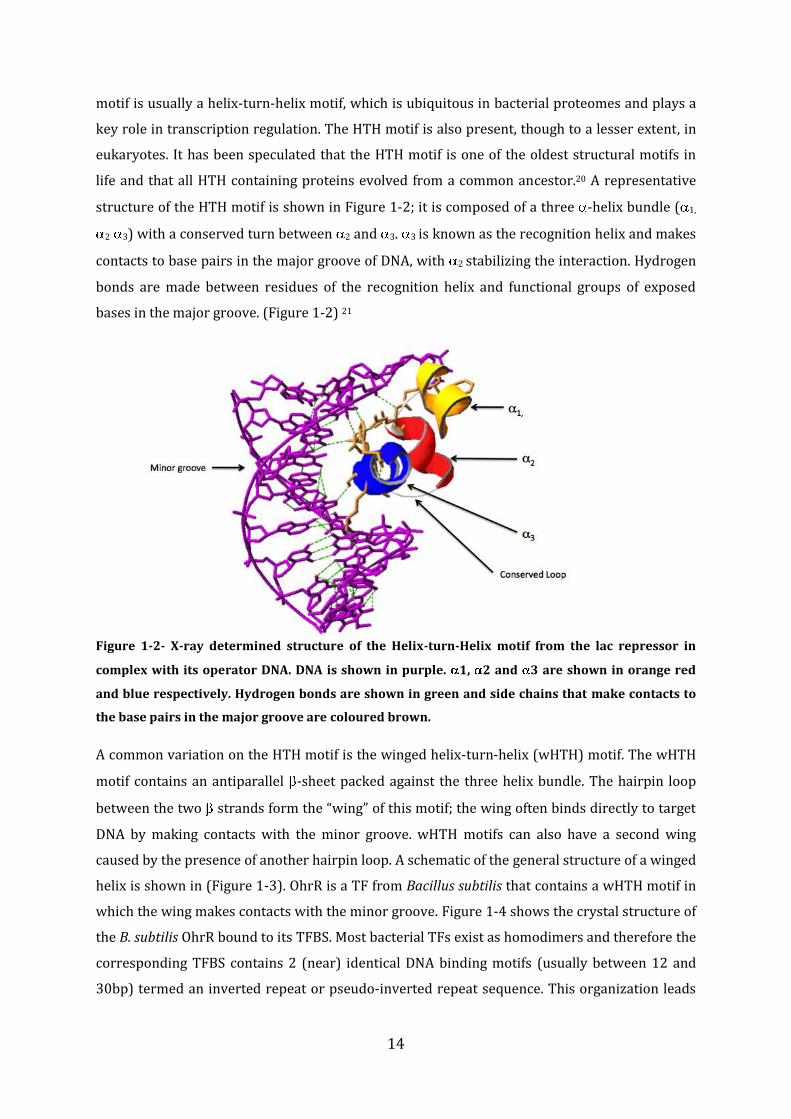
A common variation on the HTH motif is the winged helix-turn-helix (wHTH) motif. The wHTH
motif contains an antiparallel -sheet packed against the three helix bundle. The hairpin loop
between the two strands form the “wing” of this motif; the wing often binds directly to target
DNA by making contacts with the minor groove. wHTH motifs can also have a second wing
caused by the presence of another hairpin loop. A schematic of the general structure of a winged
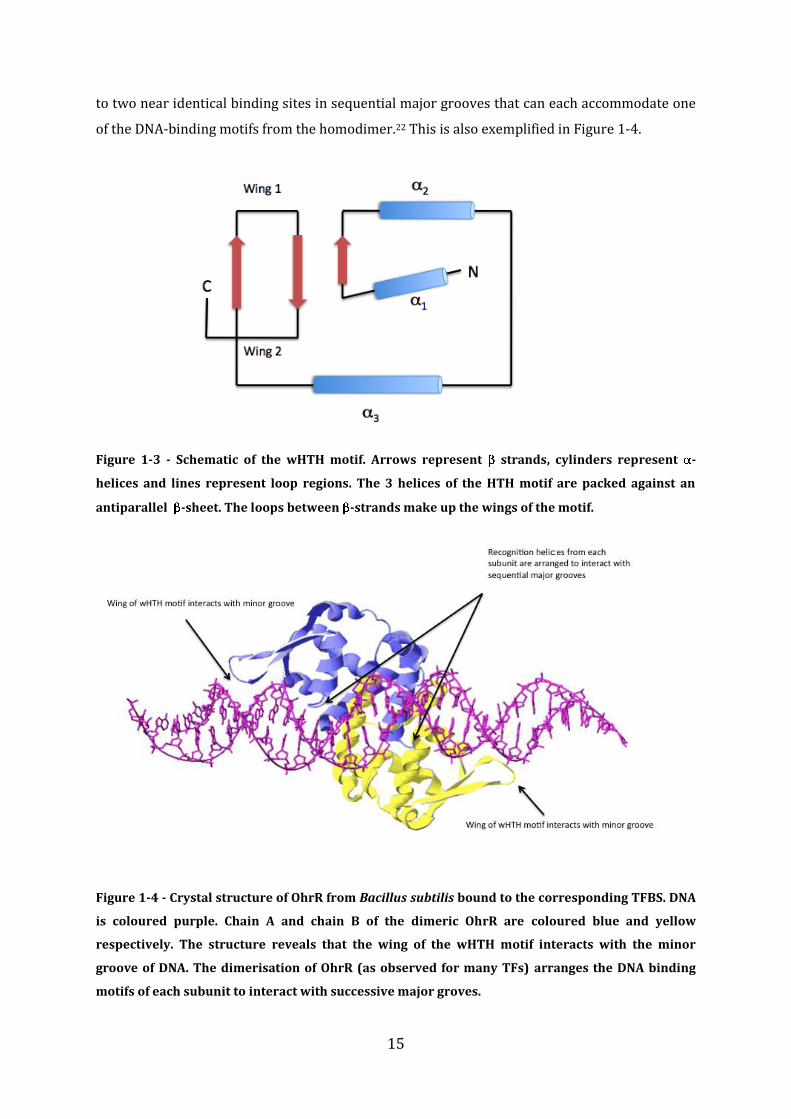
helix is shown in (Figure 1-3). OhrR is a TF from Bacillus subtilis that contains a wHTH motif in
which the wing makes contacts with the minor groove. Figure 1-4 shows the crystal structure of
the B. subtilis OhrR bound to its TFBS. Most bacterial TFs exist as homodimers and therefore the
corresponding TFBS contains 2 (near) identical DNA binding motifs (usually between 12 and
30bp) termed an inverted repeat or pseudo-inverted repeat sequence. This organization leads
15
to two near identical binding sites in sequential major grooves that can each accommodate one
of the DNA-binding motifs from the homodimer.22 This is also exemplified in Figure 1-4.
Figure 1-3 - Schematic of the wHTH motif. Arrows represent strands, cylinders represent -
helices and lines represent loop regions. The 3 helices of the HTH motif are packed against an
antiparallel -sheet. The loops between -strands make up the wings of the motif.
Figure 1-4 - Crystal structure of OhrR from Bacillus subtilis bound to the corresponding TFBS. DNA
is coloured purple. Chain A and chain B of the dimeric OhrR are coloured blue and yellow
respectively. The structure reveals that the wing of the wHTH motif interacts with the minor
groove of DNA. The dimerisation of OhrR (as observed for many TFs) arranges the DNA binding
motifs of each subunit to interact with successive major groves.
16
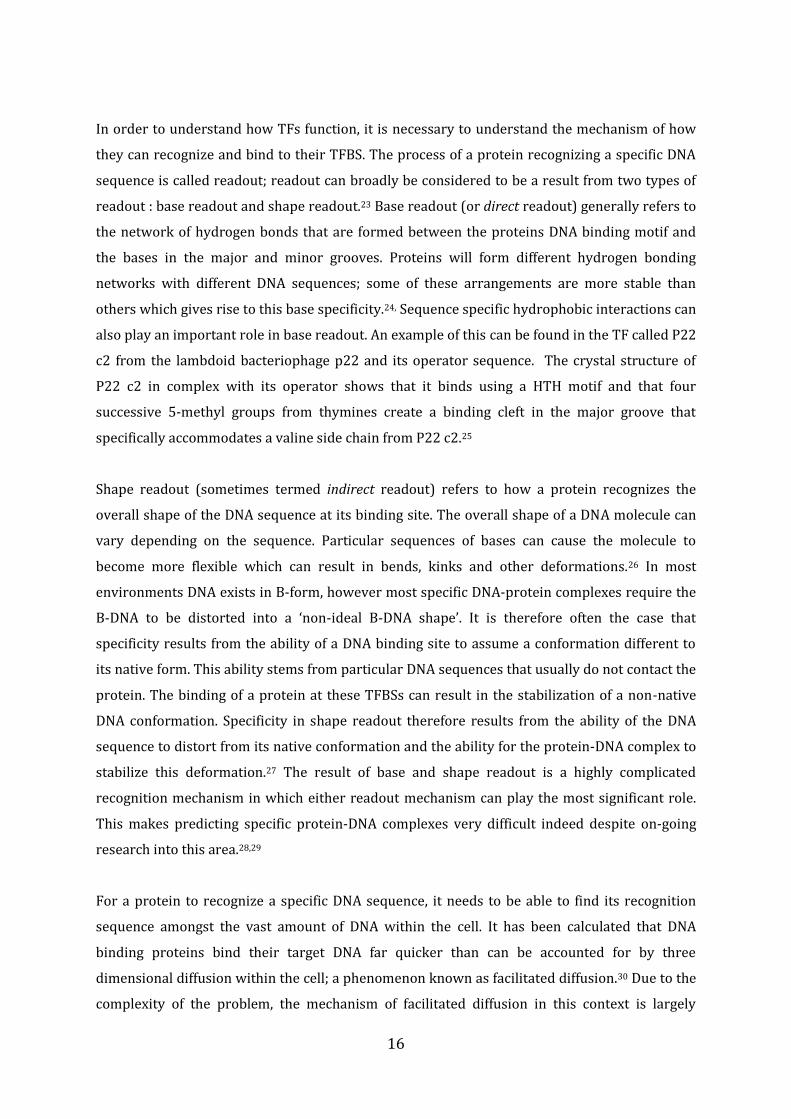
In order to understand how TFs function, it is necessary to understand the mechanism of how
they can recognize and bind to their TFBS. The process of a protein recognizing a specific DNA
sequence is called readout; readout can broadly be considered to be a result from two types of
readout : base readout and shape readout.23 Base readout (or direct readout) generally refers to
the network of hydrogen bonds that are formed between the proteins DNA binding motif and
the bases in the major and minor grooves. Proteins will form different hydrogen bonding
networks with different DNA sequences; some of these arrangements are more stable than
others which gives rise to this base specificity.24, Sequence specific hydrophobic interactions can
also play an important role in base readout. An example of this can be found in the TF called P22
c2 from the lambdoid bacteriophage p22 and its operator sequence. The crystal structure of
P22 c2 in complex with its operator shows that it binds using a HTH motif and that four
successive 5-methyl groups from thymines create a binding cleft in the major groove that
specifically accommodates a valine side chain from P22 c2.25
Shape readout (sometimes termed indirect readout) refers to how a protein recognizes the
overall shape of the DNA sequence at its binding site. The overall shape of a DNA molecule can
vary depending on the sequence. Particular sequences of bases can cause the molecule to
become more flexible which can result in bends, kinks and other deformations.26 In most
environments DNA exists in B-form, however most specific DNA-protein complexes require the
B-DNA to be distorted into a ‘non-ideal B-DNA shape’. It is therefore often the case that
specificity results from the ability of a DNA binding site to assume a conformation different to
its native form. This ability stems from particular DNA sequences that usually do not contact the
protein. The binding of a protein at these TFBSs can result in the stabilization of a non-native
DNA conformation. Specificity in shape readout therefore results from the ability of the DNA
sequence to distort from its native conformation and the ability for the protein-DNA complex to
stabilize this deformation.27 The result of base and shape readout is a highly complicated
recognition mechanism in which either readout mechanism can play the most significant role.
This makes predicting specific protein-DNA complexes very difficult indeed despite on-going
research into this area.28,29
For a protein to recognize a specific DNA sequence, it needs to be able to find its recognition
sequence amongst the vast amount of DNA within the cell. It has been calculated that DNA
binding proteins bind their target DNA far quicker than can be accounted for by three
dimensional diffusion within the cell; a phenomenon known as facilitated diffusion.30 Due to the
complexity of the problem, the mechanism of facilitated diffusion in this context is largely
17
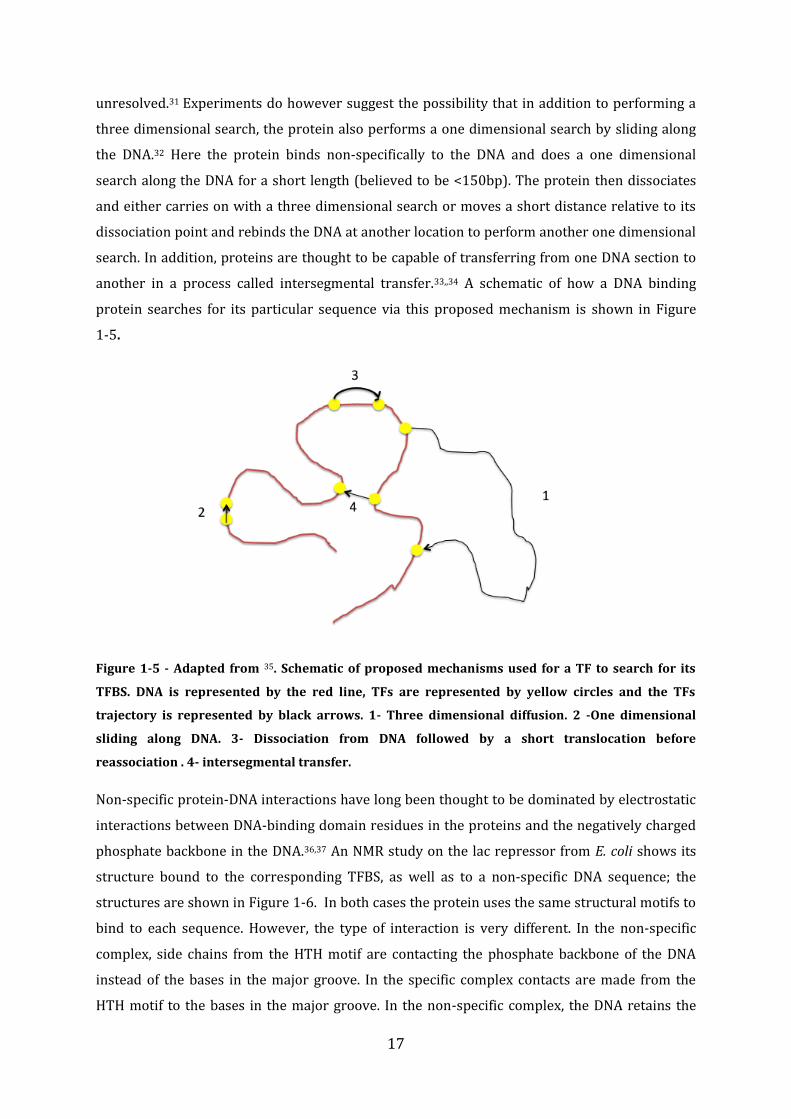
unresolved.31 Experiments do however suggest the possibility that in addition to performing a
three dimensional search, the protein also performs a one dimensional search by sliding along
the DNA.32 Here the protein binds non-specifically to the DNA and does a one dimensional
search along the DNA for a short length (believed to be <150bp). The protein then dissociates
and either carries on with a three dimensional search or moves a short distance relative to its
dissociation point and rebinds the DNA at another location to perform another one dimensional
search. In addition, proteins are thought to be capable of transferring from one DNA section to
another in a process called intersegmental transfer.33,,34 A schematic of how a DNA binding
protein searches for its particular sequence via this proposed mechanism is shown in Figure
1-5.
Figure 1-5 - Adapted from 35. Schematic of proposed mechanisms used for a TF to search for its
TFBS. DNA is represented by the red line, TFs are represented by yellow circles and the TFs
trajectory is represented by black arrows. 1- Three dimensional diffusion. 2 -One dimensional
sliding along DNA. 3- Dissociation from DNA followed by a short translocation before
reassociation . 4- intersegmental transfer.
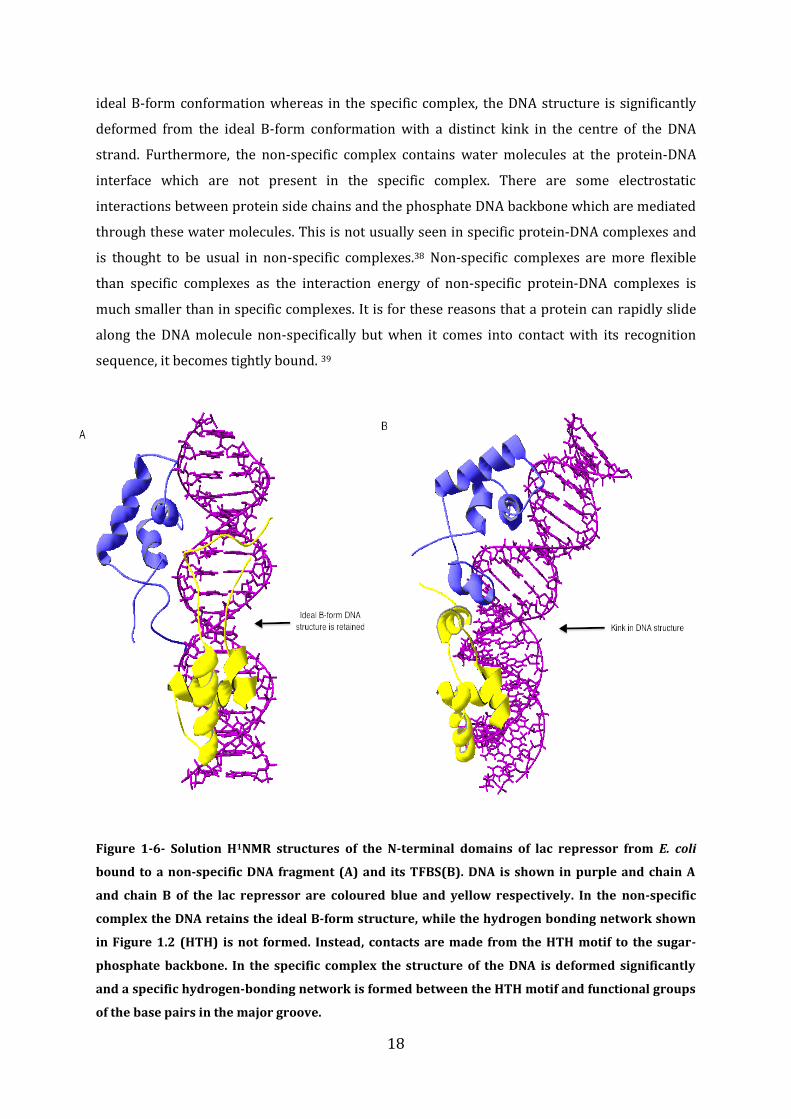
Non-specific protein-DNA interactions have long been thought to be dominated by electrostatic
interactions between DNA-binding domain residues in the proteins and the negatively charged
phosphate backbone in the DNA.36,37 An NMR study on the lac repressor from E. coli shows its
structure bound to the corresponding TFBS, as well as to a non-specific DNA sequence; the
structures are shown in Figure 1-6. In both cases the protein uses the same structural motifs to
bind to each sequence. However, the type of interaction is very different. In the non-specific
complex, side chains from the HTH motif are contacting the phosphate backbone of the DNA
instead of the bases in the major groove. In the specific complex contacts are made from the
HTH motif to the bases in the major groove. In the non-specific complex, the DNA retains the
18
ideal B-form conformation whereas in the specific complex, the DNA structure is significantly
deformed from the ideal B-form conformation with a distinct kink in the centre of the DNA
strand. Furthermore, the non-specific complex contains water molecules at the protein-DNA
interface which are not present in the specific complex. There are some electrostatic
interactions between protein side chains and the phosphate DNA backbone which are mediated
through these water molecules. This is not usually seen in specific protein-DNA complexes and
is thought to be usual in non-specific complexes.38 Non-specific complexes are more flexible
than specific complexes as the interaction energy of non-specific protein-DNA complexes is
much smaller than in specific complexes. It is for these reasons that a protein can rapidly slide
along the DNA molecule non-specifically but when it comes into contact with its recognition
sequence, it becomes tightly bound. 39
Figure 1-6- Solution H1NMR structures of the N-terminal domains of lac repressor from E. coli
bound to a non-specific DNA fragment (A) and its TFBS(B). DNA is shown in purple and chain A
and chain B of the lac repressor are coloured blue and yellow respectively. In the non-specific
complex the DNA retains the ideal B-form structure, while the hydrogen bonding network shown
in Figure 1.2 (HTH) is not formed. Instead, contacts are made from the HTH motif to the sugar-
phosphate backbone. In the specific complex the structure of the DNA is deformed significantly
and a specific hydrogen-bonding network is formed between the HTH motif and functional groups
of the base pairs in the major groove.
19
Once bound to the corresponding TFBS, a TF can then perform its regulatory function.
Repressors can function via several mechanisms; the most common and obvious is called steric
blocking, where the TF binding results in blocking access to one of the core promoter elements.
This prevents the RNAP holoenzyme from binding to the promoter thereby preventing
transcription initiation. Usually the TFBS overlaps with either or both of the -35 or -10
promoter elements, thereby inhibiting binding of the -factor. Some TF have also been found to
prevent the C-terminal domain of the -subunit in RNAP from contacting the UP element.40
Repression is stopped when the TF binds a specific small molecule known as an effector.
Binding of an effector molecule usually induces a conformational change in the repressor
structure, preventing it from specifically binding to the TFBS. Transcription from the operon
then takes place for as long as the signal from the effector molecule prevents the TF from
binding to its TFBS. 41
Other less common mechanisms that are used to repress transcription exist. Some promoters
have TFBSs upstream and downstream of the transcription start site. This is observed in E. coli
with the galETK operon that encodes genes for enzymes which metabolize galactose. Two
TFBSs are located 114bp apart at -60 and +54 of the transcription start site. The TF GalR exists
as a dimer; one dimer binds to each of these TFBS; these dimers can then associate to form a
tetramer. This causes the formation of a loop that contains the transcription start site, resulting
in promotor occlusion and hence repression. Interestingly, full repression is only observed in
the presence of the nucleoid associated protein (NAP) called HU (section 1.2.2).42,43 Also some
repressors bind to DNA upstream of the transcription start site preventing elongation; others
can act by inactivating activator TFs. 44
Activators can also act via several mechanisms, which all function to improve the affinity of
RNAP towards the promoter. The first of these is by binding to the promoter upstream of the -
35 region and recruiting RNAP to the promoter by making contacts with the C-terminal domain
of the -subunit. The TFBS for this mechanism can vary considerably because of the presence of
a flexible linker in the -subunit.45 The second mechanism of activation involves the TF binding
directly adjacent to the -35 region where it again recruits RNAP but this time through
recruitment of the -factor.45 The third mechanism by which a TF can activate a promoter is by
binding near or at the -10 and -35 regions and altering the DNA conformation. This alters the
promoter conformation to allow RNAP to bind and initiate transcription.45 A fourth mechanism
has also been discovered, whereby an activator can cause the inactivation of a repressor
resulting in transcription of the promoter.46 Like repressors, activators often only become active
20
after interacting with a particular effector molecule. Again this allows transcription to be
induced in response to particular signals (i.e. presence of effector molecule).
In addition to activator and repressor TFs, occasionally transcription from a promoter is
regulated by a pair of cognate TFs known as a two component system. Approximately 10% of
the E. coli transcription factors belong to this family. 47 Two component systems consist of a
histidine kinase (HK) protein along with a response regulator (RR) protein. Most HKs are
membrane bound and contain an extracellular “sensing” domain at their N-terminus which can
detect a particular stimulus in the environment. In response to the specific signal, a
conformational change is induced in the HK causing it to become phosphorylated at a conserved
histidine residue.48 This reaction is catalysed by an ATP-binding domain within the HK and the
process is called autophosphorylation. The cognate RR then catalyses the transfer of this
phosphate group to a conserved aspartate residue in its N-terminal “receiver domain”.
Phosphorylation causes a conformational change in the RR that allows it to either activate or
repress transcription from its target promoter. This is achieved by modulating the RRs C-
terminal “output domain” which is usually a DNA binding domain.49,50 As with other TF systems,
two component systems can vary a lot in terms of types of HKs, RRs and the stimuli detected;
however they all function via the same sequence of phosphorylation.51
Based on sequence similarity, TFs are grouped into different protein families.52 By far the most
widely distributed and well-studied family of bacterial TFs is the LysR-type transcriptional
regulator (LTTR) family. The abundance of LTTRs is exemplified by E. coli in which ~15% of its
total 314 TFs belong to this family.52 They can be involved in the transcriptional regulation of a
wide variety of different genes and can respond to many different stimuli.53 LTTRs can act as
activators or repressors and usually regulate a single operon although some have been found to
regulate several genes at several locations within the chromosome.54 LTTRs are often
divergently transcribed from the operon which it regulates, allowing it to negatively regulate its
own transcription.55 LTTR proteins contain a conserved N-terminal wHTH domain. A linker
helix connects the N-terminal domain with a “regulatory” C-terminal which consists of two /
domains (RD1 and RD2) connected by a hinge region. Effector molecules bind to LTTRs at this
hinge region, which is thought to induce conformational changes in the protein.53,55 A schematic
of the LTTR CbnR from Ralstonia eutropha which is thought to represent the general structure
of LTTRs is shown in Figure 1-7. Active LTTRs bind to target DNA as tetramers; usually at two
distinct TFBSs covering approximately 60bp at the promoter.56 Activator LTTRs that are not
bound to an effector molecule, bind to target DNA as two separate dimers. On binding an
effector molecule, the LTTR is subject to a conformational change causing the two dimers to
21
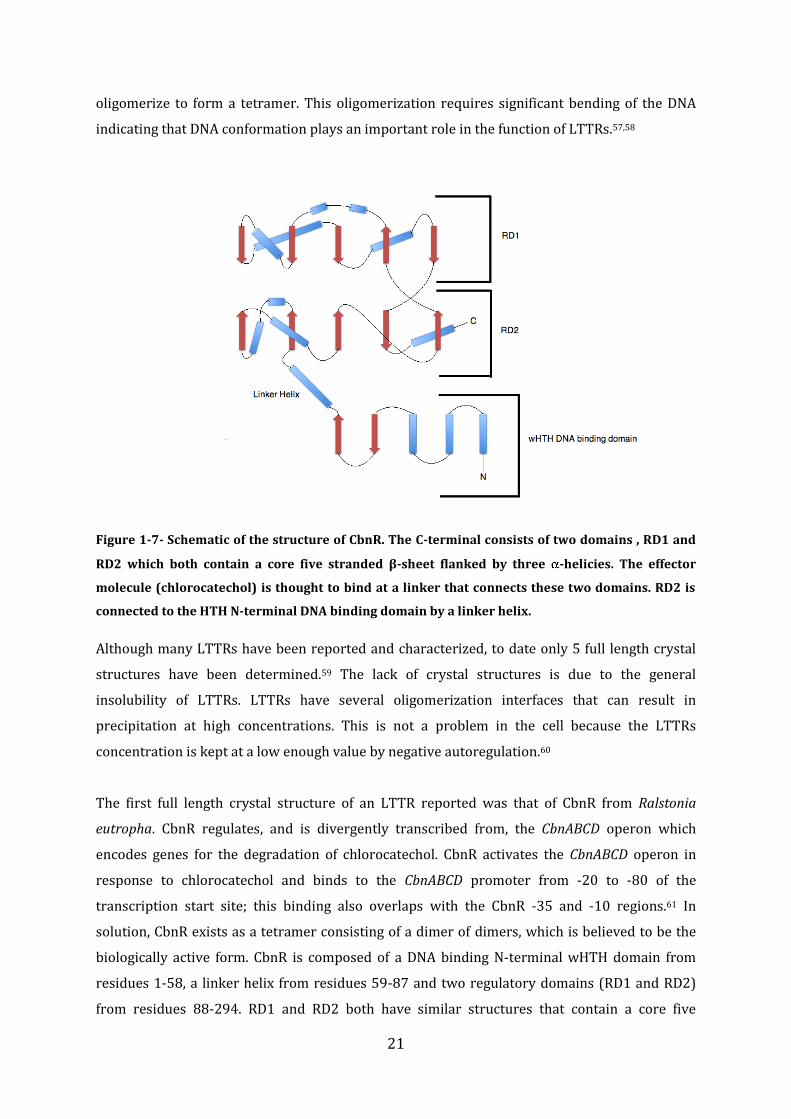
oligomerize to form a tetramer. This oligomerization requires significant bending of the DNA
indicating that DNA conformation plays an important role in the function of LTTRs.57,58
Figure 1-7- Schematic of the structure of CbnR. The C-terminal consists of two domains , RD1 and
RD2 which both contain a core five stranded β-sheet flanked by three -helicies. The effector
molecule (chlorocatechol) is thought to bind at a linker that connects these two domains. RD2 is
connected to the HTH N-terminal DNA binding domain by a linker helix.
Although many LTTRs have been reported and characterized, to date only 5 full length crystal
structures have been determined.59 The lack of crystal structures is due to the general
insolubility of LTTRs. LTTRs have several oligomerization interfaces that can result in
precipitation at high concentrations. This is not a problem in the cell because the LTTRs
concentration is kept at a low enough value by negative autoregulation.60
The first full length crystal structure of an LTTR reported was that of CbnR from Ralstonia
eutropha. CbnR regulates, and is divergently transcribed from, the CbnABCD operon which
encodes genes for the degradation of chlorocatechol. CbnR activates the CbnABCD operon in
response to chlorocatechol and binds to the CbnABCD promoter from -20 to -80 of the
transcription start site; this binding also overlaps with the CbnR -35 and -10 regions.61 In
solution, CbnR exists as a tetramer consisting of a dimer of dimers, which is believed to be the
biologically active form. CbnR is composed of a DNA binding N-terminal wHTH domain from
residues 1-58, a linker helix from residues 59-87 and two regulatory domains (RD1 and RD2)
from residues 88-294. RD1 and RD2 both have similar structures that contain a core five
22
stranded β-sheet flanked by three -helices. A hinge region located between RD1 and RD2 is
where the effector molecule (chlorocatechol) is postulated to bind. The two subunits that make
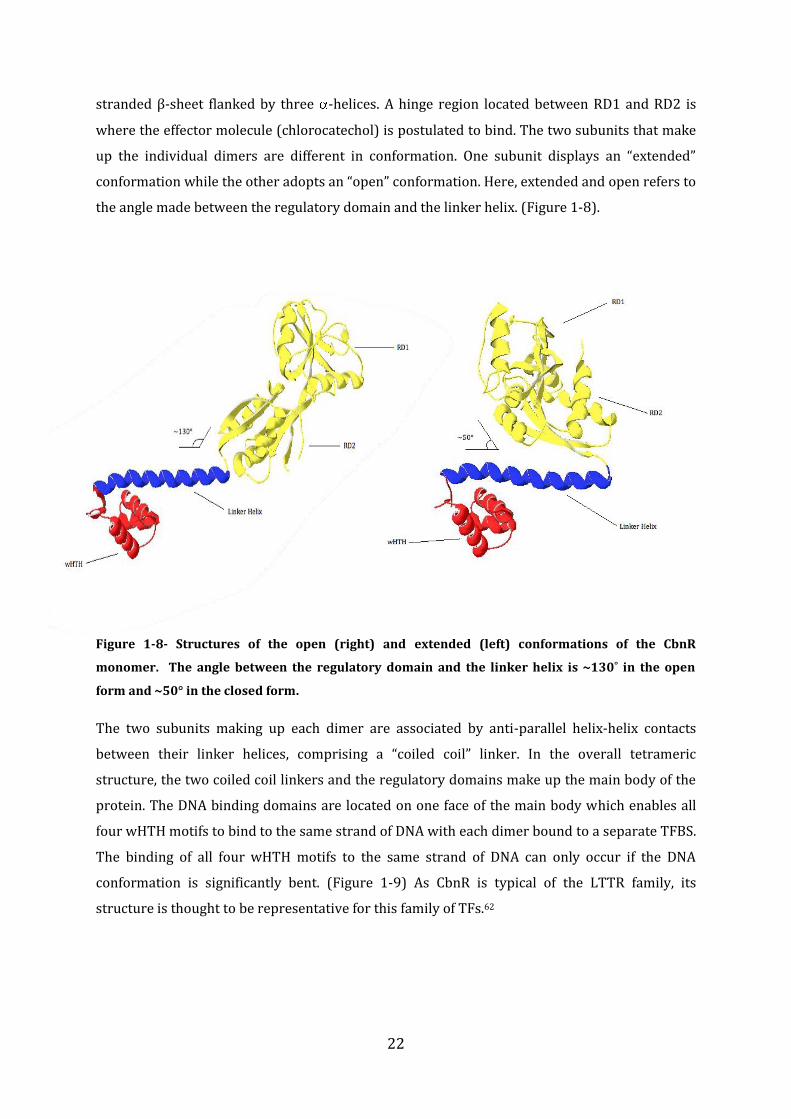
up the individual dimers are different in conformation. One subunit displays an “extended”
conformation while the other adopts an “open” conformation. Here, extended and open refers to
the angle made between the regulatory domain and the linker helix. (Figure 1-8).
Figure 1-8- Structures of the open (right) and extended (left) conformations of the CbnR
monomer. The angle between the regulatory domain and the linker helix is ~130˚ in the open
form and ~50° in the closed form.
The two subunits making up each dimer are associated by anti-parallel helix-helix contacts
between their linker helices, comprising a “coiled coil” linker. In the overall tetrameric
structure, the two coiled coil linkers and the regulatory domains make up the main body of the
protein. The DNA binding domains are located on one face of the main body which enables all
four wHTH motifs to bind to the same strand of DNA with each dimer bound to a separate TFBS.
The binding of all four wHTH motifs to the same strand of DNA can only occur if the DNA
conformation is significantly bent. (Figure 1-9) As CbnR is typical of the LTTR family, its
structure is thought to be representative for this family of TFs.62
23
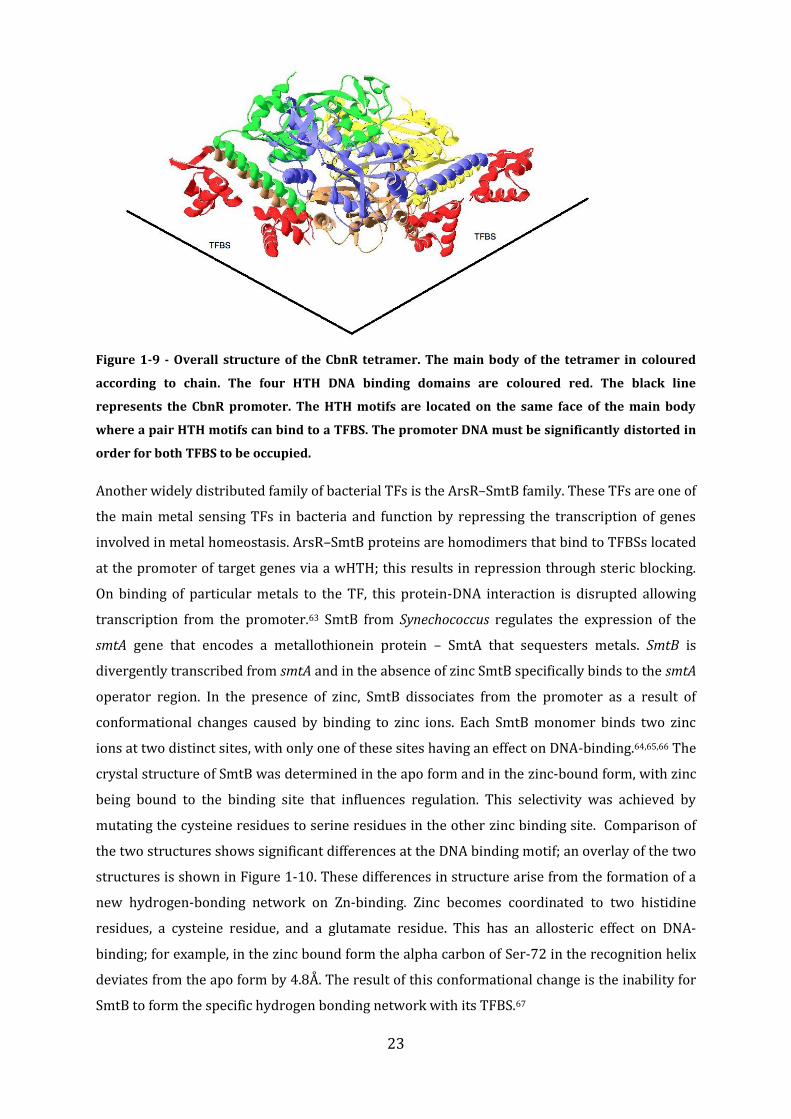
Figure 1-9 - Overall structure of the CbnR tetramer. The main body of the tetramer in coloured
according to chain. The four HTH DNA binding domains are coloured red. The black line
represents the CbnR promoter. The HTH motifs are located on the same face of the main body
where a pair HTH motifs can bind to a TFBS. The promoter DNA must be significantly distorted in
order for both TFBS to be occupied.
Another widely distributed family of bacterial TFs is the ArsR–SmtB family. These TFs are one of
the main metal sensing TFs in bacteria and function by repressing the transcription of genes
involved in metal homeostasis. ArsR–SmtB proteins are homodimers that bind to TFBSs located
at the promoter of target genes via a wHTH; this results in repression through steric blocking.
On binding of particular metals to the TF, this protein-DNA interaction is disrupted allowing
transcription from the promoter.63 SmtB from Synechococcus regulates the expression of the
smtA gene that encodes a metallothionein protein – SmtA that sequesters metals. SmtB is
divergently transcribed from smtA and in the absence of zinc SmtB specifically binds to the smtA
operator region. In the presence of zinc, SmtB dissociates from the promoter as a result of
conformational changes caused by binding to zinc ions. Each SmtB monomer binds two zinc
ions at two distinct sites, with only one of these sites having an effect on DNA-binding.64,65,66 The
crystal structure of SmtB was determined in the apo form and in the zinc-bound form, with zinc
being bound to the binding site that influences regulation. This selectivity was achieved by
mutating the cysteine residues to serine residues in the other zinc binding site. Comparison of
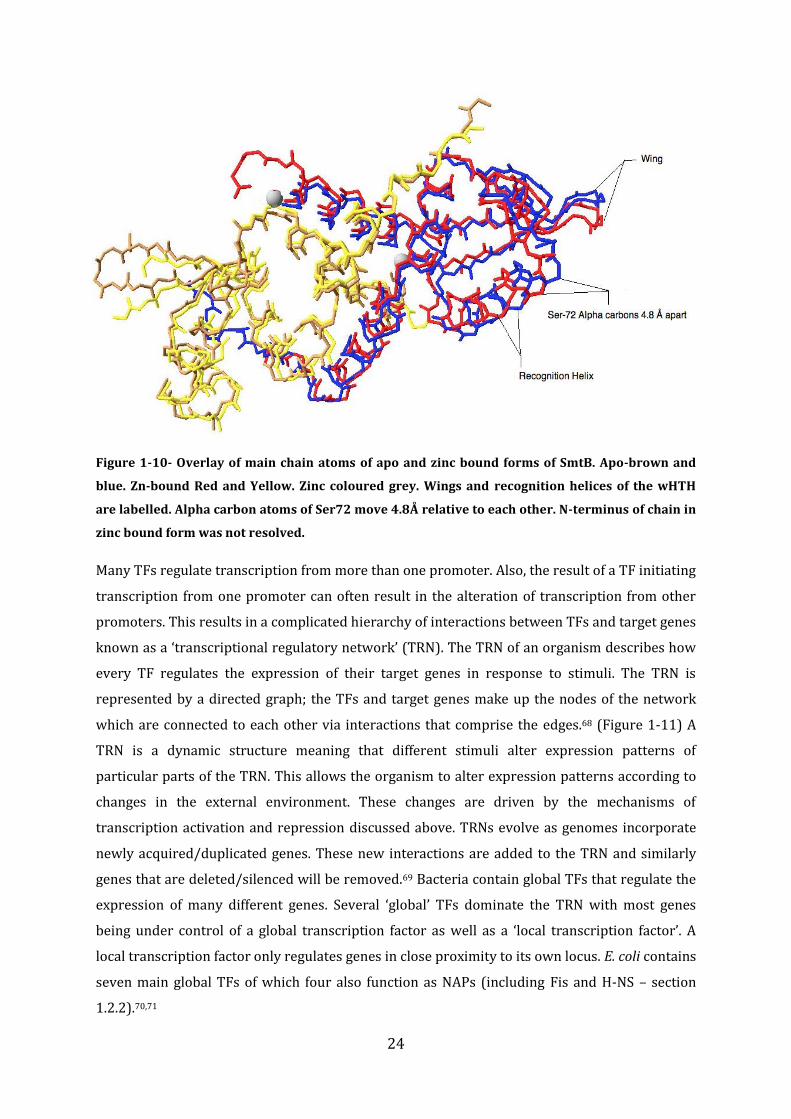
the two structures shows significant differences at the DNA binding motif; an overlay of the two
structures is shown in Figure 1-10. These differences in structure arise from the formation of a
new hydrogen-bonding network on Zn-binding. Zinc becomes coordinated to two histidine
residues, a cysteine residue, and a glutamate residue. This has an allosteric effect on DNA-
binding; for example, in the zinc bound form the alpha carbon of Ser-72 in the recognition helix
deviates from the apo form by 4.8Å. The result of this conformational change is the inability for
SmtB to form the specific hydrogen bonding network with its TFBS.67
24
Figure 1-10- Overlay of main chain atoms of apo and zinc bound forms of SmtB. Apo-brown and
blue. Zn-bound Red and Yellow. Zinc coloured grey. Wings and recognition helices of the wHTH
are labelled. Alpha carbon atoms of Ser72 move 4.8Å relative to each other. N-terminus of chain in
zinc bound form was not resolved.
Many TFs regulate transcription from more than one promoter. Also, the result of a TF initiating
transcription from one promoter can often result in the alteration of transcription from other
promoters. This results in a complicated hierarchy of interactions between TFs and target genes
known as a ‘transcriptional regulatory network’ (TRN). The TRN of an organism describes how
every TF regulates the expression of their target genes in response to stimuli. The TRN is
represented by a directed graph; the TFs and target genes make up the nodes of the network
which are connected to each other via interactions that comprise the edges.68 (Figure 1-11) A
TRN is a dynamic structure meaning that different stimuli alter expression patterns of
particular parts of the TRN. This allows the organism to alter expression patterns according to
changes in the external environment. These changes are driven by the mechanisms of
transcription activation and repression discussed above. TRNs evolve as genomes incorporate
newly acquired/duplicated genes. These new interactions are added to the TRN and similarly
genes that are deleted/silenced will be removed.69 Bacteria contain global TFs that regulate the
expression of many different genes. Several ‘global’ TFs dominate the TRN with most genes
being under control of a global transcription factor as well as a ‘local transcription factor’. A
local transcription factor only regulates genes in close proximity to its own locus. E. coli contains
seven main global TFs of which four also function as NAPs (including Fis and H-NS – section
1.2.2).70,71
25
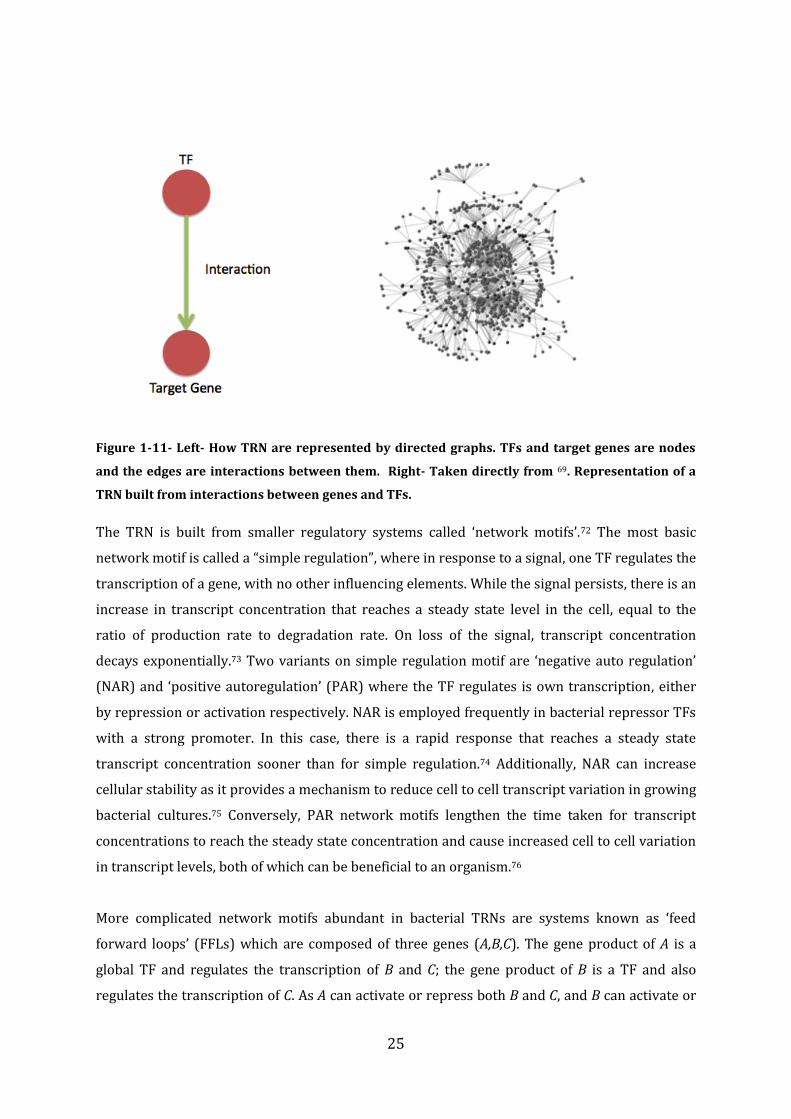
Figure 1-11- Left- How TRN are represented by directed graphs. TFs and target genes are nodes
and the edges are interactions between them. Right- Taken directly from 69. Representation of a
TRN built from interactions between genes and TFs.
The TRN is built from smaller regulatory systems called ‘network motifs’.72 The most basic
network motif is called a “simple regulation”, where in response to a signal, one TF regulates the
transcription of a gene, with no other influencing elements. While the signal persists, there is an
increase in transcript concentration that reaches a steady state level in the cell, equal to the
ratio of production rate to degradation rate. On loss of the signal, transcript concentration
decays exponentially.73 Two variants on simple regulation motif are ‘negative auto regulation’
(NAR) and ‘positive autoregulation’ (PAR) where the TF regulates is own transcription, either
by repression or activation respectively. NAR is employed frequently in bacterial repressor TFs
with a strong promoter. In this case, there is a rapid response that reaches a steady state
transcript concentration sooner than for simple regulation.74 Additionally, NAR can increase
cellular stability as it provides a mechanism to reduce cell to cell transcript variation in growing
bacterial cultures.75 Conversely, PAR network motifs lengthen the time taken for transcript
concentrations to reach the steady state concentration and cause increased cell to cell variation
in transcript levels, both of which can be beneficial to an organism.76
More complicated network motifs abundant in bacterial TRNs are systems known as ‘feed
forward loops’ (FFLs) which are composed of three genes (A,B,C). The gene product of A is a
global TF and regulates the transcription of B and C; the gene product of B is a TF and also
regulates the transcription of C. As A can activate or repress both B and C, and B can activate or
26
repress C, there are eight possible combinations of a FFL. 77 Of the eight possible FFL, two are
most commonly found in bacterial TRNs and are shown in Figure 1-12.78 The first of these is
known as a coherent type-1 FFL (C1-FFL) which is where both A and B are activators. The
behaviour of the C1-FFL depends on whether both A and B (AND logic) or just one of A or B (OR
logic) is required for activation of C. In response to a signal, the use of AND logic at a C1-FFL
causes an initial delay in C production. However, when the signal is lost there is a rapid decrease
in C levels. The initial delay therefore allows for small fluctuations in signal strength without
inducing C transcription. This can be useful if the signal is something that naturally fluctuates
within the cell, so that only strong sustained signals result in induction of C.79 A C1-FFL that
employs OR logic creates an immediate increase in C, but with a delayed decrease. This type of
FFL can enable a prolonged signal response after the signal has been lost. 80
The second most common type of FFL in bacterial TRNs is known as the incoherent type 1 FFL
(I1-FFL). Here, A activates B and C, but B is a repressor of C. I1-FFL can have different outputs
depending on how strong a repressor B is. Initially there is a rapid increase in C; if B is a strong
repressor, a rapid decrease in C will follow which leads to pulses in C concentration. If B does
not fully repress C, then C will reach a steady state concentration quicker than if C was
controlled by simple regulation, therefore providing a rapid response to the stimulus.
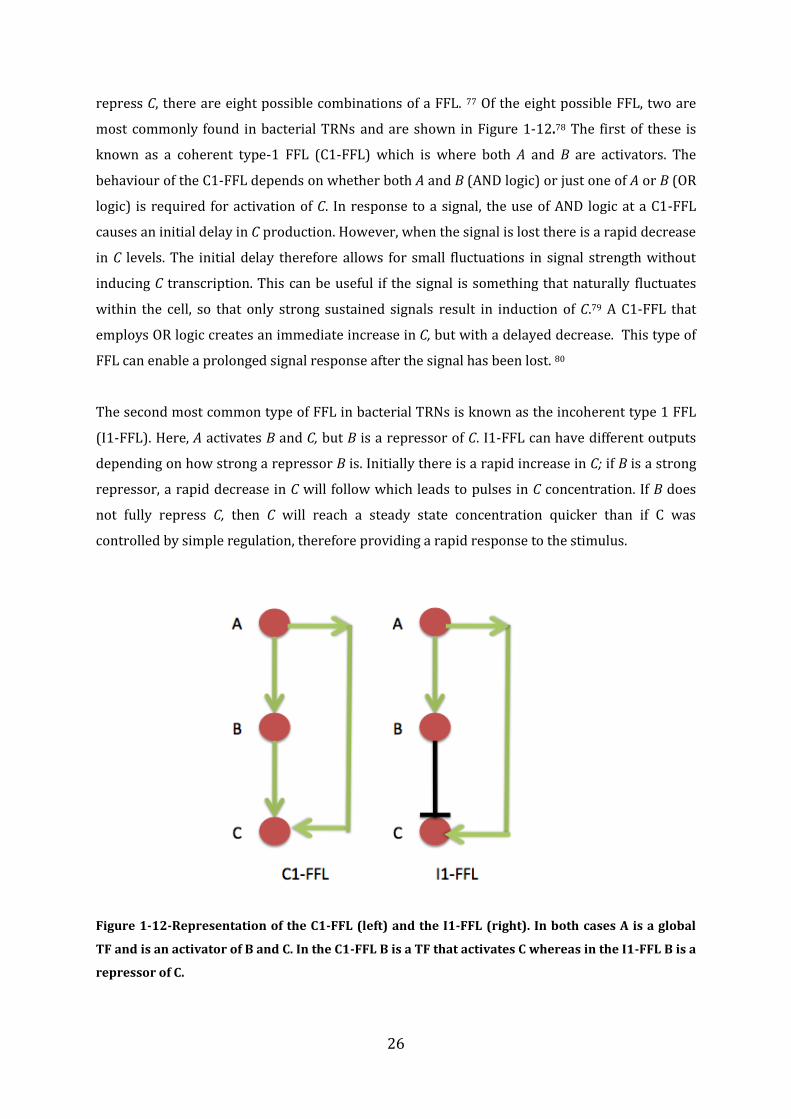
Figure 1-12-Representation of the C1-FFL (left) and the I1-FFL (right). In both cases A is a global
TF and is an activator of B and C. In the C1-FFL B is a TF that activates C whereas in the I1-FFL B is a
repressor of C.
27
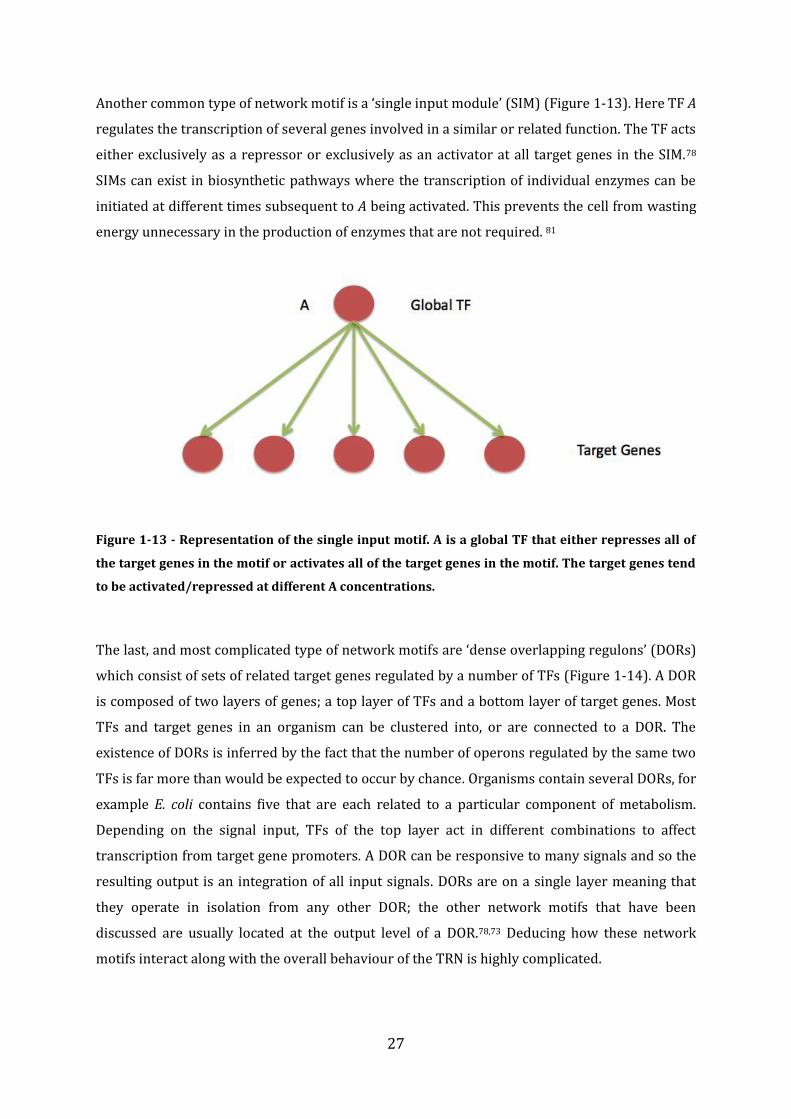
Another common type of network motif is a ‘single input module’ (SIM) (Figure 1-13). Here TF A
regulates the transcription of several genes involved in a similar or related function. The TF acts
either exclusively as a repressor or exclusively as an activator at all target genes in the SIM.78
SIMs can exist in biosynthetic pathways where the transcription of individual enzymes can be
initiated at different times subsequent to A being activated. This prevents the cell from wasting
energy unnecessary in the production of enzymes that are not required. 81
Figure 1-13 - Representation of the single input motif. A is a global TF that either represses all of
the target genes in the motif or activates all of the target genes in the motif. The target genes tend
to be activated/repressed at different A concentrations.
The last, and most complicated type of network motifs are ‘dense overlapping regulons’ (DORs)
which consist of sets of related target genes regulated by a number of TFs (Figure 1-14). A DOR
is composed of two layers of genes; a top layer of TFs and a bottom layer of target genes. Most
TFs and target genes in an organism can be clustered into, or are connected to a DOR. The
existence of DORs is inferred by the fact that the number of operons regulated by the same two
TFs is far more than would be expected to occur by chance. Organisms contain several DORs, for
example E. coli contains five that are each related to a particular component of metabolism.
Depending on the signal input, TFs of the top layer act in different combinations to affect
transcription from target gene promoters. A DOR can be responsive to many signals and so the
resulting output is an integration of all input signals. DORs are on a single layer meaning that
they operate in isolation from any other DOR; the other network motifs that have been
discussed are usually located at the output level of a DOR.78,73 Deducing how these network
motifs interact along with the overall behaviour of the TRN is highly complicated.
28
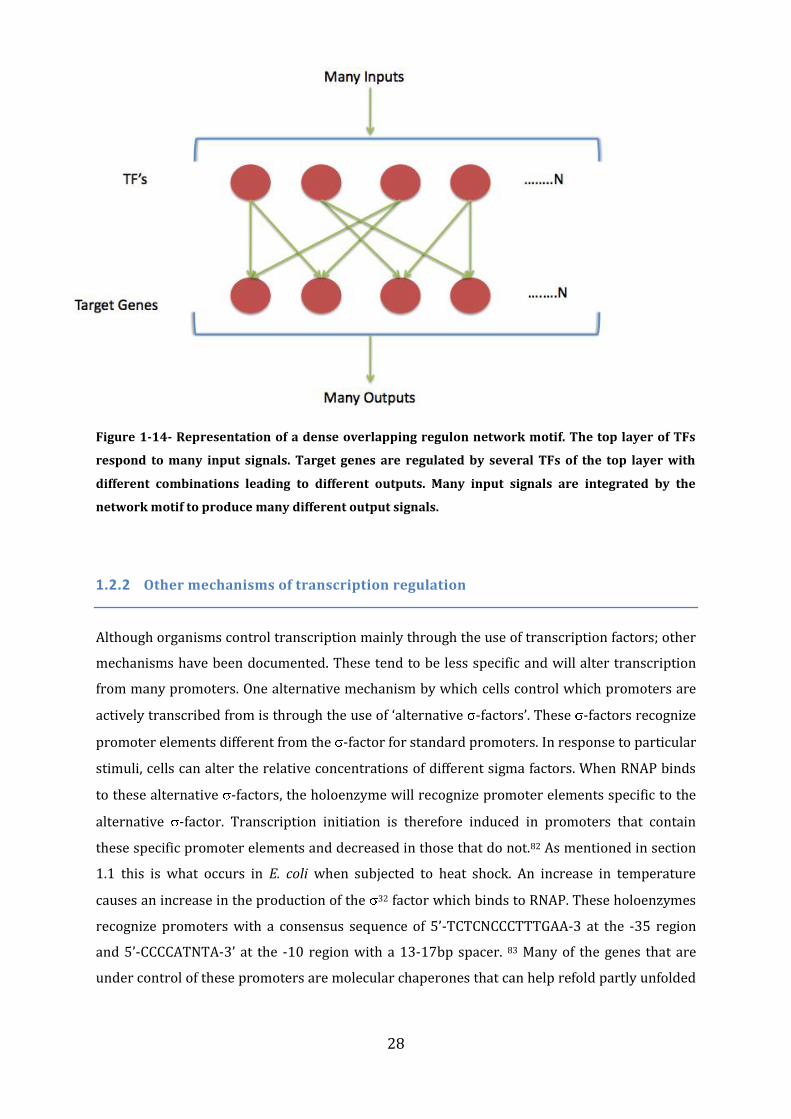
Figure 1-14- Representation of a dense overlapping regulon network motif. The top layer of TFs
respond to many input signals. Target genes are regulated by several TFs of the top layer with
different combinations leading to different outputs. Many input signals are integrated by the
network motif to produce many different output signals.
1.2.2 Other mechanisms of transcription regulation
Although organisms control transcription mainly through the use of transcription factors; other
mechanisms have been documented. These tend to be less specific and will alter transcription
from many promoters. One alternative mechanism by which cells control which promoters are
actively transcribed from is through the use of ‘alternative -factors’. These -factors recognize
promoter elements different from the -factor for standard promoters. In response to particular
stimuli, cells can alter the relative concentrations of different sigma factors. When RNAP binds
to these alternative -factors, the holoenzyme will recognize promoter elements specific to the
alternative -factor. Transcription initiation is therefore induced in promoters that contain
these specific promoter elements and decreased in those that do not.82 As mentioned in section
1.1 this is what occurs in E. coli when subjected to heat shock. An increase in temperature
causes an increase in the production of the 32 factor which binds to RNAP. These holoenzymes
recognize promoters with a consensus sequence of 5’-TCTCNCCCTTTGAA-3 at the -35 region
and 5’-CCCCATNTA-3’ at the -10 region with a 13-17bp spacer. 83 Many of the genes that are
under control of these promoters are molecular chaperones that can help refold partly unfolded
29
proteins. Other genes encode proteases that can remove misfolded and aggregated proteins
from the cell.84
Often the production of an alternative sigma factor is not regulated by the cell and its
concentration remains at a constant level. In this case, the sigma factors are usually present in
an inactive state and only become active in response to particular stimuli. This is achieved
through the use of proteins known as anti sigma factors. Anti sigma factors bind to the
alternative sigma factors preventing them from either associating with RNAP or binding to
promoter elements. Each anti -factor has a specific -factor to which it binds; this complex
dissociates when the anti -factor interacts with a specific signal in the cell.85,86 Anti -factors
can also act upon the standard promoter -factor; the E. coli 70 is inhibited by an anti-sigma
factor called Rsd. When E. coli is reaching the stationary phase of growth, there is an increase in
the cellular concentration of Rsd and an increase in the production of the stationary phase
sigma factor ( S). Rsd associates with 70 preventing it from efficiently binding to RNAP and
from binding to the -35 region at promoters.87 Rsd therefore sequesters 70 when entering the
stationary phase and allows S to bind to RNAP and initiate transcription from stationary phase
promoters.88
Transcription initiation can also be regulated by small molecules. This is what occurs when E.
coli is starved of nutrients. E. coli responds to starvation by conserving energy in what is known
as the stringent response. This response is characterized by a surge in the concentration of the
molecules Guanosine tetraphosphate (ppGpp) and guanosine pentaphosphate (pppGpp); known
collectively as (p)ppGpp. (p)ppGpp causes a global change in transcription, translation,
replication and transport in order for the bacteria to conserve energy. 89 (p)ppGpp is
synthesized in bacteria by enzymes of the RSH family; in E. coli this enzyme is called RelA. RelA
is thought to be activated by sensing a high concentration of unacylated tRNA at the ribosome.90
(p)ppGpp bind near the active site of RNAP; a reaction which is facilitated by the protein DksA.91
This causes RNAP to destabilize open complexes at all promoters. Promoters that are involved
in the production of translational machinery contain a G/C rich discriminative sequence that
makes the open complex quite unstable and very unstable in the presence of ppGpp/DksA. This
causes cellular processes that are involved in protein production to be slowed down.
Conversely, the promoters of biosynthetic pathways such as those that synthesize amino acids
contain an A/T rich discriminative sequence that stabilizes the open complex. These A/T rich
open complexes are able to cope with the destabilizing effect of ppGpp/DksA and so the genes
are preferentially transcribed.92 The stringent response therefore allows E. coli to use available
energy for the production of essential metabolites rather than cell growth and replication when
nutrients are limited. This gives the organism an increased chance of survival. Other stress
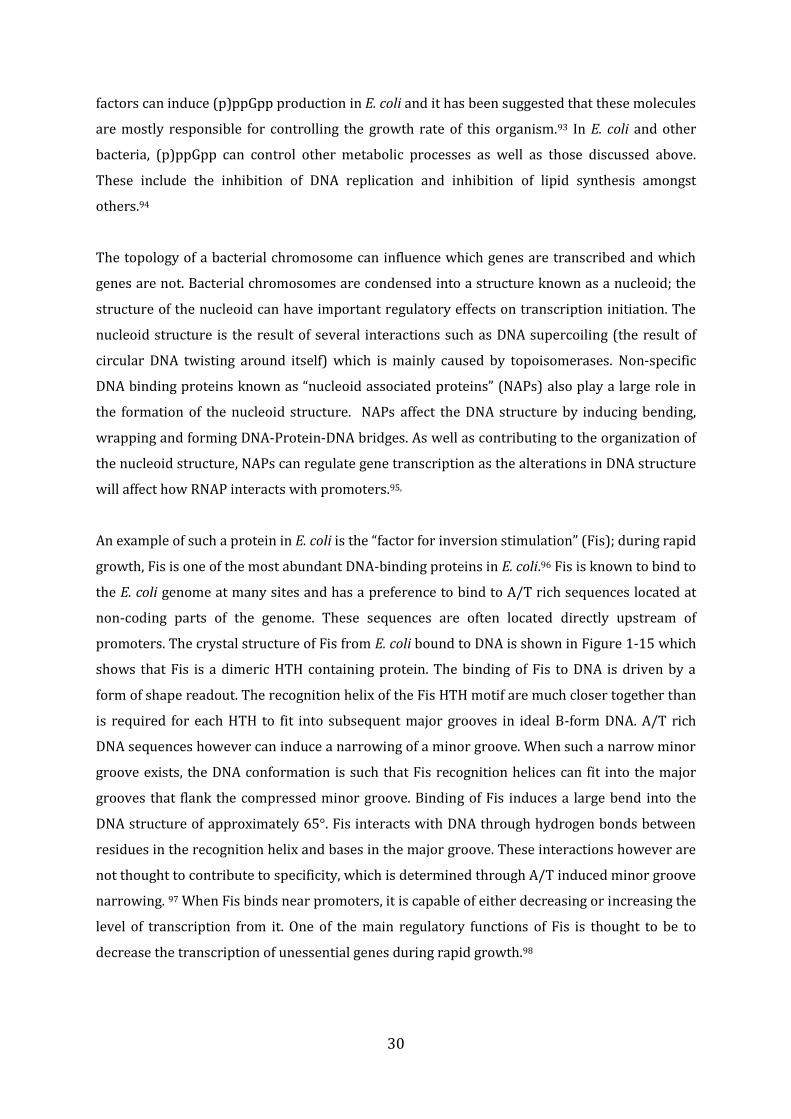
30
factors can induce (p)ppGpp production in E. coli and it has been suggested that these molecules
are mostly responsible for controlling the growth rate of this organism.93 In E. coli and other
bacteria, (p)ppGpp can control other metabolic processes as well as those discussed above.
These include the inhibition of DNA replication and inhibition of lipid synthesis amongst
others.94
The topology of a bacterial chromosome can influence which genes are transcribed and which
genes are not. Bacterial chromosomes are condensed into a structure known as a nucleoid; the
structure of the nucleoid can have important regulatory effects on transcription initiation. The
nucleoid structure is the result of several interactions such as DNA supercoiling (the result of
circular DNA twisting around itself) which is mainly caused by topoisomerases. Non-specific
DNA binding proteins known as “nucleoid associated proteins” (NAPs) also play a large role in
the formation of the nucleoid structure. NAPs affect the DNA structure by inducing bending,
wrapping and forming DNA-Protein-DNA bridges. As well as contributing to the organization of
the nucleoid structure, NAPs can regulate gene transcription as the alterations in DNA structure
will affect how RNAP interacts with promoters.95,
An example of such a protein in E. coli is the “factor for inversion stimulation” (Fis); during rapid
growth, Fis is one of the most abundant DNA-binding proteins in E. coli.96 Fis is known to bind to
the E. coli genome at many sites and has a preference to bind to A/T rich sequences located at
non-coding parts of the genome. These sequences are often located directly upstream of
promoters. The crystal structure of Fis from E. coli bound to DNA is shown in Figure 1-15 which
shows that Fis is a dimeric HTH containing protein. The binding of Fis to DNA is driven by a
form of shape readout. The recognition helix of the Fis HTH motif are much closer together than
is required for each HTH to fit into subsequent major grooves in ideal B-form DNA. A/T rich
DNA sequences however can induce a narrowing of a minor groove. When such a narrow minor
groove exists, the DNA conformation is such that Fis recognition helices can fit into the major
grooves that flank the compressed minor groove. Binding of Fis induces a large bend into the
DNA structure of approximately 65°. Fis interacts with DNA through hydrogen bonds between
residues in the recognition helix and bases in the major groove. These interactions however are
not thought to contribute to specificity, which is determined through A/T induced minor groove
narrowing. 97 When Fis binds near promoters, it is capable of either decreasing or increasing the
level of transcription from it. One of the main regulatory functions of Fis is thought to be to
decrease the transcription of unessential genes during rapid growth.98
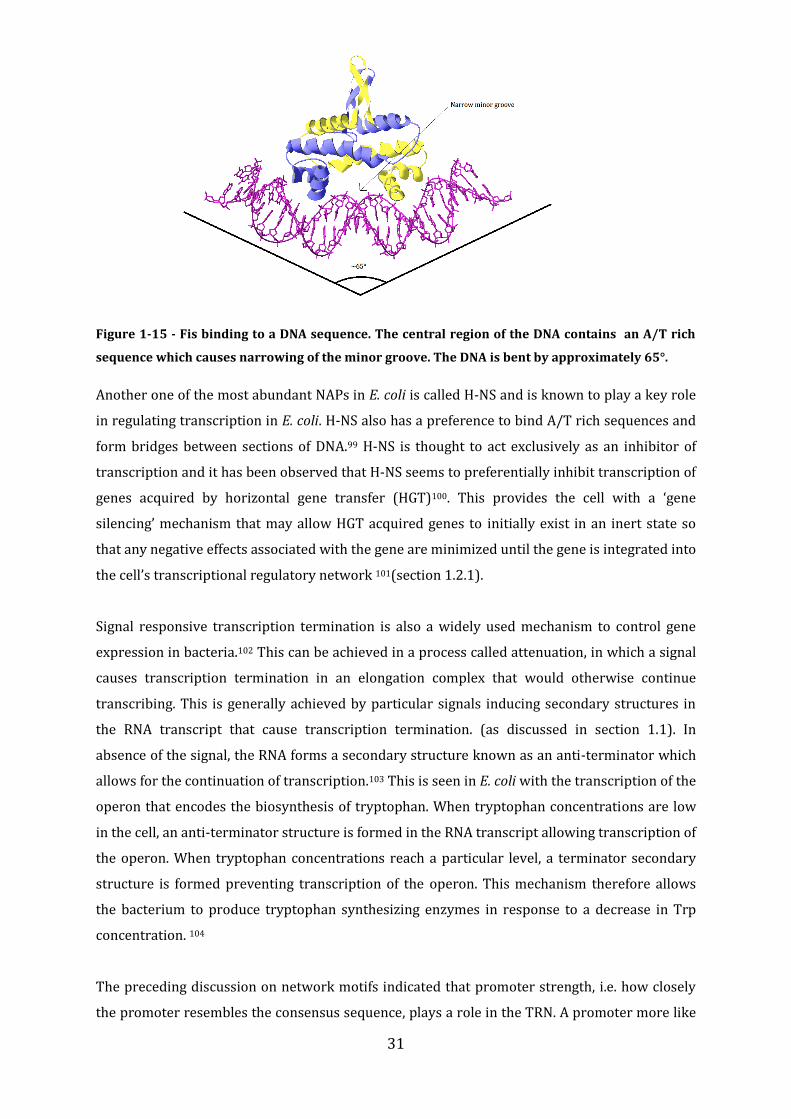
31
Figure 1-15 - Fis binding to a DNA sequence. The central region of the DNA contains an A/T rich
sequence which causes narrowing of the minor groove. The DNA is bent by approximately 65°.
Another one of the most abundant NAPs in E. coli is called H-NS and is known to play a key role
in regulating transcription in E. coli. H-NS also has a preference to bind A/T rich sequences and
form bridges between sections of DNA.99 H-NS is thought to act exclusively as an inhibitor of
transcription and it has been observed that H-NS seems to preferentially inhibit transcription of
genes acquired by horizontal gene transfer (HGT)100. This provides the cell with a ‘gene
silencing’ mechanism that may allow HGT acquired genes to initially exist in an inert state so
that any negative effects associated with the gene are minimized until the gene is integrated into
the cell’s transcriptional regulatory network 101(section 1.2.1).
Signal responsive transcription termination is also a widely used mechanism to control gene
expression in bacteria.102 This can be achieved in a process called attenuation, in which a signal
causes transcription termination in an elongation complex that would otherwise continue
transcribing. This is generally achieved by particular signals inducing secondary structures in
the RNA transcript that cause transcription termination. (as discussed in section 1.1). In
absence of the signal, the RNA forms a secondary structure known as an anti-terminator which
allows for the continuation of transcription.103 This is seen in E. coli with the transcription of the
operon that encodes the biosynthesis of tryptophan. When tryptophan concentrations are low
in the cell, an anti-terminator structure is formed in the RNA transcript allowing transcription of
the operon. When tryptophan concentrations reach a particular level, a terminator secondary
structure is formed preventing transcription of the operon. This mechanism therefore allows
the bacterium to produce tryptophan synthesizing enzymes in response to a decrease in Trp
concentration. 104
The preceding discussion on network motifs indicated that promoter strength, i.e. how closely
the promoter resembles the consensus sequence, plays a role in the TRN. A promoter more like
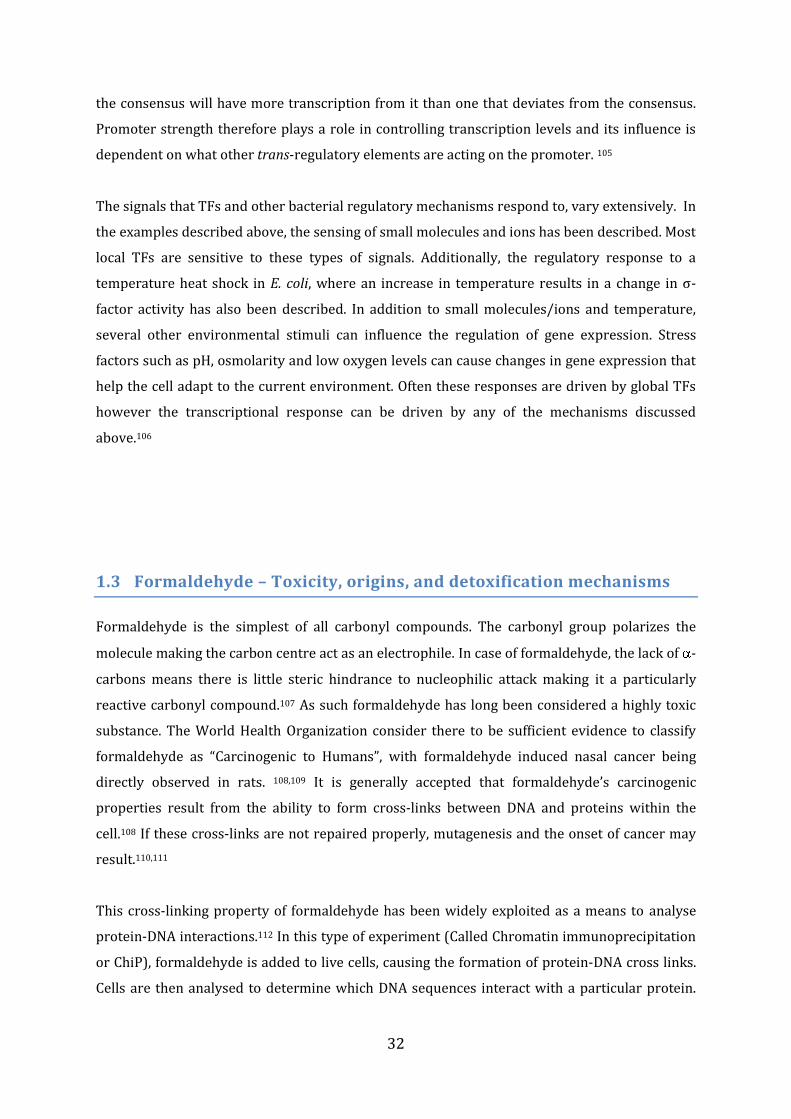
32
the consensus will have more transcription from it than one that deviates from the consensus.
Promoter strength therefore plays a role in controlling transcription levels and its influence is
dependent on what other trans-regulatory elements are acting on the promoter. 105
The signals that TFs and other bacterial regulatory mechanisms respond to, vary extensively. In
the examples described above, the sensing of small molecules and ions has been described. Most
local TFs are sensitive to these types of signals. Additionally, the regulatory response to a
temperature heat shock in E. coli, where an increase in temperature results in a change in σ-
factor activity has also been described. In addition to small molecules/ions and temperature,
several other environmental stimuli can influence the regulation of gene expression. Stress
factors such as pH, osmolarity and low oxygen levels can cause changes in gene expression that
help the cell adapt to the current environment. Often these responses are driven by global TFs
however the transcriptional response can be driven by any of the mechanisms discussed
above.106
1.3 Formaldehyde – Toxicity, origins, and detoxification mechanisms
Formaldehyde is the simplest of all carbonyl compounds. The carbonyl group polarizes the
molecule making the carbon centre act as an electrophile. In case of formaldehyde, the lack of -
carbons means there is little steric hindrance to nucleophilic attack making it a particularly
reactive carbonyl compound.107 As such formaldehyde has long been considered a highly toxic
substance. The World Health Organization consider there to be sufficient evidence to classify
formaldehyde as “Carcinogenic to Humans”, with formaldehyde induced nasal cancer being
directly observed in rats. 108,109 It is generally accepted that formaldehyde’s carcinogenic
properties result from the ability to form cross-links between DNA and proteins within the
cell.108 If these cross-links are not repaired properly, mutagenesis and the onset of cancer may
result.110,111
This cross-linking property of formaldehyde has been widely exploited as a means to analyse
protein-DNA interactions.112 In this type of experiment (Called Chromatin immunoprecipitation
or ChiP), formaldehyde is added to live cells, causing the formation of protein-DNA cross links.
Cells are then analysed to determine which DNA sequences interact with a particular protein.
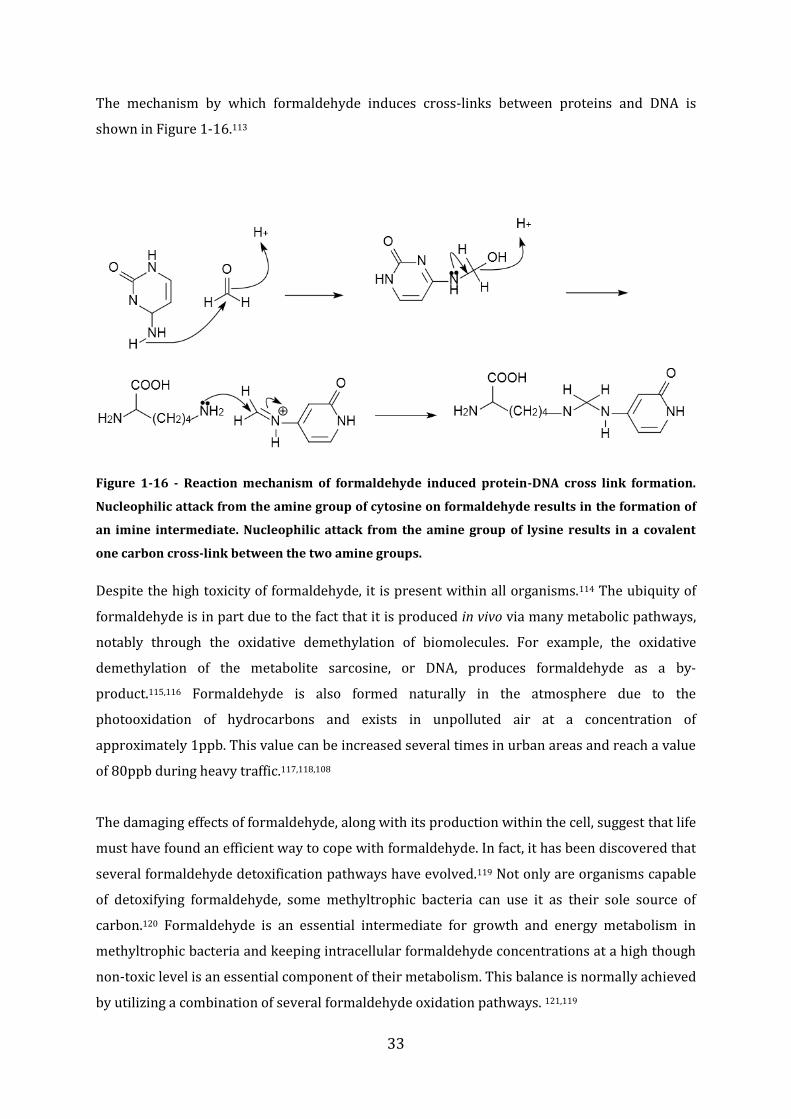
33
The mechanism by which formaldehyde induces cross-links between proteins and DNA is
shown in Figure 1-16.113
Figure 1-16 - Reaction mechanism of formaldehyde induced protein-DNA cross link formation.
Nucleophilic attack from the amine group of cytosine on formaldehyde results in the formation of
an imine intermediate. Nucleophilic attack from the amine group of lysine results in a covalent
one carbon cross-link between the two amine groups.
Despite the high toxicity of formaldehyde, it is present within all organisms.114 The ubiquity of
formaldehyde is in part due to the fact that it is produced in vivo via many metabolic pathways,
notably through the oxidative demethylation of biomolecules. For example, the oxidative
demethylation of the metabolite sarcosine, or DNA, produces formaldehyde as a by-
product.115,116 Formaldehyde is also formed naturally in the atmosphere due to the
photooxidation of hydrocarbons and exists in unpolluted air at a concentration of
approximately 1ppb. This value can be increased several times in urban areas and reach a value
of 80ppb during heavy traffic.117,118,108
The damaging effects of formaldehyde, along with its production within the cell, suggest that life
must have found an efficient way to cope with formaldehyde. In fact, it has been discovered that
several formaldehyde detoxification pathways have evolved.119 Not only are organisms capable
of detoxifying formaldehyde, some methyltrophic bacteria can use it as their sole source of
carbon.120 Formaldehyde is an essential intermediate for growth and energy metabolism in
methyltrophic bacteria and keeping intracellular formaldehyde concentrations at a high though
non-toxic level is an essential component of their metabolism. This balance is normally achieved
by utilizing a combination of several formaldehyde oxidation pathways. 121,119
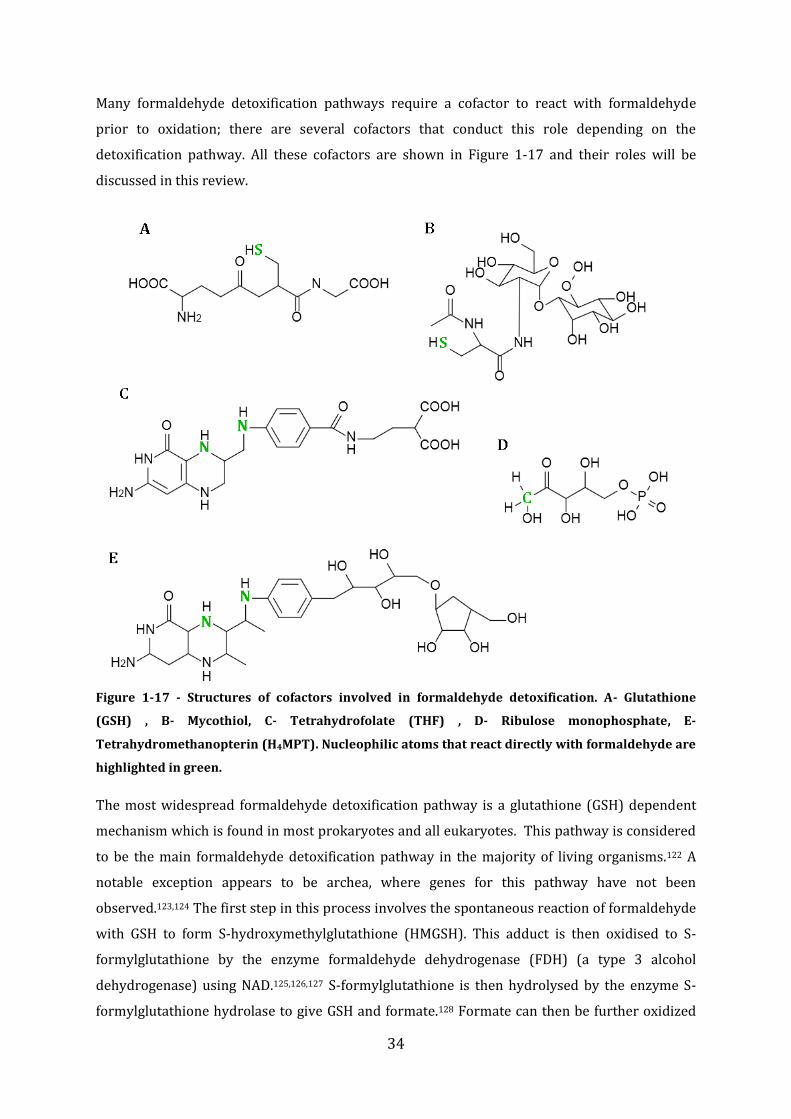
34
Many formaldehyde detoxification pathways require a cofactor to react with formaldehyde
prior to oxidation; there are several cofactors that conduct this role depending on the
detoxification pathway. All these cofactors are shown in Figure 1-17 and their roles will be
discussed in this review.
Figure 1-17 - Structures of cofactors involved in formaldehyde detoxification. A- Glutathione
(GSH) , B- Mycothiol, C- Tetrahydrofolate (THF) , D- Ribulose monophosphate, E-
Tetrahydromethanopterin (H4MPT). Nucleophilic atoms that react directly with formaldehyde are
highlighted in green.
The most widespread formaldehyde detoxification pathway is a glutathione (GSH) dependent
mechanism which is found in most prokaryotes and all eukaryotes. This pathway is considered
to be the main formaldehyde detoxification pathway in the majority of living organisms.122 A
notable exception appears to be archea, where genes for this pathway have not been
observed.123,124 The first step in this process involves the spontaneous reaction of formaldehyde
with GSH to form S-hydroxymethylglutathione (HMGSH). This adduct is then oxidised to S-
formylglutathione by the enzyme formaldehyde dehydrogenase (FDH) (a type 3 alcohol
dehydrogenase) using NAD.125,126,127 S-formylglutathione is then hydrolysed by the enzyme S-
formylglutathione hydrolase to give GSH and formate.128 Formate can then be further oxidized
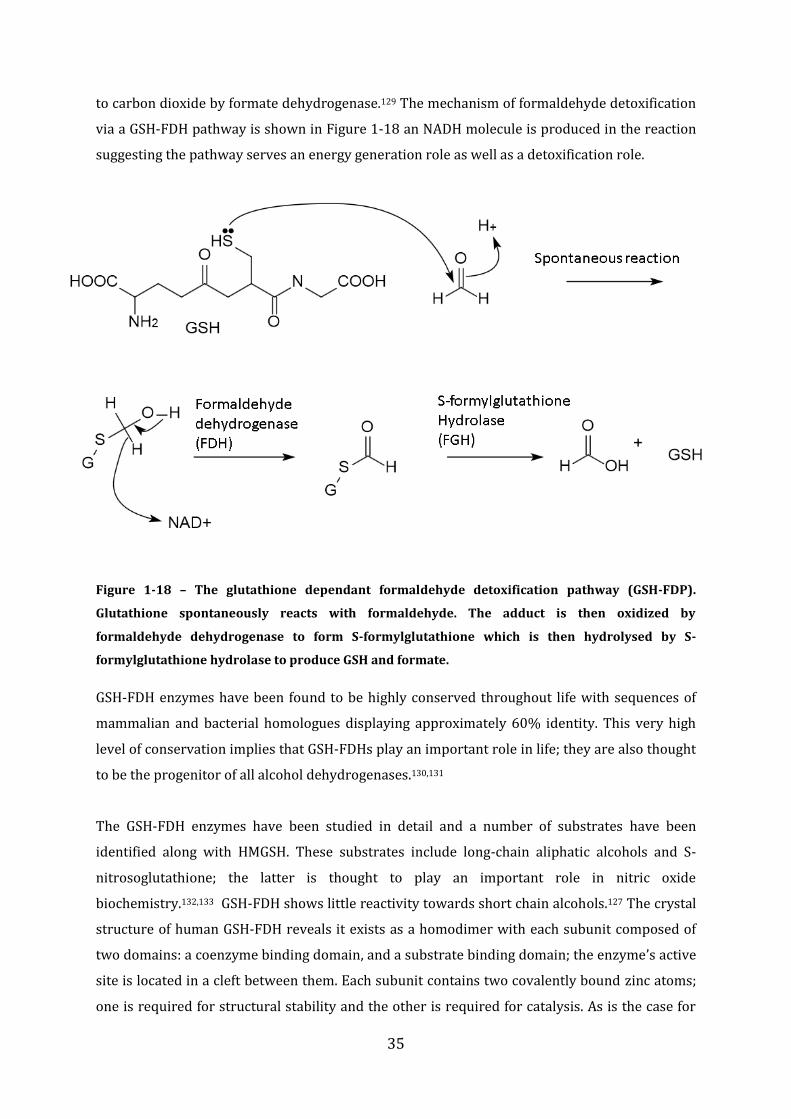
35
to carbon dioxide by formate dehydrogenase.129 The mechanism of formaldehyde detoxification
via a GSH-FDH pathway is shown in Figure 1-18 an NADH molecule is produced in the reaction
suggesting the pathway serves an energy generation role as well as a detoxification role.
Figure 1-18 – The glutathione dependant formaldehyde detoxification pathway (GSH-FDP).
Glutathione spontaneously reacts with formaldehyde. The adduct is then oxidized by
formaldehyde dehydrogenase to form S-formylglutathione which is then hydrolysed by S-
formylglutathione hydrolase to produce GSH and formate.
GSH-FDH enzymes have been found to be highly conserved throughout life with sequences of
mammalian and bacterial homologues displaying approximately 60% identity. This very high
level of conservation implies that GSH-FDHs play an important role in life; they are also thought
to be the progenitor of all alcohol dehydrogenases.130,131
The GSH-FDH enzymes have been studied in detail and a number of substrates have been
identified along with HMGSH. These substrates include long-chain aliphatic alcohols and S-
nitrosoglutathione; the latter is thought to play an important role in nitric oxide
biochemistry.132,133 GSH-FDH shows little reactivity towards short chain alcohols.127 The crystal
structure of human GSH-FDH reveals it exists as a homodimer with each subunit composed of
two domains: a coenzyme binding domain, and a substrate binding domain; the enzyme’s active
site is located in a cleft between them. Each subunit contains two covalently bound zinc atoms;
one is required for structural stability and the other is required for catalysis. As is the case for
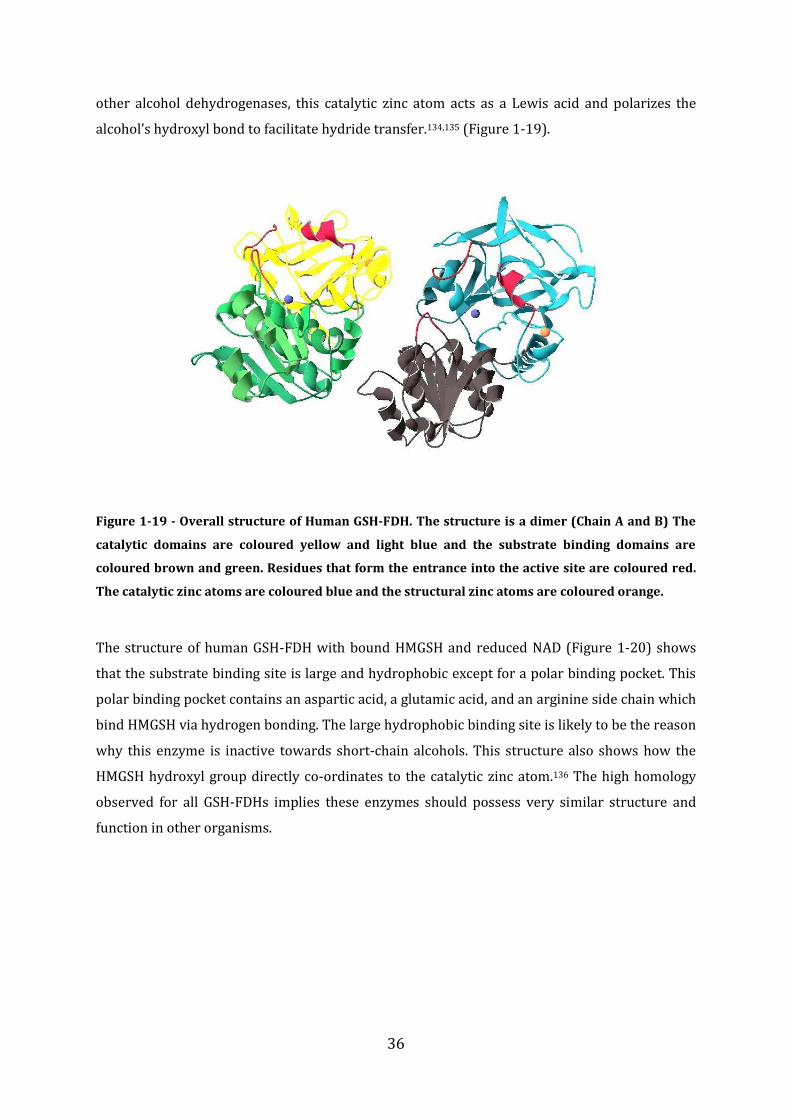
36
other alcohol dehydrogenases, this catalytic zinc atom acts as a Lewis acid and polarizes the
alcohol’s hydroxyl bond to facilitate hydride transfer.134,135 (Figure 1-19).
Figure 1-19 - Overall structure of Human GSH-FDH. The structure is a dimer (Chain A and B) The
catalytic domains are coloured yellow and light blue and the substrate binding domains are
coloured brown and green. Residues that form the entrance into the active site are coloured red.
The catalytic zinc atoms are coloured blue and the structural zinc atoms are coloured orange.
The structure of human GSH-FDH with bound HMGSH and reduced NAD (Figure 1-20) shows
that the substrate binding site is large and hydrophobic except for a polar binding pocket. This
polar binding pocket contains an aspartic acid, a glutamic acid, and an arginine side chain which
bind HMGSH via hydrogen bonding. The large hydrophobic binding site is likely to be the reason
why this enzyme is inactive towards short-chain alcohols. This structure also shows how the
HMGSH hydroxyl group directly co-ordinates to the catalytic zinc atom.136 The high homology
observed for all GSH-FDHs implies these enzymes should possess very similar structure and
function in other organisms.
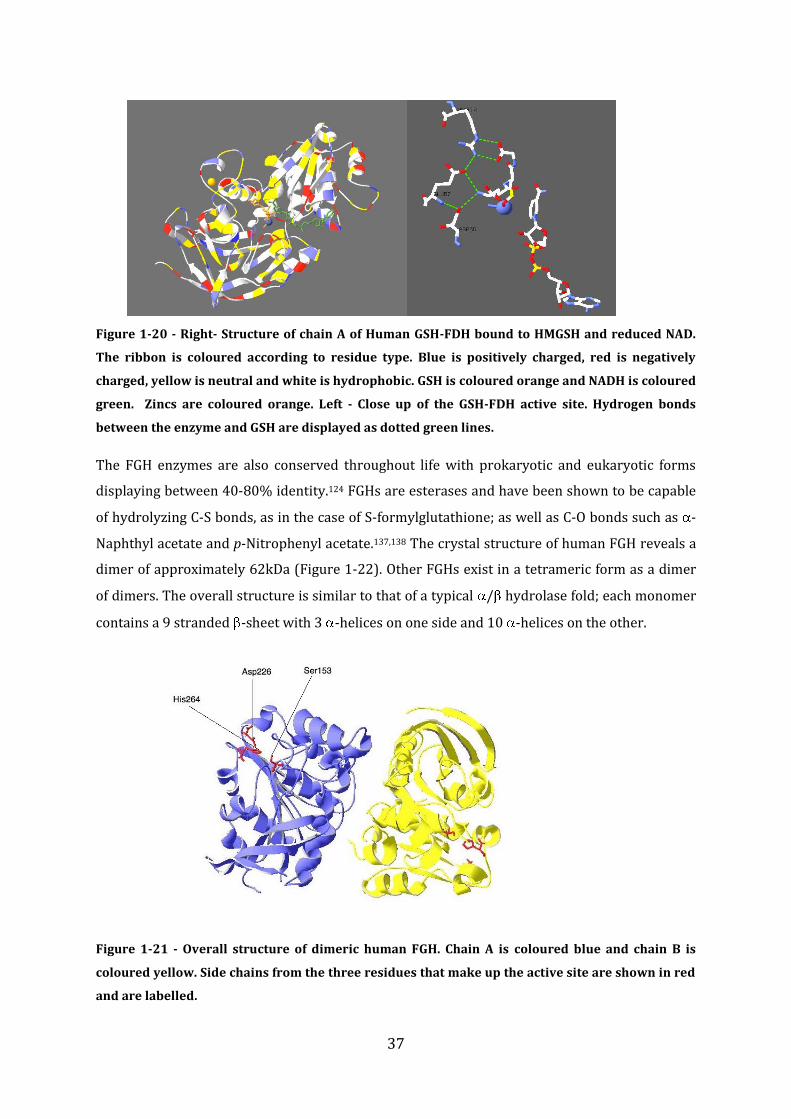
37
Figure 1-20 - Right- Structure of chain A of Human GSH-FDH bound to HMGSH and reduced NAD.
The ribbon is coloured according to residue type. Blue is positively charged, red is negatively
charged, yellow is neutral and white is hydrophobic. GSH is coloured orange and NADH is coloured
green. Zincs are coloured orange. Left - Close up of the GSH-FDH active site. Hydrogen bonds
between the enzyme and GSH are displayed as dotted green lines.
The FGH enzymes are also conserved throughout life with prokaryotic and eukaryotic forms
displaying between 40-80% identity.124 FGHs are esterases and have been shown to be capable
of hydrolyzing C-S bonds, as in the case of S-formylglutathione; as well as C-O bonds such as -
Naphthyl acetate and p-Nitrophenyl acetate.137,138 The crystal structure of human FGH reveals a
dimer of approximately 62kDa (Figure 1-22). Other FGHs exist in a tetrameric form as a dimer
of dimers. The overall structure is similar to that of a typical / hydrolase fold; each monomer
contains a 9 stranded -sheet with 3 -helices on one side and 10 -helices on the other.
Figure 1-21 - Overall structure of dimeric human FGH. Chain A is coloured blue and chain B is
coloured yellow. Side chains from the three residues that make up the active site are shown in red
and are labelled.
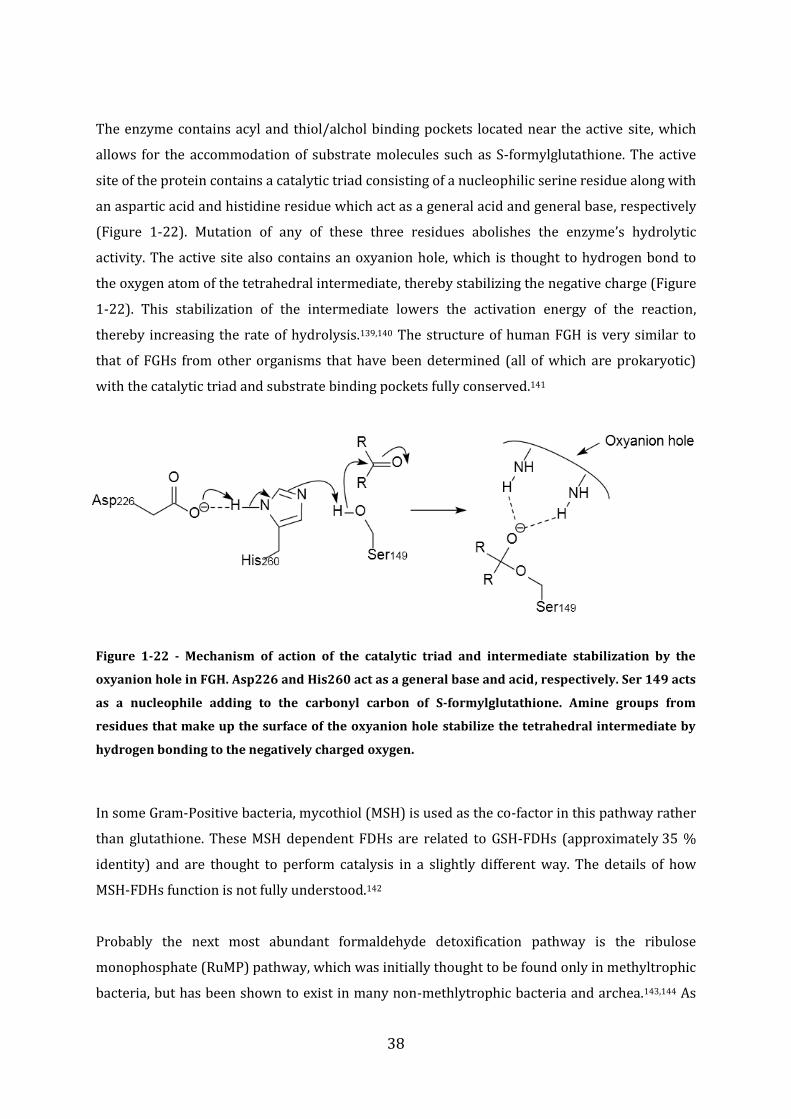
38
The enzyme contains acyl and thiol/alchol binding pockets located near the active site, which
allows for the accommodation of substrate molecules such as S-formylglutathione. The active
site of the protein contains a catalytic triad consisting of a nucleophilic serine residue along with
an aspartic acid and histidine residue which act as a general acid and general base, respectively
(Figure 1-22). Mutation of any of these three residues abolishes the enzyme’s hydrolytic
activity. The active site also contains an oxyanion hole, which is thought to hydrogen bond to
the oxygen atom of the tetrahedral intermediate, thereby stabilizing the negative charge (Figure
1-22). This stabilization of the intermediate lowers the activation energy of the reaction,
thereby increasing the rate of hydrolysis.139,140 The structure of human FGH is very similar to
that of FGHs from other organisms that have been determined (all of which are prokaryotic)
with the catalytic triad and substrate binding pockets fully conserved.141
Figure 1-22 - Mechanism of action of the catalytic triad and intermediate stabilization by the
oxyanion hole in FGH. Asp226 and His260 act as a general base and acid, respectively. Ser 149 acts
as a nucleophile adding to the carbonyl carbon of S-formylglutathione. Amine groups from
residues that make up the surface of the oxyanion hole stabilize the tetrahedral intermediate by
hydrogen bonding to the negatively charged oxygen.
In some Gram-Positive bacteria, mycothiol (MSH) is used as the co-factor in this pathway rather
than glutathione. These MSH dependent FDHs are related to GSH-FDHs (approximately 35 %
identity) and are thought to perform catalysis in a slightly different way. The details of how
MSH-FDHs function is not fully understood.142
Probably the next most abundant formaldehyde detoxification pathway is the ribulose
monophosphate (RuMP) pathway, which was initially thought to be found only in methyltrophic
bacteria, but has been shown to exist in many non-methlytrophic bacteria and archea.143,144 As

39
well as its role in detoxification, the RuMP pathway is one of the most important mechanisms of
formaldehyde fixation in methyltrophic bacteria145. The first step in this process is an aldol
condensation between formaldehyde and ribulose 5-phosphate which is catalysed by 3-
hexulose-6-phosphate synthase (HPS). D-arabino-3-hexulose-6-phosphate is then isomerised by
the enzyme 6-phospho-3-hexuloisomerase (PHI) to give fructose 6-phosphate. The product
fructose 6-phosphate can then be phosphorylated to fructose 1,6-biphosphate within the cell
which is further metabolized to pyruvate by glycolysis.146,147 The mechanism for this process is
shown in Figure 1.23.
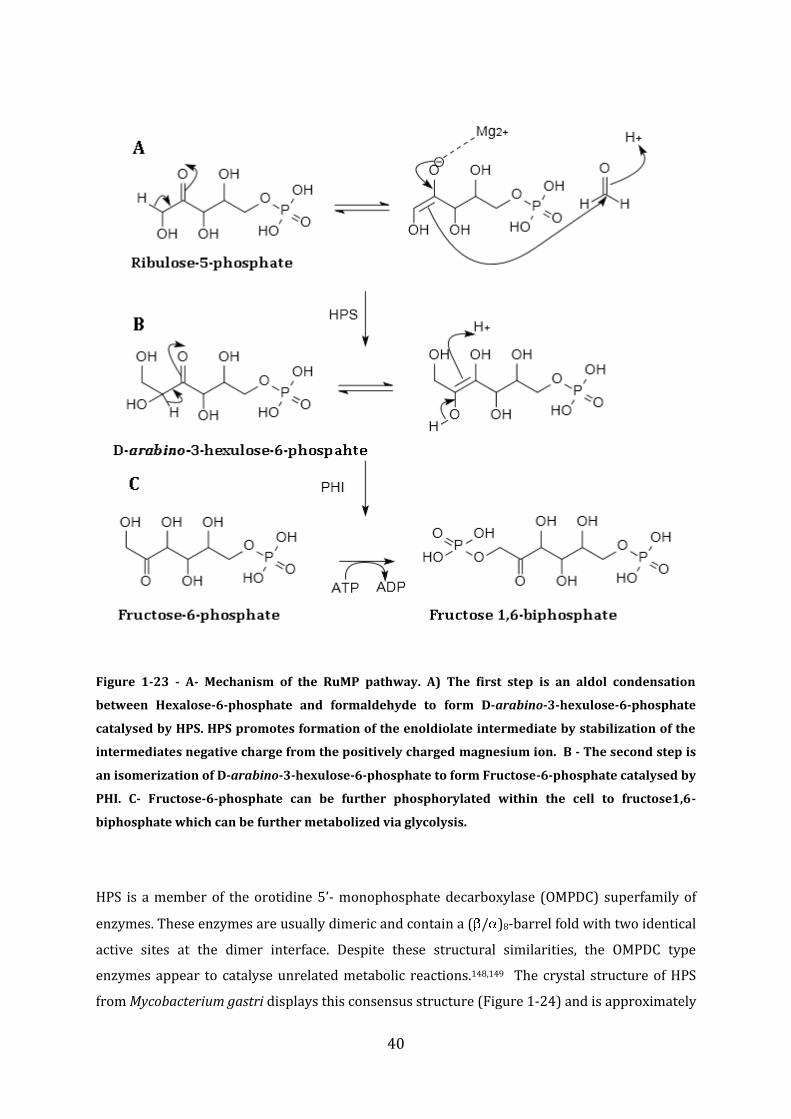
40
Figure 1-23 - A- Mechanism of the RuMP pathway. A) The first step is an aldol condensation
between Hexalose-6-phosphate and formaldehyde to form D-arabino-3-hexulose-6-phosphate
catalysed by HPS. HPS promotes formation of the enoldiolate intermediate by stabilization of the
intermediates negative charge from the positively charged magnesium ion. B - The second step is
an isomerization of D-arabino-3-hexulose-6-phosphate to form Fructose-6-phosphate catalysed by
PHI. C- Fructose-6-phosphate can be further phosphorylated within the cell to fructose1,6-
biphosphate which can be further metabolized via glycolysis.
HPS is a member of the orotidine 5’- monophosphate decarboxylase (OMPDC) superfamily of
enzymes. These enzymes are usually dimeric and contain a ( / )8-barrel fold with two identical
active sites at the dimer interface. Despite these structural similarities, the OMPDC type
enzymes appear to catalyse unrelated metabolic reactions.148,149 The crystal structure of HPS
from Mycobacterium gastri displays this consensus structure (Figure 1-24) and is approximately
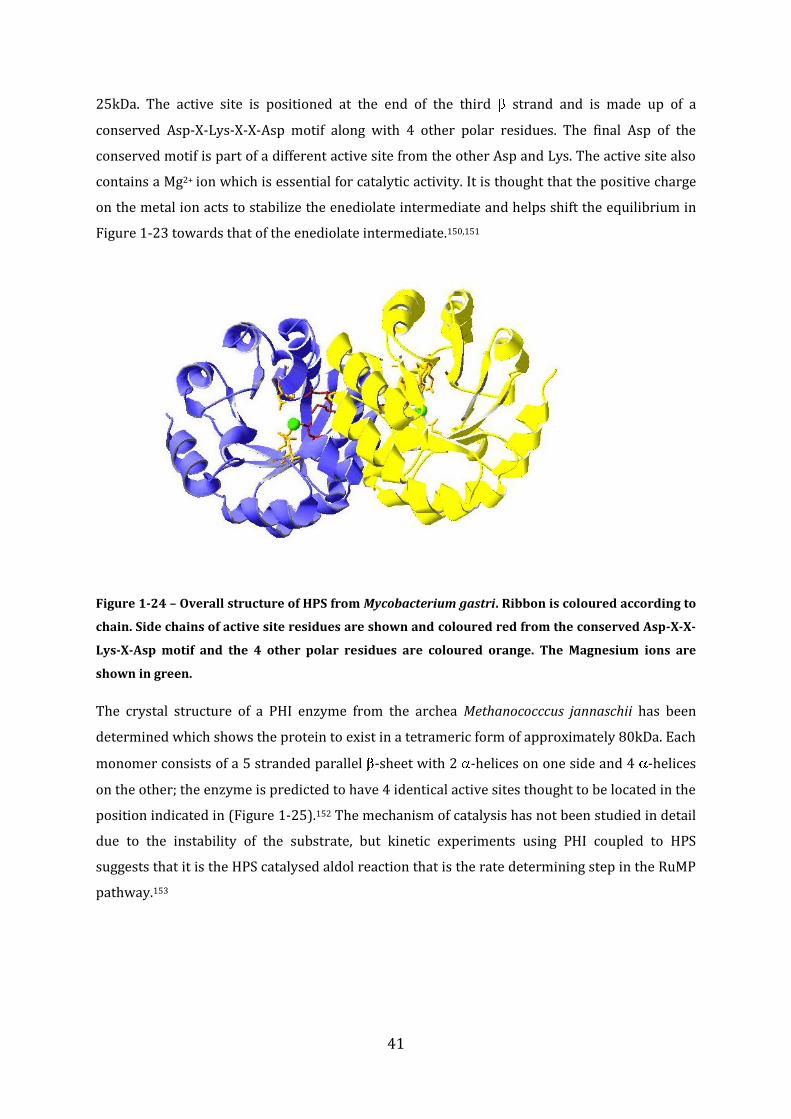
41
25kDa. The active site is positioned at the end of the third strand and is made up of a
conserved Asp-X-Lys-X-X-Asp motif along with 4 other polar residues. The final Asp of the
conserved motif is part of a different active site from the other Asp and Lys. The active site also
contains a Mg2+ ion which is essential for catalytic activity. It is thought that the positive charge
on the metal ion acts to stabilize the enediolate intermediate and helps shift the equilibrium in
Figure 1-23 towards that of the enediolate intermediate.150,151
Figure 1-24 – Overall structure of HPS from Mycobacterium gastri. Ribbon is coloured according to
chain. Side chains of active site residues are shown and coloured red from the conserved Asp-X-X-
Lys-X-Asp motif and the 4 other polar residues are coloured orange. The Magnesium ions are
shown in green.
The crystal structure of a PHI enzyme from the archea Methanococccus jannaschii has been
determined which shows the protein to exist in a tetrameric form of approximately 80kDa. Each
monomer consists of a 5 stranded parallel -sheet with 2 -helices on one side and 4 -helices
on the other; the enzyme is predicted to have 4 identical active sites thought to be located in the
position indicated in (Figure 1-25).152 The mechanism of catalysis has not been studied in detail
due to the instability of the substrate, but kinetic experiments using PHI coupled to HPS
suggests that it is the HPS catalysed aldol reaction that is the rate determining step in the RuMP
pathway.153
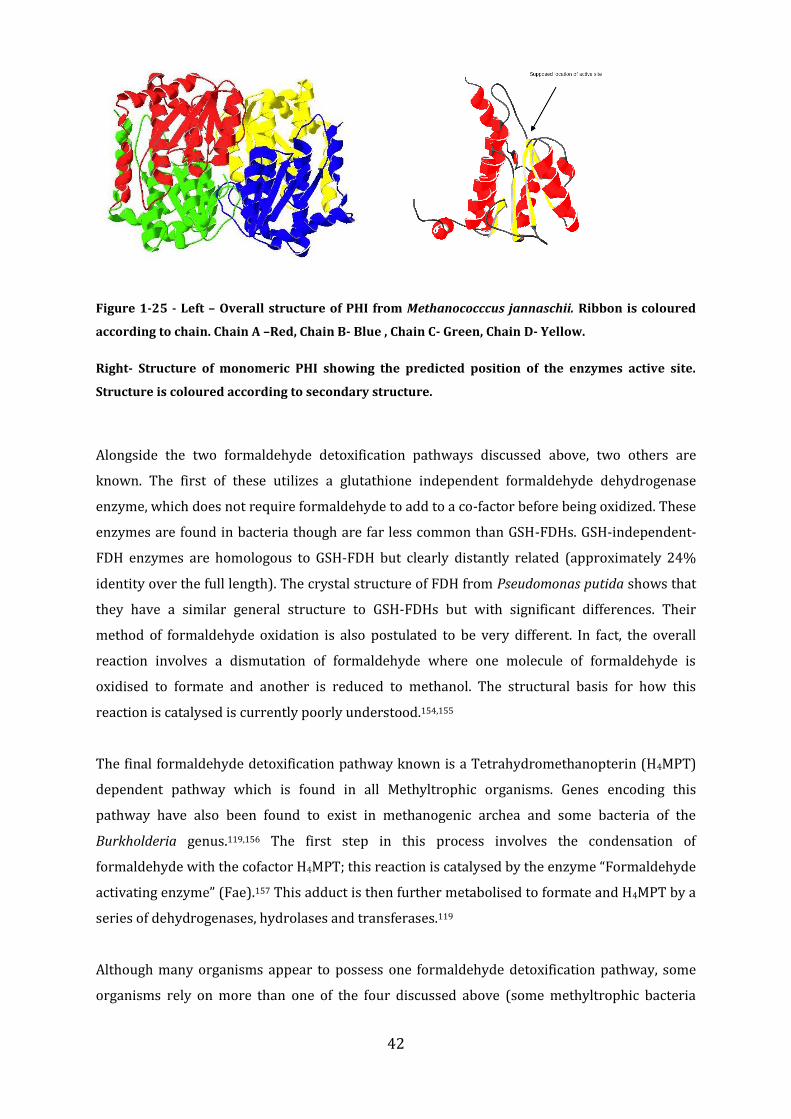
42
Figure 1-25 - Left – Overall structure of PHI from Methanococccus jannaschii. Ribbon is coloured
according to chain. Chain A –Red, Chain B- Blue , Chain C- Green, Chain D- Yellow.
Right- Structure of monomeric PHI showing the predicted position of the enzymes active site.
Structure is coloured according to secondary structure.
Alongside the two formaldehyde detoxification pathways discussed above, two others are
known. The first of these utilizes a glutathione independent formaldehyde dehydrogenase
enzyme, which does not require formaldehyde to add to a co-factor before being oxidized. These
enzymes are found in bacteria though are far less common than GSH-FDHs. GSH-independent-
FDH enzymes are homologous to GSH-FDH but clearly distantly related (approximately 24%
identity over the full length). The crystal structure of FDH from Pseudomonas putida shows that
they have a similar general structure to GSH-FDHs but with significant differences. Their
method of formaldehyde oxidation is also postulated to be very different. In fact, the overall
reaction involves a dismutation of formaldehyde where one molecule of formaldehyde is
oxidised to formate and another is reduced to methanol. The structural basis for how this
reaction is catalysed is currently poorly understood.154,155
The final formaldehyde detoxification pathway known is a Tetrahydromethanopterin (H4MPT)
dependent pathway which is found in all Methyltrophic organisms. Genes encoding this
pathway have also been found to exist in methanogenic archea and some bacteria of the
Burkholderia genus.119,156 The first step in this process involves the condensation of
formaldehyde with the cofactor H4MPT; this reaction is catalysed by the enzyme “Formaldehyde
activating enzyme” (Fae).157 This adduct is then further metabolised to formate and H4MPT by a
series of dehydrogenases, hydrolases and transferases.119
Although many organisms appear to possess one formaldehyde detoxification pathway, some
organisms rely on more than one of the four discussed above (some methyltrophic bacteria
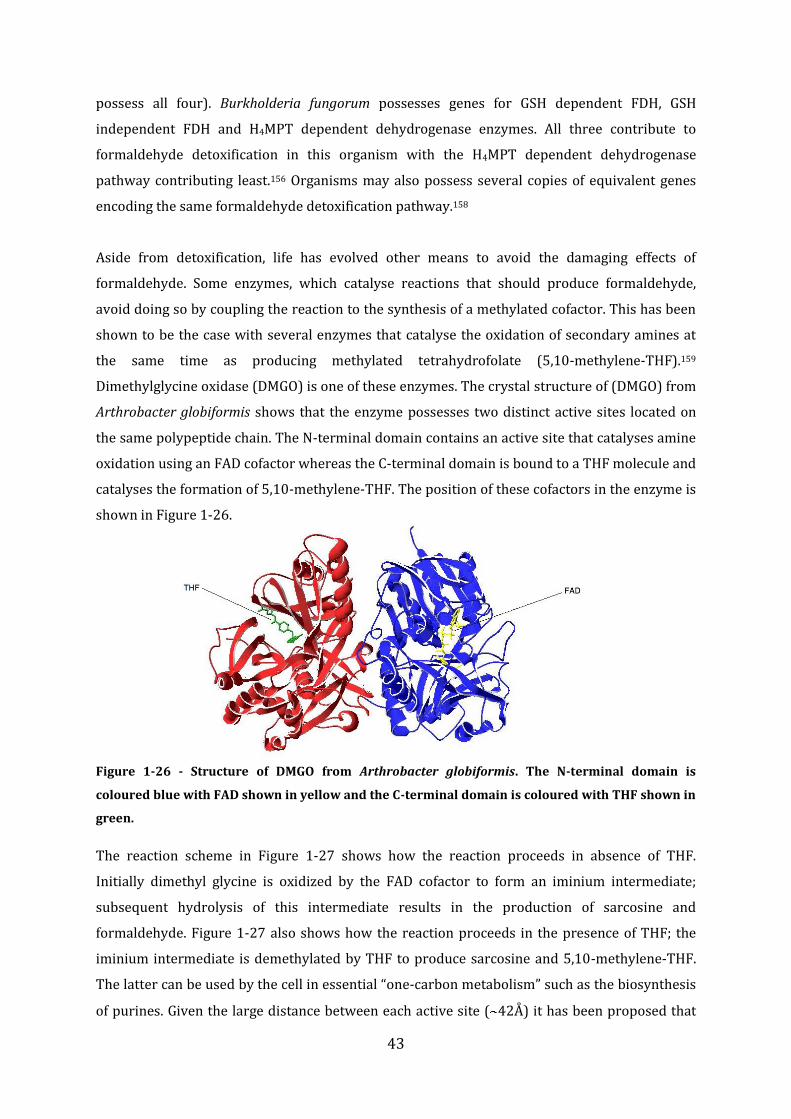
43
possess all four). Burkholderia fungorum possesses genes for GSH dependent FDH, GSH
independent FDH and H4MPT dependent dehydrogenase enzymes. All three contribute to
formaldehyde detoxification in this organism with the H4MPT dependent dehydrogenase
pathway contributing least.156 Organisms may also possess several copies of equivalent genes
encoding the same formaldehyde detoxification pathway.158
Aside from detoxification, life has evolved other means to avoid the damaging effects of
formaldehyde. Some enzymes, which catalyse reactions that should produce formaldehyde,
avoid doing so by coupling the reaction to the synthesis of a methylated cofactor. This has been
shown to be the case with several enzymes that catalyse the oxidation of secondary amines at
the same time as producing methylated tetrahydrofolate (5,10-methylene-THF).159
Dimethylglycine oxidase (DMGO) is one of these enzymes. The crystal structure of (DMGO) from
Arthrobacter globiformis shows that the enzyme possesses two distinct active sites located on
the same polypeptide chain. The N-terminal domain contains an active site that catalyses amine
oxidation using an FAD cofactor whereas the C-terminal domain is bound to a THF molecule and
catalyses the formation of 5,10-methylene-THF. The position of these cofactors in the enzyme is
shown in Figure 1-26.
Figure 1-26 - Structure of DMGO from Arthrobacter globiformis. The N-terminal domain is
coloured blue with FAD shown in yellow and the C-terminal domain is coloured with THF shown in
green.
The reaction scheme in Figure 1-27 shows how the reaction proceeds in absence of THF.
Initially dimethyl glycine is oxidized by the FAD cofactor to form an iminium intermediate;
subsequent hydrolysis of this intermediate results in the production of sarcosine and
formaldehyde. Figure 1-27 also shows how the reaction proceeds in the presence of THF; the
iminium intermediate is demethylated by THF to produce sarcosine and 5,10-methylene-THF.
The latter can be used by the cell in essential “one-carbon metabolism” such as the biosynthesis
of purines. Given the large distance between each active site ( 42Å) it has been proposed that
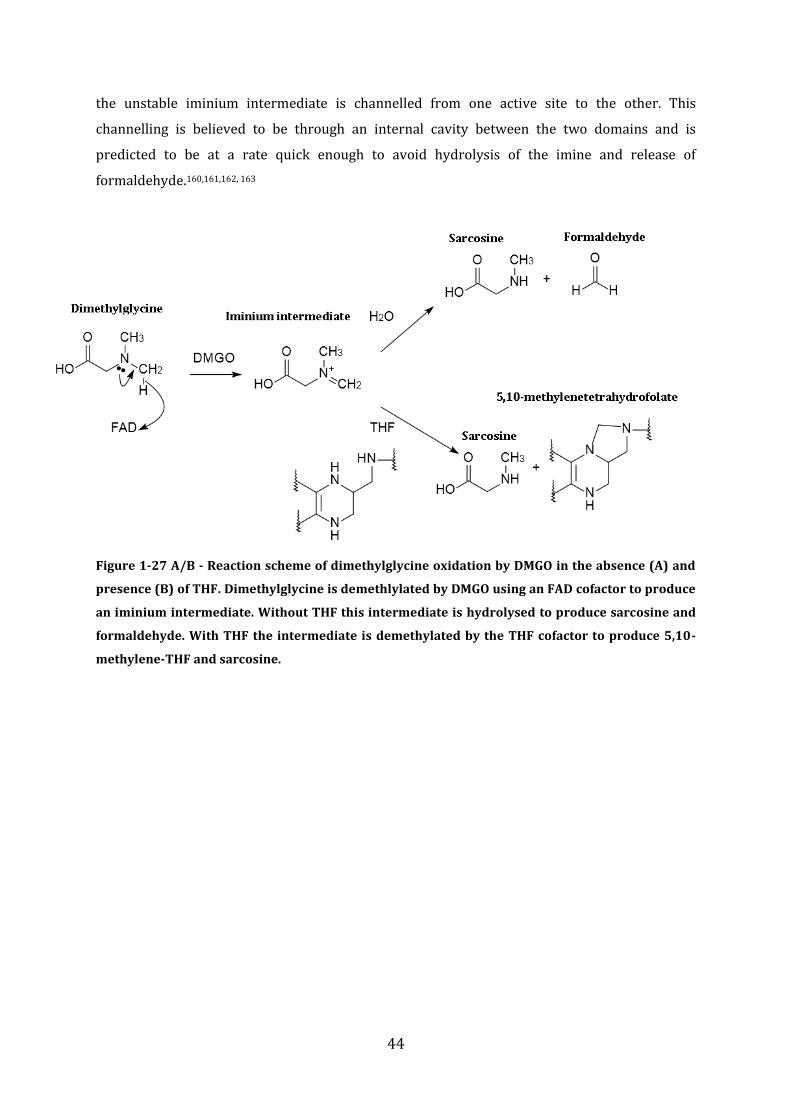
44
the unstable iminium intermediate is channelled from one active site to the other. This
channelling is believed to be through an internal cavity between the two domains and is
predicted to be at a rate quick enough to avoid hydrolysis of the imine and release of
formaldehyde.160,161,162, 163
Figure 1-27 A/B - Reaction scheme of dimethylglycine oxidation by DMGO in the absence (A) and
presence (B) of THF. Dimethylglycine is demethlylated by DMGO using an FAD cofactor to produce
an iminium intermediate. Without THF this intermediate is hydrolysed to produce sarcosine and
formaldehyde. With THF the intermediate is demethylated by the THF cofactor to produce 5,10-
methylene-THF and sarcosine.
45
1.4 Regulation of Formaldehyde detoxification in bacteria
Transcription of genes that encode formaldehyde detoxification pathways have to be regulated
in such a way that their transcripts are of high concentration in the presence of formaldehyde,
and low when they are not required. In most organisms this appears to be controlled by TFs
(section 1.2.1). Different organisms contain different TFs that regulate their formaldehyde
detoxification pathways. While the enzymes that perform these reactions are well conserved
throughout life, there seems to be a greater variation in the type of TF that regulate these
operons. However, organisms that are closely related do tend to have the same/similar TFs
regulating the expression of these pathways. The regulation of formaldehyde detoxification
pathways has only been studied in a few organisms and the last part of this review will discuss
what has been already studied in this area with regard to individual species.
The first regulatory system involving a formaldehyde detoxification pathway to be studied was
a two-component system from Paracoccus denitrificans. Paracoccus denitrificans detoxifies
formaldehyde using a glutathione-dependent pathway. The FDH gene (flhA) and the FGH gene
(fghA) are transcribed from the same gene cluster and their transcription is thought to be
induced by formaldehyde. 122,164 A deletion of two genes showing homology to a HK (flhS) and an
RR (flhR) abolishes formaldehyde induced expression of the glutathione-dependent
formaldehyde detoxification pathway. Sequence analysis suggests that FlhS is not a membrane
bound HK, rather it is thought to be cytoplasmic; the RR FlhR is predicted to contain a HTH
binding domain. It remains unclear how this system senses formaldehyde.165
A similar system was observed in Rhodobacter sphaeroides which also uses a GSH dependent
formaldehyde detoxification pathway that is induced in the presence of formaldehyde.166 A two
component system composed of the HK AfdS (50% identity to FlhS over full length) and of the
RR AfdR (56% identity to FlhR over full length) is thought to play a fairly similar role as to the
FlhSR system in Paracoccus denitrificans. As with FlhSR, the details of how formaldehyde levels
are detected by AfdS are unknown. In addition to the AfdSR system, this organism contains
another two component system that contributes to the regulation of GSH-FDH and FGH gene
transcription. This system consists of the HK RfdS and the RR RfdR which show weak homology
to the other two systems (RfdS-displays 25% identity to AfdS over full length and RfdR to shows
40 % identity AfdR). The RfdSR system has been shown to repress the transcription of the GSH-
FDH gene, however this repression appears to be independent of formaldehyde levels. RfdS may
therefore respond to a different signal than that of AfdS. 167
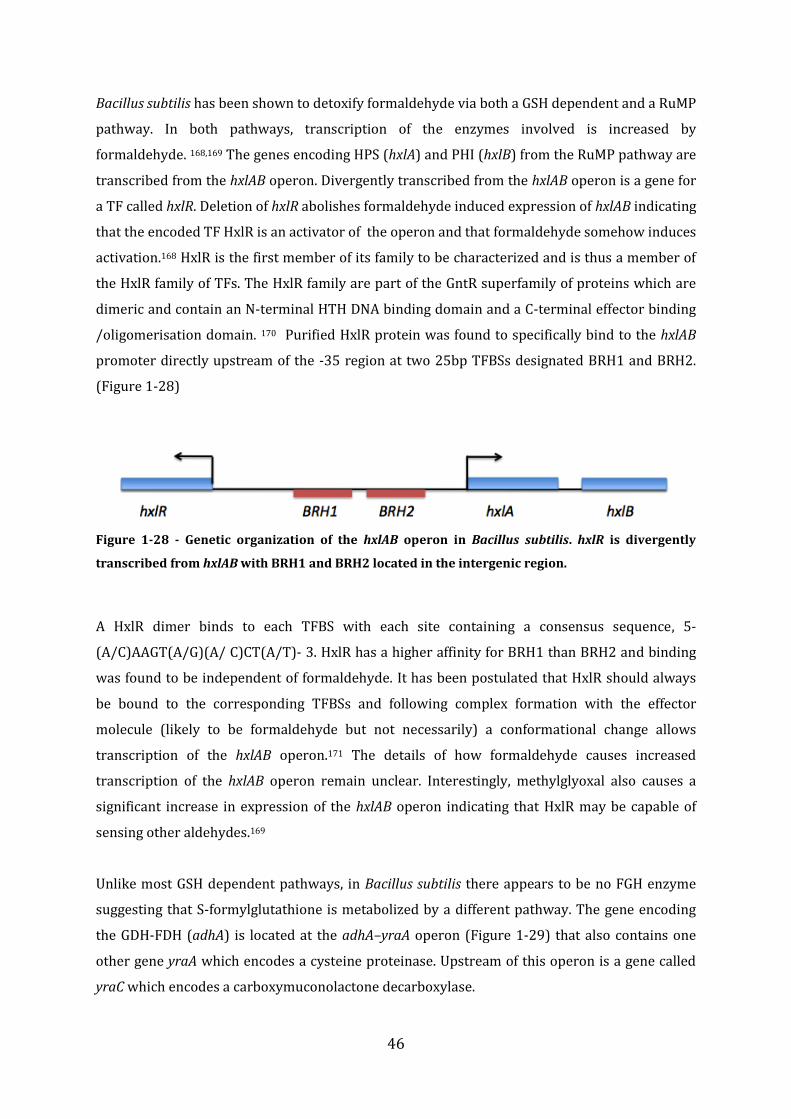
46
Bacillus subtilis has been shown to detoxify formaldehyde via both a GSH dependent and a RuMP
pathway. In both pathways, transcription of the enzymes involved is increased by
formaldehyde. 168,169 The genes encoding HPS (hxlA) and PHI (hxlB) from the RuMP pathway are
transcribed from the hxlAB operon. Divergently transcribed from the hxlAB operon is a gene for
a TF called hxlR. Deletion of hxlR abolishes formaldehyde induced expression of hxlAB indicating
that the encoded TF HxlR is an activator of the operon and that formaldehyde somehow induces
activation.168 HxlR is the first member of its family to be characterized and is thus a member of
the HxlR family of TFs. The HxlR family are part of the GntR superfamily of proteins which are
dimeric and contain an N-terminal HTH DNA binding domain and a C-terminal effector binding
/oligomerisation domain. 170 Purified HxlR protein was found to specifically bind to the hxlAB
promoter directly upstream of the -35 region at two 25bp TFBSs designated BRH1 and BRH2.
(Figure 1-28)
Figure 1-28 - Genetic organization of the hxlAB operon in Bacillus subtilis. hxlR is divergently
transcribed from hxlAB with BRH1 and BRH2 located in the intergenic region.
A HxlR dimer binds to each TFBS with each site containing a consensus sequence, 5-
(A/C)AAGT(A/G)(A/ C)CT(A/T)- 3. HxlR has a higher affinity for BRH1 than BRH2 and binding
was found to be independent of formaldehyde. It has been postulated that HxlR should always
be bound to the corresponding TFBSs and following complex formation with the effector
molecule (likely to be formaldehyde but not necessarily) a conformational change allows
transcription of the hxlAB operon.171 The details of how formaldehyde causes increased
transcription of the hxlAB operon remain unclear. Interestingly, methylglyoxal also causes a
significant increase in expression of the hxlAB operon indicating that HxlR may be capable of
sensing other aldehydes.169
Unlike most GSH dependent pathways, in Bacillus subtilis there appears to be no FGH enzyme
suggesting that S-formylglutathione is metabolized by a different pathway. The gene encoding
the GDH-FDH (adhA) is located at the adhA–yraA operon (Figure 1-29) that also contains one
other gene yraA which encodes a cysteine proteinase. Upstream of this operon is a gene called
yraC which encodes a carboxymuconolactone decarboxylase.
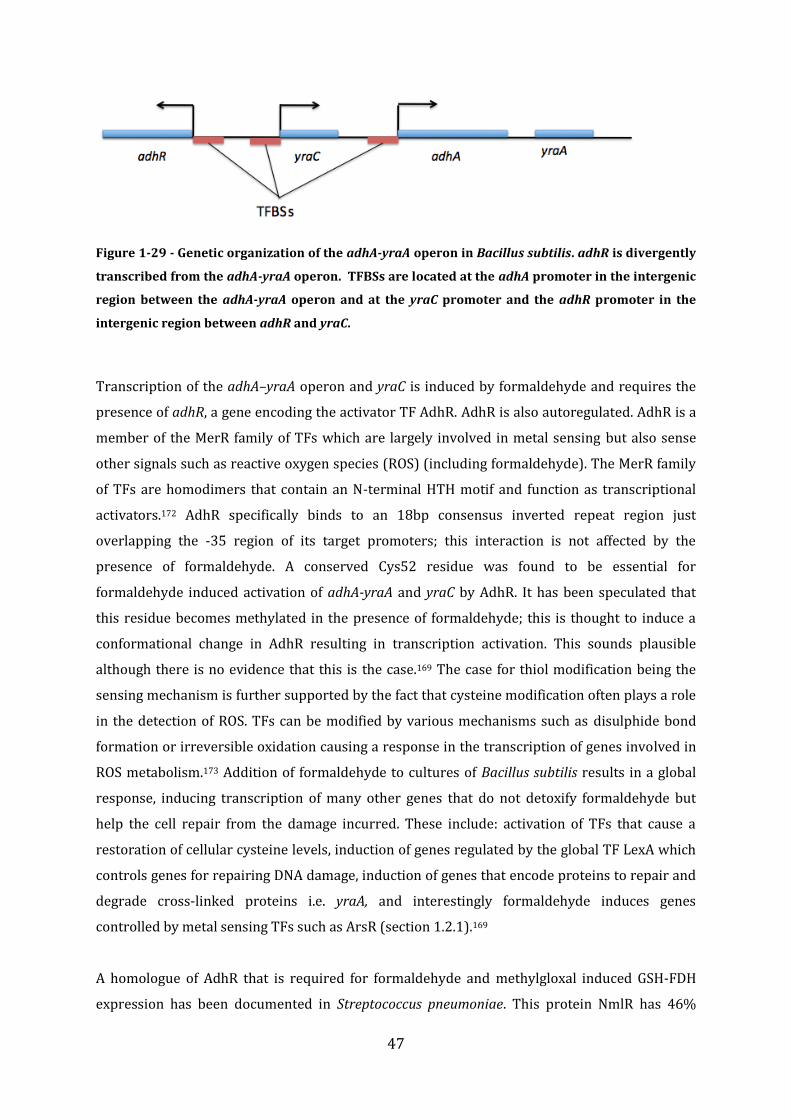
47
Figure 1-29 - Genetic organization of the adhA-yraA operon in Bacillus subtilis. adhR is divergently
transcribed from the adhA-yraA operon. TFBSs are located at the adhA promoter in the intergenic
region between the adhA-yraA operon and at the yraC promoter and the adhR promoter in the
intergenic region between adhR and yraC.
Transcription of the adhA–yraA operon and yraC is induced by formaldehyde and requires the
presence of adhR, a gene encoding the activator TF AdhR. AdhR is also autoregulated. AdhR is a
member of the MerR family of TFs which are largely involved in metal sensing but also sense
other signals such as reactive oxygen species (ROS) (including formaldehyde). The MerR family
of TFs are homodimers that contain an N-terminal HTH motif and function as transcriptional
activators.172 AdhR specifically binds to an 18bp consensus inverted repeat region just
overlapping the -35 region of its target promoters; this interaction is not affected by the
presence of formaldehyde. A conserved Cys52 residue was found to be essential for
formaldehyde induced activation of adhA-yraA and yraC by AdhR. It has been speculated that
this residue becomes methylated in the presence of formaldehyde; this is thought to induce a
conformational change in AdhR resulting in transcription activation. This sounds plausible
although there is no evidence that this is the case.169 The case for thiol modification being the
sensing mechanism is further supported by the fact that cysteine modification often plays a role
in the detection of ROS. TFs can be modified by various mechanisms such as disulphide bond
formation or irreversible oxidation causing a response in the transcription of genes involved in
ROS metabolism.173 Addition of formaldehyde to cultures of Bacillus subtilis results in a global
response, inducing transcription of many other genes that do not detoxify formaldehyde but
help the cell repair from the damage incurred. These include: activation of TFs that cause a
restoration of cellular cysteine levels, induction of genes regulated by the global TF LexA which
controls genes for repairing DNA damage, induction of genes that encode proteins to repair and
degrade cross-linked proteins i.e. yraA, and interestingly formaldehyde induces genes
controlled by metal sensing TFs such as ArsR (section 1.2.1).169
A homologue of AdhR that is required for formaldehyde and methylgloxal induced GSH-FDH
expression has been documented in Streptococcus pneumoniae. This protein NmlR has 46%
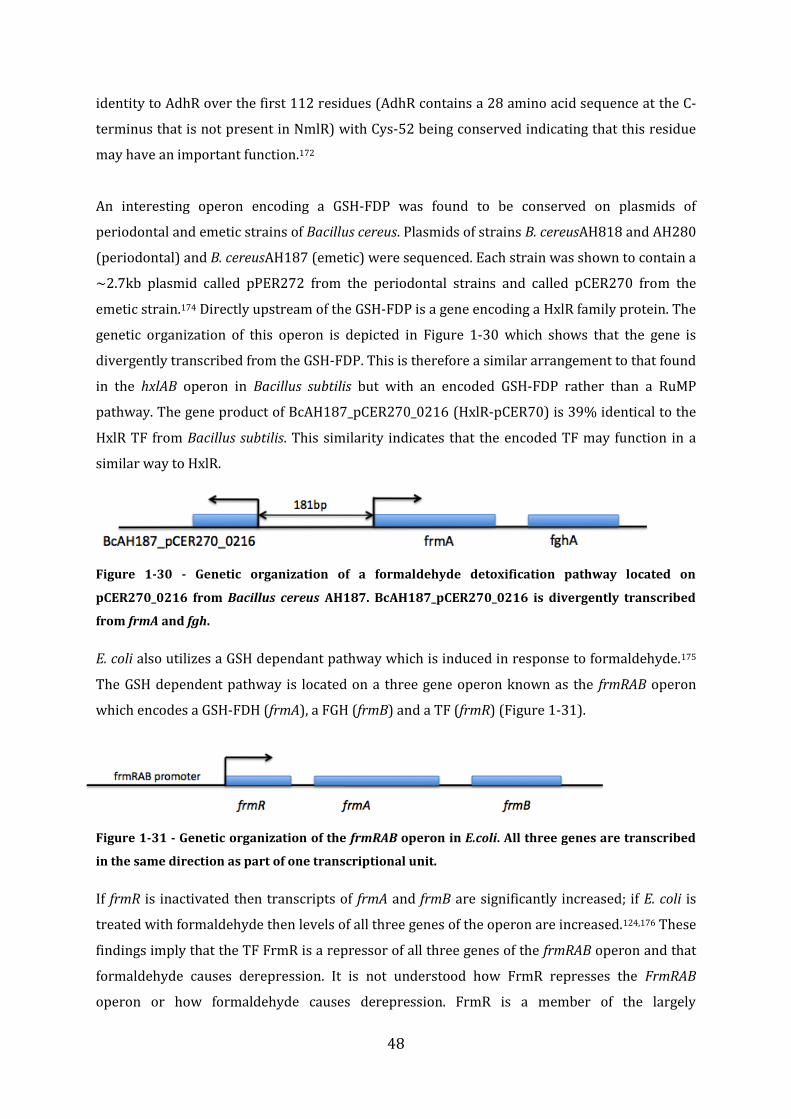
48
identity to AdhR over the first 112 residues (AdhR contains a 28 amino acid sequence at the C-
terminus that is not present in NmlR) with Cys-52 being conserved indicating that this residue
may have an important function.172
An interesting operon encoding a GSH-FDP was found to be conserved on plasmids of
periodontal and emetic strains of Bacillus cereus. Plasmids of strains B. cereusAH818 and AH280
(periodontal) and B. cereusAH187 (emetic) were sequenced. Each strain was shown to contain a
~2.7kb plasmid called pPER272 from the periodontal strains and called pCER270 from the
emetic strain.174 Directly upstream of the GSH-FDP is a gene encoding a HxlR family protein. The
genetic organization of this operon is depicted in Figure 1-30 which shows that the gene is
divergently transcribed from the GSH-FDP. This is therefore a similar arrangement to that found
in the hxlAB operon in Bacillus subtilis but with an encoded GSH-FDP rather than a RuMP
pathway. The gene product of BcAH187_pCER270_0216 (HxlR-pCER70) is 39% identical to the
HxlR TF from Bacillus subtilis. This similarity indicates that the encoded TF may function in a
similar way to HxlR.
Figure 1-30 - Genetic organization of a formaldehyde detoxification pathway located on
pCER270_0216 from Bacillus cereus AH187. BcAH187_pCER270_0216 is divergently transcribed
from frmA and fgh.
E. coli also utilizes a GSH dependant pathway which is induced in response to formaldehyde.175
The GSH dependent pathway is located on a three gene operon known as the frmRAB operon
which encodes a GSH-FDH (frmA), a FGH (frmB) and a TF (frmR) (Figure 1-31).
Figure 1-31 - Genetic organization of the frmRAB operon in E.coli. All three genes are transcribed
in the same direction as part of one transcriptional unit.
If frmR is inactivated then transcripts of frmA and frmB are significantly increased; if E. coli is
treated with formaldehyde then levels of all three genes of the operon are increased.124,176 These
findings imply that the TF FrmR is a repressor of all three genes of the frmRAB operon and that
formaldehyde causes derepression. It is not understood how FrmR represses the FrmRAB
operon or how formaldehyde causes derepression. FrmR is a member of the largely
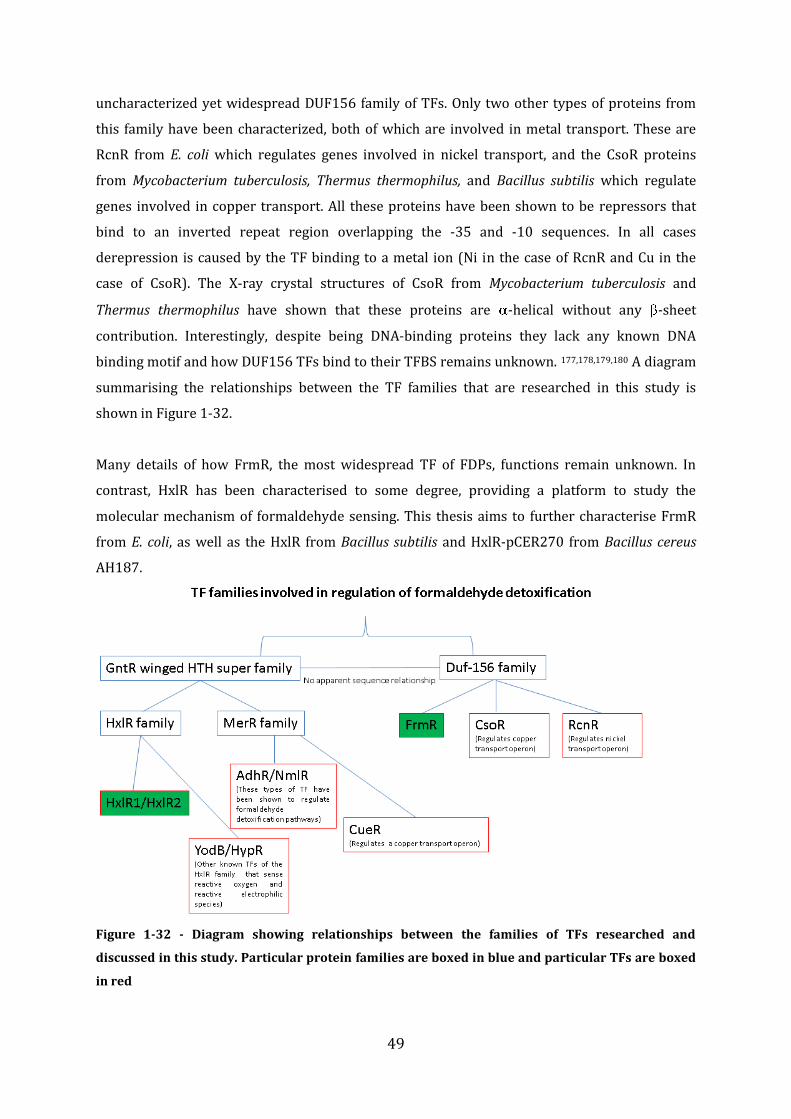
49
uncharacterized yet widespread DUF156 family of TFs. Only two other types of proteins from
this family have been characterized, both of which are involved in metal transport. These are
RcnR from E. coli which regulates genes involved in nickel transport, and the CsoR proteins
from Mycobacterium tuberculosis, Thermus thermophilus, and Bacillus subtilis which regulate
genes involved in copper transport. All these proteins have been shown to be repressors that
bind to an inverted repeat region overlapping the -35 and -10 sequences. In all cases
derepression is caused by the TF binding to a metal ion (Ni in the case of RcnR and Cu in the
case of CsoR). The X-ray crystal structures of CsoR from Mycobacterium tuberculosis and
Thermus thermophilus have shown that these proteins are -helical without any -sheet
contribution. Interestingly, despite being DNA-binding proteins they lack any known DNA
binding motif and how DUF156 TFs bind to their TFBS remains unknown. 177,178,179,180 A diagram
summarising the relationships between the TF families that are researched in this study is
shown in Figure 1-32.
Many details of how FrmR, the most widespread TF of FDPs, functions remain unknown. In
contrast, HxlR has been characterised to some degree, providing a platform to study the
molecular mechanism of formaldehyde sensing. This thesis aims to further characterise FrmR
from E. coli, as well as the HxlR from Bacillus subtilis and HxlR-pCER270 from Bacillus cereus
AH187.
Figure 1-32 - Diagram showing relationships between the families of TFs researched and
discussed in this study. Particular protein families are boxed in blue and particular TFs are boxed
in red
50
1.5 Overall Aims and Objectives
This research sets out to obtain a further understanding of how bacteria sense formaldehyde
and how this relates to the regulation of formaldehyde detoxification pathways. In order to
achieve this aim, several approaches will be taken. As the regulation of formaldehyde
detoxification is known to be controlled by TFs in several organisms, this research will focus on
some of these regulator proteins. This will include an in vitro analysis of their biophysical
properties and investigation of their interactions with other species such as target promoters
and formaldehyde. In order to do this it is necessary to acquire the TFs in a pure form in
solution which will be attempted through molecular biology techniques. Understanding protein
function can often be facilitated by detailed knowledge of their structures. This study will
therefore attempt to obtain high resolution structures of these TFs by using X-ray
crystallography. Additionally, it is hoped to study the TF from E.coli, FrmR in vivo by
constructing a plasmid based reporter system. Such a reporter system will allow FrmR activity
to be monitored in response to different stimuli and point mutations. The overall strategy is
thus to acquire information regarding of how these TFs might function and how this relates to
the cells metabolic response to formaldehyde.
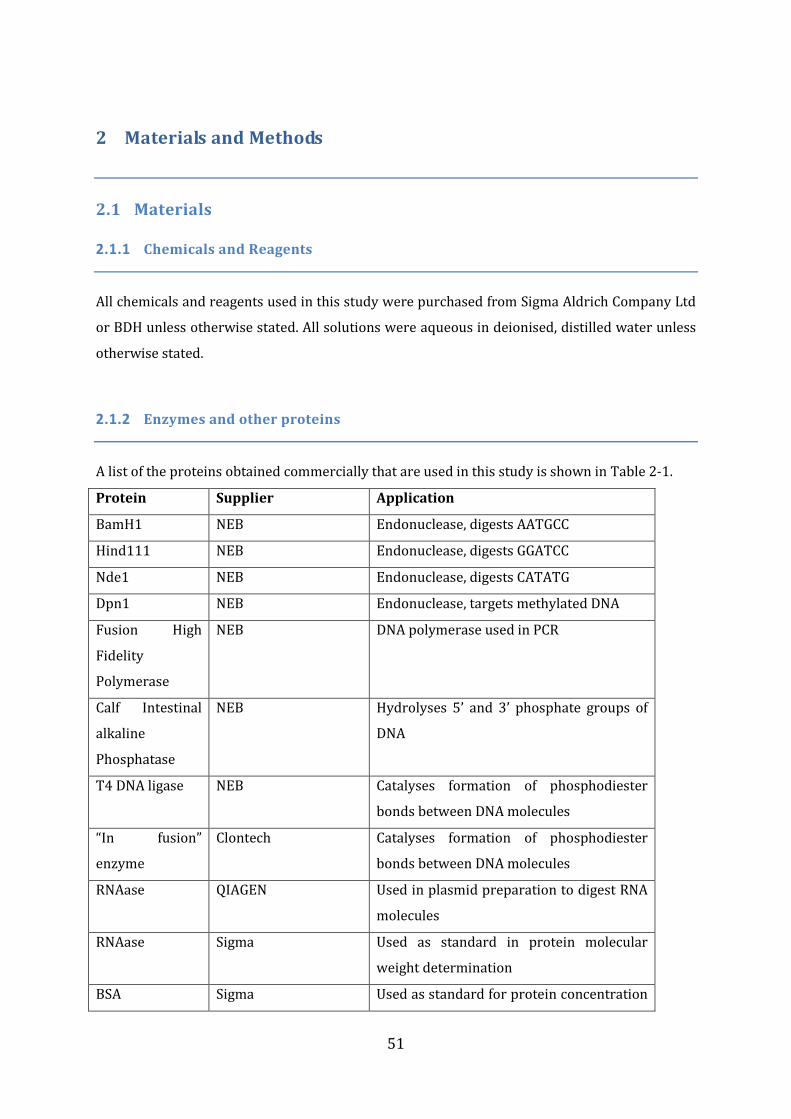
51
2 Materials and Methods
2.1 Materials
2.1.1 Chemicals and Reagents
All chemicals and reagents used in this study were purchased from Sigma Aldrich Company Ltd
or BDH unless otherwise stated. All solutions were aqueous in deionised, distilled water unless
otherwise stated.
2.1.2 Enzymes and other proteins
A list of the proteins obtained commercially that are used in this study is shown in Table 2-1.
Protein Supplier Application
BamH1 NEB Endonuclease, digests AATGCC
Hind111 NEB Endonuclease, digests GGATCC
Nde1 NEB Endonuclease, digests CATATG
Dpn1 NEB Endonuclease, targets methylated DNA
Fusion High
Fidelity
Polymerase
NEB DNA polymerase used in PCR
Calf Intestinal
alkaline
Phosphatase
NEB Hydrolyses 5’ and 3’ phosphate groups of
DNA
T4 DNA ligase NEB Catalyses formation of phosphodiester
bonds between DNA molecules
“In fusion”
enzyme
Clontech Catalyses formation of phosphodiester
bonds between DNA molecules
RNAase QIAGEN Used in plasmid preparation to digest RNA
molecules
RNAase Sigma Used as standard in protein molecular
weight determination
BSA Sigma Used as standard for protein concentration
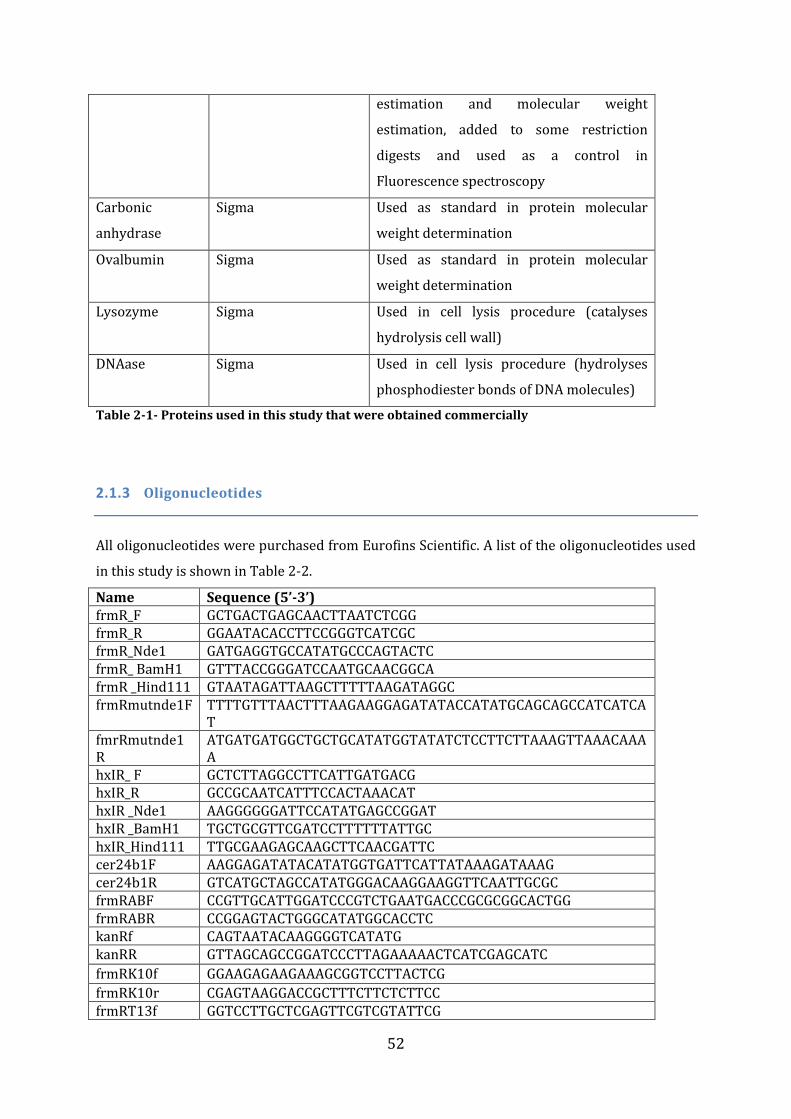
52
estimation and molecular weight
estimation, added to some restriction
digests and used as a control in
Fluorescence spectroscopy
Carbonic
anhydrase
Sigma Used as standard in protein molecular
weight determination
Ovalbumin Sigma Used as standard in protein molecular
weight determination
Lysozyme Sigma Used in cell lysis procedure (catalyses
hydrolysis cell wall)
DNAase Sigma Used in cell lysis procedure (hydrolyses
phosphodiester bonds of DNA molecules)
Table 2-1- Proteins used in this study that were obtained commercially
2.1.3 Oligonucleotides
All oligonucleotides were purchased from Eurofins Scientific. A list of the oligonucleotides used
in this study is shown in Table 2-2.
Name Sequence (5’-3’) frmR_F GCTGACTGAGCAACTTAATCTCGG frmR_R GGAATACACCTTCCGGGTCATCGC frmR_Nde1 GATGAGGTGCCATATGCCCAGTACTC frmR_ BamH1 GTTTACCGGGATCCAATGCAACGGCA frmR _Hind111 GTAATAGATTAAGCTTTTTAAGATAGGC frmRmutnde1F TTTTGTTTAACTTTAAGAAGGAGATATACCATATGCAGCAGCCATCATCA
T fmrRmutnde1R
ATGATGATGGCTGCTGCATATGGTATATCTCCTTCTTAAAGTTAAACAAAA
hxIR_ F GCTCTTAGGCCTTCATTGATGACG hxIR_R GCCGCAATCATTTCCACTAAACAT hxIR _Nde1 AAGGGGGGATTCCATATGAGCCGGAT hxIR _BamH1 TGCTGCGTTCGATCCTTTTTTATTGC hxIR_Hind111 TTGCGAAGAGCAAGCTTCAACGATTC cer24b1F AAGGAGATATACATATGGTGATTCATTATAAAGATAAAG cer24b1R GTCATGCTAGCCATATGGGACAAGGAAGGTTCAATTGCGC frmRABF CCGTTGCATTGGATCCCGTCTGAATGACCCGCGCGGCACTGG frmRABR CCGGAGTACTGGGCATATGGCACCTC kanRf CAGTAATACAAGGGGTCATATG kanRR GTTAGCAGCCGGATCCCTTAGAAAAACTCATCGAGCATC
frmRK10f GGAAGAGAAGAAAGCGGTCCTTACTCG
frmRK10r CGAGTAAGGACCGCTTTCTTCTCTTCC frmRT13f GGTCCTTGCTCGAGTTCGTCGTATTCG
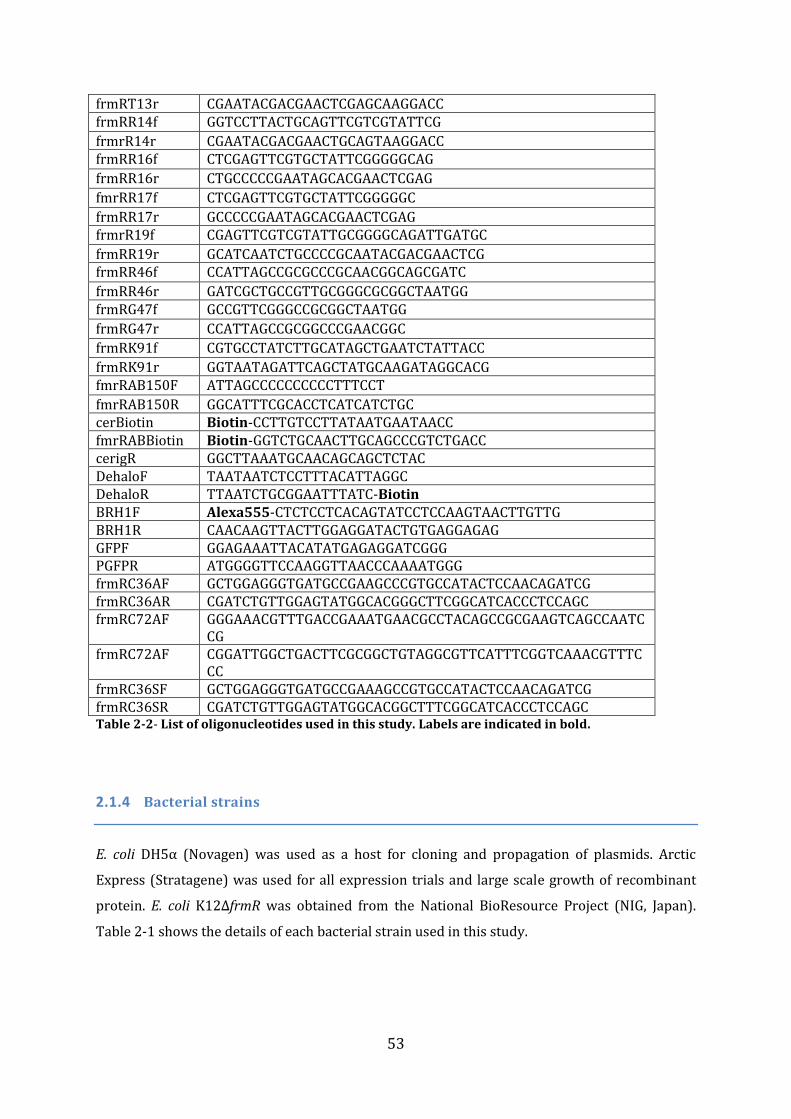
53
frmRT13r CGAATACGACGAACTCGAGCAAGGACC frmRR14f GGTCCTTACTGCAGTTCGTCGTATTCG
frmrR14r CGAATACGACGAACTGCAGTAAGGACC frmRR16f CTCGAGTTCGTGCTATTCGGGGGCAG
frmRR16r CTGCCCCCGAATAGCACGAACTCGAG
fmrRR17f CTCGAGTTCGTGCTATTCGGGGGC
frmRR17r GCCCCCGAATAGCACGAACTCGAG frmrR19f CGAGTTCGTCGTATTGCGGGGCAGATTGATGC
frmRR19r GCATCAATCTGCCCCGCAATACGACGAACTCG frmRR46f CCATTAGCCGCGCCCGCAACGGCAGCGATC
frmRR46r GATCGCTGCCGTTGCGGGCGCGGCTAATGG frmRG47f GCCGTTCGGGCCGCGGCTAATGG
frmRG47r CCATTAGCCGCGGCCCGAACGGC
frmRK91f CGTGCCTATCTTGCATAGCTGAATCTATTACC
frmRK91r GGTAATAGATTCAGCTATGCAAGATAGGCACG fmrRAB150F ATTAGCCCCCCCCCCTTTCCT
fmrRAB150R GGCATTTCGCACCTCATCATCTGC cerBiotin Biotin-CCTTGTCCTTATAATGAATAACC fmrRABBiotin Biotin-GGTCTGCAACTTGCAGCCCGTCTGACC cerigR GGCTTAAATGCAACAGCAGCTCTAC DehaloF TAATAATCTCCTTTACATTAGGC DehaloR TTAATCTGCGGAATTTATC-Biotin BRH1F Alexa555-CTCTCCTCACAGTATCCTCCAAGTAACTTGTTG BRH1R CAACAAGTTACTTGGAGGATACTGTGAGGAGAG GFPF GGAGAAATTACATATGAGAGGATCGGG PGFPR ATGGGGTTCCAAGGTTAACCCAAAATGGG frmRC36AF GCTGGAGGGTGATGCCGAAGCCCGTGCCATACTCCAACAGATCG frmRC36AR CGATCTGTTGGAGTATGGCACGGGCTTCGGCATCACCCTCCAGC frmRC72AF GGGAAACGTTTGACCGAAATGAACGCCTACAGCCGCGAAGTCAGCCAATC
CG frmRC72AF CGGATTGGCTGACTTCGCGGCTGTAGGCGTTCATTTCGGTCAAACGTTTC
CC frmRC36SF GCTGGAGGGTGATGCCGAAAGCCGTGCCATACTCCAACAGATCG frmRC36SR CGATCTGTTGGAGTATGGCACGGCTTTCGGCATCACCCTCCAGC Table 2-2- List of oligonucleotides used in this study. Labels are indicated in bold.
2.1.4 Bacterial strains
E. coli DH5α (Novagen) was used as a host for cloning and propagation of plasmids. Arctic
Express (Stratagene) was used for all expression trials and large scale growth of recombinant
protein. E. coli K12∆frmR was obtained from the National BioResource Project (NIG, Japan).
Table 2-1 shows the details of each bacterial strain used in this study.
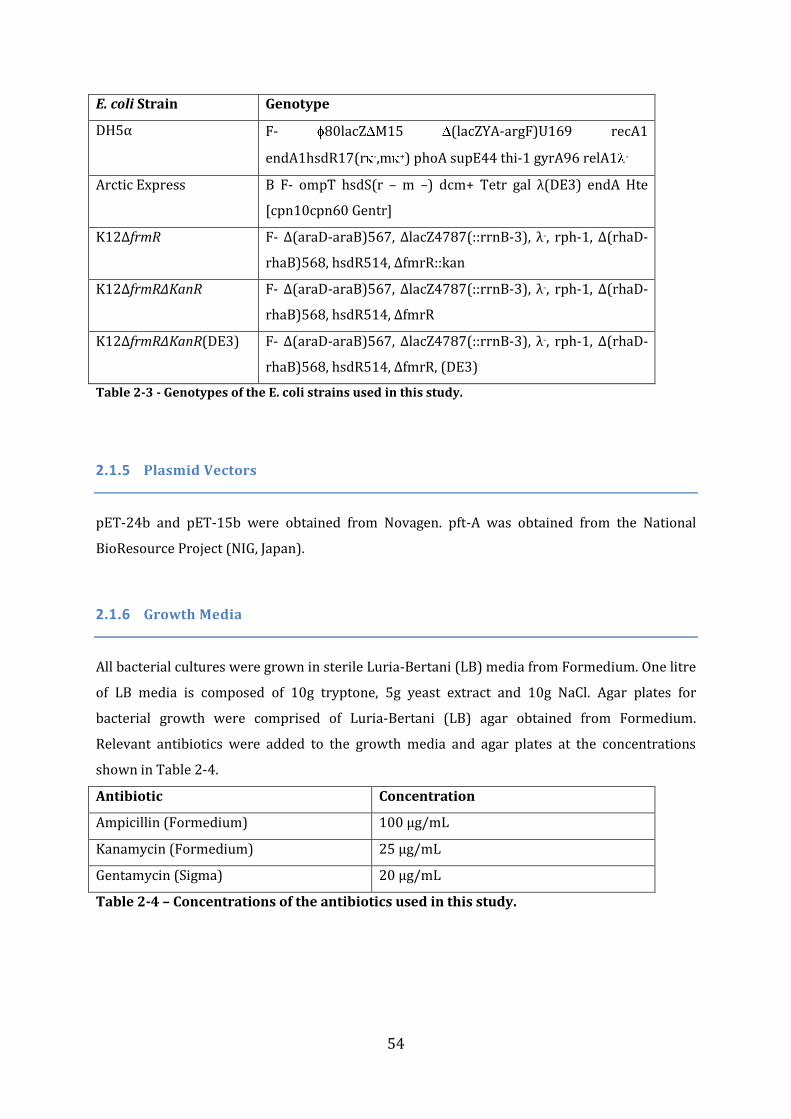
54
E. coli Strain Genotype
DH5α F- 80lacZ M15 (lacZYA-argF)U169 recA1
endA1hsdR17(r -,m +) phoA supE44 thi-1 gyrA96 relA1 -
Arctic Express B F- ompT hsdS(r – m –) dcm+ Tetr gal λ(DE3) endA Hte
[cpn10cpn60 Gentr]
K12∆frmR F- Δ(araD-araB)567, ΔlacZ4787(::rrnB-3), λ-, rph-1, Δ(rhaD-
rhaB)568, hsdR514, ΔfmrR::kan
K12∆frmR∆KanR F- Δ(araD-araB)567, ΔlacZ4787(::rrnB-3), λ-, rph-1, Δ(rhaD-
rhaB)568, hsdR514, ΔfmrR
K12∆frmR∆KanR(DE3) F- Δ(araD-araB)567, ΔlacZ4787(::rrnB-3), λ-, rph-1, Δ(rhaD-
rhaB)568, hsdR514, ΔfmrR, (DE3)
Table 2-3 - Genotypes of the E. coli strains used in this study.
2.1.5 Plasmid Vectors
pET-24b and pET-15b were obtained from Novagen. pft-A was obtained from the National
BioResource Project (NIG, Japan).
2.1.6 Growth Media
All bacterial cultures were grown in sterile Luria-Bertani (LB) media from Formedium. One litre
of LB media is composed of 10g tryptone, 5g yeast extract and 10g NaCl. Agar plates for
bacterial growth were comprised of Luria-Bertani (LB) agar obtained from Formedium.
Relevant antibiotics were added to the growth media and agar plates at the concentrations
shown in Table 2-4.
Antibiotic Concentration
Ampicillin (Formedium) 100 µg/mL
Kanamycin (Formedium) 25 µg/mL
Gentamycin (Sigma) 20 µg/mL
Table 2-4 – Concentrations of the antibiotics used in this study.
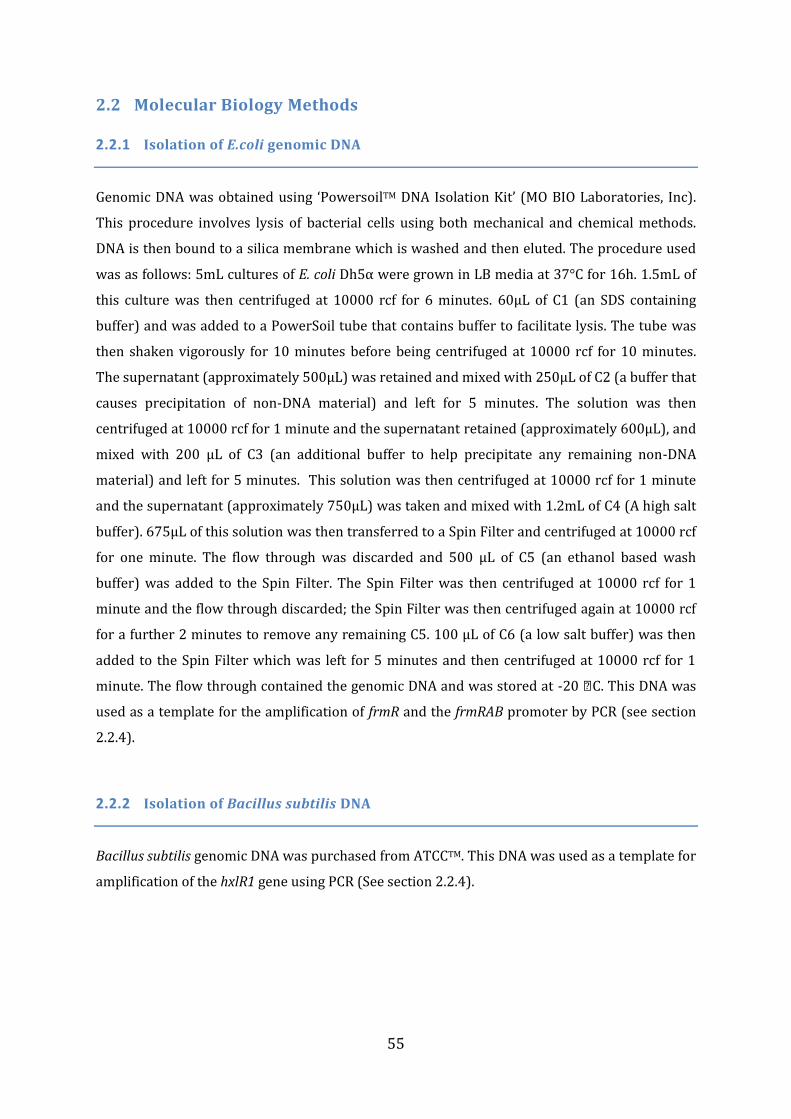
55
2.2 Molecular Biology Methods
2.2.1 Isolation of E.coli genomic DNA
Genomic DNA was obtained using ‘PowersoilTM DNA Isolation Kit’ (MO BIO Laboratories, Inc).
This procedure involves lysis of bacterial cells using both mechanical and chemical methods.
DNA is then bound to a silica membrane which is washed and then eluted. The procedure used
was as follows: 5mL cultures of E. coli Dh5α were grown in LB media at 37°C for 16h. 1.5mL of
this culture was then centrifuged at 10000 rcf for 6 minutes. 60µL of C1 (an SDS containing
buffer) and was added to a PowerSoil tube that contains buffer to facilitate lysis. The tube was
then shaken vigorously for 10 minutes before being centrifuged at 10000 rcf for 10 minutes.
The supernatant (approximately 500µL) was retained and mixed with 250µL of C2 (a buffer that
causes precipitation of non-DNA material) and left for 5 minutes. The solution was then
centrifuged at 10000 rcf for 1 minute and the supernatant retained (approximately 600µL), and
mixed with 200 µL of C3 (an additional buffer to help precipitate any remaining non-DNA
material) and left for 5 minutes. This solution was then centrifuged at 10000 rcf for 1 minute
and the supernatant (approximately 750µL) was taken and mixed with 1.2mL of C4 (A high salt
buffer). 675µL of this solution was then transferred to a Spin Filter and centrifuged at 10000 rcf
for one minute. The flow through was discarded and 500 µL of C5 (an ethanol based wash
buffer) was added to the Spin Filter. The Spin Filter was then centrifuged at 10000 rcf for 1
minute and the flow through discarded; the Spin Filter was then centrifuged again at 10000 rcf
for a further 2 minutes to remove any remaining C5. 100 µL of C6 (a low salt buffer) was then
added to the Spin Filter which was left for 5 minutes and then centrifuged at 10000 rcf for 1
minute. The flow through contained the genomic DNA and was stored at -20 ᵒC. This DNA was
used as a template for the amplification of frmR and the frmRAB promoter by PCR (see section
2.2.4).
2.2.2 Isolation of Bacillus subtilis DNA
Bacillus subtilis genomic DNA was purchased from ATCCTM. This DNA was used as a template for
amplification of the hxlR1 gene using PCR (See section 2.2.4).
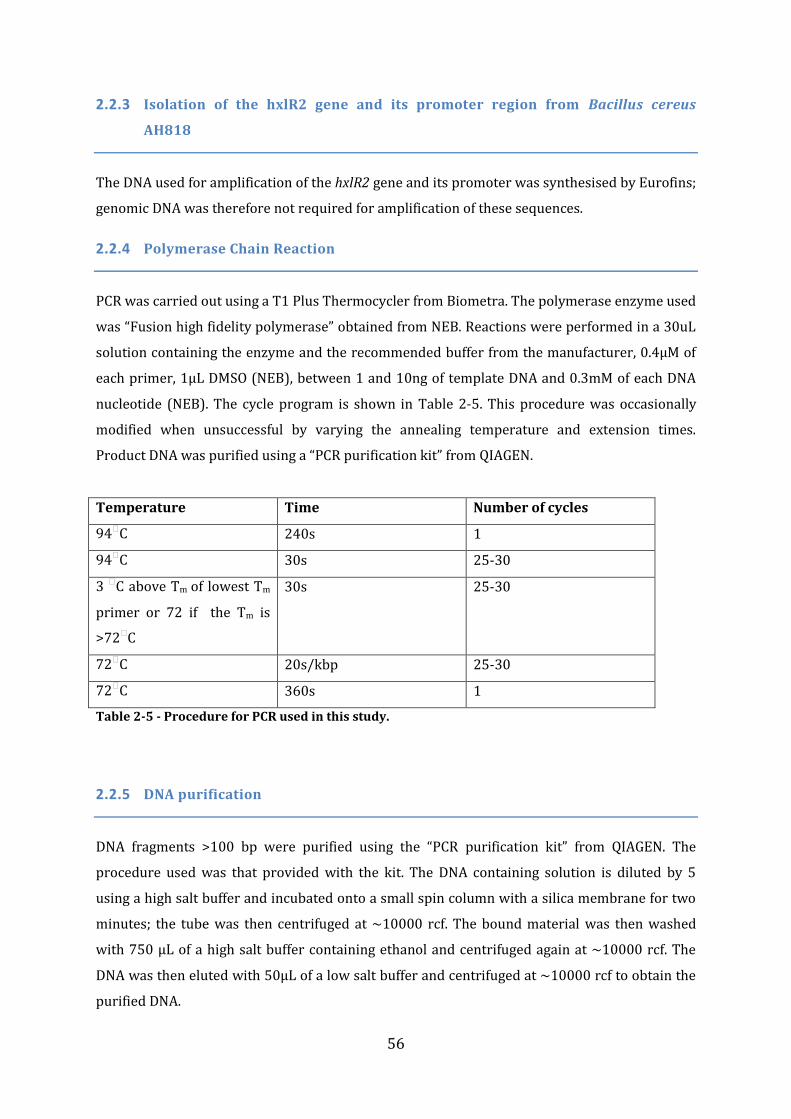
56
2.2.3 Isolation of the hxlR2 gene and its promoter region from Bacillus cereus
AH818
The DNA used for amplification of the hxlR2 gene and its promoter was synthesised by Eurofins;
genomic DNA was therefore not required for amplification of these sequences.
2.2.4 Polymerase Chain Reaction
PCR was carried out using a T1 Plus Thermocycler from Biometra. The polymerase enzyme used
was “Fusion high fidelity polymerase” obtained from NEB. Reactions were performed in a 30uL
solution containing the enzyme and the recommended buffer from the manufacturer, 0.4µM of
each primer, 1µL DMSO (NEB), between 1 and 10ng of template DNA and 0.3mM of each DNA
nucleotide (NEB). The cycle program is shown in Table 2-5. This procedure was occasionally
modified when unsuccessful by varying the annealing temperature and extension times.
Product DNA was purified using a “PCR purification kit” from QIAGEN.
Temperature Time Number of cycles
94ᵒC 240s 1
94ᵒC 30s 25-30
3 ᵒC above Tm of lowest Tm
primer or 72 if the Tm is
>72ᵒC
30s 25-30
72ᵒC 20s/kbp 25-30
72ᵒC 360s 1
Table 2-5 - Procedure for PCR used in this study.
2.2.5 DNA purification
DNA fragments >100 bp were purified using the “PCR purification kit” from QIAGEN. The
procedure used was that provided with the kit. The DNA containing solution is diluted by 5
using a high salt buffer and incubated onto a small spin column with a silica membrane for two
minutes; the tube was then centrifuged at ~10000 rcf. The bound material was then washed
with 750 µL of a high salt buffer containing ethanol and centrifuged again at ~10000 rcf. The
DNA was then eluted with 50µL of a low salt buffer and centrifuged at ~10000 rcf to obtain the
purified DNA.
57
2.2.6 Restriction endonuclease digestions
Restriction digest reactions were performed in 10-100µL solutions containing the necessary
concentrations of enzyme and buffer provided by NEB along with the DNA to be digested.
Digestions were done at 37ᵒC for the appropriate length of time as defined by manufacturer.
Reaction products were purified using “PCR purification kit”. (QIAGEN).
2.2.7 Gel extraction of DNA
DNA was extracted from agarose gels by visualising the gel under UV light and picking the
desired DNA band with a pipette tip. The pipette tip was then flushed in a relevant PCR mix and
the DNA was amplified using PCR.
2.2.8 Agarose Gel Electrophoresis
For the electrophoresis of DNA, typically a 0.8% agarose gel was cast in TAE buffer 40mM Tris,
1.3mM EDTA, 20mM glacial acetic acid, pH 8.5). DNA samples to be loaded onto the gel
contained 1×loading dye (NEB). A 1kb DNA marker (NEB) was also loaded onto the gel. The gel
tank (Geneflow) was run in TAE buffer at 90V for approximately 45 minutes. DNA was then
visualised by exposure to UV-light.
2.2.9 Ligation cloning
Cloning reactions that used “sticky ends” and ligase so as to condense two DNA molecules
together first required dephosphorylation of the digested plasmid to avoid self-ligation. A 50µL
aqueous solution of the plasmid DNA was incubated with Calf alkaline phosphatase along with
its corresponding buffer (NEB) at the concentrations specified by the manufacturer for 16 hours
at 37ᵒC. The dephosphorylated plasmid was then purified with “PCR purification kit”
(QIAGEN).
Ligations were then carried out in 20 µL reactions with T4 ligase and its corresponding buffer
(NEB). A 150 times molar excess of insert DNA fragment relative to plasmid was used in the
reaction. 6µL of the reaction product was then transformed into 50 µL of E. coli competent cells.
58
2.2.10 “Non-ligation dependent cloning” cloning
For non-ligation cloning reactions, the “in-fusion” cloning system (Clontech Laboratoriesm, Inc)
was used. In a 10µL reaction, approximately 200ng of the digested plasmid was incubated with
approximately 200ng of the insert along with the “in-fusion” enzyme and buffer for 15 minutes
at 37ᵒC, then at 50ᵒC for 15 minutes. The reaction is then cooled to approximately 0ᵒC and
diluted by a factor of 50 in TE (10mM Tris/HCl, 1mM EDTA, pH8.0) buffer. 2 µL of this solution
was then used to transform 50µL of competent E. coli cells.
2.2.11 Preparation of competent cells
To obtain E. coli cells capable of being transformed with a plasmid, they needed to be made
“competent”. A 100mL culture of the E. coli strain was grown to an OD600 of 0.5 and then cooled
at approximately 0ᵒC for 10 minutes. The culture was then centrifuged at 2000rcf for 7 minutes
and the resultant pellet was resuspended in 10mL of 100 mM CaCl2 (at 4ᵒC). The cells were
then kept at ~0ᵒC for 90 minutes and then centrifuged at 2000rcf for 7 minutes and then
resuspended in 2mL of a sterile solution of 100mM CaCl2, 20% glycerol. The cells were then split
into 150 µL aliquots and stored at -80ᵒC.
2.2.12 Transformation of E. coli with plasmids
Stored competent cells were thawed at ~0ᵒC and the plasmid DNA from either a Cloning
reaction, Site directed mutagenesis or purified plasmid DNA, was added to the cells. Typically
this 1-6 µL of plasmid containing solution into 50µL of competent cells. Cells are then incubated
at ~0ᵒC for 20 minutes and are then “heat shocked” at 42ᵒC for 1 minute and then cooled at
~0ᵒC for 5 minutes. 450µL of SOC media (20g tryptone, 5g Yeast extract, 10mM NaCl, 2.5mM
KCl, 10mM MgCl2 and 20mM glucose) was then added to the cells and the culture was incubated
for 1 hour. ~150µL of the culture was then spread over an agar plate containing LB media with
the relevant antibiotic. The plate was then incubated at 37ᵒC for ~16 hours.
2.2.13 Plasmid Extraction
Plasmids were extracted from E. coli using a “Miniprep” kit obtained from QIAGEN. The method
is based on that described in 181 and the instructions from the manufacturer were followed: 5mL
59
cultures containing the desired plasmid were grown in LB media containing the relevant
antibiotics for ~16 hours. 3mL of the culture was then centrifuged at ~10000 rcf and the
resulting pellet is then resuspended in a 250µL buffer containing RNAase; 250µL of a highly
basic buffer was then added to the suspension and the sample is mixed thoroughly. As soon as
the suspension was fully mixed, 350 µL of an acidic buffer was added. The suspension was then
centrifuged at ~10000 rcf for 10 minutes to give a pellet. The supernatant is removed and
added to a small spin column containing a silica membrane and left to incubate for 2 minutes.
The column was centrifuged at ~10000 rcf for 1 minute and the bound material was washed
with a high salt buffer containing ethanol and again centrifuged at ~10000 rcf for 1 minute. The
plasmid DNA was then eluted with 50µL of a low salt buffer and the purified solution was
obtained by centrifugation at ~10000 rcf for 1 minute.
2.2.14 Protein Expression Trials
5mL cultures of Arctic express cells (Stratagene) containing the plasmid carrying the gene to be
expressed were grown at 37ᵒC to an OD600 of 0.5 in LB media containing the appropriate
antibiotic (as defined by the plasmid encoded resistance gene) as well as gentamycin. Cultures
were then split in half into two 2.5mL cultures. One of these was induced with 1mM IPTG (the
other culture being kept as a negative control). Both cultures were then incubated at 15ᵒC for
16 hours before being split into two 1.25mL samples. Each sample was then centrifuged at 6000
rcf so as to obtain a pellet and the supernatant was discarded. One of the pellets from both the
induced and control samples was resuspended in water resulting in the total cell extract
fraction. The other pellets were resuspended in BugBuster (Novagen) and shaken for 1 hour;
this results in lysis of the cell culture. This suspension was then centrifuged at 13000 rcf (giving
the soluble fraction) and the supernatant was taken as the soluble fraction. 3µL of both the
cellular and soluble fractions were then subject to SDS-PAGE analysis.
2.2.15 SDS-PAGE Analysis
SDS-PAGE was performed using pre-cast Run-Blue 12-20% (Expedion) in an XCell SureLock™
tank from Invitrogen. Samples contained Run-Blue loading dye and 500mM β-mercaptoethanol
and prior to loading were boiled at 110ᵒC for 10 minutes. Gels were run in Run-Blue running
buffer (Expedion) at 160V for 45 minutes. Bands were visualised by staining gel with “instant
blue” (Novexin) for 30 minutes.
60
2.2.16 Site-Directed Mutagenesis
The first part of the procedure for site directed mutagenesis was identical to that described for
PCR (section 2.2.4). However, the extension times at 72ᵒC were increased to 60s/kbp and the
final step was increased to 720s. Once the PCR was finished, the solution was digested with
Dpn1 at 37ᵒC for 1h. 6µL of the resulting solution was then used to transform 50 µL of
competent E. coli cells.
2.2.17 Deletion of the KanR cassette from E. coli ∆frmR
pFT-A was transformed into E. coli ∆frmR and 5mL cultures were grown in LB media with
ampicillin at 30°C for ~16hours. This growth also contained chlorotetracycline (20µg/mL) that
had been autoclaved in LB media in order to induce the gene encoding flippase recombinase
(FLP) from Saccharomyces cerevisiae. Expression of this gene is from the pFT-A plasmid.
Cultures were then grown at 40°C in order to remove the heat sensitive pFT-A plasmid. Cultures
were then selected for lack of resistance with respect to both ampicillin and kanamycin. A
colony that was found to be sensitive to both antibiotics was verified by extracting the genomic
DNA and PCR amplifying the region of interest. Colonies containing DNA fragments of the
correct size were sequenced by Eurofins. Colonies containing the desired genotype were
designated E. coli∆frmR∆KanR.
2.2.18 Lysogenisation of E. coli ∆frmR∆KanR
E. coli ∆frmR∆KanR was infected with λDE3 Phage using a DE3 lysogenisation kit (Novagen) to
create an E. coli ∆frmR∆KanR(DE3) strain. The starting strain was grown in LB media (5mL)
containing MgSO4 (10mM) and Maltose (2%) at 37°C to an OD600 of approximately 0.5. 10µL of
this strain was then mixed with 1µL (108 pfu, phage forming units) of each of the three
provided phage solutions: λDE3, Helper Phage and Selection Phage. The resulting solutions
were incubated for 20 minutes at 37°C before being spread onto an LB-agar plate which was
incubated at 37°C for 16 hours. 6 of the resulting colonies were tested for their ability to induce
expression from its T7 promoter using the procedure described in section 2.2.14
61
2.3 Protein Production and Purification
Note- All buffers and samples used in this section were kept between 4-10ᵒC unless otherwise
stated.
2.3.1 Large Scale Growth for protein production
A 5mL culture of the Arctic Express strain containing the appropriate plasmid was grown in LB
media containing the appropriate antibiotic for 16 hours. This culture was used to inoculate a
further twenty 10mL solutions of the same media which were grown overnight at 37ᵒC. Each of
these 10mL solutions was used to inoculate a 2L flask containing the same media. The 2L
cultures are then grown at 37ᵒC to an OD600 of ~0.65 and then cooled to 15ᵒC for 45 minutes.
Cultures were then supplemented with 1mM IPTG and incubated at 15ᵒC for a further 16
hours. Cells were then harvested by centrifugation at 8000rcf with a Beckman JLA 8.1 rotor for
13 minutes. From a 20L growth, the harvested cells were split into 5 separate samples and
stored at -20ᵒC.
2.3.2 Cell Lysis and extraction
A sample of the harvested cells was thawed at 20ᵒC for 40 minutes and resuspended in 100mL
of buffer A (20mM Tris, 200mM NaCl, pH 7.5). For extraction of FrmR and FrmRC36S, the NaCl
concentration was reduced to 50mM due to the nature of the later purification steps. A
“protease inhibitor tablet, complete, EDTA free” from Roche was dissolved in the suspension
and lysozyme and DNAse were added, each at 100µg/mL. DNAse was not added when purifying
FrmR and FrmRC36S as this would interfere with downstream heparin purification steps. The
suspension was then placed in a sonicator (Bandalin) at ~0ᵒC and sonicated at an intensity of
20% for 30 minutes with 13 second pulses. The soluble crude extract was then obtained by
centrifugation at 30000rcf in a Beckman 25.10 rotor for 1 hour at 4ᵒC.
2.3.3 Nickel Affinity Purification
The His-tagged proteins FrmR-His, HxlR1-His and HxlR2-His were purified by a nickel affinity
method. Buffered imidazole (pH 7.5) was added the soluble extract at 20mM and then incubated
with 1.5mL of Nickel agarose-NTA (QIAGEN) at 4ᵒC for 90 minutes. The solution was then
62
centrifuged at 2000rcf for 5 minutes so as to separate the nickel agarose from the extract
solution. The unbound solution was removed and kept at 4ᵒC for later use. The nickel-agarose
was then washed by re-suspending in 6mL of 20mM imidazole in 20mM Tris, 200mM NaCl, pH
7.5 buffers. The suspension was then centrifuged for 5 minutes at 2000rcf and the supernatant
was removed and kept at 4ᵒC for analysis. This washing procedure was repeated with the same
buffer containing increasing imidazole concentrations at 40mM, 60mM, and 80mM. The bound
“His-Tagged” proteins were eluted by repeating the wash procedure at 300mM imidazole. The
different fractions were then analysed by SDS-PAGE. Pure protein samples were dialysed in
3mL 3.5kDa cut-off GeBAflexTM dialysis tubes (GeBa) against at least a 1000-fold excess in
volume of buffer A (20mM Tris, 200mM NaCl, pH 7.5). If samples were not to be used
immediately, glycerol (20% v/v) was added and samples were stored at -80ᵒC.
2.3.4 Purification of FrmR and FrmRC36S
The non-tagged FrmR and FrmRC36S proteins were purified from cellular extract in two stages.
The first stage used a heparin affinity method. A 5mL Heparin “HiTrapTM” column (GE
Healthcare) was fitted onto an “AKTA” purification system (GE Healthcare) and the column was
equilibrated with >25mL of loading buffer A (20mM Tris, 50mM NaCl, pH 7.5). The bound
protein was eluted by a linear gradient with buffer B ( 1M NaCl, 20mM Tris, pH 7.5) and 4mL
fractions were collected. The amount of protein being eluted in each fraction was estimated by
monitoring the 280nm absorbance. Fractions were then examined by SDS-PAGE and those
containing FrmR/FrmRC36S were pooled and concentrated using a 20mL “Centricon(R)” protein
concentrator from Sartorius. (100kDa Molecular weight cut-off).
Size exclusion chromatography (SEC) was used in the next stage of the purification of FrmR and
FrmRC36S. A Superdex 200 column (GE Healthcare) was loaded onto an AKTA purifying system
(GE Healthcare). The column was equilibrated with >30mL of buffer A (20mM Tris, 200mM
NaCl, pH 7.5) prior to injection of the 0.5mL FrmR/FrmRC36S. Elution of proteins was
monitored spectroscopically at 280nm with elution time allowing an estimation of molecular
weight when comparing against a series of standards. The procedure for SEC for molecular
weight estimation used BSA, Ovalbumin, Carbonic Anhydrase and RNAase (each at 1mg/mL,
0.5mL) as standards. A plot of log10(MW) against elution volume was fitted to a linear least
squares function. This was then used to estimate the MW of FrmR/FrmRC36S proteins. 15µL of
each fraction was analysed by SDS-PAGE and those that contained FrmR/FrmRC36S were
63
pooled. Samples that were not to be used immediately were made to 20%v/v glycerol and
stored at -80ᵒC.
2.3.5 Protein Concentration Estimation
Protein concentrations were estimated using a “Bio-rad Protein Assay” kit (Bio-Rad) which is
based on the methods described in 182 (Commonly termed Bradford Assay). Five solutions
containing BSA ranging from 0.2-1.0mg/mL were prepared. 20µL of each solution was then
added to 980µL of the provided dye. Each solution was mixed and left for 3 minutes prior to
recording the absorption of the solution at 595nm. A plot of A595 against BSA concentration was
used to fit a straight line that was used as a calibration curve to estimate the concentration of
unknown protein samples.
2.4 In vitro biochemical and biophysical characterisation methods
2.4.1 Mass-Spectrometry
Mass spectrometry measures the mass to charge ratio of ionized molecules, and thus allows the
molecular mass of the molecule to be determined when the ionization state is known. Mass
spectrometry in this section was performed using an electrospray time of flight system. This
means that ionization of the protein is performed by electrospray in which the protein solution
is pumped through a needle and a high voltage is used to disperse (electrospray) the liquid into
small charged droplets. These droplets then evaporate and transfer some of their charge to the
protein molecules which can be detected by the mass spectrometer 183. Electrospray ionization
produces multiple charged species in the protein which give rise to many peaks though these
can be deconvoluted to obtain the molecular mass.184 Prior to electrospray ionization, the
protein sample is run through a reverse phase monolithic column in order to remove all salts
from the protein sample. This is because salt ions “stick” to the protein during ionization
therefore altering its molecular mass 185. Time of flight refers to how the mass to charge ratio is
measured. Ions are accelerated by an electric field with a fixed kinetic energy, and the time
taken for the ions reach a detector is recorded. From the time recorded, the mass to charge ratio
of the ion can be calculated.186 On measuring the m/z of a protein signals will be detected that
contain many different combinations of isotopes throughout the polypeptide. As such, a
distribution of signals is recorded and the major peak in the final spectrum represents the
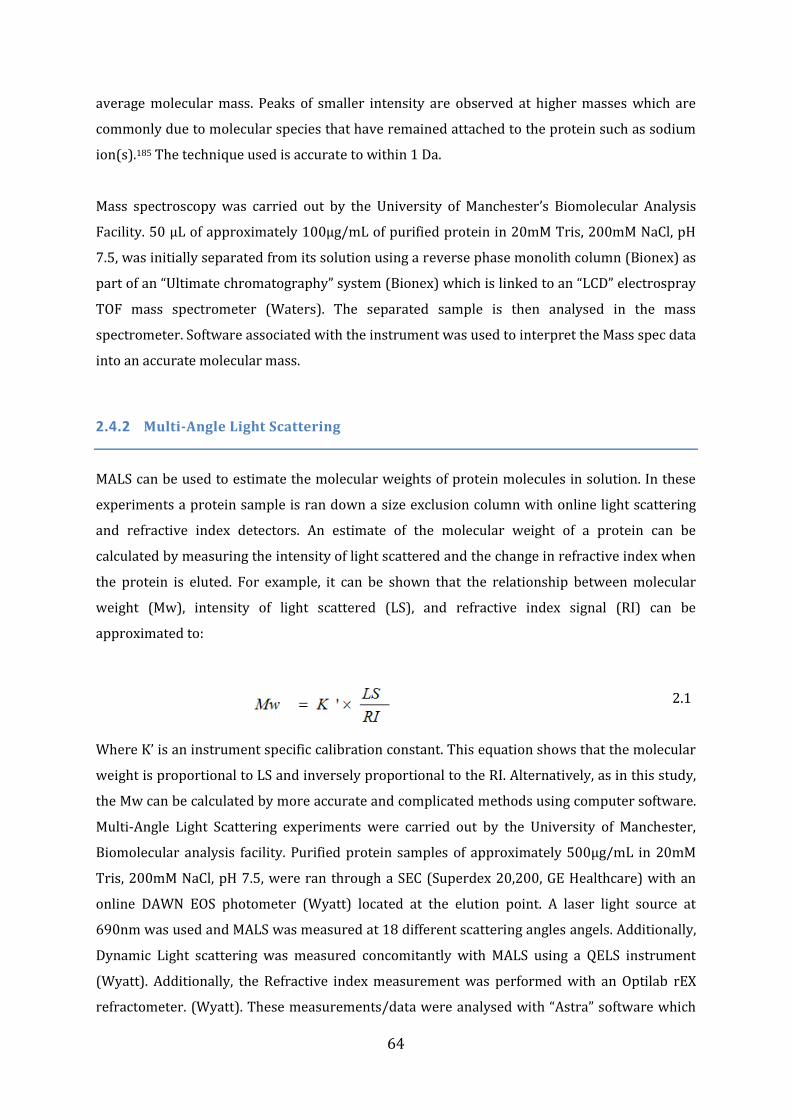
64
average molecular mass. Peaks of smaller intensity are observed at higher masses which are
commonly due to molecular species that have remained attached to the protein such as sodium
ion(s).185 The technique used is accurate to within 1 Da.
Mass spectroscopy was carried out by the University of Manchester’s Biomolecular Analysis
Facility. 50 µL of approximately 100µg/mL of purified protein in 20mM Tris, 200mM NaCl, pH
7.5, was initially separated from its solution using a reverse phase monolith column (Bionex) as
part of an “Ultimate chromatography” system (Bionex) which is linked to an “LCD” electrospray
TOF mass spectrometer (Waters). The separated sample is then analysed in the mass
spectrometer. Software associated with the instrument was used to interpret the Mass spec data
into an accurate molecular mass.
2.4.2 Multi-Angle Light Scattering
MALS can be used to estimate the molecular weights of protein molecules in solution. In these
experiments a protein sample is ran down a size exclusion column with online light scattering
and refractive index detectors. An estimate of the molecular weight of a protein can be
calculated by measuring the intensity of light scattered and the change in refractive index when
the protein is eluted. For example, it can be shown that the relationship between molecular
weight (Mw), intensity of light scattered (LS), and refractive index signal (RI) can be
approximated to:
2.1
Where K’ is an instrument specific calibration constant. This equation shows that the molecular
weight is proportional to LS and inversely proportional to the RI. Alternatively, as in this study,
the Mw can be calculated by more accurate and complicated methods using computer software.
Multi-Angle Light Scattering experiments were carried out by the University of Manchester,
Biomolecular analysis facility. Purified protein samples of approximately 500µg/mL in 20mM
Tris, 200mM NaCl, pH 7.5, were ran through a SEC (Superdex 20,200, GE Healthcare) with an
online DAWN EOS photometer (Wyatt) located at the elution point. A laser light source at
690nm was used and MALS was measured at 18 different scattering angles angels. Additionally,
Dynamic Light scattering was measured concomitantly with MALS using a QELS instrument
(Wyatt). Additionally, the Refractive index measurement was performed with an Optilab rEX
refractometer. (Wyatt). These measurements/data were analysed with “Astra” software which
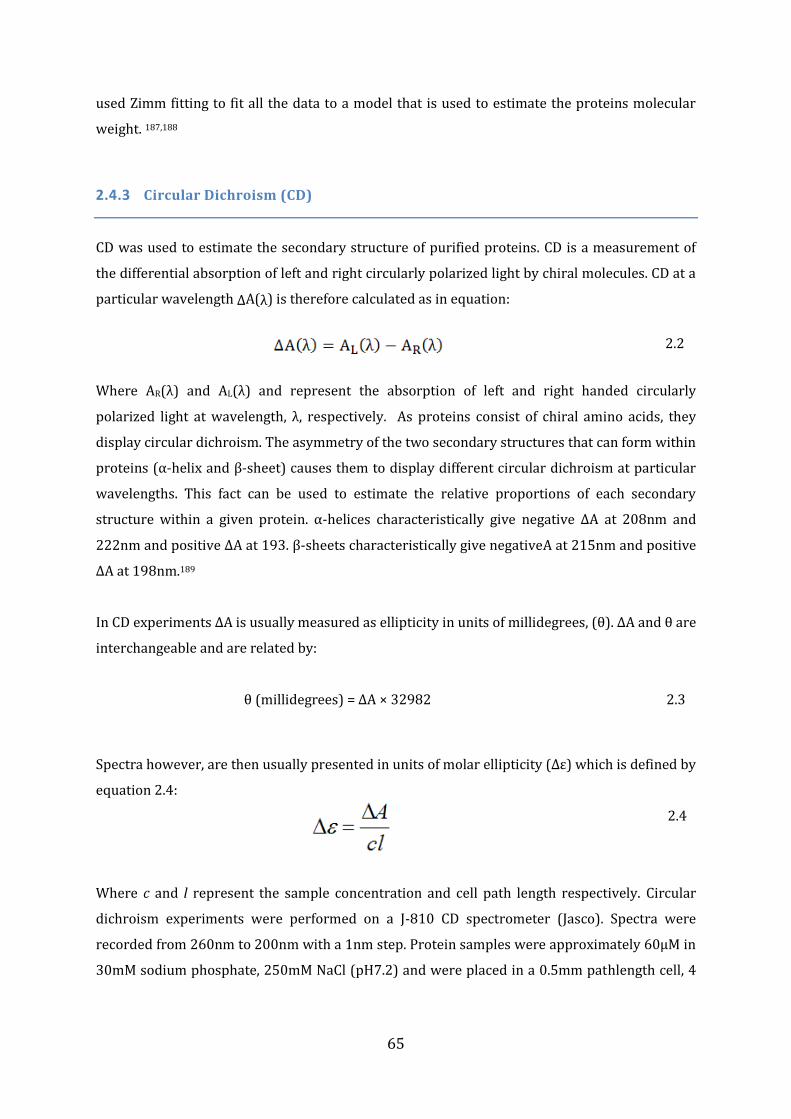
65
used Zimm fitting to fit all the data to a model that is used to estimate the proteins molecular
weight. 187,188
2.4.3 Circular Dichroism (CD)
CD was used to estimate the secondary structure of purified proteins. CD is a measurement of
the differential absorption of left and right circularly polarized light by chiral molecules. CD at a
particular wavelength ∆A(λ) is therefore calculated as in equation:
Where AR(λ) and AL(λ) and represent the absorption of left and right handed circularly
polarized light at wavelength, λ, respectively. As proteins consist of chiral amino acids, they
display circular dichroism. The asymmetry of the two secondary structures that can form within
proteins (α-helix and β-sheet) causes them to display different circular dichroism at particular
wavelengths. This fact can be used to estimate the relative proportions of each secondary
structure within a given protein. α-helices characteristically give negative ∆A at 208nm and
222nm and positive ∆A at 193. β-sheets characteristically give negativeA at 215nm and positive
∆A at 198nm.189
In CD experiments ΔA is usually measured as ellipticity in units of millidegrees, (θ). ΔA and θ are
interchangeable and are related by:
θ (millidegrees) = ΔA × 32982 2.3
Spectra however, are then usually presented in units of molar ellipticity (∆ε) which is defined by
equation 2.4:
2.4
Where c and l represent the sample concentration and cell path length respectively. Circular
dichroism experiments were performed on a J-810 CD spectrometer (Jasco). Spectra were
recorded from 260nm to 200nm with a 1nm step. Protein samples were approximately 60µM in
30mM sodium phosphate, 250mM NaCl (pH7.2) and were placed in a 0.5mm pathlength cell, 4
2.2
66
spectra were recorded for each sample; these were averaged to give the overall sample
spectrum.
The recorded spectra were used for secondary structure analysis. The software used to
interpret CD spectra in terms of secondary structure composition was K2D2. K2D2 uses a type
of artificial neural network called a ‘self-organizing map’ (SOM) that is trained with proteins of
known tertiary structure. This SOM is used to create two secondary structure maps, one for α-
helices and one for β-sheets. K2D2 uses these maps to make a prediction on the relative α-helix
and β-sheet contribution of a protein from its CD spectrum.190
2.4.4 Electropheric Mobility Shift Assays (EMSAs)
Non-competitive EMSAs were performed to determine whether purified proteins bind non-
specifically to DNA. The experiment relies on the fact that DNA:protein complexes will run at
different speed from the free DNA molecule when subject to electrophoresis.191 DNA fragments
were obtained using PCR. A 10% polyacrylamide gel was cast by pouring a 20mL
polymerisation solution into 1.5mm cassetes from Invitrogen. (The polymerisation solution
contained 2 mL 0.5×TBE (45mM tris, 45mM boric acid, 1mM EDTA, pH8.0), 2mL 37%
acrylamide (Protogel), 13.59mL ddH2O and 0.4 mL of 10% w/v ammonium persulfate (APS).
10µL of tetramethylethylenediamine (TEMED) was then added to initiate the polymerisation
and the solution was poured into 1.5mm Cassettes, (Invitrogen) and left for 30 minutes.
Samples (20µL) contained: either 60 or 90 ng of DNA, 0-500ng protein of interest in binding
buffer (100mM NaCl, 5mM Tris/HCl (pH 7.5), 5mM MgCl2). Additionally for FrmR-His, FrmR and
FrmRC36S, 100mM β-mercaptoethanol was also present. For binding reactions in which the
dependence of DNA:protein complex formation on formaldehyde is tested, the protein was pre-
treated with 5mM formaldehyde prior to mixing with the DNA. DNA:protein samples were
incubated at room temperature for 30 minutes. Prior to loading the gel, 3.5µL of EMSA loading
dye (15% ficoll, 0.02% bromophenol blue and 0.02% xylene-cyanol). Gels were run in 0.5×TBE
at 90V for approximately 2 hours. Gels were stained in a 20mg/mL Ethidium Bromide solution
for 10 minutes and DNA was visualised under UV-light.
Competitive EMSAs assess the specificity of the protein-DNA interaction. The casting and
running of the gel is done identically as described above for Non-competitive EMSAs. Biotin-
labelled DNA fragments were obtained using biotin labelled primers. Samples contained
67
between 4 and 6ng of the biotin labelled DNA fragment, between 0.3 and 2.0µg of the protein of
interest and 0.5µg Poly(I)·Poly(C). The reaction was performed in binding buffer (see above) for
30 minutes. Again for the FrmR-His, FrmR and FrmRC36S proteins, this was supplemented with
100mM β-mercaptoethanol. For reactions where the effect of formaldehyde is analysed, the
protein was pre-treated with 5mM formaldehyde. Immediately before running of the gel, 3.5 µL
of EMSA loading dye was added to the binding reaction.
The Biotin-labelled DNA was visualized using LightShift Chemiluminescent EMSA Kit (Thermo
Scientific) The DNA is electro-blotted onto a nitrocellulose membrane in 0.5×TBE buffer at 380V
for 15 minutes in an Invitrogen blotting tank. The membrane is then wrapped in transparent
film and placed under UV light for 15 minutes in order to cross link the DNA to the membrane.
The membrane is then incubated in 25mL of the provided “blocking buffer” (100mM Tris/HCl,
0.5% SDS, 10g/L BSA, pH8.0) for 15 minutes. The membrane is then transferred to 25mL
“blocking buffer” with 50 µL Streptavidin-horseradish peroxidase conjugate and incubated for a
further 15 minutes. The Streptavidin-horseradish peroxidase conjugate selects for the biotin
labelled DNA. The membrane is then incubated in 25mL of the provided “wash buffer” (100mM
Tris/HCl, 0.5% SDS, pH8.0) for 15 minutes. This wash step is repeated another two times. The
membrane is then incubated in 1mL of the provided luminol/enhancer solution for 5 minutes.
This solution detects the Biotin- Streptavidin-horseradish peroxidase complex and exhibits
chemiluminescence. The membrane is then exposed to photographic film in the dark which is
subsequently developed for 10-120 minutes.
2.4.5 Fluorescence Spectroscopy
Fluorescence of an Alexa Fluor-555 labelled DNA molecule (Eurofins) was monitored in a Cary
Eclipse Fluorescence Spectrophotometer (Varian) in a 1mm Quartz cuvette with excitation at
555nm and emission measured at 565nm. The excitation and emission slits were both set at
5mm. 10µM of labelled DNA was titrated with increasing protein concentration to
a molar excess of 1.5 (protein:DNA). The reaction was performed in 30mM Phosphate buffer,
50mM NaCl, pH7.2. Protein was taken from a highly concentrated stock solution >200 µM. A
small correction was made to the fluorescence value to account for the dilution. This correction
assumes linearity in fluorescence signal with regard to the fluorophore concentration. Five
repeats were carried out for each sample with the average value taken for each point along with
its associated standard deviation.
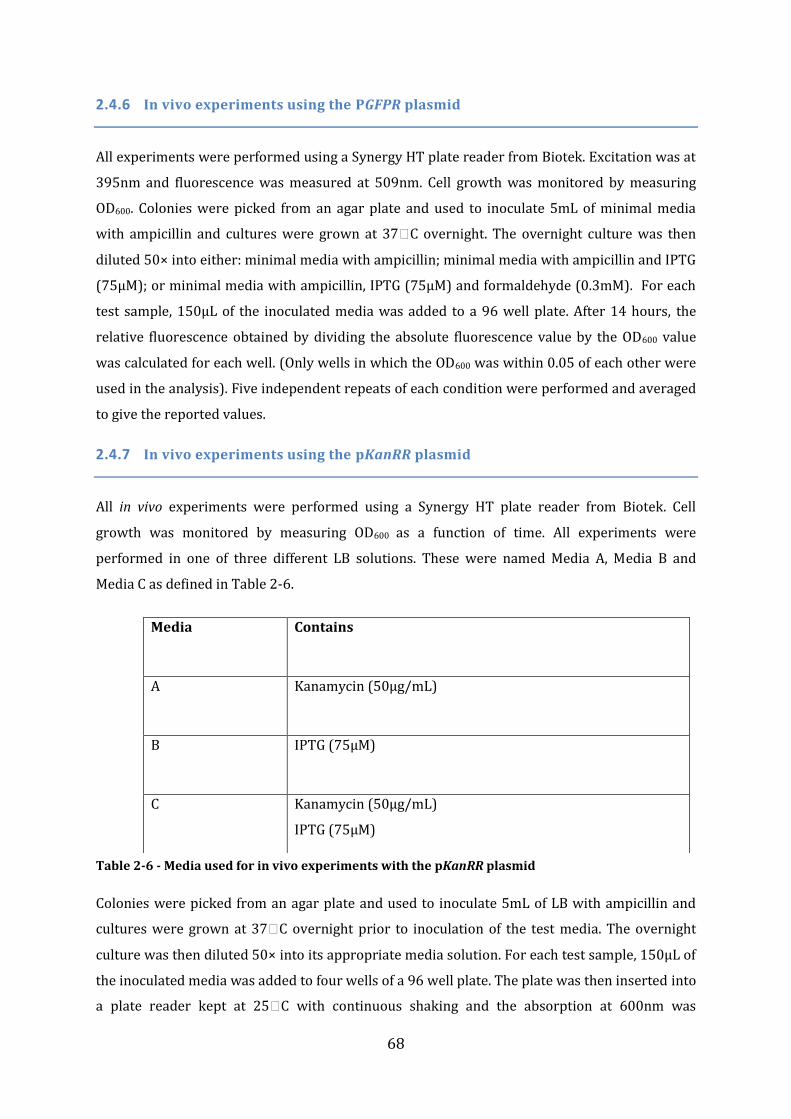
68
2.4.6 In vivo experiments using the PGFPR plasmid
All experiments were performed using a Synergy HT plate reader from Biotek. Excitation was at
395nm and fluorescence was measured at 509nm. Cell growth was monitored by measuring
OD600. Colonies were picked from an agar plate and used to inoculate 5mL of minimal media
with ampicillin and cultures were grown at 37ᵒC overnight. The overnight culture was then
diluted 50× into either: minimal media with ampicillin; minimal media with ampicillin and IPTG
(75µM); or minimal media with ampicillin, IPTG (75µM) and formaldehyde (0.3mM). For each
test sample, 150µL of the inoculated media was added to a 96 well plate. After 14 hours, the
relative fluorescence obtained by dividing the absolute fluorescence value by the OD600 value
was calculated for each well. (Only wells in which the OD600 was within 0.05 of each other were
used in the analysis). Five independent repeats of each condition were performed and averaged
to give the reported values.
2.4.7 In vivo experiments using the pKanRR plasmid
All in vivo experiments were performed using a Synergy HT plate reader from Biotek. Cell
growth was monitored by measuring OD600 as a function of time. All experiments were
performed in one of three different LB solutions. These were named Media A, Media B and
Media C as defined in Table 2-6.
Table 2-6 - Media used for in vivo experiments with the pKanRR plasmid
Colonies were picked from an agar plate and used to inoculate 5mL of LB with ampicillin and
cultures were grown at 37ᵒC overnight prior to inoculation of the test media. The overnight
culture was then diluted 50× into its appropriate media solution. For each test sample, 150µL of
the inoculated media was added to four wells of a 96 well plate. The plate was then inserted into
a plate reader kept at 25ᵒC with continuous shaking and the absorption at 600nm was
Media Contains
A Kanamycin (50µg/mL)
B IPTG (75µM)
C Kanamycin (50µg/mL)
IPTG (75µM)

69
recorded every 14 minutes for approximately 18 hours. The absorption values for each of the
four wells were averaged to give the value taken for 1 replicate. At least three replicates were
recorded for each sample in which the initial starting culture came from a separate colony from
a separate transformation. For in vivo experiments that were testing the effect of formaldehyde,
0.3mM formaldehyde was added to the media.
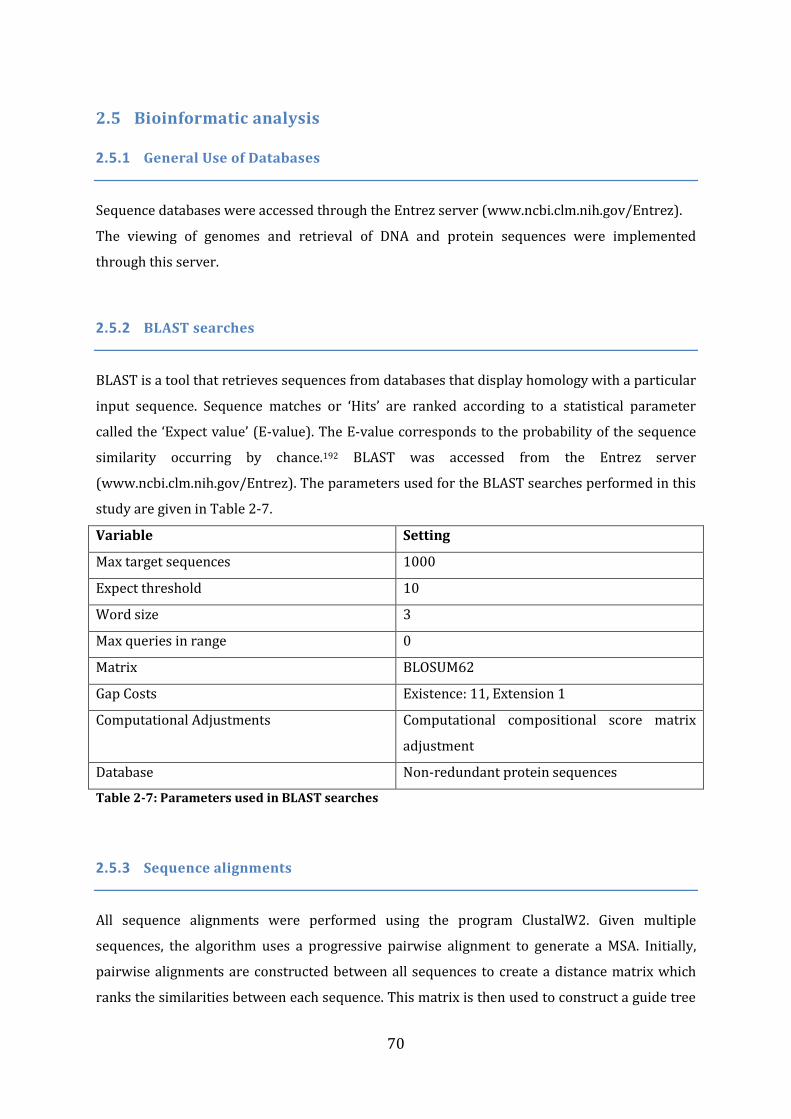
70
2.5 Bioinformatic analysis
2.5.1 General Use of Databases
Sequence databases were accessed through the Entrez server (www.ncbi.clm.nih.gov/Entrez).
The viewing of genomes and retrieval of DNA and protein sequences were implemented
through this server.
2.5.2 BLAST searches
BLAST is a tool that retrieves sequences from databases that display homology with a particular
input sequence. Sequence matches or ‘Hits’ are ranked according to a statistical parameter
called the ‘Expect value’ (E-value). The E-value corresponds to the probability of the sequence
similarity occurring by chance.192 BLAST was accessed from the Entrez server
(www.ncbi.clm.nih.gov/Entrez). The parameters used for the BLAST searches performed in this
study are given in Table 2-7.
Variable Setting
Max target sequences 1000
Expect threshold 10
Word size 3
Max queries in range 0
Matrix BLOSUM62
Gap Costs Existence: 11, Extension 1
Computational Adjustments Computational compositional score matrix
adjustment
Database Non-redundant protein sequences
Table 2-7: Parameters used in BLAST searches
2.5.3 Sequence alignments
All sequence alignments were performed using the program ClustalW2. Given multiple
sequences, the algorithm uses a progressive pairwise alignment to generate a MSA. Initially,
pairwise alignments are constructed between all sequences to create a distance matrix which
ranks the similarities between each sequence. This matrix is then used to construct a guide tree
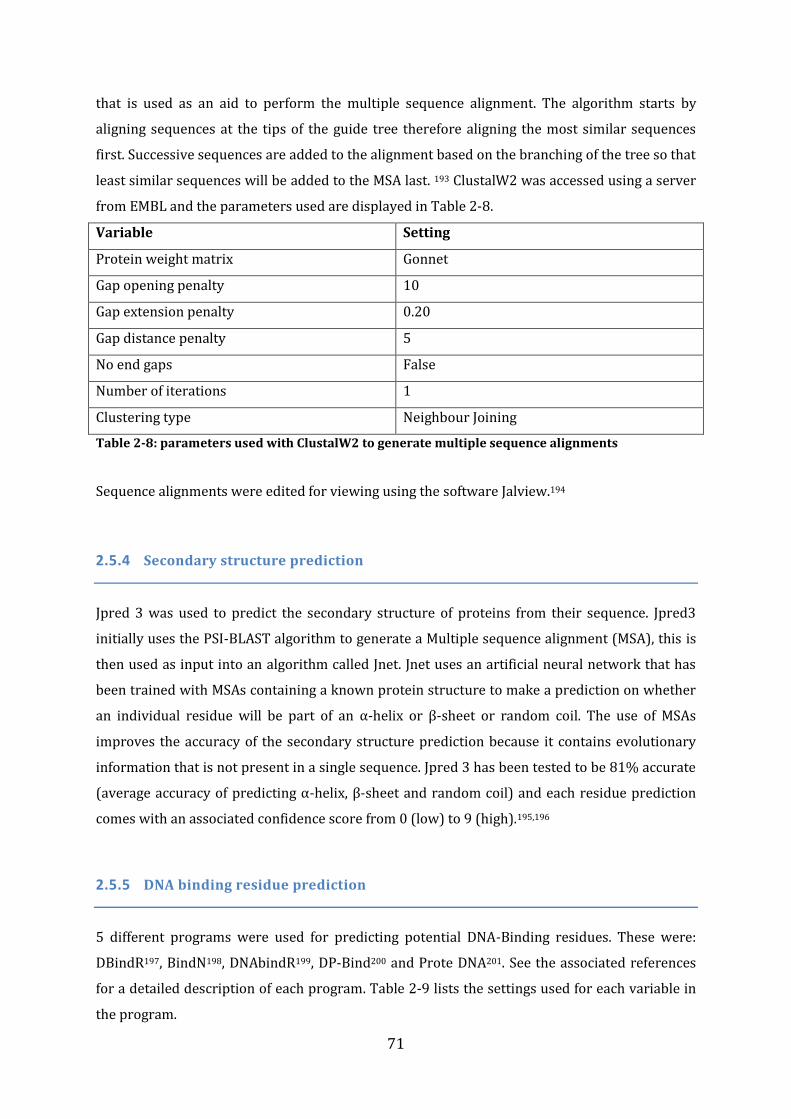
71
that is used as an aid to perform the multiple sequence alignment. The algorithm starts by
aligning sequences at the tips of the guide tree therefore aligning the most similar sequences
first. Successive sequences are added to the alignment based on the branching of the tree so that
least similar sequences will be added to the MSA last. 193 ClustalW2 was accessed using a server
from EMBL and the parameters used are displayed in Table 2-8.
Variable Setting
Protein weight matrix Gonnet
Gap opening penalty 10
Gap extension penalty 0.20
Gap distance penalty 5
No end gaps False
Number of iterations 1
Clustering type Neighbour Joining
Table 2-8: parameters used with ClustalW2 to generate multiple sequence alignments
Sequence alignments were edited for viewing using the software Jalview.194
2.5.4 Secondary structure prediction
Jpred 3 was used to predict the secondary structure of proteins from their sequence. Jpred3
initially uses the PSI-BLAST algorithm to generate a Multiple sequence alignment (MSA), this is
then used as input into an algorithm called Jnet. Jnet uses an artificial neural network that has
been trained with MSAs containing a known protein structure to make a prediction on whether
an individual residue will be part of an α-helix or β-sheet or random coil. The use of MSAs
improves the accuracy of the secondary structure prediction because it contains evolutionary
information that is not present in a single sequence. Jpred 3 has been tested to be 81% accurate
(average accuracy of predicting α-helix, β-sheet and random coil) and each residue prediction
comes with an associated confidence score from 0 (low) to 9 (high).195,196
2.5.5 DNA binding residue prediction
5 different programs were used for predicting potential DNA-Binding residues. These were:
DBindR197, BindN198, DNAbindR199, DP-Bind200 and Prote DNA201. See the associated references
for a detailed description of each program. Table 2-9 lists the settings used for each variable in
the program.

72
Program Settings Used
DBindR Prediction method: Random Forest
BindN Specificity: 80%
DNAbindR No editable variables for this program
DP-Bind Encoding Method: PSSM-based
Prote DNA No editable variables for this program
Table 2-9: Settings used in DNA binding residue prediction algorithms
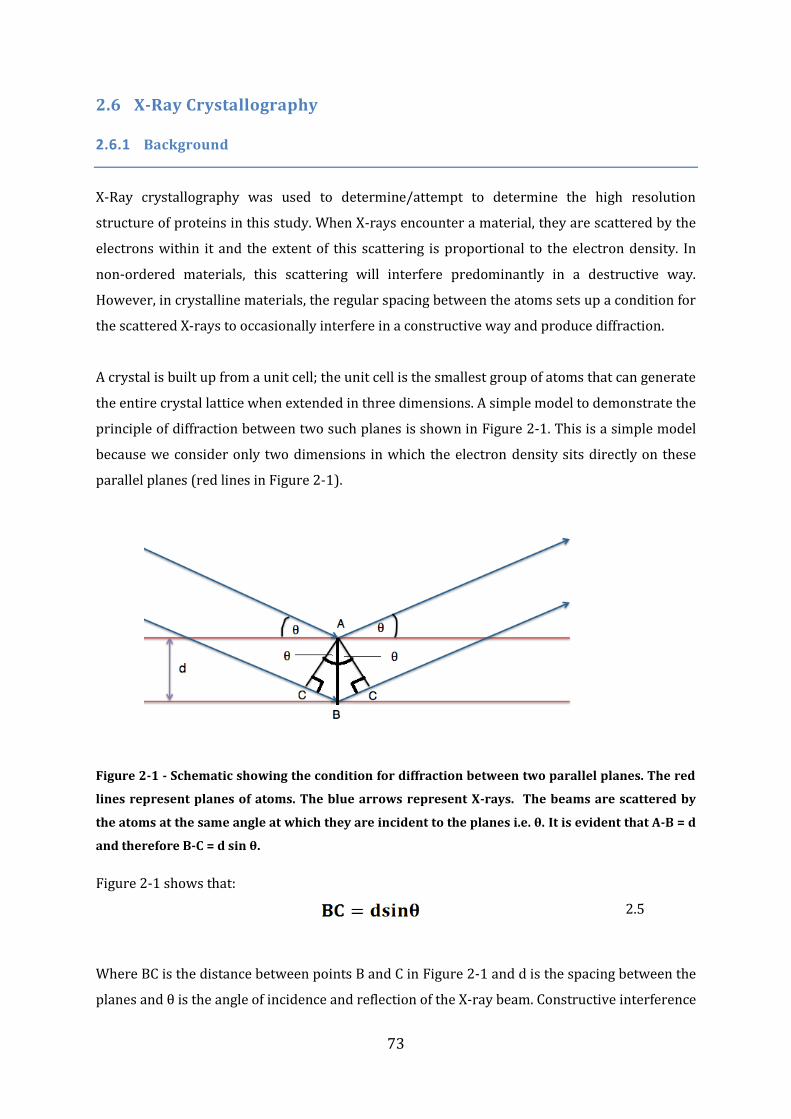
73
2.6 X-Ray Crystallography
2.6.1 Background
X-Ray crystallography was used to determine/attempt to determine the high resolution
structure of proteins in this study. When X-rays encounter a material, they are scattered by the
electrons within it and the extent of this scattering is proportional to the electron density. In
non-ordered materials, this scattering will interfere predominantly in a destructive way.
However, in crystalline materials, the regular spacing between the atoms sets up a condition for
the scattered X-rays to occasionally interfere in a constructive way and produce diffraction.
A crystal is built up from a unit cell; the unit cell is the smallest group of atoms that can generate
the entire crystal lattice when extended in three dimensions. A simple model to demonstrate the
principle of diffraction between two such planes is shown in Figure 2-1. This is a simple model
because we consider only two dimensions in which the electron density sits directly on these
parallel planes (red lines in Figure 2-1).
Figure 2-1 - Schematic showing the condition for diffraction between two parallel planes. The red
lines represent planes of atoms. The blue arrows represent X-rays. The beams are scattered by
the atoms at the same angle at which they are incident to the planes i.e. θ. It is evident that A-B = d
and therefore B-C = d sin θ.
Figure 2-1 shows that:
2.5
Where BC is the distance between points B and C in Figure 2-1 and d is the spacing between the
planes and θ is the angle of incidence and reflection of the X-ray beam. Constructive interference
74
occurs when two waves are in phase and this occurs when the path difference between them is
equal to an integer multiple of λ (wavelength). Therefore, if two X-ray beams are impinging on a
crystal with two planes separated by distance, d, at the same angle θ, the scattered waves can
only interfere constructively provided the following equation is satisfied:
2.6
Where n is an integer and λ is the wavelength of the radiation. This is called Bragg’s law and if
this condition is not met, destructive interference will cancel out any scattered radiation. For a
3D crystal, the diffraction pattern is a pattern of spots scattered around the main incident beam.
Each spot (or reflection) represents a point where constructive interference has occurred
between particular planes in the crystal lattice. The total scattering of X-rays from lattice planes
in a crystal is a result of the interaction between the radiation and all the electron density in the
unit cell. How much each atom contributes to the overall scattering of the X-ray depends on two
factors: the identity of the atom (atoms with higher electron density scatter X-rays more than
those with low electron density) and where the atom is located relative to the diffracting plane.
Each diffracted wave (i.e. reflection in the diffraction pattern) is described by a mathematical
function known a structure factor, Fhkl. (h, k, and l describe the lattice plane from which the X-
ray is diffracted). The structure factor is related to the electron density within the unit cell by
the following equation:
2.7
Where p is the electron density at coordinates x,y and z within the unit cell. The integral V is the
volume over the unit cell (x, y and z). The equation shows that if Fhkl is known for all reflection
(h,k,l) , then the electron density at a position (x,y,z) can be determined by a mathematical
operation called Fourier transform. To obtain a high resolution map of the electron density
within the unit cell, it is necessary to have structure factors for h,k,l planes in which the value of
d is of the intended resolution. Equation 2.6 indicates that to obtain reflections corresponding to
these small values of d, they have to be diffracted at high angles. This results in the diffracted
waves from shortly spaced planes being observed in the most outer ring of the recorded
diffraction pattern.
75
The structure factor can be represented as a complex vector of two components. The real
component of the vector is proportional to the amplitude of the reflection and is represented as
the absolute value of the structure factor |F|. |F| can be determined from the intensity, Ih,k,l of the
reflection which is recorded in the diffraction experiment. The imaginary component describes
the angle that the vector F makes to the real component of the vector i.e. the phase angle, h,k,l.
In these terms, the electron density at a point, ρ(x,y,z), is given by the following equation:
2.8
It is entirely possible to determine the dimensions of the plane (h,k,l) of each reflection as well
as the absolute value of the structure factor |Fh,k,l| from a diffraction experiment. The only other
parameters that are needed in order to solve equation 2.8 in terms of electron density is the
phase angle h,k,l of each reflection. However, it is practically impossible to directly measure the
phase angle of a reflection during a protein X-ray diffraction experiment. This fact results in the
so-call phase problem. Fortunately, there are a series of solutions to this problem that either
allow an indirect measurement of the phases using anomalous scattering techniques and
isomorphous substitution, or by using molecular replacement (MR) that allows the phases be
estimated to good approximation using an available model for the molecule that is being
studied. Once a good estimate of h,k,l is obtained for all reflections, it is possible to construct an
initial model from the corresponding electron density maps. This initial model can be improved
by an iterative process called refinement, and the phases can be derived directly from the
model. The refinement combines X-ray data with stereochemical restraints to create a more
accurate model. Each refinement outputs a new model with new calculated structure factors
Fcalc for each reflection. A statistic used to assess the refinement is called the R-factor, R, which is
a measurement of the difference between the observed intensities |F| and what the intensities
would be if calculated from the refined model |Fcalc|, i.e. Equation 2.9
2.9
A more robust statistic is the free R-factor, Rfree, in which ~5% of the diffraction data are
omitted from the refinement and is used as |F| in the calculation. This statistic eliminates bias
because the omitted data has not been used to determine |Fcalc|. For a completed model, the R
and Rfree values should be approximately equal to 0.1 times the resolution of the diffraction data
(in Å). When all aspects of the refinement are completed and the model is as complete and as
accurate as possible, the model is generally submitted to the Protein Data Bank which is a freely
available database. 202,203,204
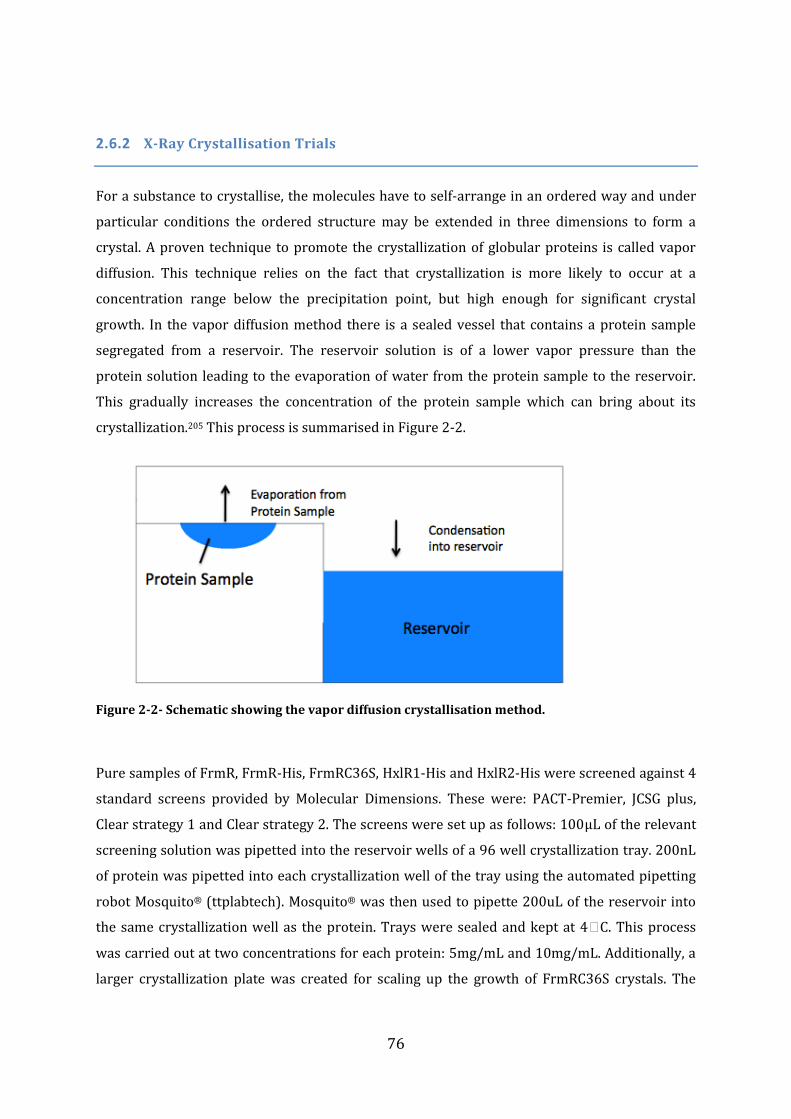
76
2.6.2 X-Ray Crystallisation Trials
For a substance to crystallise, the molecules have to self-arrange in an ordered way and under
particular conditions the ordered structure may be extended in three dimensions to form a
crystal. A proven technique to promote the crystallization of globular proteins is called vapor
diffusion. This technique relies on the fact that crystallization is more likely to occur at a
concentration range below the precipitation point, but high enough for significant crystal
growth. In the vapor diffusion method there is a sealed vessel that contains a protein sample
segregated from a reservoir. The reservoir solution is of a lower vapor pressure than the
protein solution leading to the evaporation of water from the protein sample to the reservoir.
This gradually increases the concentration of the protein sample which can bring about its
crystallization.205 This process is summarised in Figure 2-2.
Figure 2-2- Schematic showing the vapor diffusion crystallisation method.
Pure samples of FrmR, FrmR-His, FrmRC36S, HxlR1-His and HxlR2-His were screened against 4
standard screens provided by Molecular Dimensions. These were: PACT-Premier, JCSG plus,
Clear strategy 1 and Clear strategy 2. The screens were set up as follows: 100µL of the relevant
screening solution was pipetted into the reservoir wells of a 96 well crystallization tray. 200nL
of protein was pipetted into each crystallization well of the tray using the automated pipetting
robot Mosquito® (ttplabtech). Mosquito® was then used to pipette 200uL of the reservoir into
the same crystallization well as the protein. Trays were sealed and kept at 4ᵒC. This process
was carried out at two concentrations for each protein: 5mg/mL and 10mg/mL. Additionally, a
larger crystallization plate was created for scaling up the growth of FrmRC36S crystals. The
77
reservoir was composed of 2µL of reservoir, and 2µL of protein sample, and were manually
pipetted into the crystallization well. The tray was sealed and stored at 4ᵒC.
2.6.3 Data Collection
Crystals were either taken directly from the screening tray or the scaled up tray. Those of
FrmRC36S were cryo-protected with a 1:1 mixture of glycerol and PEG 200 placed into a loop
and then frozen in liquid nitrogen. HxlR2-His crystals were cryo-protected with mother liquor
supplemented with 8% PEG 200, placed into a loop and then frozen in liquid nitrogen.
Diffraction experiments were performed at the European Synchrotron Radiation Facility (ESRF)
beamline ID 14-4 (HxlR2-His) or beamline ID -23-1 (FrmRC36S), wavelengths were
approximately 0.94Å. Images were recorded through 180ᵒ with an individual oscillation angle
of 0.5ᵒ.
2.6.4 Data Processing
Indexing and integration of images was performed using the program “iMosflm”.206 Scaling and
merging was undertaken by “SCALA”207. Space group determination was done using
“Pointless”.207 The conversion of intensities to structure factors was performed with
“Truncate”; Truncate was also used to generate a 5% R-free dataset.208
2.6.5 Molecular Replacement
The MR procedure was performed using the program Phaser.209 The phasing model tried for
both HxlR2 data sets was that of the protein YtdC (PDB ID 2HHZ) from Bacillus subtilis. For
FrmRC36S data sets, two models were trialled as phasing models. These were CsoR from
Mycobacterium tuberculosis (PDB ID 2HH7) and CsoR from Bacillus subtilis (PDB ID 3AAI)
Additionally, molecular models were generated using the programs CaspR and Balbes.210,233
Each MR procedure with Phaser performed searches in the crystal space group as well as
related space groups in case the diffraction data had not been assigned to the correct group. The
output from Phaser with the highest likelihood score was carried forward for further model
building and refinement.
78
2.6.6 Model building, Refinement and validation
The initial model obtained from Phaser was rebuilt automatically by using the Autobuild
program as part of the Phenix software suite. Autobuild uses the program RESOLVE to perform
“Density modification” that iteratively improves the electron density maps (phases) by applying
known properties regarding protein electron density.211 Once the density modification has been
done, RESOLVE builds a model based on the sequence of the protein by fitting the sequence to
the electron density map.212 Autobuild then uses the program “phenix.refine” to refine the
current structure and minimize the R and R-free statistics. In addition to using the R factor as a
target score, the refinement uses known parameters such as legitimate bond and torsion angles,
bond lengths and Van der Waals contacts to score model coordinates. This is called a restrained
refinement. This routine also adds water molecules to the model where electron density that is
likely to correspond to water is observed. After each refinement round the model is used in
another round of RESOLVE, so as to iteratively improve the model.213,214 . The output electron
density map from Autobuild was then viewed in the software Coot as a 2F0-Fcalc map as well as
an F0-Fcalc along with the model. The model was further refined by manual adjustment. The
model was further refined using the program phenix.refine as part of the Phenix software
suite.214 The model generated was then adjusted in Coot and this iterative cycle was continued
until the R-free factor reached a minimum value. Validation of the final refined structure was
done by the program Molprobidity.215
2.6.7 Analysis of the dimer interface
The dimer interface of the final model HxlR2-His in the P43212 space group was analysed using
Protorp.216 Default settings were used for the analysis.
79
3 Cloning, Purification and Biophysical Characterisation of
Bacterial Transcription Factors Implicated in Formaldehyde
Sensing
3.1 Introduction
This chapter first examines the phylogenetic distribution of the known transcription factors of
formaldehyde detoxification pathways. This is done so as to obtain an improved context of the
regulators to be researched in this study. As we wish to obtain pure samples of some of these
proteins, this chapter covers the molecular biology that was performed in order to achieve this.
Also, the purification of the recombinant proteins is presented. The work in the latter part of the
chapter then attempts to obtain information regarding the physical properties of the purified
proteins. These properties include size and their secondary structure composition.
3.2 Aims and Objectives
Phylogenetic analysis will be carried out using bioinformatics methodology. Genome sequencing
has created tremendously useful databases of gene sequences from which open reading frames
may be inferred. It is therefore possible to search for related proteins in different bacterial
species. Therefore, to determine which TFs are conserved, the databases of known and putative
protein sequences will be searched using a BLAST algorithm and those sequences which appear
as part of a FDP will be collected for further analysis. A multiple sequence alignment (MSA) will
be created for each TF type so that the level conservation throughout the sequences can be
evaluated. When necessary the MSA can be used to create a phylogenetic tree which graphically
represents the sequence relationships between particular organisms.
In order to obtain pure samples of the TFs, their corresponding genes will be amplified by PCR
from either genomic or synthesised DNA templates. The corresponding genes will be inserted
into an expression vector using molecular cloning techniques which will allow the genes to be
overexpressed in E.coli. Purification of the overexpressed proteins will be attempted using a
number of chromatography based methods.

80
Once purified, it will be attempted to determine the size of the TF. The monomeric intact mass
of the proteins will be measured accurately using Mass Spectrometry , whereas Light Scattering
and Gel Filtration Chromatography will be used to evaluate their multimeric state. Finally, an
estimation of the secondary structure content of the TFs will be performed using a combination
of Circular Dichroism and computational prediction.
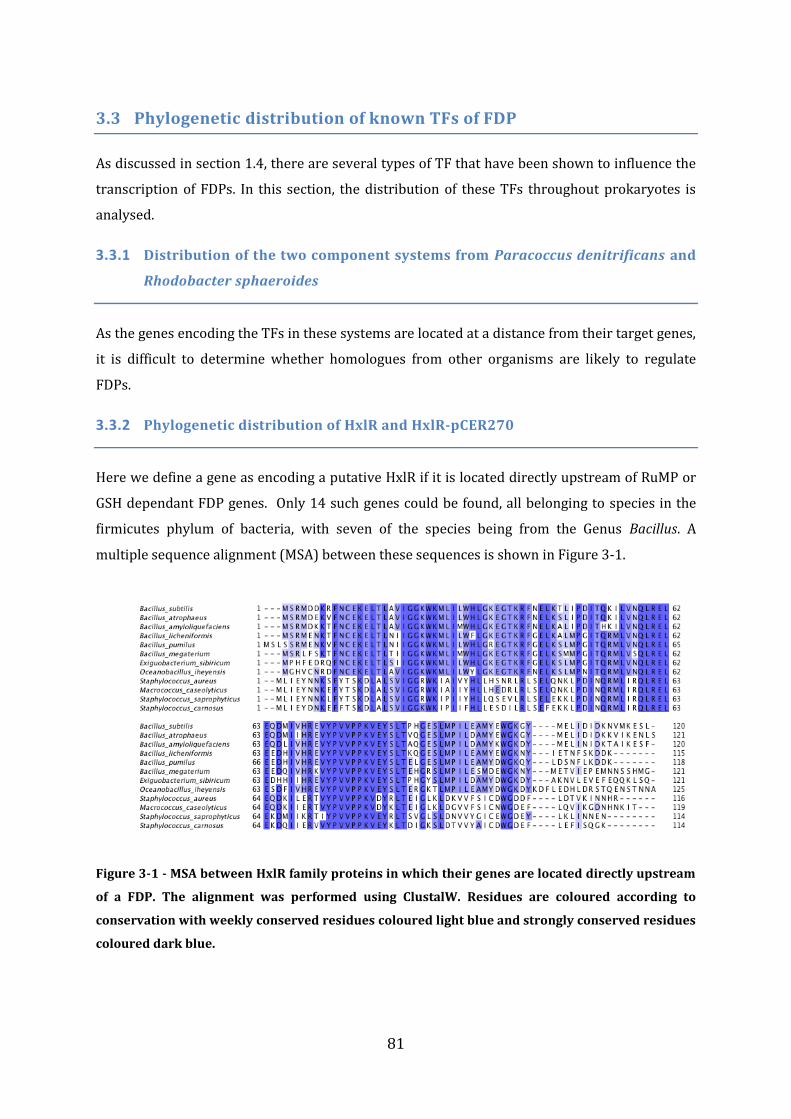
81
3.3 Phylogenetic distribution of known TFs of FDP
As discussed in section 1.4, there are several types of TF that have been shown to influence the
transcription of FDPs. In this section, the distribution of these TFs throughout prokaryotes is
analysed.
3.3.1 Distribution of the two component systems from Paracoccus denitrificans and
Rhodobacter sphaeroides
As the genes encoding the TFs in these systems are located at a distance from their target genes,
it is difficult to determine whether homologues from other organisms are likely to regulate
FDPs.
3.3.2 Phylogenetic distribution of HxlR and HxlR-pCER270
Here we define a gene as encoding a putative HxlR if it is located directly upstream of RuMP or
GSH dependant FDP genes. Only 14 such genes could be found, all belonging to species in the
firmicutes phylum of bacteria, with seven of the species being from the Genus Bacillus. A
multiple sequence alignment (MSA) between these sequences is shown in Figure 3-1.
Figure 3-1 - MSA between HxlR family proteins in which their genes are located directly upstream
of a FDP. The alignment was performed using ClustalW. Residues are coloured according to
conservation with weekly conserved residues coloured light blue and strongly conserved residues
coloured dark blue.
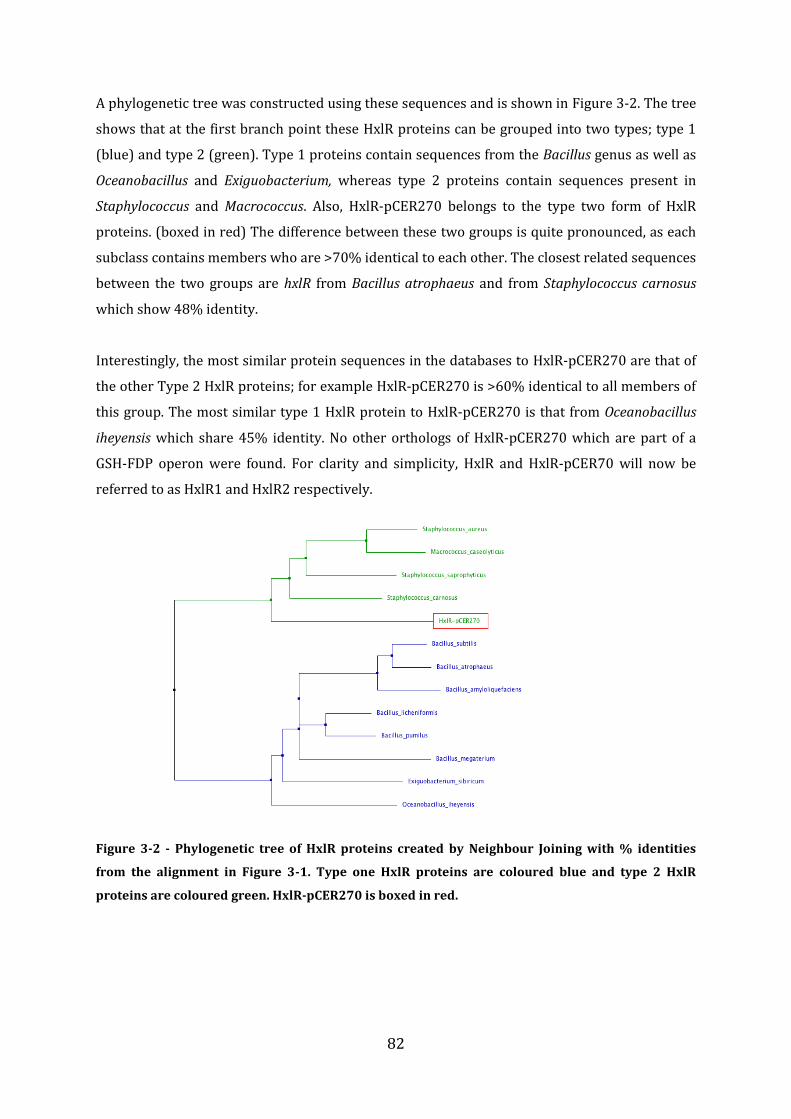
82
A phylogenetic tree was constructed using these sequences and is shown in Figure 3-2. The tree
shows that at the first branch point these HxlR proteins can be grouped into two types; type 1
(blue) and type 2 (green). Type 1 proteins contain sequences from the Bacillus genus as well as
Oceanobacillus and Exiguobacterium, whereas type 2 proteins contain sequences present in
Staphylococcus and Macrococcus. Also, HxlR-pCER270 belongs to the type two form of HxlR
proteins. (boxed in red) The difference between these two groups is quite pronounced, as each
subclass contains members who are >70% identical to each other. The closest related sequences
between the two groups are hxlR from Bacillus atrophaeus and from Staphylococcus carnosus
which show 48% identity.
Interestingly, the most similar protein sequences in the databases to HxlR-pCER270 are that of
the other Type 2 HxlR proteins; for example HxlR-pCER270 is >60% identical to all members of
this group. The most similar type 1 HxlR protein to HxlR-pCER270 is that from Oceanobacillus
iheyensis which share 45% identity. No other orthologs of HxlR-pCER270 which are part of a
GSH-FDP operon were found. For clarity and simplicity, HxlR and HxlR-pCER70 will now be
referred to as HxlR1 and HxlR2 respectively.
Figure 3-2 - Phylogenetic tree of HxlR proteins created by Neighbour Joining with % identities
from the alignment in Figure 3-1. Type one HxlR proteins are coloured blue and type 2 HxlR
proteins are coloured green. HxlR-pCER270 is boxed in red.
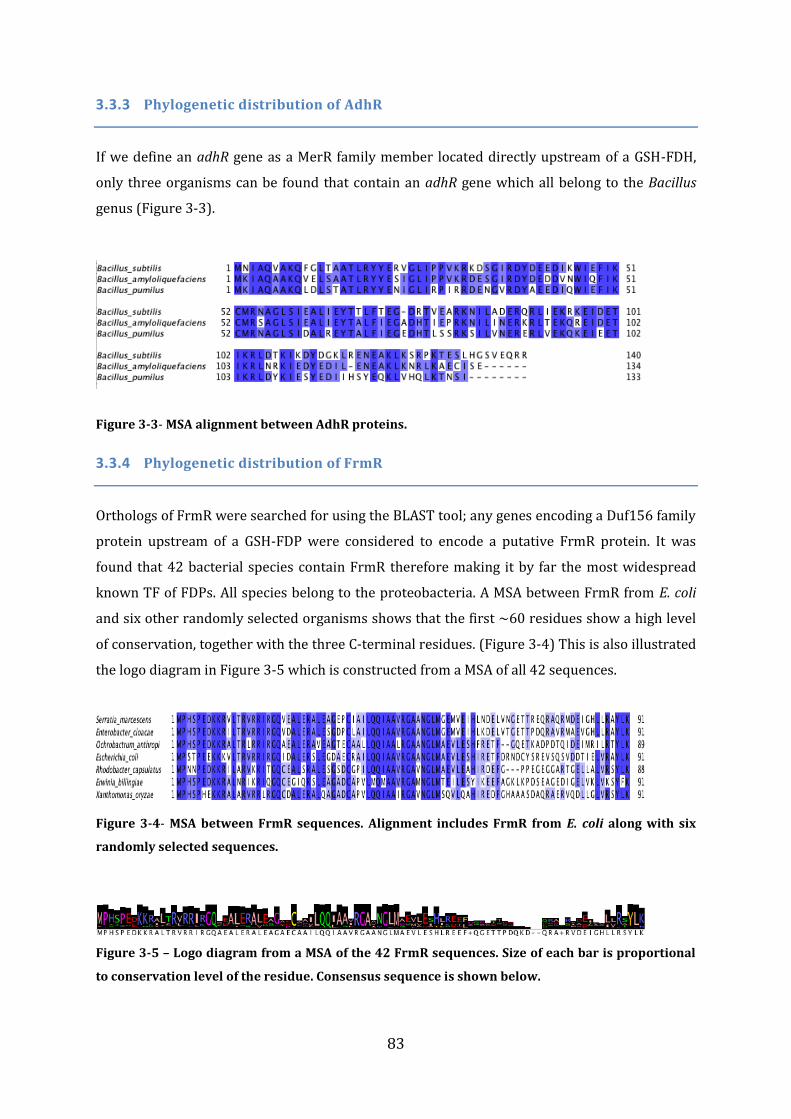
83
3.3.3 Phylogenetic distribution of AdhR
If we define an adhR gene as a MerR family member located directly upstream of a GSH-FDH,
only three organisms can be found that contain an adhR gene which all belong to the Bacillus
genus (Figure 3-3).
Figure 3-3- MSA alignment between AdhR proteins.
3.3.4 Phylogenetic distribution of FrmR
Orthologs of FrmR were searched for using the BLAST tool; any genes encoding a Duf156 family
protein upstream of a GSH-FDP were considered to encode a putative FrmR protein. It was
found that 42 bacterial species contain FrmR therefore making it by far the most widespread
known TF of FDPs. All species belong to the proteobacteria. A MSA between FrmR from E. coli
and six other randomly selected organisms shows that the first ~60 residues show a high level
of conservation, together with the three C-terminal residues. (Figure 3-4) This is also illustrated
the logo diagram in Figure 3-5 which is constructed from a MSA of all 42 sequences.
Figure 3-4- MSA between FrmR sequences. Alignment includes FrmR from E. coli along with six
randomly selected sequences.
Figure 3-5 – Logo diagram from a MSA of the 42 FrmR sequences. Size of each bar is proportional
to conservation level of the residue. Consensus sequence is shown below.
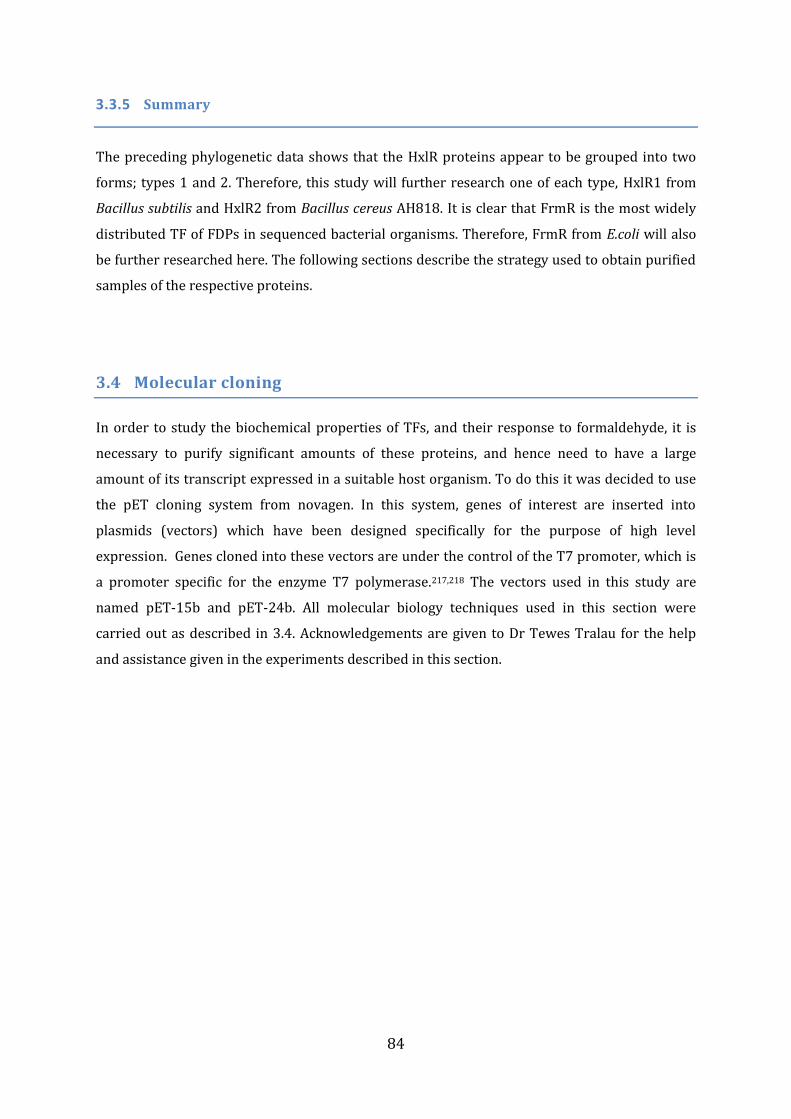
84
3.3.5 Summary
The preceding phylogenetic data shows that the HxlR proteins appear to be grouped into two
forms; types 1 and 2. Therefore, this study will further research one of each type, HxlR1 from
Bacillus subtilis and HxlR2 from Bacillus cereus AH818. It is clear that FrmR is the most widely
distributed TF of FDPs in sequenced bacterial organisms. Therefore, FrmR from E.coli will also
be further researched here. The following sections describe the strategy used to obtain purified
samples of the respective proteins.
3.4 Molecular cloning
In order to study the biochemical properties of TFs, and their response to formaldehyde, it is
necessary to purify significant amounts of these proteins, and hence need to have a large
amount of its transcript expressed in a suitable host organism. To do this it was decided to use
the pET cloning system from novagen. In this system, genes of interest are inserted into
plasmids (vectors) which have been designed specifically for the purpose of high level
expression. Genes cloned into these vectors are under the control of the T7 promoter, which is
a promoter specific for the enzyme T7 polymerase.217,218 The vectors used in this study are
named pET-15b and pET-24b. All molecular biology techniques used in this section were
carried out as described in 3.4. Acknowledgements are given to Dr Tewes Tralau for the help
and assistance given in the experiments described in this section.
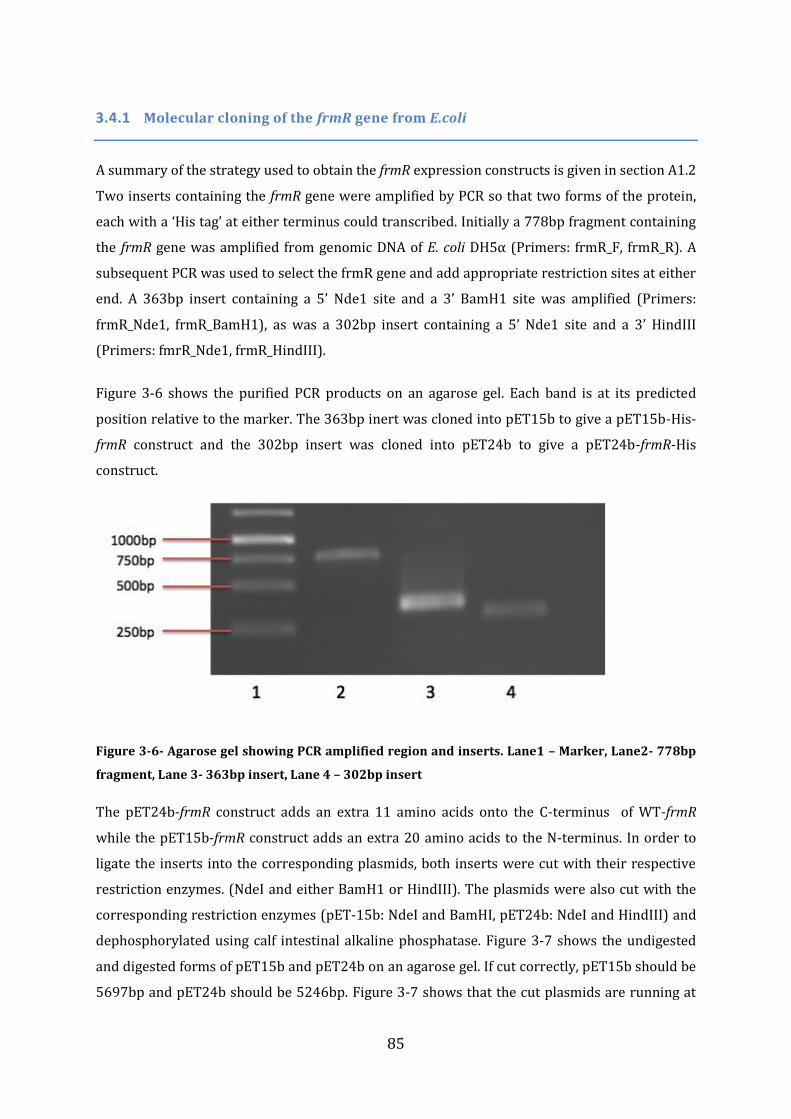
85
3.4.1 Molecular cloning of the frmR gene from E.coli
A summary of the strategy used to obtain the frmR expression constructs is given in section A1.2
Two inserts containing the frmR gene were amplified by PCR so that two forms of the protein,
each with a ‘His tag’ at either terminus could transcribed. Initially a 778bp fragment containing
the frmR gene was amplified from genomic DNA of E. coli DH5α (Primers: frmR_F, frmR_R). A
subsequent PCR was used to select the frmR gene and add appropriate restriction sites at either
end. A 363bp insert containing a 5’ Nde1 site and a 3’ BamH1 site was amplified (Primers:
frmR_Nde1, frmR_BamH1), as was a 302bp insert containing a 5’ Nde1 site and a 3’ HindIII
(Primers: fmrR_Nde1, frmR_HindIII).
Figure 3-6 shows the purified PCR products on an agarose gel. Each band is at its predicted
position relative to the marker. The 363bp inert was cloned into pET15b to give a pET15b-His-
frmR construct and the 302bp insert was cloned into pET24b to give a pET24b-frmR-His
construct.
Figure 3-6- Agarose gel showing PCR amplified region and inserts. Lane1 – Marker, Lane2- 778bp
fragment, Lane 3- 363bp insert, Lane 4 – 302bp insert
The pET24b-frmR construct adds an extra 11 amino acids onto the C-terminus of WT-frmR
while the pET15b-frmR construct adds an extra 20 amino acids to the N-terminus. In order to
ligate the inserts into the corresponding plasmids, both inserts were cut with their respective
restriction enzymes. (NdeI and either BamH1 or HindIII). The plasmids were also cut with the
corresponding restriction enzymes (pET-15b: NdeI and BamHI, pET24b: NdeI and HindIII) and
dephosphorylated using calf intestinal alkaline phosphatase. Figure 3-7 shows the undigested
and digested forms of pET15b and pET24b on an agarose gel. If cut correctly, pET15b should be
5697bp and pET24b should be 5246bp. Figure 3-7 shows that the cut plasmids are running at
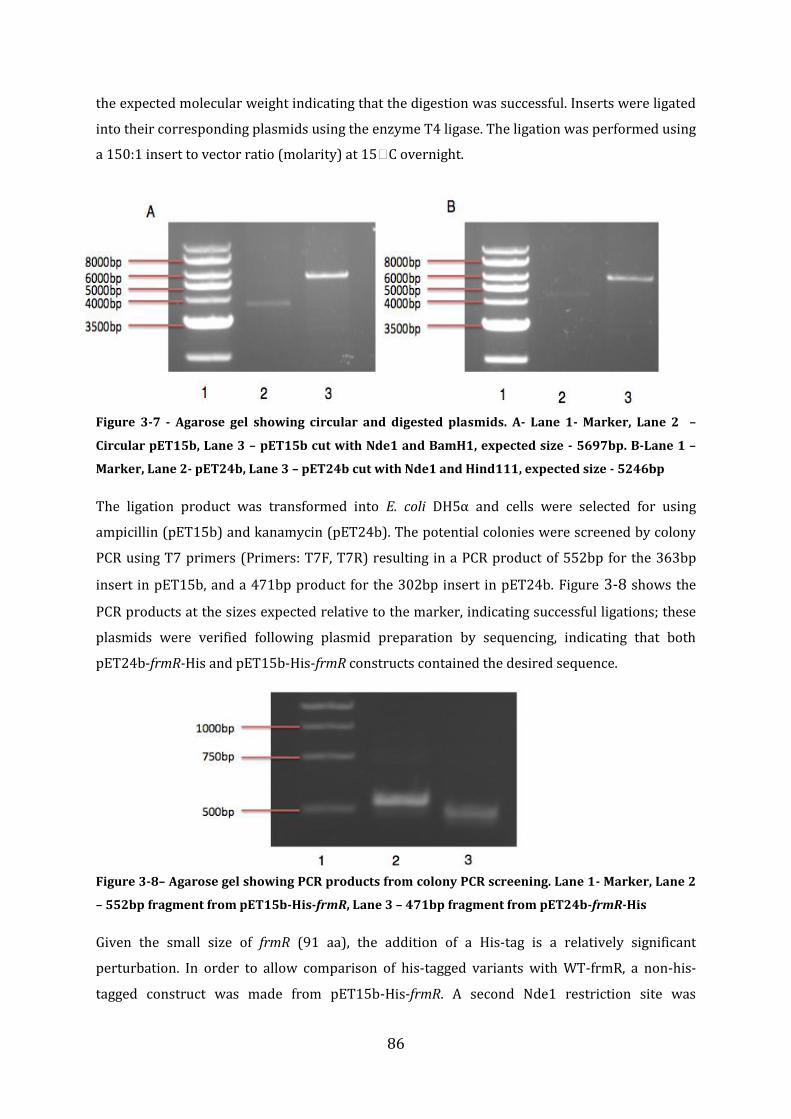
86
the expected molecular weight indicating that the digestion was successful. Inserts were ligated
into their corresponding plasmids using the enzyme T4 ligase. The ligation was performed using
a 150:1 insert to vector ratio (molarity) at 15ᵒC overnight.
Figure 3-7 - Agarose gel showing circular and digested plasmids. A- Lane 1- Marker, Lane 2 –
Circular pET15b, Lane 3 – pET15b cut with Nde1 and BamH1, expected size - 5697bp. B-Lane 1 –
Marker, Lane 2- pET24b, Lane 3 – pET24b cut with Nde1 and Hind111, expected size - 5246bp
The ligation product was transformed into E. coli DH5α and cells were selected for using
ampicillin (pET15b) and kanamycin (pET24b). The potential colonies were screened by colony
PCR using T7 primers (Primers: T7F, T7R) resulting in a PCR product of 552bp for the 363bp
insert in pET15b, and a 471bp product for the 302bp insert in pET24b. Figure 3-8 shows the
PCR products at the sizes expected relative to the marker, indicating successful ligations; these
plasmids were verified following plasmid preparation by sequencing, indicating that both
pET24b-frmR-His and pET15b-His-frmR constructs contained the desired sequence.
Figure 3-8– Agarose gel showing PCR products from colony PCR screening. Lane 1- Marker, Lane 2
– 552bp fragment from pET15b-His-frmR, Lane 3 – 471bp fragment from pET24b-frmR-His
Given the small size of frmR (91 aa), the addition of a His-tag is a relatively significant
perturbation. In order to allow comparison of his-tagged variants with WT-frmR, a non-his-
tagged construct was made from pET15b-His-frmR. A second Nde1 restriction site was
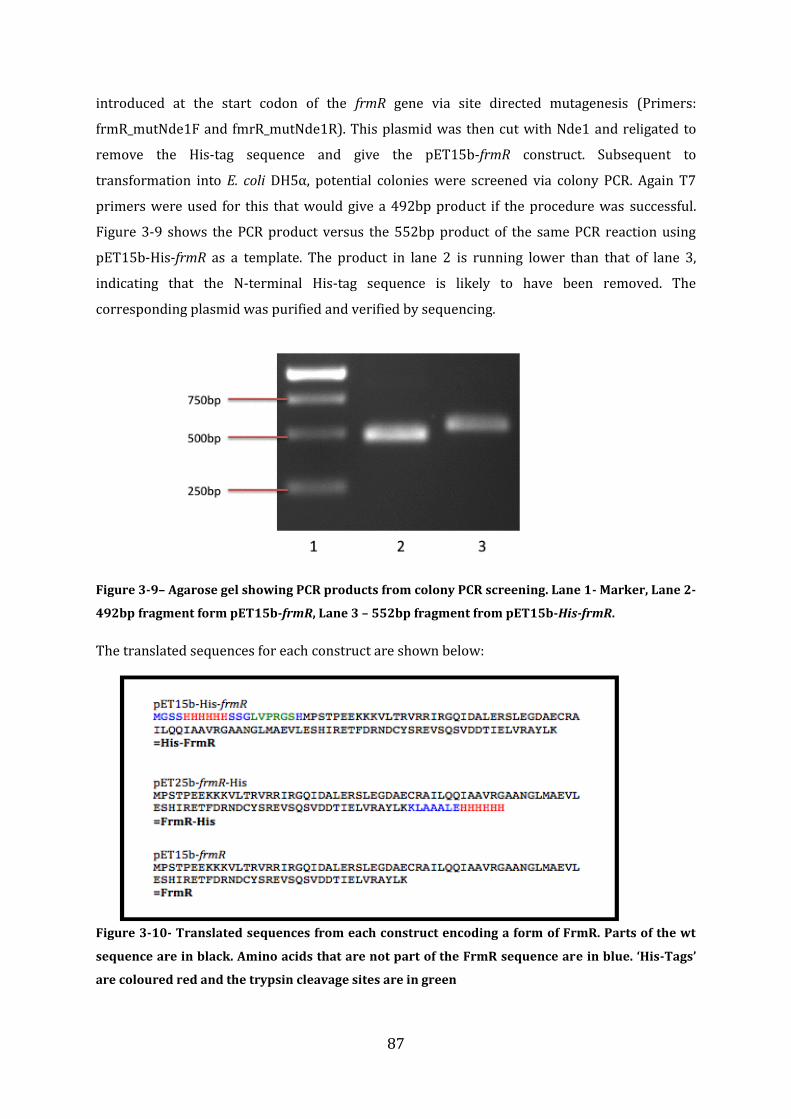
87
introduced at the start codon of the frmR gene via site directed mutagenesis (Primers:
frmR_mutNde1F and fmrR_mutNde1R). This plasmid was then cut with Nde1 and religated to
remove the His-tag sequence and give the pET15b-frmR construct. Subsequent to
transformation into E. coli DH5α, potential colonies were screened via colony PCR. Again T7
primers were used for this that would give a 492bp product if the procedure was successful.
Figure 3-9 shows the PCR product versus the 552bp product of the same PCR reaction using
pET15b-His-frmR as a template. The product in lane 2 is running lower than that of lane 3,
indicating that the N-terminal His-tag sequence is likely to have been removed. The
corresponding plasmid was purified and verified by sequencing.
Figure 3-9– Agarose gel showing PCR products from colony PCR screening. Lane 1- Marker, Lane 2-
492bp fragment form pET15b-frmR, Lane 3 – 552bp fragment from pET15b-His-frmR.
The translated sequences for each construct are shown below:
Figure 3-10- Translated sequences from each construct encoding a form of FrmR. Parts of the wt
sequence are in black. Amino acids that are not part of the FrmR sequence are in blue. ‘His-Tags’
are coloured red and the trypsin cleavage sites are in green
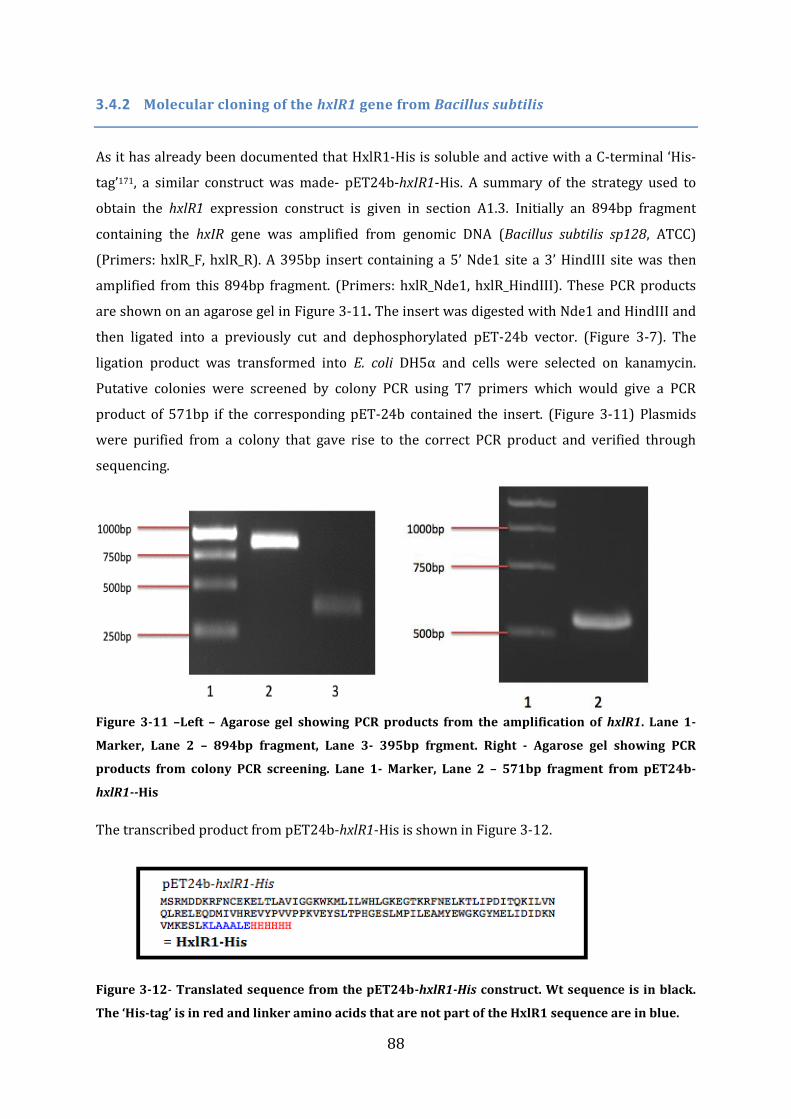
88
3.4.2 Molecular cloning of the hxlR1 gene from Bacillus subtilis
As it has already been documented that HxlR1-His is soluble and active with a C-terminal ‘His-
tag’171, a similar construct was made- pET24b-hxIR1-His. A summary of the strategy used to
obtain the hxlR1 expression construct is given in section A1.3. Initially an 894bp fragment
containing the hxIR gene was amplified from genomic DNA (Bacillus subtilis sp128, ATCC)
(Primers: hxlR_F, hxlR_R). A 395bp insert containing a 5’ Nde1 site a 3’ HindIII site was then
amplified from this 894bp fragment. (Primers: hxlR_Nde1, hxlR_HindIII). These PCR products
are shown on an agarose gel in Figure 3-11. The insert was digested with Nde1 and HindIII and
then ligated into a previously cut and dephosphorylated pET-24b vector. (Figure 3-7). The
ligation product was transformed into E. coli DH5α and cells were selected on kanamycin.
Putative colonies were screened by colony PCR using T7 primers which would give a PCR
product of 571bp if the corresponding pET-24b contained the insert. (Figure 3-11) Plasmids
were purified from a colony that gave rise to the correct PCR product and verified through
sequencing.
Figure 3-11 –Left – Agarose gel showing PCR products from the amplification of hxlR1. Lane 1-
Marker, Lane 2 – 894bp fragment, Lane 3- 395bp frgment. Right - Agarose gel showing PCR
products from colony PCR screening. Lane 1- Marker, Lane 2 – 571bp fragment from pET24b-
hxlR1--His
The transcribed product from pET24b-hxlR1-His is shown in Figure 3-12.
Figure 3-12- Translated sequence from the pET24b-hxlR1-His construct. Wt sequence is in black.
The ‘His-tag’ is in red and linker amino acids that are not part of the HxlR1 sequence are in blue.
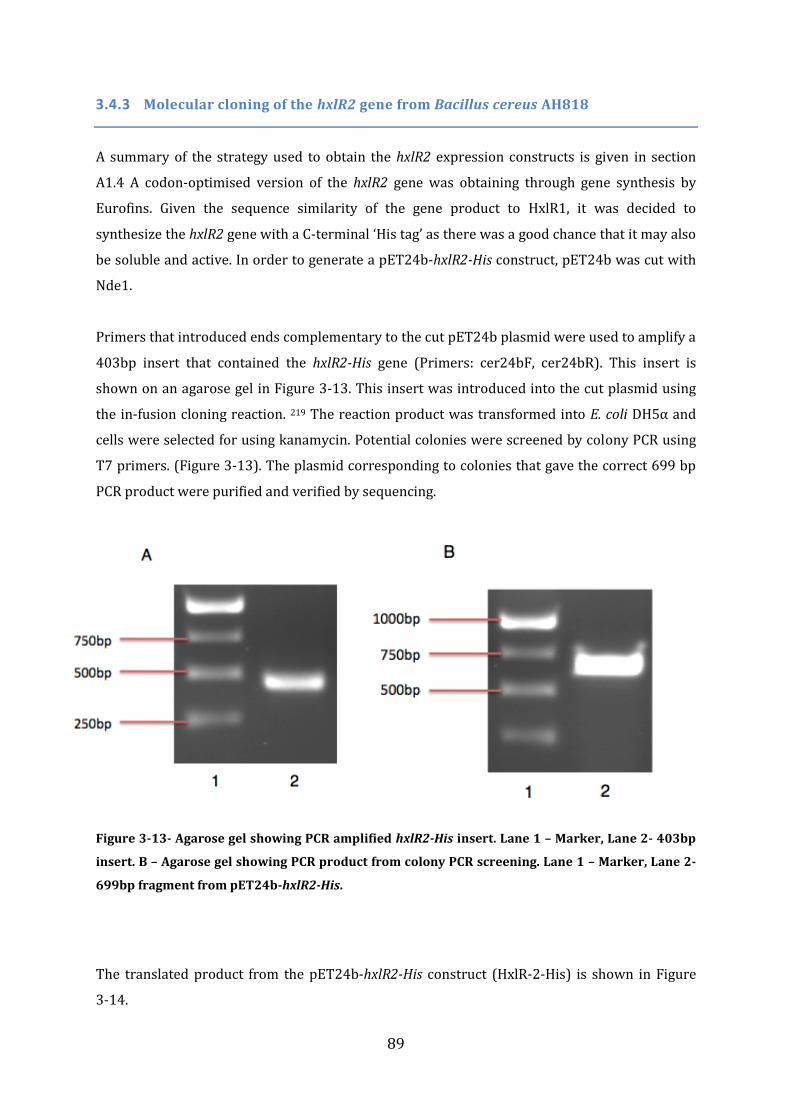
89
3.4.3 Molecular cloning of the hxlR2 gene from Bacillus cereus AH818
A summary of the strategy used to obtain the hxlR2 expression constructs is given in section
A1.4 A codon-optimised version of the hxlR2 gene was obtaining through gene synthesis by
Eurofins. Given the sequence similarity of the gene product to HxlR1, it was decided to
synthesize the hxlR2 gene with a C-terminal ‘His tag’ as there was a good chance that it may also
be soluble and active. In order to generate a pET24b-hxlR2-His construct, pET24b was cut with
Nde1.
Primers that introduced ends complementary to the cut pET24b plasmid were used to amplify a
403bp insert that contained the hxlR2-His gene (Primers: cer24bF, cer24bR). This insert is
shown on an agarose gel in Figure 3-13. This insert was introduced into the cut plasmid using
the in-fusion cloning reaction. 219 The reaction product was transformed into E. coli DH5α and
cells were selected for using kanamycin. Potential colonies were screened by colony PCR using
T7 primers. (Figure 3-13). The plasmid corresponding to colonies that gave the correct 699 bp
PCR product were purified and verified by sequencing.
Figure 3-13- Agarose gel showing PCR amplified hxlR2-His insert. Lane 1 – Marker, Lane 2- 403bp
insert. B – Agarose gel showing PCR product from colony PCR screening. Lane 1 – Marker, Lane 2-
699bp fragment from pET24b-hxlR2-His.
The translated product from the pET24b-hxlR2-His construct (HxlR-2-His) is shown in Figure
3-14.
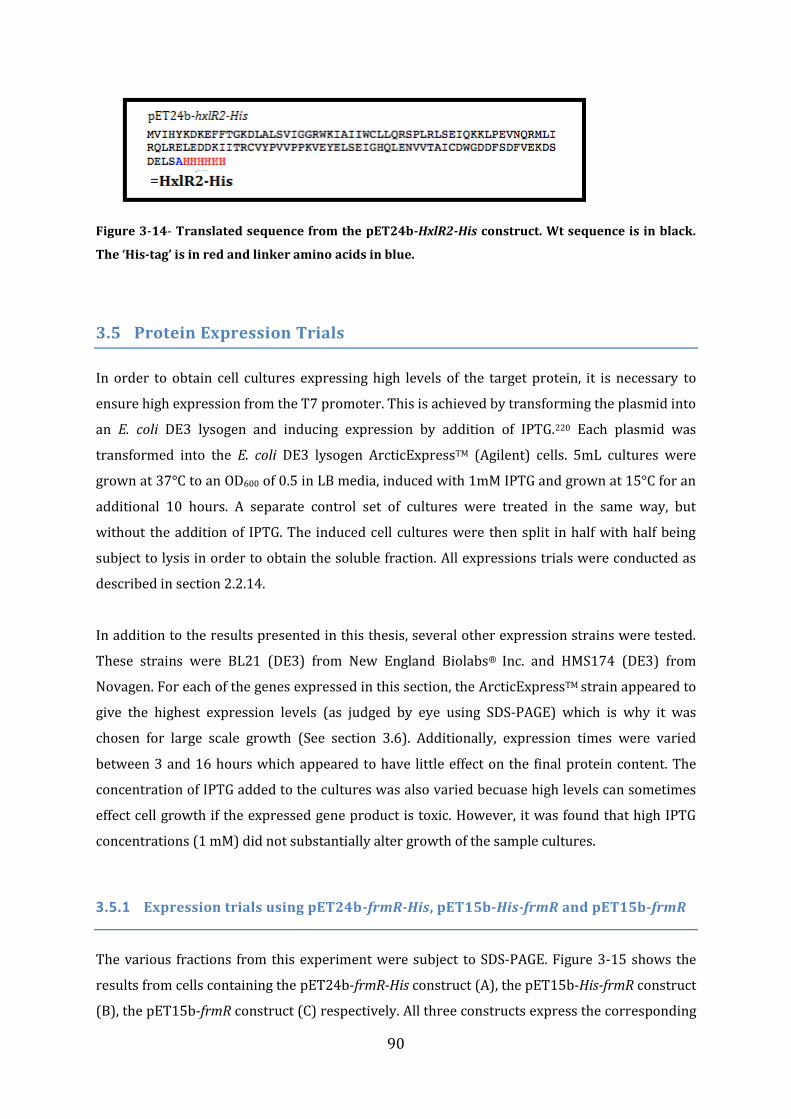
90
Figure 3-14- Translated sequence from the pET24b-HxlR2-His construct. Wt sequence is in black.
The ‘His-tag’ is in red and linker amino acids in blue.
3.5 Protein Expression Trials
In order to obtain cell cultures expressing high levels of the target protein, it is necessary to
ensure high expression from the T7 promoter. This is achieved by transforming the plasmid into
an E. coli DE3 lysogen and inducing expression by addition of IPTG.220 Each plasmid was
transformed into the E. coli DE3 lysogen ArcticExpressTM (Agilent) cells. 5mL cultures were
grown at 37°C to an OD600 of 0.5 in LB media, induced with 1mM IPTG and grown at 15°C for an
additional 10 hours. A separate control set of cultures were treated in the same way, but
without the addition of IPTG. The induced cell cultures were then split in half with half being
subject to lysis in order to obtain the soluble fraction. All expressions trials were conducted as
described in section 2.2.14.
In addition to the results presented in this thesis, several other expression strains were tested.
These strains were BL21 (DE3) from New England Biolabs® Inc. and HMS174 (DE3) from
Novagen. For each of the genes expressed in this section, the ArcticExpressTM strain appeared to
give the highest expression levels (as judged by eye using SDS-PAGE) which is why it was
chosen for large scale growth (See section 3.6). Additionally, expression times were varied
between 3 and 16 hours which appeared to have little effect on the final protein content. The
concentration of IPTG added to the cultures was also varied becuase high levels can sometimes
effect cell growth if the expressed gene product is toxic. However, it was found that high IPTG
concentrations (1 mM) did not substantially alter growth of the sample cultures.
3.5.1 Expression trials using pET24b-frmR-His, pET15b-His-frmR and pET15b-frmR
The various fractions from this experiment were subject to SDS-PAGE. Figure 3-15 shows the
results from cells containing the pET24b-frmR-His construct (A), the pET15b-His-frmR construct
(B), the pET15b-frmR construct (C) respectively. All three constructs express the corresponding
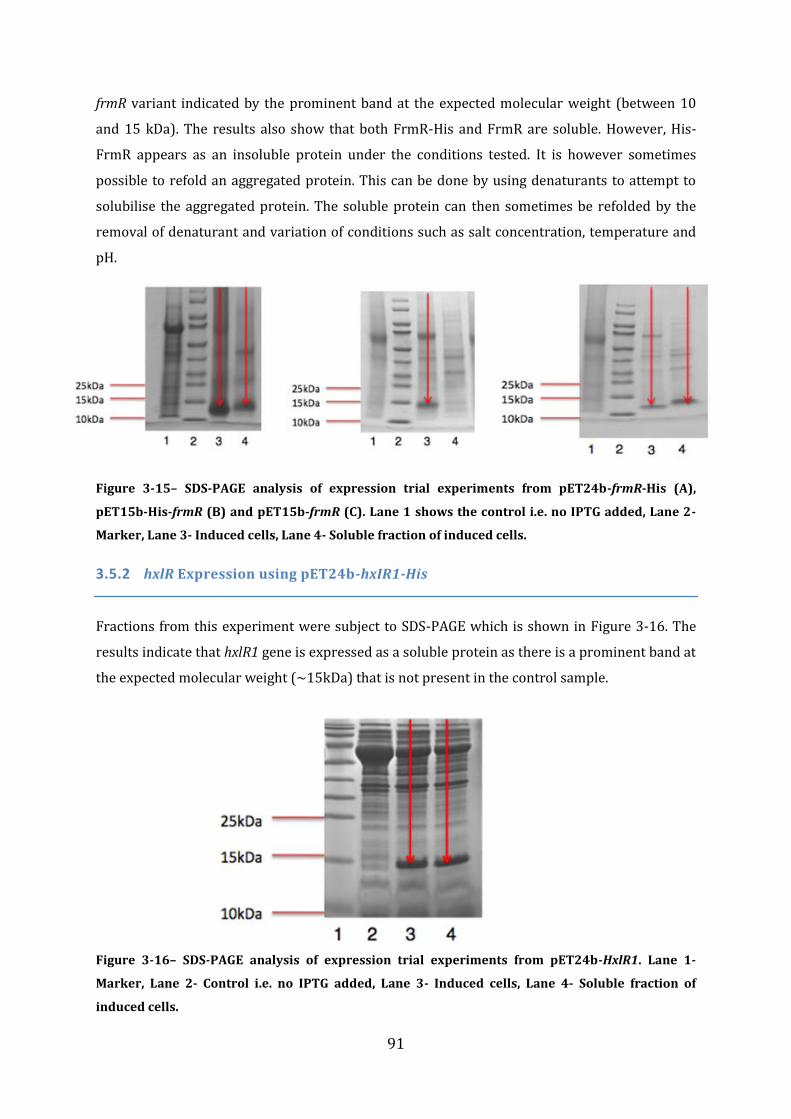
91
frmR variant indicated by the prominent band at the expected molecular weight (between 10
and 15 kDa). The results also show that both FrmR-His and FrmR are soluble. However, His-
FrmR appears as an insoluble protein under the conditions tested. It is however sometimes
possible to refold an aggregated protein. This can be done by using denaturants to attempt to
solubilise the aggregated protein. The soluble protein can then sometimes be refolded by the
removal of denaturant and variation of conditions such as salt concentration, temperature and
pH.
Figure 3-15– SDS-PAGE analysis of expression trial experiments from pET24b-frmR-His (A),
pET15b-His-frmR (B) and pET15b-frmR (C). Lane 1 shows the control i.e. no IPTG added, Lane 2-
Marker, Lane 3- Induced cells, Lane 4- Soluble fraction of induced cells.
3.5.2 hxlR Expression using pET24b-hxIR1-His
Fractions from this experiment were subject to SDS-PAGE which is shown in Figure 3-16. The
results indicate that hxlR1 gene is expressed as a soluble protein as there is a prominent band at
the expected molecular weight (~15kDa) that is not present in the control sample.
Figure 3-16– SDS-PAGE analysis of expression trial experiments from pET24b-HxlR1. Lane 1-
Marker, Lane 2- Control i.e. no IPTG added, Lane 3- Induced cells, Lane 4- Soluble fraction of
induced cells.
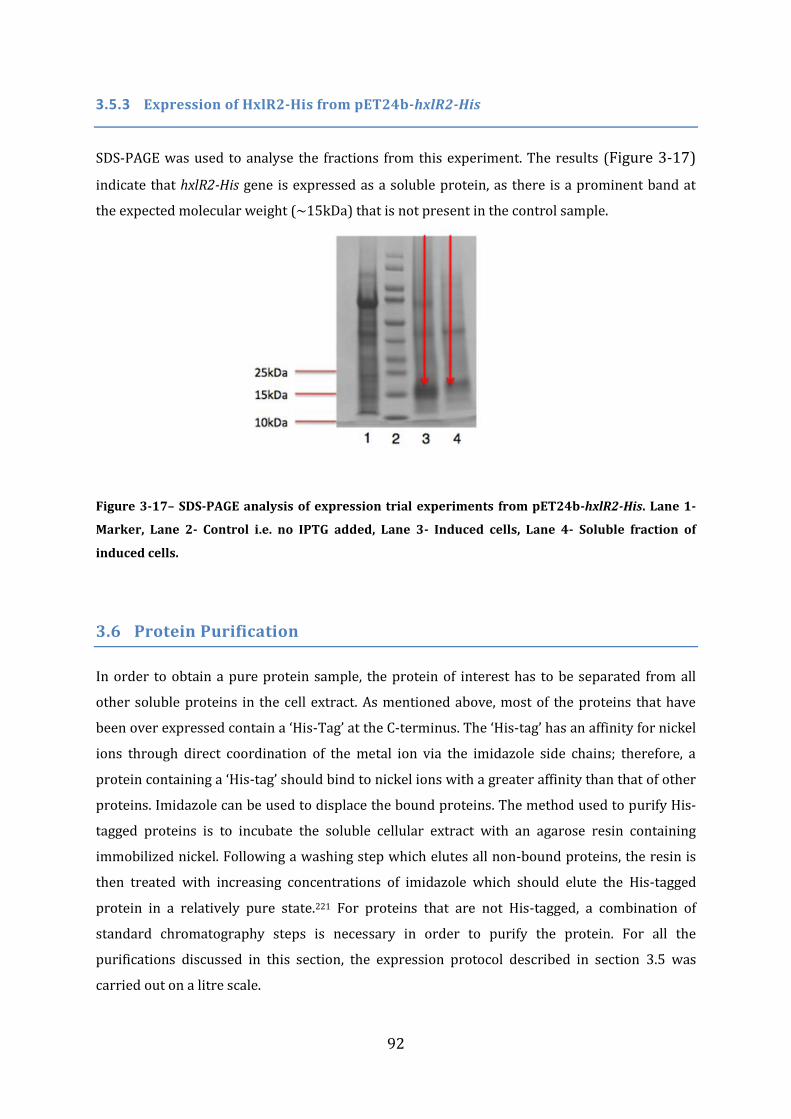
92
3.5.3 Expression of HxlR2-His from pET24b-hxlR2-His
SDS-PAGE was used to analyse the fractions from this experiment. The results (Figure 3-17)
indicate that hxlR2-His gene is expressed as a soluble protein, as there is a prominent band at
the expected molecular weight (~15kDa) that is not present in the control sample.
Figure 3-17– SDS-PAGE analysis of expression trial experiments from pET24b-hxlR2-His. Lane 1-
Marker, Lane 2- Control i.e. no IPTG added, Lane 3- Induced cells, Lane 4- Soluble fraction of
induced cells.
3.6 Protein Purification
In order to obtain a pure protein sample, the protein of interest has to be separated from all
other soluble proteins in the cell extract. As mentioned above, most of the proteins that have
been over expressed contain a ‘His-Tag’ at the C-terminus. The ‘His-tag’ has an affinity for nickel
ions through direct coordination of the metal ion via the imidazole side chains; therefore, a
protein containing a ‘His-tag’ should bind to nickel ions with a greater affinity than that of other
proteins. Imidazole can be used to displace the bound proteins. The method used to purify His-
tagged proteins is to incubate the soluble cellular extract with an agarose resin containing
immobilized nickel. Following a washing step which elutes all non-bound proteins, the resin is
then treated with increasing concentrations of imidazole which should elute the His-tagged
protein in a relatively pure state.221 For proteins that are not His-tagged, a combination of
standard chromatography steps is necessary in order to purify the protein. For all the
purifications discussed in this section, the expression protocol described in section 3.5 was
carried out on a litre scale.
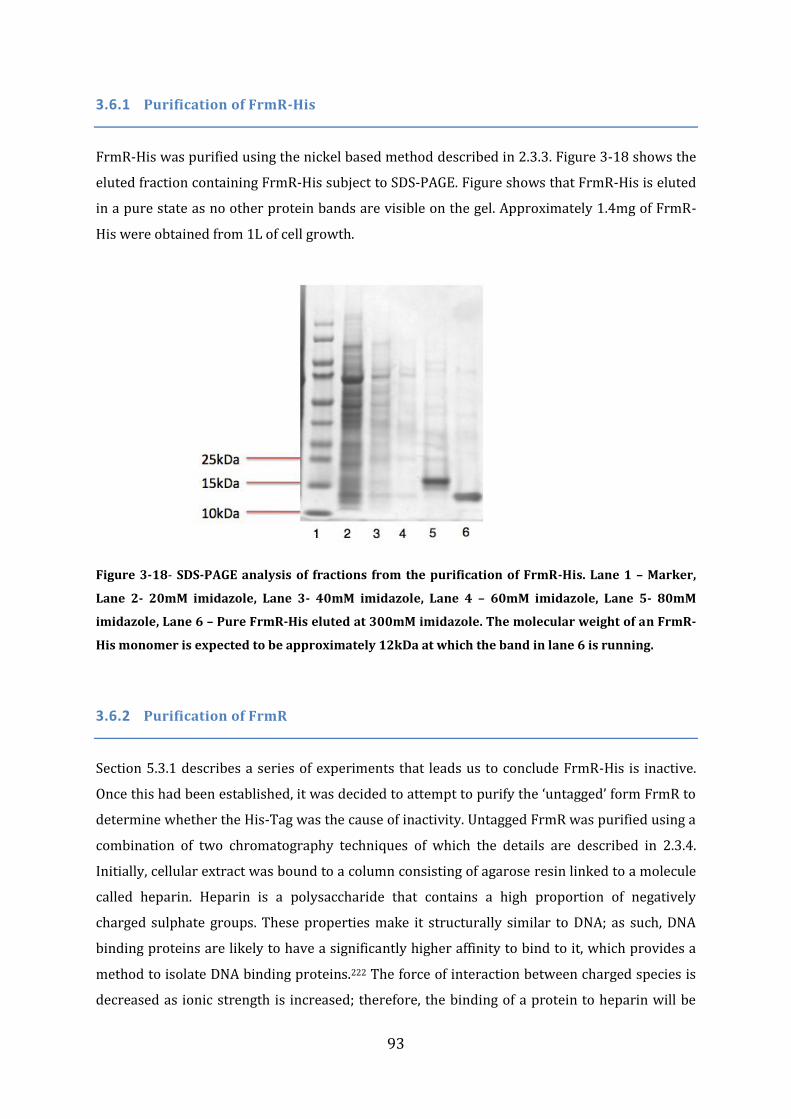
93
3.6.1 Purification of FrmR-His
FrmR-His was purified using the nickel based method described in 2.3.3. Figure 3-18 shows the
eluted fraction containing FrmR-His subject to SDS-PAGE. Figure shows that FrmR-His is eluted
in a pure state as no other protein bands are visible on the gel. Approximately 1.4mg of FrmR-
His were obtained from 1L of cell growth.
Figure 3-18- SDS-PAGE analysis of fractions from the purification of FrmR-His. Lane 1 – Marker,
Lane 2- 20mM imidazole, Lane 3- 40mM imidazole, Lane 4 – 60mM imidazole, Lane 5- 80mM
imidazole, Lane 6 – Pure FrmR-His eluted at 300mM imidazole. The molecular weight of an FrmR-
His monomer is expected to be approximately 12kDa at which the band in lane 6 is running.
3.6.2 Purification of FrmR
Section 5.3.1 describes a series of experiments that leads us to conclude FrmR-His is inactive.
Once this had been established, it was decided to attempt to purify the ‘untagged’ form FrmR to
determine whether the His-Tag was the cause of inactivity. Untagged FrmR was purified using a
combination of two chromatography techniques of which the details are described in 2.3.4.
Initially, cellular extract was bound to a column consisting of agarose resin linked to a molecule
called heparin. Heparin is a polysaccharide that contains a high proportion of negatively
charged sulphate groups. These properties make it structurally similar to DNA; as such, DNA
binding proteins are likely to have a significantly higher affinity to bind to it, which provides a
method to isolate DNA binding proteins.222 The force of interaction between charged species is
decreased as ionic strength is increased; therefore, the binding of a protein to heparin will be
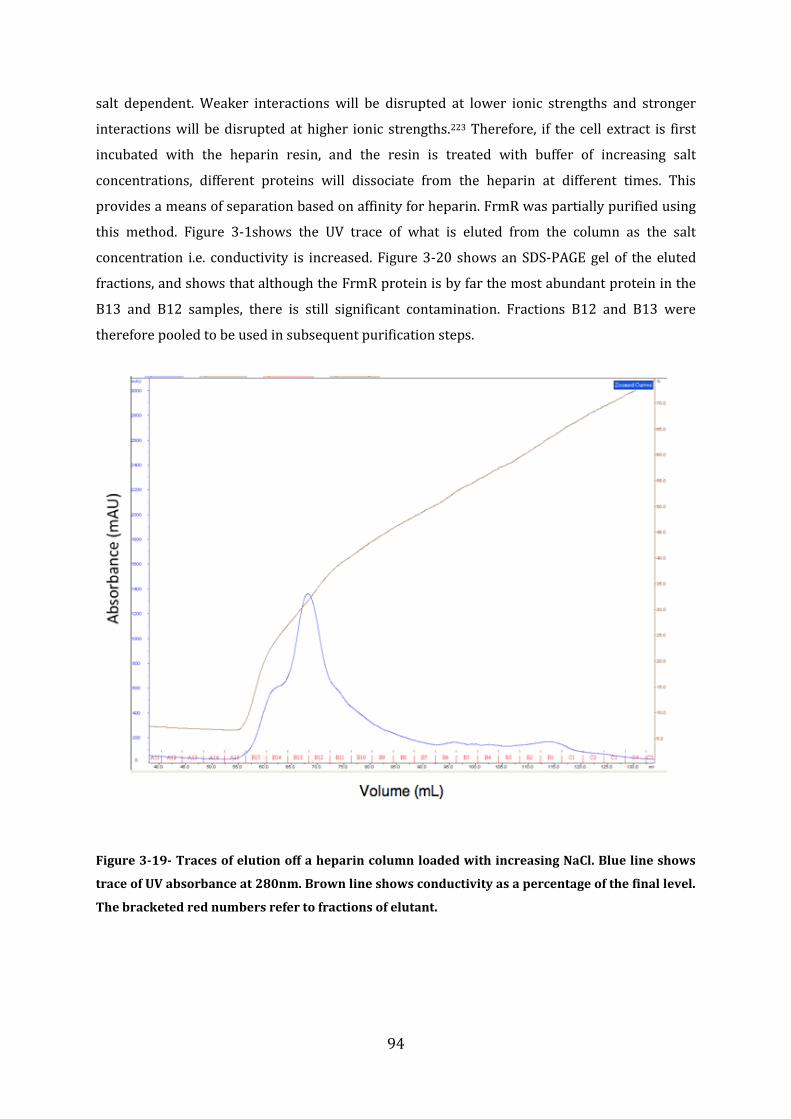
94
salt dependent. Weaker interactions will be disrupted at lower ionic strengths and stronger
interactions will be disrupted at higher ionic strengths.223 Therefore, if the cell extract is first
incubated with the heparin resin, and the resin is treated with buffer of increasing salt
concentrations, different proteins will dissociate from the heparin at different times. This
provides a means of separation based on affinity for heparin. FrmR was partially purified using
this method. Figure 3-1shows the UV trace of what is eluted from the column as the salt
concentration i.e. conductivity is increased. Figure 3-20 shows an SDS-PAGE gel of the eluted
fractions, and shows that although the FrmR protein is by far the most abundant protein in the
B13 and B12 samples, there is still significant contamination. Fractions B12 and B13 were
therefore pooled to be used in subsequent purification steps.
Figure 3-19- Traces of elution off a heparin column loaded with increasing NaCl. Blue line shows
trace of UV absorbance at 280nm. Brown line shows conductivity as a percentage of the final level.
The bracketed red numbers refer to fractions of elutant.
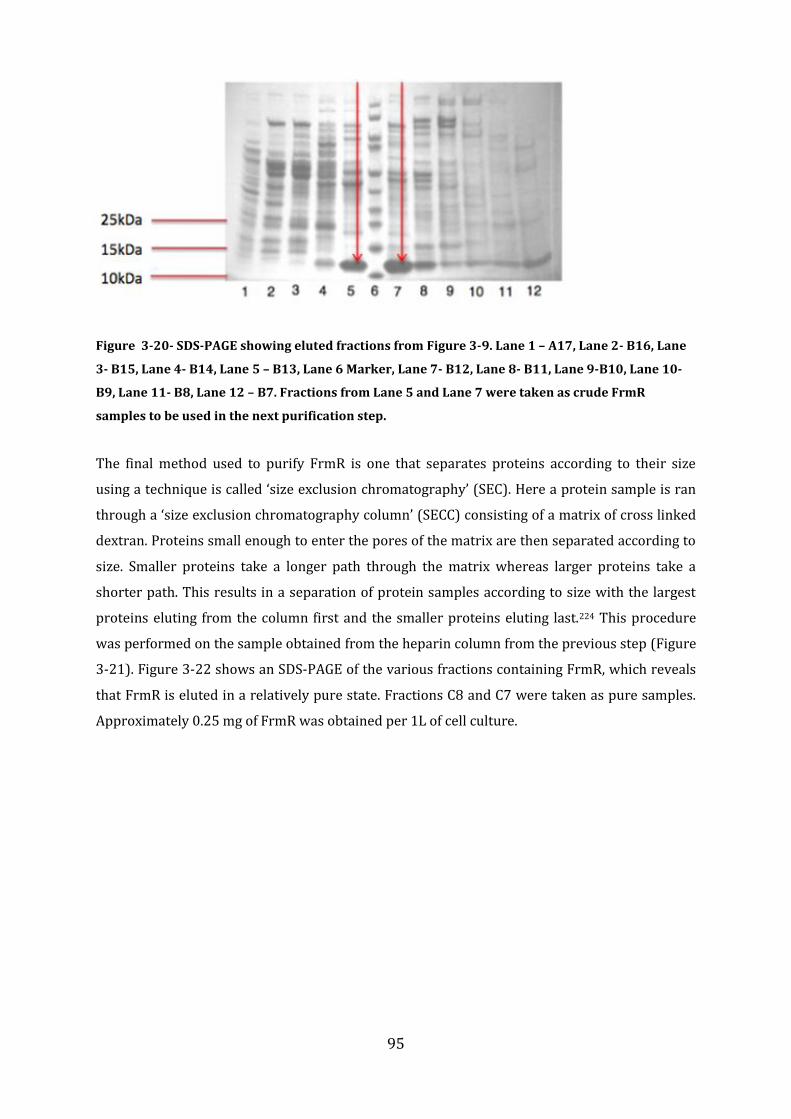
95
Figure 3-20- SDS-PAGE showing eluted fractions from Figure 3-9. Lane 1 – A17, Lane 2- B16, Lane
3- B15, Lane 4- B14, Lane 5 – B13, Lane 6 Marker, Lane 7- B12, Lane 8- B11, Lane 9-B10, Lane 10-
B9, Lane 11- B8, Lane 12 – B7. Fractions from Lane 5 and Lane 7 were taken as crude FrmR
samples to be used in the next purification step.
The final method used to purify FrmR is one that separates proteins according to their size
using a technique is called ‘size exclusion chromatography’ (SEC). Here a protein sample is ran
through a ‘size exclusion chromatography column’ (SECC) consisting of a matrix of cross linked
dextran. Proteins small enough to enter the pores of the matrix are then separated according to
size. Smaller proteins take a longer path through the matrix whereas larger proteins take a
shorter path. This results in a separation of protein samples according to size with the largest
proteins eluting from the column first and the smaller proteins eluting last.224 This procedure
was performed on the sample obtained from the heparin column from the previous step (Figure
3-21). Figure 3-22 shows an SDS-PAGE of the various fractions containing FrmR, which reveals
that FrmR is eluted in a relatively pure state. Fractions C8 and C7 were taken as pure samples.
Approximately 0.25 mg of FrmR was obtained per 1L of cell culture.
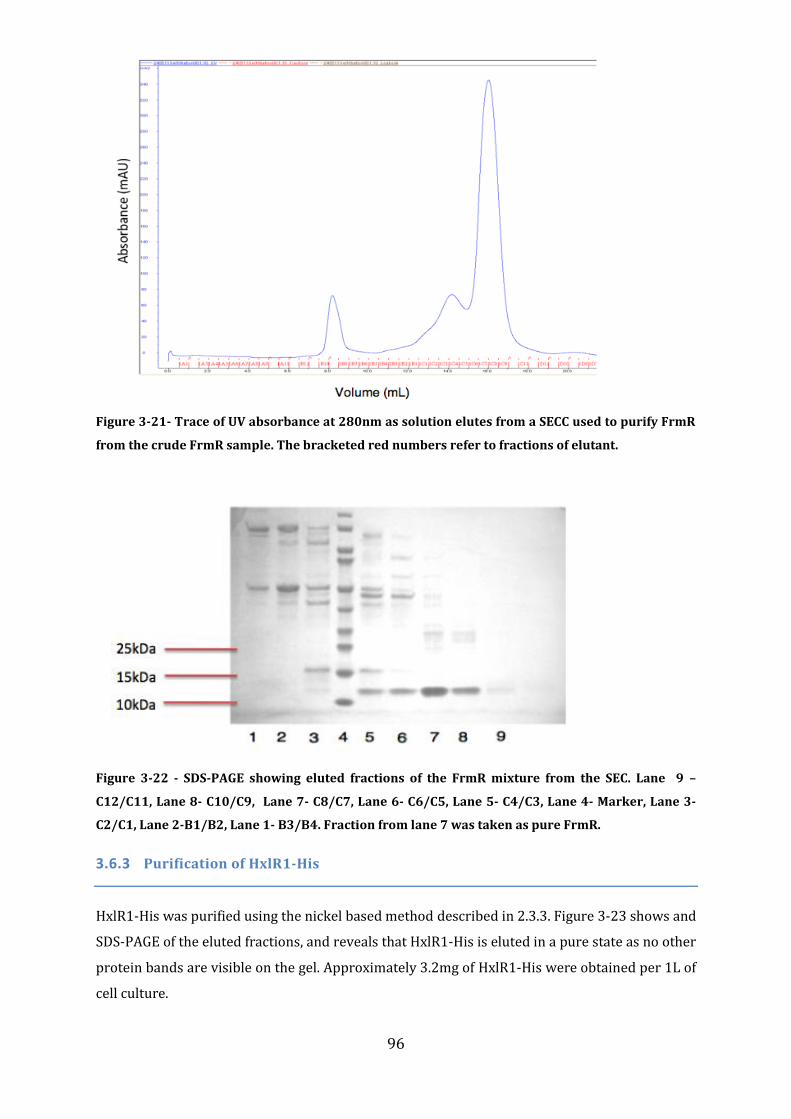
96
Figure 3-21- Trace of UV absorbance at 280nm as solution elutes from a SECC used to purify FrmR
from the crude FrmR sample. The bracketed red numbers refer to fractions of elutant.
Figure 3-22 - SDS-PAGE showing eluted fractions of the FrmR mixture from the SEC. Lane 9 –
C12/C11, Lane 8- C10/C9, Lane 7- C8/C7, Lane 6- C6/C5, Lane 5- C4/C3, Lane 4- Marker, Lane 3-
C2/C1, Lane 2-B1/B2, Lane 1- B3/B4. Fraction from lane 7 was taken as pure FrmR.
3.6.3 Purification of HxlR1-His
HxlR1-His was purified using the nickel based method described in 2.3.3. Figure 3-23 shows and
SDS-PAGE of the eluted fractions, and reveals that HxlR1-His is eluted in a pure state as no other
protein bands are visible on the gel. Approximately 3.2mg of HxlR1-His were obtained per 1L of
cell culture.
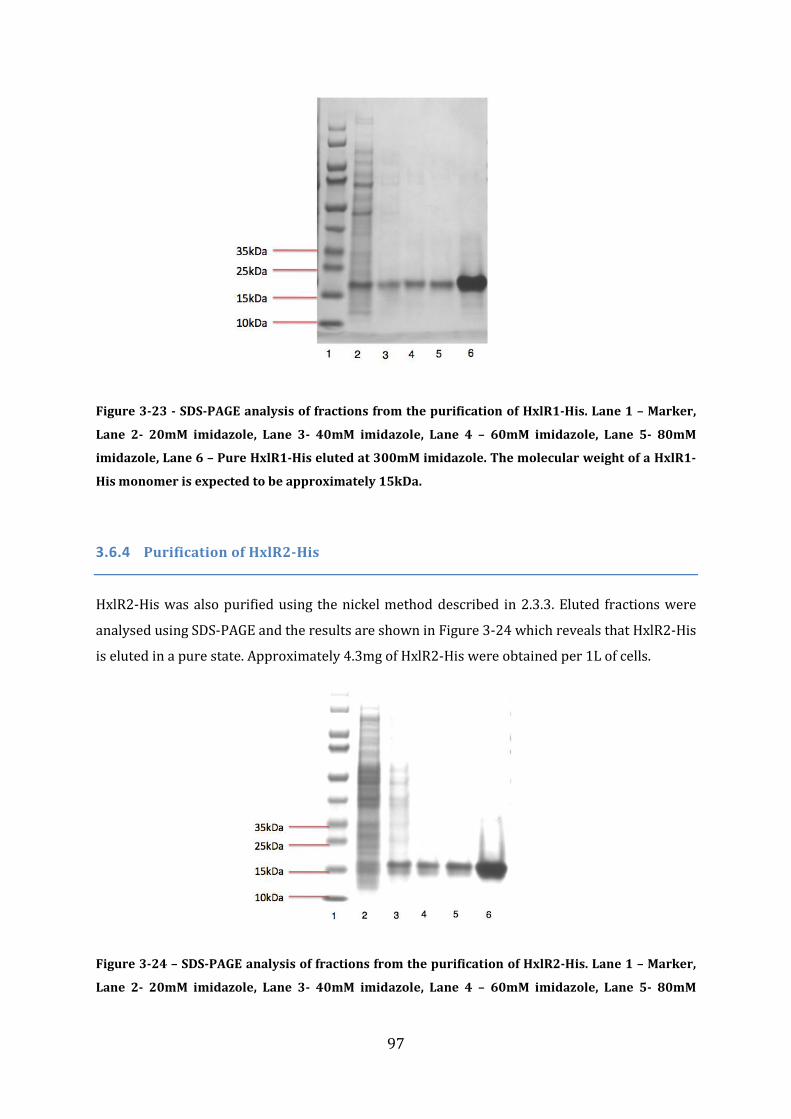
97
Figure 3-23 - SDS-PAGE analysis of fractions from the purification of HxlR1-His. Lane 1 – Marker,
Lane 2- 20mM imidazole, Lane 3- 40mM imidazole, Lane 4 – 60mM imidazole, Lane 5- 80mM
imidazole, Lane 6 – Pure HxlR1-His eluted at 300mM imidazole. The molecular weight of a HxlR1-
His monomer is expected to be approximately 15kDa.
3.6.4 Purification of HxlR2-His
HxlR2-His was also purified using the nickel method described in 2.3.3. Eluted fractions were
analysed using SDS-PAGE and the results are shown in Figure 3-24 which reveals that HxlR2-His
is eluted in a pure state. Approximately 4.3mg of HxlR2-His were obtained per 1L of cells.
Figure 3-24 – SDS-PAGE analysis of fractions from the purification of HxlR2-His. Lane 1 – Marker,
Lane 2- 20mM imidazole, Lane 3- 40mM imidazole, Lane 4 – 60mM imidazole, Lane 5- 80mM
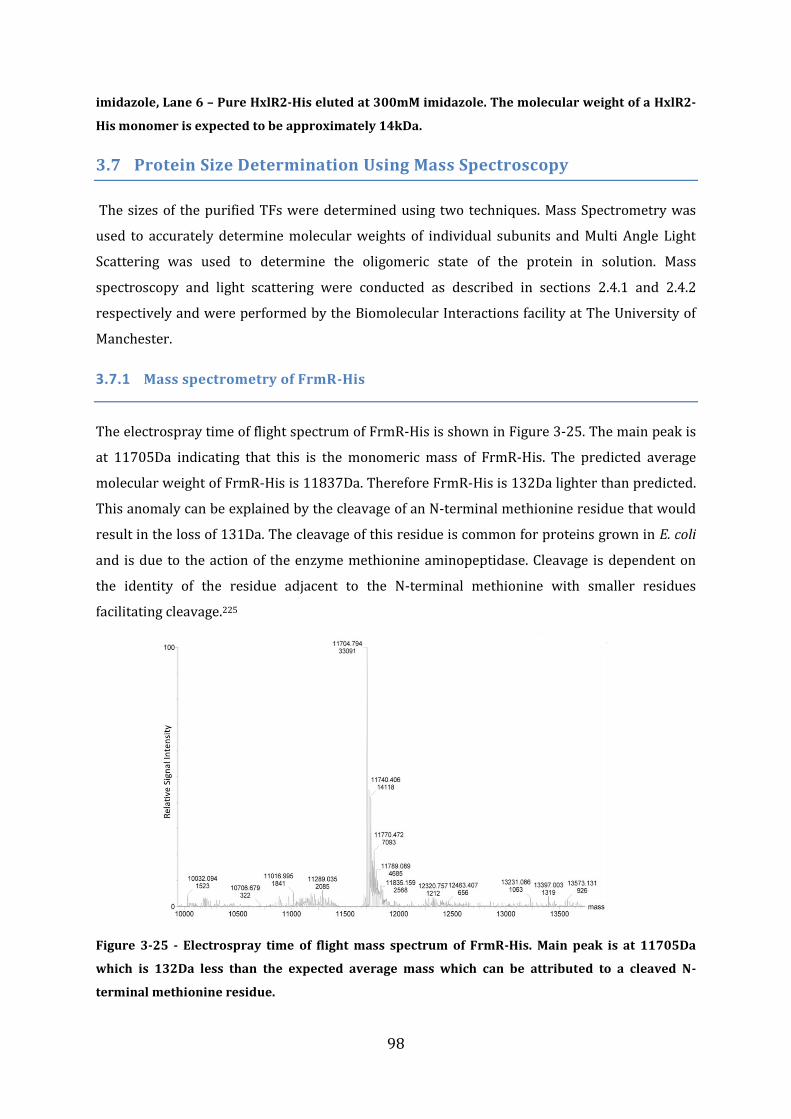
98
imidazole, Lane 6 – Pure HxlR2-His eluted at 300mM imidazole. The molecular weight of a HxlR2-
His monomer is expected to be approximately 14kDa.
3.7 Protein Size Determination Using Mass Spectroscopy
The sizes of the purified TFs were determined using two techniques. Mass Spectrometry was
used to accurately determine molecular weights of individual subunits and Multi Angle Light
Scattering was used to determine the oligomeric state of the protein in solution. Mass
spectroscopy and light scattering were conducted as described in sections 2.4.1 and 2.4.2
respectively and were performed by the Biomolecular Interactions facility at The University of
Manchester.
3.7.1 Mass spectrometry of FrmR-His
The electrospray time of flight spectrum of FrmR-His is shown in Figure 3-25. The main peak is
at 11705Da indicating that this is the monomeric mass of FrmR-His. The predicted average
molecular weight of FrmR-His is 11837Da. Therefore FrmR-His is 132Da lighter than predicted.
This anomaly can be explained by the cleavage of an N-terminal methionine residue that would
result in the loss of 131Da. The cleavage of this residue is common for proteins grown in E. coli
and is due to the action of the enzyme methionine aminopeptidase. Cleavage is dependent on
the identity of the residue adjacent to the N-terminal methionine with smaller residues
facilitating cleavage.225
Figure 3-25 - Electrospray time of flight mass spectrum of FrmR-His. Main peak is at 11705Da
which is 132Da less than the expected average mass which can be attributed to a cleaved N-
terminal methionine residue.
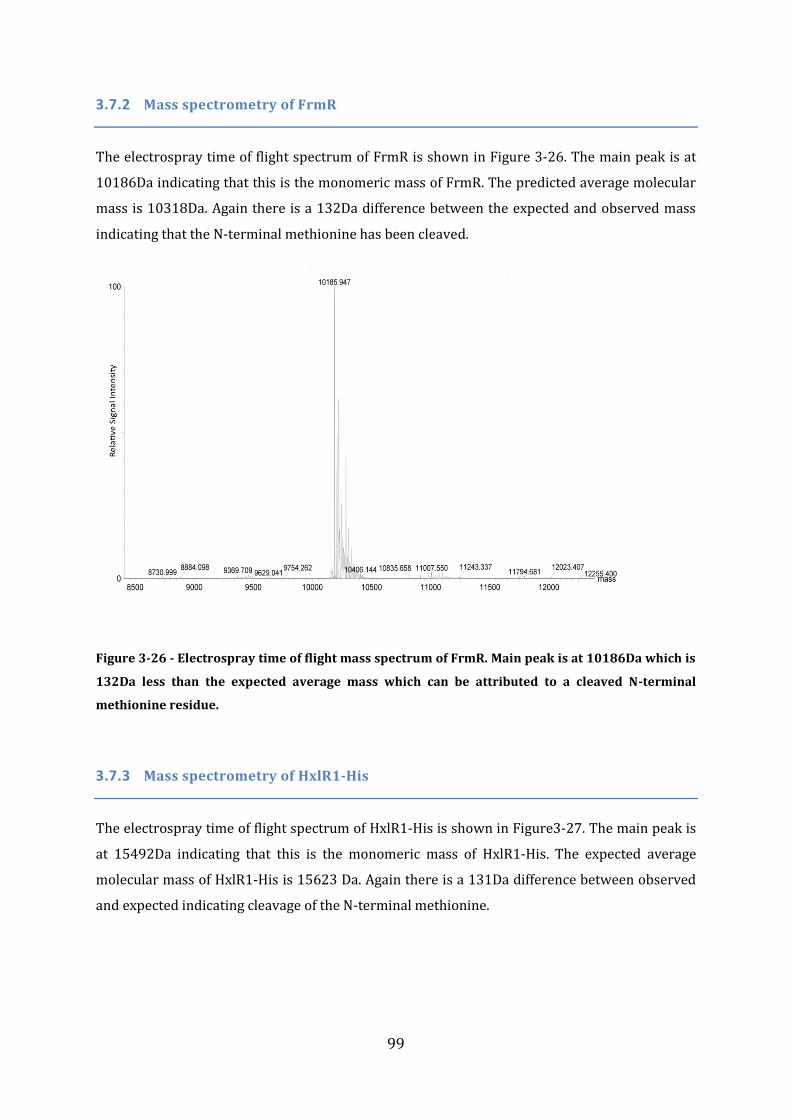
99
3.7.2 Mass spectrometry of FrmR
The electrospray time of flight spectrum of FrmR is shown in Figure 3-26. The main peak is at
10186Da indicating that this is the monomeric mass of FrmR. The predicted average molecular
mass is 10318Da. Again there is a 132Da difference between the expected and observed mass
indicating that the N-terminal methionine has been cleaved.
Figure 3-26 - Electrospray time of flight mass spectrum of FrmR. Main peak is at 10186Da which is
132Da less than the expected average mass which can be attributed to a cleaved N-terminal
methionine residue.
3.7.3 Mass spectrometry of HxlR1-His
The electrospray time of flight spectrum of HxlR1-His is shown in Figure3-27. The main peak is
at 15492Da indicating that this is the monomeric mass of HxlR1-His. The expected average
molecular mass of HxlR1-His is 15623 Da. Again there is a 131Da difference between observed
and expected indicating cleavage of the N-terminal methionine.
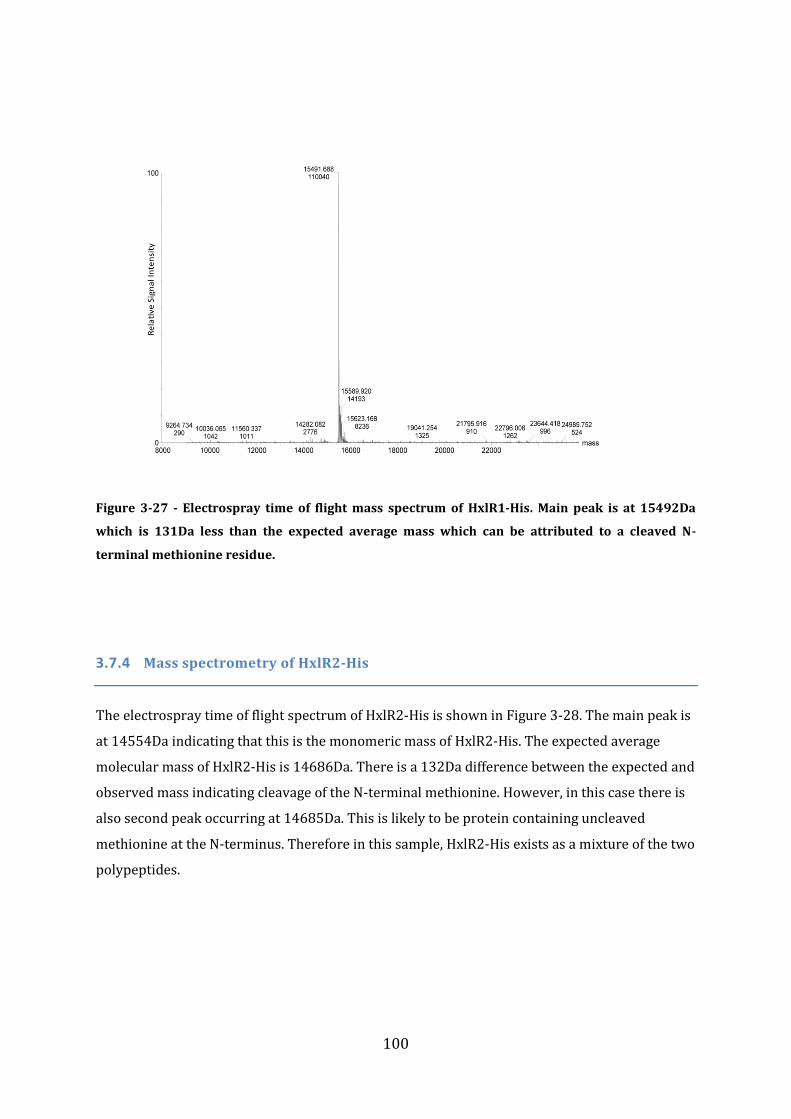
100
Figure 3-27 - Electrospray time of flight mass spectrum of HxlR1-His. Main peak is at 15492Da
which is 131Da less than the expected average mass which can be attributed to a cleaved N-
terminal methionine residue.
3.7.4 Mass spectrometry of HxlR2-His
The electrospray time of flight spectrum of HxlR2-His is shown in Figure 3-28. The main peak is
at 14554Da indicating that this is the monomeric mass of HxlR2-His. The expected average
molecular mass of HxlR2-His is 14686Da. There is a 132Da difference between the expected and
observed mass indicating cleavage of the N-terminal methionine. However, in this case there is
also second peak occurring at 14685Da. This is likely to be protein containing uncleaved
methionine at the N-terminus. Therefore in this sample, HxlR2-His exists as a mixture of the two
polypeptides.
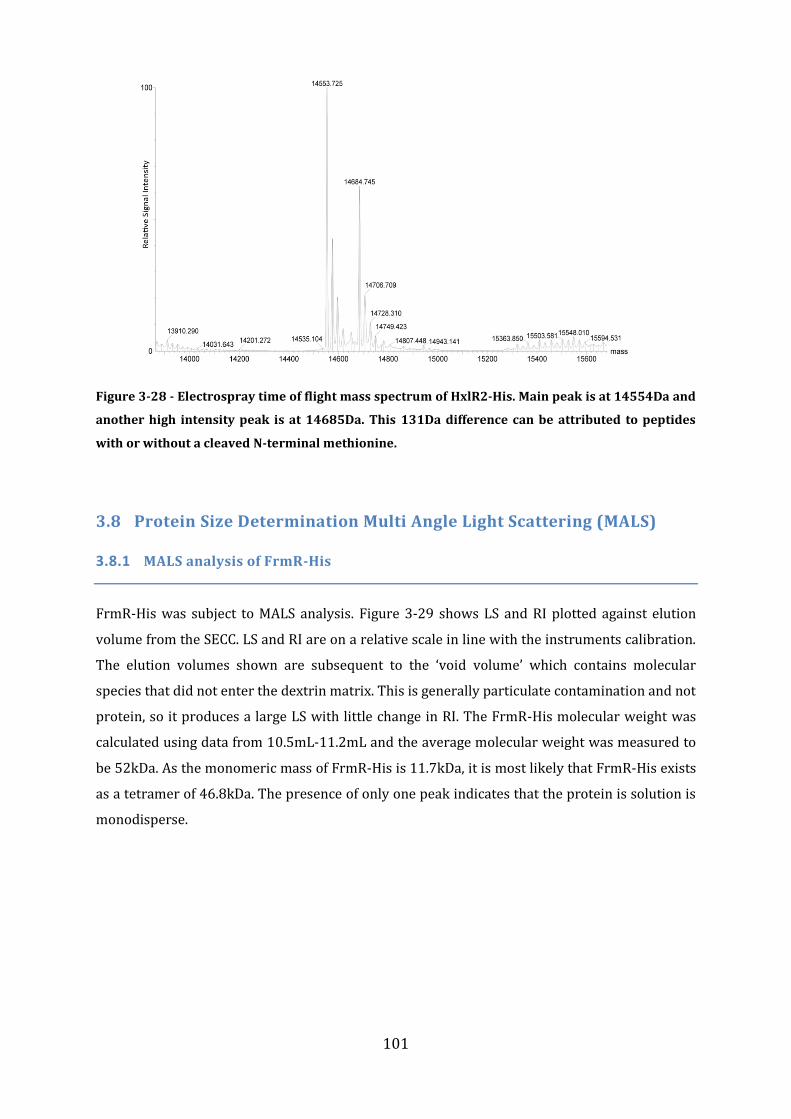
101
Figure 3-28 - Electrospray time of flight mass spectrum of HxlR2-His. Main peak is at 14554Da and
another high intensity peak is at 14685Da. This 131Da difference can be attributed to peptides
with or without a cleaved N-terminal methionine.
3.8 Protein Size Determination Multi Angle Light Scattering (MALS)
3.8.1 MALS analysis of FrmR-His
FrmR-His was subject to MALS analysis. Figure 3-29 shows LS and RI plotted against elution
volume from the SECC. LS and RI are on a relative scale in line with the instruments calibration.
The elution volumes shown are subsequent to the ‘void volume’ which contains molecular
species that did not enter the dextrin matrix. This is generally particulate contamination and not
protein, so it produces a large LS with little change in RI. The FrmR-His molecular weight was
calculated using data from 10.5mL-11.2mL and the average molecular weight was measured to
be 52kDa. As the monomeric mass of FrmR-His is 11.7kDa, it is most likely that FrmR-His exists
as a tetramer of 46.8kDa. The presence of only one peak indicates that the protein is solution is
monodisperse.
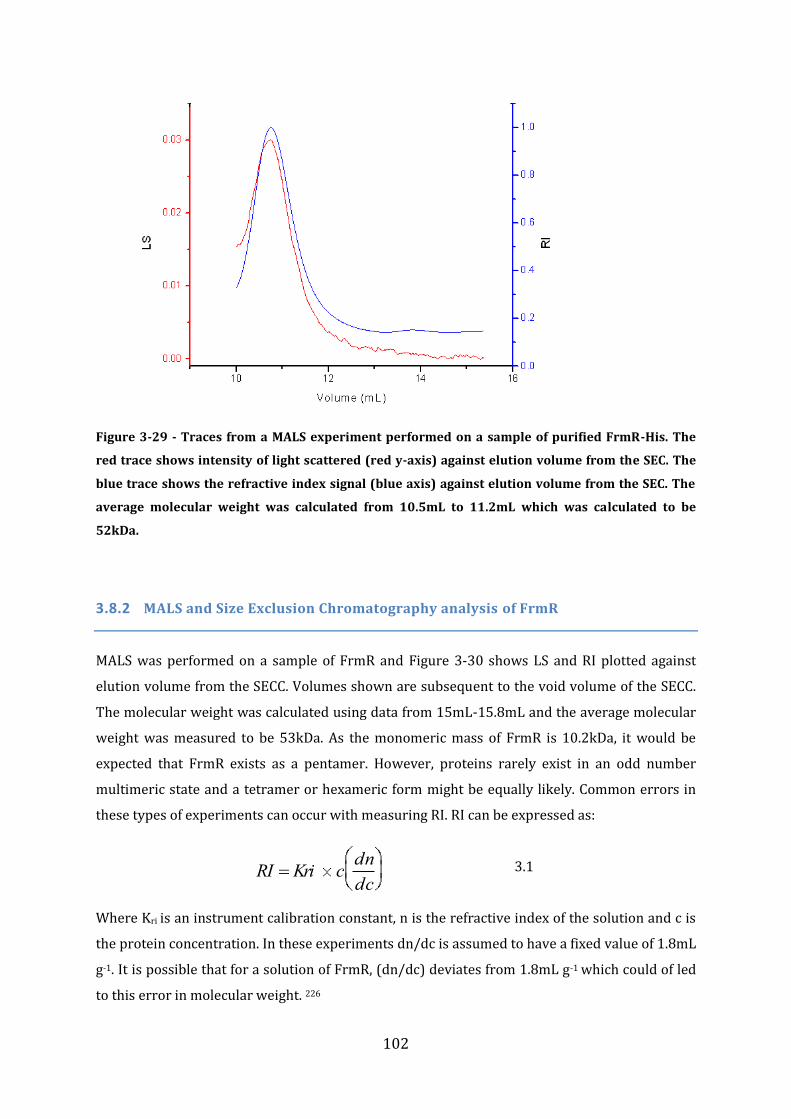
102
Figure 3-29 - Traces from a MALS experiment performed on a sample of purified FrmR-His. The
red trace shows intensity of light scattered (red y-axis) against elution volume from the SEC. The
blue trace shows the refractive index signal (blue axis) against elution volume from the SEC. The
average molecular weight was calculated from 10.5mL to 11.2mL which was calculated to be
52kDa.
3.8.2 MALS and Size Exclusion Chromatography analysis of FrmR
MALS was performed on a sample of FrmR and Figure 3-30 shows LS and RI plotted against
elution volume from the SECC. Volumes shown are subsequent to the void volume of the SECC.
The molecular weight was calculated using data from 15mL-15.8mL and the average molecular
weight was measured to be 53kDa. As the monomeric mass of FrmR is 10.2kDa, it would be
expected that FrmR exists as a pentamer. However, proteins rarely exist in an odd number
multimeric state and a tetramer or hexameric form might be equally likely. Common errors in
these types of experiments can occur with measuring RI. RI can be expressed as:
3.1
Where Kri is an instrument calibration constant, n is the refractive index of the solution and c is
the protein concentration. In these experiments dn/dc is assumed to have a fixed value of 1.8mL
g-1. It is possible that for a solution of FrmR, (dn/dc) deviates from 1.8mL g-1 which could of led
to this error in molecular weight. 226
RI Kri cdn
dc
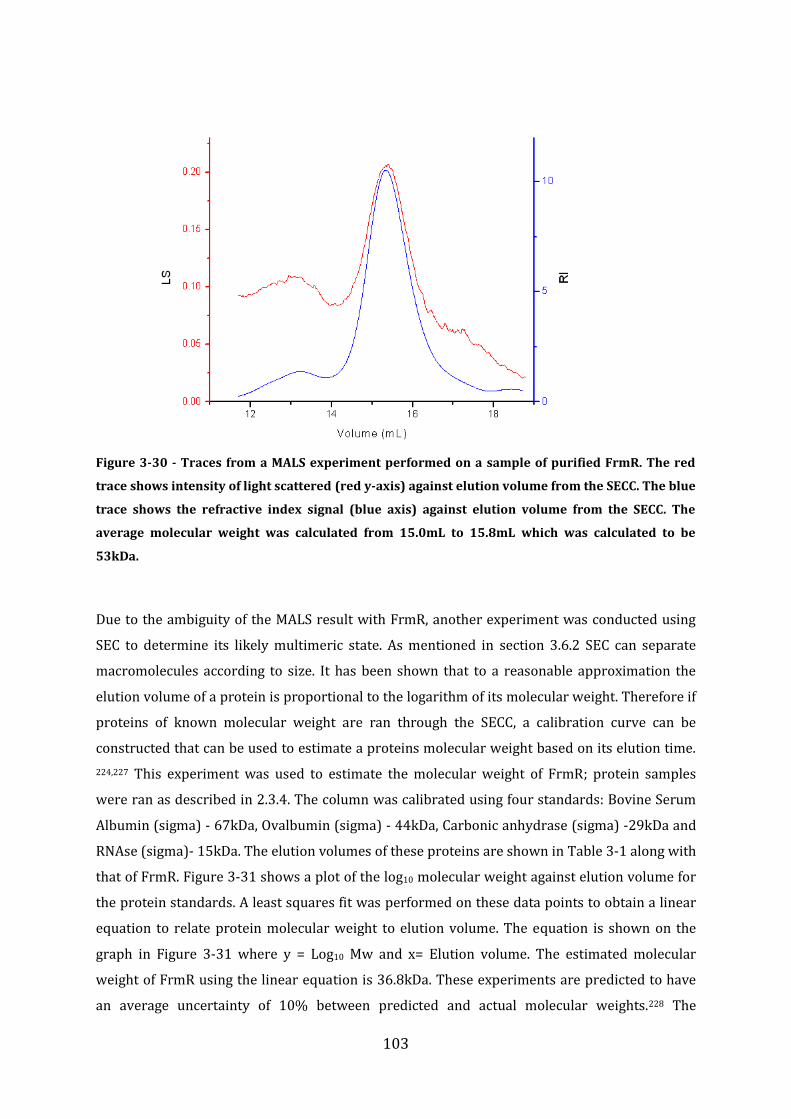
103
Figure 3-30 - Traces from a MALS experiment performed on a sample of purified FrmR. The red
trace shows intensity of light scattered (red y-axis) against elution volume from the SECC. The blue
trace shows the refractive index signal (blue axis) against elution volume from the SECC. The
average molecular weight was calculated from 15.0mL to 15.8mL which was calculated to be
53kDa.
Due to the ambiguity of the MALS result with FrmR, another experiment was conducted using
SEC to determine its likely multimeric state. As mentioned in section 3.6.2 SEC can separate
macromolecules according to size. It has been shown that to a reasonable approximation the
elution volume of a protein is proportional to the logarithm of its molecular weight. Therefore if
proteins of known molecular weight are ran through the SECC, a calibration curve can be
constructed that can be used to estimate a proteins molecular weight based on its elution time.
224,227 This experiment was used to estimate the molecular weight of FrmR; protein samples
were ran as described in 2.3.4. The column was calibrated using four standards: Bovine Serum
Albumin (sigma) - 67kDa, Ovalbumin (sigma) - 44kDa, Carbonic anhydrase (sigma) -29kDa and
RNAse (sigma)- 15kDa. The elution volumes of these proteins are shown in Table 3-1 along with
that of FrmR. Figure 3-31 shows a plot of the log10 molecular weight against elution volume for
the protein standards. A least squares fit was performed on these data points to obtain a linear
equation to relate protein molecular weight to elution volume. The equation is shown on the
graph in Figure 3-31 where y = Log10 Mw and x= Elution volume. The estimated molecular
weight of FrmR using the linear equation is 36.8kDa. These experiments are predicted to have
an average uncertainty of 10% between predicted and actual molecular weights.228 The
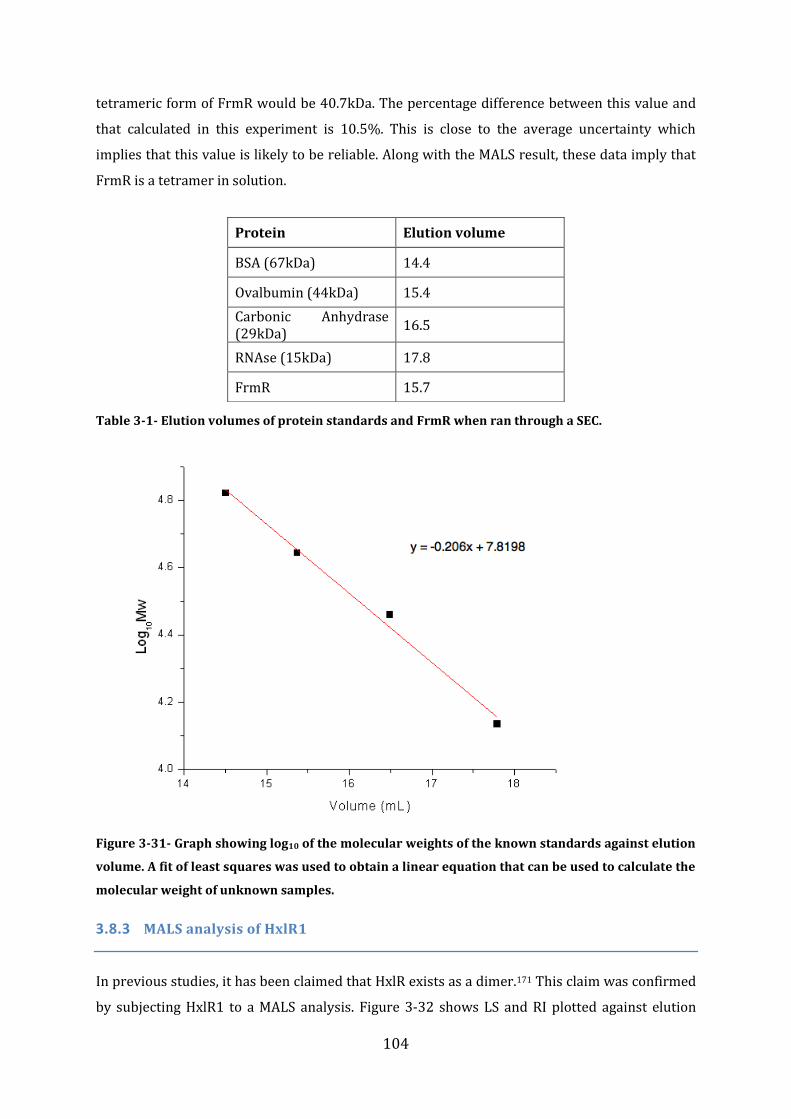
104
tetrameric form of FrmR would be 40.7kDa. The percentage difference between this value and
that calculated in this experiment is 10.5%. This is close to the average uncertainty which
implies that this value is likely to be reliable. Along with the MALS result, these data imply that
FrmR is a tetramer in solution.
Table 3-1- Elution volumes of protein standards and FrmR when ran through a SEC.
Figure 3-31- Graph showing log10 of the molecular weights of the known standards against elution
volume. A fit of least squares was used to obtain a linear equation that can be used to calculate the
molecular weight of unknown samples.
3.8.3 MALS analysis of HxlR1
In previous studies, it has been claimed that HxlR exists as a dimer.171 This claim was confirmed
by subjecting HxlR1 to a MALS analysis. Figure 3-32 shows LS and RI plotted against elution
Protein Elution volume
BSA (67kDa) 14.4
Ovalbumin (44kDa) 15.4
Carbonic Anhydrase (29kDa)
16.5
RNAse (15kDa) 17.8
FrmR 15.7
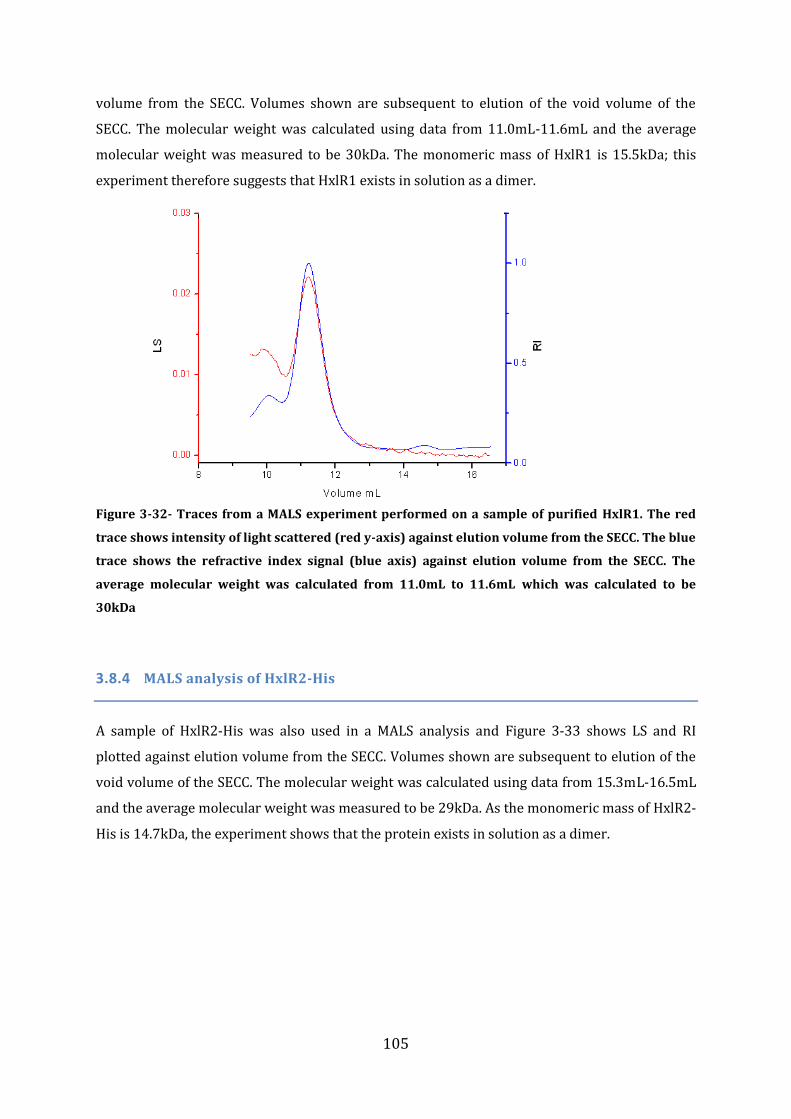
105
volume from the SECC. Volumes shown are subsequent to elution of the void volume of the
SECC. The molecular weight was calculated using data from 11.0mL-11.6mL and the average
molecular weight was measured to be 30kDa. The monomeric mass of HxlR1 is 15.5kDa; this
experiment therefore suggests that HxlR1 exists in solution as a dimer.
Figure 3-32- Traces from a MALS experiment performed on a sample of purified HxlR1. The red
trace shows intensity of light scattered (red y-axis) against elution volume from the SECC. The blue
trace shows the refractive index signal (blue axis) against elution volume from the SECC. The
average molecular weight was calculated from 11.0mL to 11.6mL which was calculated to be
30kDa
3.8.4 MALS analysis of HxlR2-His
A sample of HxlR2-His was also used in a MALS analysis and Figure 3-33 shows LS and RI
plotted against elution volume from the SECC. Volumes shown are subsequent to elution of the
void volume of the SECC. The molecular weight was calculated using data from 15.3mL-16.5mL
and the average molecular weight was measured to be 29kDa. As the monomeric mass of HxlR2-
His is 14.7kDa, the experiment shows that the protein exists in solution as a dimer.
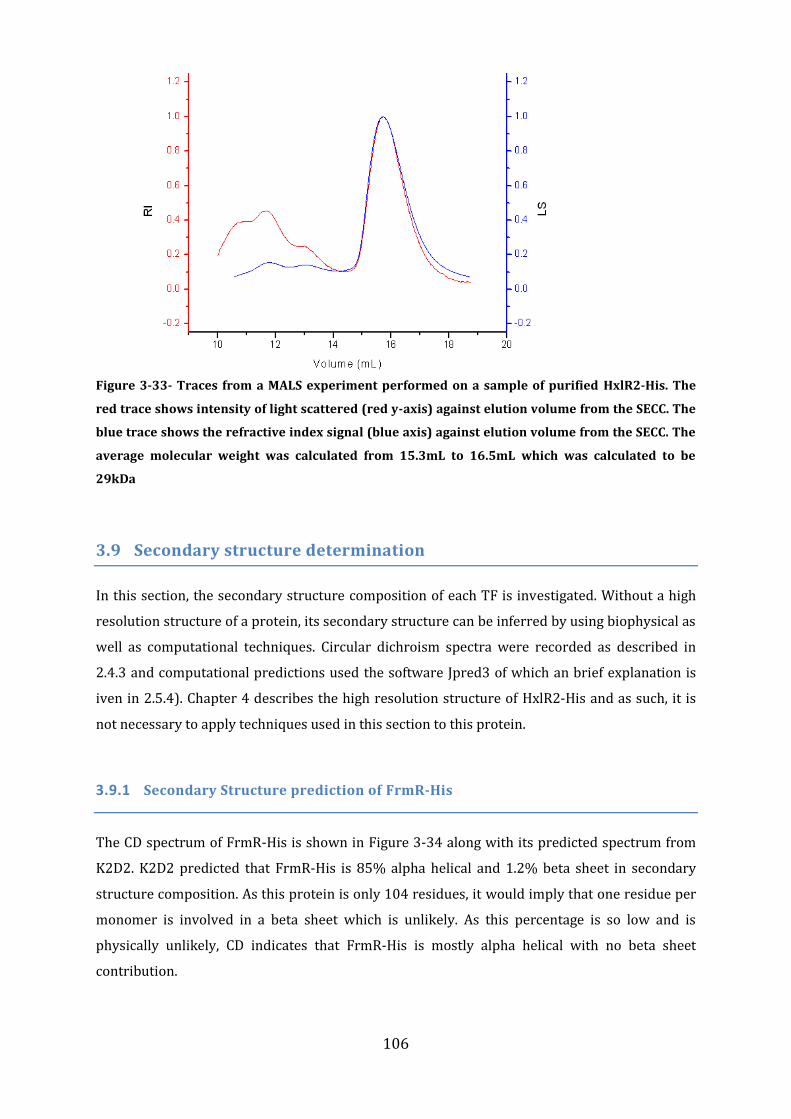
106
Figure 3-33- Traces from a MALS experiment performed on a sample of purified HxlR2-His. The
red trace shows intensity of light scattered (red y-axis) against elution volume from the SECC. The
blue trace shows the refractive index signal (blue axis) against elution volume from the SECC. The
average molecular weight was calculated from 15.3mL to 16.5mL which was calculated to be
29kDa
3.9 Secondary structure determination
In this section, the secondary structure composition of each TF is investigated. Without a high
resolution structure of a protein, its secondary structure can be inferred by using biophysical as
well as computational techniques. Circular dichroism spectra were recorded as described in
2.4.3 and computational predictions used the software Jpred3 of which an brief explanation is
iven in 2.5.4). Chapter 4 describes the high resolution structure of HxlR2-His and as such, it is
not necessary to apply techniques used in this section to this protein.
3.9.1 Secondary Structure prediction of FrmR-His
The CD spectrum of FrmR-His is shown in Figure 3-34 along with its predicted spectrum from
K2D2. K2D2 predicted that FrmR-His is 85% alpha helical and 1.2% beta sheet in secondary
structure composition. As this protein is only 104 residues, it would imply that one residue per
monomer is involved in a beta sheet which is unlikely. As this percentage is so low and is
physically unlikely, CD indicates that FrmR-His is mostly alpha helical with no beta sheet
contribution.
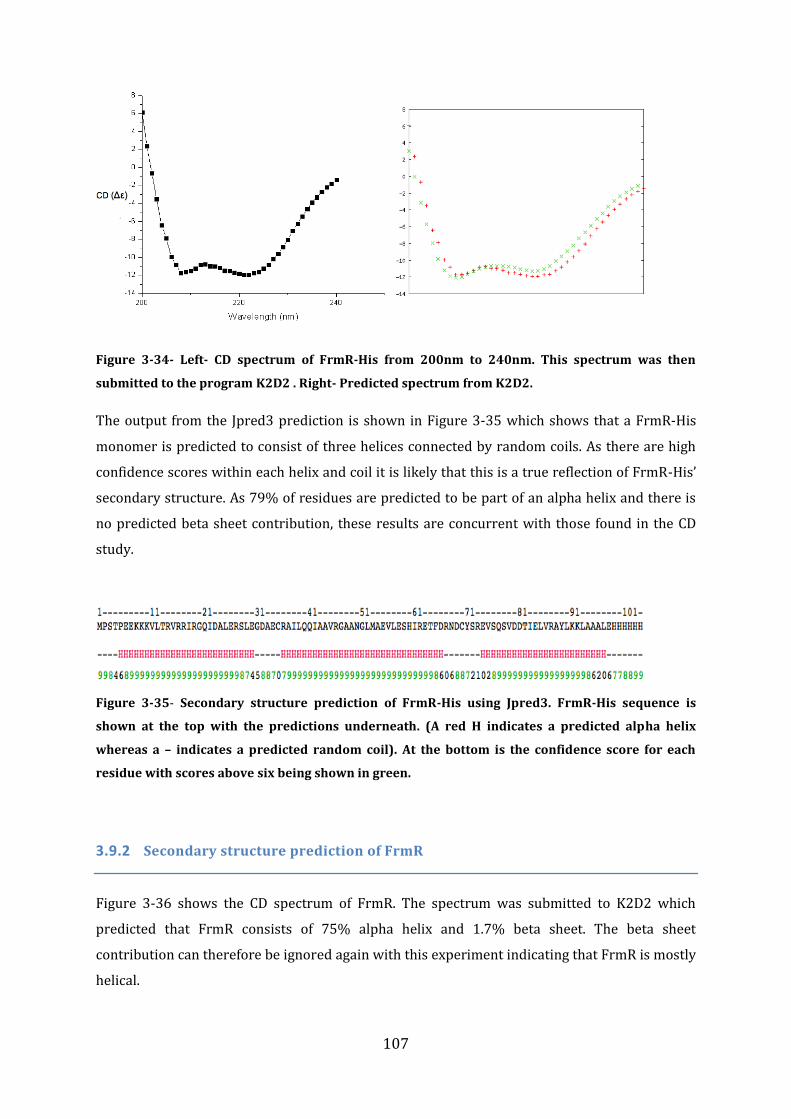
107
Figure 3-34- Left- CD spectrum of FrmR-His from 200nm to 240nm. This spectrum was then
submitted to the program K2D2 . Right- Predicted spectrum from K2D2.
The output from the Jpred3 prediction is shown in Figure 3-35 which shows that a FrmR-His
monomer is predicted to consist of three helices connected by random coils. As there are high
confidence scores within each helix and coil it is likely that this is a true reflection of FrmR-His’
secondary structure. As 79% of residues are predicted to be part of an alpha helix and there is
no predicted beta sheet contribution, these results are concurrent with those found in the CD
study.
Figure 3-35- Secondary structure prediction of FrmR-His using Jpred3. FrmR-His sequence is
shown at the top with the predictions underneath. (A red H indicates a predicted alpha helix
whereas a – indicates a predicted random coil). At the bottom is the confidence score for each
residue with scores above six being shown in green.
3.9.2 Secondary structure prediction of FrmR
Figure 3-36 shows the CD spectrum of FrmR. The spectrum was submitted to K2D2 which
predicted that FrmR consists of 75% alpha helix and 1.7% beta sheet. The beta sheet
contribution can therefore be ignored again with this experiment indicating that FrmR is mostly
helical.
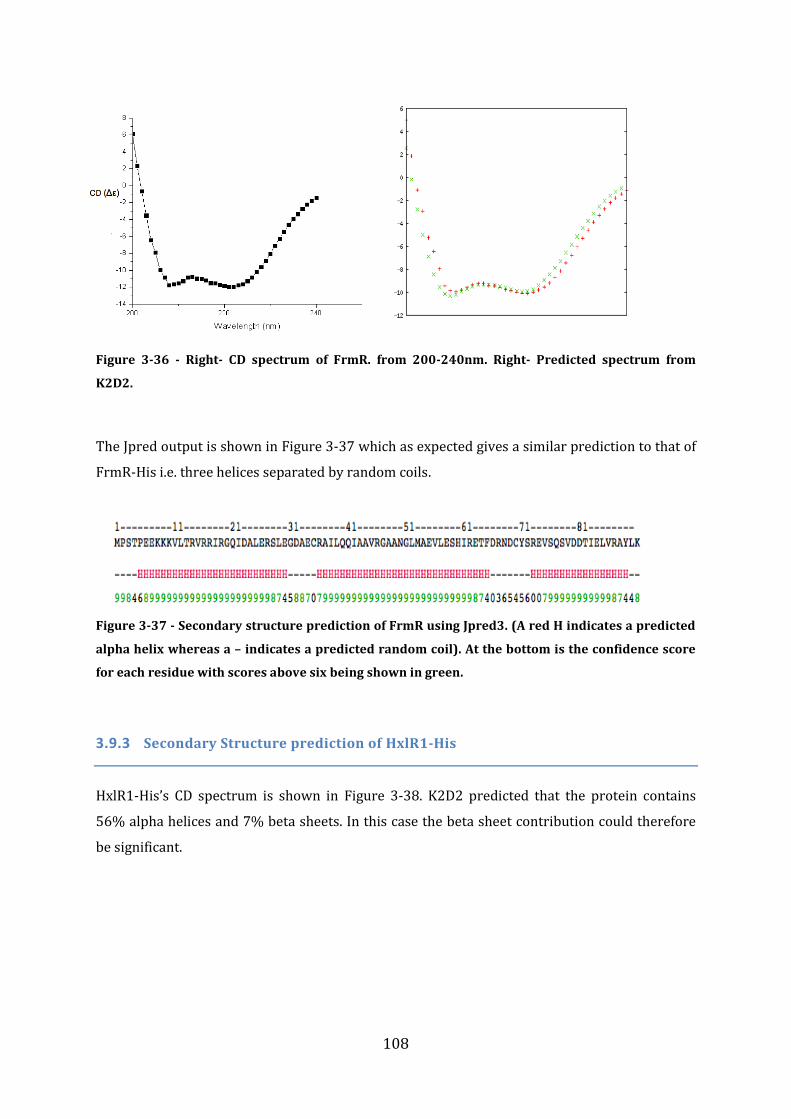
108
Figure 3-36 - Right- CD spectrum of FrmR. from 200-240nm. Right- Predicted spectrum from
K2D2.
The Jpred output is shown in Figure 3-37 which as expected gives a similar prediction to that of
FrmR-His i.e. three helices separated by random coils.
Figure 3-37 - Secondary structure prediction of FrmR using Jpred3. (A red H indicates a predicted
alpha helix whereas a – indicates a predicted random coil). At the bottom is the confidence score
for each residue with scores above six being shown in green.
3.9.3 Secondary Structure prediction of HxlR1-His
HxlR1-His’s CD spectrum is shown in Figure 3-38. K2D2 predicted that the protein contains
56% alpha helices and 7% beta sheets. In this case the beta sheet contribution could therefore
be significant.
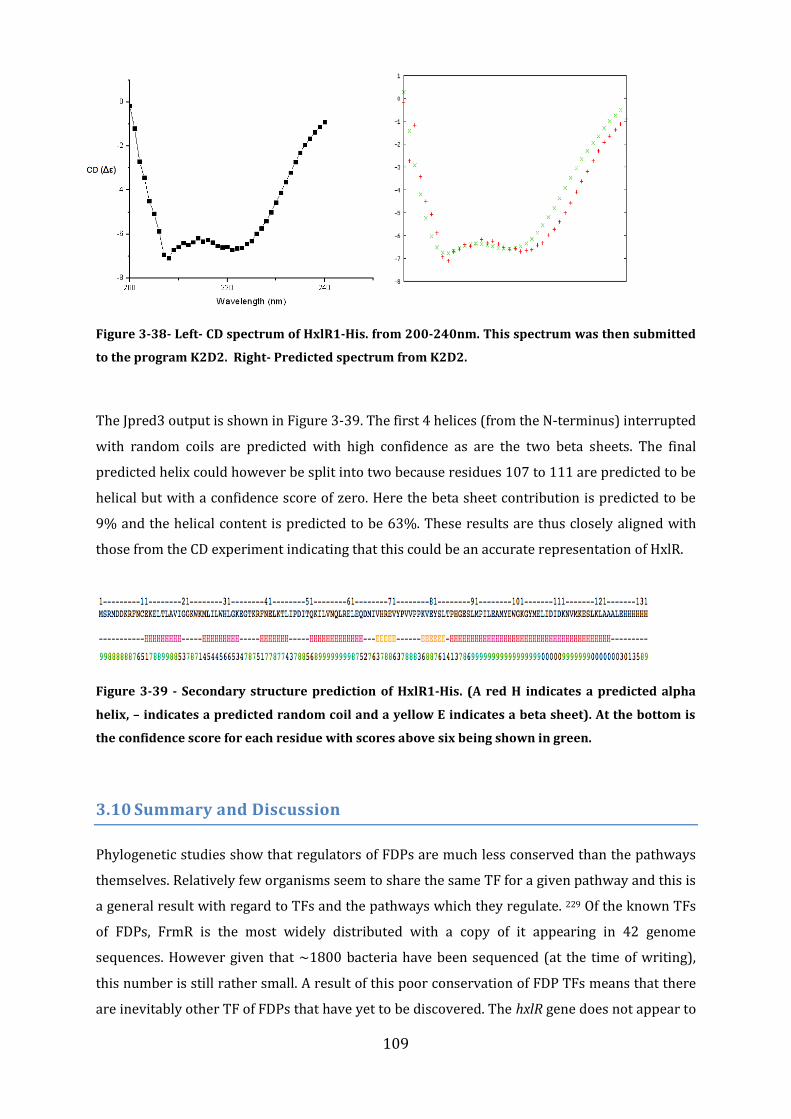
109
Figure 3-38- Left- CD spectrum of HxlR1-His. from 200-240nm. This spectrum was then submitted
to the program K2D2. Right- Predicted spectrum from K2D2.
The Jpred3 output is shown in Figure 3-39. The first 4 helices (from the N-terminus) interrupted
with random coils are predicted with high confidence as are the two beta sheets. The final
predicted helix could however be split into two because residues 107 to 111 are predicted to be
helical but with a confidence score of zero. Here the beta sheet contribution is predicted to be
9% and the helical content is predicted to be 63%. These results are thus closely aligned with
those from the CD experiment indicating that this could be an accurate representation of HxlR.
Figure 3-39 - Secondary structure prediction of HxlR1-His. (A red H indicates a predicted alpha
helix, – indicates a predicted random coil and a yellow E indicates a beta sheet). At the bottom is
the confidence score for each residue with scores above six being shown in green.
3.10 Summary and Discussion
Phylogenetic studies show that regulators of FDPs are much less conserved than the pathways
themselves. Relatively few organisms seem to share the same TF for a given pathway and this is
a general result with regard to TFs and the pathways which they regulate. 229 Of the known TFs
of FDPs, FrmR is the most widely distributed with a copy of it appearing in 42 genome
sequences. However given that ~1800 bacteria have been sequenced (at the time of writing),
this number is still rather small. A result of this poor conservation of FDP TFs means that there
are inevitably other TF of FDPs that have yet to be discovered. The hxlR gene does not appear to
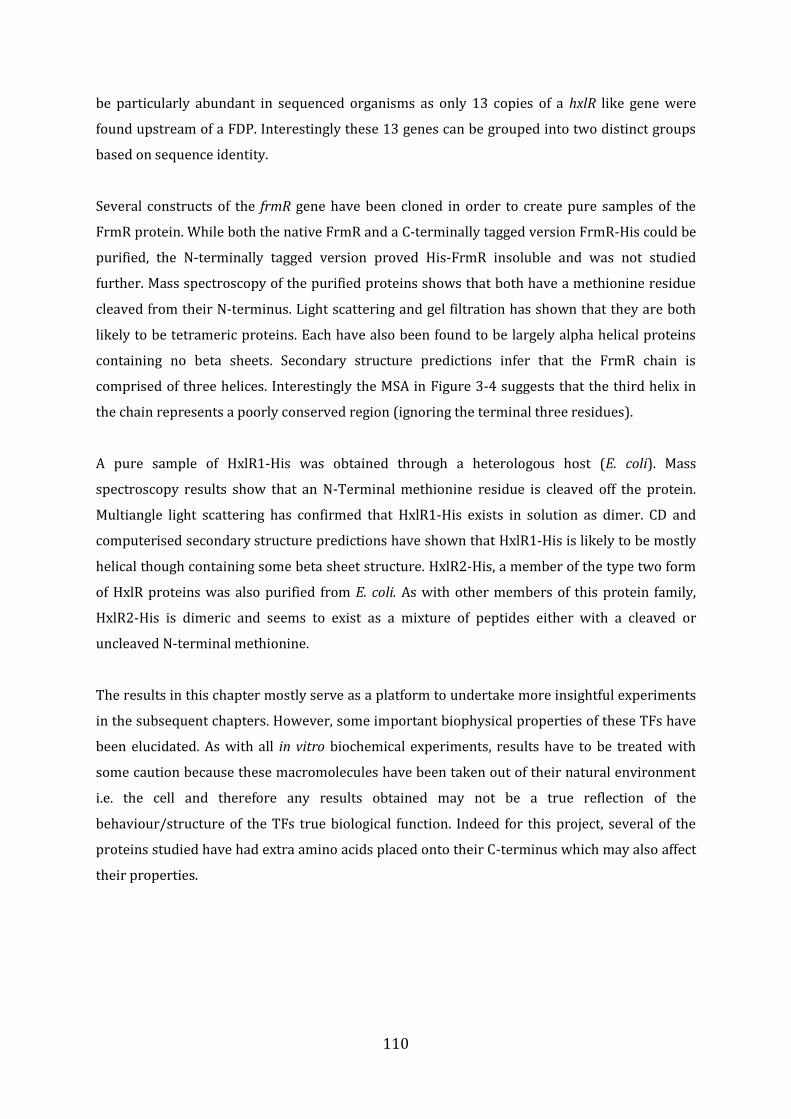
110
be particularly abundant in sequenced organisms as only 13 copies of a hxlR like gene were
found upstream of a FDP. Interestingly these 13 genes can be grouped into two distinct groups
based on sequence identity.
Several constructs of the frmR gene have been cloned in order to create pure samples of the
FrmR protein. While both the native FrmR and a C-terminally tagged version FrmR-His could be
purified, the N-terminally tagged version proved His-FrmR insoluble and was not studied
further. Mass spectroscopy of the purified proteins shows that both have a methionine residue
cleaved from their N-terminus. Light scattering and gel filtration has shown that they are both
likely to be tetrameric proteins. Each have also been found to be largely alpha helical proteins
containing no beta sheets. Secondary structure predictions infer that the FrmR chain is
comprised of three helices. Interestingly the MSA in Figure 3-4 suggests that the third helix in
the chain represents a poorly conserved region (ignoring the terminal three residues).
A pure sample of HxlR1-His was obtained through a heterologous host (E. coli). Mass
spectroscopy results show that an N-Terminal methionine residue is cleaved off the protein.
Multiangle light scattering has confirmed that HxlR1-His exists in solution as dimer. CD and
computerised secondary structure predictions have shown that HxlR1-His is likely to be mostly
helical though containing some beta sheet structure. HxlR2-His, a member of the type two form
of HxlR proteins was also purified from E. coli. As with other members of this protein family,
HxlR2-His is dimeric and seems to exist as a mixture of peptides either with a cleaved or
uncleaved N-terminal methionine.
The results in this chapter mostly serve as a platform to undertake more insightful experiments
in the subsequent chapters. However, some important biophysical properties of these TFs have
been elucidated. As with all in vitro biochemical experiments, results have to be treated with
some caution because these macromolecules have been taken out of their natural environment
i.e. the cell and therefore any results obtained may not be a true reflection of the
behaviour/structure of the TFs true biological function. Indeed for this project, several of the
proteins studied have had extra amino acids placed onto their C-terminus which may also affect
their properties.
111
4 Crystal Structure Determination of FrmR and HxlR
4.1 Introduction
Knowing the detailed 3D-structure of biomolecules is essential to understand their function.
The unique structure of a biomolecule dictates how it can interact and/or catalyse a reaction
and therefore how it fulfils its biological role. It is therefore desirable to obtain detailed
structures of the TFs that are being studied in this project and this chapter describes
experiments aimed at obtaining these structures. The most common method of obtaining an
accurate 3D-model is through the use of macromolecular X-ray crystallography. X-ray
crystallography is the method of determining how the atomic structure of a crystal is arranged
by illuminating the crystal with X-rays and analysing the resulting diffraction patterns. This
chapter attempts to obtain high resolution structures of the purified proteins from Chapter 3 in
order to increase our understanding of their biochemical properties. Aknowledgements are
given to Dr Mark Dunstan and Professor David Leys for their help and assistance given in the
experiments described in this section
4.2 Aims and Objectives
The first step in macromolecular structure determination by X-ray crystallography is to obtain
crystals of the macromolecule. There are several known methods that can achieve this with the
‘vapour diffusion’ method proving particularly successful; this technique will therefore be
employed in this study. By screening many known crystallisation conditions it is hoped to
obtain crystals of the TFs that were purified in chapter 3. If this first step is successful, then the
diffraction patterns of the crystals will be determined using high intensity X-ray radiation from
a synchrotron source. Once the data are collected, they need to be processed so that all the
recorded reflections are stored in one file with their intensities scaled relative to each other.
Then, the recorded reflections need reasonably accurate phase estimates so that a starting
model for refinement can be created. In this study, molecular replacement (MR) was used for
this procedure. If a realistic starting model is obtained then model refinement can be performed
which will hopefully lead to a final structure. With a refined structure in hand, it is then possible
to evaluate the protein structure and assess its biological context.
112
4.3 Crystallization
Macromolecular crystallization usually only occurs in some conditions and all too often, not at
all.205 To try and find optimal crystallization conditions, each protein was screened under 384
different conditions using commercially available screens obtained from MOLECULAR
DIMENSIONS. These screens each contain 96 different reservoirs and are designed to cover the
majority of known conditions that support crystallization of globular proteins. These screens
are called “PACT-Premier, JCSG plus, Clear strategy 1 and Clear strategy 2. In order to screen
through these conditions the protein sample is first mixed in a 1:1 ratio with an equal volume
from the reservoir before being placed in the crystallization well. Details of the crystallization
procedure are described in 2.6.2.
4.3.1 Crystallization of FrmR-His and FrmR
Crystallization of FrmR and FrmR-His was attempted using these four screens. Two starting
concentrations were used for each protein: 10 mg/mL and 5 mg/mL. Unfortunately, no
crystalline form of either of these two proteins was observed (despite screening various
conditions and ligands such as formaldehyde). These results meant that crystallographic
structure determination could not be performed on these two proteins.
4.3.2 Crystallization of FrmRC36S
As explained in chapter 5, a mutant form of FrmRC36S, deficient in formaldehyde sensing but
not in DNA-binding has been obtained. In order to test whether this mutation alters FrmR’s
ability to crystallize, this protein was also tested against the four screens. It was found that in
contrast to the WT, FrmR-C36S readily formed crystals in several conditions. Two of these
conditions produced crystals that were of an appreciable size, but appeared to belong to
different crystal forms. One type of crystals were hexagonal rods while the other can be
described as plates. The plate like crystals were formed in condition G2 from PACT premier
with the reservoir consisting of 0.2M Sodium bromide, 0.1M Bis Tris propane, 20% w/v PEG
3350 at pH 7.5. The conditions that formed the rods were from well A4 of the Clear strategy 2
screen with the reservoir consisting of 0.5M dihydrogen potassium phosphate and 0.1M sodium
acetate (pH 5.5). Both of these crystal forms were on the scale of approximately 50-200
micrometres in each dimension. In order to obtain more and potentially improved crystals, both
these conditions were optimized by scaling up the volumes used as well as testing small
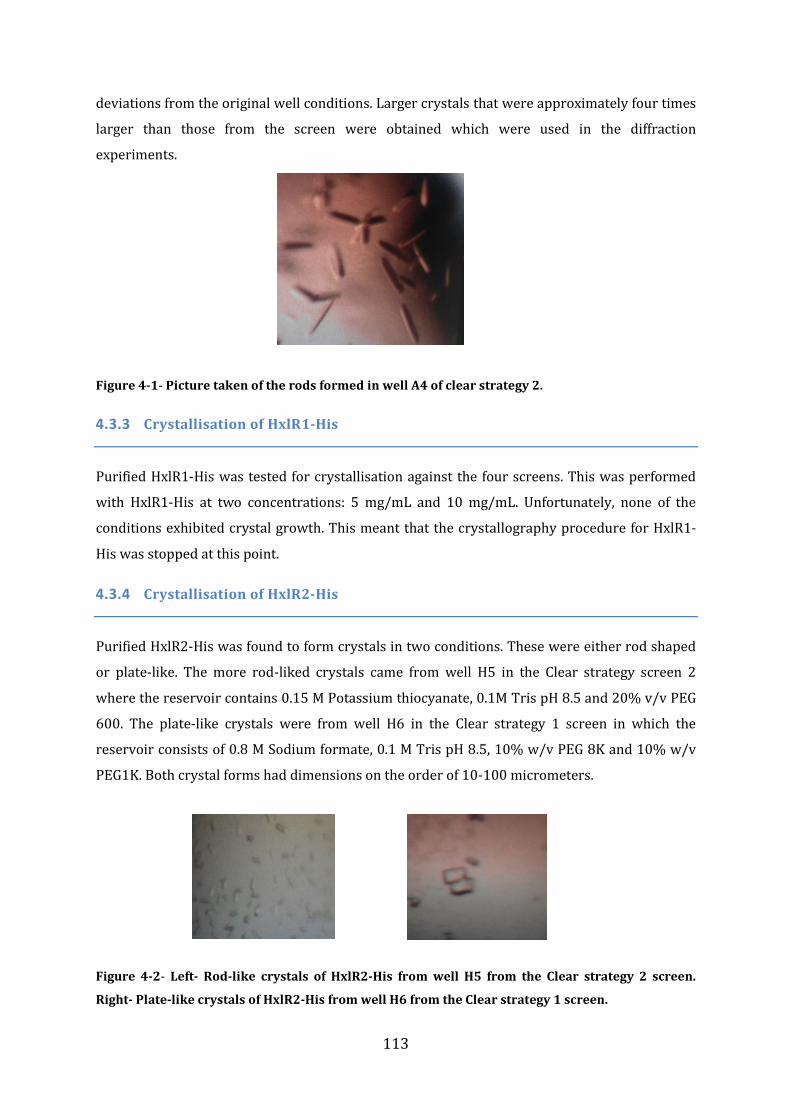
113
deviations from the original well conditions. Larger crystals that were approximately four times
larger than those from the screen were obtained which were used in the diffraction
experiments.
Figure 4-1- Picture taken of the rods formed in well A4 of clear strategy 2.
4.3.3 Crystallisation of HxlR1-His
Purified HxlR1-His was tested for crystallisation against the four screens. This was performed
with HxlR1-His at two concentrations: 5 mg/mL and 10 mg/mL. Unfortunately, none of the
conditions exhibited crystal growth. This meant that the crystallography procedure for HxlR1-
His was stopped at this point.
4.3.4 Crystallisation of HxlR2-His
Purified HxlR2-His was found to form crystals in two conditions. These were either rod shaped
or plate-like. The more rod-liked crystals came from well H5 in the Clear strategy screen 2
where the reservoir contains 0.15 M Potassium thiocyanate, 0.1M Tris pH 8.5 and 20% v/v PEG
600. The plate-like crystals were from well H6 in the Clear strategy 1 screen in which the
reservoir consists of 0.8 M Sodium formate, 0.1 M Tris pH 8.5, 10% w/v PEG 8K and 10% w/v
PEG1K. Both crystal forms had dimensions on the order of 10-100 micrometers.
Figure 4-2- Left- Rod-like crystals of HxlR2-His from well H5 from the Clear strategy 2 screen.
Right- Plate-like crystals of HxlR2-His from well H6 from the Clear strategy 1 screen.
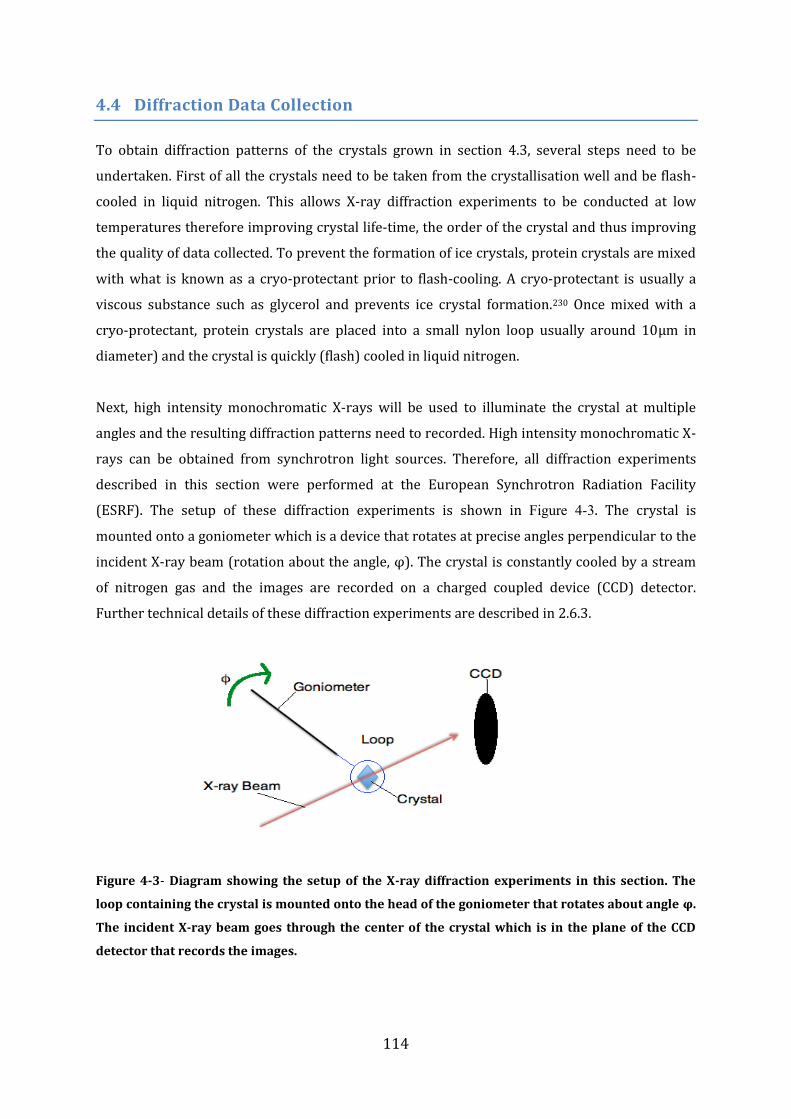
114
4.4 Diffraction Data Collection
To obtain diffraction patterns of the crystals grown in section 4.3, several steps need to be
undertaken. First of all the crystals need to be taken from the crystallisation well and be flash-
cooled in liquid nitrogen. This allows X-ray diffraction experiments to be conducted at low
temperatures therefore improving crystal life-time, the order of the crystal and thus improving
the quality of data collected. To prevent the formation of ice crystals, protein crystals are mixed
with what is known as a cryo-protectant prior to flash-cooling. A cryo-protectant is usually a
viscous substance such as glycerol and prevents ice crystal formation.230 Once mixed with a
cryo-protectant, protein crystals are placed into a small nylon loop usually around 10µm in
diameter) and the crystal is quickly (flash) cooled in liquid nitrogen.
Next, high intensity monochromatic X-rays will be used to illuminate the crystal at multiple
angles and the resulting diffraction patterns need to recorded. High intensity monochromatic X-
rays can be obtained from synchrotron light sources. Therefore, all diffraction experiments
described in this section were performed at the European Synchrotron Radiation Facility
(ESRF). The setup of these diffraction experiments is shown in Figure 4-3. The crystal is
mounted onto a goniometer which is a device that rotates at precise angles perpendicular to the
incident X-ray beam (rotation about the angle, φ). The crystal is constantly cooled by a stream
of nitrogen gas and the images are recorded on a charged coupled device (CCD) detector.
Further technical details of these diffraction experiments are described in 2.6.3.
Figure 4-3- Diagram showing the setup of the X-ray diffraction experiments in this section. The
loop containing the crystal is mounted onto the head of the goniometer that rotates about angle φ.
The incident X-ray beam goes through the center of the crystal which is in the plane of the CCD
detector that records the images.
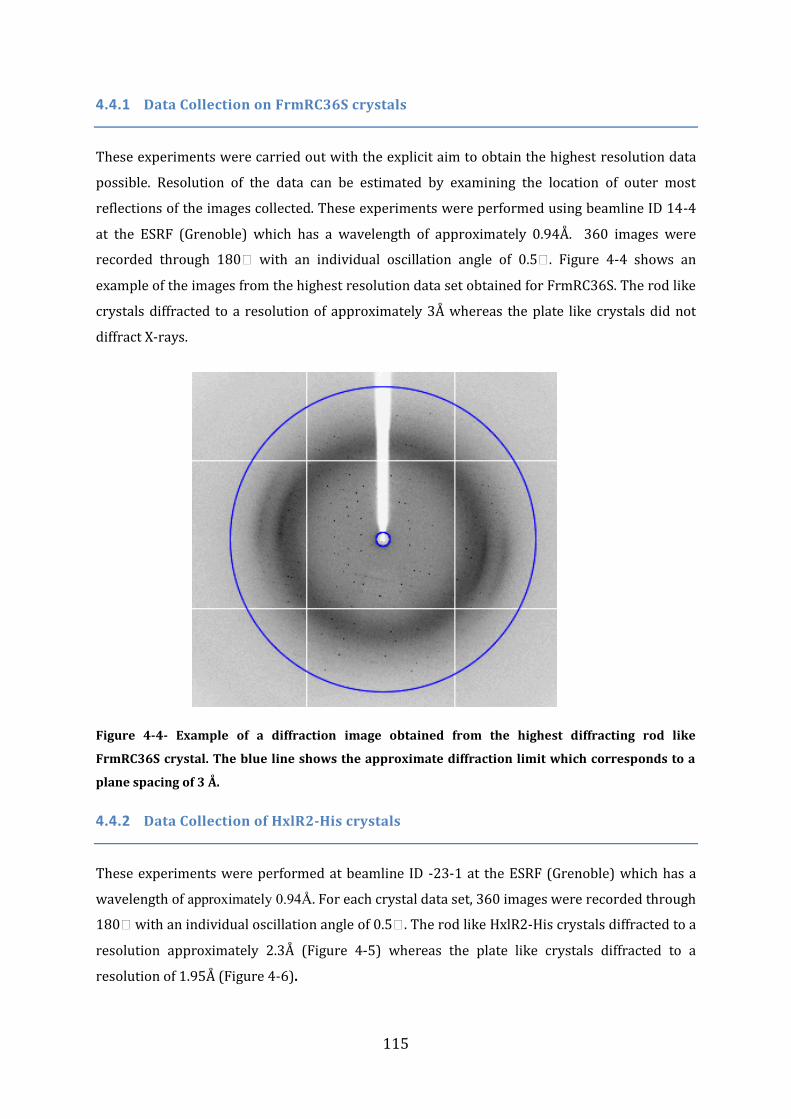
115
4.4.1 Data Collection on FrmRC36S crystals
These experiments were carried out with the explicit aim to obtain the highest resolution data
possible. Resolution of the data can be estimated by examining the location of outer most
reflections of the images collected. These experiments were performed using beamline ID 14-4
at the ESRF (Grenoble) which has a wavelength of approximately 0.94Å. 360 images were
recorded through 180ᵒ with an individual oscillation angle of 0.5ᵒ. Figure 4-4 shows an
example of the images from the highest resolution data set obtained for FrmRC36S. The rod like
crystals diffracted to a resolution of approximately 3Å whereas the plate like crystals did not
diffract X-rays.
Figure 4-4- Example of a diffraction image obtained from the highest diffracting rod like
FrmRC36S crystal. The blue line shows the approximate diffraction limit which corresponds to a
plane spacing of 3 Å.
4.4.2 Data Collection of HxlR2-His crystals
These experiments were performed at beamline ID -23-1 at the ESRF (Grenoble) which has a
wavelength of approximately 0.94Å. For each crystal data set, 360 images were recorded through
180ᵒ with an individual oscillation angle of 0.5ᵒ. The rod like HxlR2-His crystals diffracted to a
resolution approximately 2.3Å (Figure 4-5) whereas the plate like crystals diffracted to a
resolution of 1.95Å (Figure 4-6).
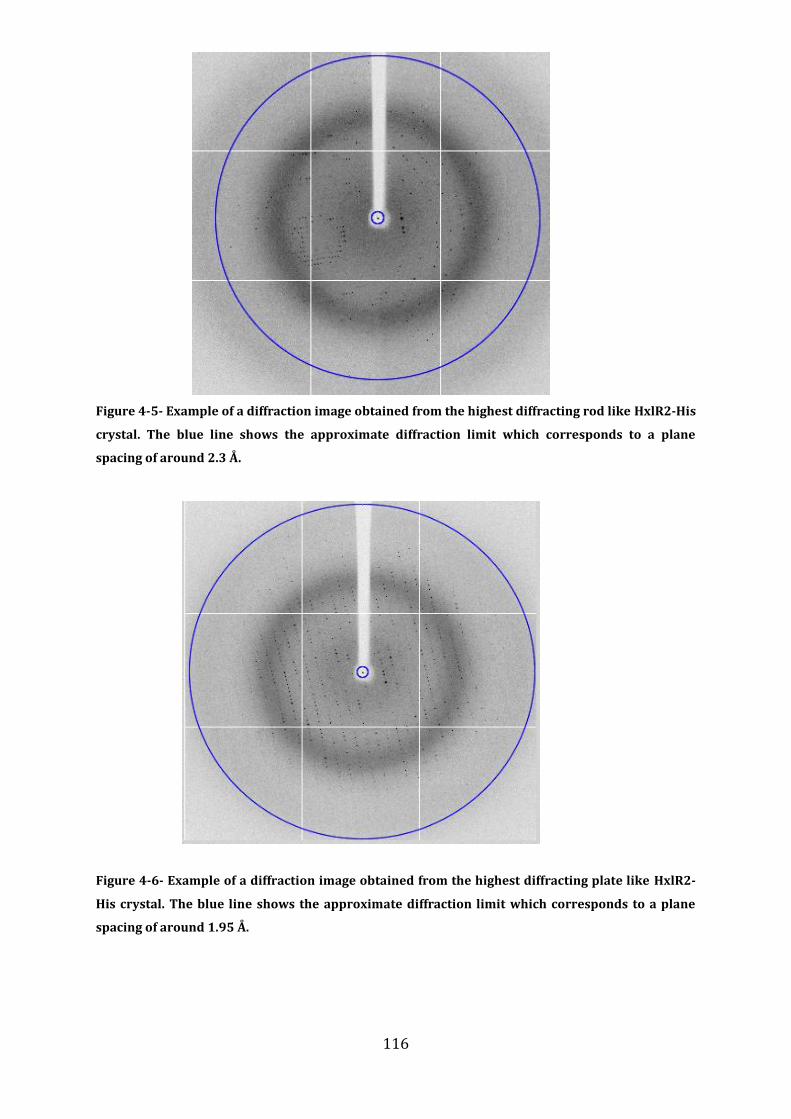
116
Figure 4-5- Example of a diffraction image obtained from the highest diffracting rod like HxlR2-His
crystal. The blue line shows the approximate diffraction limit which corresponds to a plane
spacing of around 2.3 Å.
Figure 4-6- Example of a diffraction image obtained from the highest diffracting plate like HxlR2-
His crystal. The blue line shows the approximate diffraction limit which corresponds to a plane
spacing of around 1.95 Å.
117
4.5 Data Processing
Following data collection, the images need to be processed. The processing of data goes through
a number of stages, the first of which is determining crystal orientation, unit-cell parameters
(indexing) and potential space group of the crystal. These parameters are used to predict a
diffraction pattern and the intensity is recorded at each predicted reflection, a process called
integration. The program iMosflm was used to carry out this initial data processing.206,231 Due to
the imperfect nature of real protein crystals, a particular reflection occurs over a certain
oscillation width (rather than being a discrete point in space) and so reflections can occur
across different images. This results in partial reflections being recorded as the reflection is split
between separate images. A process called merging needs to be performed on the data whereby
the presence of partial reflections is taken into account and the various images are scaled to a
common reference. This process is called scaling. Both merging and scaling were performed
using the program SCALA. 207 The most likely space group was then determined for each crystal
form using the program POINTLESS.207 In order to continue with structure elucidation, the list
of intensities needs to be converted into structure factors, |F|; this operation was conducted
using the program Truncate. If the data was from a perfect lattice then |F| would be equal to √I;
however as the data will be imperfect, truncate makes best estimates of |F|. Additionally, the
“Free R flag” is set; this is the 5% of data that is not used for determining the model and is kept
aside for generating the Rfree statistic208. The output from POINTLESS and SCALA gives a number
of data processing statistics and contains much of the information obtained from data collection
and data processing. These statistics are generally presented in a table such as that in Table 4-1.
It contains:
Space Group- space group of the crystal.
Unit-cell parameters (a,b,c)- The dimensions of the unit cell of the crystal in Å.
Unit-cell parameters , , (°)- Size of the angles between the three unit cell axes. between b
and c, between a and c, between a and b
Resolution Range- The range in Å that the data was processed in. This corresponds to the angle
of the reflections seen in the diffraction pattern.
Number of observed reflections- The total number of reflections used in the data processing.
Number of unique reflections- The number of measured reflections.
Completeness- The percentage of expected reflections to be observed from this space group at
the stated resolution that are measured
<I/ I>- The average ratio of the measured intensity of a reflection, I, divided by its standard
deviation, I.
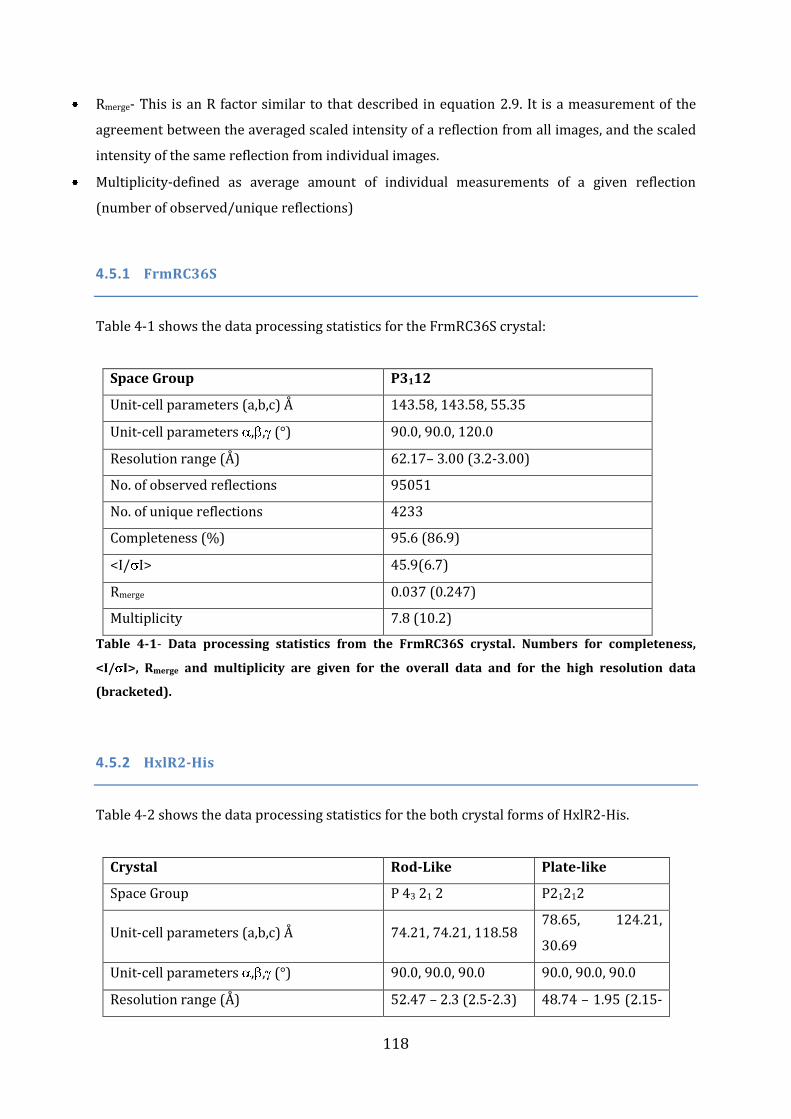
118
Rmerge- This is an R factor similar to that described in equation 2.9. It is a measurement of the
agreement between the averaged scaled intensity of a reflection from all images, and the scaled
intensity of the same reflection from individual images.
Multiplicity-defined as average amount of individual measurements of a given reflection
(number of observed/unique reflections)
4.5.1 FrmRC36S
Table 4-1 shows the data processing statistics for the FrmRC36S crystal:
Space Group P3112
Unit-cell parameters (a,b,c) Å 143.58, 143.58, 55.35
Unit-cell parameters , , (°) 90.0, 90.0, 120.0
Resolution range (Å) 62.17– 3.00 (3.2-3.00)
No. of observed reflections 95051
No. of unique reflections 4233
Completeness (%) 95.6 (86.9)
<I/ I> 45.9(6.7)
Rmerge 0.037 (0.247)
Multiplicity 7.8 (10.2)
Table 4-1- Data processing statistics from the FrmRC36S crystal. Numbers for completeness,
<I/ I>, Rmerge and multiplicity are given for the overall data and for the high resolution data
(bracketed).
4.5.2 HxlR2-His
Table 4-2 shows the data processing statistics for the both crystal forms of HxlR2-His.
Crystal Rod-Like Plate-like
Space Group P 43 21 2 P21212
Unit-cell parameters (a,b,c) Å 74.21, 74.21, 118.58 78.65, 124.21,
30.69
Unit-cell parameters , , (°) 90.0, 90.0, 90.0 90.0, 90.0, 90.0
Resolution range (Å) 52.47 – 2.3 (2.5-2.3) 48.74 – 1.95 (2.15-
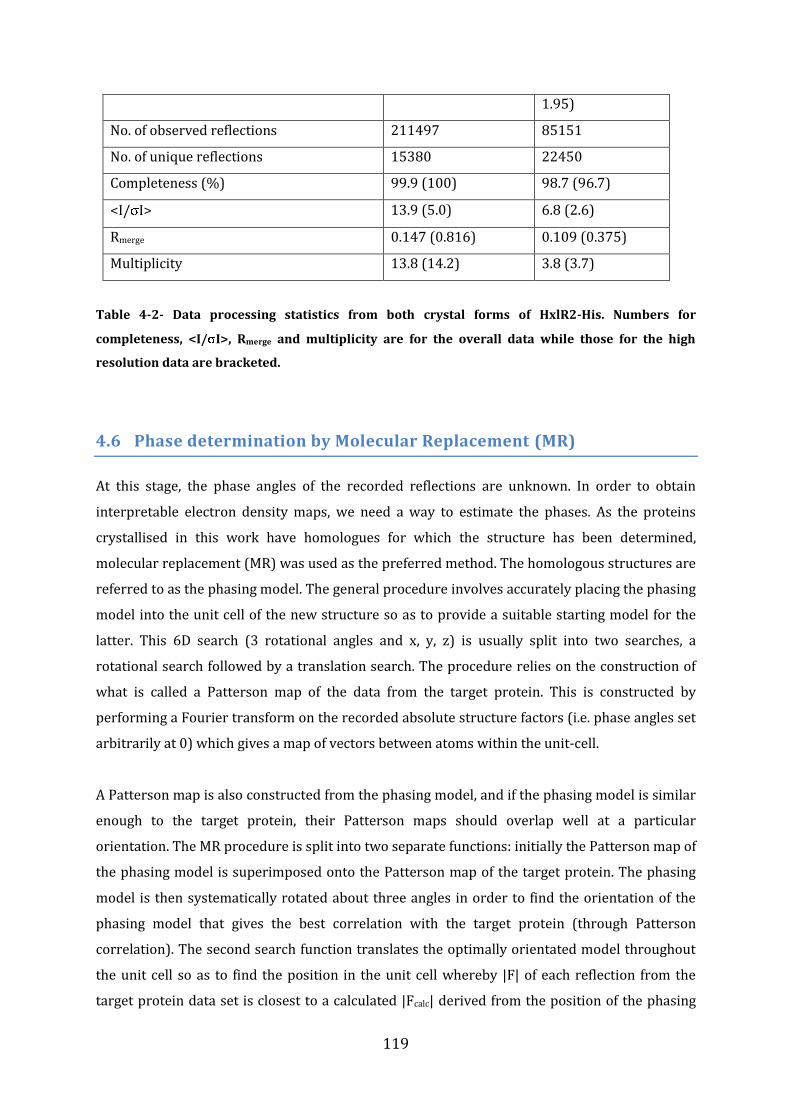
119
1.95)
No. of observed reflections 211497 85151
No. of unique reflections 15380 22450
Completeness (%) 99.9 (100) 98.7 (96.7)
<I/ I> 13.9 (5.0) 6.8 (2.6)
Rmerge 0.147 (0.816) 0.109 (0.375)
Multiplicity 13.8 (14.2) 3.8 (3.7)
Table 4-2- Data processing statistics from both crystal forms of HxlR2-His. Numbers for
completeness, <I/ I>, Rmerge and multiplicity are for the overall data while those for the high
resolution data are bracketed.
4.6 Phase determination by Molecular Replacement (MR)
At this stage, the phase angles of the recorded reflections are unknown. In order to obtain
interpretable electron density maps, we need a way to estimate the phases. As the proteins
crystallised in this work have homologues for which the structure has been determined,
molecular replacement (MR) was used as the preferred method. The homologous structures are
referred to as the phasing model. The general procedure involves accurately placing the phasing
model into the unit cell of the new structure so as to provide a suitable starting model for the
latter. This 6D search (3 rotational angles and x, y, z) is usually split into two searches, a
rotational search followed by a translation search. The procedure relies on the construction of
what is called a Patterson map of the data from the target protein. This is constructed by
performing a Fourier transform on the recorded absolute structure factors (i.e. phase angles set
arbitrarily at 0) which gives a map of vectors between atoms within the unit-cell.
A Patterson map is also constructed from the phasing model, and if the phasing model is similar
enough to the target protein, their Patterson maps should overlap well at a particular
orientation. The MR procedure is split into two separate functions: initially the Patterson map of
the phasing model is superimposed onto the Patterson map of the target protein. The phasing
model is then systematically rotated about three angles in order to find the orientation of the
phasing model that gives the best correlation with the target protein (through Patterson
correlation). The second search function translates the optimally orientated model throughout
the unit cell so as to find the position in the unit cell whereby |F| of each reflection from the
target protein data set is closest to a calculated |Fcalc| derived from the position of the phasing
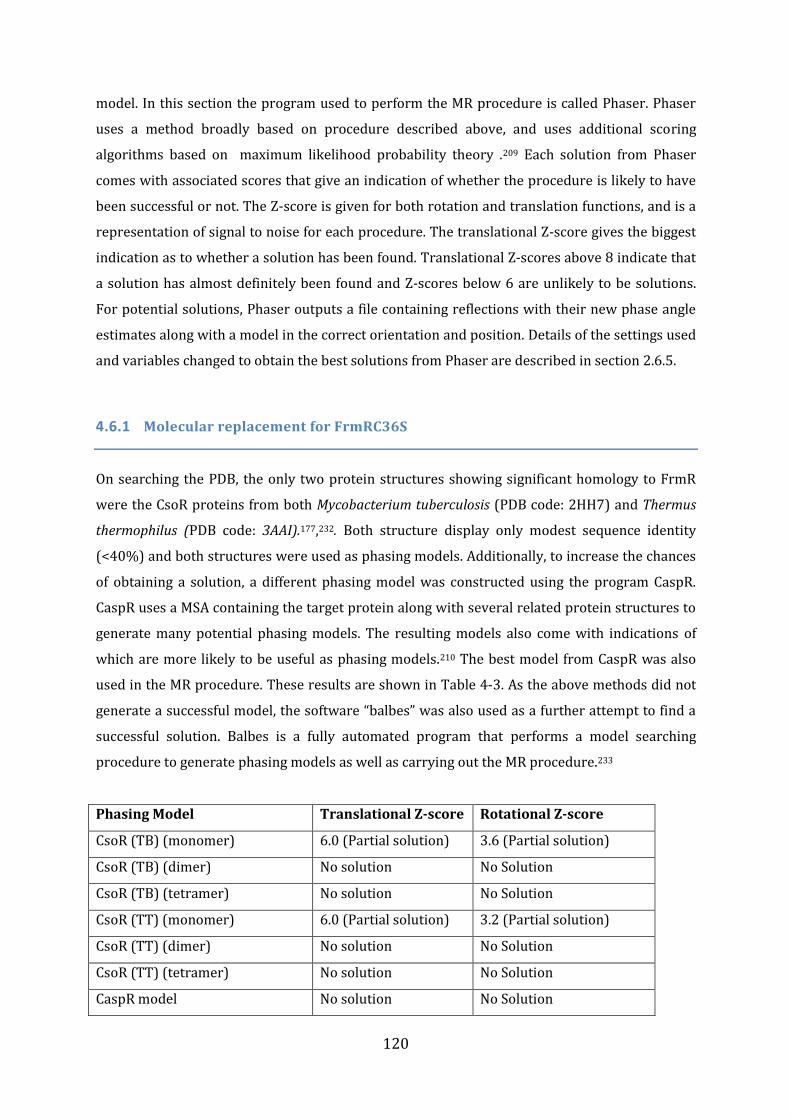
120
model. In this section the program used to perform the MR procedure is called Phaser. Phaser
uses a method broadly based on procedure described above, and uses additional scoring
algorithms based on maximum likelihood probability theory .209 Each solution from Phaser
comes with associated scores that give an indication of whether the procedure is likely to have
been successful or not. The Z-score is given for both rotation and translation functions, and is a
representation of signal to noise for each procedure. The translational Z-score gives the biggest
indication as to whether a solution has been found. Translational Z-scores above 8 indicate that
a solution has almost definitely been found and Z-scores below 6 are unlikely to be solutions.
For potential solutions, Phaser outputs a file containing reflections with their new phase angle
estimates along with a model in the correct orientation and position. Details of the settings used
and variables changed to obtain the best solutions from Phaser are described in section 2.6.5.
4.6.1 Molecular replacement for FrmRC36S
On searching the PDB, the only two protein structures showing significant homology to FrmR
were the CsoR proteins from both Mycobacterium tuberculosis (PDB code: 2HH7) and Thermus
thermophilus (PDB code: 3AAI).177,232. Both structure display only modest sequence identity
(<40%) and both structures were used as phasing models. Additionally, to increase the chances
of obtaining a solution, a different phasing model was constructed using the program CaspR.
CaspR uses a MSA containing the target protein along with several related protein structures to
generate many potential phasing models. The resulting models also come with indications of
which are more likely to be useful as phasing models.210 The best model from CaspR was also
used in the MR procedure. These results are shown in Table 4-3. As the above methods did not
generate a successful model, the software “balbes” was also used as a further attempt to find a
successful solution. Balbes is a fully automated program that performs a model searching
procedure to generate phasing models as well as carrying out the MR procedure.233
Phasing Model Translational Z-score Rotational Z-score
CsoR (TB) (monomer) 6.0 (Partial solution) 3.6 (Partial solution)
CsoR (TB) (dimer) No solution No Solution
CsoR (TB) (tetramer) No solution No Solution
CsoR (TT) (monomer) 6.0 (Partial solution) 3.2 (Partial solution)
CsoR (TT) (dimer) No solution No Solution
CsoR (TT) (tetramer) No solution No Solution
CaspR model No solution No Solution
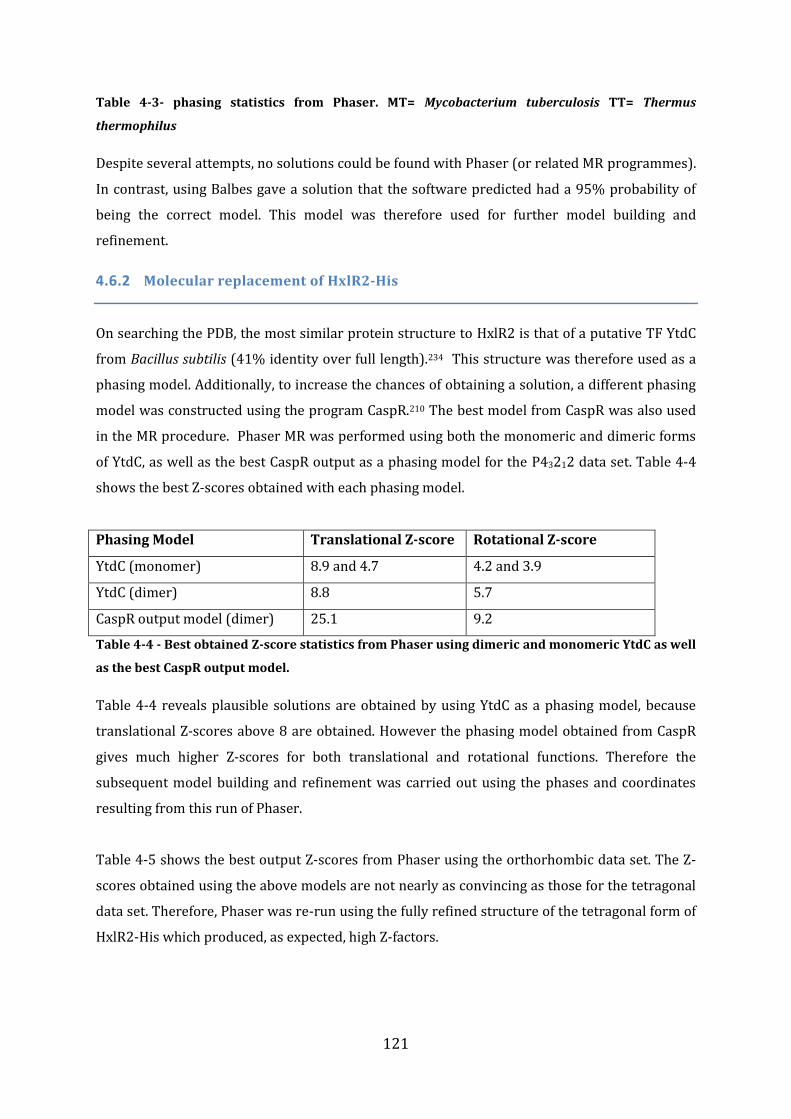
121
Table 4-3- phasing statistics from Phaser. MT= Mycobacterium tuberculosis TT= Thermus
thermophilus
Despite several attempts, no solutions could be found with Phaser (or related MR programmes).
In contrast, using Balbes gave a solution that the software predicted had a 95% probability of
being the correct model. This model was therefore used for further model building and
refinement.
4.6.2 Molecular replacement of HxlR2-His
On searching the PDB, the most similar protein structure to HxlR2 is that of a putative TF YtdC
from Bacillus subtilis (41% identity over full length).234 This structure was therefore used as a
phasing model. Additionally, to increase the chances of obtaining a solution, a different phasing
model was constructed using the program CaspR.210 The best model from CaspR was also used
in the MR procedure. Phaser MR was performed using both the monomeric and dimeric forms
of YtdC, as well as the best CaspR output as a phasing model for the P43212 data set. Table 4-4
shows the best Z-scores obtained with each phasing model.
Phasing Model Translational Z-score Rotational Z-score
YtdC (monomer) 8.9 and 4.7 4.2 and 3.9
YtdC (dimer) 8.8 5.7
CaspR output model (dimer) 25.1 9.2
Table 4-4 - Best obtained Z-score statistics from Phaser using dimeric and monomeric YtdC as well
as the best CaspR output model.
Table 4-4 reveals plausible solutions are obtained by using YtdC as a phasing model, because
translational Z-scores above 8 are obtained. However the phasing model obtained from CaspR
gives much higher Z-scores for both translational and rotational functions. Therefore the
subsequent model building and refinement was carried out using the phases and coordinates
resulting from this run of Phaser.
Table 4-5 shows the best output Z-scores from Phaser using the orthorhombic data set. The Z-
scores obtained using the above models are not nearly as convincing as those for the tetragonal
data set. Therefore, Phaser was re-run using the fully refined structure of the tetragonal form of
HxlR2-His which produced, as expected, high Z-factors.
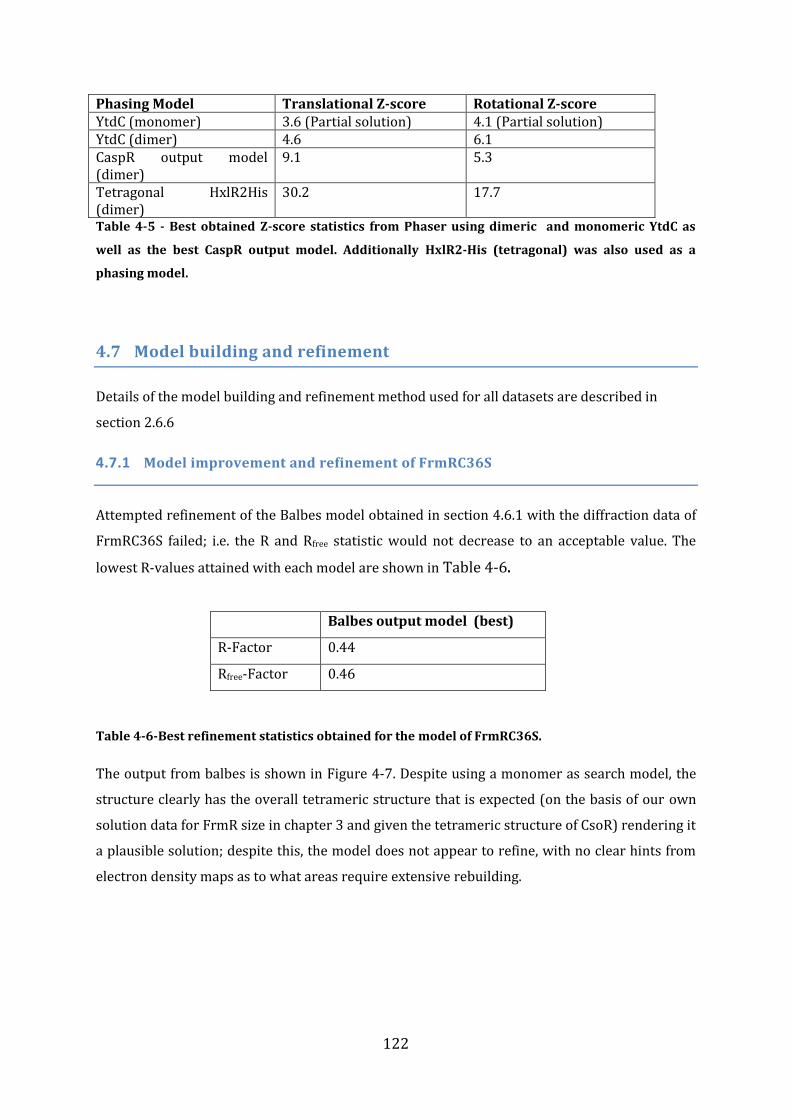
122
Phasing Model Translational Z-score Rotational Z-score YtdC (monomer) 3.6 (Partial solution) 4.1 (Partial solution) YtdC (dimer) 4.6 6.1 CaspR output model (dimer)
9.1 5.3
Tetragonal HxlR2His (dimer)
30.2 17.7
Table 4-5 - Best obtained Z-score statistics from Phaser using dimeric and monomeric YtdC as
well as the best CaspR output model. Additionally HxlR2-His (tetragonal) was also used as a
phasing model.
4.7 Model building and refinement
Details of the model building and refinement method used for all datasets are described in
section 2.6.6
4.7.1 Model improvement and refinement of FrmRC36S
Attempted refinement of the Balbes model obtained in section 4.6.1 with the diffraction data of
FrmRC36S failed; i.e. the R and Rfree statistic would not decrease to an acceptable value. The
lowest R-values attained with each model are shown in Table 4-6.
Balbes output model (best)
R-Factor 0.44
Rfree-Factor 0.46
Table 4-6-Best refinement statistics obtained for the model of FrmRC36S.
The output from balbes is shown in Figure 4-7. Despite using a monomer as search model, the
structure clearly has the overall tetrameric structure that is expected (on the basis of our own
solution data for FrmR size in chapter 3 and given the tetrameric structure of CsoR) rendering it
a plausible solution; despite this, the model does not appear to refine, with no clear hints from
electron density maps as to what areas require extensive rebuilding.
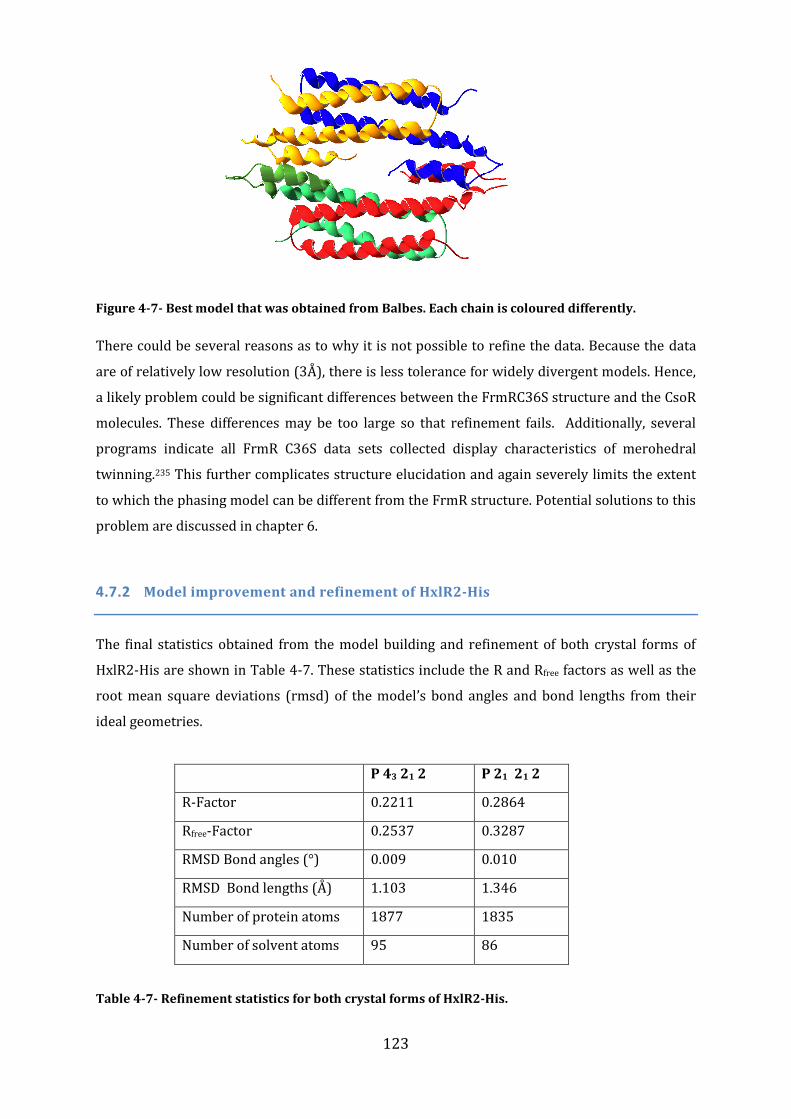
123
Figure 4-7- Best model that was obtained from Balbes. Each chain is coloured differently.
There could be several reasons as to why it is not possible to refine the data. Because the data
are of relatively low resolution (3Å), there is less tolerance for widely divergent models. Hence,
a likely problem could be significant differences between the FrmRC36S structure and the CsoR
molecules. These differences may be too large so that refinement fails. Additionally, several
programs indicate all FrmR C36S data sets collected display characteristics of merohedral
twinning.235 This further complicates structure elucidation and again severely limits the extent
to which the phasing model can be different from the FrmR structure. Potential solutions to this
problem are discussed in chapter 6.
4.7.2 Model improvement and refinement of HxlR2-His
The final statistics obtained from the model building and refinement of both crystal forms of
HxlR2-His are shown in Table 4-7. These statistics include the R and Rfree factors as well as the
root mean square deviations (rmsd) of the model’s bond angles and bond lengths from their
ideal geometries.
P 43 21 2 P 21 21 2
R-Factor 0.2211 0.2864
Rfree-Factor 0.2537 0.3287
RMSD Bond angles (°) 0.009 0.010
RMSD Bond lengths (Å) 1.103 1.346
Number of protein atoms 1877 1835
Number of solvent atoms 95 86
Table 4-7- Refinement statistics for both crystal forms of HxlR2-His.
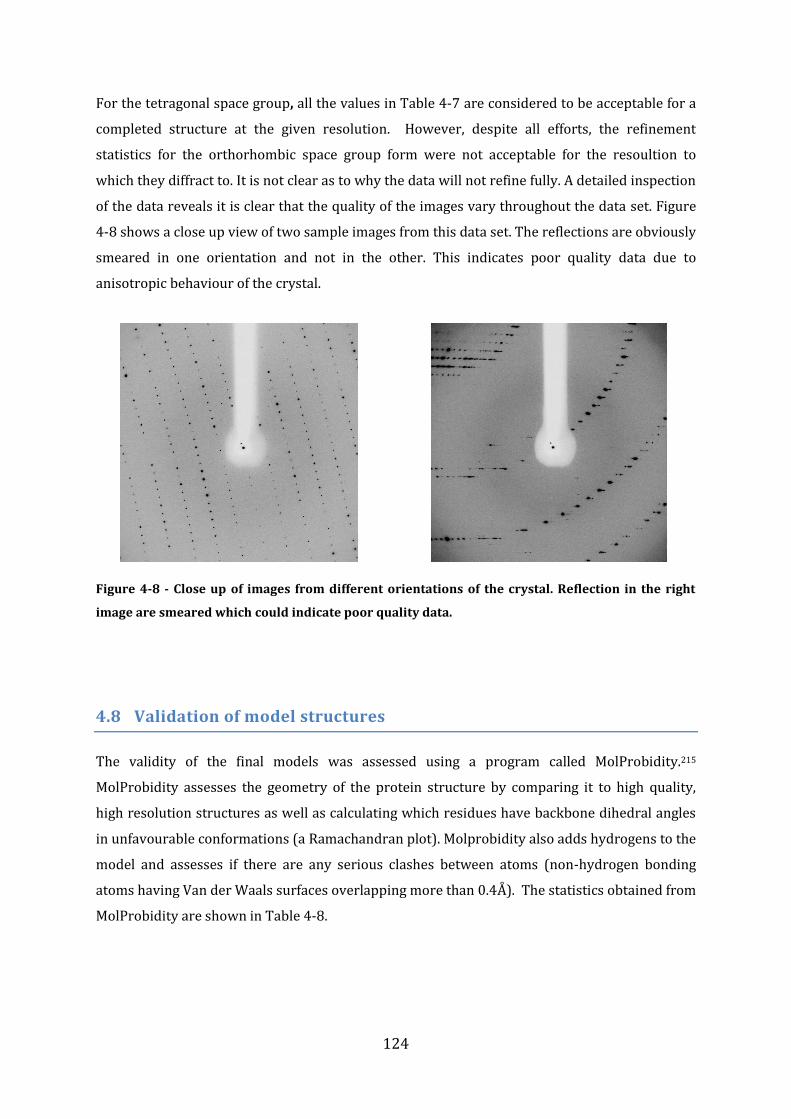
124
For the tetragonal space group, all the values in Table 4-7 are considered to be acceptable for a
completed structure at the given resolution. However, despite all efforts, the refinement
statistics for the orthorhombic space group form were not acceptable for the resoultion to
which they diffract to. It is not clear as to why the data will not refine fully. A detailed inspection
of the data reveals it is clear that the quality of the images vary throughout the data set. Figure
4-8 shows a close up view of two sample images from this data set. The reflections are obviously
smeared in one orientation and not in the other. This indicates poor quality data due to
anisotropic behaviour of the crystal.
Figure 4-8 - Close up of images from different orientations of the crystal. Reflection in the right
image are smeared which could indicate poor quality data.
4.8 Validation of model structures
The validity of the final models was assessed using a program called MolProbidity.215
MolProbidity assesses the geometry of the protein structure by comparing it to high quality,
high resolution structures as well as calculating which residues have backbone dihedral angles
in unfavourable conformations (a Ramachandran plot). Molprobidity also adds hydrogens to the
model and assesses if there are any serious clashes between atoms (non-hydrogen bonding
atoms having Van der Waals surfaces overlapping more than 0.4Å). The statistics obtained from
MolProbidity are shown in Table 4-8.
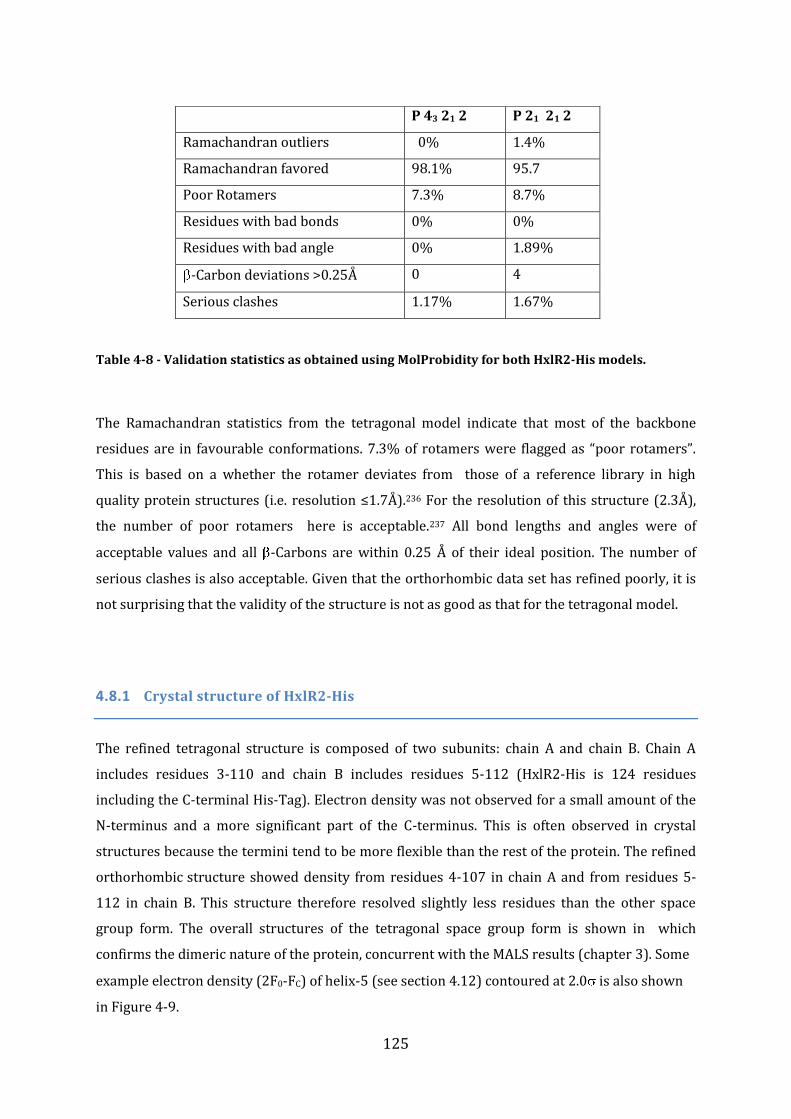
125
Table 4-8 - Validation statistics as obtained using MolProbidity for both HxlR2-His models.
The Ramachandran statistics from the tetragonal model indicate that most of the backbone
residues are in favourable conformations. 7.3% of rotamers were flagged as “poor rotamers”.
This is based on a whether the rotamer deviates from those of a reference library in high
quality protein structures (i.e. resolution ≤1.7Å).236 For the resolution of this structure (2.3Å),
the number of poor rotamers here is acceptable.237 All bond lengths and angles were of
acceptable values and all -Carbons are within 0.25 Å of their ideal position. The number of
serious clashes is also acceptable. Given that the orthorhombic data set has refined poorly, it is
not surprising that the validity of the structure is not as good as that for the tetragonal model.
4.8.1 Crystal structure of HxlR2-His
The refined tetragonal structure is composed of two subunits: chain A and chain B. Chain A
includes residues 3-110 and chain B includes residues 5-112 (HxlR2-His is 124 residues
including the C-terminal His-Tag). Electron density was not observed for a small amount of the
N-terminus and a more significant part of the C-terminus. This is often observed in crystal
structures because the termini tend to be more flexible than the rest of the protein. The refined
orthorhombic structure showed density from residues 4-107 in chain A and from residues 5-
112 in chain B. This structure therefore resolved slightly less residues than the other space
group form. The overall structures of the tetragonal space group form is shown in which
confirms the dimeric nature of the protein, concurrent with the MALS results (chapter 3). Some
example electron density (2F0-FC) of helix-5 (see section 4.12) contoured at 2.0 is also shown
in Figure 4-9.
P 43 21 2 P 21 21 2
Ramachandran outliers 0% 1.4%
Ramachandran favored 98.1% 95.7
Poor Rotamers 7.3% 8.7%
Residues with bad bonds 0% 0%
Residues with bad angle 0% 1.89%
-Carbon deviations >0.25Å 0 4
Serious clashes 1.17% 1.67%
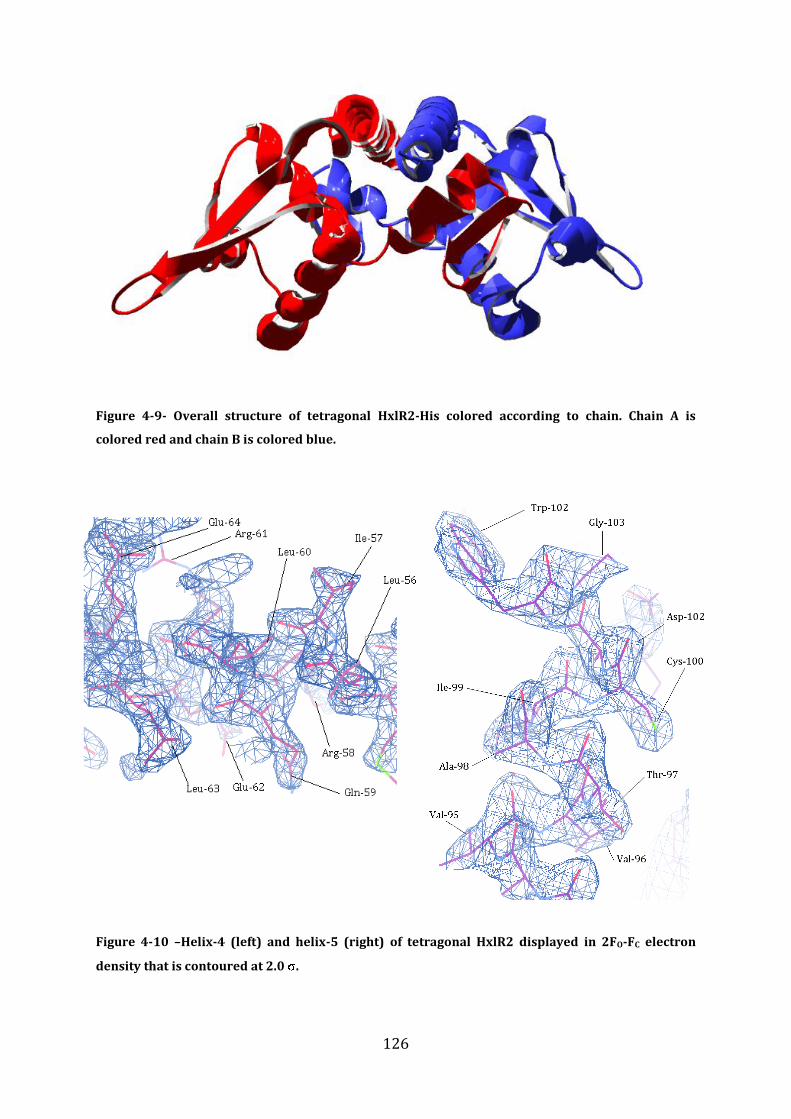
126
Figure 4-9- Overall structure of tetragonal HxlR2-His colored according to chain. Chain A is
colored red and chain B is colored blue.
Figure 4-10 –Helix-4 (left) and helix-5 (right) of tetragonal HxlR2 displayed in 2FO-FC electron
density that is contoured at 2.0 .
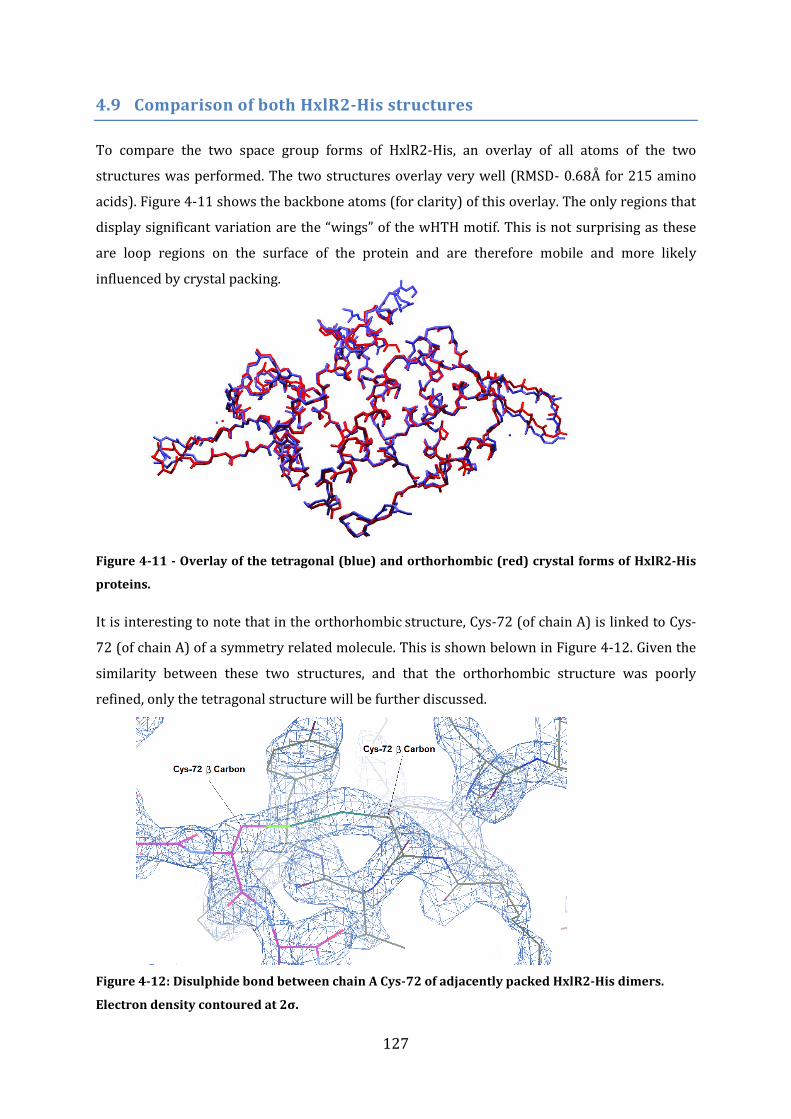
127
4.9 Comparison of both HxlR2-His structures
To compare the two space group forms of HxlR2-His, an overlay of all atoms of the two
structures was performed. The two structures overlay very well (RMSD- 0.68Å for 215 amino
acids). Figure 4-11 shows the backbone atoms (for clarity) of this overlay. The only regions that
display significant variation are the “wings” of the wHTH motif. This is not surprising as these
are loop regions on the surface of the protein and are therefore mobile and more likely
influenced by crystal packing.
Figure 4-11 - Overlay of the tetragonal (blue) and orthorhombic (red) crystal forms of HxlR2-His
proteins.
It is interesting to note that in the orthorhombic structure, Cys-72 (of chain A) is linked to Cys-
72 (of chain A) of a symmetry related molecule. This is shown belown in Figure 4-12. Given the
similarity between these two structures, and that the orthorhombic structure was poorly
refined, only the tetragonal structure will be further discussed.
Figure 4-12: Disulphide bond between chain A Cys-72 of adjacently packed HxlR2-His dimers.
Electron density contoured at 2σ.
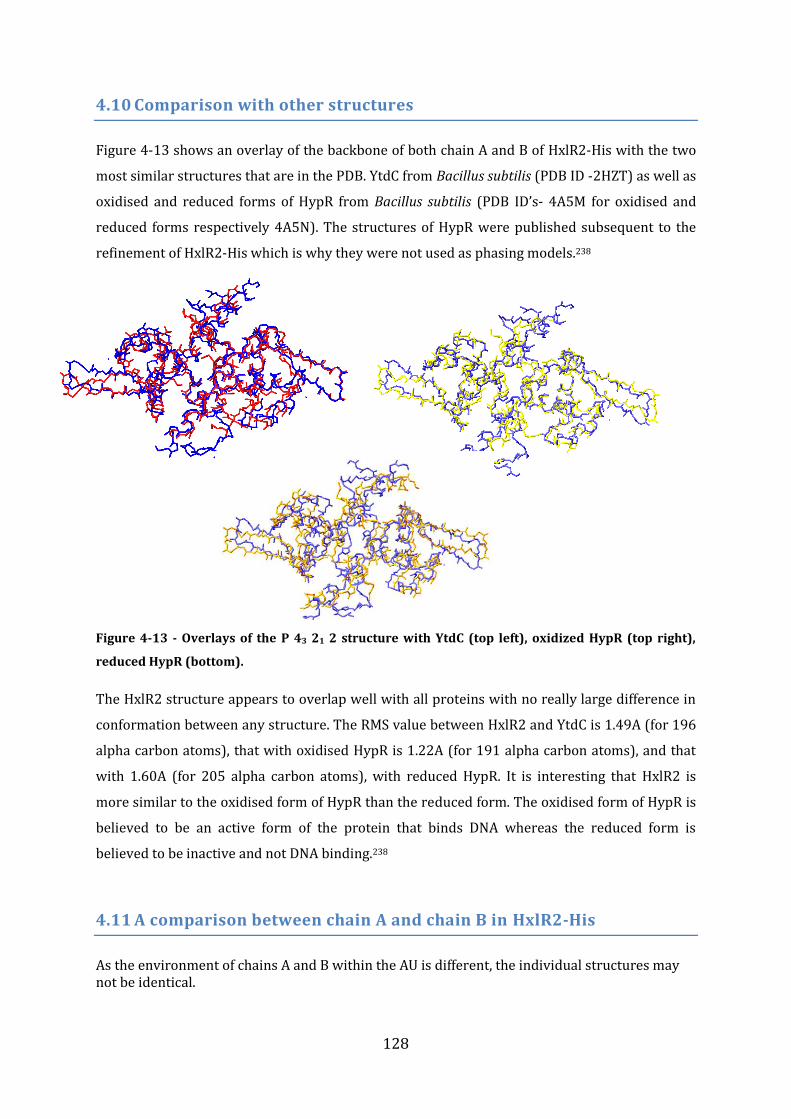
128
4.10 Comparison with other structures
Figure 4-13 shows an overlay of the backbone of both chain A and B of HxlR2-His with the two
most similar structures that are in the PDB. YtdC from Bacillus subtilis (PDB ID -2HZT) as well as
oxidised and reduced forms of HypR from Bacillus subtilis (PDB ID’s- 4A5M for oxidised and
reduced forms respectively 4A5N). The structures of HypR were published subsequent to the
refinement of HxlR2-His which is why they were not used as phasing models.238
Figure 4-13 - Overlays of the P 43 21 2 structure with YtdC (top left), oxidized HypR (top right),
reduced HypR (bottom).
The HxlR2 structure appears to overlap well with all proteins with no really large difference in
conformation between any structure. The RMS value between HxlR2 and YtdC is 1.49A (for 196
alpha carbon atoms), that with oxidised HypR is 1.22A (for 191 alpha carbon atoms), and that
with 1.60A (for 205 alpha carbon atoms), with reduced HypR. It is interesting that HxlR2 is
more similar to the oxidised form of HypR than the reduced form. The oxidised form of HypR is
believed to be an active form of the protein that binds DNA whereas the reduced form is
believed to be inactive and not DNA binding.238
4.11 A comparison between chain A and chain B in HxlR2-His
As the environment of chains A and B within the AU is different, the individual structures may not be identical.
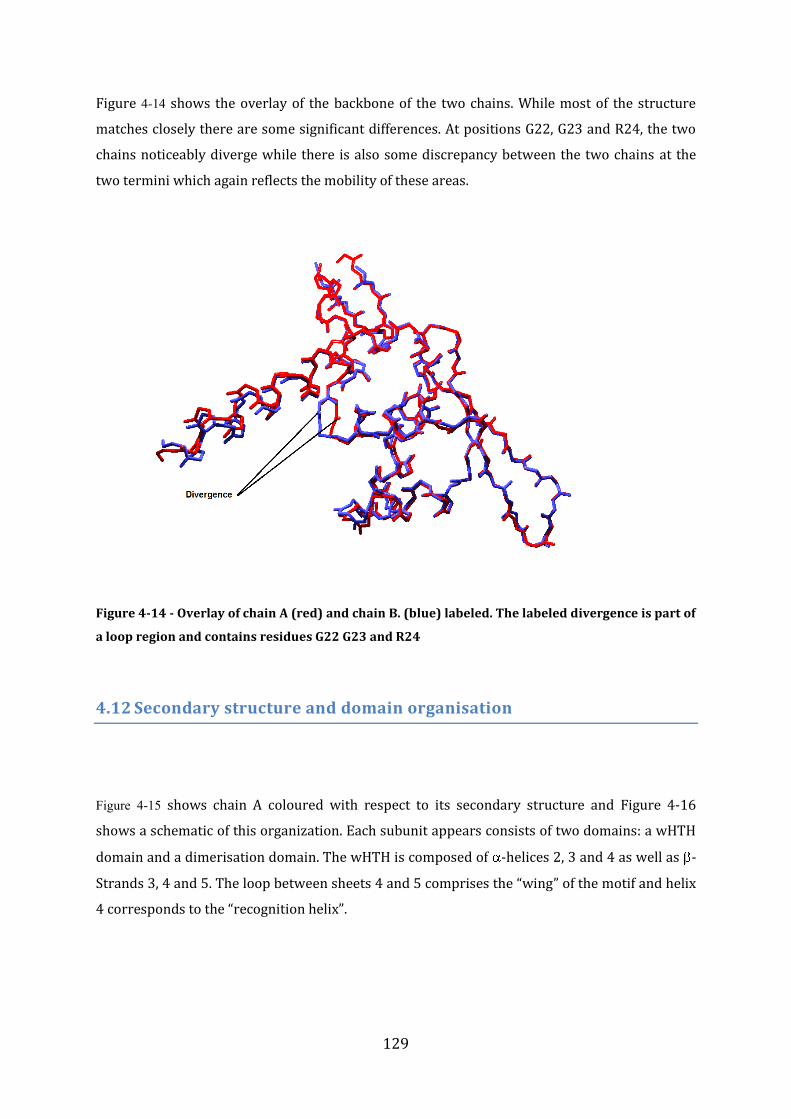
129
Figure 4-14 shows the overlay of the backbone of the two chains. While most of the structure
matches closely there are some significant differences. At positions G22, G23 and R24, the two
chains noticeably diverge while there is also some discrepancy between the two chains at the
two termini which again reflects the mobility of these areas.
Figure 4-14 - Overlay of chain A (red) and chain B. (blue) labeled. The labeled divergence is part of
a loop region and contains residues G22 G23 and R24
4.12 Secondary structure and domain organisation
Figure 4-15 shows chain A coloured with respect to its secondary structure and Figure 4-16
shows a schematic of this organization. Each subunit appears consists of two domains: a wHTH
domain and a dimerisation domain. The wHTH is composed of -helices 2, 3 and 4 as well as -
Strands 3, 4 and 5. The loop between sheets 4 and 5 comprises the “wing” of the motif and helix
4 corresponds to the “recognition helix”.
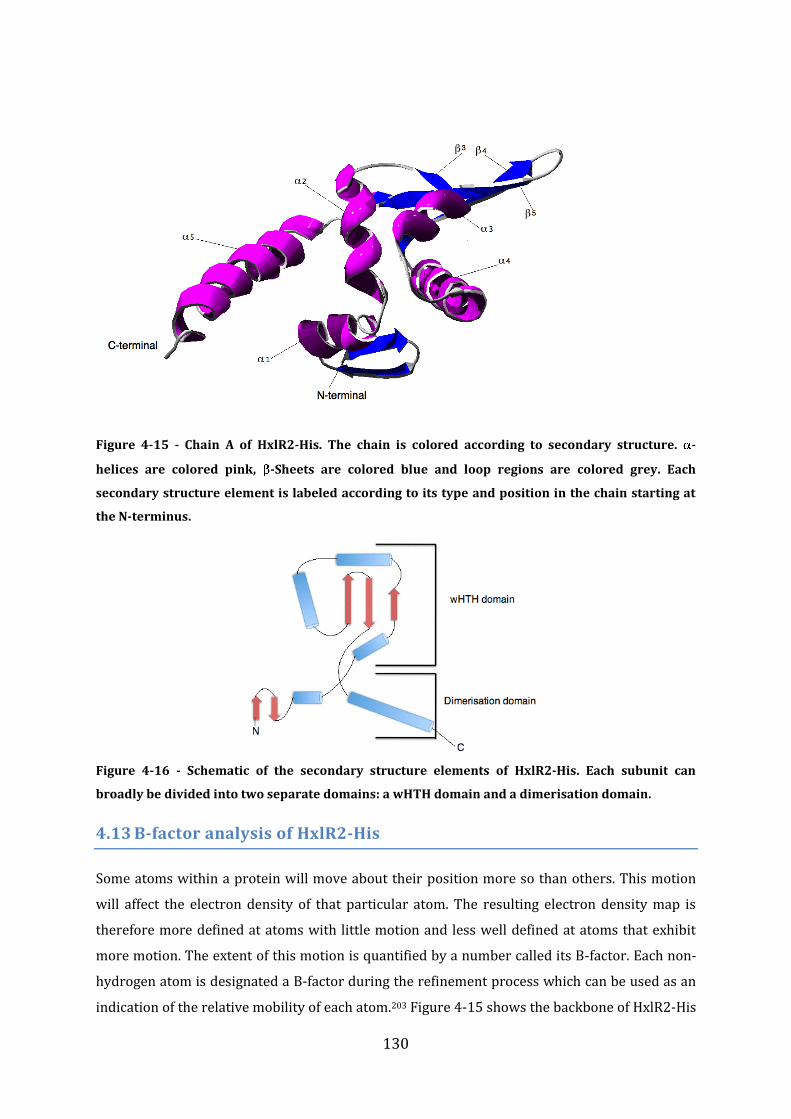
130
Figure 4-15 - Chain A of HxlR2-His. The chain is colored according to secondary structure. -
helices are colored pink, -Sheets are colored blue and loop regions are colored grey. Each
secondary structure element is labeled according to its type and position in the chain starting at
the N-terminus.
Figure 4-16 - Schematic of the secondary structure elements of HxlR2-His. Each subunit can
broadly be divided into two separate domains: a wHTH domain and a dimerisation domain.
4.13 B-factor analysis of HxlR2-His
Some atoms within a protein will move about their position more so than others. This motion
will affect the electron density of that particular atom. The resulting electron density map is
therefore more defined at atoms with little motion and less well defined at atoms that exhibit
more motion. The extent of this motion is quantified by a number called its B-factor. Each non-
hydrogen atom is designated a B-factor during the refinement process which can be used as an
indication of the relative mobility of each atom.203 Figure 4-15 shows the backbone of HxlR2-His
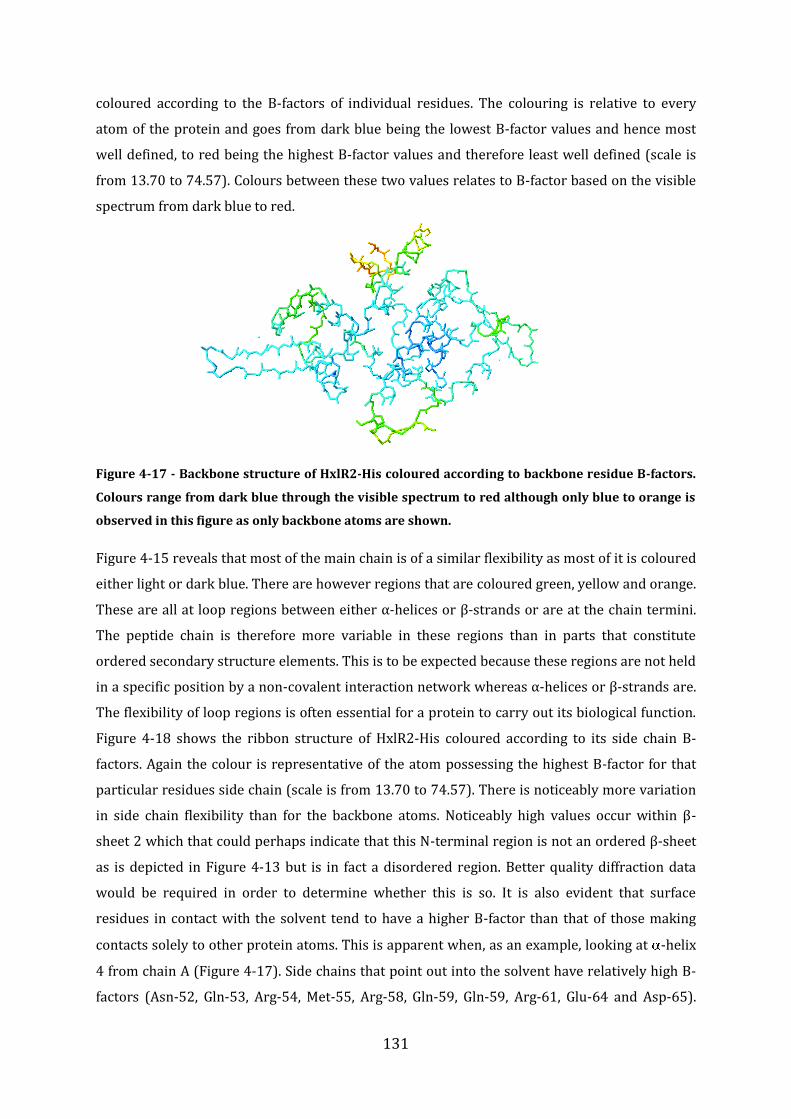
131
coloured according to the B-factors of individual residues. The colouring is relative to every
atom of the protein and goes from dark blue being the lowest B-factor values and hence most
well defined, to red being the highest B-factor values and therefore least well defined (scale is
from 13.70 to 74.57). Colours between these two values relates to B-factor based on the visible
spectrum from dark blue to red.
Figure 4-17 - Backbone structure of HxlR2-His coloured according to backbone residue B-factors.
Colours range from dark blue through the visible spectrum to red although only blue to orange is
observed in this figure as only backbone atoms are shown.
Figure 4-15 reveals that most of the main chain is of a similar flexibility as most of it is coloured
either light or dark blue. There are however regions that are coloured green, yellow and orange.
These are all at loop regions between either α-helices or β-strands or are at the chain termini.
The peptide chain is therefore more variable in these regions than in parts that constitute
ordered secondary structure elements. This is to be expected because these regions are not held
in a specific position by a non-covalent interaction network whereas α-helices or β-strands are.
The flexibility of loop regions is often essential for a protein to carry out its biological function.
Figure 4-18 shows the ribbon structure of HxlR2-His coloured according to its side chain B-
factors. Again the colour is representative of the atom possessing the highest B-factor for that
particular residues side chain (scale is from 13.70 to 74.57). There is noticeably more variation
in side chain flexibility than for the backbone atoms. Noticeably high values occur within β-
sheet 2 which that could perhaps indicate that this N-terminal region is not an ordered β-sheet
as is depicted in Figure 4-13 but is in fact a disordered region. Better quality diffraction data
would be required in order to determine whether this is so. It is also evident that surface
residues in contact with the solvent tend to have a higher B-factor than that of those making
contacts solely to other protein atoms. This is apparent when, as an example, looking at -helix
4 from chain A (Figure 4-17). Side chains that point out into the solvent have relatively high B-
factors (Asn-52, Gln-53, Arg-54, Met-55, Arg-58, Gln-59, Gln-59, Arg-61, Glu-64 and Asp-65).
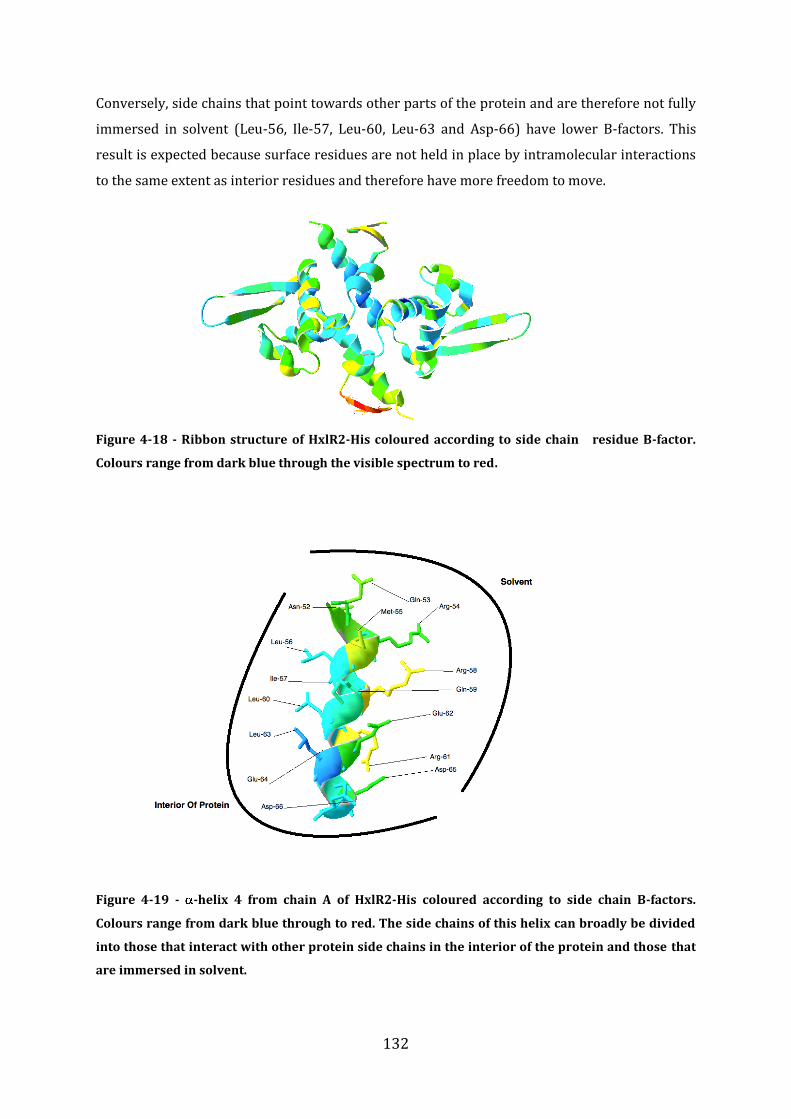
132
Conversely, side chains that point towards other parts of the protein and are therefore not fully
immersed in solvent (Leu-56, Ile-57, Leu-60, Leu-63 and Asp-66) have lower B-factors. This
result is expected because surface residues are not held in place by intramolecular interactions
to the same extent as interior residues and therefore have more freedom to move.
Figure 4-18 - Ribbon structure of HxlR2-His coloured according to side chain residue B-factor.
Colours range from dark blue through the visible spectrum to red.
Figure 4-19 - -helix 4 from chain A of HxlR2-His coloured according to side chain B-factors.
Colours range from dark blue through to red. The side chains of this helix can broadly be divided
into those that interact with other protein side chains in the interior of the protein and those that
are immersed in solvent.
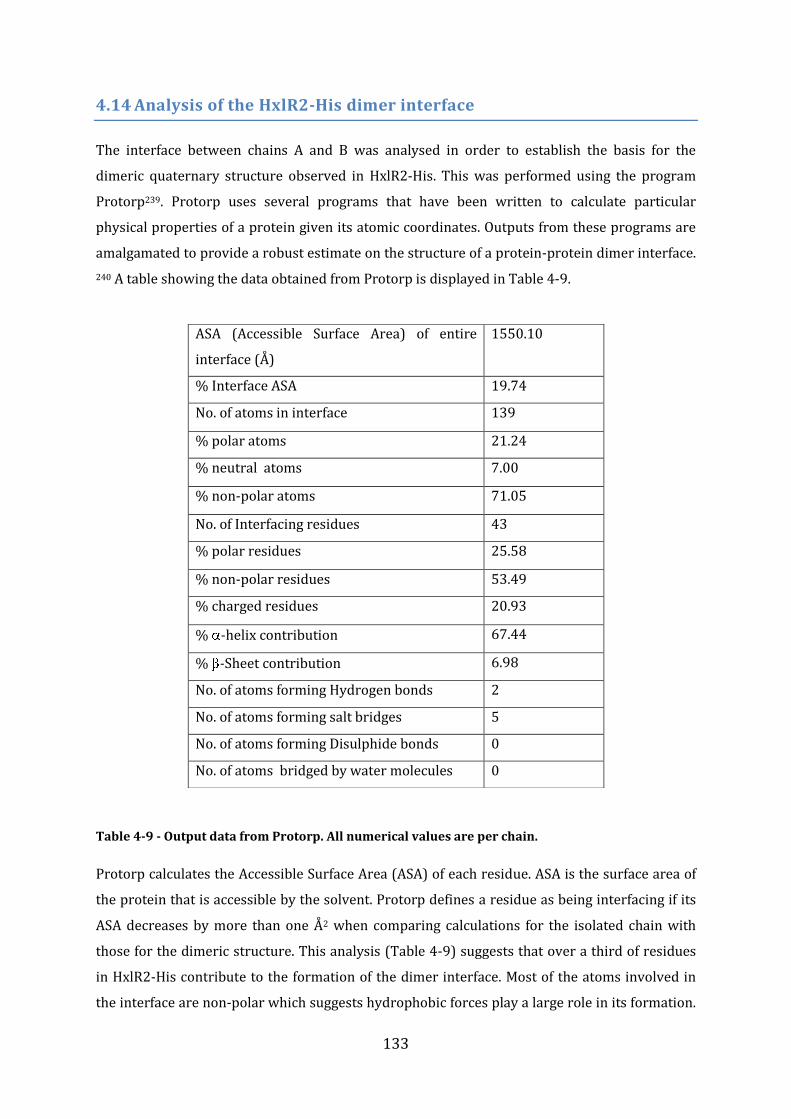
133
4.14 Analysis of the HxlR2-His dimer interface
The interface between chains A and B was analysed in order to establish the basis for the
dimeric quaternary structure observed in HxlR2-His. This was performed using the program
Protorp239. Protorp uses several programs that have been written to calculate particular
physical properties of a protein given its atomic coordinates. Outputs from these programs are
amalgamated to provide a robust estimate on the structure of a protein-protein dimer interface.
240 A table showing the data obtained from Protorp is displayed in Table 4-9.
Table 4-9 - Output data from Protorp. All numerical values are per chain.
Protorp calculates the Accessible Surface Area (ASA) of each residue. ASA is the surface area of
the protein that is accessible by the solvent. Protorp defines a residue as being interfacing if its
ASA decreases by more than one Å2 when comparing calculations for the isolated chain with
those for the dimeric structure. This analysis (Table 4-9) suggests that over a third of residues
in HxlR2-His contribute to the formation of the dimer interface. Most of the atoms involved in
the interface are non-polar which suggests hydrophobic forces play a large role in its formation.
ASA (Accessible Surface Area) of entire
interface (Å)
1550.10
% Interface ASA 19.74
No. of atoms in interface 139
% polar atoms 21.24
% neutral atoms 7.00
% non-polar atoms 71.05
No. of Interfacing residues 43
% polar residues 25.58
% non-polar residues 53.49
% charged residues 20.93
% -helix contribution 67.44
% -Sheet contribution 6.98
No. of atoms forming Hydrogen bonds 2
No. of atoms forming salt bridges 5
No. of atoms forming Disulphide bonds 0
No. of atoms bridged by water molecules 0
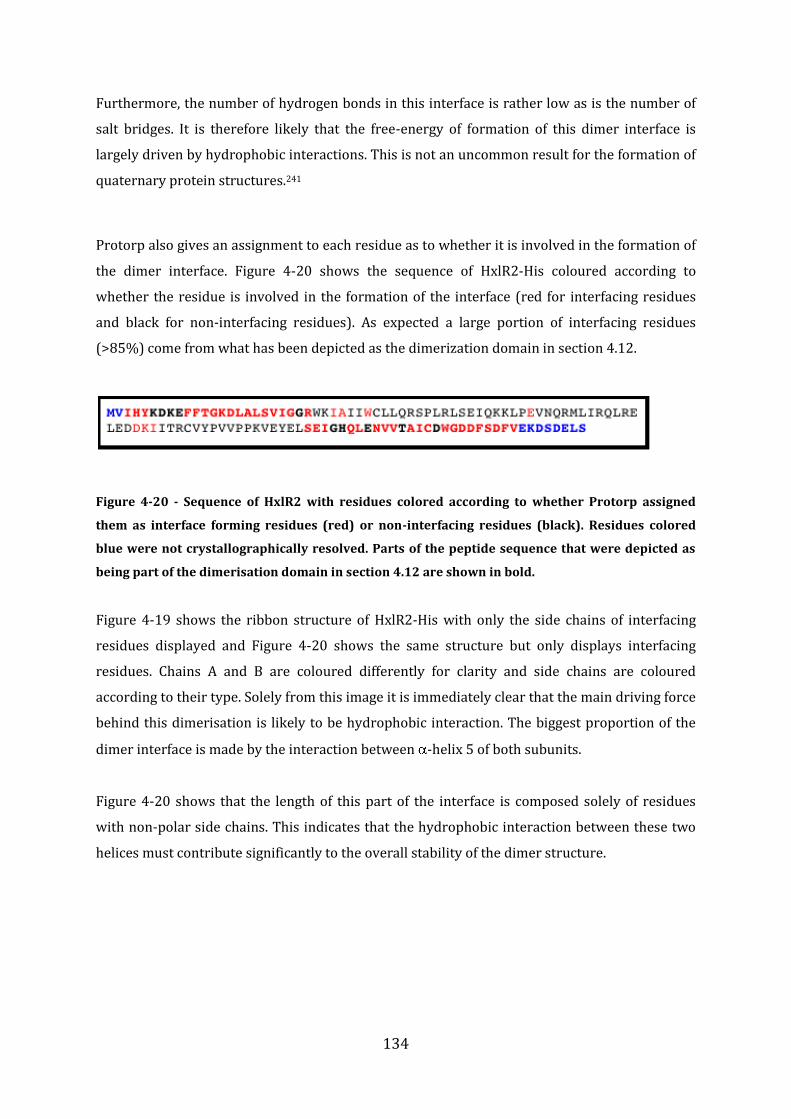
134
Furthermore, the number of hydrogen bonds in this interface is rather low as is the number of
salt bridges. It is therefore likely that the free-energy of formation of this dimer interface is
largely driven by hydrophobic interactions. This is not an uncommon result for the formation of
quaternary protein structures.241
Protorp also gives an assignment to each residue as to whether it is involved in the formation of
the dimer interface. Figure 4-20 shows the sequence of HxlR2-His coloured according to
whether the residue is involved in the formation of the interface (red for interfacing residues
and black for non-interfacing residues). As expected a large portion of interfacing residues
(>85%) come from what has been depicted as the dimerization domain in section 4.12.
Figure 4-20 - Sequence of HxlR2 with residues colored according to whether Protorp assigned
them as interface forming residues (red) or non-interfacing residues (black). Residues colored
blue were not crystallographically resolved. Parts of the peptide sequence that were depicted as
being part of the dimerisation domain in section 4.12 are shown in bold.
Figure 4-19 shows the ribbon structure of HxlR2-His with only the side chains of interfacing
residues displayed and Figure 4-20 shows the same structure but only displays interfacing
residues. Chains A and B are coloured differently for clarity and side chains are coloured
according to their type. Solely from this image it is immediately clear that the main driving force
behind this dimerisation is likely to be hydrophobic interaction. The biggest proportion of the
dimer interface is made by the interaction between -helix 5 of both subunits.
Figure 4-20 shows that the length of this part of the interface is composed solely of residues
with non-polar side chains. This indicates that the hydrophobic interaction between these two
helices must contribute significantly to the overall stability of the dimer structure.
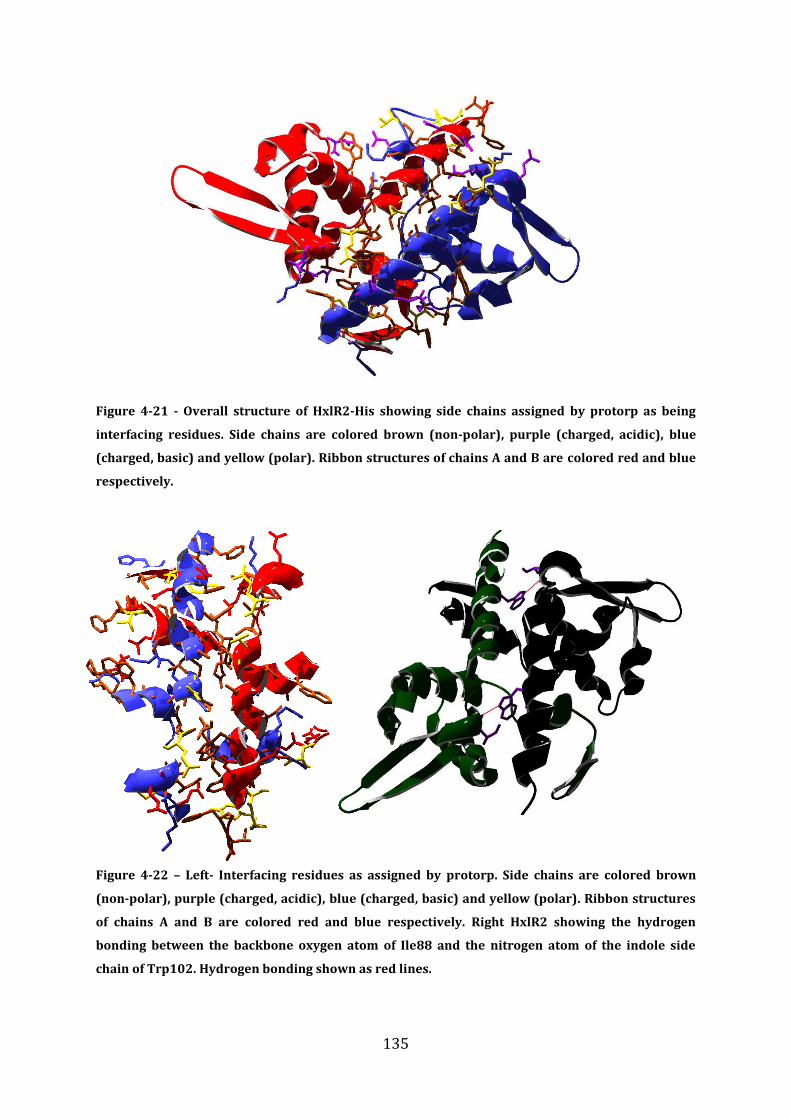
135
Figure 4-21 - Overall structure of HxlR2-His showing side chains assigned by protorp as being
interfacing residues. Side chains are colored brown (non-polar), purple (charged, acidic), blue
(charged, basic) and yellow (polar). Ribbon structures of chains A and B are colored red and blue
respectively.
Figure 4-22 – Left- Interfacing residues as assigned by protorp. Side chains are colored brown
(non-polar), purple (charged, acidic), blue (charged, basic) and yellow (polar). Ribbon structures
of chains A and B are colored red and blue respectively. Right HxlR2 showing the hydrogen
bonding between the backbone oxygen atom of Ile88 and the nitrogen atom of the indole side
chain of Trp102. Hydrogen bonding shown as red lines.
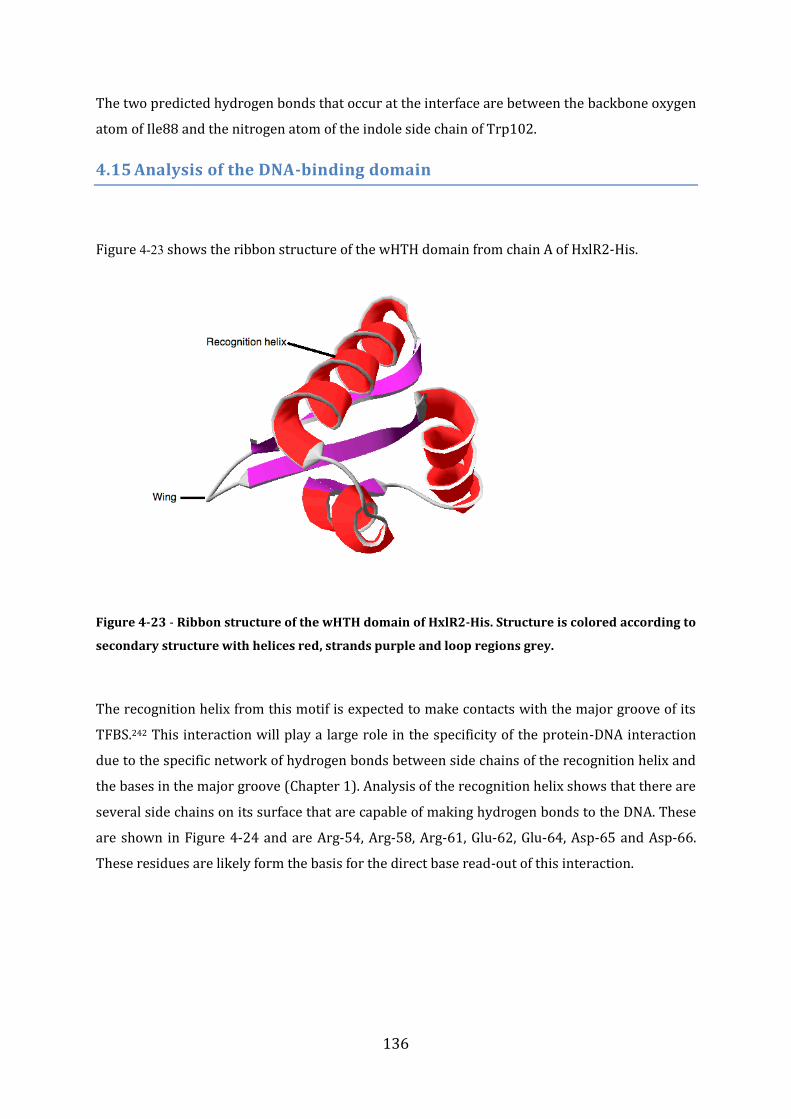
136
The two predicted hydrogen bonds that occur at the interface are between the backbone oxygen
atom of Ile88 and the nitrogen atom of the indole side chain of Trp102.
4.15 Analysis of the DNA-binding domain
Figure 4-23 shows the ribbon structure of the wHTH domain from chain A of HxlR2-His.
Figure 4-23 - Ribbon structure of the wHTH domain of HxlR2-His. Structure is colored according to
secondary structure with helices red, strands purple and loop regions grey.
The recognition helix from this motif is expected to make contacts with the major groove of its
TFBS.242 This interaction will play a large role in the specificity of the protein-DNA interaction
due to the specific network of hydrogen bonds between side chains of the recognition helix and
the bases in the major groove (Chapter 1). Analysis of the recognition helix shows that there are
several side chains on its surface that are capable of making hydrogen bonds to the DNA. These
are shown in Figure 4-24 and are Arg-54, Arg-58, Arg-61, Glu-62, Glu-64, Asp-65 and Asp-66.
These residues are likely form the basis for the direct base read-out of this interaction.
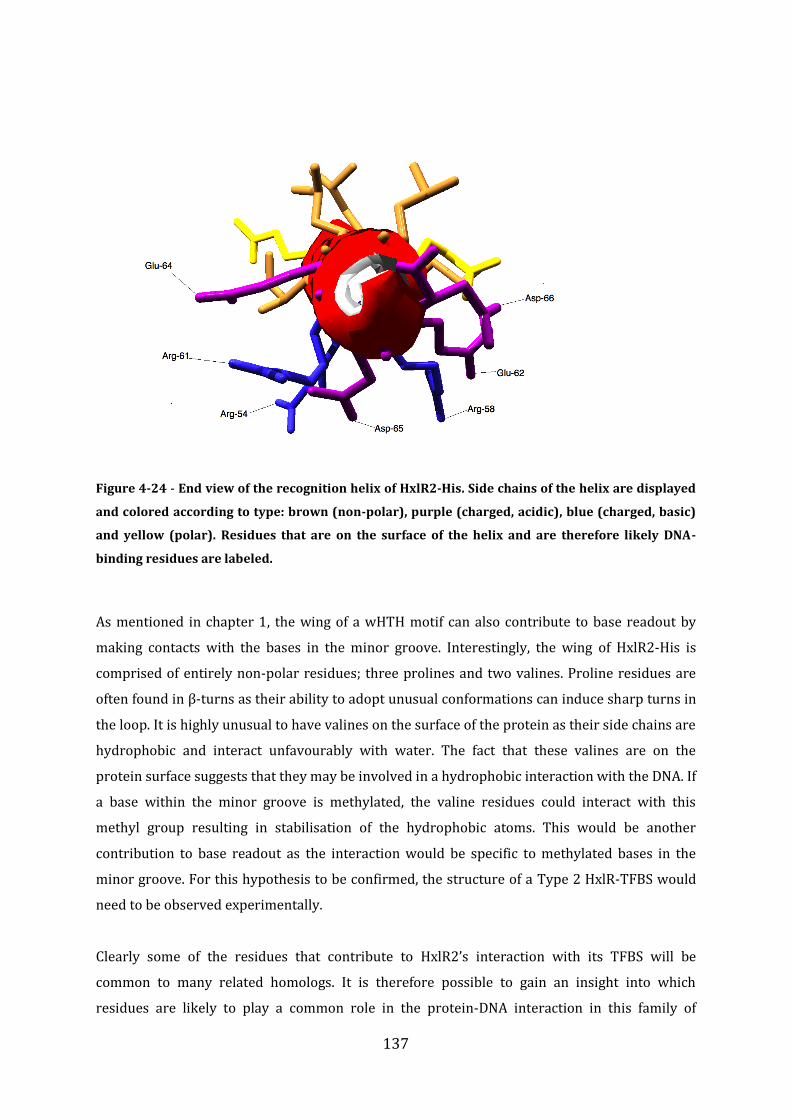
137
Figure 4-24 - End view of the recognition helix of HxlR2-His. Side chains of the helix are displayed
and colored according to type: brown (non-polar), purple (charged, acidic), blue (charged, basic)
and yellow (polar). Residues that are on the surface of the helix and are therefore likely DNA-
binding residues are labeled.
As mentioned in chapter 1, the wing of a wHTH motif can also contribute to base readout by
making contacts with the bases in the minor groove. Interestingly, the wing of HxlR2-His is
comprised of entirely non-polar residues; three prolines and two valines. Proline residues are
often found in β-turns as their ability to adopt unusual conformations can induce sharp turns in
the loop. It is highly unusual to have valines on the surface of the protein as their side chains are
hydrophobic and interact unfavourably with water. The fact that these valines are on the
protein surface suggests that they may be involved in a hydrophobic interaction with the DNA. If
a base within the minor groove is methylated, the valine residues could interact with this
methyl group resulting in stabilisation of the hydrophobic atoms. This would be another
contribution to base readout as the interaction would be specific to methylated bases in the
minor groove. For this hypothesis to be confirmed, the structure of a Type 2 HxlR-TFBS would
need to be observed experimentally.
Clearly some of the residues that contribute to HxlR2’s interaction with its TFBS will be
common to many related homologs. It is therefore possible to gain an insight into which
residues are likely to play a common role in the protein-DNA interaction in this family of
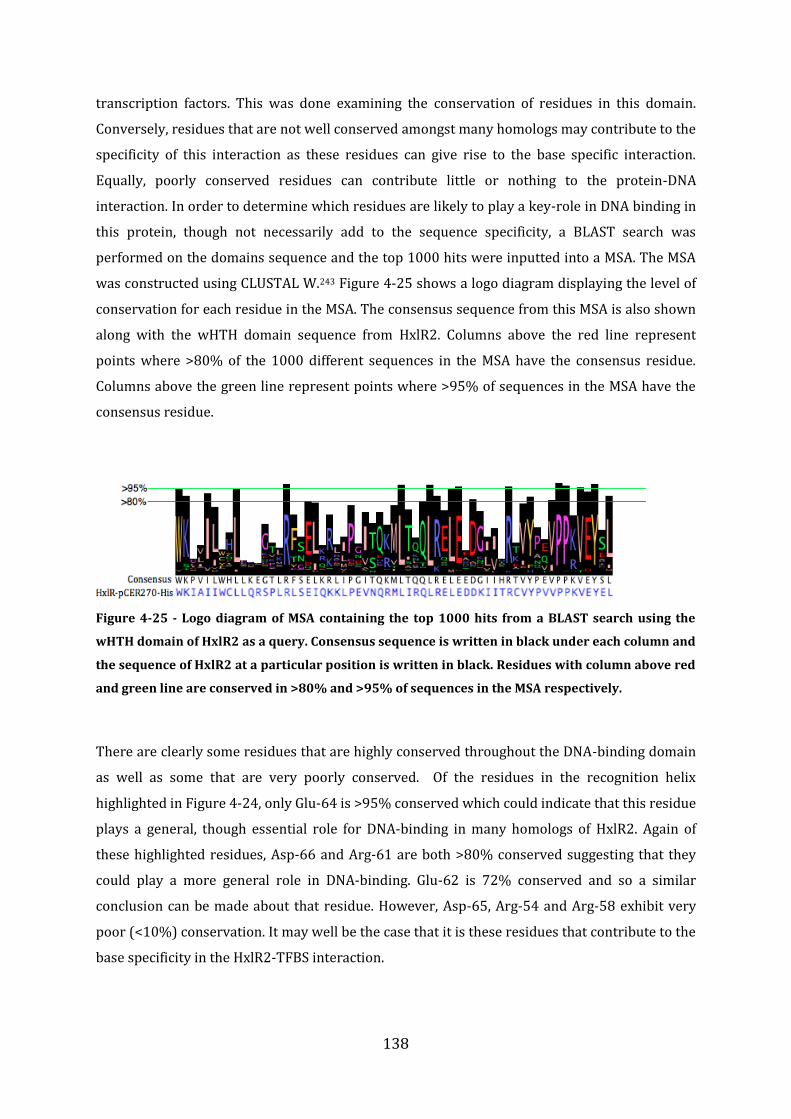
138
transcription factors. This was done examining the conservation of residues in this domain.
Conversely, residues that are not well conserved amongst many homologs may contribute to the
specificity of this interaction as these residues can give rise to the base specific interaction.
Equally, poorly conserved residues can contribute little or nothing to the protein-DNA
interaction. In order to determine which residues are likely to play a key-role in DNA binding in
this protein, though not necessarily add to the sequence specificity, a BLAST search was
performed on the domains sequence and the top 1000 hits were inputted into a MSA. The MSA
was constructed using CLUSTAL W.243 Figure 4-25 shows a logo diagram displaying the level of
conservation for each residue in the MSA. The consensus sequence from this MSA is also shown
along with the wHTH domain sequence from HxlR2. Columns above the red line represent
points where >80% of the 1000 different sequences in the MSA have the consensus residue.
Columns above the green line represent points where >95% of sequences in the MSA have the
consensus residue.
Figure 4-25 - Logo diagram of MSA containing the top 1000 hits from a BLAST search using the
wHTH domain of HxlR2 as a query. Consensus sequence is written in black under each column and
the sequence of HxlR2 at a particular position is written in black. Residues with column above red
and green line are conserved in >80% and >95% of sequences in the MSA respectively.
There are clearly some residues that are highly conserved throughout the DNA-binding domain
as well as some that are very poorly conserved. Of the residues in the recognition helix
highlighted in Figure 4-24, only Glu-64 is >95% conserved which could indicate that this residue
plays a general, though essential role for DNA-binding in many homologs of HxlR2. Again of
these highlighted residues, Asp-66 and Arg-61 are both >80% conserved suggesting that they
could play a more general role in DNA-binding. Glu-62 is 72% conserved and so a similar
conclusion can be made about that residue. However, Asp-65, Arg-54 and Arg-58 exhibit very
poor (<10%) conservation. It may well be the case that it is these residues that contribute to the
base specificity in the HxlR2-TFBS interaction.
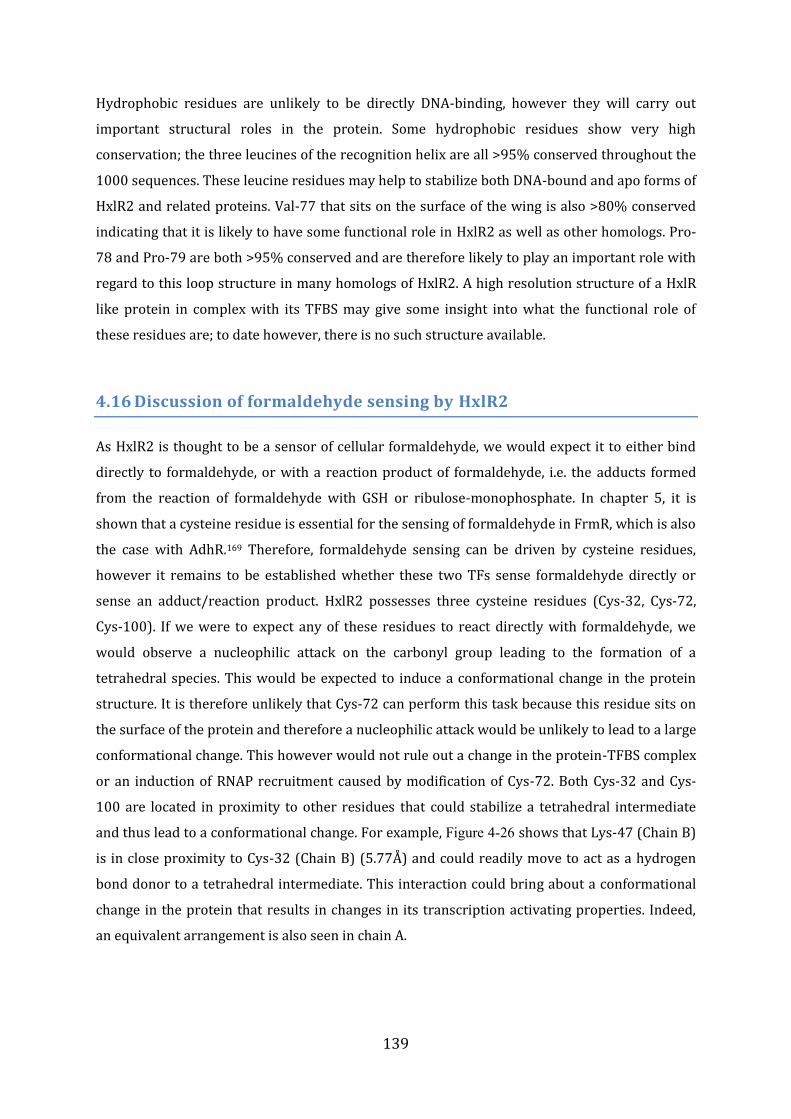
139
Hydrophobic residues are unlikely to be directly DNA-binding, however they will carry out
important structural roles in the protein. Some hydrophobic residues show very high
conservation; the three leucines of the recognition helix are all >95% conserved throughout the
1000 sequences. These leucine residues may help to stabilize both DNA-bound and apo forms of
HxlR2 and related proteins. Val-77 that sits on the surface of the wing is also >80% conserved
indicating that it is likely to have some functional role in HxlR2 as well as other homologs. Pro-
78 and Pro-79 are both >95% conserved and are therefore likely to play an important role with
regard to this loop structure in many homologs of HxlR2. A high resolution structure of a HxlR
like protein in complex with its TFBS may give some insight into what the functional role of
these residues are; to date however, there is no such structure available.
4.16 Discussion of formaldehyde sensing by HxlR2
As HxlR2 is thought to be a sensor of cellular formaldehyde, we would expect it to either bind
directly to formaldehyde, or with a reaction product of formaldehyde, i.e. the adducts formed
from the reaction of formaldehyde with GSH or ribulose-monophosphate. In chapter 5, it is
shown that a cysteine residue is essential for the sensing of formaldehyde in FrmR, which is also
the case with AdhR.169 Therefore, formaldehyde sensing can be driven by cysteine residues,
however it remains to be established whether these two TFs sense formaldehyde directly or
sense an adduct/reaction product. HxlR2 possesses three cysteine residues (Cys-32, Cys-72,
Cys-100). If we were to expect any of these residues to react directly with formaldehyde, we
would observe a nucleophilic attack on the carbonyl group leading to the formation of a
tetrahedral species. This would be expected to induce a conformational change in the protein
structure. It is therefore unlikely that Cys-72 can perform this task because this residue sits on
the surface of the protein and therefore a nucleophilic attack would be unlikely to lead to a large
conformational change. This however would not rule out a change in the protein-TFBS complex
or an induction of RNAP recruitment caused by modification of Cys-72. Both Cys-32 and Cys-
100 are located in proximity to other residues that could stabilize a tetrahedral intermediate
and thus lead to a conformational change. For example, Figure 4-26 shows that Lys-47 (Chain B)
is in close proximity to Cys-32 (Chain B) (5.77Å) and could readily move to act as a hydrogen
bond donor to a tetrahedral intermediate. This interaction could bring about a conformational
change in the protein that results in changes in its transcription activating properties. Indeed,
an equivalent arrangement is also seen in chain A.
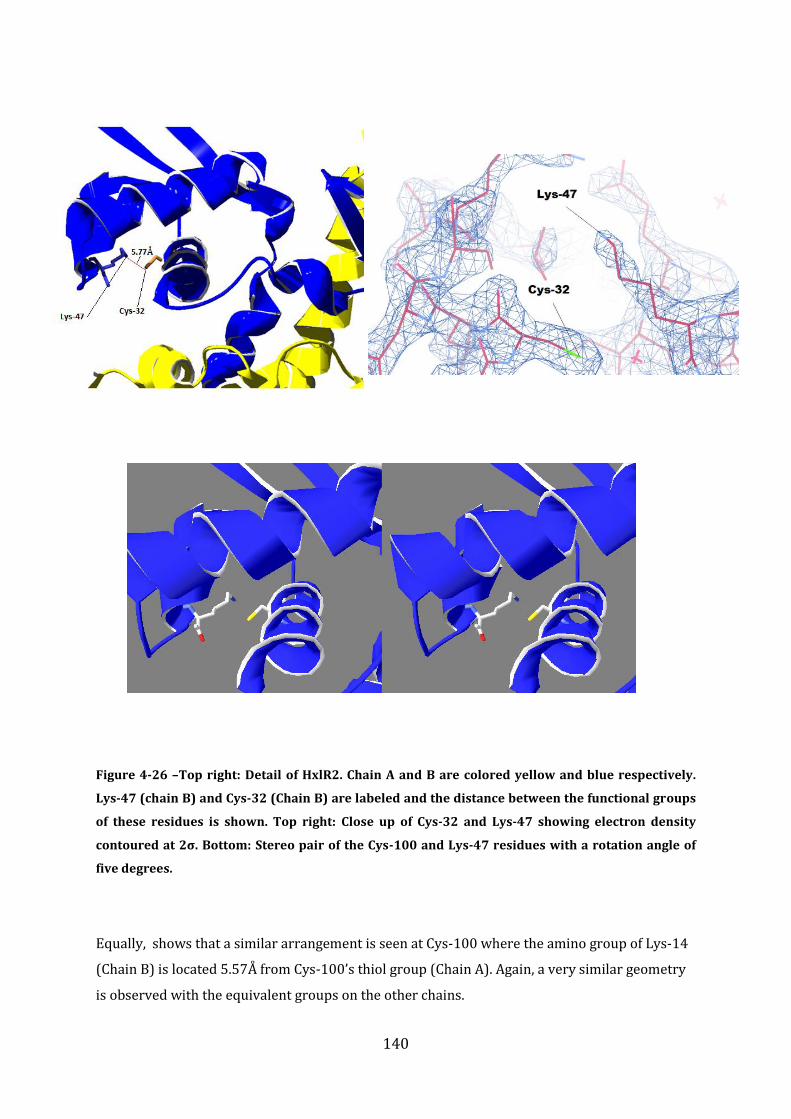
140
Figure 4-26 –Top right: Detail of HxlR2. Chain A and B are colored yellow and blue respectively.
Lys-47 (chain B) and Cys-32 (Chain B) are labeled and the distance between the functional groups
of these residues is shown. Top right: Close up of Cys-32 and Lys-47 showing electron density
contoured at 2σ. Bottom: Stereo pair of the Cys-100 and Lys-47 residues with a rotation angle of
five degrees.
Equally, shows that a similar arrangement is seen at Cys-100 where the amino group of Lys-14
(Chain B) is located 5.57Å from Cys-100’s thiol group (Chain A). Again, a very similar geometry
is observed with the equivalent groups on the other chains.
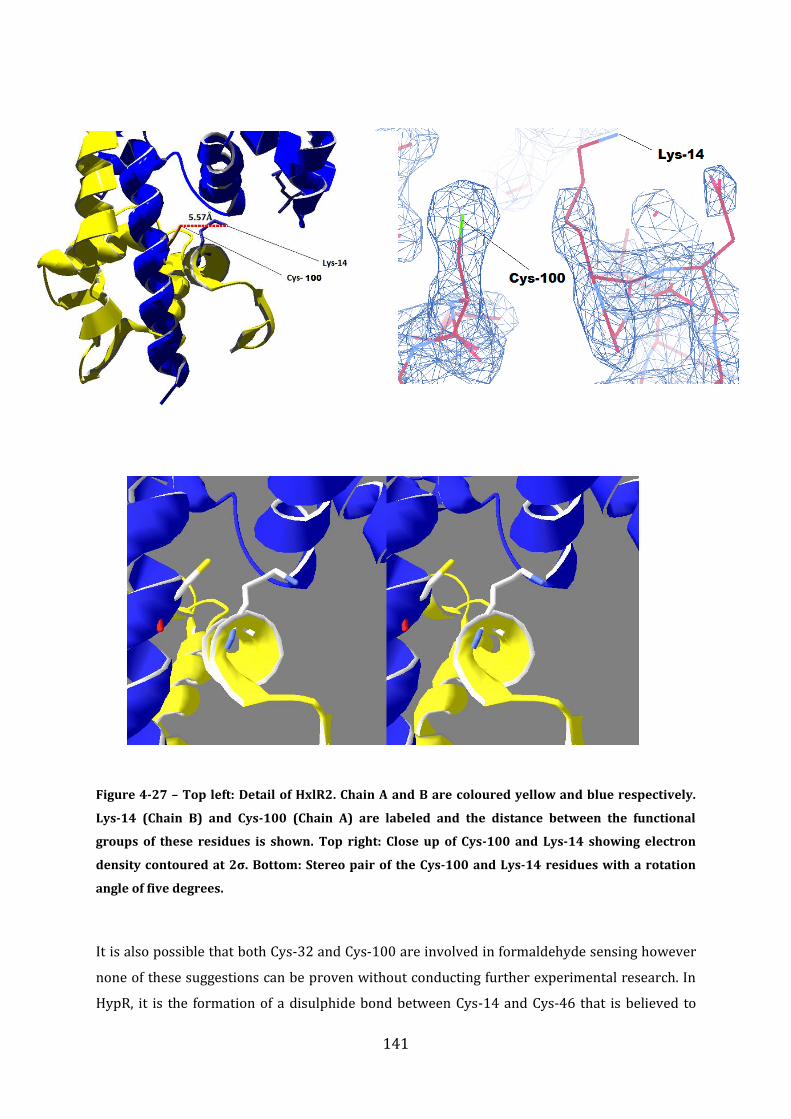
141
Figure 4-27 – Top left: Detail of HxlR2. Chain A and B are coloured yellow and blue respectively.
Lys-14 (Chain B) and Cys-100 (Chain A) are labeled and the distance between the functional
groups of these residues is shown. Top right: Close up of Cys-100 and Lys-14 showing electron
density contoured at 2σ. Bottom: Stereo pair of the Cys-100 and Lys-14 residues with a rotation
angle of five degrees.
It is also possible that both Cys-32 and Cys-100 are involved in formaldehyde sensing however
none of these suggestions can be proven without conducting further experimental research. In
HypR, it is the formation of a disulphide bond between Cys-14 and Cys-46 that is believed to
142
convert a non-active oxidized protein to an active oxidized protein. These cysteine residues are
not conserved in HxlR2 suggesting this is not a viable mechanism of regulation in this protein.
This is unusual given their sequence similarity however the overlay in Figure 4-13 shows that
HxlR2-His overlaps much better with the oxidized form of HypR suggesting HxlR2 is already in
this “active” conformation. This further suggests a similar mechanism is unlikely. The
comparison between these two proteins is discussed further in Chapter 6.
4.17 Discussion
Despite screening through an extensive range of conditions, several of the proteins in this study
failed to crystallise; these were FrmR, FrmR-His, and HxlR1. It was therefore not possible to
continue with crystallographic methods on these proteins. However, diffraction quality crystals
of FrmRC36S and HxlR2 were obtained. A full data set of an FrmRC36S crystal that diffracted to
a resolution of 3.0Å was recorded. Data processing showed that these crystals were of the space
group P3212. Unfortunately, although a plausible molecular replacement solution could be
obtained, this could not be refined. This could be due to the lower resolution obtained, in
combination with the large degree of error in the model used. Furthermore, signs of merohedral
twinning were detected in all FrmRC36S datasets. This is likely to result in the sort of problems
observed here, i.e. a potential solution is obtained from the MR software however the data are
too different to result in a refined structure.
Two crystal forms of HxlR2-His were observed. One of these was space group P43212 which
diffracted to 2.3Å and was fully refined using MR. The other crystal was of P21212 and diffracted
to 1.95Å. Although a solution to this data set was found, the data refined poorly. Again, the cause
of this problem is unknown however the diffraction data was clearly not of the same quality as
the tetragonal data. The final models obtained of both forms overlap very well and are
effectively the same structure given the error associated with crystal structures of this
resolution. One noticeable difference in the crystalline packing of these two proteins is the
formation of a disulphide bond between C72 of neighbouring molecules.
The overall dimeric structure of HxlR2-His is similar to that of other proteins of this family. Each
subunit contains a wHTH DNA binding domain that is linked to a helical dimerization domain.
The wHTH of each subunit are located at opposite ends of the protein which is likely to define
the protein-DNA interaction. The formation of the dimer interface appears to be driven by
hydrophobic interactions between the dimerization domains of each subunit. As would be
expected in any accurate protein model, the B-factors of loop regions tend to be higher than
143
those of secondary structure regions. Side chains that are in contact with the solvent also have
higher B-factors than those that are buried within the protein interior, reflecting the higher
motilities of these side-chains.
One very interesting feature of HxlR2-His is at the loop region comprising the “wing” of the
wHTH motif. There are several valine regions that are on the surface of the protein in contact
with the solvent. This is highly unusual as these residues will interact unfavorably with water
and hence destabilise the protein. It is also interesting that one of these valine residues show a
high level of sequence conservation. These observations suggest that these valine residues may
play an important functional role, for example interacting with methylated DNA. Several
residues were noted as being potential DNA-binding residues and these were Arg-54, Arg-58,
Arg-61, Glu-62, Glu-64, Asp-65 and Asp-66. Some of these are well conserved and may therefore
play a similar role in related proteins. It is worth noting that many of the leucine residues in the
DNA binding domain are well conserved amongst other homologs. This suggests that the
structural role that these hydrophobic residues carry out is highly important in HxlR-like
proteins. How this protein senses formaldehyde remains unknown and will require further
experiments.
144
5 In vitro and in vivo functional characterisation of FrmR and HxlR
5.1 Introduction
This chapter intends to further study the functional properties of the TF FrmR, which is a
duf156 family protein which are shown to the right the flow diagram in Figure 1-32. As
described in chapter 1, previous experiments have suggested that FrmR is a repressor of the
frmRAB operon and that this repression is stopped in the presence of formaldehyde.176 This
chapter tests this hypothesis both in vivo and in vitro and provides further evidence that
supports this mechanism of regulation. These experiments also provide further insights into the
interactions of FrmR with its TFBS as well as formaldehyde.
FrmR is a member of the Duf-156 family of TFs; the only other members of this family to be
characterised are TFs that sense heavy metals and regulate TGs involved in the transport of
these metals. These are the copper sensor CsoR from several organisms and RcnR from E. coli.
These TFs coordinate to metal ions which is thought to induce a conformational change in the
protein resulting in a dissociation from their TFBS and hence de-repression. This coordination
involves several protein residues including a conserved cysteine residue that corresponds to
Cys-36 of FrmR. 179,232,244,245 A similar link between formaldehyde and metal sensing appears to
exist in the MerR family, of which AdhR (section 1.4) is a member. CueR is a well-studied
member of this protein family and is involved in the regulation of copper transport proteins.
CueR specifically binds to copper which, as in CsoR/RcnR, induces a conformational change
causing an alteration of its TGs expression.246 Interestingly, this coordination also involves a
conserved cysteine residue that corresponds to Cys-52 in AdhR. This residue was found to be
essential for AdhR’s ability to sense formaldehyde and induce the expression of the
formaldehyde detoxification pathway that it had been shown to regulate.169 Hence, in the MerR
family there appears to be a link between sensors of heavy metal ions and sensors of
formaldehyde, both using a conserved cysteine residue. A similar situation could exist for Duf-
156 proteins, a hypothesis we will test in vitro and in vivo using a C36S FrmR mutant.
Both CsoR and RcnR have been shown to specifically bind to their promoters at TFBSs which are
located upstream of the transcription start site and overlap with the -10 and -35 structure
elements. These TFBSs possess AT containing inverted repeats which are interrupted by runs of
guanine and cytosine bases. In the RcnR promoter, these G and C tracts are shown induce the
formation of A-form DNA at these inverted repeats. Mutational studies suggest that the
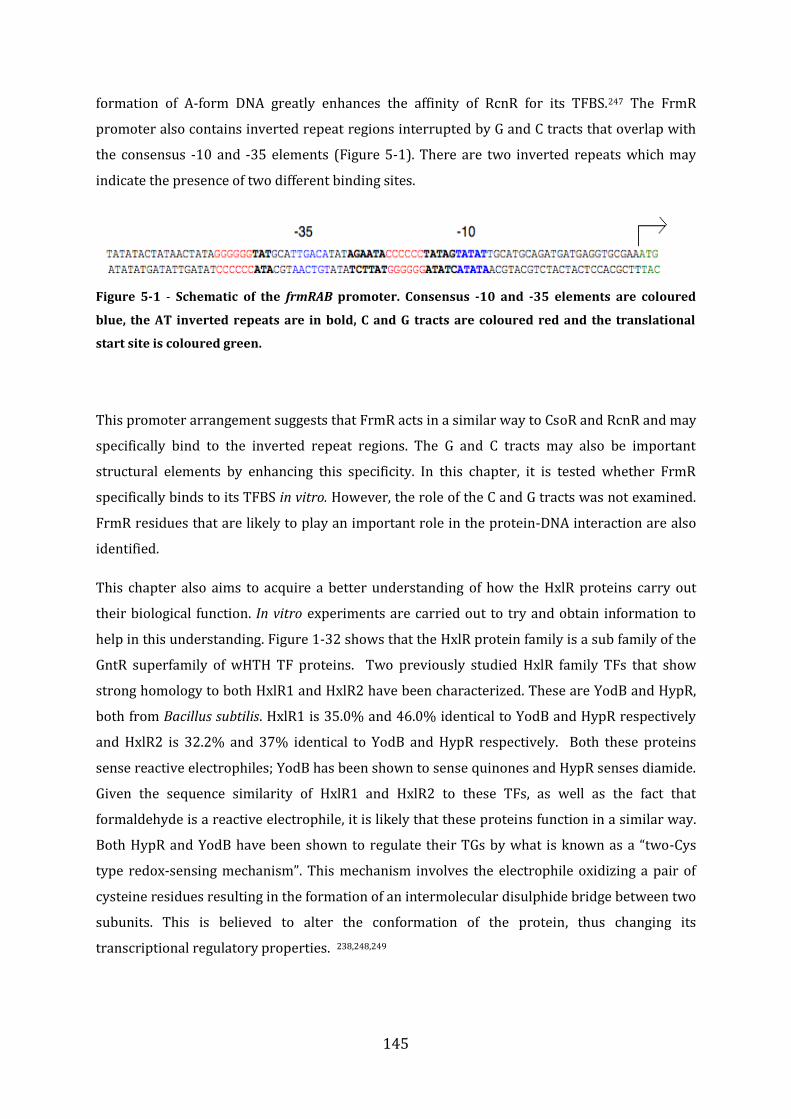
145
formation of A-form DNA greatly enhances the affinity of RcnR for its TFBS.247 The FrmR
promoter also contains inverted repeat regions interrupted by G and C tracts that overlap with
the consensus -10 and -35 elements (Figure 5-1). There are two inverted repeats which may
indicate the presence of two different binding sites.
Figure 5-1 - Schematic of the frmRAB promoter. Consensus -10 and -35 elements are coloured
blue, the AT inverted repeats are in bold, C and G tracts are coloured red and the translational
start site is coloured green.
This promoter arrangement suggests that FrmR acts in a similar way to CsoR and RcnR and may
specifically bind to the inverted repeat regions. The G and C tracts may also be important
structural elements by enhancing this specificity. In this chapter, it is tested whether FrmR
specifically binds to its TFBS in vitro. However, the role of the C and G tracts was not examined.
FrmR residues that are likely to play an important role in the protein-DNA interaction are also
identified.
This chapter also aims to acquire a better understanding of how the HxlR proteins carry out
their biological function. In vitro experiments are carried out to try and obtain information to
help in this understanding. Figure 1-32 shows that the HxlR protein family is a sub family of the
GntR superfamily of wHTH TF proteins. Two previously studied HxlR family TFs that show
strong homology to both HxlR1 and HxlR2 have been characterized. These are YodB and HypR,
both from Bacillus subtilis. HxlR1 is 35.0% and 46.0% identical to YodB and HypR respectively
and HxlR2 is 32.2% and 37% identical to YodB and HypR respectively. Both these proteins
sense reactive electrophiles; YodB has been shown to sense quinones and HypR senses diamide.
Given the sequence similarity of HxlR1 and HxlR2 to these TFs, as well as the fact that
formaldehyde is a reactive electrophile, it is likely that these proteins function in a similar way.
Both HypR and YodB have been shown to regulate their TGs by what is known as a “two-Cys
type redox-sensing mechanism”. This mechanism involves the electrophile oxidizing a pair of
cysteine residues resulting in the formation of an intermolecular disulphide bridge between two
subunits. This is believed to alter the conformation of the protein, thus changing its
transcriptional regulatory properties. 238,248,249
146
For both YodB and HypR, one of the essential cysteine residues for the sensing mechanisms
corresponds to Cys-11 in HxlR1. The conservation of this residue could indicate that it plays an
important role in the formaldehyde sensing mechanism of HxlR1. However, this cysteine
residue is the only one of its kind in the HxlR chain which this rules out the potential for HxlR1
to function via the two-Cys type redox-sensing mechanism. If HxlR1 senses formaldehyde
through a cysteine residue then it will have to be through this Cys-11 residue and cannot
involve the formation of intramolecular disulphide linkages. Therefore, despite the high
homology between HxlR1 and HypR, they must sense their effector molecules by different
mechanisms. Interestingly, HxlR2 and the other type 2 HxlR TFs (see Figure 3-1) do not possess
a corresponding Cys-11 residue. However, they do possess other cysteine residues that may
support formaldehyde sensing (section 4.16). If HxlR2 is in fact a sensor of formaldehyde and
this is done through cysteine residue, then the mechanism of action will have to be different
from that of HxlR1.
Although previous biochemical work would suggest formaldehyde sensing, like other oxidant
sensing, would be driven by a nucleophilic thiolate; it is entirely plausable for sensing to be
driven by a non-cysteine residue such as lysine.250
5.2 Aims and objectives
Based on the sequence similarities between FrmR and the metal sensors, CsoR and RcnR; it can
be postulated that FrmR might behave in a similar way with regard to its interactions with DNA
and effector moleucles. Initially, this chapter will try and determine whether FrmR interacts
with its promoter in vitro. This will be done by performing a series of electropheric mobility
shift assays. The effect of formaldehyde on this interaction will also be studied. So that FrmR can
be studied in vivo, this section describes the construction of two plasmid based reporter
systems as well as the steps taken to acquire an E.coli DE3 lysogen that lacks the genomic frmR
gene. One of these reporter systems is shown to work as expected with respect to repression
and formaldehyde induced derepression. The reporter plasmid is then used to study which
residues are likely to be fundamental to DNA binding by creating mutations in the FrmR
sequence and analysing their effect on repression. Similarly, the in vivo reporter system is used
to identify a cysteine residue that is essential to formaldehyde induced derepression. This
particular mutant is purified in order to assess its behaviour in vitro with respect to how
formaldehyde affects its DNA binding properties.
147
Experiments in this section also set out whether HxlR2 specifically interacts with its supposed
TFBS. This is attempted using EMSAs and the effect of formaldehyde on this interaction is
studied. Little is understood in terms of how, if at all, formaldehyde affects HxlR2 and its
interaction with its TFBSs. Therefore, an experiment in this chapter sets out to observe if
formaldehyde affects the environment of as HxlR2-TFBS complex by monitoring the
fluorescence of a labelled TFBS that’s emission intensity is sensitive to complex formation
.
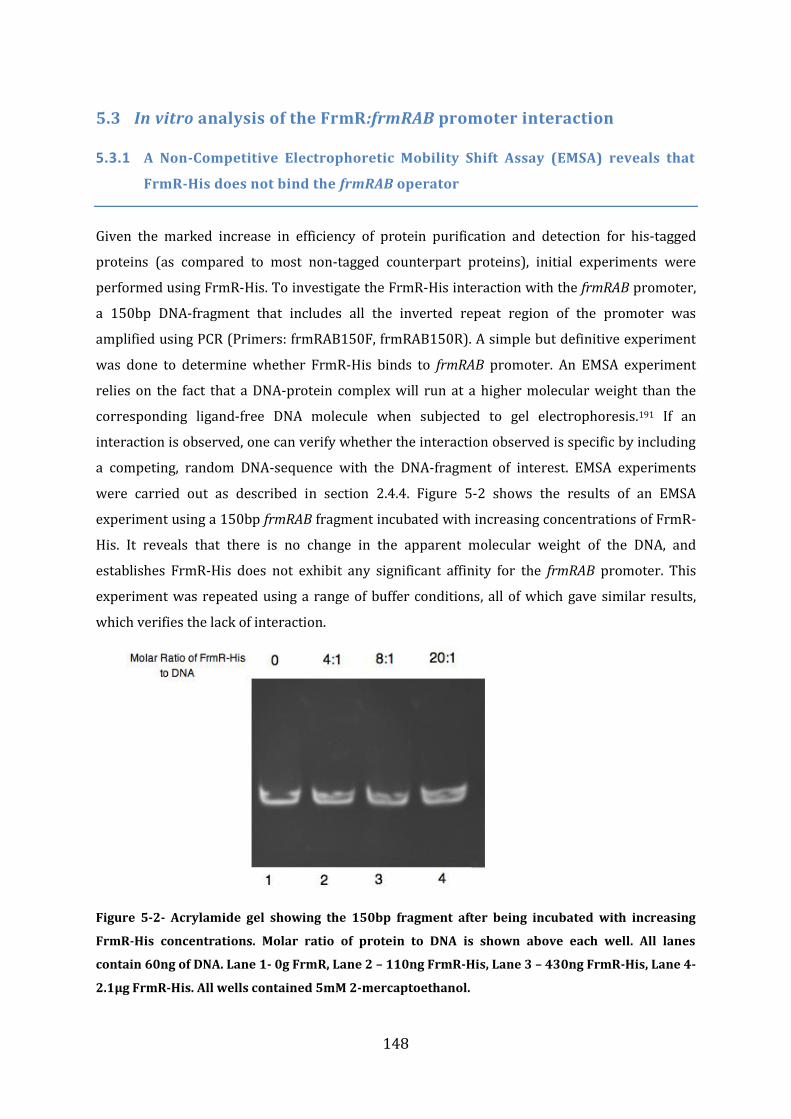
148
5.3 In vitro analysis of the FrmR:frmRAB promoter interaction
5.3.1 A Non-Competitive Electrophoretic Mobility Shift Assay (EMSA) reveals that
FrmR-His does not bind the frmRAB operator
Given the marked increase in efficiency of protein purification and detection for his-tagged
proteins (as compared to most non-tagged counterpart proteins), initial experiments were
performed using FrmR-His. To investigate the FrmR-His interaction with the frmRAB promoter,
a 150bp DNA-fragment that includes all the inverted repeat region of the promoter was
amplified using PCR (Primers: frmRAB150F, frmRAB150R). A simple but definitive experiment
was done to determine whether FrmR-His binds to frmRAB promoter. An EMSA experiment
relies on the fact that a DNA-protein complex will run at a higher molecular weight than the
corresponding ligand-free DNA molecule when subjected to gel electrophoresis.191 If an
interaction is observed, one can verify whether the interaction observed is specific by including
a competing, random DNA-sequence with the DNA-fragment of interest. EMSA experiments
were carried out as described in section 2.4.4. Figure 5-2 shows the results of an EMSA
experiment using a 150bp frmRAB fragment incubated with increasing concentrations of FrmR-
His. It reveals that there is no change in the apparent molecular weight of the DNA, and
establishes FrmR-His does not exhibit any significant affinity for the frmRAB promoter. This
experiment was repeated using a range of buffer conditions, all of which gave similar results,
which verifies the lack of interaction.
Figure 5-2- Acrylamide gel showing the 150bp fragment after being incubated with increasing
FrmR-His concentrations. Molar ratio of protein to DNA is shown above each well. All lanes
contain 60ng of DNA. Lane 1- 0g FrmR, Lane 2 – 110ng FrmR-His, Lane 3 – 430ng FrmR-His, Lane 4-
2.1μg FrmR-His. All wells contained 5mM 2-mercaptoethanol.
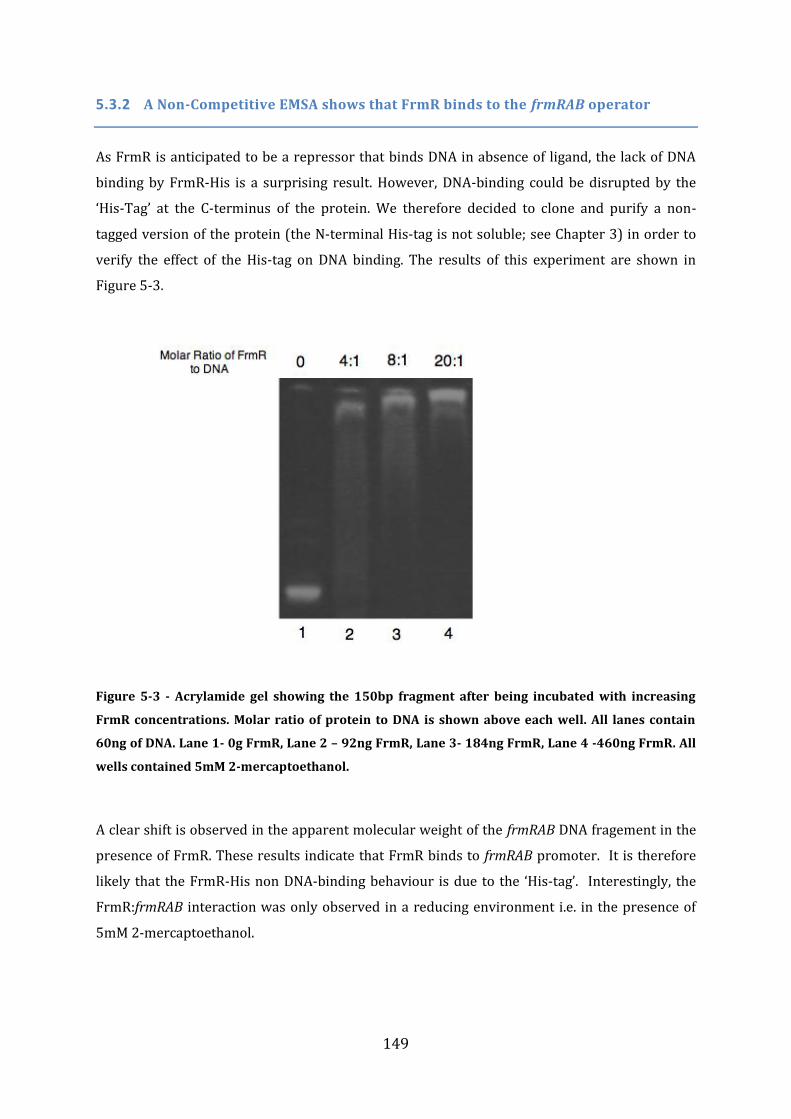
149
5.3.2 A Non-Competitive EMSA shows that FrmR binds to the frmRAB operator
As FrmR is anticipated to be a repressor that binds DNA in absence of ligand, the lack of DNA
binding by FrmR-His is a surprising result. However, DNA-binding could be disrupted by the
‘His-Tag’ at the C-terminus of the protein. We therefore decided to clone and purify a non-
tagged version of the protein (the N-terminal His-tag is not soluble; see Chapter 3) in order to
verify the effect of the His-tag on DNA binding. The results of this experiment are shown in
Figure 5-3.
Figure 5-3 - Acrylamide gel showing the 150bp fragment after being incubated with increasing
FrmR concentrations. Molar ratio of protein to DNA is shown above each well. All lanes contain
60ng of DNA. Lane 1- 0g FrmR, Lane 2 – 92ng FrmR, Lane 3- 184ng FrmR, Lane 4 -460ng FrmR. All
wells contained 5mM 2-mercaptoethanol.
A clear shift is observed in the apparent molecular weight of the frmRAB DNA fragement in the
presence of FrmR. These results indicate that FrmR binds to frmRAB promoter. It is therefore
likely that the FrmR-His non DNA-binding behaviour is due to the ‘His-tag’. Interestingly, the
FrmR:frmRAB interaction was only observed in a reducing environment i.e. in the presence of
5mM 2-mercaptoethanol.
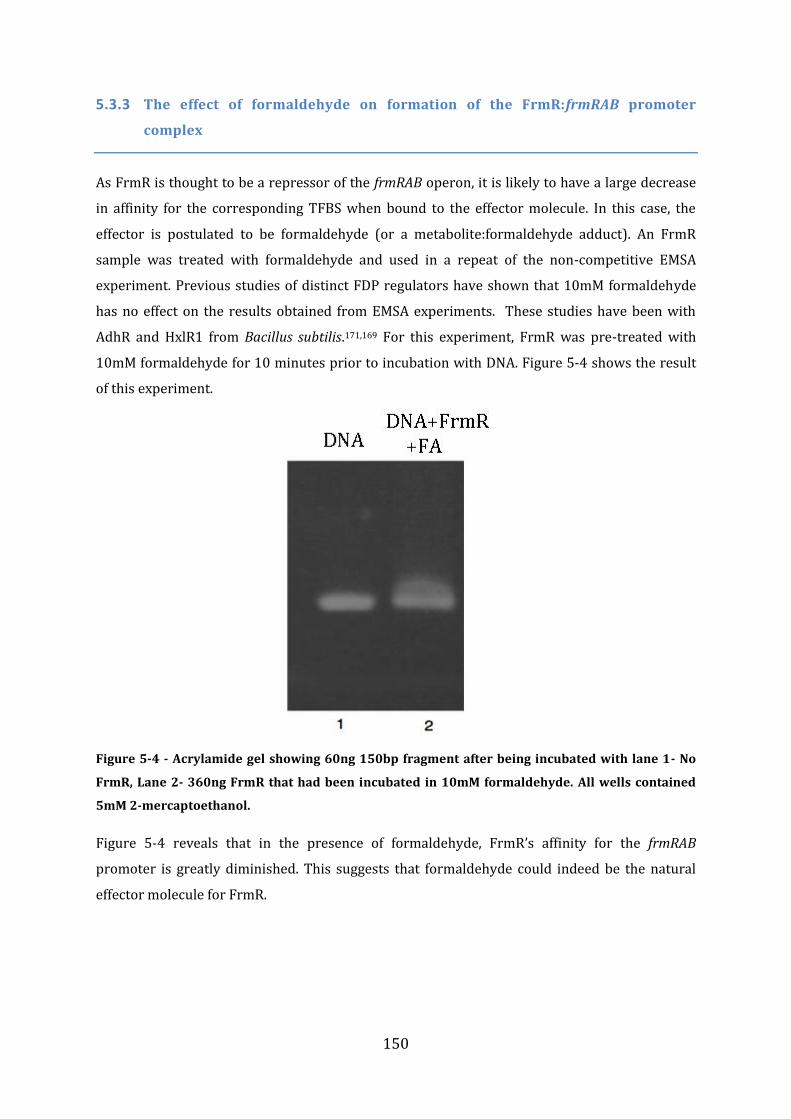
150
5.3.3 The effect of formaldehyde on formation of the FrmR:frmRAB promoter
complex
As FrmR is thought to be a repressor of the frmRAB operon, it is likely to have a large decrease
in affinity for the corresponding TFBS when bound to the effector molecule. In this case, the
effector is postulated to be formaldehyde (or a metabolite:formaldehyde adduct). An FrmR
sample was treated with formaldehyde and used in a repeat of the non-competitive EMSA
experiment. Previous studies of distinct FDP regulators have shown that 10mM formaldehyde
has no effect on the results obtained from EMSA experiments. These studies have been with
AdhR and HxlR1 from Bacillus subtilis.171,169 For this experiment, FrmR was pre-treated with
10mM formaldehyde for 10 minutes prior to incubation with DNA. Figure 5-4 shows the result
of this experiment.
Figure 5-4 - Acrylamide gel showing 60ng 150bp fragment after being incubated with lane 1- No
FrmR, Lane 2- 360ng FrmR that had been incubated in 10mM formaldehyde. All wells contained
5mM 2-mercaptoethanol.
Figure 5-4 reveals that in the presence of formaldehyde, FrmR’s affinity for the frmRAB
promoter is greatly diminished. This suggests that formaldehyde could indeed be the natural
effector molecule for FrmR.
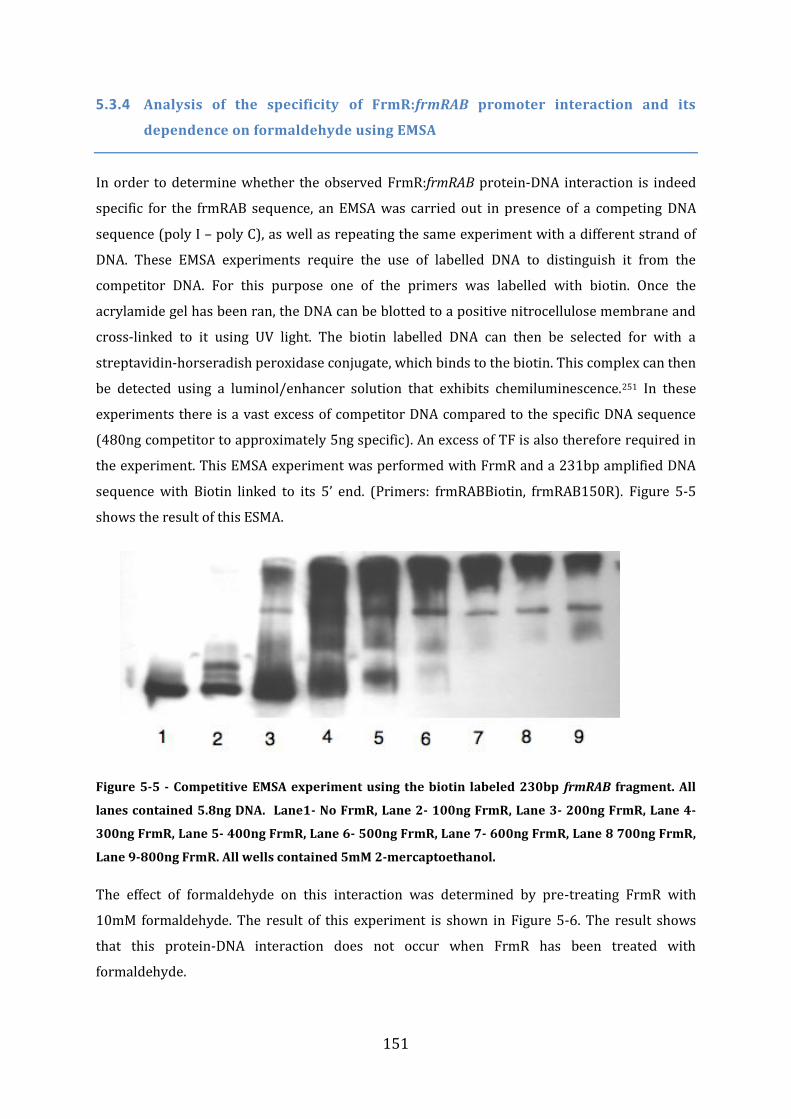
151
5.3.4 Analysis of the specificity of FrmR:frmRAB promoter interaction and its
dependence on formaldehyde using EMSA
In order to determine whether the observed FrmR:frmRAB protein-DNA interaction is indeed
specific for the frmRAB sequence, an EMSA was carried out in presence of a competing DNA
sequence (poly I – poly C), as well as repeating the same experiment with a different strand of
DNA. These EMSA experiments require the use of labelled DNA to distinguish it from the
competitor DNA. For this purpose one of the primers was labelled with biotin. Once the
acrylamide gel has been ran, the DNA can be blotted to a positive nitrocellulose membrane and
cross-linked to it using UV light. The biotin labelled DNA can then be selected for with a
streptavidin-horseradish peroxidase conjugate, which binds to the biotin. This complex can then
be detected using a luminol/enhancer solution that exhibits chemiluminescence.251 In these
experiments there is a vast excess of competitor DNA compared to the specific DNA sequence
(480ng competitor to approximately 5ng specific). An excess of TF is also therefore required in
the experiment. This EMSA experiment was performed with FrmR and a 231bp amplified DNA
sequence with Biotin linked to its 5’ end. (Primers: frmRABBiotin, frmRAB150R). Figure 5-5
shows the result of this ESMA.
Figure 5-5 - Competitive EMSA experiment using the biotin labeled 230bp frmRAB fragment. All
lanes contained 5.8ng DNA. Lane1- No FrmR, Lane 2- 100ng FrmR, Lane 3- 200ng FrmR, Lane 4-
300ng FrmR, Lane 5- 400ng FrmR, Lane 6- 500ng FrmR, Lane 7- 600ng FrmR, Lane 8 700ng FrmR,
Lane 9-800ng FrmR. All wells contained 5mM 2-mercaptoethanol.
The effect of formaldehyde on this interaction was determined by pre-treating FrmR with
10mM formaldehyde. The result of this experiment is shown in Figure 5-6. The result shows
that this protein-DNA interaction does not occur when FrmR has been treated with
formaldehyde.
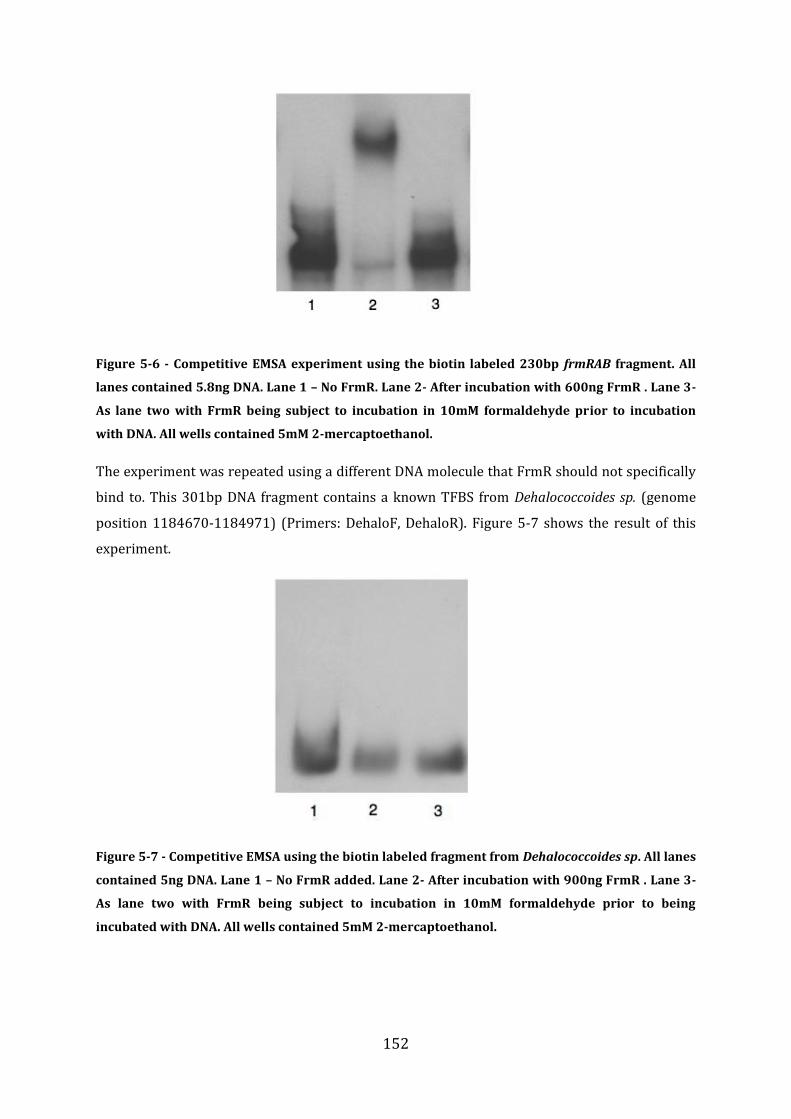
152
Figure 5-6 - Competitive EMSA experiment using the biotin labeled 230bp frmRAB fragment. All
lanes contained 5.8ng DNA. Lane 1 – No FrmR. Lane 2- After incubation with 600ng FrmR . Lane 3-
As lane two with FrmR being subject to incubation in 10mM formaldehyde prior to incubation
with DNA. All wells contained 5mM 2-mercaptoethanol.
The experiment was repeated using a different DNA molecule that FrmR should not specifically
bind to. This 301bp DNA fragment contains a known TFBS from Dehalococcoides sp. (genome
position 1184670-1184971) (Primers: DehaloF, DehaloR). Figure 5-7 shows the result of this
experiment.
Figure 5-7 - Competitive EMSA using the biotin labeled fragment from Dehalococcoides sp. All lanes
contained 5ng DNA. Lane 1 – No FrmR added. Lane 2- After incubation with 900ng FrmR . Lane 3-
As lane two with FrmR being subject to incubation in 10mM formaldehyde prior to being
incubated with DNA. All wells contained 5mM 2-mercaptoethanol.
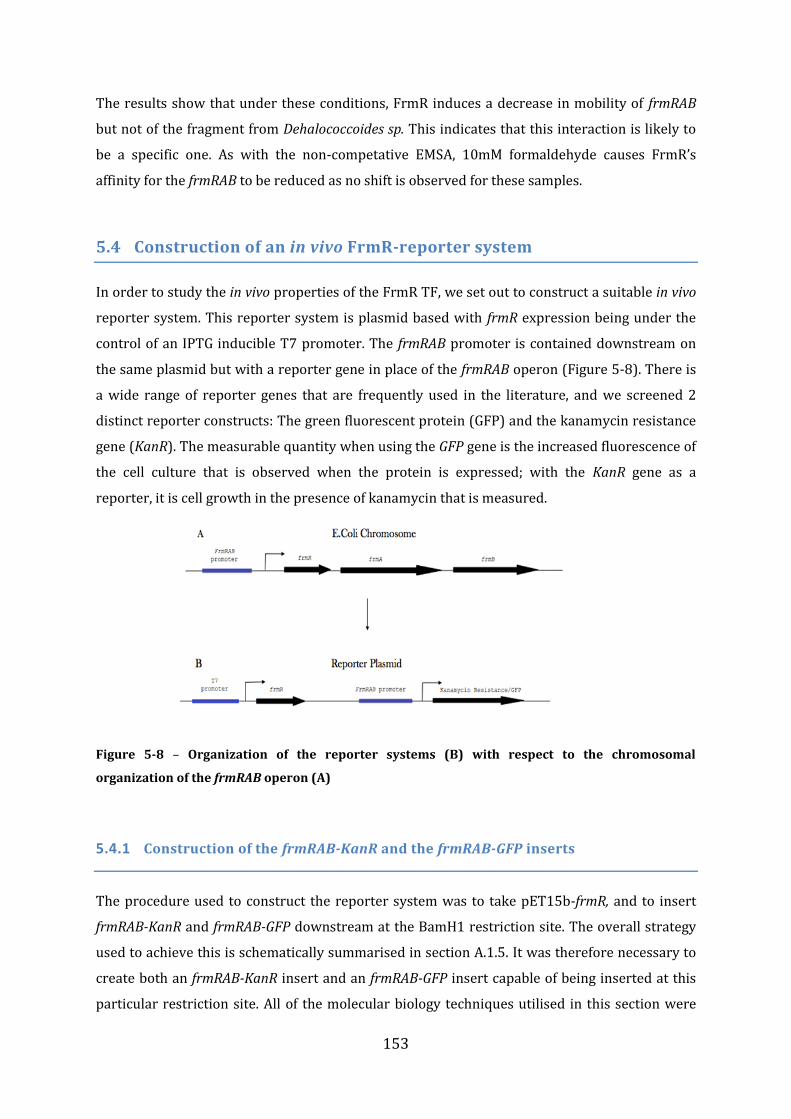
153
The results show that under these conditions, FrmR induces a decrease in mobility of frmRAB
but not of the fragment from Dehalococcoides sp. This indicates that this interaction is likely to
be a specific one. As with the non-competative EMSA, 10mM formaldehyde causes FrmR’s
affinity for the frmRAB to be reduced as no shift is observed for these samples.
5.4 Construction of an in vivo FrmR-reporter system
In order to study the in vivo properties of the FrmR TF, we set out to construct a suitable in vivo
reporter system. This reporter system is plasmid based with frmR expression being under the
control of an IPTG inducible T7 promoter. The frmRAB promoter is contained downstream on
the same plasmid but with a reporter gene in place of the frmRAB operon (Figure 5-8). There is
a wide range of reporter genes that are frequently used in the literature, and we screened 2
distinct reporter constructs: The green fluorescent protein (GFP) and the kanamycin resistance
gene (KanR). The measurable quantity when using the GFP gene is the increased fluorescence of
the cell culture that is observed when the protein is expressed; with the KanR gene as a
reporter, it is cell growth in the presence of kanamycin that is measured.
Figure 5-8 – Organization of the reporter systems (B) with respect to the chromosomal
organization of the frmRAB operon (A)
5.4.1 Construction of the frmRAB-KanR and the frmRAB-GFP inserts
The procedure used to construct the reporter system was to take pET15b-frmR, and to insert
frmRAB-KanR and frmRAB-GFP downstream at the BamH1 restriction site. The overall strategy
used to achieve this is schematically summarised in section A.1.5. It was therefore necessary to
create both an frmRAB-KanR insert and an frmRAB-GFP insert capable of being inserted at this
particular restriction site. All of the molecular biology techniques utilised in this section were
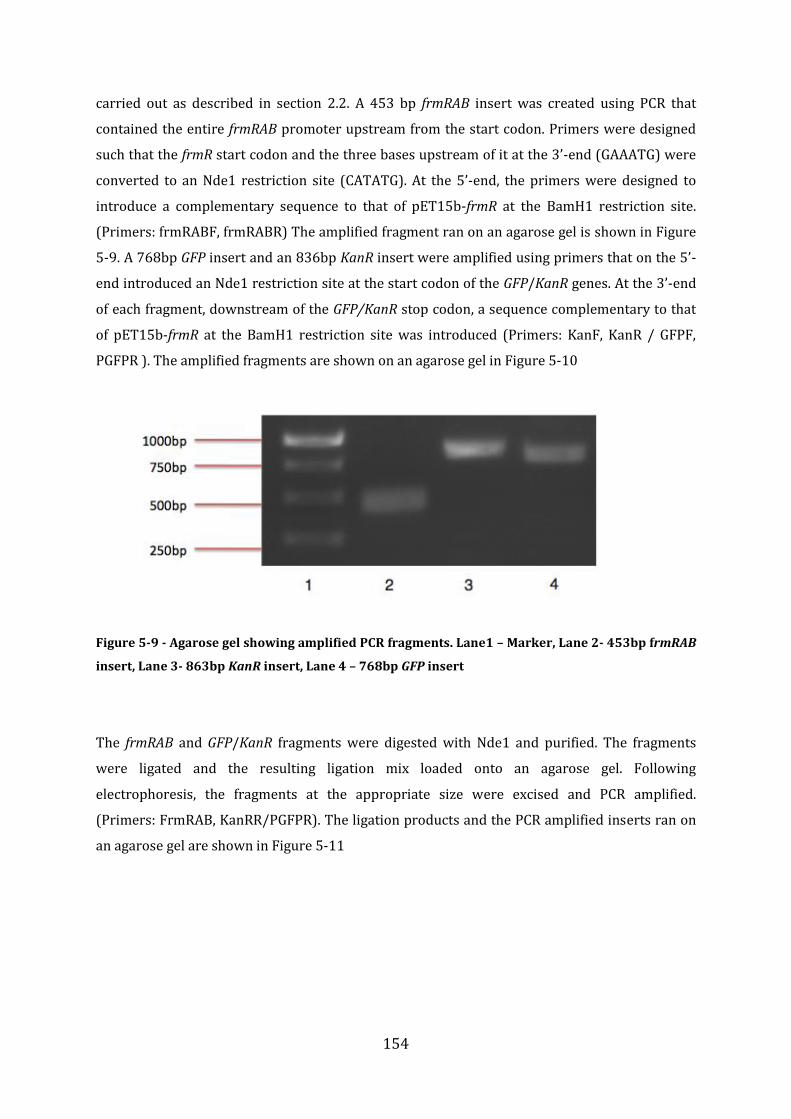
154
carried out as described in section 2.2. A 453 bp frmRAB insert was created using PCR that
contained the entire frmRAB promoter upstream from the start codon. Primers were designed
such that the frmR start codon and the three bases upstream of it at the 3’-end (GAAATG) were
converted to an Nde1 restriction site (CATATG). At the 5’-end, the primers were designed to
introduce a complementary sequence to that of pET15b-frmR at the BamH1 restriction site.
(Primers: frmRABF, frmRABR) The amplified fragment ran on an agarose gel is shown in Figure
5-9. A 768bp GFP insert and an 836bp KanR insert were amplified using primers that on the 5’-
end introduced an Nde1 restriction site at the start codon of the GFP/KanR genes. At the 3’-end
of each fragment, downstream of the GFP/KanR stop codon, a sequence complementary to that
of pET15b-frmR at the BamH1 restriction site was introduced (Primers: KanF, KanR / GFPF,
PGFPR ). The amplified fragments are shown on an agarose gel in Figure 5-10
Figure 5-9 - Agarose gel showing amplified PCR fragments. Lane1 – Marker, Lane 2- 453bp frmRAB
insert, Lane 3- 863bp KanR insert, Lane 4 – 768bp GFP insert
The frmRAB and GFP/KanR fragments were digested with Nde1 and purified. The fragments
were ligated and the resulting ligation mix loaded onto an agarose gel. Following
electrophoresis, the fragments at the appropriate size were excised and PCR amplified.
(Primers: FrmRAB, KanRR/PGFPR). The ligation products and the PCR amplified inserts ran on
an agarose gel are shown in Figure 5-11
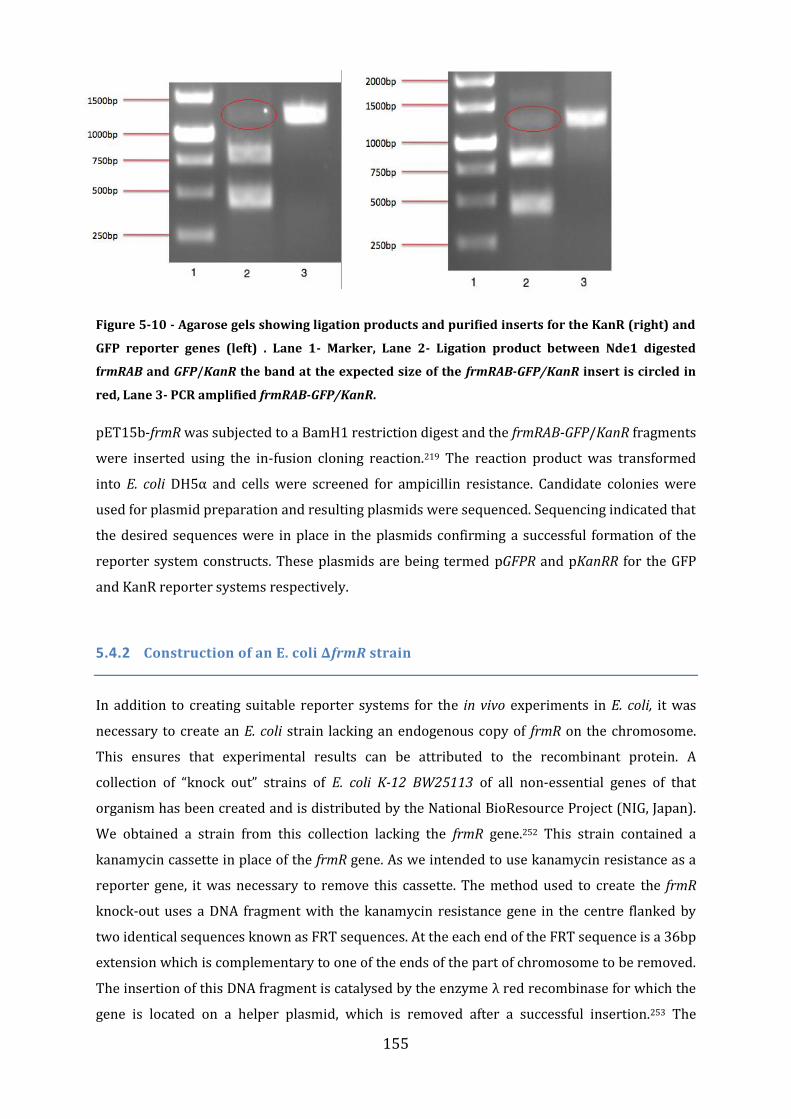
155
Figure 5-10 - Agarose gels showing ligation products and purified inserts for the KanR (right) and
GFP reporter genes (left) . Lane 1- Marker, Lane 2- Ligation product between Nde1 digested
frmRAB and GFP/KanR the band at the expected size of the frmRAB-GFP/KanR insert is circled in
red, Lane 3- PCR amplified frmRAB-GFP/KanR.
pET15b-frmR was subjected to a BamH1 restriction digest and the frmRAB-GFP/KanR fragments
were inserted using the in-fusion cloning reaction.219 The reaction product was transformed
into E. coli DH5α and cells were screened for ampicillin resistance. Candidate colonies were
used for plasmid preparation and resulting plasmids were sequenced. Sequencing indicated that
the desired sequences were in place in the plasmids confirming a successful formation of the
reporter system constructs. These plasmids are being termed pGFPR and pKanRR for the GFP
and KanR reporter systems respectively.
5.4.2 Construction of an E. coli ∆frmR strain
In addition to creating suitable reporter systems for the in vivo experiments in E. coli, it was
necessary to create an E. coli strain lacking an endogenous copy of frmR on the chromosome.
This ensures that experimental results can be attributed to the recombinant protein. A
collection of “knock out” strains of E. coli K-12 BW25113 of all non-essential genes of that
organism has been created and is distributed by the National BioResource Project (NIG, Japan).
We obtained a strain from this collection lacking the frmR gene.252 This strain contained a
kanamycin cassette in place of the frmR gene. As we intended to use kanamycin resistance as a
reporter gene, it was necessary to remove this cassette. The method used to create the frmR
knock-out uses a DNA fragment with the kanamycin resistance gene in the centre flanked by
two identical sequences known as FRT sequences. At the each end of the FRT sequence is a 36bp
extension which is complementary to one of the ends of the part of chromosome to be removed.
The insertion of this DNA fragment is catalysed by the enzyme λ red recombinase for which the
gene is located on a helper plasmid, which is removed after a successful insertion.253 The
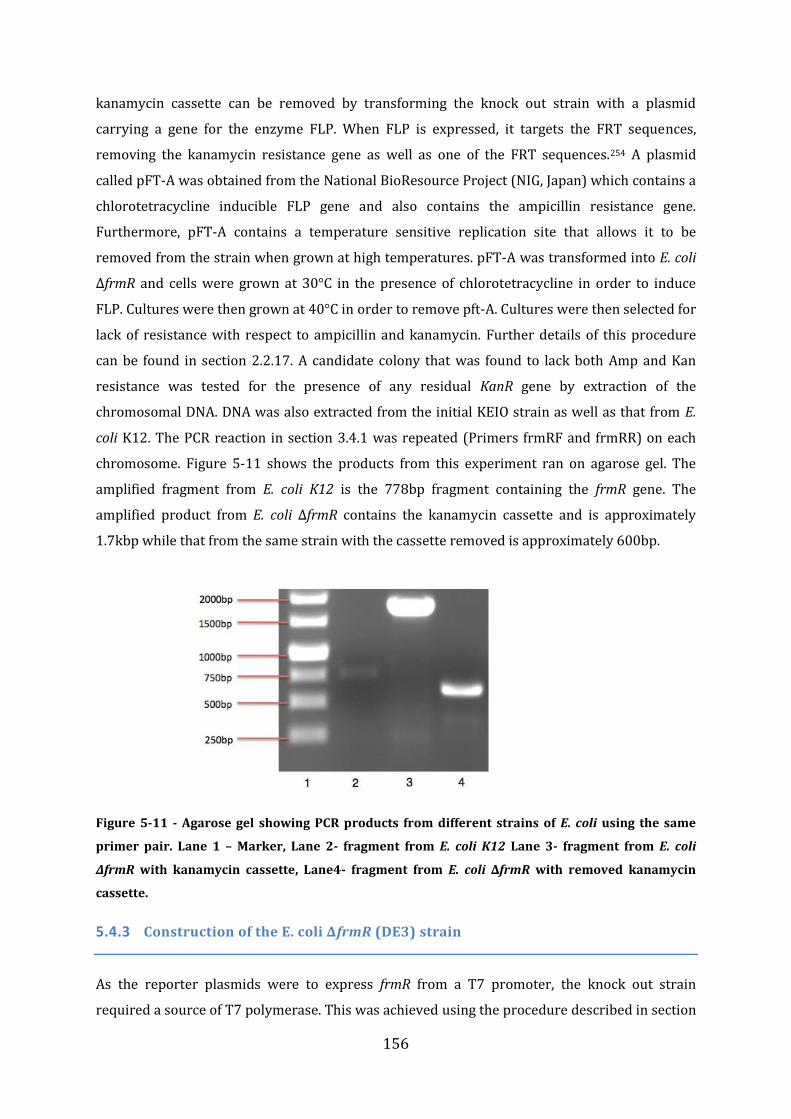
156
kanamycin cassette can be removed by transforming the knock out strain with a plasmid
carrying a gene for the enzyme FLP. When FLP is expressed, it targets the FRT sequences,
removing the kanamycin resistance gene as well as one of the FRT sequences.254 A plasmid
called pFT-A was obtained from the National BioResource Project (NIG, Japan) which contains a
chlorotetracycline inducible FLP gene and also contains the ampicillin resistance gene.
Furthermore, pFT-A contains a temperature sensitive replication site that allows it to be
removed from the strain when grown at high temperatures. pFT-A was transformed into E. coli
∆frmR and cells were grown at 30°C in the presence of chlorotetracycline in order to induce
FLP. Cultures were then grown at 40°C in order to remove pft-A. Cultures were then selected for
lack of resistance with respect to ampicillin and kanamycin. Further details of this procedure
can be found in section 2.2.17. A candidate colony that was found to lack both Amp and Kan
resistance was tested for the presence of any residual KanR gene by extraction of the
chromosomal DNA. DNA was also extracted from the initial KEIO strain as well as that from E.
coli K12. The PCR reaction in section 3.4.1 was repeated (Primers frmRF and frmRR) on each
chromosome. Figure 5-11 shows the products from this experiment ran on agarose gel. The
amplified fragment from E. coli K12 is the 778bp fragment containing the frmR gene. The
amplified product from E. coli ∆frmR contains the kanamycin cassette and is approximately
1.7kbp while that from the same strain with the cassette removed is approximately 600bp.
Figure 5-11 - Agarose gel showing PCR products from different strains of E. coli using the same
primer pair. Lane 1 – Marker, Lane 2- fragment from E. coli K12 Lane 3- fragment from E. coli
∆frmR with kanamycin cassette, Lane4- fragment from E. coli ∆frmR with removed kanamycin
cassette.
5.4.3 Construction of the E. coli ∆frmR (DE3) strain
As the reporter plasmids were to express frmR from a T7 promoter, the knock out strain
required a source of T7 polymerase. This was achieved using the procedure described in section
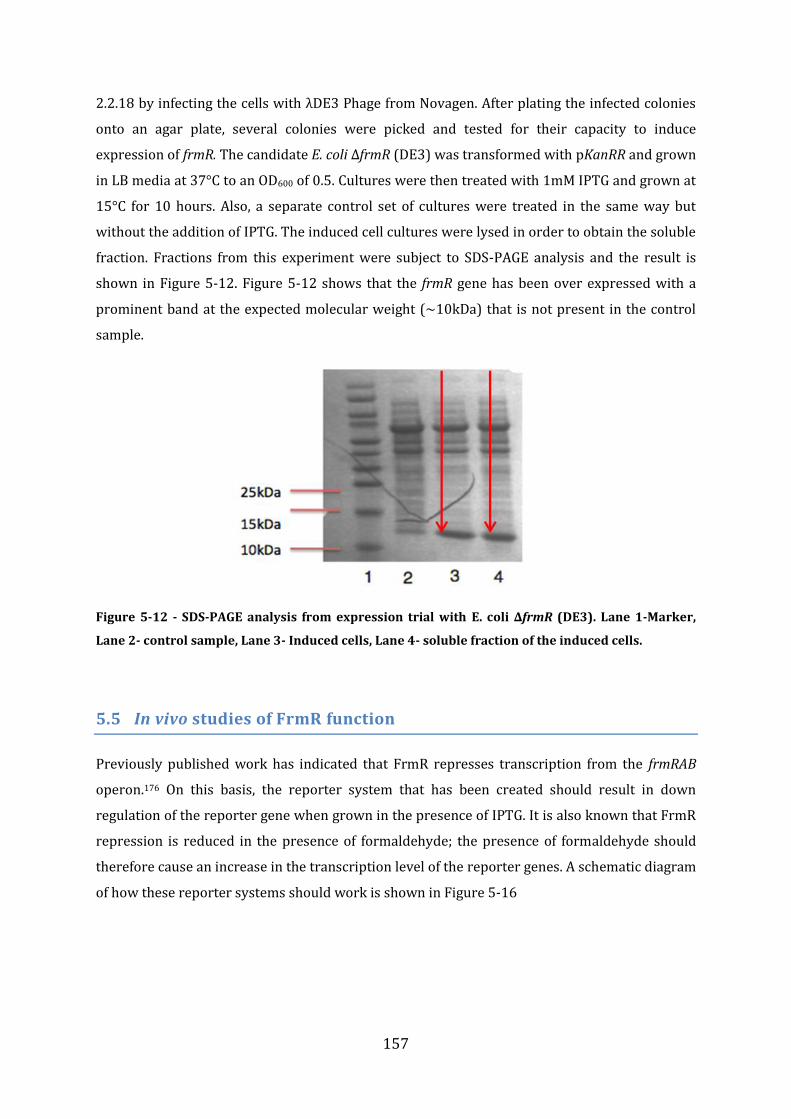
157
2.2.18 by infecting the cells with λDE3 Phage from Novagen. After plating the infected colonies
onto an agar plate, several colonies were picked and tested for their capacity to induce
expression of frmR. The candidate E. coli ∆frmR (DE3) was transformed with pKanRR and grown
in LB media at 37°C to an OD600 of 0.5. Cultures were then treated with 1mM IPTG and grown at
15°C for 10 hours. Also, a separate control set of cultures were treated in the same way but
without the addition of IPTG. The induced cell cultures were lysed in order to obtain the soluble
fraction. Fractions from this experiment were subject to SDS-PAGE analysis and the result is
shown in Figure 5-12. Figure 5-12 shows that the frmR gene has been over expressed with a
prominent band at the expected molecular weight (~10kDa) that is not present in the control
sample.
Figure 5-12 - SDS-PAGE analysis from expression trial with E. coli ∆frmR (DE3). Lane 1-Marker,
Lane 2- control sample, Lane 3- Induced cells, Lane 4- soluble fraction of the induced cells.
5.5 In vivo studies of FrmR function
Previously published work has indicated that FrmR represses transcription from the frmRAB
operon.176 On this basis, the reporter system that has been created should result in down
regulation of the reporter gene when grown in the presence of IPTG. It is also known that FrmR
repression is reduced in the presence of formaldehyde; the presence of formaldehyde should
therefore cause an increase in the transcription level of the reporter genes. A schematic diagram
of how these reporter systems should work is shown in Figure 5-16
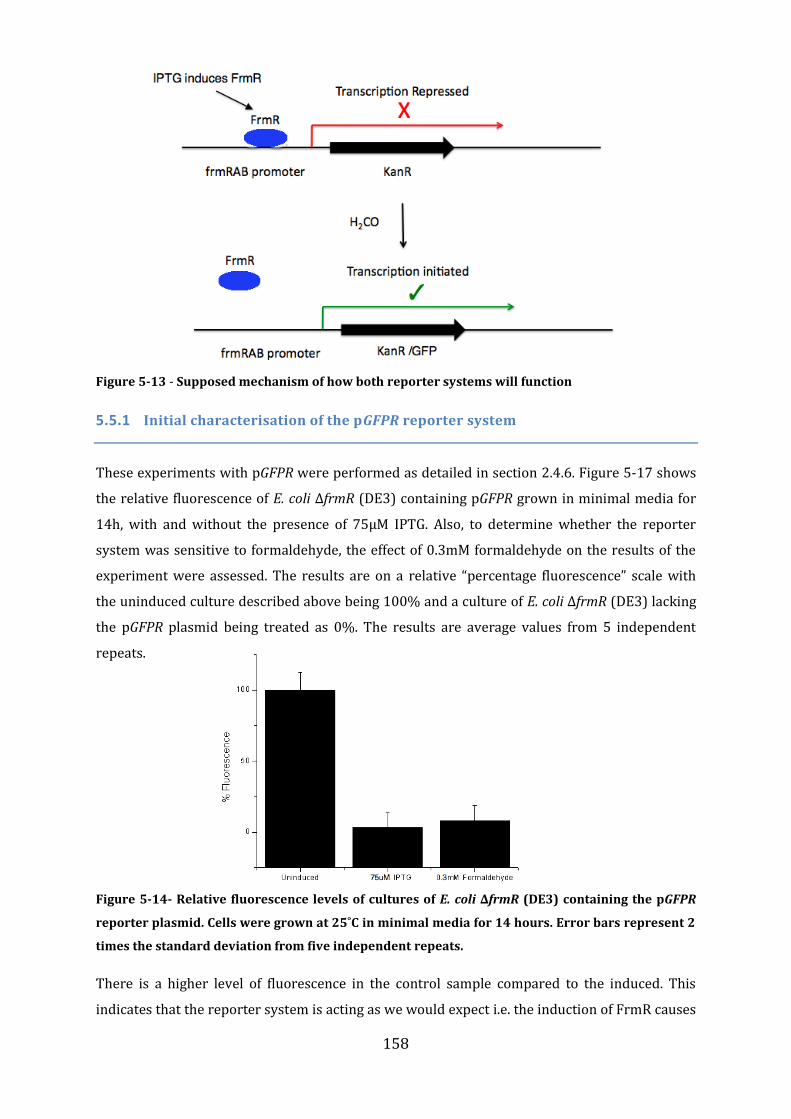
158
Figure 5-13 - Supposed mechanism of how both reporter systems will function
5.5.1 Initial characterisation of the pGFPR reporter system
These experiments with pGFPR were performed as detailed in section 2.4.6. Figure 5-17 shows
the relative fluorescence of E. coli ∆frmR (DE3) containing pGFPR grown in minimal media for
14h, with and without the presence of 75µM IPTG. Also, to determine whether the reporter
system was sensitive to formaldehyde, the effect of 0.3mM formaldehyde on the results of the
experiment were assessed. The results are on a relative “percentage fluorescence” scale with
the uninduced culture described above being 100% and a culture of E. coli ∆frmR (DE3) lacking
the pGFPR plasmid being treated as 0%. The results are average values from 5 independent
repeats.
Figure 5-14- Relative fluorescence levels of cultures of E. coli ∆frmR (DE3) containing the pGFPR
reporter plasmid. Cells were grown at 25˚C in minimal media for 14 hours. Error bars represent 2
times the standard deviation from five independent repeats.
There is a higher level of fluorescence in the control sample compared to the induced. This
indicates that the reporter system is acting as we would expect i.e. the induction of FrmR causes
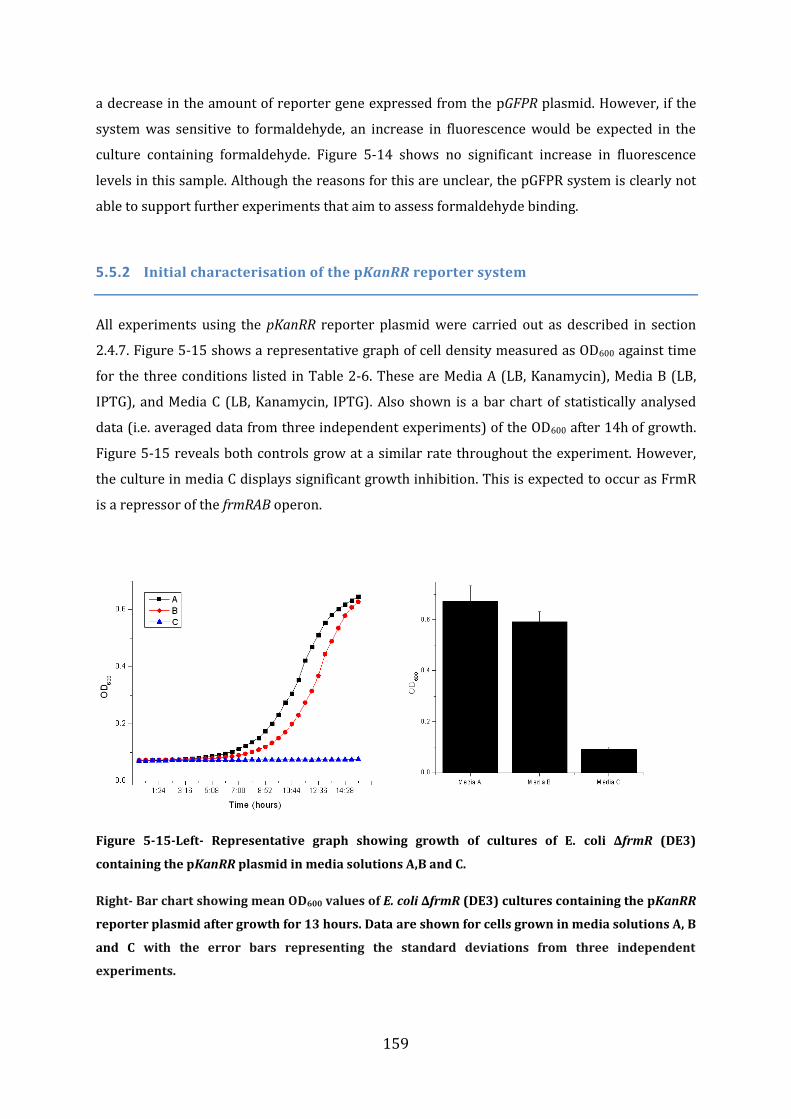
159
a decrease in the amount of reporter gene expressed from the pGFPR plasmid. However, if the
system was sensitive to formaldehyde, an increase in fluorescence would be expected in the
culture containing formaldehyde. Figure 5-14 shows no significant increase in fluorescence
levels in this sample. Although the reasons for this are unclear, the pGFPR system is clearly not
able to support further experiments that aim to assess formaldehyde binding.
5.5.2 Initial characterisation of the pKanRR reporter system
All experiments using the pKanRR reporter plasmid were carried out as described in section
2.4.7. Figure 5-15 shows a representative graph of cell density measured as OD600 against time
for the three conditions listed in Table 2-6. These are Media A (LB, Kanamycin), Media B (LB,
IPTG), and Media C (LB, Kanamycin, IPTG). Also shown is a bar chart of statistically analysed
data (i.e. averaged data from three independent experiments) of the OD600 after 14h of growth.
Figure 5-15 reveals both controls grow at a similar rate throughout the experiment. However,
the culture in media C displays significant growth inhibition. This is expected to occur as FrmR
is a repressor of the frmRAB operon.
Figure 5-15-Left- Representative graph showing growth of cultures of E. coli ∆frmR (DE3)
containing the pKanRR plasmid in media solutions A,B and C.
Right- Bar chart showing mean OD600 values of E. coli ∆frmR (DE3) cultures containing the pKanRR
reporter plasmid after growth for 13 hours. Data are shown for cells grown in media solutions A, B
and C with the error bars representing the standard deviations from three independent
experiments.
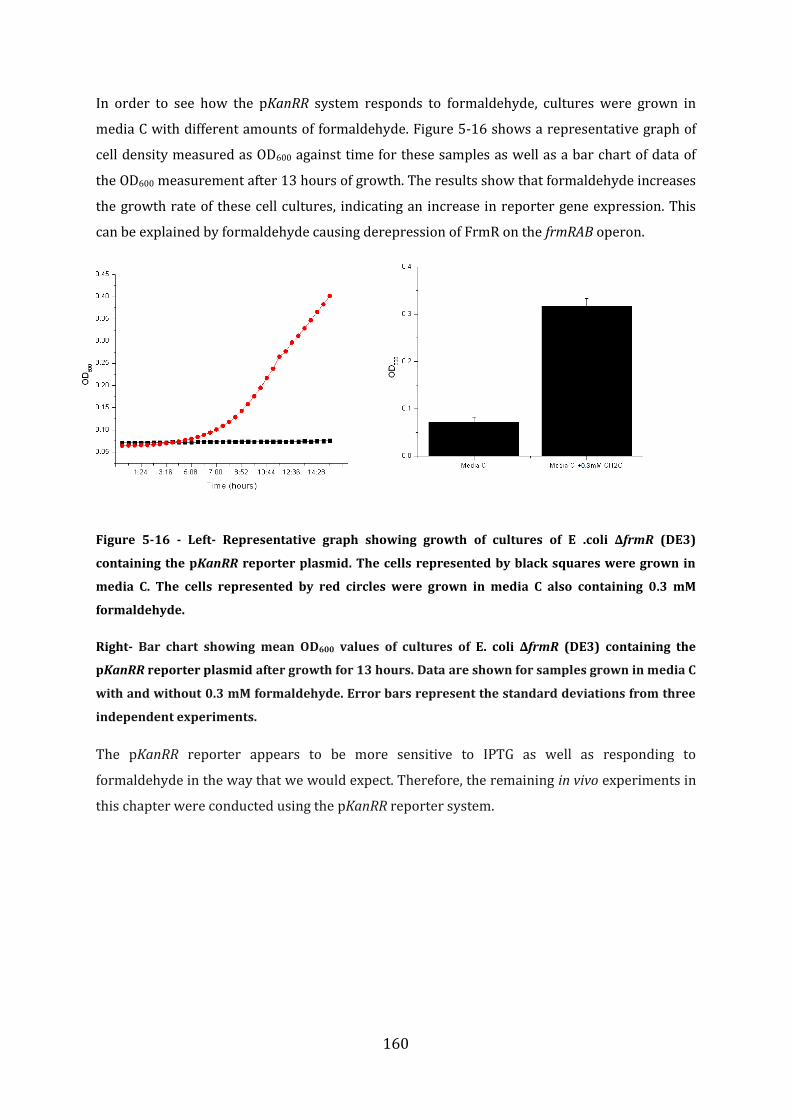
160
In order to see how the pKanRR system responds to formaldehyde, cultures were grown in
media C with different amounts of formaldehyde. Figure 5-16 shows a representative graph of
cell density measured as OD600 against time for these samples as well as a bar chart of data of
the OD600 measurement after 13 hours of growth. The results show that formaldehyde increases
the growth rate of these cell cultures, indicating an increase in reporter gene expression. This
can be explained by formaldehyde causing derepression of FrmR on the frmRAB operon.
Figure 5-16 - Left- Representative graph showing growth of cultures of E .coli ∆frmR (DE3)
containing the pKanRR reporter plasmid. The cells represented by black squares were grown in
media C. The cells represented by red circles were grown in media C also containing 0.3 mM
formaldehyde.
Right- Bar chart showing mean OD600 values of cultures of E. coli ∆frmR (DE3) containing the
pKanRR reporter plasmid after growth for 13 hours. Data are shown for samples grown in media C
with and without 0.3 mM formaldehyde. Error bars represent the standard deviations from three
independent experiments.
The pKanRR reporter appears to be more sensitive to IPTG as well as responding to
formaldehyde in the way that we would expect. Therefore, the remaining in vivo experiments in
this chapter were conducted using the pKanRR reporter system.
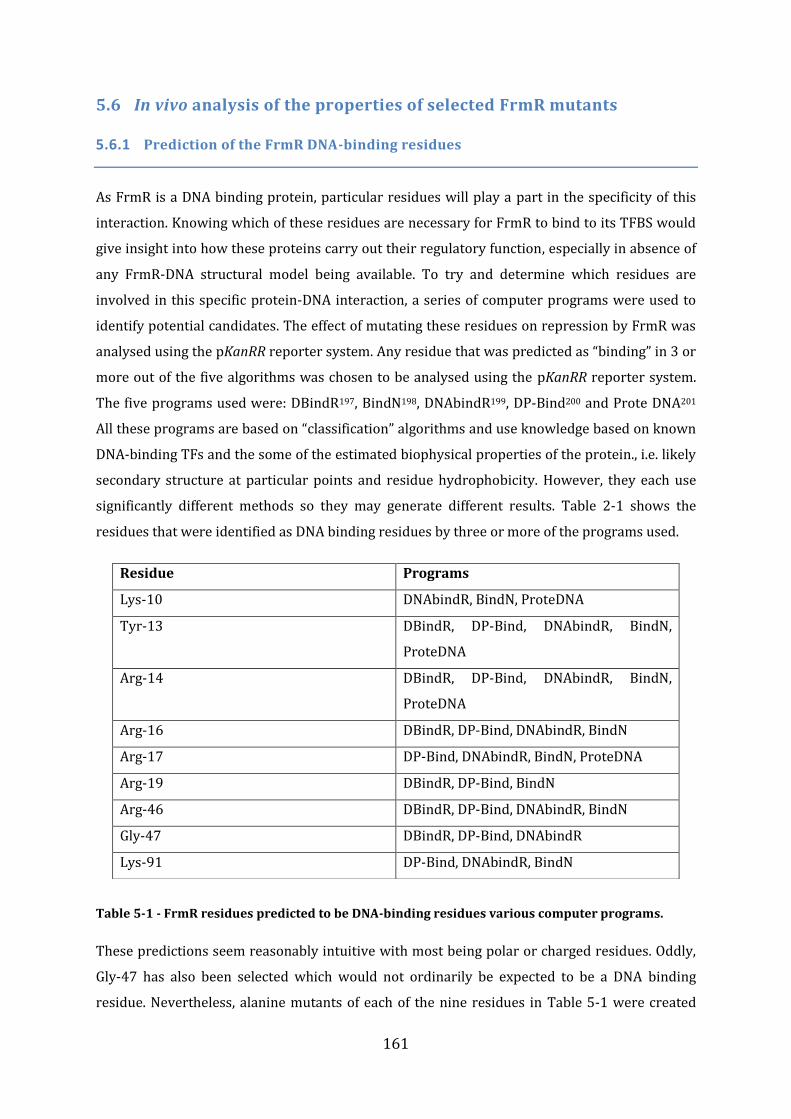
161
5.6 In vivo analysis of the properties of selected FrmR mutants
5.6.1 Prediction of the FrmR DNA-binding residues
As FrmR is a DNA binding protein, particular residues will play a part in the specificity of this
interaction. Knowing which of these residues are necessary for FrmR to bind to its TFBS would
give insight into how these proteins carry out their regulatory function, especially in absence of
any FrmR-DNA structural model being available. To try and determine which residues are
involved in this specific protein-DNA interaction, a series of computer programs were used to
identify potential candidates. The effect of mutating these residues on repression by FrmR was
analysed using the pKanRR reporter system. Any residue that was predicted as “binding” in 3 or
more out of the five algorithms was chosen to be analysed using the pKanRR reporter system.
The five programs used were: DBindR197, BindN198, DNAbindR199, DP-Bind200 and Prote DNA201
All these programs are based on “classification” algorithms and use knowledge based on known
DNA-binding TFs and the some of the estimated biophysical properties of the protein., i.e. likely
secondary structure at particular points and residue hydrophobicity. However, they each use
significantly different methods so they may generate different results. Table 2-1 shows the
residues that were identified as DNA binding residues by three or more of the programs used.
Table 5-1 - FrmR residues predicted to be DNA-binding residues various computer programs.
These predictions seem reasonably intuitive with most being polar or charged residues. Oddly,
Gly-47 has also been selected which would not ordinarily be expected to be a DNA binding
residue. Nevertheless, alanine mutants of each of the nine residues in Table 5-1 were created
Residue Programs
Lys-10 DNAbindR, BindN, ProteDNA
Tyr-13 DBindR, DP-Bind, DNAbindR, BindN,
ProteDNA
Arg-14 DBindR, DP-Bind, DNAbindR, BindN,
ProteDNA
Arg-16 DBindR, DP-Bind, DNAbindR, BindN
Arg-17 DP-Bind, DNAbindR, BindN, ProteDNA
Arg-19 DBindR, DP-Bind, BindN
Arg-46 DBindR, DP-Bind, DNAbindR, BindN
Gly-47 DBindR, DP-Bind, DNAbindR
Lys-91 DP-Bind, DNAbindR, BindN
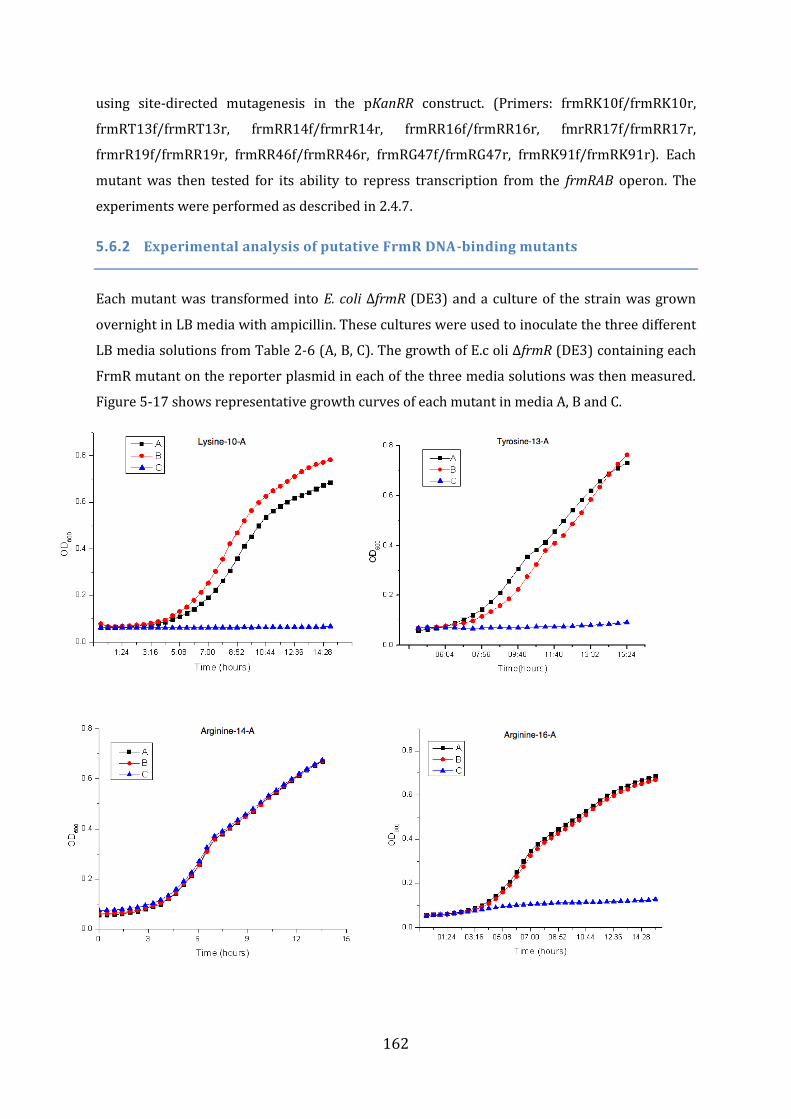
162
using site-directed mutagenesis in the pKanRR construct. (Primers: frmRK10f/frmRK10r,
frmRT13f/frmRT13r, frmRR14f/frmrR14r, frmRR16f/frmRR16r, fmrRR17f/frmRR17r,
frmrR19f/frmRR19r, frmRR46f/frmRR46r, frmRG47f/frmRG47r, frmRK91f/frmRK91r). Each
mutant was then tested for its ability to repress transcription from the frmRAB operon. The
experiments were performed as described in 2.4.7.
5.6.2 Experimental analysis of putative FrmR DNA-binding mutants
Each mutant was transformed into E. coli ∆frmR (DE3) and a culture of the strain was grown
overnight in LB media with ampicillin. These cultures were used to inoculate the three different
LB media solutions from Table 2-6 (A, B, C). The growth of E.c oli ∆frmR (DE3) containing each
FrmR mutant on the reporter plasmid in each of the three media solutions was then measured.
Figure 5-17 shows representative growth curves of each mutant in media A, B and C.
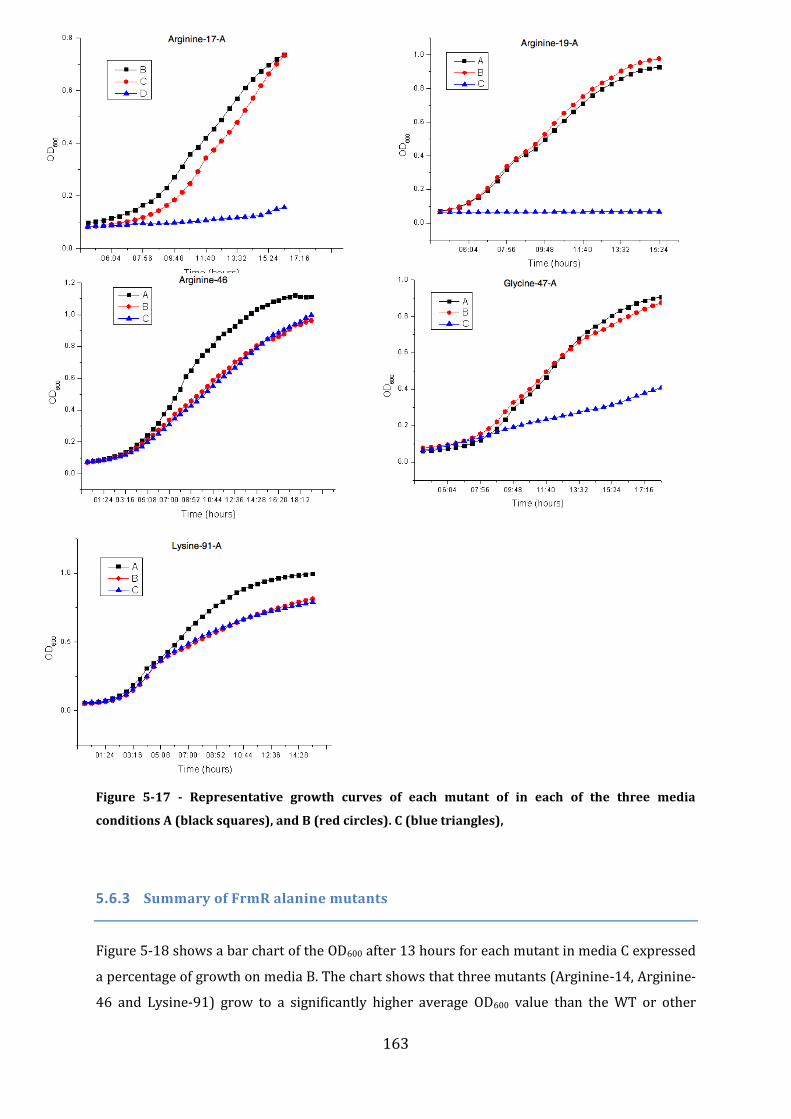
163
Figure 5-17 - Representative growth curves of each mutant of in each of the three media
conditions A (black squares), and B (red circles). C (blue triangles),
5.6.3 Summary of FrmR alanine mutants
Figure 5-18 shows a bar chart of the OD600 after 13 hours for each mutant in media C expressed
a percentage of growth on media B. The chart shows that three mutants (Arginine-14, Arginine-
46 and Lysine-91) grow to a significantly higher average OD600 value than the WT or other
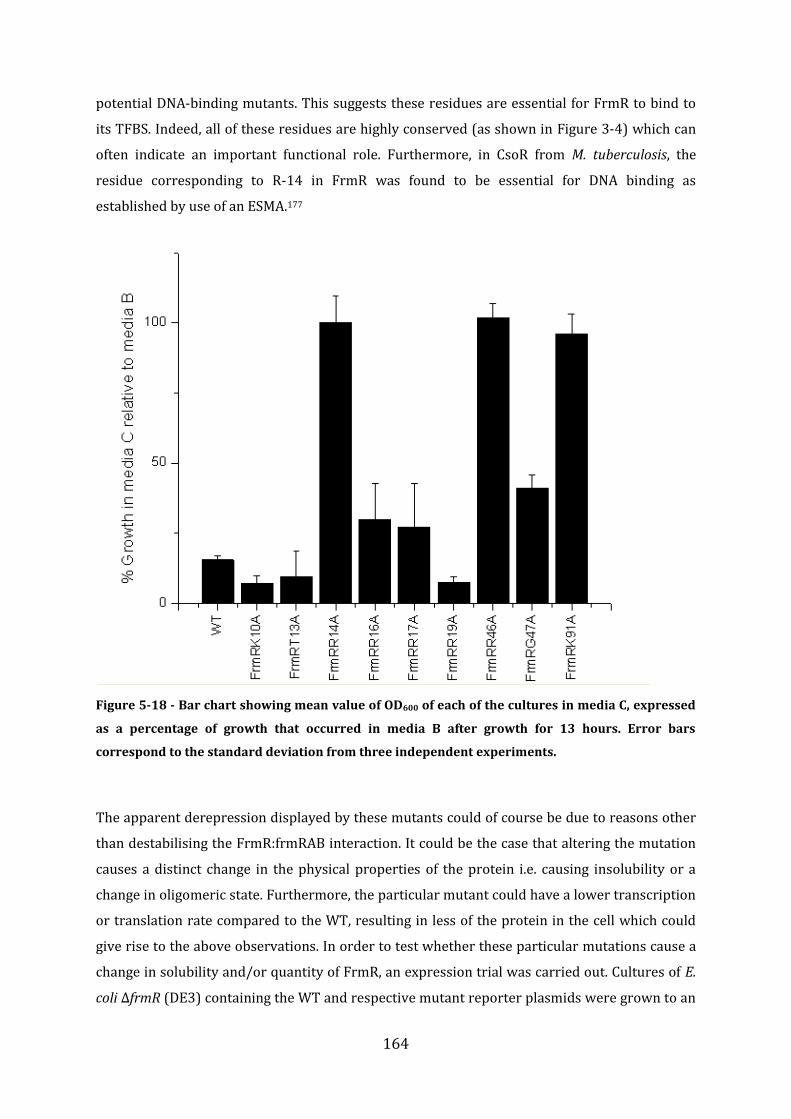
164
potential DNA-binding mutants. This suggests these residues are essential for FrmR to bind to
its TFBS. Indeed, all of these residues are highly conserved (as shown in Figure 3-4) which can
often indicate an important functional role. Furthermore, in CsoR from M. tuberculosis, the
residue corresponding to R-14 in FrmR was found to be essential for DNA binding as
established by use of an ESMA.177
Figure 5-18 - Bar chart showing mean value of OD600 of each of the cultures in media C, expressed
as a percentage of growth that occurred in media B after growth for 13 hours. Error bars
correspond to the standard deviation from three independent experiments.
The apparent derepression displayed by these mutants could of course be due to reasons other
than destabilising the FrmR:frmRAB interaction. It could be the case that altering the mutation
causes a distinct change in the physical properties of the protein i.e. causing insolubility or a
change in oligomeric state. Furthermore, the particular mutant could have a lower transcription
or translation rate compared to the WT, resulting in less of the protein in the cell which could
give rise to the above observations. In order to test whether these particular mutations cause a
change in solubility and/or quantity of FrmR, an expression trial was carried out. Cultures of E.
coli ∆frmR (DE3) containing the WT and respective mutant reporter plasmids were grown to an
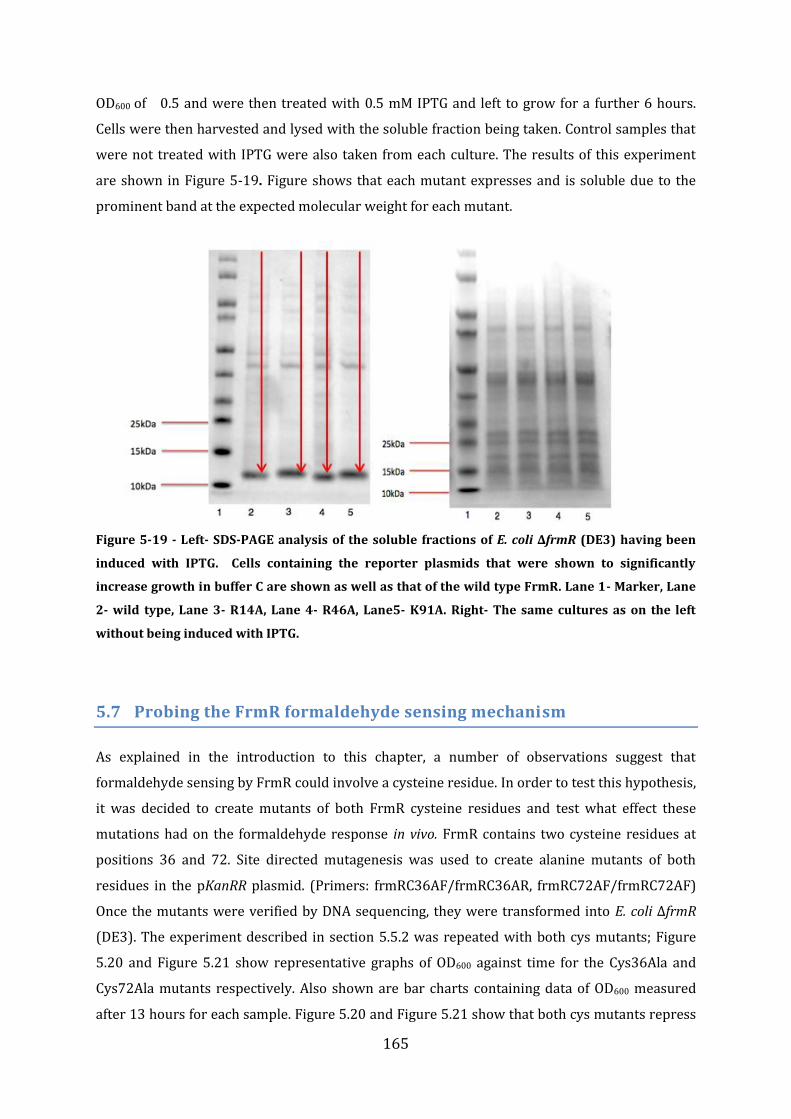
165
OD600 of 0.5 and were then treated with 0.5 mM IPTG and left to grow for a further 6 hours.
Cells were then harvested and lysed with the soluble fraction being taken. Control samples that
were not treated with IPTG were also taken from each culture. The results of this experiment
are shown in Figure 5-19. Figure shows that each mutant expresses and is soluble due to the
prominent band at the expected molecular weight for each mutant.
Figure 5-19 - Left- SDS-PAGE analysis of the soluble fractions of E. coli ∆frmR (DE3) having been
induced with IPTG. Cells containing the reporter plasmids that were shown to significantly
increase growth in buffer C are shown as well as that of the wild type FrmR. Lane 1- Marker, Lane
2- wild type, Lane 3- R14A, Lane 4- R46A, Lane5- K91A. Right- The same cultures as on the left
without being induced with IPTG.
5.7 Probing the FrmR formaldehyde sensing mechanism
As explained in the introduction to this chapter, a number of observations suggest that
formaldehyde sensing by FrmR could involve a cysteine residue. In order to test this hypothesis,
it was decided to create mutants of both FrmR cysteine residues and test what effect these
mutations had on the formaldehyde response in vivo. FrmR contains two cysteine residues at
positions 36 and 72. Site directed mutagenesis was used to create alanine mutants of both
residues in the pKanRR plasmid. (Primers: frmRC36AF/frmRC36AR, frmRC72AF/frmRC72AF)
Once the mutants were verified by DNA sequencing, they were transformed into E. coli ∆frmR
(DE3). The experiment described in section 5.5.2 was repeated with both cys mutants; Figure
5.20 and Figure 5.21 show representative graphs of OD600 against time for the Cys36Ala and
Cys72Ala mutants respectively. Also shown are bar charts containing data of OD600 measured
after 13 hours for each sample. Figure 5.20 and Figure 5.21 show that both cys mutants repress
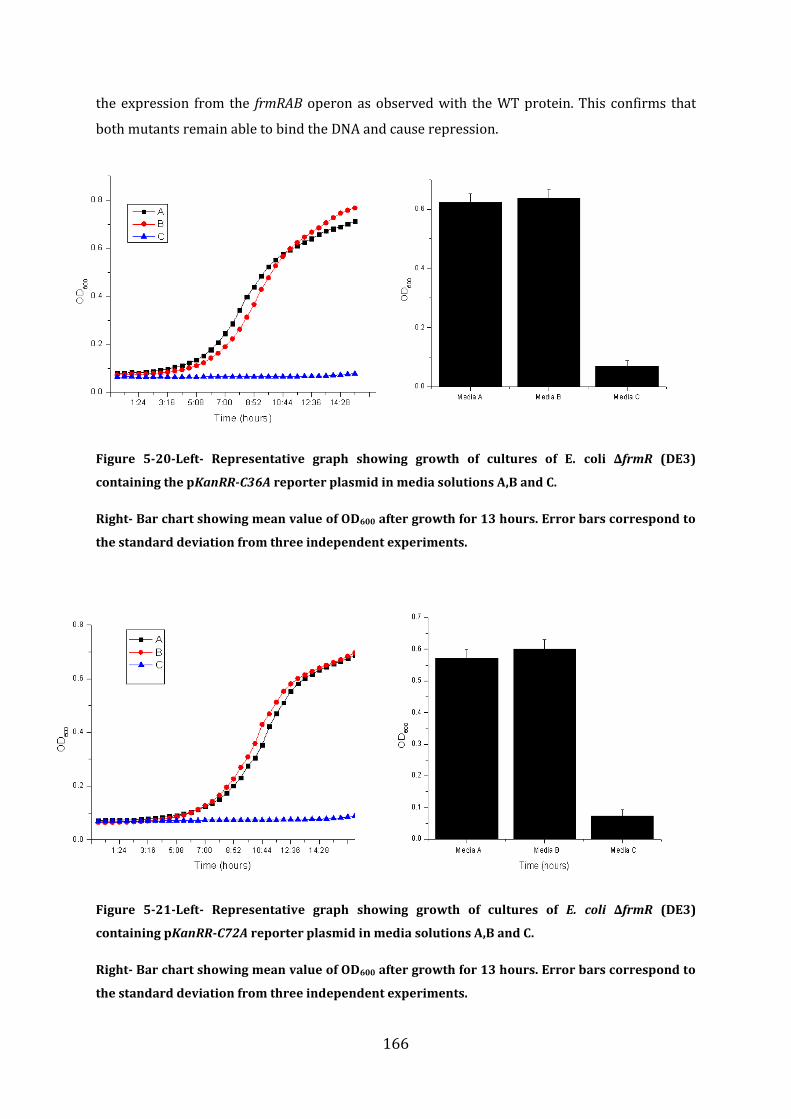
166
the expression from the frmRAB operon as observed with the WT protein. This confirms that
both mutants remain able to bind the DNA and cause repression.
Figure 5-20-Left- Representative graph showing growth of cultures of E. coli ∆frmR (DE3)
containing the pKanRR-C36A reporter plasmid in media solutions A,B and C.
Right- Bar chart showing mean value of OD600 after growth for 13 hours. Error bars correspond to
the standard deviation from three independent experiments.
Figure 5-21-Left- Representative graph showing growth of cultures of E. coli ∆frmR (DE3)
containing pKanRR-C72A reporter plasmid in media solutions A,B and C.
Right- Bar chart showing mean value of OD600 after growth for 13 hours. Error bars correspond to
the standard deviation from three independent experiments.
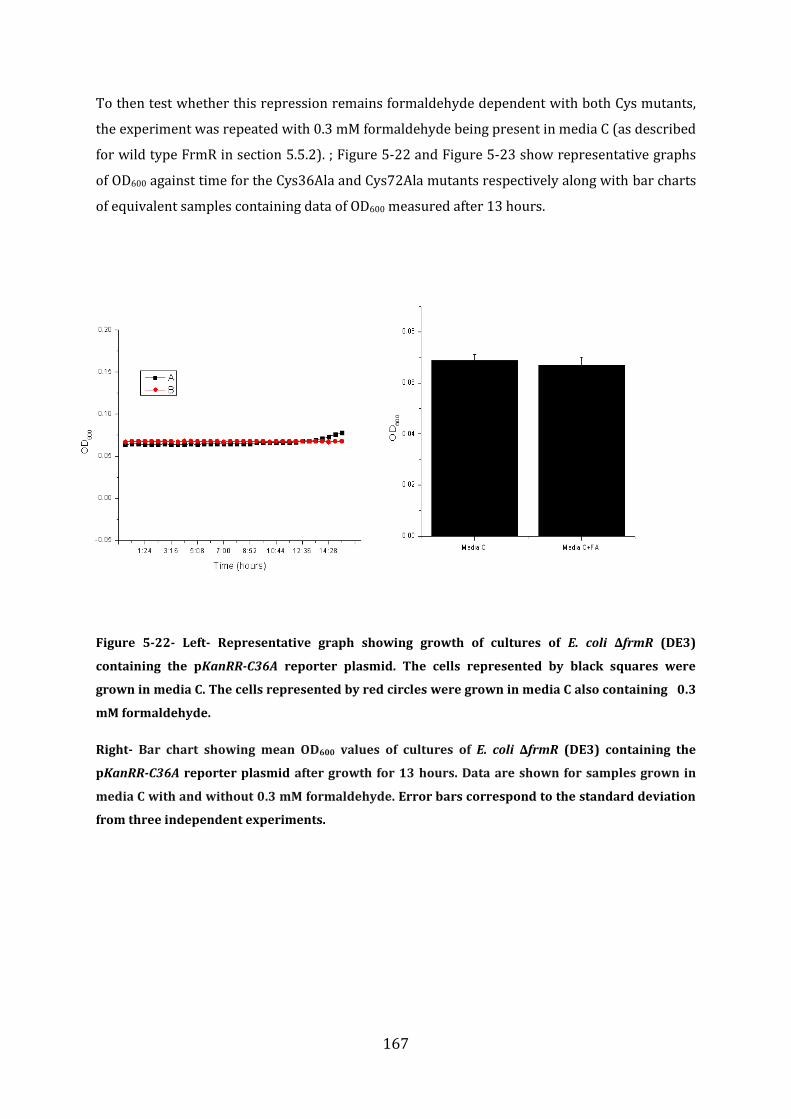
167
To then test whether this repression remains formaldehyde dependent with both Cys mutants,
the experiment was repeated with 0.3 mM formaldehyde being present in media C (as described
for wild type FrmR in section 5.5.2). ; Figure 5-22 and Figure 5-23 show representative graphs
of OD600 against time for the Cys36Ala and Cys72Ala mutants respectively along with bar charts
of equivalent samples containing data of OD600 measured after 13 hours.
Figure 5-22- Left- Representative graph showing growth of cultures of E. coli ∆frmR (DE3)
containing the pKanRR-C36A reporter plasmid. The cells represented by black squares were
grown in media C. The cells represented by red circles were grown in media C also containing 0.3
mM formaldehyde.
Right- Bar chart showing mean OD600 values of cultures of E. coli ∆frmR (DE3) containing the
pKanRR-C36A reporter plasmid after growth for 13 hours. Data are shown for samples grown in
media C with and without 0.3 mM formaldehyde. Error bars correspond to the standard deviation
from three independent experiments.
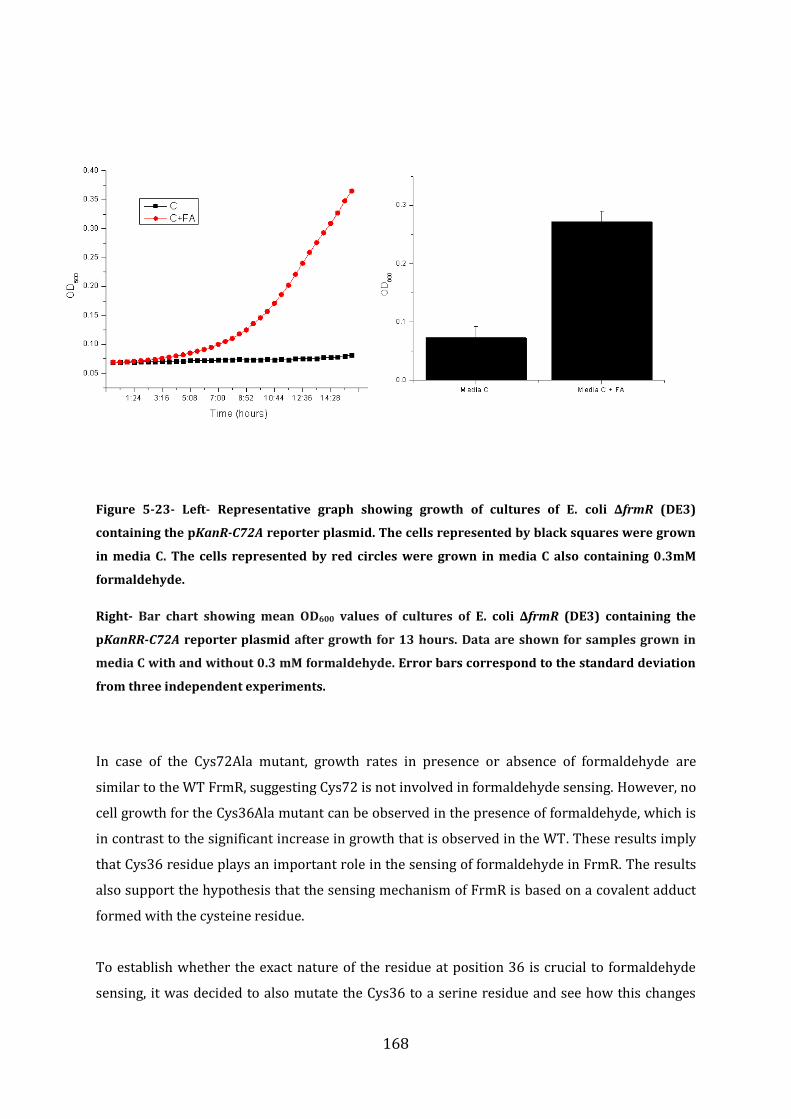
168
Figure 5-23- Left- Representative graph showing growth of cultures of E. coli ∆frmR (DE3)
containing the pKanR-C72A reporter plasmid. The cells represented by black squares were grown
in media C. The cells represented by red circles were grown in media C also containing 0.3mM
formaldehyde.
Right- Bar chart showing mean OD600 values of cultures of E. coli ∆frmR (DE3) containing the
pKanRR-C72A reporter plasmid after growth for 13 hours. Data are shown for samples grown in
media C with and without 0.3 mM formaldehyde. Error bars correspond to the standard deviation
from three independent experiments.
In case of the Cys72Ala mutant, growth rates in presence or absence of formaldehyde are
similar to the WT FrmR, suggesting Cys72 is not involved in formaldehyde sensing. However, no
cell growth for the Cys36Ala mutant can be observed in the presence of formaldehyde, which is
in contrast to the significant increase in growth that is observed in the WT. These results imply
that Cys36 residue plays an important role in the sensing of formaldehyde in FrmR. The results
also support the hypothesis that the sensing mechanism of FrmR is based on a covalent adduct
formed with the cysteine residue.
To establish whether the exact nature of the residue at position 36 is crucial to formaldehyde
sensing, it was decided to also mutate the Cys36 to a serine residue and see how this changes
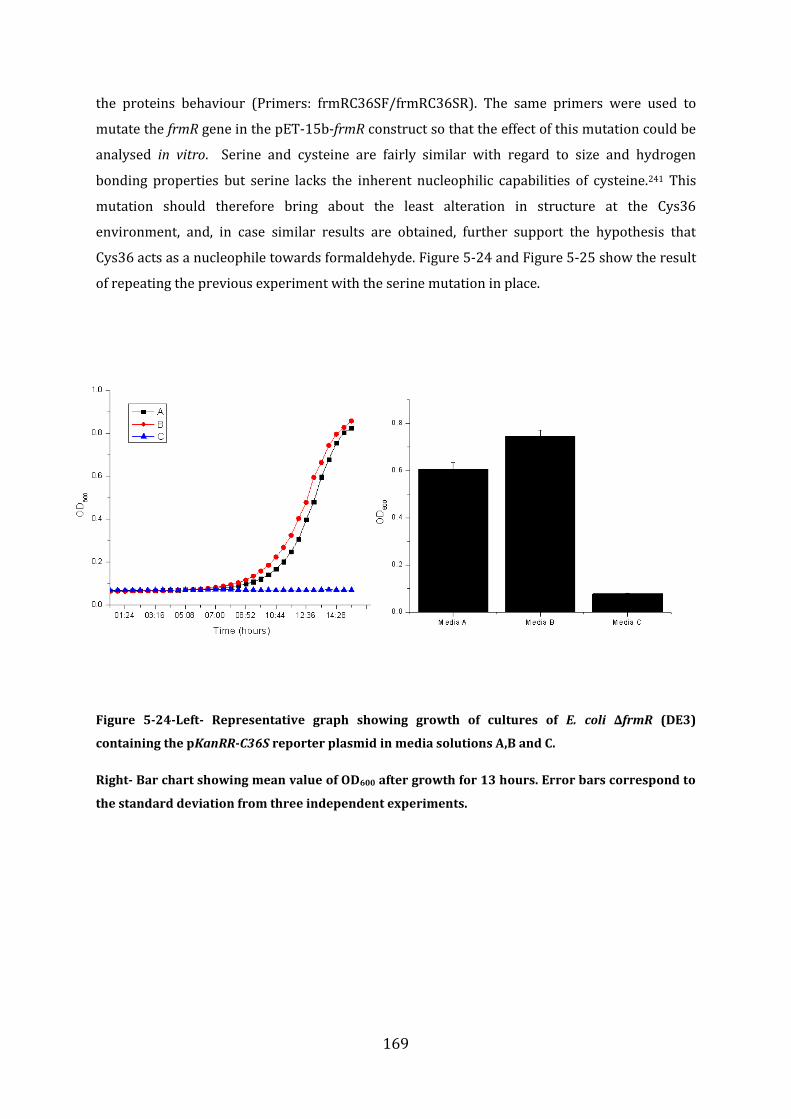
169
the proteins behaviour (Primers: frmRC36SF/frmRC36SR). The same primers were used to
mutate the frmR gene in the pET-15b-frmR construct so that the effect of this mutation could be
analysed in vitro. Serine and cysteine are fairly similar with regard to size and hydrogen
bonding properties but serine lacks the inherent nucleophilic capabilities of cysteine.241 This
mutation should therefore bring about the least alteration in structure at the Cys36
environment, and, in case similar results are obtained, further support the hypothesis that
Cys36 acts as a nucleophile towards formaldehyde. Figure 5-24 and Figure 5-25 show the result
of repeating the previous experiment with the serine mutation in place.
Figure 5-24-Left- Representative graph showing growth of cultures of E. coli ∆frmR (DE3)
containing the pKanRR-C36S reporter plasmid in media solutions A,B and C.
Right- Bar chart showing mean value of OD600 after growth for 13 hours. Error bars correspond to
the standard deviation from three independent experiments.
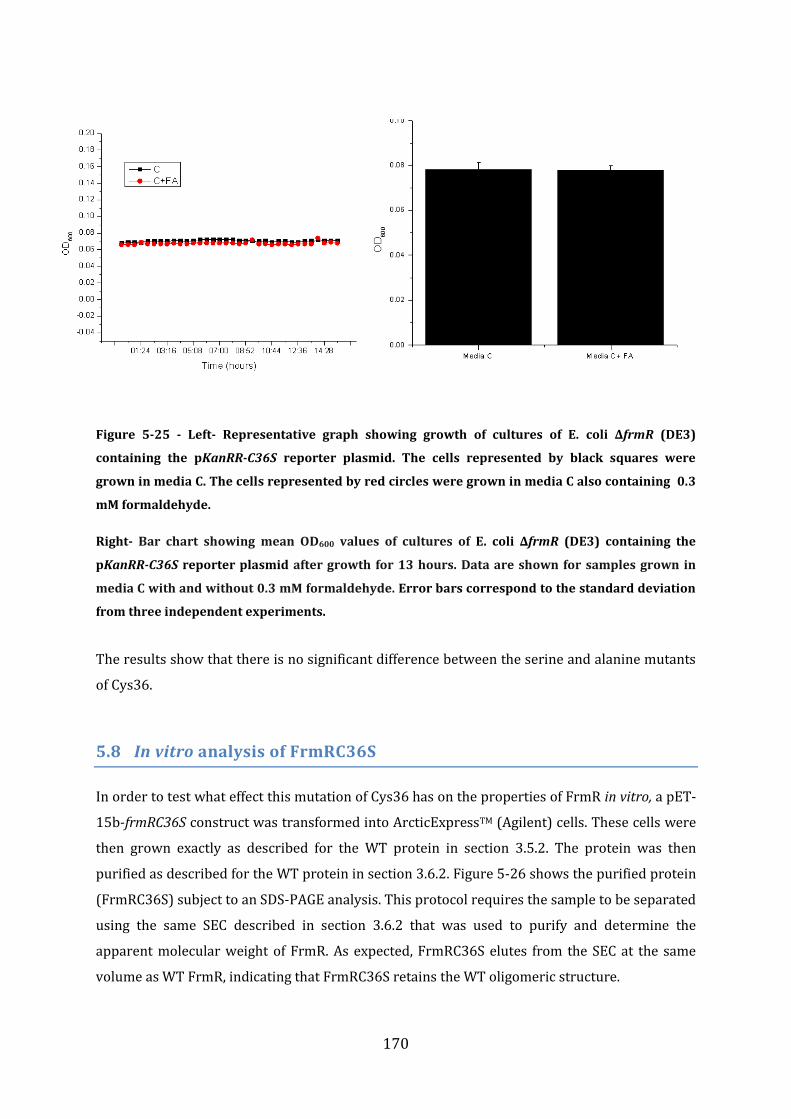
170
Figure 5-25 - Left- Representative graph showing growth of cultures of E. coli ∆frmR (DE3)
containing the pKanRR-C36S reporter plasmid. The cells represented by black squares were
grown in media C. The cells represented by red circles were grown in media C also containing 0.3
mM formaldehyde.
Right- Bar chart showing mean OD600 values of cultures of E. coli ∆frmR (DE3) containing the
pKanRR-C36S reporter plasmid after growth for 13 hours. Data are shown for samples grown in
media C with and without 0.3 mM formaldehyde. Error bars correspond to the standard deviation
from three independent experiments.
The results show that there is no significant difference between the serine and alanine mutants
of Cys36.
5.8 In vitro analysis of FrmRC36S
In order to test what effect this mutation of Cys36 has on the properties of FrmR in vitro, a pET-
15b-frmRC36S construct was transformed into ArcticExpressTM (Agilent) cells. These cells were
then grown exactly as described for the WT protein in section 3.5.2. The protein was then
purified as described for the WT protein in section 3.6.2. Figure 5-26 shows the purified protein
(FrmRC36S) subject to an SDS-PAGE analysis. This protocol requires the sample to be separated
using the same SEC described in section 3.6.2 that was used to purify and determine the
apparent molecular weight of FrmR. As expected, FrmRC36S elutes from the SEC at the same
volume as WT FrmR, indicating that FrmRC36S retains the WT oligomeric structure.
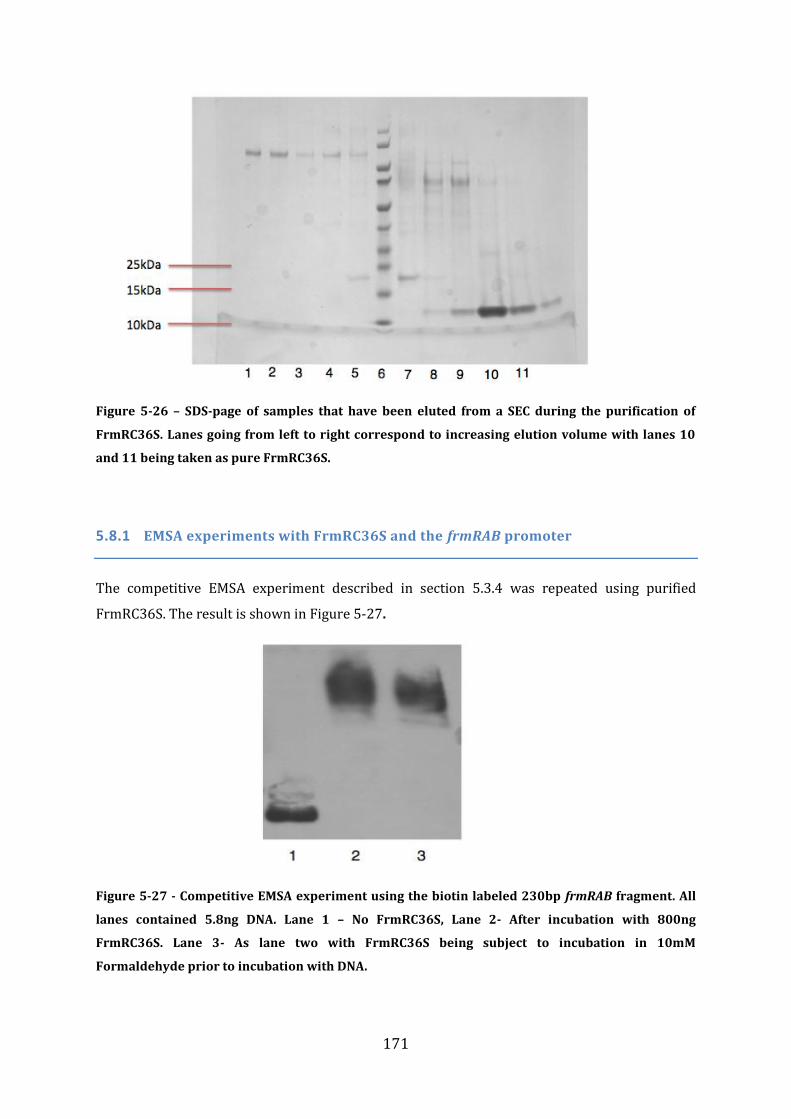
171
Figure 5-26 – SDS-page of samples that have been eluted from a SEC during the purification of
FrmRC36S. Lanes going from left to right correspond to increasing elution volume with lanes 10
and 11 being taken as pure FrmRC36S.
5.8.1 EMSA experiments with FrmRC36S and the frmRAB promoter
The competitive EMSA experiment described in section 5.3.4 was repeated using purified
FrmRC36S. The result is shown in Figure 5-27.
Figure 5-27 - Competitive EMSA experiment using the biotin labeled 230bp frmRAB fragment. All
lanes contained 5.8ng DNA. Lane 1 – No FrmRC36S, Lane 2- After incubation with 800ng
FrmRC36S. Lane 3- As lane two with FrmRC36S being subject to incubation in 10mM
Formaldehyde prior to incubation with DNA.
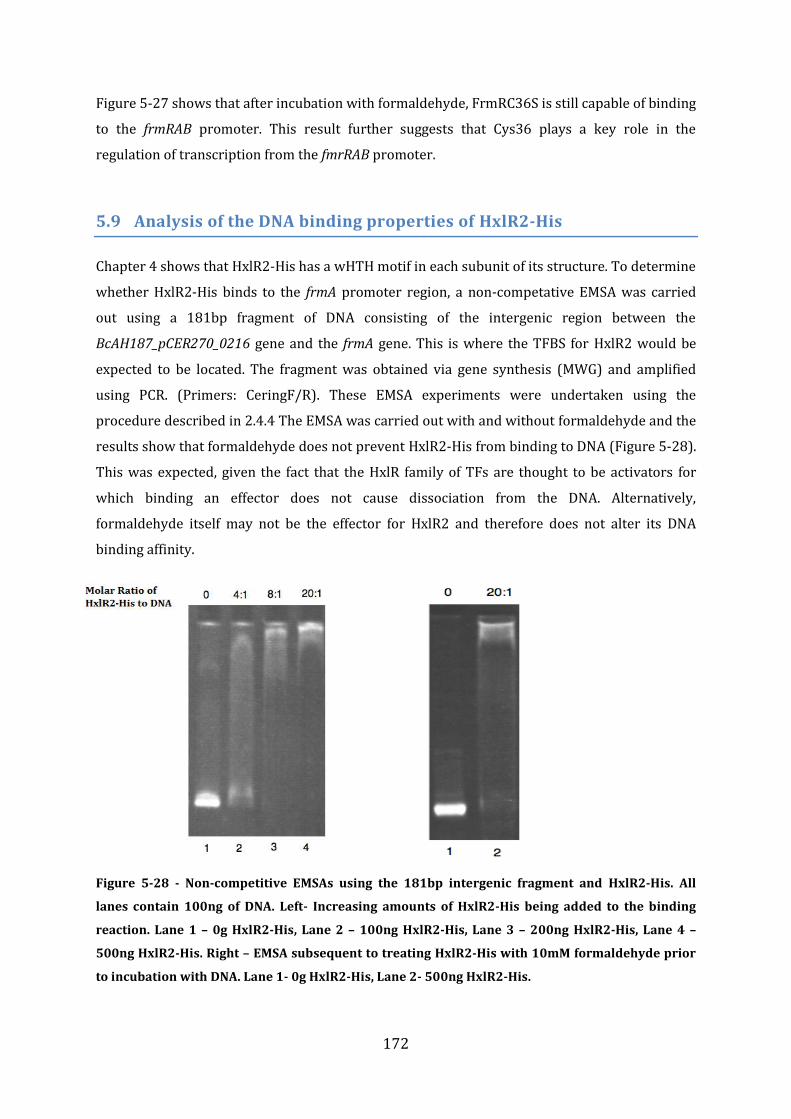
172
Figure 5-27 shows that after incubation with formaldehyde, FrmRC36S is still capable of binding
to the frmRAB promoter. This result further suggests that Cys36 plays a key role in the
regulation of transcription from the fmrRAB promoter.
5.9 Analysis of the DNA binding properties of HxlR2-His
Chapter 4 shows that HxlR2-His has a wHTH motif in each subunit of its structure. To determine
whether HxlR2-His binds to the frmA promoter region, a non-competative EMSA was carried
out using a 181bp fragment of DNA consisting of the intergenic region between the
BcAH187_pCER270_0216 gene and the frmA gene. This is where the TFBS for HxlR2 would be
expected to be located. The fragment was obtained via gene synthesis (MWG) and amplified
using PCR. (Primers: CeringF/R). These EMSA experiments were undertaken using the
procedure described in 2.4.4 The EMSA was carried out with and without formaldehyde and the
results show that formaldehyde does not prevent HxlR2-His from binding to DNA (Figure 5-28).
This was expected, given the fact that the HxlR family of TFs are thought to be activators for
which binding an effector does not cause dissociation from the DNA. Alternatively,
formaldehyde itself may not be the effector for HxlR2 and therefore does not alter its DNA
binding affinity.
Figure 5-28 - Non-competitive EMSAs using the 181bp intergenic fragment and HxlR2-His. All
lanes contain 100ng of DNA. Left- Increasing amounts of HxlR2-His being added to the binding
reaction. Lane 1 – 0g HxlR2-His, Lane 2 – 100ng HxlR2-His, Lane 3 – 200ng HxlR2-His, Lane 4 –
500ng HxlR2-His. Right – EMSA subsequent to treating HxlR2-His with 10mM formaldehyde prior
to incubation with DNA. Lane 1- 0g HxlR2-His, Lane 2- 500ng HxlR2-His.
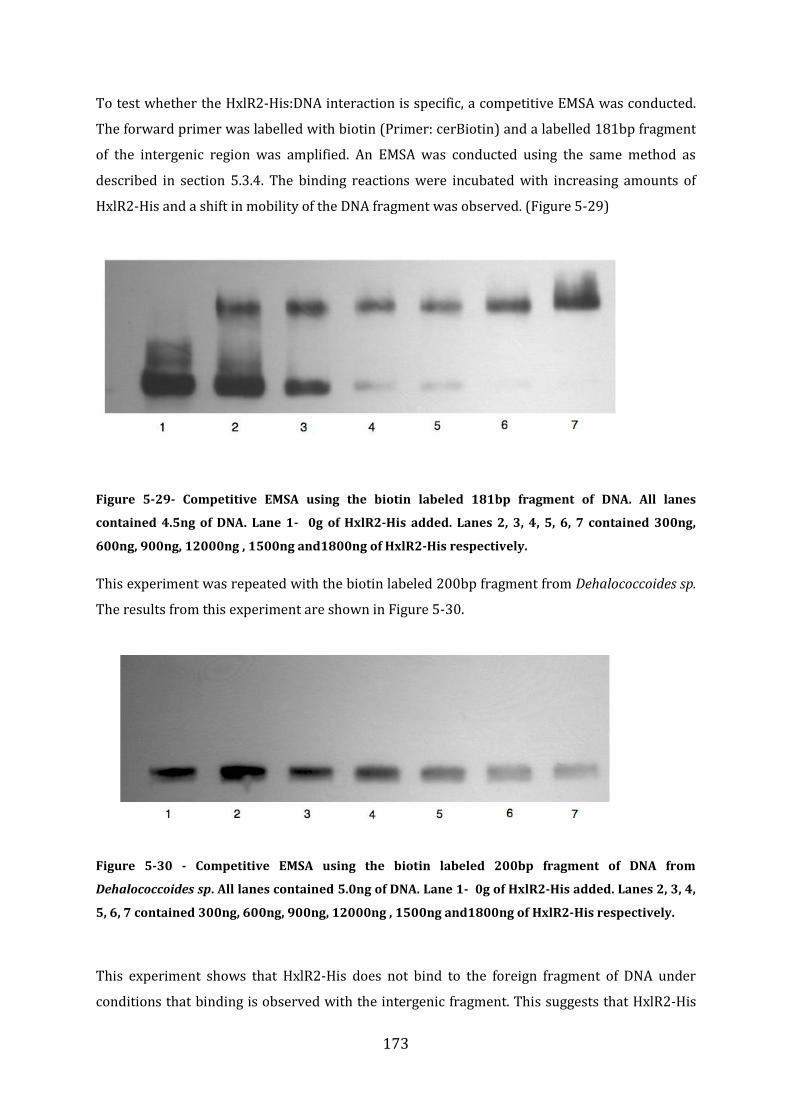
173
To test whether the HxlR2-His:DNA interaction is specific, a competitive EMSA was conducted.
The forward primer was labelled with biotin (Primer: cerBiotin) and a labelled 181bp fragment
of the intergenic region was amplified. An EMSA was conducted using the same method as
described in section 5.3.4. The binding reactions were incubated with increasing amounts of
HxlR2-His and a shift in mobility of the DNA fragment was observed. (Figure 5-29)
Figure 5-29- Competitive EMSA using the biotin labeled 181bp fragment of DNA. All lanes
contained 4.5ng of DNA. Lane 1- 0g of HxlR2-His added. Lanes 2, 3, 4, 5, 6, 7 contained 300ng,
600ng, 900ng, 12000ng , 1500ng and1800ng of HxlR2-His respectively.
This experiment was repeated with the biotin labeled 200bp fragment from Dehalococcoides sp.
The results from this experiment are shown in Figure 5-30.
Figure 5-30 - Competitive EMSA using the biotin labeled 200bp fragment of DNA from
Dehalococcoides sp. All lanes contained 5.0ng of DNA. Lane 1- 0g of HxlR2-His added. Lanes 2, 3, 4,
5, 6, 7 contained 300ng, 600ng, 900ng, 12000ng , 1500ng and1800ng of HxlR2-His respectively.
This experiment shows that HxlR2-His does not bind to the foreign fragment of DNA under
conditions that binding is observed with the intergenic fragment. This suggests that HxlR2-His
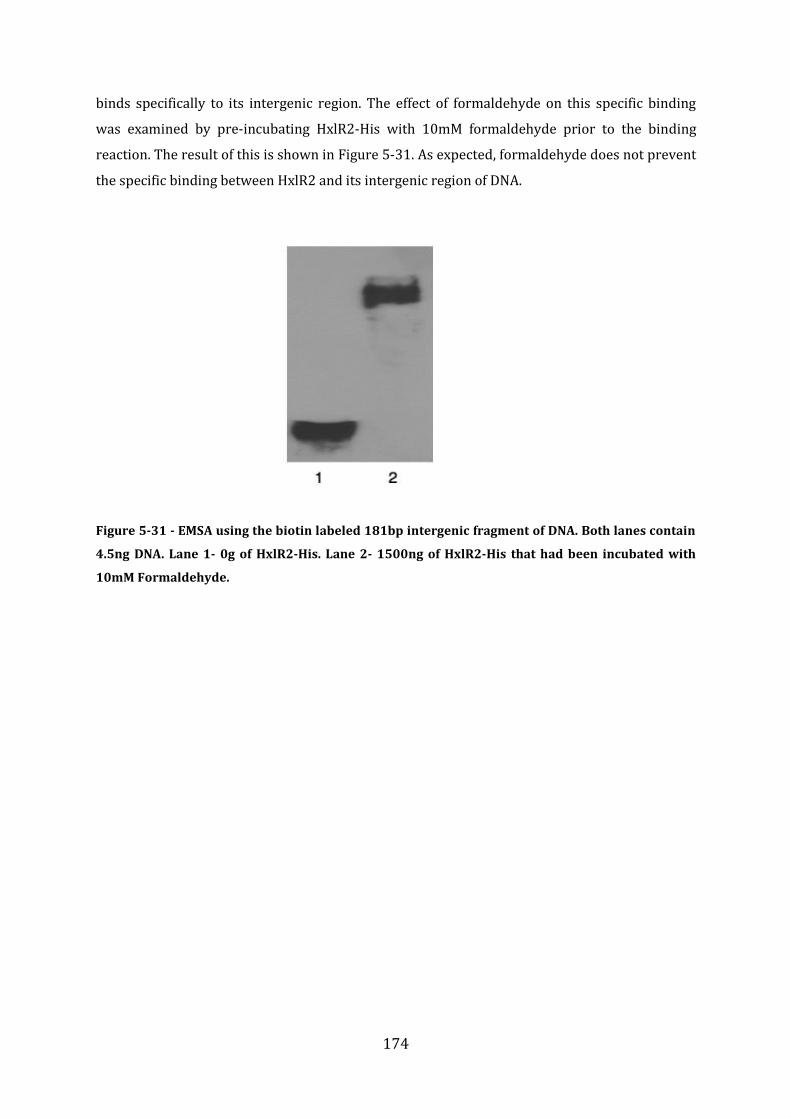
174
binds specifically to its intergenic region. The effect of formaldehyde on this specific binding
was examined by pre-incubating HxlR2-His with 10mM formaldehyde prior to the binding
reaction. The result of this is shown in Figure 5-31. As expected, formaldehyde does not prevent
the specific binding between HxlR2 and its intergenic region of DNA.
Figure 5-31 - EMSA using the biotin labeled 181bp intergenic fragment of DNA. Both lanes contain
4.5ng DNA. Lane 1- 0g of HxlR2-His. Lane 2- 1500ng of HxlR2-His that had been incubated with
10mM Formaldehyde.
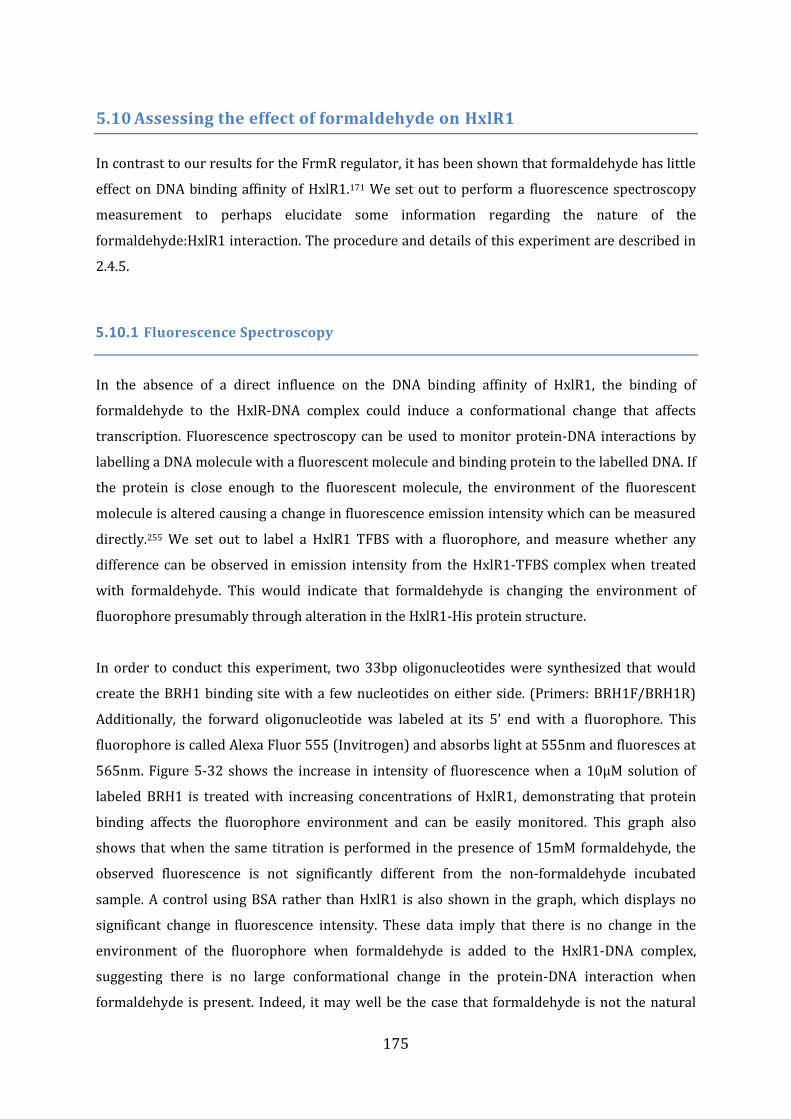
175
5.10 Assessing the effect of formaldehyde on HxlR1
In contrast to our results for the FrmR regulator, it has been shown that formaldehyde has little
effect on DNA binding affinity of HxlR1.171 We set out to perform a fluorescence spectroscopy
measurement to perhaps elucidate some information regarding the nature of the
formaldehyde:HxlR1 interaction. The procedure and details of this experiment are described in
2.4.5.
5.10.1 Fluorescence Spectroscopy
In the absence of a direct influence on the DNA binding affinity of HxlR1, the binding of
formaldehyde to the HxlR-DNA complex could induce a conformational change that affects
transcription. Fluorescence spectroscopy can be used to monitor protein-DNA interactions by
labelling a DNA molecule with a fluorescent molecule and binding protein to the labelled DNA. If
the protein is close enough to the fluorescent molecule, the environment of the fluorescent
molecule is altered causing a change in fluorescence emission intensity which can be measured
directly.255 We set out to label a HxlR1 TFBS with a fluorophore, and measure whether any
difference can be observed in emission intensity from the HxlR1-TFBS complex when treated
with formaldehyde. This would indicate that formaldehyde is changing the environment of
fluorophore presumably through alteration in the HxlR1-His protein structure.
In order to conduct this experiment, two 33bp oligonucleotides were synthesized that would
create the BRH1 binding site with a few nucleotides on either side. (Primers: BRH1F/BRH1R)
Additionally, the forward oligonucleotide was labeled at its 5’ end with a fluorophore. This
fluorophore is called Alexa Fluor 555 (Invitrogen) and absorbs light at 555nm and fluoresces at
565nm. Figure 5-32 shows the increase in intensity of fluorescence when a 10μM solution of
labeled BRH1 is treated with increasing concentrations of HxlR1, demonstrating that protein
binding affects the fluorophore environment and can be easily monitored. This graph also
shows that when the same titration is performed in the presence of 15mM formaldehyde, the
observed fluorescence is not significantly different from the non-formaldehyde incubated
sample. A control using BSA rather than HxlR1 is also shown in the graph, which displays no
significant change in fluorescence intensity. These data imply that there is no change in the
environment of the fluorophore when formaldehyde is added to the HxlR1-DNA complex,
suggesting there is no large conformational change in the protein-DNA interaction when
formaldehyde is present. Indeed, it may well be the case that formaldehyde is not the natural
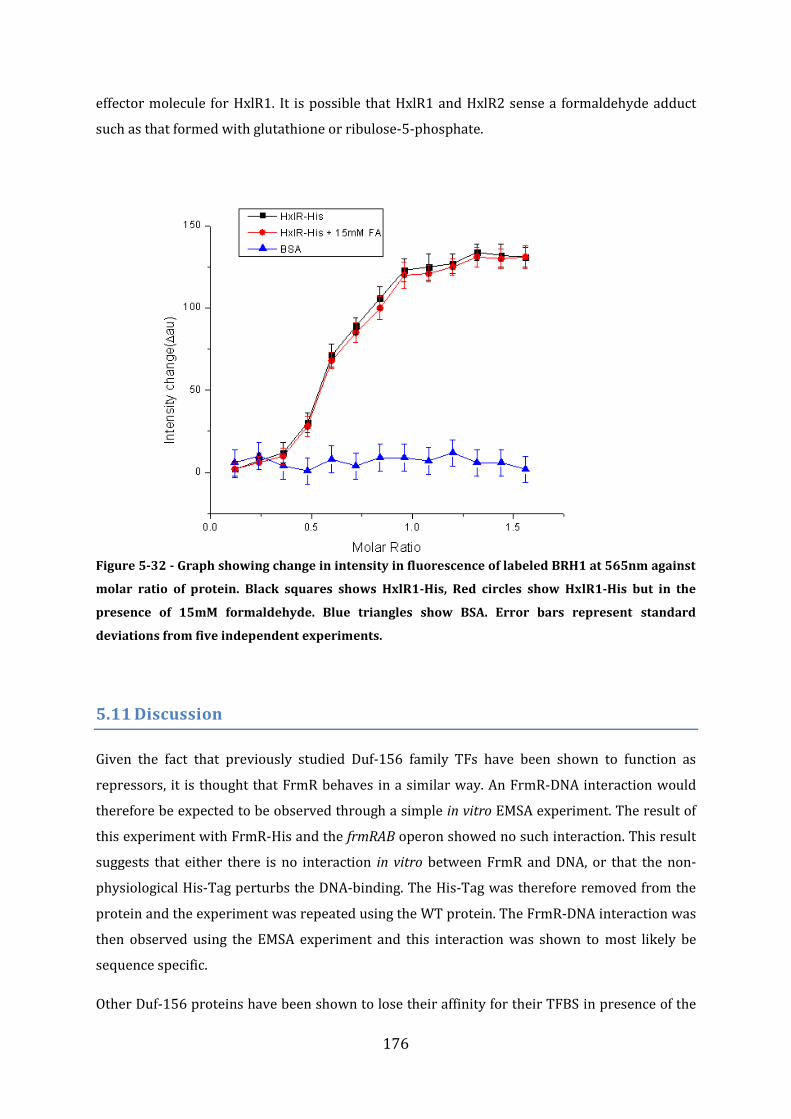
176
effector molecule for HxlR1. It is possible that HxlR1 and HxlR2 sense a formaldehyde adduct
such as that formed with glutathione or ribulose-5-phosphate.
Figure 5-32 - Graph showing change in intensity in fluorescence of labeled BRH1 at 565nm against
molar ratio of protein. Black squares shows HxlR1-His, Red circles show HxlR1-His but in the
presence of 15mM formaldehyde. Blue triangles show BSA. Error bars represent standard
deviations from five independent experiments.
5.11 Discussion
Given the fact that previously studied Duf-156 family TFs have been shown to function as
repressors, it is thought that FrmR behaves in a similar way. An FrmR-DNA interaction would
therefore be expected to be observed through a simple in vitro EMSA experiment. The result of
this experiment with FrmR-His and the frmRAB operon showed no such interaction. This result
suggests that either there is no interaction in vitro between FrmR and DNA, or that the non-
physiological His-Tag perturbs the DNA-binding. The His-Tag was therefore removed from the
protein and the experiment was repeated using the WT protein. The FrmR-DNA interaction was
then observed using the EMSA experiment and this interaction was shown to most likely be
sequence specific.
Other Duf-156 proteins have been shown to lose their affinity for their TFBS in presence of the
177
respective effector molecules. In case of FrmR, pre-incubations with 10mM formaldehyde
indeed leads to a complete loss of affinity for the frmRAB operator. This is the first example of a
formaldehyde sensing TF that appears to interact directly with formaldehyde. This is possibly a
reflextion of the fact that FrmR acts as a repressor, whereas previous in vitro studies have been
carried out with activator TFs (HxlR, AdhR).
In vivo reporter systems were constructed, and the experiments presented in this study provide
further evidence for FrmR functioning as a repressor that is alleviated by formaldehyde.
Induction of the frmR gene apparently results in repression of the KanR and GFP genes which
were placed under control of the frmRAB promoter. In the case of KanR, the addition of 0.3mM
formaldehyde to the cell culture caused significant derepression.
Unlike the more traditional HTH-type TFs, it is still not understood how FrmR and other Duf-
156 TFs bind to DNA. For the details of this process to be established, it will be necessary to
obtain a high resolution structure of a Duf-156 TF bound to its TFBS. Computational algorithms
identified residues likely to be involved in the FrmR-DNA interaction, and the effect of mutating
these residues on the activity of FrmR was tested in vivo. Three particular residues were noted
to cause a significant decrease in repression activity. These were R-14, R-46 and K91;
interestingly, each of these residues is highly conserved. The R-14 residue corresponds to the R-
15 residue in CsoR from M. tuberculosis that was found to be essential for DNA binding in vitro.
In CsoR this residue makes up a positively charged patch on the protein surface likely to form at
least part of the DNA binding region of the protein. Results from this chapter therefore suggest
this residue plays a similar role in the DNA binding functionality of FrmR.
In vivo studies have shown that Cys-36 plays an essential role in FrmR’s sensing of
formaldehyde as mutation of this residue abolishes derepression. Mutation of the other FrmR
cysteine residue (Cys-72) does not result in a change of any of the observable properties.
Interestingly, residues homologous to Cys-36 are known to be essential for heavy metal sensing
in FrmR homologs by coordinating to the metal center. This further suggests a mechanistic link
between metal sensing and formaldehyde sensing in certain TFs, as can be observed in the case
of MerR regulators. In both CsoR and RcnR, a histidine residue (corresponding to His-60 of
FrmR) is also shown to co-ordinate to the metal centre. The fact that His-60 is conserved in
FrmR may indicate that this residue also plays a role in effector molecule binding in FrmR. The
histidine side chain can act as a hydrogen bond donor which first of all may contribute to the
formation of a thiolate ion in Cys-36. After nucleophilic attack on formaldehyde from the
thiolate ion, the tetrahedral intermediate could be stabilized by His-60.
The lack of a high resolution structure of FrmR (Chapter 4) means we are unable to correlate
178
the results of this chapter to the structure of the protein. For example, a high resolution
structure would elucidate the environment of Cys-36 and suggest a molecular interpretation for
the observed formaldehyde effects. For this reason, work is being continued on the pursuit of
obtaining a high resolution structure of FrmR, to which some progress has been made (Chapter
4).
Although no structure exists for a representative HxlR-DNA complex, the presence of HTH
motifs allow for some limited understanding of the DNA binding mode. However, in case of HxlR
family members, the direct binding of formaldehyde or any allosteric effect on DNA binding has
not been observed. We have studied HxlR2 and shown it binds in a sequence specific manner to
its promoter region. This binding appears to be unaffected by 10mM formaldehyde. These
results are similar to those described previously for HxlR1-His. The HxlR1:DNA binding
interaction has been studied using fluorescence spectroscopy in which the labelled DNA
molecule shows a marked increase in fluorescence when treated with HxlR1-His. This is
indicative of a change in environment of the fluorophore when the DNA molecule is bound to
the protein. It was postulated that formaldehyde could induce a large conformational change in
this interaction possibly with a corresponding change in fluorescence intensity. There was no
such change observed when the binding interaction was studied in the presence of
formaldehyde. These results indicate that there is no major conformational change in the
interaction caused by formaldehyde.
179
6 Discussion, Conclusions and Future work
This study set out to provide a molecular understanding of how some bacteria “sense”
formaldehyde, i.e. what are the mechanisms by which transcriptional regulators allosterically
couple ligand binding (presumably with formaldehyde or formaldehyde:adducts) to DNA- and
/or RNA-polymerase binding. There is a wide range of distinct bacterial transcriptional
regulators, and representatives of several transcriptional regulator families have been
implicated in formaldehyde metabolism. This study looked in detail at two distinct regulators:
FrmR and HxlR.
We have been able to further our understanding of the FrmR protein and its basis for regulation
of the associated GSH-FDP genes in E. coli. We have established that it exists in a helical
tetrameric state as observed for homologous CsoR and RcnR proteins (Sections 3.8.2 and 3.9.2)
177,179,245. We reveal that FrmR binds specifically to the frmRAB promoter in vitro, and that this
interaction is severely weakened when FrmR is pre-treated with formaldehyde. (Section 5.2)
This suggests that repression by FrmR may be inactivated by a direct interaction with
formaldehyde. In vivo studies in E. coli have confirmed that FrmR is indeed a repressor of the
frmRAB opeon, and that addition of formaldehyde to the media causes derepression. (Section
5.5.2) These results indicate that FrmR exhibits negative auto-regulation and based on the
organisation of the operon, it is most likely that FrmR is a local TF solely regulating the frmRAB
operon.
In vivo studies have shown that FrmR’s functional repression is weakened/abolished by
mutating several predicted DNA-binding residues (Arg-14, Arg-46 and K91), delineating a
possible DNA binding site on the protein. Furthermore, the FrmR C-terminally His-tagged
protein does not bind DNA. (Section 5.3.1) An arginine residue corresponding to FrmR Arg-14 is
known to be essential for DNA binding in CsoR, and the results in this study suggest that Arg-14
plays a similar role in FrmR.177 It is difficult to establish the exact role of R-46 and K-91 without
a detailed FrmR structure. However, it is interesting to note that K-91 plays such an important
role because it is the C-terminal residue. Ordinarily, residues towards both termini tend not to
have important functional roles.241 However, as shown in Figure 3-4, K-91 shows a high degree
of conservation in terms of amino acid nature and protein chain length, suggesting this result is
significant. Indeed, this may go some way to explain why the C-terminal “His-Tagged” FrmR
protein appears to be inactive in vitro (Section 5.3.1). It will be interesting to establish whether
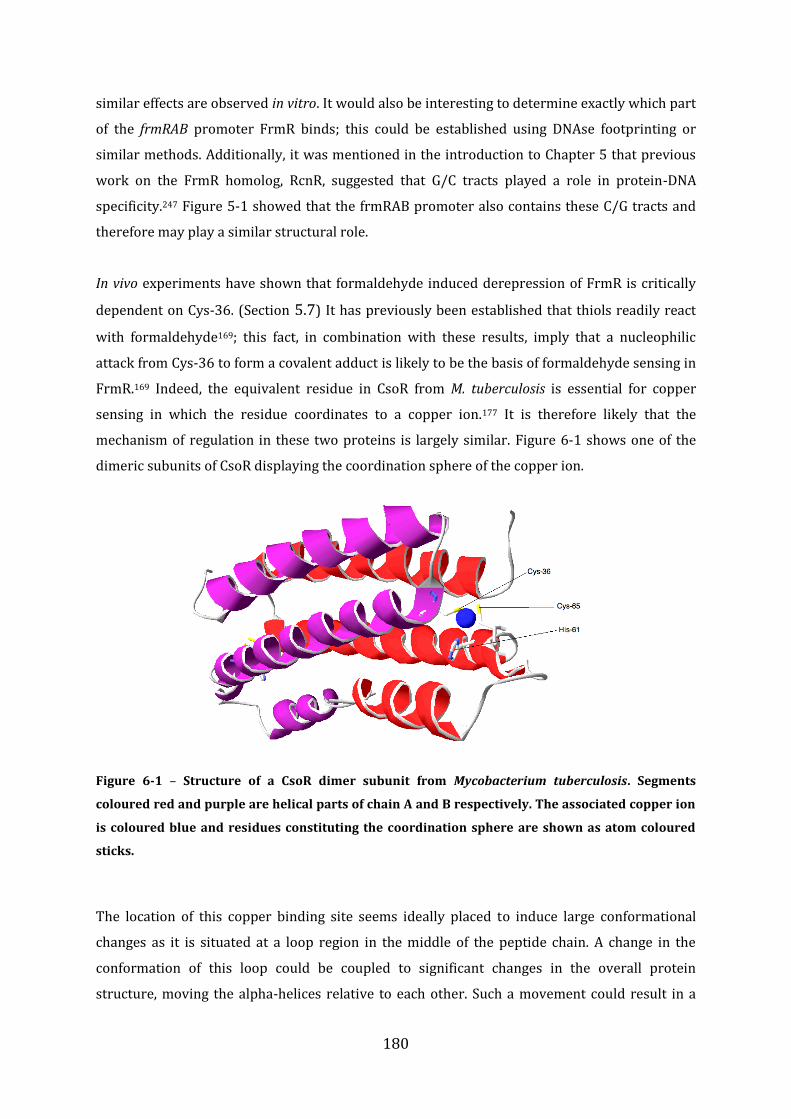
180
similar effects are observed in vitro. It would also be interesting to determine exactly which part
of the frmRAB promoter FrmR binds; this could be established using DNAse footprinting or
similar methods. Additionally, it was mentioned in the introduction to Chapter 5 that previous
work on the FrmR homolog, RcnR, suggested that G/C tracts played a role in protein-DNA
specificity.247 Figure 5-1 showed that the frmRAB promoter also contains these C/G tracts and
therefore may play a similar structural role.
In vivo experiments have shown that formaldehyde induced derepression of FrmR is critically
dependent on Cys-36. (Section 5.7) It has previously been established that thiols readily react
with formaldehyde169; this fact, in combination with these results, imply that a nucleophilic
attack from Cys-36 to form a covalent adduct is likely to be the basis of formaldehyde sensing in
FrmR.169 Indeed, the equivalent residue in CsoR from M. tuberculosis is essential for copper
sensing in which the residue coordinates to a copper ion.177 It is therefore likely that the
mechanism of regulation in these two proteins is largely similar. Figure 6-1 shows one of the
dimeric subunits of CsoR displaying the coordination sphere of the copper ion.
Figure 6-1 – Structure of a CsoR dimer subunit from Mycobacterium tuberculosis. Segments
coloured red and purple are helical parts of chain A and B respectively. The associated copper ion
is coloured blue and residues constituting the coordination sphere are shown as atom coloured
sticks.
The location of this copper binding site seems ideally placed to induce large conformational
changes as it is situated at a loop region in the middle of the peptide chain. A change in the
conformation of this loop could be coupled to significant changes in the overall protein
structure, moving the alpha-helices relative to each other. Such a movement could result in a
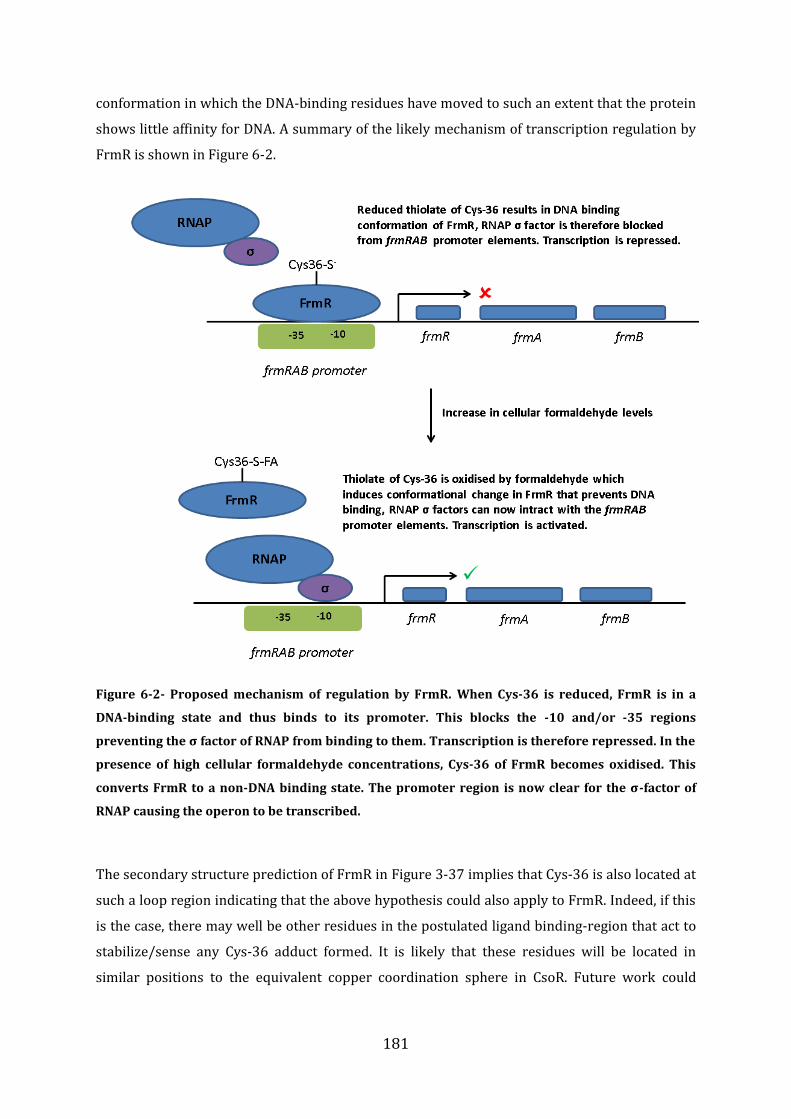
181
conformation in which the DNA-binding residues have moved to such an extent that the protein
shows little affinity for DNA. A summary of the likely mechanism of transcription regulation by
FrmR is shown in Figure 6-2.
Figure 6-2- Proposed mechanism of regulation by FrmR. When Cys-36 is reduced, FrmR is in a
DNA-binding state and thus binds to its promoter. This blocks the -10 and/or -35 regions
preventing the σ factor of RNAP from binding to them. Transcription is therefore repressed. In the
presence of high cellular formaldehyde concentrations, Cys-36 of FrmR becomes oxidised. This
converts FrmR to a non-DNA binding state. The promoter region is now clear for the σ-factor of
RNAP causing the operon to be transcribed.
The secondary structure prediction of FrmR in Figure 3-37 implies that Cys-36 is also located at
such a loop region indicating that the above hypothesis could also apply to FrmR. Indeed, if this
is the case, there may well be other residues in the postulated ligand binding-region that act to
stabilize/sense any Cys-36 adduct formed. It is likely that these residues will be located in
similar positions to the equivalent copper coordination sphere in CsoR. Future work could
182
involve mutational studies with residues in this region, and to establish which residues are
important for this function.
Of course, any of the future experiments above would be greatly facilitated by a high resolution
structure of FrmR. This would give us a better insight as to where the potential DNA-binding
residues are located on the protein. Also, the position of Cys-36 could be determined and the
possible environment of any adduct could be assessed. Although we obtained diffracting
crystals of FrmRC36S, as well as a plausible looking phasing model, a refinable model was not
obtained. (Section 4.7.1) This could be due to merohydral twinning of the crystals, combined
with low accuracy of the starting models. In future, it might be possible to use anomalous
scattering and/or multiple isomorphous replacement techniques in order to obtain
experimental phases. Alternatively, different crystals forms could be sought. It is interesting to
note that while FrmRC36S formed crystals under several conditions, the WT protein did not
crystallise at all (section 4.3). This, along with the fact that FrmR will only bind DNA under
reducing conditions, further suggests how essential this cysteine residue appears to be for the
activity of FrmR. It is therefore likely that under oxidising conditions, this residue is modified in
a way that causes the protein to become inactive, possibly leading to disorder affecting the
crystallisation likelihood.
It is still largely unknown how FrmR and other Duf-156 bind DNA. In the future, it would be
insightful to obtain a high resolution structure of one of these proteins in complex with its TFBS.
As far as this study is concerned, this would ideally be of FrmR:frmRAB, however a complex of
any homolog would also provide significant insight into FrmR function through homology. The
structure of CsoR from M. tuberculosis is only known when bound to its effector (copper), thus
only the inactive structure of this protein is known. It would be interesting to obtain high
resolution structures of both an active (DNA-binding), and an inactive (effector bound) form of a
Duf-156 protein. Differences between the two forms of the protein may elucidate the structural
basis for allosteric regulation in these proteins.
This project also aimed to gain a further understanding of the HxlR proteins. We studied HxlR1
from Bacillus subtilis and HxlR2 from Bacillus cereus AH818. These proteins are fairly similar
(39% identity over full length) and represent two distinct types of HxlR proteins that appear to
regulate formaldehyde detoxification pathways (HxlR1 is Type 1 and HxlR2 is Type 2). Both
Type 2 and Type 1 regulators are linked to genes for the RuMP pathway, however the Type 2
protein HxlR2, appears to regulate genes for a glutathione-dependent pathway.
183
This study, along with previously published work, indicate that HxlR1 appears to show little
difference in its DNA binding properties when in the absence or presence of formaldehyde.171
(Section 5.9) This suggests that if a direct interaction between HxlR1 and formaldehyde exists, it
affects HxlR:RNA-polymerase interactions rather than HxlR1-DNA interactions. On the other
hand, it may well be the case that neither HxlR nor the related HxlR2 actually interact with
formaldehyde, but respond to a distinct ligand/chemical stress that arises as a direct
consequence to an increase in cellular formaldehyde. At the outset of this project it was
intended to obtain a high resolution structure of HxlR1 to assist further experiments and
understanding of the formaldehyde sensing mechanism in this protein. Unfortunately no
crystals of this protein could be obtained (Section 4.3.3). In contrast, crystals were obtained for
the related HxlR2, and based on the level of conservation between HxlR1 and HxlR2 (39%
identity) we can assume that their overall structures will be largely similar. It is not yet known
whether HxlR2 is in fact a regulator of the FDP directly upstream, however the arrangement of
this operon suggests that it is. (Figure 1-30). Additionally, as shown in Figure 3-2, there are
genes encoding proteins >65% identical to HxlR2, located upstream of FDPs that are conserved
in other organisms. This further suggests a formaldehyde responsive role of this protein. The
HxlR2 structure is similar to previously solved members of this family: the protein is dimeric
and contains a wHTH DNA-binding domain and a dimerisation domain. (Section 4.8.1) The
dimerisation between the two subunits appears to be driven by hydrophobic interactions at the
interface. (Section 4.14)
It has been shown using EMSA that HxlR2 is capable of binding to DNA. (Section 5.9). Residues
that are likely involved in DNA-binding in the HxlR-family have been identified by analysis of
the recognition helix. (Section 4.15) One noticeable feature of the wHTH is that the loop
contains hydrophobic valine residues on its surface. This is unusual and therefore may imply
that there is a hydrophobic interaction between the wing of the wHTH and HxlR2 TFBS. Future
work could look to test the hypotheses regarding the protein-DNA interaction by attempting to
obtain a crystal structure of the complex.
HypR is the most similar protein to HxlR1/2 to be characterised both structurally and
functionally. HypR is a TF that senses sodium hypochlorite and diamide in Bacillus subtilis.238
The protein senses its effector molecules through their effect on key cysteine residues. Rather
than covalent adduct formation, the effectors lead to inter-molecular disulphide bond
formation. As explained in the introduction to chapter 5, this kind of inter-molecular disulphide
bond formation is not possible in HxlR1. Aslo, type 2 HxlR proteins do not possess either of the
cysteine residues implicated in disulphide bond formation.
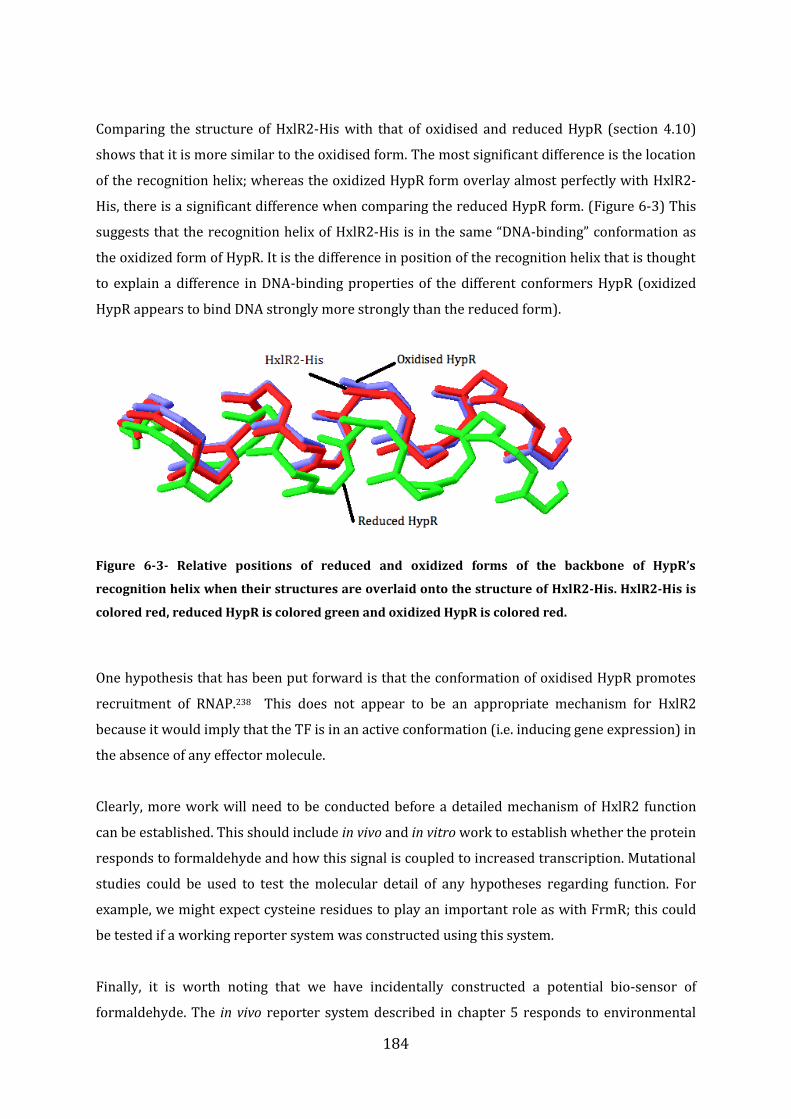
184
Comparing the structure of HxlR2-His with that of oxidised and reduced HypR (section 4.10)
shows that it is more similar to the oxidised form. The most significant difference is the location
of the recognition helix; whereas the oxidized HypR form overlay almost perfectly with HxlR2-
His, there is a significant difference when comparing the reduced HypR form. (Figure 6-3) This
suggests that the recognition helix of HxlR2-His is in the same “DNA-binding” conformation as
the oxidized form of HypR. It is the difference in position of the recognition helix that is thought
to explain a difference in DNA-binding properties of the different conformers HypR (oxidized
HypR appears to bind DNA strongly more strongly than the reduced form).
Figure 6-3- Relative positions of reduced and oxidized forms of the backbone of HypR’s
recognition helix when their structures are overlaid onto the structure of HxlR2-His. HxlR2-His is
colored red, reduced HypR is colored green and oxidized HypR is colored red.
One hypothesis that has been put forward is that the conformation of oxidised HypR promotes
recruitment of RNAP.238 This does not appear to be an appropriate mechanism for HxlR2
because it would imply that the TF is in an active conformation (i.e. inducing gene expression) in
the absence of any effector molecule.
Clearly, more work will need to be conducted before a detailed mechanism of HxlR2 function
can be established. This should include in vivo and in vitro work to establish whether the protein
responds to formaldehyde and how this signal is coupled to increased transcription. Mutational
studies could be used to test the molecular detail of any hypotheses regarding function. For
example, we might expect cysteine residues to play an important role as with FrmR; this could
be tested if a working reporter system was constructed using this system.
Finally, it is worth noting that we have incidentally constructed a potential bio-sensor of
formaldehyde. The in vivo reporter system described in chapter 5 responds to environmental

185
formaldehyde. This may therefore be of use in applications that require the sensing of
formaldehyde. For example, it may be necessary to obtain an enzyme mutant that can
demethylate a particular molecule. Demethylation will produce formaldehyde as a by-product. If
this reaction is performed in vivo alongside the reporter system, it may be possible to effectively
observe this reaction as a response from the reporter system. Whether the reporter system will
be of any use entirely depends on whether it is sensitive enough to detect the levels of
formaldehyde produced. This will therefore need to be tested in future.
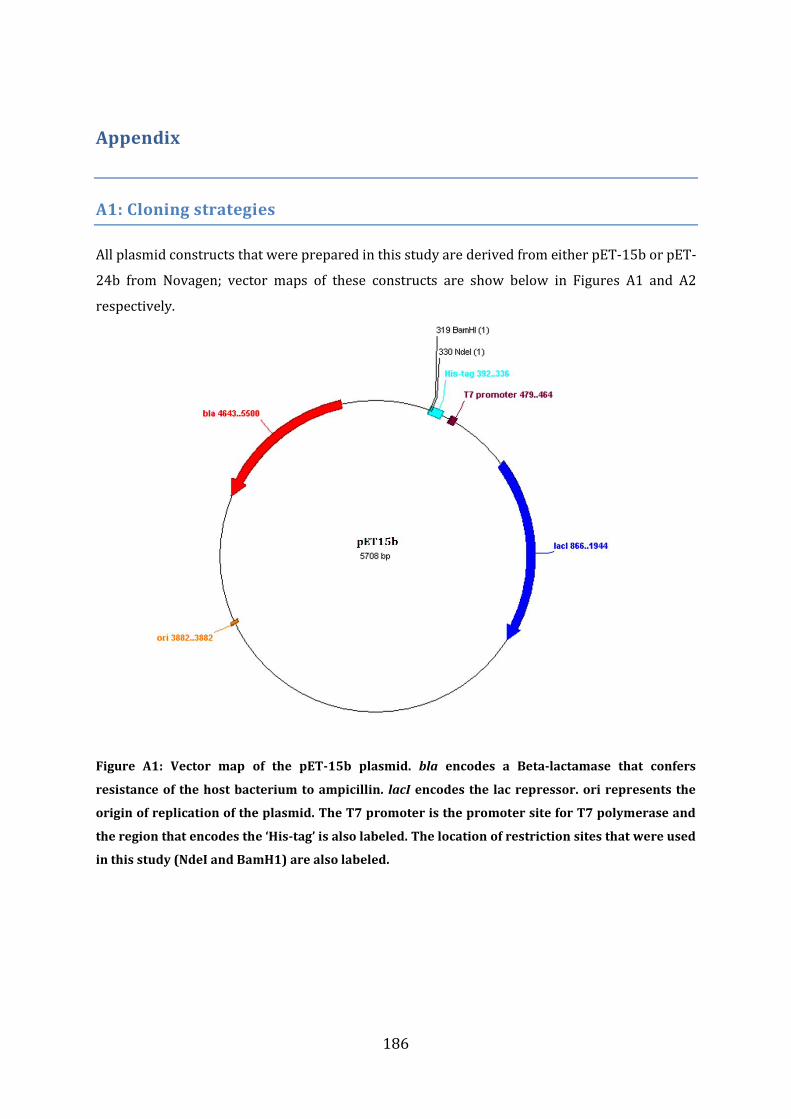
186
Appendix
A1: Cloning strategies
All plasmid constructs that were prepared in this study are derived from either pET-15b or pET-
24b from Novagen; vector maps of these constructs are show below in Figures A1 and A2
respectively.
Figure A1: Vector map of the pET-15b plasmid. bla encodes a Beta-lactamase that confers
resistance of the host bacterium to ampicillin. lacI encodes the lac repressor. ori represents the
origin of replication of the plasmid. The T7 promoter is the promoter site for T7 polymerase and
the region that encodes the ‘His-tag’ is also labeled. The location of restriction sites that were used
in this study (NdeI and BamH1) are also labeled.
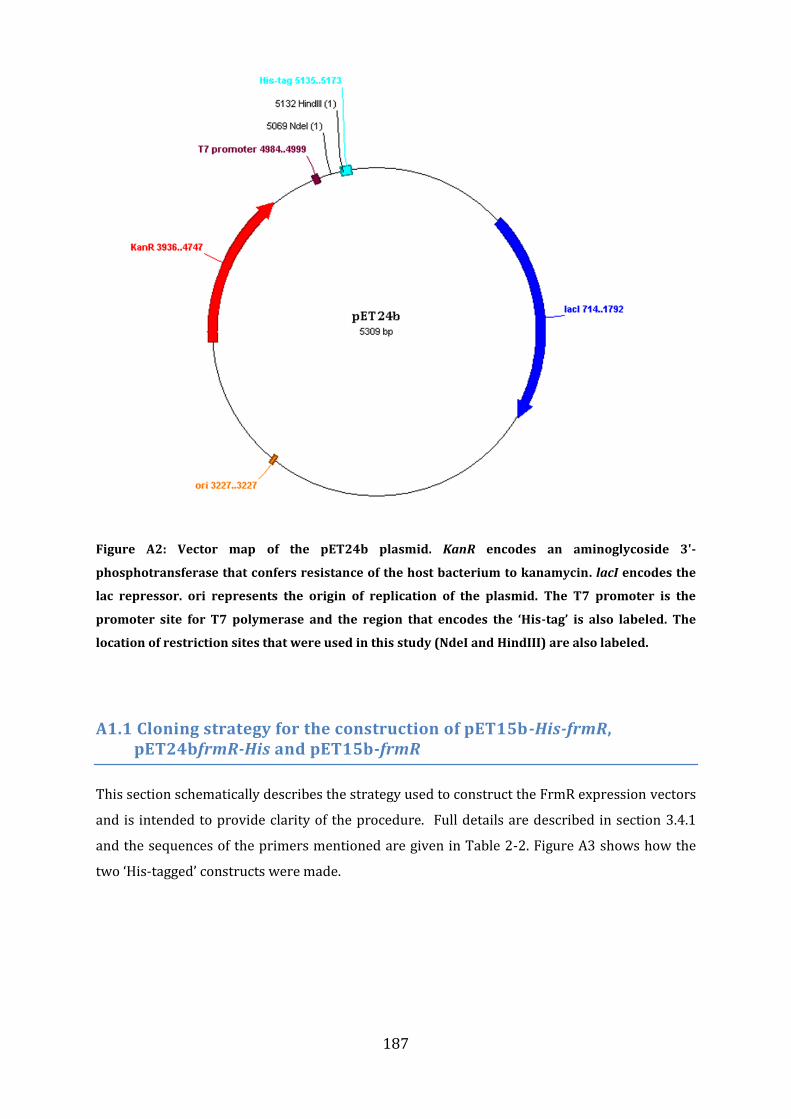
187
Figure A2: Vector map of the pET24b plasmid. KanR encodes an aminoglycoside 3'-
phosphotransferase that confers resistance of the host bacterium to kanamycin. lacI encodes the
lac repressor. ori represents the origin of replication of the plasmid. The T7 promoter is the
promoter site for T7 polymerase and the region that encodes the ‘His-tag’ is also labeled. The
location of restriction sites that were used in this study (NdeI and HindIII) are also labeled.
A1.1 Cloning strategy for the construction of pET15b-His-frmR, pET24bfrmR-His and pET15b-frmR
This section schematically describes the strategy used to construct the FrmR expression vectors
and is intended to provide clarity of the procedure. Full details are described in section 3.4.1
and the sequences of the primers mentioned are given in Table 2-2. Figure A3 shows how the
two ‘His-tagged’ constructs were made.
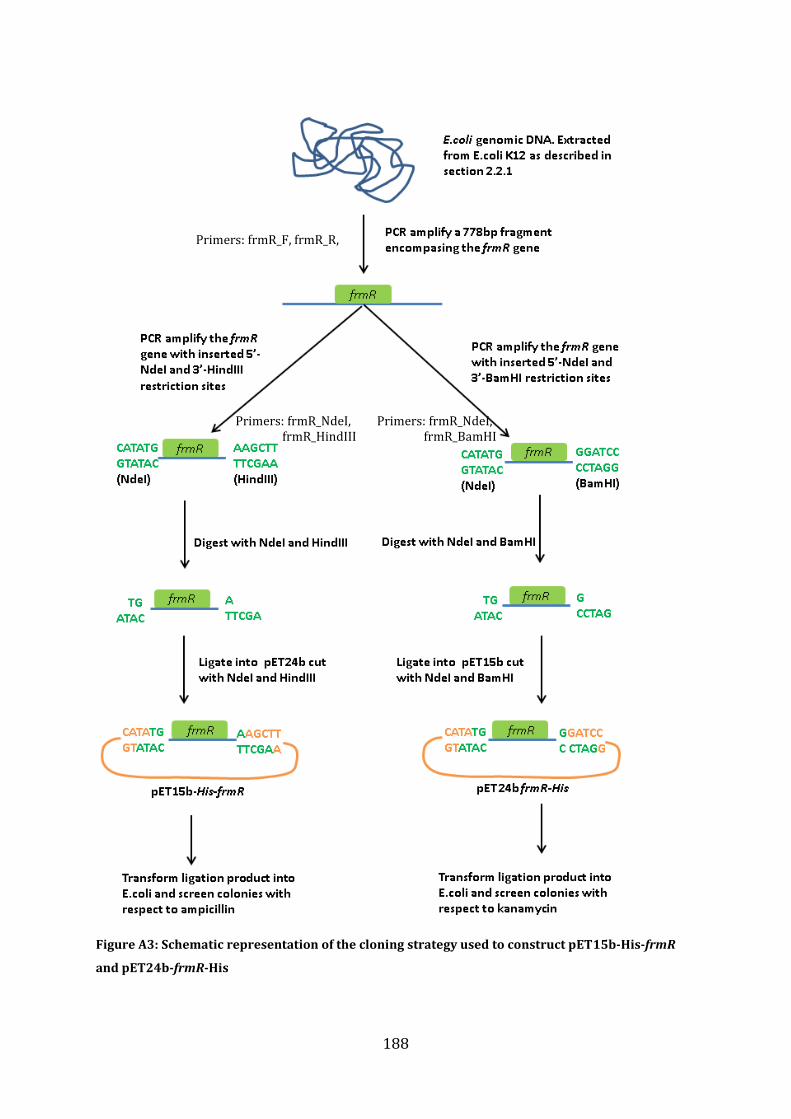
188
Figure A3: Schematic representation of the cloning strategy used to construct pET15b-His-frmR
and pET24b-frmR-His
Primers: frmR_F, frmR_R,
Primers: frmR_NdeI, frmR_HindIII
Primers: frmR_NdeI, frmR_BamHI
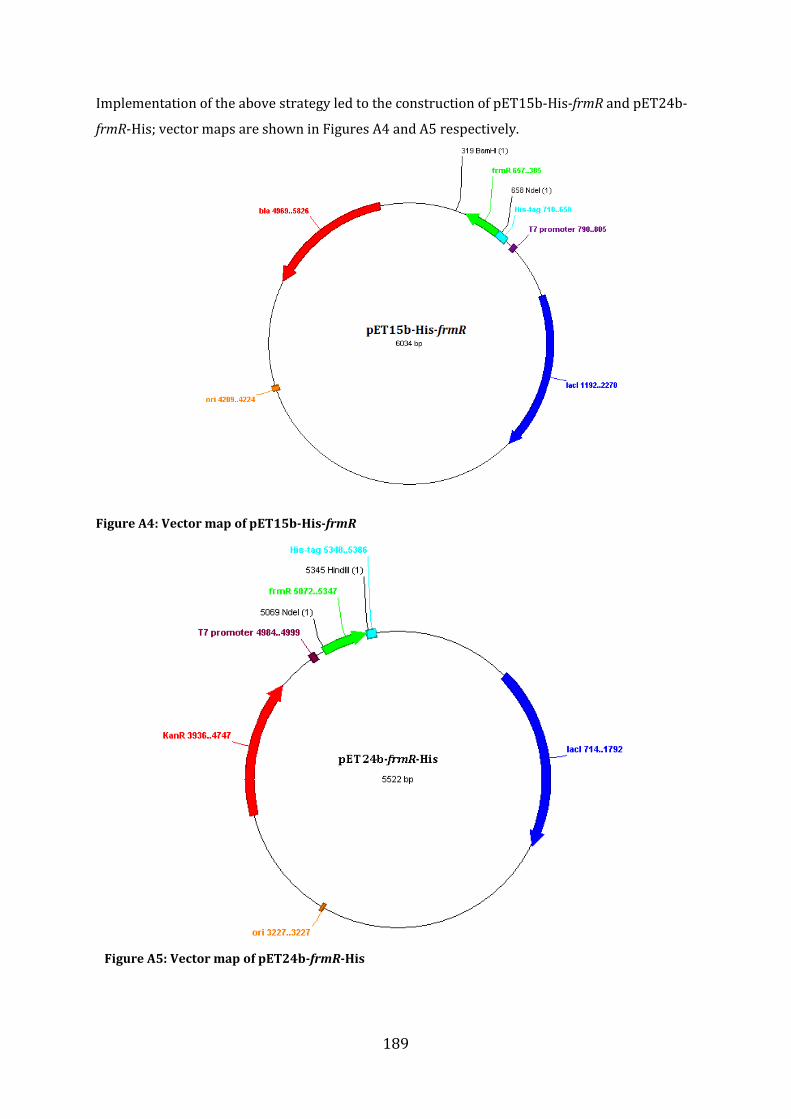
189
Implementation of the above strategy led to the construction of pET15b-His-frmR and pET24b-
frmR-His; vector maps are shown in Figures A4 and A5 respectively.
Figure A4: Vector map of pET15b-His-frmR
Figure A5: Vector map of pET24b-frmR-His
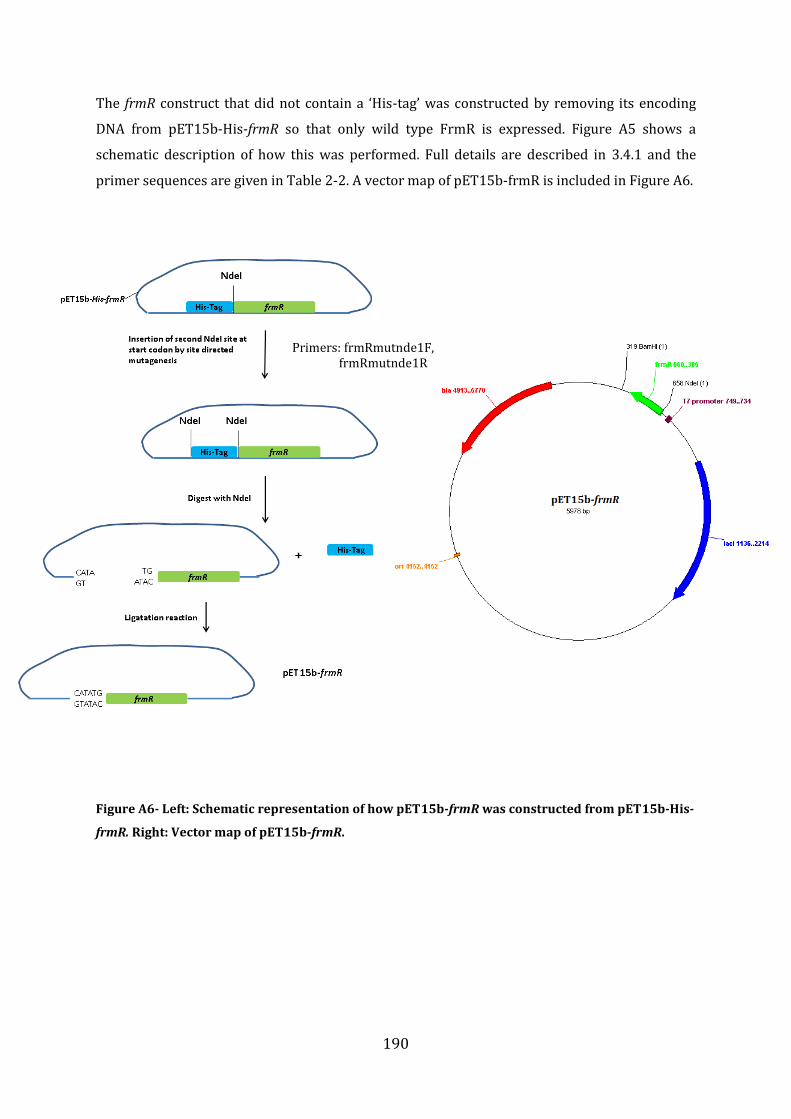
190
The frmR construct that did not contain a ‘His-tag’ was constructed by removing its encoding
DNA from pET15b-His-frmR so that only wild type FrmR is expressed. Figure A5 shows a
schematic description of how this was performed. Full details are described in 3.4.1 and the
primer sequences are given in Table 2-2. A vector map of pET15b-frmR is included in Figure A6.
Figure A6- Left: Schematic representation of how pET15b-frmR was constructed from pET15b-His-
frmR. Right: Vector map of pET15b-frmR.
Primers: frmRmutnde1F, frmRmutnde1R
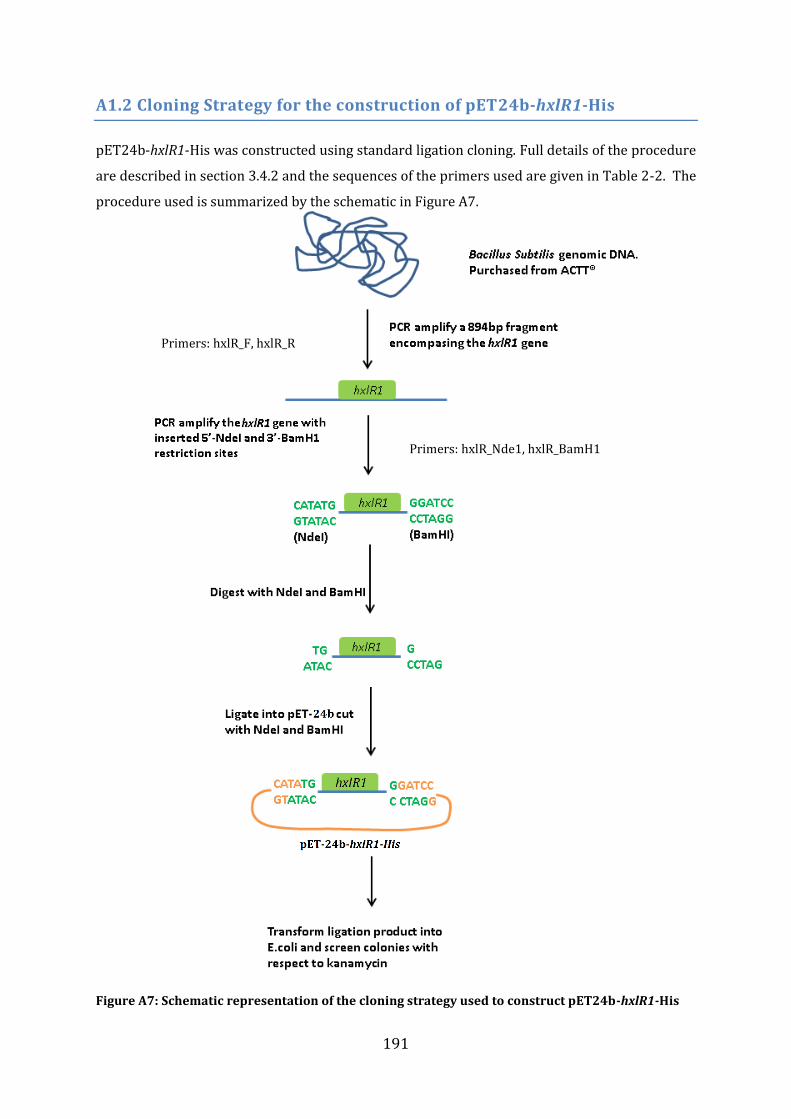
191
A1.2 Cloning Strategy for the construction of pET24b-hxlR1-His
pET24b-hxlR1-His was constructed using standard ligation cloning. Full details of the procedure
are described in section 3.4.2 and the sequences of the primers used are given in Table 2-2. The
procedure used is summarized by the schematic in Figure A7.
Figure A7: Schematic representation of the cloning strategy used to construct pET24b-hxlR1-His
Primers: hxlR_Nde1, hxlR_BamH1
Primers: hxlR_F, hxlR_R
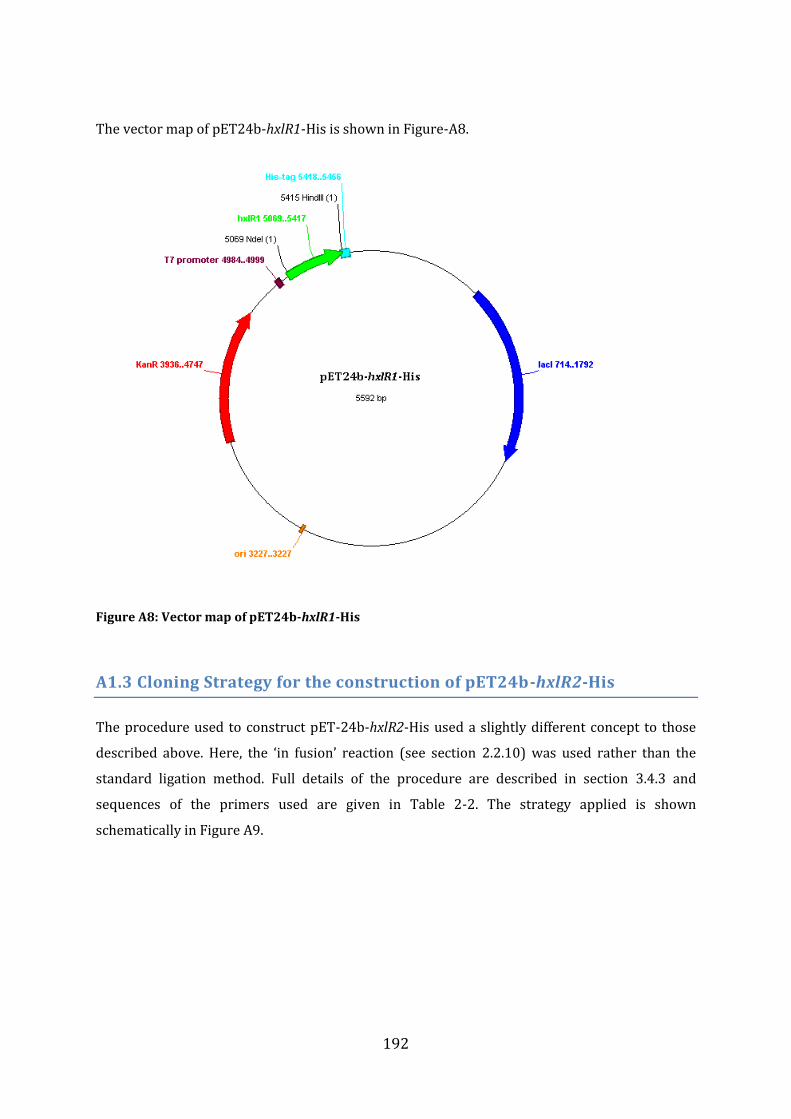
192
The vector map of pET24b-hxlR1-His is shown in Figure-A8.
Figure A8: Vector map of pET24b-hxlR1-His
A1.3 Cloning Strategy for the construction of pET24b-hxlR2-His
The procedure used to construct pET-24b-hxlR2-His used a slightly different concept to those
described above. Here, the ‘in fusion’ reaction (see section 2.2.10) was used rather than the
standard ligation method. Full details of the procedure are described in section 3.4.3 and
sequences of the primers used are given in Table 2-2. The strategy applied is shown
schematically in Figure A9.
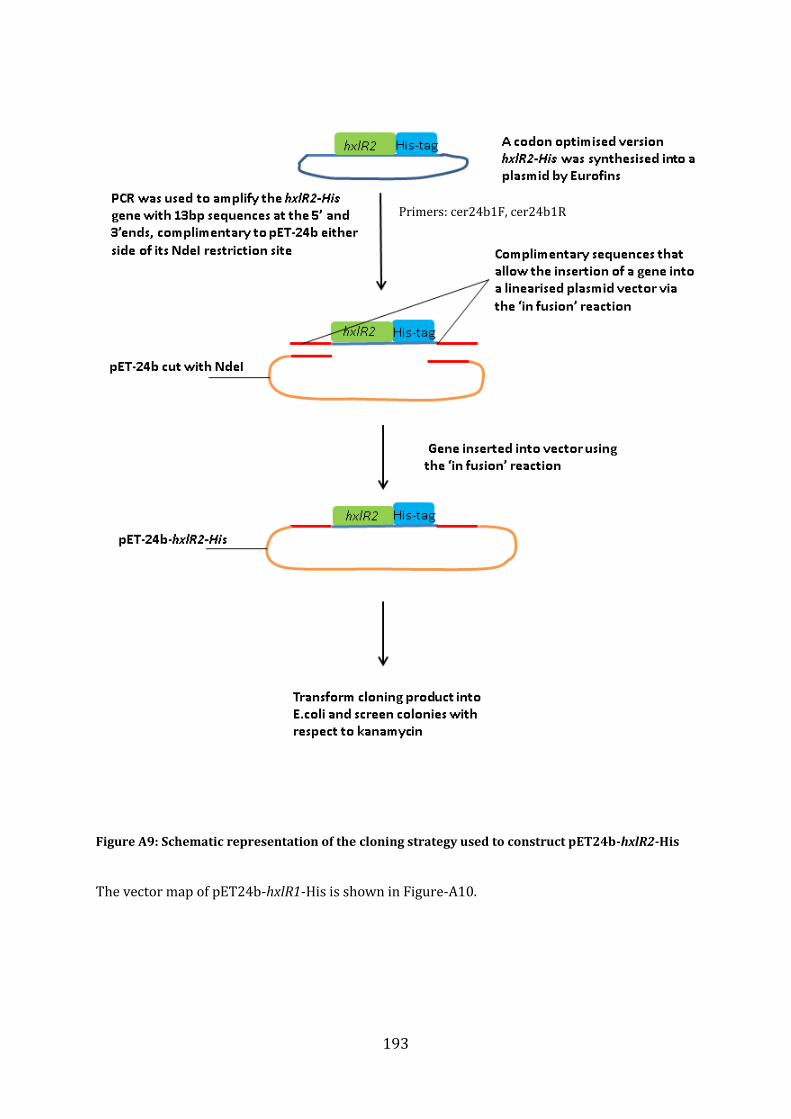
193
Figure A9: Schematic representation of the cloning strategy used to construct pET24b-hxlR2-His
The vector map of pET24b-hxlR1-His is shown in Figure-A10.
Primers: cer24b1F, cer24b1R
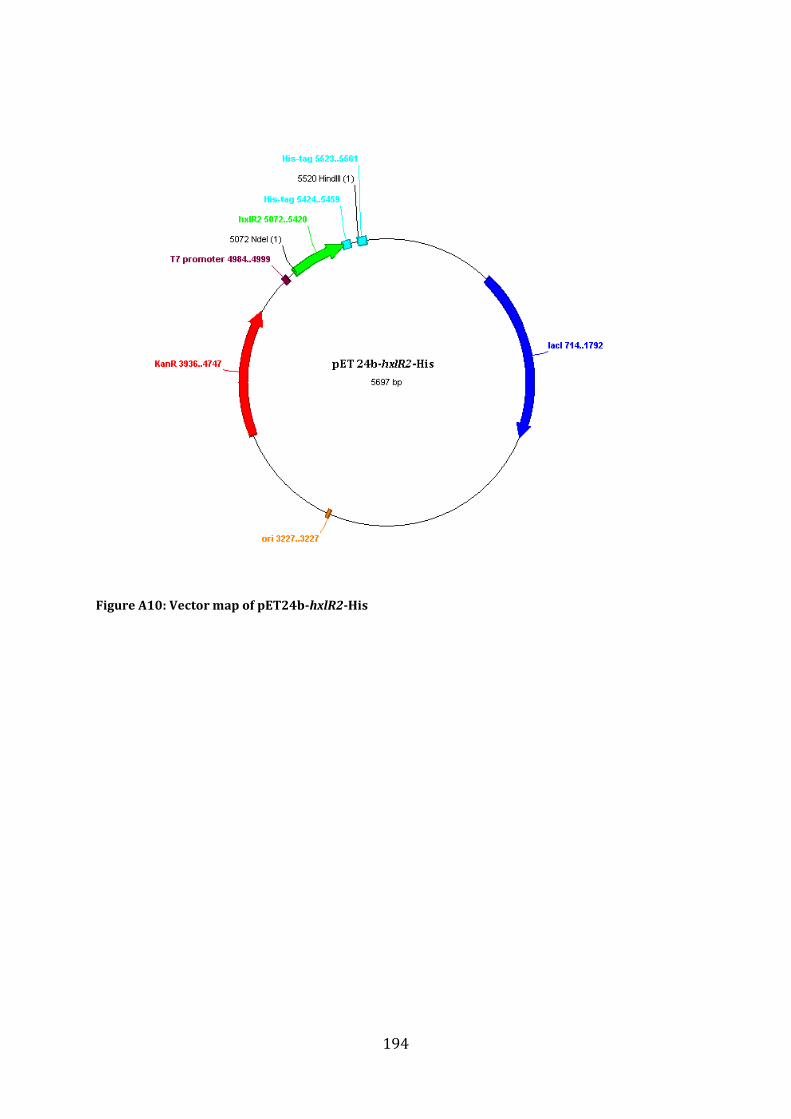
194
Figure A10: Vector map of pET24b-hxlR2-His
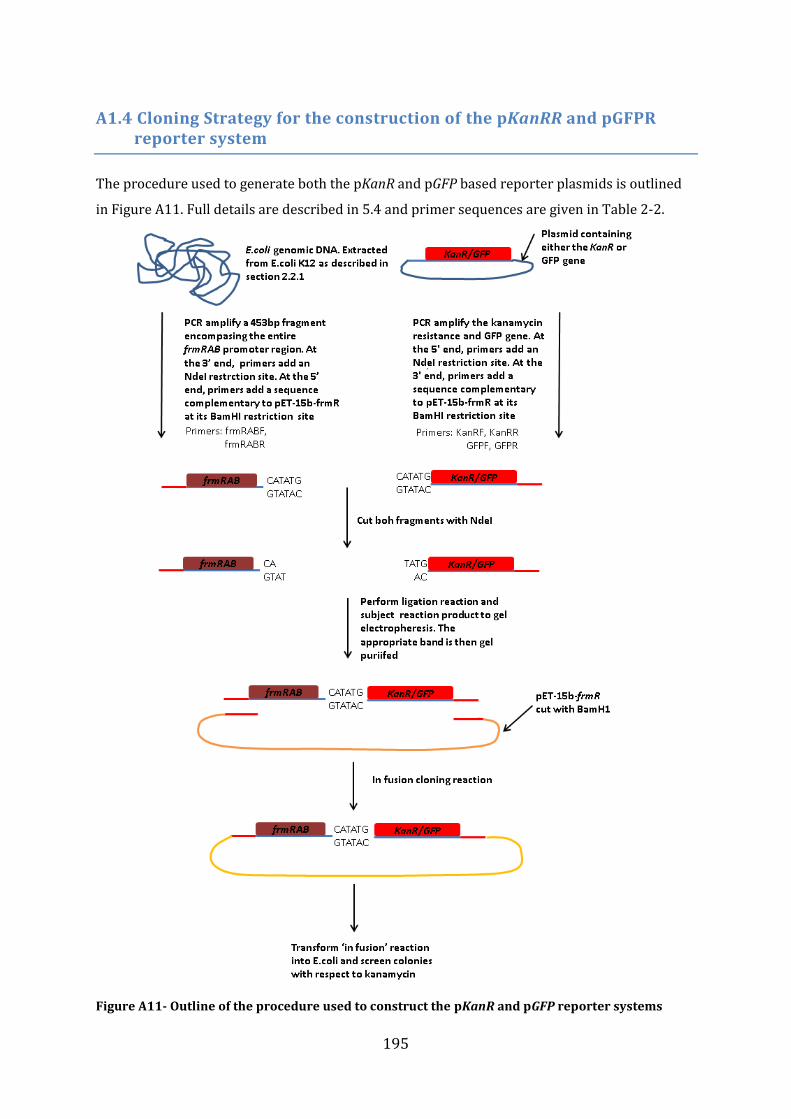
195
A1.4 Cloning Strategy for the construction of the pKanRR and pGFPR reporter system
The procedure used to generate both the pKanR and pGFP based reporter plasmids is outlined
in Figure A11. Full details are described in 5.4 and primer sequences are given in Table 2-2.
Figure A11- Outline of the procedure used to construct the pKanR and pGFP reporter systems
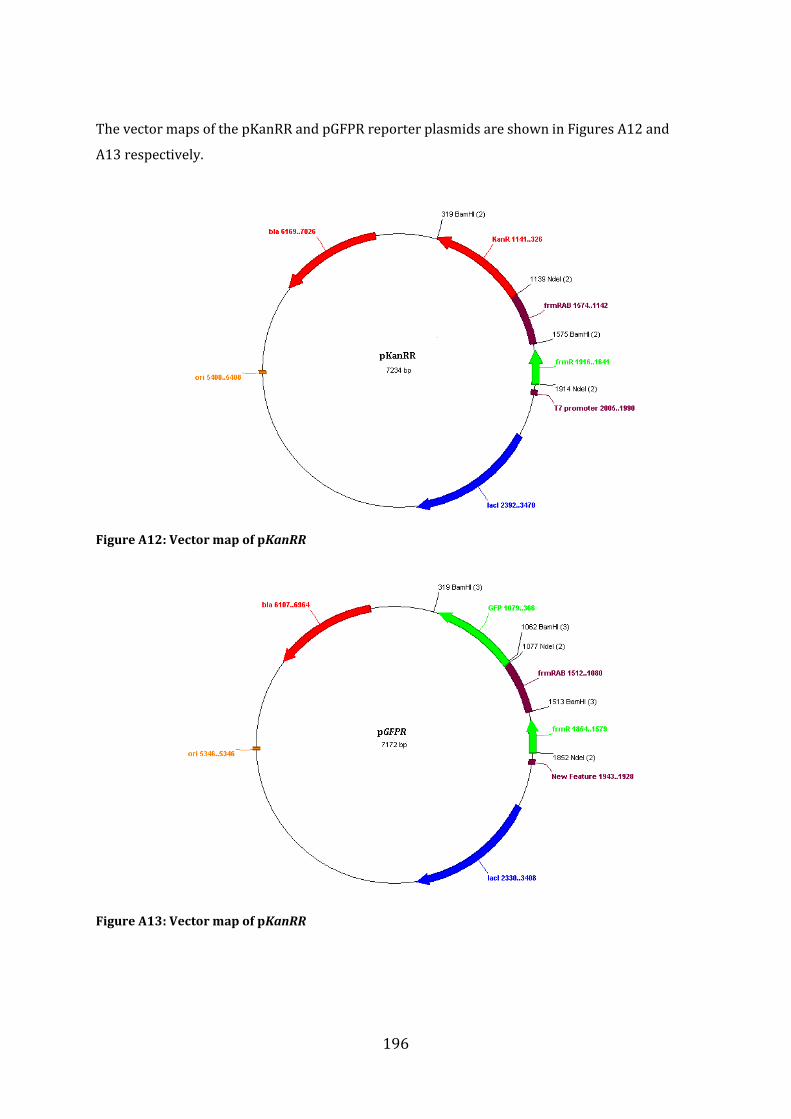
196
The vector maps of the pKanRR and pGFPR reporter plasmids are shown in Figures A12 and
A13 respectively.
Figure A12: Vector map of pKanRR
Figure A13: Vector map of pKanRR
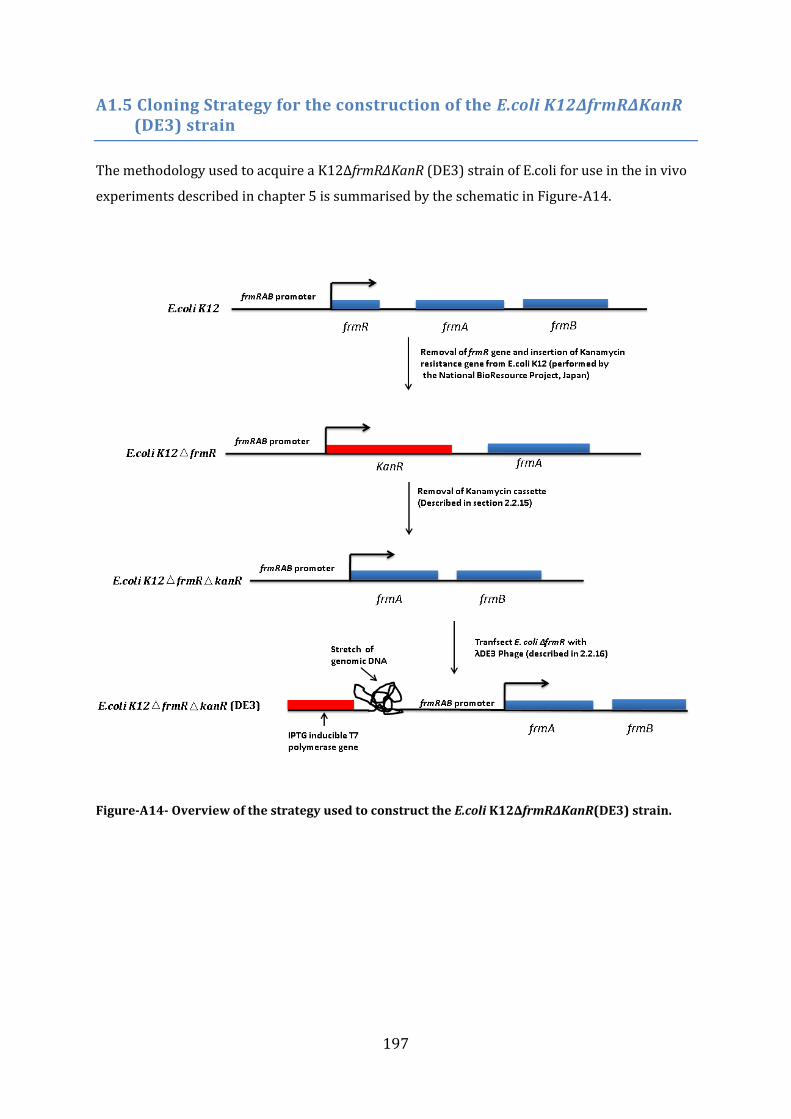
197
A1.5 Cloning Strategy for the construction of the E.coli K12∆frmR∆KanR (DE3) strain
The methodology used to acquire a K12∆frmR∆KanR (DE3) strain of E.coli for use in the in vivo
experiments described in chapter 5 is summarised by the schematic in Figure-A14.
Figure-A14- Overview of the strategy used to construct the E.coli K12∆frmR∆KanR(DE3) strain.
198
References
1. van Hijum, S.A.F.T., Medema, M.H. & Kuipers, O.P. Mechanisms and evolution of control logic in
prokaryotic transcriptional regulation. Microbiology and molecular biology reviews 73, 481-509 (2009).
2. Struhl, K. Fundamentally different logic of gene regulation in eukaryotes and prokaryotes. Cell 98, 1-4
(1999).
3. Fassler, J. & Gussin, G. Promoters and basal transcription machinery in eubacteria and eukaryotes:
Concepts, definitions, and analogies. 273, 367-375 (1996).
4. Harley, C.B. & Reynolds, R.P. Analysis of E. coli promoter sequences. Nucleic acids research 15,
2343-61 (1987).
5. Hertz, G.Z. & Stormo, G.D. Escherichia coli promoter sequences: analysis and prediction. Methods in
enzymology 273, 30-42 (1996).
6. Murakami, K.S. & Darst, S.A. Bacterial RNA polymerases: the wholo story. Current opinion in
structural biology 13, 31-39 (2003).
7. Vassylyev, D.G. et al. Crystal structure of a bacterial RNA polymerase holoenzyme at 2.6 A resolution.
Nature 417, 712-9 (2002).
8. Zhang, G. et al. Crystal Structure of Core RNA Polymerase at 3.3 p Resolution. Cell 98, 811-824
(1999).
9. Guthold, M. et al. Direct observation of one-dimensional diffusion and transcription by Escherichia coli
RNA polymerase. Biophysical journal 77, 2284-94 (1999).
10. Borukhov, S. & Nudler, E. RNA polymerase: the vehicle of transcription. Trends in microbiology 16,
126-34 (2008).
11. Craig, M.L. et al. DNA footprints of the two kinetically significant intermediates in formation of an
RNA polymerase-promoter open complex: evidence that interactions with start site and downstream
DNA induce sequential conformational changes in polymerase and DNA. Journal of molecular biology
283, 741-56 (1998).
12. Haugen, S.P., Ross, W. & Gourse, R.L. Advances in bacterial promoter recognition and its control by
factors that do not bind DNA. Nature reviews. Microbiology 6, 507-19 (2008).
13. Helmann, J.D. RNA polymerase: a nexus of gene regulation. Methods 47, 1-5 (2009).
14. Hsu, L. Promoter clearance and escape in prokaryotes. Biochimica et biophysica acta - gene structure
and expression 1577, 191-207 (2002).
15. Landick, R. The regulatory roles and mechanism of transcriptional pausing. Biochemical society
transactions 34, 1062-6 (2006).
16. Park, J.-S. & Roberts, J.W. Role of DNA bubble rewinding in enzymatic transcription termination.
Proceedings of the National Academy of Sciences 103, 4870-5 (2006).
17. Skordalakes, E. & Berger, J.M. Structure of the Rho Transcription Terminator. Cell 114, 135-146
(2003).
18. Richardson, J.P. Loading Rho to Terminate Transcription. Cell 114, 157-159 (2003).
19. Minchin, S.D. & Busby, S.J.W. Analysis of mechanisms of activation and repression at bacterial
promoters. Methods 47, 6-12 (2009).
20. Ohlendorf, D.H., Anderson, W.F. & Matthews, B.W. Many gene-regulatory proteins appear to have a
similar α-helical fold that binds DNA and evolved from a common precursor. Journal of molecular
evolution 19, 109-114 (1983).
21. Brennan, R.G. & Matthews, B.W. The helix-turn-helix DNA binding motif. The journal of biological
chemistry 264, 1903-6 (1989).
22. Huffman, J.L. & Brennan, R.G. Prokaryotic transcription regulators: more than just the helix-turn-helix
motif. Current opinion in structural biology 12, 98-106 (2002).
23. Rohs, R. et al. Origins of specificity in protein-DNA recognition. Annual review of biochemistry 79,
233-69 (2010).
24. Seeman, N.C. Sequence-Specific Recognition of Double Helical Nucleic Acids by Proteins.
Proceedings of the National Academy of Sciences 73, 804-808 (1976).
25. Watkins, D., Hsiao, C., Woods, K.K., Koudelka, G.B. & Williams, L.D. P22 c2 repressor-operator
complex: mechanisms of direct and indirect readout. Biochemistry 47, 2325-38 (2008).
26. Koo, H.S., Wu, H.M. & Crothers, D.M. DNA bending at adenine . thymine tracts. Nature 320, 501-6
(1986).
199
27. Koudelka, G.B., Mauro, S.A. & Ciubotaru, M. Indirect readout of DNA sequence by proteins: the roles
of DNA sequence-dependent intrinsic and extrinsic forces. Progress in nucleic acid research and
molecular biology 81, 143-77 (2006).
28. Rohs, R., West, S.M., Liu, P. & Honig, B. Nuance in the double-helix and its role in protein-DNA
recognition. Current opinion in structural biology 19, 171-7 (2009).
29. Zhang, Y., Xi, Z., Hegde, R.S., Shakked, Z. & Crothers, D.M. Predicting indirect readout effects in
protein-DNA interactions. Proceedings of the National Academy of Sciences 101, 8337-41 (2004).
30. Riggs, A., Bourgeous, S. & Cohn, M. The lac represser-operator interaction *1, *2III. Kinetic studies.
Journal of molecular biology 53, 401-417 (1970).
31. Kolomeisky, A.B. Physics of protein-DNA interactions: mechanisms of facilitated target search.
Physical chemistry chemical physics 13, 2088-95 (2011).
32. Gorman, J. & Greene, E.C. Visualizing one-dimensional diffusion of proteins along DNA. Nature
structural & molecular biology 15, 768-74 (2008).
33. Sheinman, M. & Kafri, Y. The effects of intersegmental transfers on target location by proteins.
Physical biology 6, 016-030 (2009).
34. Mirny, L. et al. How a protein searches for its site on DNA: the mechanism of facilitated diffusion.
Journal of physics A: Mathematical and theoretical 42, 434013 (2009).
35. Givaty, O. & Levy, Y. Protein sliding along DNA: dynamics and structural characterization. Journal of
molecular biology 385, 1087-97 (2009).
36. Hagmar, P. Unspecific DNA binding of the DNA binding domain of the glucocorticoid receptor studied
with flow linear dichroism. FEBS letters 253, 28-32 (1989).
37. Mossing, M. & Record, M. Thermodynamic origins of specificity in the lac repressor-operator
interaction. Adaptability in the recognition of mutant operator sites. Journal of molecular biology 186,
295-305 (1985).
38. Kalodimos, C.G. et al. Structure and flexibility adaptation in nonspecific and specific protein-DNA
complexes. Science 305, 386-9 (2004).
39. Dahirel, V., Paillusson, F., Jardat, M., Barbi, M. & Victor, J.-M. Nonspecific DNA-Protein Interaction:
Why Proteins Can Diffuse along DNA. Physical review letters 102, (2009).
40. Quinones, M., Kimsey, H.H., Ross, W., Gourse, R.L. & Waldor, M.K. LexA represses CTXphi
transcription by blocking access of the alpha C-terminal domain of RNA polymerase to promoter DNA.
The journal of biological chemistry 281, 39407-12 (2006).
41. Rojo, F. Repression of transcription initiation in bacteria. Journal of bacteriology 181, 2987-91 (1999).
42. Semsey, S., Geanacopoulos, M., Lewis, D.E.A. & Adhya, S. Operator-bound GalR dimers close DNA
loops by direct interaction: tetramerization and inducer binding. The EMBO journal 21, 4349-56 (2002).
43. Aki, T. & Adhya, S. Repressor induced site-specific binding of HU for transcriptional regulation. The
EMBO journal 16, 3666-74 (1997).
44. Rodionov, D.A. Comparative genomic reconstruction of transcriptional regulatory networks in bacteria.
Chemical reviews 107, 3467-97 (2007).
45. Rhodius, V. Positive activation of gene expression. Current opinion in microbiology 1, 152-159 (1998).
46. Smits, W.K., Hoa, T.T., Hamoen, L.W., Kuipers, O.P. & Dubnau, D. Antirepression as a second
mechanism of transcriptional activation by a minor groove binding protein. Molecular microbiology 64,
368-81 (2007).
47. Yamamoto, K. et al. Functional characterization in vitro of all two-component signal transduction
systems from Escherichia coli. The journal of biological chemistry 280, 1448-56 (2005).
48. Mascher, T., Helmann, J.D. & Unden, G. Stimulus perception in bacterial signal-transducing histidine
kinases. Microbiology and molecular biology reviews 70, 910-38 (2006).
49. Galperin, M.Y. Diversity of structure and function of response regulator output domains. Current
opinion in microbiology 13, 150-9 (2010).
50. Bourret, R.B. Receiver domain structure and function in response regulator proteins. Current opinion in
microbiology 13, 142-9 (2010).
51. Casino, P., Rubio, V. & Marina, A. The mechanism of signal transduction by two-component systems.
Current opinion in structural biology 20, 763-71 (2010).
52. Perez-Rueda, E. The repertoire of DNA-binding transcriptional regulators in Escherichia coli K-12.
Nucleic acids research 28, 1838-1847 (2000).
53. Maddocks, S.E. & Oyston, P.C. Structure and function of the LysR-type transcriptional regulator
(LTTR) family proteins. Microbiology 154, 3609-3623 (2008).
54. Hernández-Lucas, I. et al. The LysR-type transcriptional regulator LeuO controls expression of several
genes in Salmonella enterica serovar Typhi. Journal of bacteriology 190, 1658-70 (2008).
55. Schell, M.A. Molecular-Biology of the Lysr Family of Transcriptional Regulators. Annual review of
microbiology 47, 597-626 (1993).
200
56. Ogawa, N., McFall, S.M., Klem, T.J., Miyashita, K. & Chakrabarty, A.M. Transcriptional Activation of
the Chlorocatechol Degradative Genes of Ralstonia eutropha NH9. Journal of bacteriology 181, 6697-
6705 (1999).
57. van Keulen, G., Ridder, A.N.J.A., Dijkhuizen, L. & Meijer, W.G. Analysis of DNA Binding and
Transcriptional Activation by the LysR-Type Transcriptional Regulator CbbR of Xanthobacter flavus.
Journal of bacteriology 185, 1245-1252 (2003).
58. Maddocks, S.E. & Oyston, P.C.F. Structure and function of the LysR-type transcriptional regulator
(LTTR) family proteins. Microbiology 154, 3609-23 (2008).
59. Zhou, X. et al. Crystal structure of ArgP from Mycobacterium tuberculosis confirms two distinct
conformations of full-length LysR transcriptional regulators and reveals its function in DNA binding
and transcriptional regulation. Journal of molecular biology 396, 1012-24 (2010).
60. Ezezika, O.C., Haddad, S., Neidle, E.L. & Momany, C. Oligomerization of BenM, a LysR-type
transcriptional regulator: structural basis for the aggregation of proteins in this family. Acta
crystallographica. Section F, Structural biology and crystallization communications 63, 361-8 (2007).
61. Ogawa, N., McFall, S.M., Klem, T.J., Miyashita, K. & Chakrabarty, A.M. Transcriptional activation of
the chlorocatechol degradative genes of Ralstonia eutropha NH9. Journal of bacteriology 181, 6697-705
(1999).
62. Muraoka, S. et al. Crystal structure of a full-length LysR-type transcriptional regulator, CbnR: unusual
combination of two subunit forms and molecular bases for causing and changing DNA bend. Journal of
molecular biology 328, 555-566 (2003).
63. Busenlehner, L.S., Pennella, M.A. & Giedroc, D.P. The SmtB/ArsR family of metalloregulatory
transcriptional repressors: structural insights into prokaryotic metal resistance. FEMS microbiology
Reviews 27, 131-143 (2003).
64. Turner, J. Zinc sensing by the cyanobacterial metallothionein repressor SmtB: different motifs mediate
metal-induced protein-DNA dissociation. Nucleic acids research 24, 3714-3721 (1996).
65. Morby, A.P., Turner, J.S., Huckle, J.W. & Robinson, N.J. SmtB is a metal-dependent repressor of the
cyanobacterial metallothionein gene smtA: identification of a Zn inhibited DNA-protein complex.
Nucleic acids research 21, 921-5 (1993).
66. VanZile, M.L., Chen, X. & Giedroc, D.P. Allosteric Negative Regulation of smt O/P Binding of the
Zinc Sensor, SmtB, by Metal Ions: A Coupled Equilibrium Analysis †. Biochemistry 41, 9776-9786
(2002).
67. Eicken, C. et al. A Metal–Ligand-mediated Intersubunit Allosteric Switch in Related SmtB/ArsR Zinc
Sensor Proteins. Journal of molecular biology 333, 683-695 (2003).
68. Seshasayee, A.S.N., Bertone, P., Fraser, G.M. & Luscombe, N.M. Transcriptional regulatory networks
in bacteria: from input signals to output responses. Current opinion in microbiology 9, 511-9 (2006).
69. Babu, M.M. Early Career Research Award Lecture. Structure, evolution and dynamics of transcriptional
regulatory networks. Biochemical society transactions 38, 1155-78 (2010).
70. Gama-Castro, S. et al. RegulonDB (version 6.0): gene regulation model of Escherichia coli K-12
beyond transcription, active (experimental) annotated promoters and Textpresso navigation. Nucleic
acids research 36, D120-4 (2008).
71. Martínez-Antonio, A. Identifying global regulators in transcriptional regulatory networks in bacteria.
Current opinion in microbiology 6, 482-489 (2003).
72. Milo, R. et al. Network motifs: simple building blocks of complex networks. Science 298, 824-7 (2002).
73. Alon, U. Network motifs: theory and experimental approaches. Nature reviews. Genetics 8, 450-61
(2007).
74. Rosenfeld, N., Elowitz, M.B. & Alon, U. Negative Autoregulation Speeds the Response Times of
Transcription Networks. Journal of molecular bology 323, 785-793 (2002).
75. Becskei, A. & Serrano, L. Engineering stability in gene networks by autoregulation. Nature 405, 590-3
(2000).
76. Maeda, Y.T. & Sano, M. Regulatory dynamics of synthetic gene networks with positive feedback.
Journal of molecular biology 359, 1107-24 (2006).
77. Mangan, S. & Alon, U. Structure and function of the feed-forward loop network motif. Proceedings of
the National Academy of Sciences 100, 11980-5 (2003).
78. Shen-Orr, S.S., Milo, R., Mangan, S. & Alon, U. Network motifs in the transcriptional regulation
network of Escherichia coli. Nature genetics 31, 64-8 (2002).
79. Mangan, S., Zaslaver, A. & Alon, U. The Coherent Feedforward Loop Serves as a Sign-sensitive Delay
Element in Transcription Networks. Journal of molecular biology 334, 197-204 (2003).
80. Kalir, S., Mangan, S. & Alon, U. A coherent feed-forward loop with a SUM input function prolongs
flagella expression in Escherichia coli. Molecular systems biology 1, 2005.0006 (2005).
201
81. Zaslaver, A. et al. Just-in-time transcription program in metabolic pathways. Nature genetics 36, 486-91
(2004).
82. Ishihama, A. Functional modulation of Escherichia coli RNA polymerase. Annual review of
microbiology 54, 499-518 (2000).
83. Koo, B.-M., Rhodius, V.A., Campbell, E.A. & Gross, C.A. Dissection of recognition determinants of
Escherichia coli sigma32 suggests a composite -10 region with an “extended -10” motif and a core -10
element. Molecular microbiology 72, 815-29 (2009).
84. Arsène, F., Tomoyasu, T. & Bukau, B. The heat shock response of Escherichia coli. International
journal of food microbiology 55, 3-9 (2000).
85. Hughes, K.T. & Mathee, K. The anti-sigma factors. Annual review of microbiology 52, 231-86 (1998).
86. Helmann, J.D. Anti-sigma factors. Current opinion in microbiology 2, 135-41 (1999).
87. Jishage, M. & Ishihama, A. A stationary phase protein in Escherichia coli with binding activity to the
major sigma subunit of RNA polymerase. Proceedings of the National Academy of Sciences 95, 4953-8
(1998).
88. Piper, S.E., Mitchell, J.E., Lee, D.J. & Busby, S.J.W. A global view of Escherichia coli Rsd protein and
its interactions. Molecular biosystems 5, 1943-7 (2009).
89. Srivatsan, A. & Wang, J.D. Control of bacterial transcription, translation and replication by (p)ppGpp.
Current opinion in microbiology 11, 100-5 (2008).
90. Wendrich, T.M., Blaha, G., Wilson, D.N., Marahiel, M.A. & Nierhaus, K.H. Dissection of the
Mechanism for the Stringent Factor RelA. Molecular Cell 10, 779-788 (2002).
91. Paul, B.J. et al. DksA: a critical component of the transcription initiation machinery that potentiates the
regulation of rRNA promoters by ppGpp and the initiating NTP. Cell 118, 311-22 (2004).
92. Haugen, S.P. et al. rRNA promoter regulation by nonoptimal binding of sigma region 1.2: an additional
recognition element for RNA polymerase. Cell 125, 1069-82 (2006).
93. Potrykus, K., Murphy, H., Philippe, N. & Cashel, M. ppGpp is the major source of growth rate control
in E. coli. Environmental microbiology 13, 563-75 (2010).
94. Potrykus, K. & Cashel, M. (p)ppGpp: still magical? Annual review of microbiology 62, 35-51 (2008).
95. Dillon, S.C. & Dorman, C.J. Bacterial nucleoid-associated proteins, nucleoid structure and gene
expression. Nature reviews. Microbiology 8, 185-95 (2010).
96. Ball, C.A., Osuna, R., Ferguson, K.C. & Johnson, R.C. Dramatic changes in Fis levels upon nutrient
upshift in Escherichia coli. Journal of bacteriology 174, 8043-8056 (1992).
97. Stella, S., Cascio, D. & Johnson, R.C. The shape of the DNA minor groove directs binding by the DNA-
bending protein Fis. Genes & development 24, 814-26 (2010).
98. Squire, D.J.P., Xu, M., Cole, J.A., Busby, S.J.W. & Browning, D.F. Competition between NarL-
dependent activation and Fis-dependent repression controls expression from the Escherichia coli yeaR
and ogt promoters. The biochemical journal 420, 249-57 (2009).
99. Dorman, C.J. H-NS: a universal regulator for a dynamic genome. Nature reviews. Microbiology 2, 391-
400 (2004).
100. Lucchini, S. et al. H-NS mediates the silencing of laterally acquired genes in bacteria. PLoS pathogens
2, e81 (2006).
101. Stoebel, D.M., Free, A. & Dorman, C.J. Anti-silencing: overcoming H-NS-mediated repression of
transcription in Gram-negative enteric bacteria. Microbiology 154, 2533-45 (2008).
102. Merino, E. & Yanofsky, C. Transcription attenuation: a highly conserved regulatory strategy used by
bacteria. Trends in genetics 21, 260-4 (2005).
103. Naville, M. & Gautheret, D. Transcription attenuation in bacteria: theme and variations. Briefings in
functional genomics & proteomics 8, 482-92 (2009).
104. Yanofsky, C. Attenuation in the control of expression of bacterial operons. Nature 289, 751-758 (1981).
105. Browning, D.F. & Busby, S.J. The regulation of bacterial transcription initiation. Nature reviews.
Microbiology 2, 57-65 (2004).
106. Wang, S. et al. Transcriptomic response of Escherichia coli O157:H7 to oxidative stress. Applied and
environmental microbiology 75, 6110-23 (2009).
107. Clayden, J. Organic Chemistry. (Oxford University Press: Oxford, 2001).
108. WHO Formaldehyde. (2006).
109. Kerns, W.D., Pavkov, K.L., Donofrio, D.J., Gralla, E.J. & Swenberg, J.A. Carcinogenicity of
Formaldehyde in Rats and Mice after Long-Term Inhalation Exposure. Cancer Research 43, 4382-4392
(1983).
110. Schmid, O. & Speit, G. Genotoxic effects induced by formaldehyde in human blood and implications
for the interpretation of biomonitoring studies. Mutagenesis 22, 69-74 (2007).
111. Barker, S., Weinfeld, M. & Murray, D. DNA-protein crosslinks: their induction, repair, and biological
consequences. Mutation research 589, 111-35 (2005).
202
112. Aparicio, O., Geisberg, J.V. & Struhl, K. Chromatin immunoprecipitation for determining the
association of proteins with specific genomic sequences in vivo. Current protocols in cell biology
Chapter 17, Unit 17.7 (2004).
113. Collado-Vides, J. et al. Bioinformatics resources for the study of gene regulation in bacteria. Journal of
bacteriology 191, 23-31 (2009).
114. Heck, H. et al. Formaldehyde (CH2O) Concentrations in the Blood of Humans and Fischer-344 Rats
Exposed to CH2O Under Controlled Conditions. AIHA Journal 46, 1-3 (1985).
115. Handler, P., Bernheim, M. & R, K. The Oxidative Demethylation of Sacrosine. Journal of biological
chemistry 138, 211-218 (1941).
116. Trewick, S.C., Henshaw, T.F., Hausinger, R.P., Lindahl, T. & Sedgwick, B. Oxidative demethylation by
Escherichia coli AlkB directly reverts DNA base damage. Nature 419, 174-8 (2002).
117. Carlier, P., Hannichi, H. & Mouvier, G. The chemistry of carbonyl compounds in the atmosphere—A
review. Atmospheric environment 20, 2079-2099 (1986).
118. Granby, K. Urban and semi-rural observations of carboxylic acids and carbonyls. Atmospheric
environment 31, 1403-1415 (1997).
119. Vorholt, J.A. Cofactor-dependent pathways of formaldehyde oxidation in methylotrophic bacteria.
Archives of microbiology 178, 239-49 (2002).
120. Mitsui, R., Omori, M., Kitazawa, H. & Tanaka, M. Formaldehyde-limited cultivation of a newly
isolated methylotrophic bacterium, Methylobacterium sp. MF1: enzymatic analysis related to C1
metabolism. Journal of bioscience and bioengineering 99, 18-22 (2005).
121. Chistoserdova, L., Kalyuzhnaya, M.G. & Lidstrom, M.E. The expanding world of methylotrophic
metabolism. Annual review of microbiology 63, 477-99 (2009).
122. Harms, N., Ras, J., Reijnders, W.N., van Spanning, R.J. & Stouthamer, A.H. S-formylglutathione
hydrolase of Paracoccus denitrificans is homologous to human esterase D: a universal pathway for
formaldehyde detoxification? Journal of bacteriology 178, 6296-6299 (1996).
123. Interproscan. at <http://www.ebi.ac.uk/Tools/pfa/iprscan/>
124. Gonzalez, C.F. et al. Molecular basis of formaldehyde detoxification. Characterization of two S-
formylglutathione hydrolases from Escherichia coli, FrmB and YeiG. Journal of biological chemistry
281, 14514-14522 (2006).
125. Stittermatter, P. & Eric, B. Formaldehyde Dehydrogenase, a Glutathione dependent enzyme system. The
journal of biological chemistryournal of Biological Chemistry 213, 445-461 (1955).
126. Uotila, L. & Koivusalo, M. Formaldehyde Dehydrogenase from Human Liver. Purification, properties,
and evidence for formation of glutathione thiol esters by the enzyme. Journal of biological chemistry
249, 7653-7663 (1974).
127. Ksaumann, M. & Uotila, L. Evidence for the identity of glutathione-dependent formaldehyde
dehydrogenase and class III alcohol dehydrogenase. FEBS letters 257, 105-109 (1989).
128. Uotila, L. & Koivusalo, M. Purification and Properties of S-Formylglutathione Hydrolase from Human
Liver. Journal of biological chemistry 249, 7664-7672 (1974).
129. Min, H., Shane, B. & Stokstad, E.L. Identification of 10-formyltetrahydrofolate dehydrogenase-
hydrolase as a major folate binding protein in liver cytosol. Biochimica et biophysica acta 967, 348-53
(1988).
130. Danielsson, O. “Enzymogenesis”: Classical Liver Alcohol Dehydrogenase Origin from the Glutathione-
Dependent Formaldehyde Dehydrogenase Line. Proceedings of the National Academy of Sciences 89,
9247-9251 (1992).
131. Kaiser, R. Origin of the Human Alcohol Dehydrogenase System: Implications from the Structure and
Properties of the Octopus Protein. Proceedings of the National Academy of Sciences 90, 11222-11226
(1993).
132. Jensen, D.E., Belka, G.K. & Du Bois, G.C. S-Nitrosoglutathione is a substrate for rat alcohol
dehydrogenase class III isoenzyme. The biochemical journal 331 ( Pt 2, 659-68 (1998).
133. Liu, L. et al. A metabolic enzyme for S-nitrosothiol conserved from bacteria to humans. Nature 410,
490-4 (2001).
134. Yang, Z.N., Bosron, W.F. & Hurley, T.D. Structure of human chi chi alcohol dehydrogenase: a
glutathione-dependent formaldehyde dehydrogenase. Journal of molecular biology 265, 330-43 (1997).
135. Plapp, B.V. Conformational changes and catalysis by alcohol dehydrogenase. Archives of biochemistry
and biophysics 493, 3-12 (2010).
136. Sanghani, P.C., Bosron, W.F. & Hurley, T.D. Human Glutathione-Dependent Formaldehyde
Dehydrogenase. Structural Changes Associated with Ternary Complex Formation †. Biochemistry 41,
15189-15194 (2002).
203
137. Degrassi, G., Uotila, L., Klima, R. & Venturi, V. Purification and properties of an esterase from the
yeast Saccharomyces cerevisiae and identification of the encoding gene. Applied and environmental
microbiology 65, 3470-2 (1999).
138. Kordic, S., Cummins, I. & Edwards, R. Cloning and characterization of an S-formylglutathione
hydrolase from Arabidopsis thaliana. Archives of biochemistry and biophysics 399, 232-8 (2002).
139. Wu, D. et al. Crystal structure of human esterase D: a potential genetic marker of retinoblastoma. The
FASEB journal : official publication of the Federation of American Societies for Experimental Biology
23, 1441-6 (2009).
140. Johnson, Curtis, W. Principles Of Physical Biochemistry. (Pearson: 2006).
141. Alterio, V. et al. Crystal structure of an S-formylglutathione hydrolase from Pseudoalteromonas
haloplanktis TAC125. Biopolymers 93, 669-77 (2010).
142. Newton, G.L. & Fahey, R.C. Mycothiol biochemistry. Archives of microbiology 178, 388-94 (2002).
143. Reizer, J., Reizer, A. & Saier, M.H. Is the ribulose monophosphate pathway widely distributed in
bacteria? Microbiology 143 ( Pt 8, 2519-20 (1997).
144. Orita, I. et al. The archaeon Pyrococcus horikoshii possesses a bifunctional enzyme for formaldehyde
fixation via the ribulose monophosphate pathway. Journal of bacteriology 187, 3636-42 (2005).
145. Yurimoto, H., Kato, N. & Sakai, Y. Assimilation, dissimilation, and detoxification of formaldehyde, a
central metabolic intermediate of methylotrophic metabolism. Chemical record 5, 367-75 (2005).
146. Quayle, J.R. & Ferenci, T. Evolutionary aspects of autotrophy. Microbiological reviews 42, 251-73
(1978).
147. Kato, N., Yurimoto, H. & Thauer, R.K. The physiological role of the ribulose monophosphate pathway
in bacteria and archaea. Bioscience biotechnology and biochemistry 70, 10-21 (2006).
148. Wise, E., Yew, W.S., Babbitt, P.C., Gerlt, J.A. & Rayment, I. Homologous (β/α) 8 -Barrel Enzymes That
Catalyze Unrelated Reactions: Orotidine 5‘-Monophosphate Decarboxylase and 3-Keto- l -Gulonate 6-
Phosphate Decarboxylase † , ‡. Biochemistry 41, 3861-3869 (2002).
149. Gerlt, J. Evolution of function in (β/α)8-barrel enzymes. Current opinion in chemical biology 7, 252-264
(2003).
150. Yew, W.S., Wise, E.L., Rayment, I. & Gerlt, J.A. Evolution of enzymatic activities in the orotidine 5’-
monophosphate decarboxylase suprafamily: mechanistic evidence for a proton relay system in the active
site of 3-keto-L-gulonate 6-phosphate decarboxylase. Biochemistry 43, 6427-37 (2004).
151. Orita, I. et al. Crystal structure of 3-hexulose-6-phosphate synthase, a member of the orotidine 5’-
monophosphate decarboxylase suprafamily. Proteins 78, 3488-92 (2010).
152. Martinez-cruz, L.A. et al. of MJ1247 Protein from M. jannastechii at 2.0 A
Resolution Infers a Molecular Function of 3-Hexulose-6-Phosphate Isomerase. Structure 10, 195-204
(2002).
153. Ferenci, T., Strom, T. & Quayle, J.R. Purification and properties of 3-hexulose phosphate synthase and
phospho-3-hexuloisomerase from Methylococcus capsulatus. The biochemical journal 144, 477-86
(1974).
154. Tanaka, N., Kusakabe, Y., Ito, K., Yoshimoto, T. & Nakamura, K.T. Crystal Structure of Formaldehyde
Dehydrogenase from Pseudomonas putida: the Structural Origin of the Tightly Bound Cofactor in
Nicotinoprotein Dehydrogenases. Journal of molecular biology 324, 519-533 (2002).
155. Kato, N., Yamagami, T. & Shimao, M. Formaldehyde dismutase, a novel NAD-Binding oxioreductase
from Pseudomonas-putida F61. European journal of biochemistry 156, 59-64 (1986).
156. Marx, C.J., Miller, J.A., Chistoserdova, L. & Lidstrom, M.E. Multiple Formaldehyde
Oxidation/Detoxification Pathways in Burkholderia fungorum LB400. Journal of bacteriology 186,
2173-2178 (2004).
157. Vorholt, J.A., Marx, C.J., Lidstrom, M.E. & Thauer, R.K. Novel formaldehyde-activating enzyme in
Methylobacterium extorquens AM1 required for growth on methanol. Journal of bacteriology 182,
6645-50 (2000).
158. Roca, A., Rodríguez-Herva, J.J. & Ramos, J.L. Redundancy of enzymes for formaldehyde detoxification
in Pseudomonas putida. Journal of bacteriology 191, 3367-74 (2009).
159. Wittwer, A. & Wagner, C. Identification of the folate-binding proteins of rat liver mitochondria as
dimethylglycine dehydrogenase and sarcosine dehydrogenase. Flavoprotein nature and enzymatic
properties of the purified proteins. Journal of biological chemistry 256, 4109-4115 (1981).
160. Mackenzie, C.G. & Frisell, W. The metabolism of dimethylglycine by liver mitochondria. Thej ournal
of biological chemistry 232, 417-27 (1958).
161. Leys, D., Basran, J. & Scrutton, N.S. Channelling and formation of “active” formaldehyde in
dimethylglycine oxidase. The EMBO journal 22, 4038-48 (2003).
162. Tralau, T. et al. An internal reaction chamber in dimethylglycine oxidase provides efficient protection
from exposure to toxic formaldehyde. The journal of biological chemistry 284, 17826-34 (2009).
204
163. Fox, J.T. & Stover, P.J. Folate-mediated one-carbon metabolism. Vitamins and hormones 79, 1-44
(2008).
164. de Vries, G.E., Harms, N., Maurer, K., Papendrecht, A. & Stouthamer, A.H. Physiological regulation of
Paracoccus denitrificans methanol dehydrogenase synthesis and activity. Journal of bacteriology 170,
3731-7 (1988).
165. Harms, N., Reijnders, W.N., Koning, S. & van Spanning, R.J. Two-component system that regulates
methanol and formaldehyde oxidation in Paracoccus denitrificans. Journal of bacteriology 183, 664-70
(2001).
166. Barber, R.D. & Donohue, T.J. Pathways for transcriptional activation of a glutathione-dependent
formaldehyde dehydrogenase gene. Journal of molecular biology 280, 775-84 (1998).
167. Hickman, J.W., Witthuhn, V.C., Dominguez, M. & Donohue, T.J. Positive and negative transcriptional
regulators of glutathione-dependent formaldehyde metabolism. Journal of bacteriology 186, 7914-25
(2004).
168. Yasueda, H., Kawahara, Y. & Sugimoto, S. Bacillus subtilis yckG and yckF encode two key enzymes of
the ribulose monophosphate pathway used by methylotrophs, and yckH is required for their expression.
Journal of bacteriology 181, 7154-7160 (1999).
169. Nguyen, T.T.H. et al. Genome-wide responses to carbonyl electrophiles in Bacillus subtilis: control of
the thiol-dependent formaldehyde dehydrogenase AdhA and cysteine proteinase YraA by the MerR-
family regulator YraB (AdhR). Molecular microbiology 71, 876-94 (2009).
170. Hoskisson, P.A. & Rigali, S. Advances in Applied Microbiology Volume 69. Advances in applied
microbiology 69, 1-22 (Elsevier: 2009).
171. Yurimoto, H. et al. HxlR, a member of the DUF24 protein family, is a DNA-binding protein that acts as
a positive regulator of the formaldehyde-inducible hxlAB operon in Bacillus subtilis. Molecular
microbiology 57, 511-519 (2005).
172. Potter, A.J., Kidd, S.P., McEwan, A.G. & Paton, J.C. The MerR/NmlR family transcription factor of
Streptococcus pneumoniae responds to carbonyl stress and modulates hydrogen peroxide production.
Journal of bacteriology 192, 4063-6 (2010).
173. Barford, D. The role of cysteine residues as redox-sensitive regulatory switches. Current opinion in
structural biology 14, 679-86 (2004).
174. Rasko, D.A. et al. Complete sequence analysis of novel plasmids from emetic and periodontal Bacillus
cereus isolates reveals a common evolutionary history among the B. cereus-group plasmids, including
Bacillus anthracis pXO1. Journal of bacteriology 189, 52-64 (2007).
175. Gutheil, W.G., Kasimoglu, E. & Nicholson, P.C. Induction of glutathione-dependent formaldehyde
dehydrogenase activity in Escherichia coli and Hemophilus influenza. Biochemical and biophysical
research communications 238, 693-696 (1997).
176. Herring, C.D. & Blattner, F.R. Global transcriptional effects of a suppressor tRNA and the inactivation
of the regulator frmR. Journal of bacteriology 186, 6714-6720 (2004).
177. Liu, T. et al. CsoR is a novel Mycobacterium tuberculosis copper-sensing transcriptional regulator.
Nature chemical biology 3, 60-68 (2007).
178. Ma, Z., Cowart, D.M., Scott, R.A. & Giedroc, D.P. Molecular Insights into the Metal Selectivity of the
Copper(I)-Sensing Repressor CsoR from Bacillus subtilis. Biochemistry 48, 3325-3334 (2009).
179. Sakamoto, K., Agari, Y., Agari, K., Kuramitsu, S. & Shinkai, A. Structural and functional
characterization of the transcriptional repressor CsoR from Thermus thermophilus HB8. Microbiology
156, 1993-2005 (2010).
180. Iwig, J.S., Rowe, J.L. & Chivers, P.T. Nickel homeostasis in Escherichia coli - the rcnR-rcnA efflux
pathway and its linkage to NikR function. Molecular microbiology 62, 252-262 (2006).
181. Birnboim, H.C. & Doly, J. A rapid alkaline extraction procedure for screening recombinant plasmid
DNA. Nucleic acids research 7, 1513-23 (1979).
182. Bradford, M.M. A rapid and sensitive method for the quantitation of microgram quantities of protein
utilizing the principle of protein-dye binding. Analytical biochemistry 72, 248-54 (1976).
183. Fenn, J., Mann, M., Meng, C., Wong, S. & Whitehouse, C. Electrospray ionization for mass
spectrometry of large biomolecules. Science 246, 64-71 (1989).
184. Nolting, B. Methods in Modern Biophysics. (Springer: 2010).
185. Strupat, K. Molecular weight determination of peptides and proteins by ESI and MALDI. Methods in
enzymology 405, 1-36 (2005).
186. Wiley, W.C. & McLaren, I.H. Time-of-Flight Mass Spectrometer with Improved Resolution. Review of
Scientific Instruments 26, 1150 (1955).
187. Wen J., Arakawa T. & Philo J.S. Size-Exclusion Chromatography with On-Line Light-Scattering,
Absorbance, and Refractive Index Detectors for Studying Proteins and Their Interactions. Analytical
biochemistry 240, 12 (1996).
205
188. Zimm, B.H. The Scattering of Light and the Radial Distribution Function of High Polymer Solutions.
The journal of chemical physics 16, 1093 (1948).
189. Whitmore, L. & Wallace, B.A. Protein secondary structure analyses from circular dichroism
spectroscopy: methods and reference databases. Biopolymers 89, 392-400 (2008).
190. Perez-Iratxeta, C. & Andrade-Navarro, M.A. K2D2: estimation of protein secondary structure from
circular dichroism spectra. BMC structural biology 8, 25 (2008).
191. Fried, M.G. Measurement of protein-DNA interaction parameters by electrophoresis mobility shift
assay. Electrophoresis 10, 366-76
192. Altschul*, S.F. et al. Gapped BLAST and PSI-BLAST: a new generation of protein database search
programs. Nucleic acids research 25, 3389-3402 (1997).
193. Larkin, M.A. et al. Clustal W and Clustal X version 2.0. Bioinformatics 23, 2947-8 (2007).
194. Clamp, M., Cuff, J., Searle, S.M. & Barton, G.J. The Jalview Java alignment editor. Bioinformatics 20,
426-7 (2004).
195. Cole, C., Barber, J.D. & Barton, G.J. The Jpred 3 secondary structure prediction server. Nucleic acids
research 36, W197-201 (2008).
196. Simossis, V.A. & Heringa, J. Integrating protein secondary structure prediction and multiple sequence
alignment. Current protein & peptide science 5, 249-66 (2004).
197. Wu, J. et al. Prediction of DNA-binding residues in proteins from amino acid sequences using a random
forest model with a hybrid feature. Bioinformatics 25, 30-5 (2009).
198. Wang, L. & Brown, S.J. BindN: a web-based tool for efficient prediction of DNA and RNA binding
sites in amino acid sequences. Nucleic acids research 34, W243-8 (2006).
199. Yan, C. et al. Predicting DNA-binding sites of proteins from amino acid sequence. BMC bioinformatics
7, 262 (2006).
200. Hwang, S., Gou, Z. & Kuznetsov, I.B. DP-Bind: a web server for sequence-based prediction of DNA-
binding residues in DNA-binding proteins. Bioinformatics 23, 634-6 (2007).
201. Chu, W.-Y. et al. ProteDNA: a sequence-based predictor of sequence-specific DNA-binding residues in
transcription factors. Nucleic acids research 37, W396-401 (2009).
202. Rhodes, G. Crystallography Made Crystal Clear. (Elsevier: Oxford, 2006).
203. Drenth, J. Principles of Protein X-Ray Crystallography. (Springer: New York, 2007).
204. Woolfson, M. An Introduction to X-Ray Crystallography. (Cambridge University Press: 1997).
205. Durbin, S.D. & Feher, G. Protein crystallization. Annual review of physical chemistry 47, 171-204
(1996).
206. Battye, T.G.G., Kontogiannis, L., Johnson, O., Powell, H.R. & Leslie, A.G.W. iMOSFLM: a new
graphical interface for diffraction-image processing with MOSFLM. Acta crystallographica. Section D,
Biological crystallography 67, 271-81 (2011).
207. Evans, P. Scaling and assessment of data quality. Acta crystallographica. Section D, Biological
crystallography 62, 72-82 (2006).
208. French, S. & Wilson, K. On the treatment of negative intensity observations. Acta crystallographica
Section A 34, 517-525 (1978).
209. McCoy, A.J. et al. Phaser crystallographic software. Journal of applied crystallography 40, 658-674
(2007).
210. Claude, J.-B., Suhre, K., Notredame, C., Claverie, J.-M. & Abergel, C. CaspR: a web server for
automated molecular replacement using homology modelling. Nucleic acids research 32, W606-9
(2004).
211. Terwilliger, T.C. Maximum-likelihood density modification using pattern recognition of structural
motifs. Acta crystallographica Section D Biological crystallography 57, 1755-1762 (2001).
212. Terwilliger, T.C. Automated main-chain model building by template matching and iterative fragment
extension. Acta crystallographica Section D Biological crystallography 59, 38-44 (2002).
213. Terwilliger, T.C. et al. Iterative model building, structure refinement and density modification with the
PHENIX AutoBuild wizard. Acta crystallographica. Section D, Biological crystallography 64, 61-9
(2008).
214. Afonine, P.., Grosse-Kunstleve, R.W. & Adams, P.D. The Phenix refinement framework. CCP4
newsletter 42, (2005).
215. Chen, V.B. et al. MolProbity: all-atom structure validation for macromolecular crystallography. Acta
crystallographica. Section D, Biological crystallography 66, 12-21 (2010).
216. Reynolds, C., Damerell, D. & Jones, S. ProtorP: a protein-protein interaction analysis server.
Bioinformatics 25, 413-4 (2009).
217. Studier, F.W. & Moffatt, B.A. Use of bacteriophage T7 RNA polymerase to direct selective high-level
expression of cloned genes. Journal of molecular biology 189, 113-30 (1986).
206
218. Rosenberg, A. et al. Vectors for selective expression of cloned DNAs by T7 RNA polymerase. Gene 56,
125-135 (1987).
219. Zhu, B., Cai, G., Hall, E.O. & Freeman, G.J. In-fusion assembly: seamless engineering of multidomain
fusion proteins, modular vectors, and mutations. BioTechniques 43, 354-9 (2007).
220. Studier, F.W., Rosenberg, A.H., Dunn, J.J. & Dubendorff, J.W. Use of T7 RNA polymerase to direct
expression of cloned genes. Methods in enzymology 185, 60-89 (1990).
221. Hochuli, E., Döbeli, H. & Schacher, A. New metal chelate adsorbent selective for proteins and peptides
containing neighbouring histidine residues. Journal of chromatography 411, 177-84 (1987).
222. Sternbach, H., Englehardt, R. & Lezius, A.G. Rapid Isolation of Highly Active RNA Polymerase from
Escherichia coli and Its Subunits by Matrix-Bound Heparin. European journal of biochemistry 60, 51-
55 (1975).
223. Atkins, P. & De Paula, J. Physical Chemistry. 162-163 (Oxford University Press: New York, 2006).
224. Winzor, D.J. Analytical exclusion chromatography. Journal of biochemical and biophysical methods 56,
15-52 (2003).
225. Ben-Bassat, A. et al. Processing of the initiation methionine from proteins: properties of the Escherichia
coli methionine aminopeptidase and its gene structure. Journal of bacteriology 169, 751-757 (1987).
226. Oliva, A., Llabrés, M. & Fariña, J.B. Applications of multi-angle laser light-scattering detection in the
analysis of peptides and proteins. Current drug discovery technologies 1, 229-42 (2004).
227. Whitaker, J.R. Determination of Molecular Weights of Proteins by Gel Filtration of Sephadex.
Analytical chemistry 35, 1950-1953 (1963).
228. Andrews, P. Estimation of the molecular weights of proteins by Sephadex gel-filtration. The
biochemical journal 91, 222-33 (1964).
229. Perez, J.C. & Groisman, E.A. Evolution of transcriptional regulatory circuits in bacteria. Cell 138, 233-
44 (2009).
230. Petsko, G. Protein crystallography at sub-zero temperatures: Cryo-protective mother liquors for protein
crystals. Journal of molecular biology 96, 381-388 (1975).
231. Leslie, A.G.W. The integration of macromolecular diffraction data. Acta crystallographica. Section D,
Biological crystallography 62, 48-57 (2006).
232. Ma, Z., Cowart, D.M., Scott, R.A. & Giedroc, D.P. Molecular insights into the metal selectivity of the
copper(I)-sensing repressor CsoR from Bacillus subtilis. Biochemistry 48, 3325-34 (2009).
233. Long, F., Vagin, A.A., Young, P. & Murshudov, G.N. BALBES: a molecular-replacement pipeline.
Acta crystallographica. Section D, Biological crystallography 64, 125-32 (2008).
234. Berman, H.M. The Protein Data Bank. Nucleic acids research 28, 235-242 (2000).
235. Yeates, T.O. Detecting and overcoming crystal twinning. Methods in enzymology 276, 344-58 (1997).
236. Lovell, S.C., Word, J.M., Richardson, J.S. & Richardson, D.C. The penultimate rotamer library.
Proteins 40, 389-408 (2000).
237. Arendall, W.B. et al. A test of enhancing model accuracy in high-throughput crystallography. Journal of
structural and functional genomics 6, 1-11 (2005).
238. Palm, G.J. et al. Structural insights into the redox-switch mechanism of the MarR/DUF24-type regulator
HypR. Nucleic acids research gkr1316- (2012).doi:10.1093/nar/gkr1316
239. Reynolds C, Damerell D, J.S. ProtorP: a protein-protein interaction analysis server. Bioinformatics 3,
413-414 (2009).
240. Bahadur, R.P. & Zacharias, M. The interface of protein-protein complexes: analysis of contacts and
prediction of interactions. Cellular and molecular life sciences 65, 1059-72 (2008).
241. Voet, D. & Voet, J. Biochemisrty. (J. Wiley & Sons: 2004).
242. Aravind, L., Anantharaman, V., Balaji, S., Babu, M.M. & Iyer, L.M. The many faces of the helix-turn-
helix domain: Transcription regulation and beyond. FEMS Microbiology Reviews 29, 231-262 (2005).
243. Thompson, J.D., Gibson, T.J. & Higgins, D.G. Multiple sequence alignment using ClustalW and
ClustalX. Current protocols in bioinformatics Chapter 2, Unit 2.3 (2002).
244. Smaldone, G.T. & Helmann, J.D. CsoR regulates the copper efflux operon copZA in Bacillus subtilis.
Microbiology 153, 4123-8 (2007).
245. Iwig, J.S., Leitch, S., Herbst, R.W., Maroney, M.J. & Chivers, P.T. Ni(II) and Co(II) sensing by
Escherichia coli RcnR. Journal of the American Chemical Society 130, 7592-7606 (2008).
246. Changela, A. et al. Molecular basis of metal-ion selectivity and zeptomolar sensitivity by CueR. Science
301, 1383-7 (2003).
247. Iwig, J.S. & Chivers, P.T. DNA Recognition and Wrapping by Escherichia coli RcnR. Journal of
molecular biology 393, 514-526 (2009).
248. Chi, B.K. et al. The redox-sensing regulator YodB senses quinones and diamide via a thiol-disulfide
switch in Bacillus subtilis. Proteomics 10, 3155-64 (2010).

207
249. Antelmann, H. & Helmann, J.D. Thiol-based redox switches and gene regulation. Antioxidants & redox
signaling 14, 1049-63 (2011).
250. Barford, D. The role of cysteine residues as redox-sensitive regulatory switches. Current opinion in
structural biology 14, 679-86 (2004).
251. Matthews, J., Batki, A., Hynds, C. & Kricka, L. Enhanced chemiluminescent method for the detection
of DNA dot-hybridization assays. Analytical biochemistry 151, 205-209 (1985).
252. Baba, T. et al. Construction of Escherichia coli K-12 in-frame, single-gene knockout mutants: the Keio
collection. Molecular systems biology 2, 2006.0008 (2006).
253. Datsenko, K.A. & Wanner, B.L. One-step inactivation of chromosomal genes in Escherichia coli K-12
using PCR products. Proceedings of the National Academy of Sciences 97, 6640-6645 (2000).
254. Martinez-Morales, F., Borges, A.C., Martinez, A., Shanmugam, K.T. & Ingram, L.O. Chromosomal
integration of heterologous DNA in Escherichia coli with precise removal of markers and replicons used
during construction. Journal of bacteriology 181, 7143-7148 (1999).
255. Anderson, B.J. et al. Using Fluorophore-Labeled Oligonucleotides to Measure Affinities of Protein-
DNA Interactions. Methods in enzymology Volume 450, 253-272 (2008).