Embed Size (px)
Citation preview

Research Collection
Doctoral Thesis
Molecular and physiological analysis of chilling tolerance inmaize (Zea mays L.) seedlings
Author(s): Biradar, Sunil Kumar
Publication Date: 2008
Permanent Link: https://doi.org/10.3929/ethz-a-005786359
Rights / License: In Copyright - Non-Commercial Use Permitted
This page was generated automatically upon download from the ETH Zurich Research Collection. For moreinformation please consult the Terms of use.
ETH Library

Diss. ETH No. 18028
Molecular and physiological analysis of chilling tolerance in maize (Zea mays L.) seedlings
A dissertation submitted to the
ETH ZURICH for the degree of
DOCTOR OF SCIENCES
presented by
SUNIL KUMAR BIRADAR M.Sc. in Agricultural Sciences, University of Agricultural Science, Dharwad, India
born 1. June 1976
Citizen of India
accepted on the recommendation of
Prof. Dr. P. Stamp, examiner
Dr. C. Sautter, co-examiner
Dr. J. Leipner, co-examiner
Zurich, 2008


I
Table of contents
Summary .................................................................................................................................. IV
Zusammenfassung...................................................................................................................VII
List of abbreviations.................................................................................................................. X
1 General Introduction........................................................................................................... 1
1.1 Aims of the study ....................................................................................................... 5
2 Re-analysis of a major QTL for chilling tolerance of photosynthesis based on an improved map of the ETH-DL3 × ETH-DH7 population.................................................. 7
2.1 Introduction ................................................................................................................ 7
2.2 Materials and Methods ............................................................................................... 7
2.2.1 Resource population and phenotypic data.............................................................. 7
2.2.2 Selection and development of molecular markers ................................................. 8
2.2.3 DNA markers assay................................................................................................ 8
2.2.4 QTL analysis .......................................................................................................... 9
2.3 Results and Discussion............................................................................................... 9
3 Marker assisted introgression of a major QTL for chilling tolerance of photosynthesis into the recurrent parental line.......................................................................................... 13
3.1 Introduction .............................................................................................................. 13
3.2 Materials and methods ............................................................................................. 14
3.2.1 Plant material........................................................................................................ 14
3.2.2 Growth conditions ................................................................................................ 15
3.2.3 Measurement of physiological traits .................................................................... 15
3.2.4 DNA isolation and SSR marker assay.................................................................. 16
3.2.5 Marker assisted and phenotype based backcrossing ............................................ 17
3.2.6 Statistical analysis and QTL mapping.................................................................. 18
3.3 Results ...................................................................................................................... 18
3.3.1 Phenotypic analysis of chilling tolerance............................................................. 18
3.3.2 QTL consistency over generations....................................................................... 20
3.3.3 Confirmation of the additional QTL in the distal region of chromosome 6 in the BC3F2 population ................................................................................................. 21
3.3.4 Time course analysis of QTLs for photosynthetic traits ...................................... 22
3.4 Discussion ................................................................................................................ 24
4 Characterization of the photosynthetic apparatus of near isogenic lines (NILs) for a QTL related to chilling tolerance of photosynthesis ................................................................. 28
4.1 Introduction .............................................................................................................. 28

II
4.2 Materials and Methods ............................................................................................. 29
4.2.1 Plant material........................................................................................................ 29
4.2.2 Growth conditions ................................................................................................ 29
4.2.3 Light response curves of gas-exchange and chlorophyll fluorescence parameters under controlled conditions.................................................................................. 30
4.2.4 Measurement of physiological traits under field conditions ................................ 31
4.2.5 Data analysis and statistic .................................................................................... 31
4.3 Results ...................................................................................................................... 31
4.3.1 Genotypic differences in the light response of CO2 assimilation, PS II functioning and energy dissipation.......................................................................................... 31
4.3.2 Field experiment................................................................................................... 34
4.4 Discussion ................................................................................................................ 35
5 Validation of the major QTL for chilling tolerance of photosynthesis in a dent × flint maize population .............................................................................................................. 38
5.1 Introduction .............................................................................................................. 38
5.2 Materials and Methods ............................................................................................. 39
5.2.1 Plant material........................................................................................................ 39
5.2.2 Growth conditions ................................................................................................ 39
5.2.3 Measurement of chlorophyll fluorescence parameters......................................... 40
5.2.4 DNA isolation and SSR marker assay.................................................................. 40
5.2.5 Bulk segregant analysis........................................................................................ 40
5.2.6 QTL mapping ....................................................................................................... 40
5.3 Results ...................................................................................................................... 41
5.3.1 Phenotypic analysis .............................................................................................. 41
5.3.2 Bulk segregant analysis........................................................................................ 42
5.3.3 Construction of molecular marker map and analysis of QTL.............................. 43
5.4 Discussion ................................................................................................................ 44
6 Comparative mapping and identification of candidate genes for the major QTL for chilling tolerance of photosynthesis ................................................................................. 47
6.1 Introduction .............................................................................................................. 47
6.2 Material and Methods............................................................................................... 48
6.2.1 Comparative mapping .......................................................................................... 48
6.2.2 Bioinformatics...................................................................................................... 48
6.3 Results and Discussion............................................................................................. 48
7 General Conclusions......................................................................................................... 53
8 References ........................................................................................................................ 55

III
9 Appendix .......................................................................................................................... 64
Acknowledgements .................................................................................................................. 66
Curriculum Vitae...................................................................................................................... 68

IV
Summary
Maize (Zea mays L.) is a crop of tropical/subtropical origin. It requires a temperature of about
25-35 °C for growth and development. In temperate regions, however, maize is sown during
spring, where maize seedlings are often exposed to suboptimal temperature coupled with short
spells of chilling events. In particular, the growth and early development of the seedling may
be strongly affected by low temperature. A better understanding of the genetic and
physiological basis of the effect of low temperature on maize may help to alleviate the
problems associated with the chilling sensitivity of maize seedlings. The genetic basis of
chilling tolerance has been studied by analysis of the quantitative trait locus (QTL); several
QTLs for chilling tolerance of photosynthesis were identified in a Swiss dent maize mapping
population derived from the cross of the chilling sensitive line ETH-DL3 and the chilling
tolerant line ETH-DH7. In order to conduct an in-depth study of the major QTL for chilling
tolerance of photosynthesis, which was found in the above mentioned study in the telomeric
region of the long arm of chromosome 6, physiological and genetic analyses were conducted
in backcross populations and near isogenic lines (NILs) derived from the ETH-DL3 × ETH-
DH7 population as well as in an alternative F2 population. Based on the results, the aim was
to identify further potential candidate genes which may underlay this QTL for chilling
tolerance of photosynthesis.
In order to narrow down the confidence interval of the major QTL for chilling tolerance of
photosynthesis on chromosome 6, in a first step, 17 simple sequence repeat (SSR), 18 indel
polymorphism (IDP) and 21 newly designed SSR markers from BAC sequences, located in
the QTL region, were analyzed for parental polymorphism. Two polymorphic SSR markers
were identified. The re-analysis of the data of the previous QTL study with the two additional
polymorphic SSR markers revealed an additional QTL in the telomeric region of the long arm
of chromosome 6, which was also associated with chilling tolerance of photosynthesis. The
re-analysis showed that the first QTL (QTL-1) is flanked by the markers umc1859 and
bnlg1740, while the other, new, QTL (QTL-2) is flanked by markers bnlg1136 and umc1653.
In order to elucidate the physiological and genetic basis of the above mentioned two QTLs, a
marker assisted backcross breeding was carried out. The chromosomal region, which harbors
the QTLs for chilling tolerance of photosynthesis, was introgressed by marker assisted fore-
and back-ground selection from the chilling tolerant line ETH-DH7 into the chilling sensitive
V
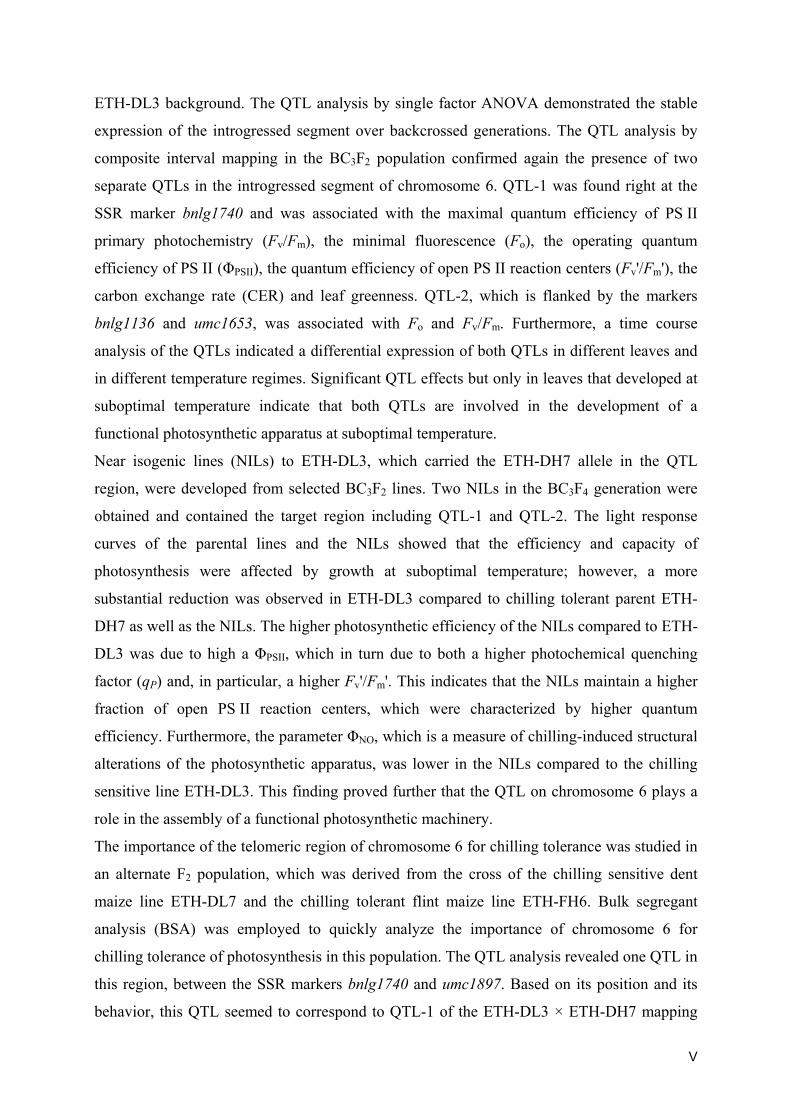
ETH-DL3 background. The QTL analysis by single factor ANOVA demonstrated the stable
expression of the introgressed segment over backcrossed generations. The QTL analysis by
composite interval mapping in the BC3F2 population confirmed again the presence of two
separate QTLs in the introgressed segment of chromosome 6. QTL-1 was found right at the
SSR marker bnlg1740 and was associated with the maximal quantum efficiency of PS II
primary photochemistry (Fv/Fm), the minimal fluorescence (Fo), the operating quantum
efficiency of PS II (ΦPSII), the quantum efficiency of open PS II reaction centers (Fv'/Fm'), the
carbon exchange rate (CER) and leaf greenness. QTL-2, which is flanked by the markers
bnlg1136 and umc1653, was associated with Fo and Fv/Fm. Furthermore, a time course
analysis of the QTLs indicated a differential expression of both QTLs in different leaves and
in different temperature regimes. Significant QTL effects but only in leaves that developed at
suboptimal temperature indicate that both QTLs are involved in the development of a
functional photosynthetic apparatus at suboptimal temperature.
Near isogenic lines (NILs) to ETH-DL3, which carried the ETH-DH7 allele in the QTL
region, were developed from selected BC3F2 lines. Two NILs in the BC3F4 generation were
obtained and contained the target region including QTL-1 and QTL-2. The light response
curves of the parental lines and the NILs showed that the efficiency and capacity of
photosynthesis were affected by growth at suboptimal temperature; however, a more
substantial reduction was observed in ETH-DL3 compared to chilling tolerant parent ETH-
DH7 as well as the NILs. The higher photosynthetic efficiency of the NILs compared to ETH-
DL3 was due to high a ΦPSII, which in turn due to both a higher photochemical quenching
factor (qP) and, in particular, a higher Fv'/Fm'. This indicates that the NILs maintain a higher
fraction of open PS II reaction centers, which were characterized by higher quantum
efficiency. Furthermore, the parameter ΦNO, which is a measure of chilling-induced structural
alterations of the photosynthetic apparatus, was lower in the NILs compared to the chilling
sensitive line ETH-DL3. This finding proved further that the QTL on chromosome 6 plays a
role in the assembly of a functional photosynthetic machinery.
The importance of the telomeric region of chromosome 6 for chilling tolerance was studied in
an alternate F2 population, which was derived from the cross of the chilling sensitive dent
maize line ETH-DL7 and the chilling tolerant flint maize line ETH-FH6. Bulk segregant
analysis (BSA) was employed to quickly analyze the importance of chromosome 6 for
chilling tolerance of photosynthesis in this population. The QTL analysis revealed one QTL in
this region, between the SSR markers bnlg1740 and umc1897. Based on its position and its
behavior, this QTL seemed to correspond to QTL-1 of the ETH-DL3 × ETH-DH7 mapping

VI
population. The conservation of this QTL in different mapping populations indicated the
importance of this genomic region for the development of a functional photosynthetic
apparatus at suboptimal temperature.
Potential candidate genes were identified by in silico analysis of the QTL region, which
contains 232 expressed sequence tags (ESTs). A further search for homology against EST
sequences from publicly available maize cold stressed library, revealed 33 putative candidate
genes, which are induced under chilling stress conditions. Among these, three genes were
directly involved in photosynthesis. In particular, cab-m7, coding for a light harvesting
complex II protein and the gene of the protease DegP1, which is known to be involved in the
repair of PS II, explained the observed phenotype of the studied QTL. However, further fine
mapping and functional genomic experimentation will be required to clarify whether one of
these genes underlies of the QTL for chilling tolerance of photosynthesis on the long arm of
chromosome 6.

VII
Zusammenfassung
Mais (Zea mays L.) ist eine Kulturpflanze (sub)tropischen Ursprungs. Sie benötigt eine
Temperatur von ungefähr 25 bis 35 °C für ein optimales Wachstum und Entwicklung. Mais
wird jedoch in den gemässigten Zonen im Frühling gesät, wenn die Pflanzen suboptimalen
Temperaturen und kurzen Kälteeinbrüchen ausgesetzt sein können. Insbesondere das
Wachstum und die frühe Entwicklung der Sämlinge kann durch niedrige Temperaturen stark
gestört werden. Ein besseres Verständnis der genetischen und physiologischen Ursachen der
Effekte niedriger Temperatur auf Mais ist nötigt, um züchterisch eine verbesserte
Kühletoleranz der Maissämlinge zu erreichen. In einer vorherigen Studie wurde die
genetische Ursache der Kühletoleranz in einer Quantitative Trait Locus (QTL) Analyse
untersucht. Dabei wurden in einer Schweizer Zahnmaispopulation, welche aus der Kreuzung
der kühlesensitiven Inzuchtlinie ETH-DL3 und der kühletoleranten Linie ETH-DH7
hervorging, mehrer QTLs für die Kühletoleranz der Photosynthese identifiziert. Um diesen
QTL für die Kühletoleranz der Photosynthese, welcher in der oben genannten Population in
der telomerischen Region des langen Arms von Chromosom 6 gefunden wurde, besser zu
untersuchen, wurden physiologische und genetische Analysen in Rückkreuzungspopulationen
und nahe-isogene Linien (NILs) der ETH-DL3 × ETH-DH7 Population sowie in einer
alternativen F2-Population durchgeführt. Basierend auf den erhaltenen Ergebnissen sollten
potentielle Kandidatengene identifiziert werden, die möglicherweise diesem QTL für die
Kühletoleranz der Photosynthese unterliegen.
Mit dem Ziel das QTL-Konfidenzintervall einzugrenzen, wurden in einem ersten Schritt 17
Mikrosatelliten (SSR Marker), 18 indel Polymorphismus (IDP) Marker sowie 21 aus BAC
Sequenzen konstruierte SSR Marker, welche in der QTL-Region lokalisiert sind, auf elterliche
Polymorphismen untersucht. Dabei wurden zwei polymorphe SSR Marker identifiziert. Die
Reanalyse der Daten aus der vorherigen QTL-Studie mit den beiden neuen polymorphen SSR
Markern zeigte ein zusätzliches QTL in der telomerischen Region des langen Arms von
Chromosom 6 auf, welches mit der Kühletoleranz der Photosynthese assoziiert war. Die
Reanalyse ergab, dass das erste QTL (QTL-1) durch die Marker umc1859 und bnlg1740
flankiert ist, während das zweite QTL (QTL-2) zwischen den Markern bnlg1136 und
umc1653 liegt.
Markergestützte Rückkreuzungen wurden durchgeführt, um die physiologischen und gene-
tischen Ursachen der beiden oben genannten QTLs in grösserer Genauigkeit zu untersuchen.

VIII
Die chromosomale Region, welche den QTL für die Kühletoleranz der Photosynthese
beinhaltet, wurde durch markergestützte Selektion von der kühletoleranten Linie ETH-DH7 in
die kühlesensitive Linie ETH-DL3 eingefügt. Die QTL-Analyse mittels ANOVA zeigte eine
stabile Expression des eingefügten chromosomalen Segments in den verschiedenen Rück-
kreuzungsgenerationen. Die QTL-Analyse mittels Composite Interval Mapping in der BC3F2-
Generation bestätigte das Vorhandensein von zwei unabhängigen QTLs im eingefügten
Segment von Chromosom 6. Das QTL-1 wurde nahe des SSR Markers bnlg1740 lokalisiert
und war mit der maximalen Quanteneffizienz der primären Photochemie des Photosystem II
(Fv/Fm), der minimalen Fluoreszenz (Fo), der aktuellen Quanteneffizienz von Photosystem II
(ΦPSII), der Quanteneffizienz der offenen Photosystem II Reaktionszentren (Fv'/Fm'), dem
CO2-Austausch und der Blattgrüne assoziiert. QTL-2, welches durch die Marker bnlg1136
und umc1653 flankiert war, war mit Fo und Fv/Fm assoziiert. Das Vorhandensein von
signifikanten QTL-Effekten nur in Blättern, die sich unter suboptimaler Temperatur
entwickelten, deutet an, dass beide QTLs in der Entwicklung eines funktionsfähigen
photosynthetischen Apparates involviert sind.
Von ausgewählten BC3F2 Linien wurden NILs zu ETH-DL3 entwickelt, welche das ETH-
DH7-Allel in der QTL-Region besassen. Es wurden zwei NILs in der BC3F4-Generation
erhalten, die die Zielregion mit QTL-1 und QTL-2 enthielten. Die Lichtsättigungskurven der
elterlichen Linien und der NILs zeigten, dass sowohl die photosynthetische Effizienz als auch
deren Aktivität durch suboptimale Wachstumstemperatur beeinträchtigt war. Jedoch wurde
eine deutlichere Reduktion in ETH-DL3 im Vergleich zu ETH-DH7 und den NILs
beobachtet. Die höhere photosynthetische Effizienz der NILs im Vergleich zu ETH-DL3
beruhte auf eine höhere ΦPSII, die wiederum durch einen höheren Faktor der photochemischen
Löschung (qP) und insbesondere einer höheren Fv'/Fm' verursacht wurde. Diese Beobachtung
deutete daraufhin, dass die NILs einen grösseren Anteil an offenen PS II Reaktionszentren
aufweisen, die zu dem durch eine höhere Quanteneffizienz charakterisiert waren. Ausserdem
war der Parameter ΦNO, welcher ein Mass für kühleinduzierte Veränderungen in der Struktur
des photosynthetischen Apparates ist, in den NILs niedriger im Vergleich zur kühlesensitiven
Linie ETH-DL3. Diese Erkenntnis gab einen weiteren Beleg für die Rolle des QTLs auf
Chromosom 6 für den Aufbau einer funktionstüchtigen photosynthetischen Maschinerie.
Die Wichtigkeit der telomerischen Region von Chromosom 6 für die Kühletoleranz der
Photosynthese wurde auch in einer alternativen F2-Population, welche aus der Kreuzung
zwischen der kühlesensitiven Zahnmaislinie ETH-DL7 und der kühletoleranten Flintmaislinie
ETH-FH6 abgeleitet wurde, untersucht. Um möglichst schnell die Wichtigkeit von Chromo-

IX
som 6 für die Kühletoleranz der Photosynthese in dieser Population zu untersuchen, wurde
zunächst eine Bulk Segregant Analysis (BSA) durchgeführt. Die QTL-Analyse bestätigte
einen QTL in dieser chromosomalen Region, welcher zwischen den SSR Markern bnlg1740
und umc1897 lag. Basierend auf seine Position und Charakteristika, kann vermutet werden,
dass dieser QTL mit dem QTL-1 der ETH-DL3 × ETH-DH7 Population korrespondiert. Das
Vorhandensein dieses QTLs in verschiedenen Kartierungspopulationen unterstreicht die
Wichtigkeit dieser genomischen Region für die Entwicklung eines funktionsfähigen
photosynthetischen Apparates unter suboptimaler Temperatur.
Potentielle Kandidatengene wurden in der QTL-Region, welche 232 Expressed Sequence
Tags (ESTs) enthält, in silco identifiziert. Eine Homologiesuche für EST-Sequenzen in einer
öffentlichen cDNA-Bibliothek von kühlegestressten Mais ergab 33 putative Kandidatengene.
Unter diesen befanden sich drei Gene, welche direkt in der Photosynthese involviert sind.
Insbesondere cab-m7, welches für ein Lichtsammler-Chlorophyll a/b-Protein II kodiert, und
das Gen der DegP1 Protease, welche in der Wiederherstellung des Photosystems II involviert
ist, könnten gut den Phänotypen des untersuchten QTLs erklären. Dennoch muss berück-
sichtigt werden, dass eine bessere Kartierung und funktionelle genetische Beschreibung nötig
sind, um abzuklären, ob diese Gene dem QTL für Kühletoleranz der Photosynthese auf dem
langen Arm von Chromosom 6 zugrunde liegen.

X
List of abbreviations
Add Additive effect
ANOVA Analysis of variance
bp Base pairs
CER CO2 exchange rate
CIM Composite Interval Mapping
cM Centimorgan
DNA Deoxyribonucleic acid
dNTPs Deoxynucledotide 5’-triphosphate
Dom Dominant effect
EST Expressed sequence tags
Fo Minimal fluorescence in dark-adapted leaves
Fo' Minimal fluorescence in light-adapted leaves
Fm Maximal fluorescence in dark-adapted leaves
Fm' Maximal fluorescence in light-adapted leaves
Fv Variable fluorescence in dark-adapted leaves
F ' Actual fluorescence intensity at any given time
Fv/Fm Maximum quantum efficiency of PS II primary photochemistry
Fv'/Fm' Quantum efficiency of open PS II reaction centers
LOD Base 10 logarithm of the likelihood ration (LR)
MAS Marker assisted selection
NIL Near isogenic line
PCR Polymerase chain reaction
PS II Photosystem II
qP Photochemical quenching factor
QTL Quantitative Trait Locus
R2 Phenotypic variance explained by quantitative trait locus
SPAD Soil plant analyses development
SSR Simple sequence repeat
ΦNO Quantum efficiency for dissipation not by down regulation
ΦNPQ Quantum efficiency for dissipation by down regulation
ΦPSII Operating quantum efficiency of PS II

Chapter 1
1
1 General Introduction
Plant abiotic stress factors, such as cold, drought, light or salt, constitute major constraints to
agricultural production. Crop production is never free of such abiotic stress factors;
consequently, they can affect crop production in every season and in every crop worldwide.
Plants have evolved multiple, interconnected strategies that enable them to survive under
abiotic stress. However, these strategies are not well developed in most agricultural crops.
Across a range of cropping systems around the world, abiotic stress is estimated to reduce
yields to less than half of that possible under ideal growing conditions (Tang and Boyer,
2002). Of all the abiotic stresses that curtail crop productivity, temperature extremes are the
most important players besides water shortage, governing natural distribution of species and
the yield potential of crops. Plants can be divided into species, which are chilling sensitive,
chilling tolerant but freezing sensitive, and freezing tolerant. Chilling tolerance at the
vegetative level is defined as the ability to withstand the development of chilling injury and to
resume normal growth upon return to a non-chilling temperature (Lyons, 1973). Chilling-
sensitive species exhibit a marked physiological dysfunction when exposed to chilling
temperatures (between 0 and 15 °C) beyond a certain period of time and, if maintained at
these temperatures, develop a variety of external symptoms (chilling injury) and eventually
die (Lyons, 1973). Like other cereal crops of tropical and subtropical origin (e.g. rice,
sorghum), maize is a typical chilling-sensitive species that upon exposure to chilling
temperatures, inhibits seedling establishment and photosynthetic activity (Leipner et al., 1999;
Stirling et al., 1991) with the result that productivity and yield stability are reduced (Carr and
Hough, 1978; Stamp, 1986).
Years of selective breeding have led to the emergence of maize genotypes exhibiting varying
degrees of adaptation to temperate climate due to late planting and breeding for early-
maturing hybrids. Agronomic progress was achieved mainly an avoidance mechanism i.e., the
shortening the plant’s life cycle. These strategies minimize the risk of losses in the field
(Stamp, 1986). However, until now, little true chilling tolerance has been obtained, even
though the genetic diversity in the level of adaptation to suboptimal temperature is high
among the various genotypes (Greaves, 1996). An improvement in chilling tolerance would
be favorable for earlier spring planting and would consequently, lead to higher yielding maize
hybrids (Lee et al., 2002). Furthermore, earlier sowing may be an important avoidance

General Introduction
2
strategy for drought-affected flowering when the usual flowering time in midsummer
coincides with dry soil conditions.
In Switzerland, maize is sown during spring, where the requirement of high temperature
maize is not always met during the early growth stages of the crop. The optimum temperature
range for germination, seedling growth and dry matter accumulation of maize is between 25
and 35 °C (Miedema, 1982). Suboptimal temperature coupled with short spells of chilling
events during early growth stages results in decreased productivity of the crop (Carr and
Hough, 1978), poor yield stability (Stamp, 1986) and various effects on a number of
physiological processes. Under field conditions, both germination and development of the
first few leaves often take place at suboptimal temperature. Despite an increase in mean
temperature, later growth also seems to be affected by chilling, probably due to the inability
of the plant to respond quickly to the favorable changes in the environment. The slow
recovery of leaves after low temperature stress might be due to the inability of chloroplasts to
attain high photosynthetic efficiency after cessation of the unfavorable conditions (Nie et al.,
1995).
Amongst the various effects of low temperature on the physiology of maize, the considerable
susceptibility of the photosynthetic apparatus to low temperature is considered to be of
particularly important (Baker et al., 1994). Photosynthetic activity of maize leaves decreases
substantially when plants are subjected to cold stress (Ying et al., 2000). The mechanism
responsible for the reduction of leaf photosynthesis at low temperatures is unclear, as stomatal
closure (Massacci et al., 1995), reduced chlorophyll content (Leipner et al., 1999), lower
ribulose-1,5-bisphosphate carboxylase/oxygenase (Rubisco) activity (Stamp, 1981) and
reduced quantum efficiency of photosystem II (ΦPSII) (Fracheboud et al., 1999; Leipner et al.,
1999) have all been proposed as possible causes. With regard to photosynthetic apparatus,
several impact options have been discussed. First, the photosynthetic apparatus is known to be
highly sensitive to low temperature-induced photoinhibition (Long et al., 1983); second,
leaves that develop at a temperature of 15 °C or below are characterized by a very low
efficiency and capacity of photosynthesis, altered composition of leaf pigment (Haldimann et
al., 1995) and impaired chloroplast development (Robertson et al., 1993). Above all,
photosynthesis is one of most dominant and important biochemical process in higher plants,
and a loss of its activity damages the physiological activity of the whole plant. Improved
chilling tolerance of the photosynthetic apparatus of maize may, therefore, contribute
substantially to the improvement of the performance of the crop in temperate regions by
increasing early vigor and extending the culture period.

Chapter 1
3
Although impressive progress in the understanding of chilling stress has been achieved at the
biochemical and physiological levels, the potential for genetic improvement of maize
production under chilling conditions is still not been fulfilled. Genetic improvement under
chilling stress should be accelerated by implementing new molecular tools and by increasing
amount of genetic information generated through molecular and biochemical approaches. The
genetic basis of differences in physiological processes i.e., in quantitative traits is usually
complex, because several genes are involved and the expression of these traits depends
strongly on environmental factors. Analysis of Quantitative trait loci (QTL) enables to unravel
the genetics of such quantitative traits. The analysis of the genes controlling a variation in trait
may enable the molecular identification of these genes and, subsequently, the processes that
the control.
Molecular markers and QTL analysis based on carefully managed replicated tests have the
potential to alleviate the problems associated with chilling stress. The identified molecular
markers linked to QTLs for chilling tolerance could be used to increase the efficiency of
breeding and the selection of maize germplasm with enhanced chilling tolerance. Such an
approach provides a more systematic way of identifying specific traits that contribute to
chilling tolerance. Moreover, further analyses of these traits could lead to a better
understanding of the biological basis of chilling tolerance. The development of molecular
genetic markers and their use in QTL analyses is an increasingly a common approach to the
evaluation of the inheritance and the feasibility of accelerating selection for complex
quantitative traits in crop plants. Molecular markers have been used successfully to identify
and characterize QTLs associated with several traits in maize including plant height and
maturity (Beavis et al., 1991), characters concerned with plant domestication (Doebley et al.,
1990; Doebley and Stec, 1991; Doebley and Stec, 1993), resistance to disease and insect
(Dingersdissen et al., 1996; Freymark et al., 1993; Pe et al., 1993; Perez-Brito et al., 2001),
drought tolerance (Ribaut et al., 1996) and grain yield and component characters of grain
yield (Mohammadi et al., 2003; Tuberosa et al., 2002b).
Based on quantitative trait loci approach, several QTLs for chilling tolerance of
photosynthesis have already been mapped (Fracheboud et al., 2002; Fracheboud et al., 2004;
Jompuk et al., 2005; Pimentel et al., 2005). It was shown that the major QTLs involved in the
chilling tolerance of seedlings are found in the field as well as under controlled chilling
conditions (Jompuk et al., 2005). This cleared the path towards pinpointing chromosomal
regions involved in chilling tolerance. Although these authors identified regions of the maize
genome that condition the expression of chilling tolerance, however, little information has

General Introduction
4
been provided about the expression of individual QTLs. Furthermore, quantitative traits were
usually observed at a fixed time point or stage of trait development (e.g. at fully developed
third leaf). Such QTL mapping strategy can only provide an estimate of the effects of
individual QTLs accumulated from the beginning of ontogenesis to the time of the
observations. According to developmental genetics, the development of a trait results from the
differential activity of many related QTLs. This suggests that different QTLs show different
expression dynamics during trait development, even though the final effects may be same.
Lastly, a lack precision mapping of QTLs was intrinsic for these studies.
Near-isogenic lines (NILs), differing with regard to QTLs for chilling tolerance, could
provide a valuable material for a more detailed study of the genetic basis of quantitative
tolerance. Such NILs not only provide a better estimate of the effect of single QTL alleles, but
also provide better insight into QTL × environment interactions. Furthermore, QTL-NILs may
provide a starting point for unraveling the genes underlying these loci and may be useful for
positional cloning. Conventionally such QTL-NILs were developed by backcross breeding.
Recurrent backcrossing is a traditional breeding method commonly employed to transfer
alleles at one or more loci from a donor to an elite variety (Bravo et al., 2003; Reyes-Valdés,
2000). Traditional backcrossing programs are based on the assumption that the proportion of
the recurrent parent genome is recovered at a rate of 1 - (½)t+1 for each t generation of
backcrossing (Reddy et al., 2001). Thus, the expected recovery of the recurrent parent genome
after six generations of backcrossing would be 99.2%, i.e., near-isogenic. However, any
specific backcross progeny will deviate from this due to chance (stochastic or non-random
positions of chiasmata) and/or linkage between a target gene from the donor parent and
nearby genes (Ribaut and Hoisington, 1998). For example, Young and Tanksley (1997) found
an introgressed segment as large as 4 centimorgan (cM) in tomato cultivars developed after 20
backcrosses, and one cultivar developed after 11 backcrosses still contained the entire
chromosome arm carrying the gene from the donor parent. Therefore, the two main
limitations of the backcrossing approach are: i). the number of generations, and, thus, the
time, necessary to achieve the introgression objective and, ii). the simultaneous transfer of
other genes flanking the target gene from the donor parent (linkage drag).
Among the genes, which were carried through linkage drag, some coded for agronomically
undesirable traits, such as low yield or low temperature sensitivity. Depending on the linkage
distances, the size of the flanking regions can be decreased by additional backcrossing (Färber
et al., 1997), although breeders do not have direct control over the size of the region or the
recombination breakpoints. During the past two decades, the ability to transfer target genomic

Chapter 1
5
regions increased by means of molecular markers, which were obtained by extensive genetic
mapping experiments. Molecular markers are a tool that can be used as chromosome
landmarks to facilitate the introgression of chromosome segments (genes) associated with
economically important traits by marker assisted backcrossing (MAB), also referred to as
marker assisted selection (MAS), marker assisted introgression or molecular breeding. There
is now a large amount of research that aims to identify genomic regions of interest, from
which MAB experiments are the next attractive step. Molecular markers do not require
genetic engineering and cultivars developed by MAB are not transgenic and, therefore, are
more easily accepted by the public than transgenic crops.
1.1 Aims of the study Among the several QTLs detected for chilling tolerance of photosynthesis in the ETH-DL3 ×
ETH-DH7 population, the QTL with the largest genetic influence on chilling tolerance of
photosynthesis was identified on the long arm of chromosome 6 at bin 6.07 (Fracheboud et
al., 2004; Jompuk et al., 2005). This QTL alone explained 37.4 percent of the phenotypic
variance of photoinhibition (Fv/Fm) at suboptimal temperature and was significantly involved
in the expression of other traits, such as minimal fluorescence of dark-adapted leaves (Fo),
quantum yield of electron transport at PS II (ΦPSII), trapping efficiency of PS II (Fv'/Fm'),
including the rate of carbon fixation (CER) and shoot dry matter accumulation (Fracheboud et
al., 2004). This QTL contributes substantially to the maintenance of photosynthesis across
cold environments, a process long considered to be essential for chilling tolerance, making it
of particular interest for improving the chilling tolerance of elite chilling sensitive germplasm.
However, before such a QTL can be used in applied breeding its precise position on the
genome must be determined and it is necessary to discover its expression in different
environments and plant tissues. For these reasons, it would be helpful to understand the
underlying molecular mechanisms. Therefore, in the present study, an attempt was made to
elucidate the molecular and physiological basis of the QTL for chilling tolerance of
photosynthesis located in the telomeric region of the long arm of chromosome 6. For such a
study, near isogenic lines have to be developed that differ only in the presence of the chilling
tolerance allele at the target QTL. At the same time, QTL effects must be verified in different
genetic backgrounds before the deployment of such a QTL in an applied breeding program.
General Introduction
6
Keeping the above mentioned issues in mind, the present study was carried out in order
• to refine the position of the QTL for chilling tolerance of photosynthesis on chromosome
6 (bin 6.07) on the genetic linkage map of the ETH-DL3 × ETH-DH7 population,
• to investigate stability of this QTL during introgression of the chilling tolerant allele into a
chilling sensitive background,
• to study its effects during leaf development at different temperatures,
• to investigate the physiological mechanism of this chilling tolerance allele in near isogenic
lines,
• to verify the QTL effects in an alternate genetic background
• and to identify putative candidate genes underlying this QTL.
Chapter 2
7
2 Re-analysis of a major QTL for chilling tolerance of photosynthesis based on an improved map of the ETH-DL3 × ETH-DH7 population
2.1 Introduction In a previous analysis, a QTL with large effects on the chilling tolerance of photosynthesis
was detected in a Swiss dent mapping population originating from the cross ETH-DL3 ×
ETH-DH7 (Fracheboud et al., 2004). It explains a large amount of phenotypic variation for
photosynthesis and chlorophyll fluorescence parameters and was detected on chromosome 6
at bin 6.07. However, due to the small number of markers used in the linkage analysis, the
position of the QTL is still vague within a large marker interval of approximately 54 cM. This
region, which is flanked by the SSR markers umc1859 and umc1653, is too large to be studied
effectively and must be refined to facilitate positional cloning of the underlying genes.
Fine mapping of QTLs can be achieved by increasing the marker density within the
chromosomal region of interest, by increasing the number of individuals for which phenotypic
information can be obtained, or by increasing the accuracy of assigning QTL genotypes
(Nezer et al., 2003). For this QTL, the most straightforward approach is to increase the
number of informative markers within the QTL interval, as this eliminates the need to produce
new F2:3 individuals or to score new phenotypes on the previously generated F2:3 population.
Recent advances in maize genome resources, including the development of physical maps and
the genome sequencing project, provide reagents for the targeted isolation of new markers.
This chapter describes the use of these resources to increase the marker density around bin
6.07, and, thereby, the map position of the major QTL for chilling tolerance of photosynthesis
was refined.
2.2 Materials and Methods 2.2.1 Resource population and phenotypic data The ETH-DL3 × ETH-DH7 population derived from the chilling sensitive inbred line ETH
DL3 and the chilling tolerant inbred line ETH DH7 was used in the present study (for details,
see Fracheboud et al., 2004). The phenotypic data for photosynthesis and the chlorophyll
fluorescence parameters of the ETH-DL3 × ETH-DH7 population in the F2:3 generation were
obtained from the Maize Genetics and Genomics Database (http://www.maizegdb.org/qtl-
data.php). The methods of measurements have been described by Fracheboud et al. (2004). In

Re-analysis of major chilling tolerance QTL
8
brief, the parameters were measured on the fully developed third leaves which developed
either at optimal (25/22 °C) or at suboptimal temperature (15/13 °C). The operating quantum
efficiency of photosystem II (ΦPSII), the efficiency of open PS II reaction centers (Fv'/Fm') and
the carbon exchange rate (CER) were measured using LI-6400 instrument equipped with an
LI-6400-40 pulse-amplitude modulation fluorometer (LI-COR, Lincoln, NE, USA). The
maximum quantum efficiency of PS II (Fv/Fm) was determined with a PAM-2000 fluorometer
(Walz, Effeltrich, Germany) after 30-60 min dark adaptation. Leaf greenness was measured
using a Minolta SPAD-502 chlorophyll meter (Minolta Corporation, Ramsey, Japan).
2.2.2 Selection and development of molecular markers Seventeen simple sequence repeat (SSR) and 18 indel polymorphism (IDP) markers, which
are located in the proximity of bin 6.07 close to the SSR marker bnlg1740, were selected
based on information provided by the IBM 2 neighbors map at the Maize Genetics and
Genomics Database (http://www.maizegdb.org). Additional 21 SSR markers were developed
from BAC sequences, which were located in the QTL confidence interval. The simple
sequence repeat identification tool (SSRIT) available at http://www.gramene.org was
employed to identify SSRs in the BAC sequences. The SSRIT program was run online and
the parameters were set for the detection of di-, tri-, tetra- and penta-nucleotide motifs with a
minimum of 10, 7, 5 and 4 repeats, respectively. The repeat region and surrounding flanking
sequence (ca. 200 bp on either side) were extracted and used for PCR primer design by the
program Primer3 available at http://frodo.wi.mit.edu/cgi-bin/primer3/primer3_www.cgi
(Rozen and Skaletsky, 2000). The parameters were set as follows: primer product size range,
200-300 bp; primer optimum length, 20 bp; primer length, 18 bp; primer maximum length, 25
bp; primer optimum temperature, 55 °C; primer minimum temperature, 50 °C; primer
maximum temperature, 60 °C; primer maximum differential temperature, 3 °C; primer
minimum GC content, 50 percent; primer maximum GC content, 55 percent.
2.2.3 DNA markers assay The DNA of 254 F2 plants of the ETH-DL3 × ETH-DH7 population (Fracheboud et al., 2004)
was used for marker analysis. The PCR was carried out using 50 ng DNA as template, 5
pmoles of each primer, 0.2 mM dNTPs, 1 × PCR buffer and 1 U Taq DNA polymerase (New
England Biolab) in a total volume of 15 µl. Template DNA was initially denatured at 94 °C
for 5 min followed by 35 cycles of PCR amplification under the following cycling conditions:
30 sec denaturation at 94 °C, 30 sec primer annealing at 55 °C, 1 min extension at 72 °C. A

Chapter 2
9
final extension of 72 °C for 7 min was conducted. The PCR amplification was carried out in
an Eppendorf DNA Thermal cycler (Eppendorf, Hamburg, Germany) and the amplification
products were size fractioned in a 4 % high resolution agarose (Eurobio) as described by
Sambrook and Russell (2001). After electrophoresis, the gels were stained in 0.5 μg ml-1
ethidium bromide and visualized under ultraviolet light.
2.2.4 QTL analysis The genetic map was constructed using mapmaker 3.0 (Lander et al., 1987) with the Haldane
mapping function. QTL analysis based on this map was carried out using the QTL
Cartographer v.1.17b (Basten et al., 1994; Basten et al., 2003). The method of composite
interval mapping (CIM), model 6 of Zmapqtl program module, was used for mapping QTLs
and estimating their effects (Jansen and Stam, 1994; Zeng, 1994). Cofactors were chosen
according to the forward-backward method of stepwise regression at p(Fin) = p(Fout) < 0.01.
The chromosomal region was scanned at 2 cM; the window size was set at 30 cM.
2.3 Results and Discussion By taking advantage of recent developments in maize genome resources, including the high
resolution IBM2 2008 neighbors map and BAC fingerprint maps, an attempt was made to
saturate the confidence interval of the QTL for chilling tolerance of photosynthesis on the
long arm of chromosome 6 with additional SSR markers. Over 56 molecular markers located
between bin 6.06 and bin 6.08 were screened for parental polymorphism between ETH-DL3
and ETH-DH7. Of these markers, only two markers showed parental polymorphism. These
two polymorphic SSR markers, namely bnlg1136 and umc2234, were used to survey the
genomic DNA of the 254 F2 plants and a new genetic linkage map was constructed (Figure
2.1). The relatively low rate of polymorphism is attributed to the similar origin of the parental
lines; both parents were derived from the same Swiss Dent breeding population (Fracheboud
et al., 1999). Similarly, Fracheboud et al. (2004) found only 118 polymorphic markers from a
total of 1200 markers screened for parental polymorphism between ETH-DL3 and ETH-DH7
at the level of the whole genome.
Furthermore, a primer pair was designed (agpslzm), which amplifies the gene of the ADP-
glucose pyrophosphorylase that was previously proposed as a positional candidate gene of the
major QTL for chilling tolerance of photosynthesis on chromosome 6 (Fracheboud et al.,
2004; Jompuk et al., 2005). However, the linkage analysis in the F2 population revealed that

Re-analysis of major chilling tolerance QTL
10
agpslzm, which is specific for the gene of ADP-glucose pyrophosphorylase in the leaf, is not
located on chromosome 6 but on chromosome 1 at 205.6 cM between mmc0041 (189.3 cM)
and bnlg1502 (249.2 cM). A re-analysis of the phenotypic data from Fracheboud et al. (2004)
revealed that agpslzm is closely located to QTLs for SPAD (205.3 cM), Fv/Fm (213.6 cM),
CER (221.6 cM) and ΦPSII (227.6 cM) in leaves that developed at suboptimal temperature.
Due to the closeness of agpslzm to the mentioned QTLs for photosynthesis related traits,
agpslzm can be considered as a potential positional candidate gene. However, it remains to be
open how ADP-glucose pyrophosphorylase, which plays a central role in the starch turn-over
within the chloroplast (Baroja-Fernández et al., 2001), affects the chlorophyll content under
chilling stress conditions.
In another analysis of the data of Fracheboud et al. (2004), two QTLs associated with
photosynthesis and chlorophyll fluorescence parameters were identified on the long arm of
chromosome 6 (Figure2.1, Table 2.1). The first QTL, which is located at 206 to 228 cM and is
flanked by the markers umc1859 and bnlg1740, was also detected in the original study
grown at 15 °C
LOD score
0 5 10 15
Fo
Fv/Fm
SPADΦPSII
Fv'/Fm'q
P
CER
grown at 25 °C
LOD score
0 5 10 15 20
Fo
Fv/Fm
SPADΦPSII
Fv'/Fm'q
P
CER
Chr 6
bnlg1043 0.0bnlg161 7.4
bnlg1867 46.3bnlg249 56.4
bnlg1188 59.2
umc1887 108.4bnlg1617 122.9bnlg1922 126.9
bnlg1732 175.8umc1859 186.2
bnlg1740 231.5bnlg1136 239.8
umc1653 255.4
umc2324 272.5
Figure 2.1: Linkage map and putative locations of QTLs on chromosome 6 for chlorophyll fluorescence parameters (Fo, Fv/Fm, ΦPSII, Fv'/Fm' and qP), leaf greenness (SPAD) and carbon exchange rate (CER) in seedlings of the ETH-DL3 × ETH-DH7 population in the F2:3generation grown at suboptimal (15 °C) and optimal temperature (25 °C). Phenotypic data were obtained from Fracheboud et al. (2004). The new markers are indicated by bold names and the threshold for the LOD score of 3.5 is shown.

Chapter 2
11
(Fracheboud et al., 2004). The second new QTL was detected at 244 to 254 cM in the region
where additional markers were mapped. This QTL is flanked by markers bnlg1136 and
umc1653. For clarity, the QTL at 206 to 228 cM will be designated QTL-1 and the QTL at
244 to 254 cM will be named as QTL-2. The possibility still remains that the newly identified
QTL is linked to the first QTL, given the shape of the test statistic curves (Figure 2.1).
However, the large distance between the two QTLs suggests that they are separate.
Furthermore, the two QTLs have distinct characteristics in respect to the analyzed traits. In
general, QTL-2 showed lower effects than QTL-1. However, while the additivity and the
phenotypic variance (R2) of Fv/Fm, Fo and Fv'/Fm' were only little lower for QTL-2 compared
to QTL-1, they were considerably lower for ΦPSII and CER. This was observed for seedlings
grown at 15 °C as well as for plants that grown at 25 °C.
Table 2.1: Main characteristics of significant QTLs on the long arm of chromosome 6 for photosynthetic traits in seedlings of the F2:3 population grown at suboptimal (15 °C) and optimal temperature (25 °C) recalculated from Fracheboud et al. (2004).
Trait cM Marker interval LOD score Add Dom R2 (%)
grown at 15 °C
Fv/Fm 224 umc1859-bnlg1740 18.51 0.032 0.017 39.0 246 bnlg1136-umc1653 16.07 0.025 0.020 29.4
Fo 222 umc1859-bnlg1740 17.37 -0.054 -0.026 35.5 248 bnlg1136-umc1653 15.82 -0.039 -0.039 27.7
ΦPSII 212 umc1859-bnlg1740 6.18 0.024 -0.013 24.8 254 bnlg1136-umc1653 6.54 0.012 0.014 10.6
Fv'/Fm' 228 umc1859-bnlg1740 4.94 0.019 0.005 8.4 254 bnlg1136-umc1653 5.97 0.015 0.019 9.6
CER 206 umc1859-bnlg1740 5.20 0.56 -0.21 15.1 255 bnlg1136-umc1653 2.81 0.11 0.42 4.4
grown at 25 °C
Fo 224 umc1859-bnlg1740 12.64 -0.004 -0.003 21.3 244 bnlg1136-umc1653 11.59 -0.003 -0.002 16.3
ΦPSII 214 umc1859-bnlg1740 6.05 0.013 0.008 21.8 250 bnlg1136-umc1653 4.99 0.009 0.003 9.6
Fv'/Fm' 216 umc1859-bnlg1740 10.01 0.013 0.012 37.1 250 bnlg1136-umc1653 8.67 0.010 0.005 18.2
cM = Position of the peak of the QTL in centimorgan; Add = additive effect of the ETH-DH7 allele; Dom = dominant effect of the ETH-DH7 allele; R2 = phenotypic variance as explained by QTL.

Re-analysis of major chilling tolerance QTL
12
In order to characterize these two QTLs in more detail and to unravel their function, further
experiments are necessary and should include newly developed plant material, which makes it
possible to focus better on this genomic region of chromosome 6.

Chapter 3
13
3 Marker assisted introgression of a major QTL for chilling tolerance of photosynthesis into the recurrent parental line
3.1 Introduction In maize, suboptimal temperature coupled with short spells of chilling events during early
growth stages result in decreased productivity (Carr and Hough, 1978) and poor yield stability
(Stamp, 1986) and affects several physiological processes. Among the various effects of low
temperature on the physiology of maize, high susceptibility of the photosynthetic apparatus to
low temperature is considered to be of particular importance (Baker et al., 1994). This is due
to the photosynthetic apparatus of maize is known to be highly sensitive to low temperature-
induced photoinhibition (Long et al., 1983) and, leaves that develop at a temperature of 15 °C
or below are characterized by a very low photosynthetic capacity, altered leaf pigment
composition (Haldimann et al., 1995) and impaired chloroplast development (Robertson et al.,
1993). Improved chilling tolerance of the photosynthetic apparatus of maize may, therefore,
contribute substantially to an overall improvement in early vigor in temperate regions.
In previous studies, an F2:3 population, derived from the cross between ETH-DH7 and ETH-
DL3 was genetically analyzed (Fracheboud et al., 2004; Jompuk et al., 2005). It was
demonstrated that chromosome 6 harbored a major QTL, which was involved not only in the
development of a functional photosynthetic apparatus but also in its protection against low
temperature stress. A QTL re-analysis employing an improved linkage map of chromosome 6
indicated that probably two separate QTLs are located in this chromosomal region (Chapter
2). In order to study the genetic and physiological mechanisms of this/these QTL(s) in more
detail, it is desirable to conduct a backcross breeding program to introgress this chromosomal
region in an isogenic background. Different approaches have been described. For QTLs with
large effects, the most common approach is to introgress individual QTL alleles into
homozygous genetic backgrounds through multiple generations of backcrossing (e.g. Kole et
al., 2001; Li et al., 2001; Lin et al., 2000; Monforte and Tanksley, 2000; Van Berloo et al.,
2001; Vladutu et al., 1999). This can lead to qualitative segregation of phenotypic effects,
which can be used for fine mapping and, consequently, to clone the QTL of interest (Yano,
2001). However, introgression of QTLs through conventional backcrossing is time consuming
and laborious. The use of molecular markers to construct molecular genetic linkage maps
(Phillips and Vasil, 1994) and to detect marker-trait associations (Kearsey and Farquhar,

Marker assisted introgression of major chilling tolerance QTL
14
1998) has been exploited extensively in recent years. The information provided by marker-
trait associations can be used as a tool for crop improvement thorough the use of marker
assisted selection (MAS) of favorable alleles. Valuable information can be provided by the
screening of backcross populations with molecular markers of known position on a genetic
map. Not only can the origin of the QTL allele be determined, but also the rest of the genome,
both linked and unlinked to the QTL, can be monitored. Hence, molecular markers assist
backcross breeding by reducing the number of generations required to introgress QTLs into a
near isogenic background, in particular, by deploying DNA markers for selection of target
QTLs and of the recurrent parent genome (RPG) selection during backcross breeding
(Fracheboud et al., 2002; Frisch and Melchinger, 2001). Thus, marker assisted selection of
whole genome in favor of the recurrent parent alleles will help to recover the recurrent
genotype at a much faster pace than can be achieved by conventional backcrossing (Bouchez
et al., 2002; Hospital et al., 1992; Tanksley and Nelson, 1996).
The aim of this study was to elucidate the physiological and genetic basis of the major QTL
region for chilling tolerance of photosynthesis on the long arm of chromosome 6. The study
was carried out on a series of backcross populations derived from the cross between the
chilling sensitive parent, ETH-DL3, and the chilling tolerant parent, ETH-DH7. Important
goals were: (1) to assess the stability of the QTL expression during different generations of
marker assisted backcross breeding, (2) to assess the QTL dynamics in different leaves and
under different temperature regimes and (3) to find further evidence of the presence of two
separate QTLs in this genomic region.
3.2 Materials and methods 3.2.1 Plant material The maize genotypes ETH-DH7 and ETH-DL3 were used as the donor and the recurrent
parent, respectively. ETH-DH7 is a chilling tolerant inbred line, which maintains higher
photosynthetic activity at suboptimal growth temperature, whereas the inbred line ETH-DL3
shows poor photosynthetic activity when grown under suboptimal temperature (Fracheboud et
al., 2004). The two parental lines were originally obtained by divergent selection from a Swiss
dent maize breeding population using the chlorophyll fluorescence as a selection tool
(Fracheboud et al., 1999). The F1 plants were crossed with ETH-DL3 to produce BC1F1
plants. To select chilling-tolerant BC1F1 plants, seedlings were grown at suboptimal
temperature and the operating quantum efficiency of photosystem II (ΦPSII) was measured on

Chapter 3
15
the fully developed third leaf at 6 °C under a PPFD of 50 µmol m-2 s-1. The BC1F1 plants,
which had a high average of ΦPSII were selected for further crossing. Starting from the BC2F1
generation, marker assisted selection was carried out to develop the BC3F2 population.
3.2.2 Growth conditions The experiments were carried out in growth chambers (PGW36, Conviron, Winnipeg,
Canada). Seeds were allowed to germinate in 0.75 l pots containing a commercial mixture of
soil, peat and compost (Topf und Pikiererde 140, Ricoter, Aarberg, Switzerland) and grew
until 1-leaf stage at 25/22 °C (day/night) temperature, 12 h photoperiod with a light intensity
of 400 µmol m-2 s-1 and a relative humidity of 60/70 % (day/night). About six days after
seeding, when the 1-leaf was fully emerged, the seedlings were transferred to suboptimal
growth temperature (15/13 °C, day/night) for 15 days until the third leaf was fully developed.
The other conditions were the same. The plants were watered and fertilized with half-strength
Wuxal nutrient solution (0.2 %) as required.
Furthermore, a time-course experiment was conducted using seedlings of the BC3F2
generation. After growth at suboptimal temperature (15/13 °C), the temperature was
decreased to 10/10 °C (day/night) during the dark period for two days followed by recovery
for two days at 25/23 °C (day/night); recovery started at the beginning of the light period. The
light intensity was 400 µmol m-2 s-1 with a photoperiod of 12 hours and a relative humidity of
60/70 % (day/night).
3.2.3 Measurement of physiological traits Measurements of photosynthesis and chlorophyll fluorescence parameters were carried out
with an infrared gas analyzer equipped with a pulse-amplitude modulation fluorometer (LI-
6400, LI-COR, Lincoln, NE, USA). The conditions in the measuring chamber of the LI-6400
were the same as the growth conditions. The operating quantum yield of photosystem II
(ΦPSII), the efficiency of open PS II reaction centers (Fv'/Fm'), the photochemical quenching
factor (qP) and the carbon exchange rate (CER) were measured simultaneously on the middle
part of the third leaf. After determining the carbon exchange rate and the steady state
fluorescence (F '), a one second saturation flash (> 8000 µmol m-2 s1) was applied to
determine the maximum fluorescence in the light (Fm'). The actinic light was then turned off,
and the leaf was subjected to far red light for 3 seconds to determine the ground fluorescence
of light adapted leaves (Fo').

Marker assisted introgression of major chilling tolerance QTL
16
The maximum quantum efficiency of PS II primary photochemistry (Fv/Fm) was determined
with a PAM-2000 fluorometer (Walz, Effeltrich, Germany) after 30-60 minutes of dark
adaptation by applying a one-second saturation flash (> 8000 µmol m-2 s-1).
To measure leaf greenness, three measurements in the middle section of the third leaf were
made and averaged for each plant using a SPAD-502 chlorophyll meter (Minolta Corporation,
Ramsey, Japan).
To analyze the time-course of QTLs in the BC3F2 population, Fv/Fm and ΦPSII were
determined with the PAM-2000 fluorometer. The ΦPSII measurements were conducted under
growth conditions and Fv/Fm was determined after at least 30 minutes of dark adaptation.
3.2.4 DNA isolation and SSR marker assay The DNA was isolated from 3 cm leaf segments according to Zheng et al. (1995). The leaves
of the maize seedlings were harvested and homogenized immediately in a chilled mortar in
400 µl extraction buffer (50 mM TRIS-HCl, pH 8.0; 25 mM EDTA; 300 mM NaCl; 1 %
[w/v] SDS). 400 µl homogenate were extracted with 400 µl phenol:chloroform (24:1). After
centrifugation (10000 rpm for 10 minutes), the aqueous supernatant was transferred to another
1.5 ml tube, and DNA was precipitated with 97 % ethanol. After drying in air, the DNA was
re-suspended in 200 µl water.
Aliquots of 2 µl DNA solution (50 ng µl-1) were taken for PCR along with 5 pmoles of each
primer, 0.2 mM dNTPs, 1 × PCR buffer and 1 U Taq DNA polymerase (New England
Biolab) in a total volume of 15 µl. Template DNA was initially denatured at 94 °C for 5 min
followed by 35 cycles of PCR amplification under the following conditions: 30 second
denaturation at 94 °C, 30 second primer annealing at 55 °C, 1 minute extension at 72 °C. A
final extension of 72 °C for 7 minutes was conducted. The PCR amplification was carried out
in an Eppendorf DNA Thermal cycler (Eppendorf, Hamburg, Germany) and the amplification
products were size fractioned in a 4 % high resolution agarose (Eurobio) as described in
Sambrook and Russell (2001). After electrophoresis, the gels were stained in 0.5 μg ml-1
ethidium bromide and visualized under ultraviolet light.
To genotype the BC3F2 plants, genomic DNA was isolated from 25 day old plants according
to the method of Dellaporta et al. (1983). The PCR was carried out using 50 ng DNA as
template for amplification; the other conditions were the same as above.

Chapter 3
17
3.2.5 Marker assisted and phenotype based backcrossing The BC3F2 generation was generated by several steps of backcrossing with the recurrent
parent (ETH-DL3) and selection of plants based on analysis of the phenotype and by marker
assisted selection. For phenotypic selection, seedlings that had developed at suboptimal
temperature were screened for ΦPSII and Fv/Fm as described above. The schematic illustration
of the marker assisted backcross breeding is shown in Figure 3.1.
3.2.5.1 Foreground selection
Three SSR markers namely bnlg1740 linked to the studied QTL (as per LOD score) and
umc1859 and umc1653 located on right- and left-hand side of the confidence interval, were
used to select the favorable ETH-DH7 allele at the target QTL in the BC2F1 generation. In the
BC3F1 generation, bnlg1740 and umc1653 were used to select for the favorable alleles of
ETH-DH7 at the target QTL and to reduce linkage drag around the introgressed region;
recombination was allowed on the right hand side of the confidence interval by selecting
plants having the ETH-DL3 allele for the SSR marker umc1859. In order to reduce the
amount of plant material, a sequential genotyping approach was followed in both generations.
Initially, the plants were genotyped with SSR marker bnlg1740. Recombinant plants were
selected and genotyped further with umc1859 and umc1653.
ETH-DL3 × ETH-DH7
ETH-DL3 × F1
ETH-DL3 × BC1F1
BC3F1
BC3F2
The two inbred lines were crossed to generate the F1 generation.
One F1 plant was backcrossed to the recurrent parent (ETH-DL3) to generate the BC1F1generation.
The BC1F1 plants were screened for ΦPSII and Fv/Fm. Four BC1F1 plants having high ΦPSIIand Fv/Fmwere selected and backcrossed to the recurrent parent.
Foreground selection was conducted with markers linked to the target QTL as well as by phenotyping for ΦPSII and Fv/Fm.Background selection was conducted with markers linked to non-target QTLs.A single plant was selected based on the marker profile and the highest level of ΦPSII and Fv/Fm and backcrossed to the recurrent parent.
Foreground selection was conducted with markers linked to the target QTL as well as by phenotyping for ΦPSII and Fv/Fm.Background selection was conducted with markers linked to non-target QTLs and with markers located in the proximal and telomeric regions of the chromosomes.A single plant was selected based on the marker profile and the highest level of ΦPSII and Fv/Fm and selfed.
ETH-DL3 × BC2F1
Figure 3.1: Schematic illustration of the marker assisted backcross breeding.

Marker assisted introgression of major chilling tolerance QTL
18
3.2.5.2 Background selection
Based on the results obtained by Fracheboud et al. (2004), to cull out non-target QTLs, 9 SSR
markers linked to the respective non-target QTLs were chosen: bnlg1564 (QTL for leaf
greenness at chromosome 1), bnlg1502 (QTL for ΦPSII on chromosome 1), dupssr21,
bnlg2248 and bnlg1148 (QTLs for CER, leaf greenness and Fv'/Fm' on chromosome 2),
bnlg1447 and bnlg1019 (QTLs for Fv'/Fm' and CER on chromosome 3), phi072 (QTL for
Fv'/Fm' on chromosome 4) and bnlg1031 (QTL for Fo and Fm on chromosome 8). For
background selection in the BC3F1 generation, 35 SSR markers were chosen which were
located in the proximal and in the distal regions of the maize chromosomes. To produce the
BC3F2 population, a single BC3F1 plant was selected, which recovered 96 percent of the
parental genome and which had the highest level of chilling-tolerance of photosynthesis as
assessed by chlorophyll fluorescence analysis.
3.2.6 Statistical analysis and QTL mapping Pearson’s correlation coefficients between traits were computed according to the CORR
procedure in SAS (v. 9.0, SAS Institute Inc., USA).
Single factor ANOVA was employed to determine the association between marker genotypic
class means and the phenotype to assess the stability of the QTL during backcrossing.
In the BC3F2 population, the genetic map was constructed using mapmaker 3.0 (Lander et al.,
1987) with the Haldane mapping function based on the genotypic data of 176 BC3F2 plants.
The QTL analyses were carried out using QTL Cartographer v.1.17b (Basten et al., 1994;
Basten et al., 2003). The method of composite interval mapping (CIM), model 6 of the
Zmapqtl program module, was chosen for mapping QTLs and estimating their effects (Jansen
and Stam, 1994; Zeng, 1994). Cofactors were chosen according to the forward-backward
method of stepwise regression at p(Fin) = p(Fout) < 0.01. The chromosomal region was
scanned at 2 cM; the window size was set at 30 cM (see also Chapter 2).
3.3 Results 3.3.1 Phenotypic analysis of chilling tolerance The superior chilling tolerance of ETH-DH7 over ETH-DL3 in seedlings grown at suboptimal
temperature was obvious (Table 3.1). Compared to ETH-DL3, ETH-DH7 was characterized
by a higher maximum quantum efficiency of PS II primary photochemistry (Fv/Fm), a lower
minimal fluorescence in dark adapted leaves (Fo), a higher operating quantum efficiency of
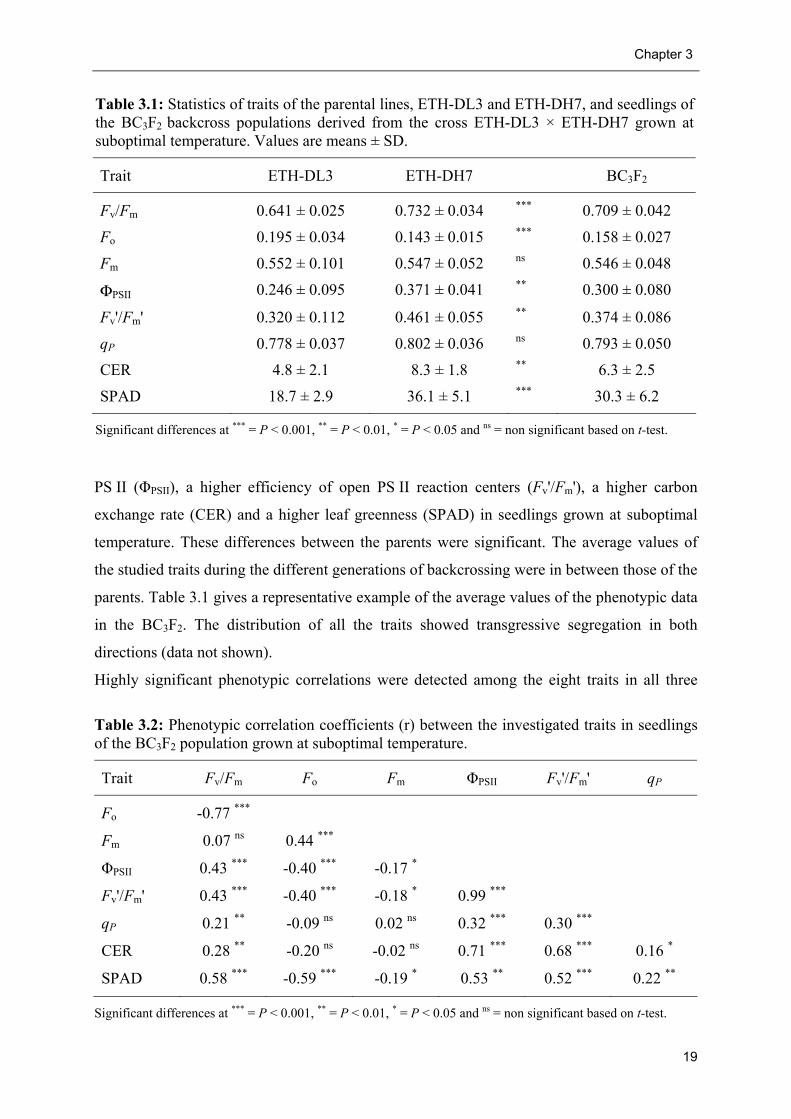
Chapter 3
19
PS II (ΦPSII), a higher efficiency of open PS II reaction centers (Fv'/Fm'), a higher carbon
exchange rate (CER) and a higher leaf greenness (SPAD) in seedlings grown at suboptimal
temperature. These differences between the parents were significant. The average values of
the studied traits during the different generations of backcrossing were in between those of the
parents. Table 3.1 gives a representative example of the average values of the phenotypic data
in the BC3F2. The distribution of all the traits showed transgressive segregation in both
directions (data not shown).
Highly significant phenotypic correlations were detected among the eight traits in all three
Table 3.1: Statistics of traits of the parental lines, ETH-DL3 and ETH-DH7, and seedlings of the BC3F2 backcross populations derived from the cross ETH-DL3 × ETH-DH7 grown at suboptimal temperature. Values are means ± SD.
Trait ETH-DL3 ETH-DH7 BC3F2
Fv/Fm 0.641 ± 0.025 0.732 ± 0.034 *** 0.709 ± 0.042
Fo 0.195 ± 0.034 0.143 ± 0.015 *** 0.158 ± 0.027
Fm 0.552 ± 0.101 0.547 ± 0.052 ns 0.546 ± 0.048
ΦPSII 0.246 ± 0.095 0.371 ± 0.041 ** 0.300 ± 0.080
Fv'/Fm' 0.320 ± 0.112 0.461 ± 0.055 ** 0.374 ± 0.086
qP 0.778 ± 0.037 0.802 ± 0.036 ns 0.793 ± 0.050
CER 4.8 ± 2.1 8.3 ± 1.8 ** 6.3 ± 2.5
SPAD 18.7 ± 2.9 36.1 ± 5.1 *** 30.3 ± 6.2
Significant differences at *** = P < 0.001, ** = P < 0.01, * = P < 0.05 and ns = non significant based on t-test.
Table 3.2: Phenotypic correlation coefficients (r) between the investigated traits in seedlings of the BC3F2 population grown at suboptimal temperature.
Trait Fv/Fm Fo Fm ΦPSII Fv'/Fm' qP
Fo -0.77 ***
Fm 0.07 ns 0.44 ***
ΦPSII 0.43 *** -0.40 *** -0.17 *
Fv'/Fm' 0.43 *** -0.40 *** -0.18 * 0.99 ***
qP 0.21 ** -0.09 ns 0.02 ns 0.32 *** 0.30 ***
CER 0.28 ** -0.20 ns -0.02 ns 0.71 *** 0.68 *** 0.16 *
SPAD 0.58 *** -0.59 *** -0.19 * 0.53 ** 0.52 *** 0.22 **
Significant differences at *** = P < 0.001, ** = P < 0.01, * = P < 0.05 and ns = non significant based on t-test.

Marker assisted introgression of major chilling tolerance QTL
20
backcross populations. In Table 3.2, the correlation coefficient values for each pair-wise
combination of traits in the BC3F2 population are shown. Correlation coefficients ranged
from -0.02 between Fm and CER to 0.99 between ΦPSII and Fv'/Fm'. Positive correlation
coefficients were observed between all the traits except for Fo and Fm which were negatively
correlated with all other traits.
3.3.2 QTL consistency over generations Of the eight analyzed traits, six traits with the exception of CER in the BC2F1 population
showed significant differences among the genotypic groups for the SSR marker bnlg1740 in
all three backcross populations (Table 3.3). The other significant traits were Fv/Fm, Fo, ΦPSII,
Fv'/Fm' and SPAD. The proportion of phenotypic variance contributed by the genotypic
differences (R2) ranged from 5.6 % (SPAD) to 51.9 % (Fv/Fm) in the BC2F1 population, 6.2 %
(CER) to 41.8 % (Fv/Fm) in BC3F1 population and 6.6 % (CER) to 46.1 % (Fv/Fm) in the
BC3F2 population indicating the stability of QTL expression for these traits. The chilling
tolerant parent ETH-DH7 at this marker contributed to an increase of Fv/Fm, ΦPSII, Fv'/Fm',
CER, SPAD and a decrease in Fo in all three backcross populations.
Table 3.3: Stability of QTL expression of photosynthetic traits in seedlings of the three backcross population grown at suboptimal temperature based on single marker analysis of the SSR marker bnlg1740.
BC2F1 BC3F1 BC3F2 Trait F value a R2 (%) b F value R2 (%) F value R2 (%)
Fv/Fm 167.02 ** 51.9 87.03 ** 41.8 71.52 *** 46.1
Fo 143.19 ** 48.0 50.89 ** 29.6 26.59 *** 24.3
Fm 3.60 ns - 5.29 ns - 4.27 ns -
ΦPSII 26.87 ** 14.8 21.89 ** 15.0 9.91 *** 10.6
Fv'/Fm' 39.45 ** 20.3 17.84 ** 12.9 10.46 *** 11.1
qP 1.41 ns - 1.35 ns - 3.14 ns -
CER 1.19 ns - 8.01 ** 6.2 5.92 ** 6.6
SPAD 9.17 ** 5.6 53.78 ** 30.8 25.61 *** 23.5
a = tests of the phenotypic differences between the two genotypic groups in BC2F1, BC2F1 and three genotype groups in BC3F2; *, P < 0.05; **, P < 0.01; ***, P < 0.001; b = phenotypic variance as explained by the QTL.

Chapter 3
21
3.3.3 Confirmation of the additional QTL in the distal region of chromosome 6 in the BC3F2 population
Using the SSR markers, bnlg1740 and umc1653, as well as the two new markers, bnlg1136
and umc2324 (Chapter 2), the 176 plants of the BC3F2 population were genotyped and a new
genetic linkage map was constructed (Figure 3.2). The order of the SSR markers was the same
as in the F2 population but the genetic distances between them was higher in the BC3F2 than
in the F2 population. This genetic linkage map was used to analyze QTLs by composite
interval mapping of the traits of leaves that developed at suboptimal temperature. The QTL
analysis confirmed the presence of the QTL-1, which was involved in the variation of Fv/Fm,
Fo, ΦPSII, Fv'/Fm', CER and SPAD. The QTL-1 was localized at the SSR marker bnlg1740
(Table 3.4). An increase in Fv/Fm, ΦPSII, Fv'/Fm', CER and SPAD and a decrease in Fo were
due to the allelic contribution of the chilling tolerant parent ETH-DH7. The magnitude of the
phenotypic variation (R2) explained by this QTL ranged from 6.5% for CER to 47.3% for
F2 BC3F2bnlg1043bnlg161
bnlg1867bnlg249bnlg1188
umc1887bnlg1617bnlg1922
bnlg1732umc1859
bnlg1740bnlg1136
umc1653
umc2324
7.4
39.0
10.12.8
47.7
12.63.6
49.6
10.4
38.0
8.416.8
16.0
bnlg1740bnlg1136
umc1653
umc2324
10.5
19.4
26.8
F2 BC3F2bnlg1043bnlg161
bnlg1867bnlg249bnlg1188
umc1887bnlg1617bnlg1922
bnlg1732umc1859
bnlg1740bnlg1136
umc1653
umc2324
7.4
39.0
10.12.8
47.7
12.63.6
49.6
10.4
38.0
8.416.8
16.0
bnlg1740bnlg1136
umc1653
umc2324
10.5
19.4
26.8
Figure 3.2: Genetic linkage map of the introgressed segment of chromosome 6 in the BC3F2population in relation to the genetic linkage map of the whole chromosome 6 in the F2population. The additional SSR markers are indicated by bold letters.

Marker assisted introgression of major chilling tolerance QTL
22
Fv/Fm, while the LOD score ranged from 2.53 for CER to 22.66 for Fv/Fm. Furthermore, the
QTL analysis identified the second QTL (QTL-2) in the introgressed region flanked by
umc1653 and umc2324 and 45 cM distant from the first QTL at bnlg1740. This QTL-2
controlled the traits Fo and Fv/Fm and explained 45.5 and 24.8% of the trait variation,
respectively.
3.3.4 Time course analysis of QTLs for photosynthetic traits The time course experiment was designed to assess the effects of both QTLs in different
leaves and under different temperature regimes. The time course of Fv/Fm and ΦPSII in the
parental lines and in the BC3F2 population are shown in Figure 3.3. In the first leaf, which
developed at 25 °C, Fv/Fm and ΦPSII of the parental lines measured at 25 °C were nearly
identical. A decrease in growth and measuring temperature to 15 °C resulted in a substantial
reduction in Fv/Fm and ΦPSII. However, starting from day 3 after transfer to 15 °C, Fv/Fm and
ΦPSII of second and third leaves of ETH-DH7 were significantly (P < 0.01) higher compared
to ETH-DL3. These differences in Fv/Fm and ΦPSII between the parents were smaller in the
second leaf, which had only partially developed at 15 °C, than in the third leaf that fully
developed at 15 °C. Furthermore, the third leaf was characterized by a lower ΦPSII than the
second leaf, especially in the chilling sensitive genotype ETH-DL3.
The significant differences between the parental lines were also observed when the
temperature was lowered further to 10 °C for two days. This decrease in temperature resulted
in a marked decrease in ΦPSII and Fv/Fm. Both parameters recovered when the seedlings were
Table 3.4: Main characteristics of QTLs for photosynthetic traits in the BC3F2 population with an LOD score above a threshold of 2.5.
Trait cM Interval LOD score Add Dom R2 (%)
Fv/Fm 0.0 bnlg1740 - bnlg1136 22.66 0.042 0.030 47.3 44.8 umc1653 - umc2324 5.32 0.031 0.020 24.8
Fo 0.0 bnlg1740 - bnlg1136 8.50 -0.020 -0.023 39.7 44.8 umc1653 - umc2324 5.81 -0.025 -0.024 45.5
ΦPSII 0.0 bnlg1740 - bnlg1136 4.47 0.036 0.035 11.4
Fv'/Fm' 0.0 bnlg1740 - bnlg1136 4.76 0.040 0.041 12.1
CER 0.0 bnlg1740 - bnlg1136 2.53 0.9 0.7 6.5
SPAD 0.0 bnlg1740 - bnlg1136 10.27 4.1 4.1 23.8
cM = Position of the peak of the QTL in centimorgan; Add = additive effect of the ETH-DH7 allele; Dom = dominant effect of the ETH-DH7 allele; R2 = phenotypic variance as explained by QTL.

Chapter 3
23
transferred to 25 °C. Most notable was that ETH-DH7 recovered the initial values of Fv/Fm
and ΦPSII while this was not the case in ETH-DL3.
The performance of the both traits of the BC3F2 population was skewed towards the chilling
tolerant parent ETH-DH7 with regard to the second leaf and was between the corresponding
values of the two parents with regard to the third leaf during growth at 15 °C. In this state,
transgressive segregation occurred in both directions of the parents for Fv/Fm and ΦPSII in the
second leaf as well as in the third leaf at 15 °C (data not shown). During cold stress at 10 °C
F v/Fm
0.0
0.2
0.4
0.6
0.8
ΦPS
II
0.0
0.2
0.4
0.6
10°C 25°C15°C25°C10°C 25°C15°C25°C
ETH-DH7BC3F2ETH-DL3
leaf 1 2 3
LOD
(Fv/F
m)
0
5
10
15
20QTL-1QTL-2
leaf 1 2 3
LOD
(ΦP
SII)
0
5
10
15
20
time (days)
0 5 10 15 20
R2 (F
v/Fm)
0
10
20
30
40
50
time (days)
0 5 10 15 20R
2 (ΦPS
II)0
10
20
30
40
50QTL-1QTL-2
leaf 1 2 3
Figure 3.3: Time course of Fv/Fm and ΦPSII in seedlings of ETH-DH7 (white symbols), ETH-DL3 (black symbols) and of the BC3F2 population (grey symbols) and time course of LOD scores and R2 values for QTL-1 (black symbols) and QTL-2 (white symbols).

Marker assisted introgression of major chilling tolerance QTL
24
and during recovery at 25 °C, the mean values of the BC3F2 population were towards the
chilling tolerant parent ETH-DH7 for Fv/Fm and towards ETH-DL3 for ΦPSII.
The QTL analysis revealed that QTL-1 had not been not expressed in the first leaf (day 0;
25 °C) and in the second leaf (day 3 to 9 after transfer to 15 °C) (Figure 3.3). In the third leaf,
QTL-1 was expressed at all the time points at 15 °C for Fv/Fm and ΦPSII. Furthermore, QTL-1
consistently explained the variation for Fv/Fm even during cold stress at 10 °C and during
recovery phase at 25 °C. Its expression was below the threshold level for ΦPSII (Figure 2.3).
The LOD score and the R2 value for Fv/Fm showed a strong increase during growth of the
third leaf at suboptimal temperature. Similar to QTL-1, QTL-2 was not expressed in the first
and second leaves. However, QTL-2 was found for Fv/Fm in the third leaf at 15 and at 10 °C.
During the recovery phase at 25 °C, QTL-2 was below the threshold. The QTL-2 expression
(R2) for Fv/Fm changed as the third leaf developed. For ΦPSII, the QTL-2 was below the
threshold level irrespective of the temperature regime or leaf.
3.4 Discussion The main focus of this study was to understand the physiological and genetic basis of chilling
tolerance of photosynthesis. Previous studies identified several QTLs for chilling tolerance of
photosynthesis in maize seedlings (Fracheboud et al., 2004; Jompuk et al., 2005). The major
QTL for chilling tolerance of photosynthesis was located on chromosome 6 (bin 6.07); it
explained 37.4 % of the phenotypic variance in the chronic photoinhibition at low temperature
and was significantly involved in the expression of other traits, such as minimal fluorescence
of dark-adapted leaves (Fo), operating quantum efficiency of PS II (ΦPSII), carbon exchange
rate (CER) and accumulation of shoot dry matter (Fracheboud et al., 2004). However, this
QTL did not have a significant effect on flowering or yield parameters (Leipner et al., 2008).
For an in-depth analysis of the genetic and physiological basis of this QTL, it is required
necessary to develop a population segregating only for this QTL. In the present study, the
introgression of the chilling tolerant allele from ETH-DH7 at this QTL into the chilling
sensitive line ETH-DL3 was accomplished by marker assisted selection (MAS). Theoretical
studies have shown that the potential gain from MAS depends on the genetic distance
between the QTL and the linked molecular marker(s), the number of markers used per QTL
for MAS and the relative size of the phenotypic effect of the QTL (Bouchez et al., 2002;
Kraja and Dudley, 2000; Lander et al., 1987). In the present study, three SSR markers, namely
bnlg1740, linked to QTL as per LOD score, and umc1859 and umc1653, which are located on

Chapter 3
25
the right- and left-hand sides of the confidence interval (Fracheboud et al., 2004; Jompuk et
al., 2005), were useful for selecting the target QTL and for verifying the integrity of the QTL
during backcrossing. Numerous studies also demonstrated a successful MAS program by
taking the QTL confidence interval into account (Bouchez et al., 2002; Singh et al., 2001;
Thabuis et al., 2004). Marker assisted background selection to cull out non-target QTLs from
ETH-DH7 and to select a maximum of the recurrent parental genome were successfully
achieved in the BC2F1 and BC3F1 progenies. Previous theoretical (Bouchez et al., 2002; Hillel
et al., 1990; Visscher et al., 1996) and experimental (Bouchez et al., 2002; Ragot et al., 1995;
Tajima et al., 2002; Thabuis et al., 2004) studies have shown that background selection is an
efficient method.
QTL detection by means of single factor ANOVA and composite interval mapping
demonstrated that the introgressed segment of chromosome 6 of the chilling tolerant line
ETH-DH7 into the chilling sensitive line ETH-DL3 was associated with a significant increase
in Fv/Fm, ΦPSII, Fv'/Fm', CER and SPAD and a decrease in Fo in three backcross populations.
This shows a stable QTL expression of all the traits (with the exception of CER in BC2F1)
over backcross generations as was also shown in other studies (cf. Chaïb et al., 2006; Mutlu et
al., 2005). Discrepancy in QTL expression for CER in the BC2F1 population was attributed to
an experimental error or QTL × genetic background interaction. Thus, the present results and
those of previous studies (Fracheboud et al., 2004; Jompuk et al., 2005) support the location
of the QTL on chromosome 6 (bin 6.07) and its pleiotropic nature; it simultaneously controls
Fv/Fm, Fo, ΦPSII, Fv'/Fm', CER and SPAD. As described in Chapter 2, an additional QTL was
identified for Fv/Fm and Fo in the introgressed region of chromosome 6. This QTL was not
identified in previous studies (Fracheboud et al., 2004; Jompuk et al., 2005), probably due to
the insufficient number of markers in this region.
The significant reduction in Fv/Fm in the maize seedlings is a well documented in plants under
severe stress. The decrease in Fv/Fm is a measure of the decline of the potential maximum
quantum yield of PS II (Björkman and Demmig, 1987; Genty et al., 1989). This decline in
Fv/Fm in genotypes that do not carry the chilling tolerance allele from ETH-DH7 at bin 6.07
suggests that the integrity of PS II was altered and indicates photoinhibition of photosynthesis
(Long et al., 1994). The decrease in the Fv/Fm of genotypes without ETH-DH7 allele at both
QTLs was due to an increase in Fo which may have been caused by one of the following: a) a
functional dissociation of the antenna complex from the PS II reaction center (Armond et al.,
1978; Kitao and Lei, 2007), b) damage to the D1 protein of the PS II reaction center resulting
in an impairment of electron transport from QA to QB (Gilmore et al., 1996), or c)

Marker assisted introgression of major chilling tolerance QTL
26
chlororespiration, a non-photochemical reduction on QA by reducing equivalents supplied in
the dark from a stromal pool of NAD(P)H (Horváth et al., 2000). The increase in Fv/Fm due to
the ETH-DH7 allele was associated with an increase in the operating quantum efficiency of
PS II (ΦPSII) at QTL-1. The increase in ΦPSII was due to an increase in Fv'/Fm' whilst qP was
not affected. This indicates a higher efficiency of capture of excitation energy by open PS II
reaction centers without a change in the redox state of QA in the genotypes holding the ETH-
DH7 allele. Moreover, the low SPAD and CER values of chilling sensitive parent and chilling
sensitive genotypes of backcross populations also reflected a disturbance in the assembly of
the photosynthetic apparatus. The favorable allele in the chilling tolerant parent ETH-DH7
and in the chilling tolerant genotypes of the BC3F2 population at QTL-1 seems to be involved
in the development of a functional photosynthetic apparatus at suboptimal temperature or in
its protection. The QTL effects were not detected for leaf greenness at this locus in previous
studies (Fracheboud et al., 2004; Jompuk et al., 2005). On the one hand, this may be due to
high phenotypic variance caused by multiple genomic regions, which differ between
genotypes of the F2:3 population since several segregating QTLs contribute to phenotypic
differences between them. In contrast, in a NIL population, the phenotypic variation observed
between genotypes can be assigned directly to the distinct genomic regions introgressed in an
otherwise similar genetic background (Nadeau et al., 2000). On the other hand, the number of
QTLs detected in common mapping populations for the same trait can vary considerably
among experiments (Kearsey and Farquhar, 1998; Tanksley and Nelson, 1996) and is often
underestimated. The analysis of NILs carrying small introgressions of a donor genome, for
example, revealed 23 QTLs for single trait in an introgression line population of Lycopersicon
pennellii (Eshed and Zamir, 1995), whereas only four to 13 QTLs were detected when
segregating populations were used (Bernacchi et al., 1998b; Saranga et al., 2004; Tanksley
and Nelson, 1996). Similarly, it was found that NILs had significant affects on traits that were
undetected in the previous BC3 population from which the NILs were developed (Bernacchi et
al., 1998a; Bernacchi et al., 1998b). The results of the current study support the latter
observations.
Many QTL mapping studies have been limited with regard to the performance of a trait
observed at a fixed time point or stage of ontogenesis. Such a QTL mapping estimates the
effects of QTL accumulated from the beginning of ontogenesis to the time of observation, but
the development of trait involves differential activity of many related QTLs. This means that
the dynamics of expression of different QTLs may differ during trait development, even
though they may have the same end effect. To this end, an experiment was carried out to

Chapter 3
27
determine the genetic and physiological functions of the QTL region on chromosome 6 in
different leaves and under different temperature regimes. The results showed that the
expression of QTL-1 and QTL-2 was not detected in the first and second leaves, but it was
expressed in the third leaf. A similar response was found for the major QTL for ΦPSII, which
was located on chromosome 3, in the Ac7643 × Ac7729 mapping population (Fracheboud et
al., 2002). The differential expression of these QTLs in different leaves may be due to the
different developmental history of the leaves. While the first leaf was fully developed at
optimal temperature, the second leaf grew in both temperature conditions; it achieved
approximately 50 % of its final size at 25 °C. The development of the third leaf and its
complete expansion occurred under suboptimal temperature. The differential expression of
QTL may be due to differences in the growth rate and the expansion of leaf as a result of the
temperature decrease in the root zone where the shoot apex is located (Engels, 1994; Stone et
al., 1999). The chilling induced growth retardation of leaves seems to be caused by an
increase in the duration of the cell cycle and by a reduction in cell production (Rymen et al.,
2007). Furthermore, differences in the photosynthetic performance of the genotypes are
smaller when the plants were grown at 25 °C and transferred directly to the cold than when
plants grew at 15 °C (Fracheboud et al., 1999; Fracheboud et al., 2002). Thus, significant
effects of QTL in the third leaf only indicate that both QTLs play a major role in the
development of the photosynthetic apparatus under suboptimal temperature.
Finally, it is necessary to point out that the concept of QTL expression studied here was only
at the level of the phenotype. Revealing its relationship to the molecular or biochemical
process is a future task for developmental quantitative genetics. Based on results of such a
study the dynamics of QTL expression at the molecular or biochemical level could be
deduced.

Characterization of NILs
28
4 Characterization of the photosynthetic apparatus of near isogenic lines (NILs) for a QTL related to chilling tolerance of photosynthesis
4.1 Introduction Suboptimal temperature is particularly deleterious in the early growth stages of maize. It
induces many physiological, biochemical and molecular responses in which photosynthesis is
one of the primary physiological targets (Baker and Nie, 1994; Fryer et al., 1998; Leipner et
al., 1999; Marocco et al., 2005). Experimental results indicated that suboptimal temperature
has a negative effect on the development of the photosynthetic apparatus (Nie and Baker,
1991). Years of selective breeding have led to the emergence of genotypes exhibiting varying
degrees of adaptation to temperate climate. However, this was achieved mainly by shortening
the plant's life cycle while the reasons for the varied chilling-sensitivities of the individual
selected maize lines are poorly understood.
Several QTLs for chilling tolerance in maize, mainly with respect to photosynthesis have been
identified (Fracheboud et al., 2002; Fracheboud et al., 2004; Jompuk et al., 2005). To study
the genetic and physiological basis of these QTLs in more detail, it is advantageous to
develop lines that differ for a single QTL and are identical for the remaining genome. Such
near isogenic lines (NILs) not only provide a better estimate of the effect of the single QTL
alleles, but also serve as a starting point for unraveling the underlying functional genes and
may be useful for positional cloning (Frary et al., 2000; Fridman et al., 2000; Salvi and
Tuberosa, 2005). They have the advantage is that the genetic background noise is eliminated,
giving the QTL the characteristic of a qualitative gene. Approaches utilizing NILs to
accelerate QTL discovery, validation and germplasm improvement have been proposed
(Kaeppler et al., 1993; Saranga et al., 2004; Tuinstra et al., 1997). In addition, the availability
of NILs for specific QTL effects on a number of traits facilitates the elaboration of models
and hypotheses on their cause-effect relationships (Tuberosa et al., 2002a).
The development of near isogenic lines (NILs) requires a controlled program of backcrossing,
ensuring that only the target QTL is present while the rest of the genome is inherited from the
recurrent parent. Phenotypic selection for good agronomic performance has always been
practiced along with backcross selection (Bravo et al., 2003). Genotypic selection by
monitoring the parental origin of alleles using molecular markers throughout the genome
during backcrossing was originally proposed by Young and Tanksley (1997) and was later

Chapter 4
29
referred as background selection (Bouchez et al., 2002). Screening plants with molecular
markers allows a controlled backcrossing program, and it enables to efficiently select against
the donor genome (Bouchez et al., 2002; Tajima et al., 2002; Thabuis et al., 2004).
In the previous chapter (Chapter 3), the effect of the major QTL region for chilling tolerance
of photosynthesis on chromosome 6 (bin 6.07) was confirmed by using a BC3F2 population.
This study, aimed at developing NILs for this chromosomal region in order to assess possible
effects of the introgressed segment on chilling tolerance. As a consequence, it was focused to
investigate the physiological mechanism underlying the QTL and finally to investigate the
physiological impact of the favorable QTL allele on chilling tolerance of seedlings at
suboptimal temperature under controlled as well as under field conditions.
4.2 Materials and Methods 4.2.1 Plant material Near isogenic lines (NILs) to ETH-DL3 were developed from selected BC3F2 lines of the
QTL mapping population (see Chapter 3). The SSR markers bnlg1740, bngl1139, umc1653
and umc2324 were used to select for the donor parental (ETH-DH7) allele in a homozygous
condition in the target region of chromosome 6 (bin 6.07) as well as to select against ETH-
DH7 in non target region using additional 35 SSR markers. The selected lines were selfed
twice; two NILs, namely NIL152 and NIL146 were recovered; they contained the target
region including QTL-1 and QTL-2 and the recurrent parental (ETH-DL3) alleles at 59 co-
dominant SSR markers used for background selection. The maize genotypes ETH-DH7 and
ETH-DL3 and their two NILs (NIL152 and NIL146) were used for this study.
4.2.2 Growth conditions Plants were grown in growth chambers (PGW36, Conviron, Winnipeg, Canada) in 0.75 l pots
containing a commercial mixture of soil, peat and compost (Topf und Pikiererde 140, Ricoter,
Aarberg, Switzerland). The seeds germinated and grew until the first leaf stage at 25/22 °C
(day/night), 12 h photoperiod with a light intensity of 400 µmol m-2 s-1 and a relative humidity
of 60/70 % (day/night). About six days after sowing, when the first leaf was fully emerged,
half of the seedlings were transferred to suboptimal growth temperature (15/13 °C, day/night)
for 15 days until the third leaf was fully developed; the other half was kept at optimal
temperature (25/22 °C) for seven days until they reached the same physiological age. The

Characterization of NILs
30
plants were watered and fertilized with half-strength Wuxal nutrient solution (0.2 %) as
required.
Furthermore, the plant material was grown under field conditions at the experimental station
of the Institute of Plant Sciences of the ETH in Eschikon near Zurich (47°26' N, 8°40' E and
550 m above sea level) in 2007. Seedlings were grew until the first leaf stage in growth
chambers (PGW36, Conviron, Winnipeg, Canada) at 25/22 °C (day/night) temperature, 12 h
photoperiod with a light intensity of 400 µmol m-2 s-1 and a relative humidity of 60/70 %
(day/night). Six day old seedlings were transferred to the field on 3 May 2007. Twenty
seedlings per genotype were planted in two rows. The distance between the rows was 75 cm
and the distance between the plants in the rows was 15 cm. The soil was an Eutric Cambisol
(FAO classification) with a clay loam (CL) texture and a low content of organic matter (3%)
(Richner et al., 1996).
4.2.3 Light response curves of gas-exchange and chlorophyll fluorescence parameters under controlled conditions
To obtain light response curves of parental lines and NILs, the carbon exchange rate and the
chlorophyll fluorescence were monitored with a portable photosynthesis system (LI-6400)
equipped with a LI-6400-40 pulse-amplitude modulation fluorometer (LI-COR, Lincoln, NE,
USA). The maximum quantum efficiency of PS II primary photochemistry (Fv/Fm) and dark
respiration were determined after 15 min of dark adaptation. After determining of Fv/Fm and
dark respiration, plants adapted to the light for five minutes at the lowest light level intensity.
At each light intensity, the leaf adapted for 5 to 8 minutes to the new light intensity until the
variation in ΔCO2 + ΔH2O + Δflow was less than 0.2 %.
The maximum fluorescence in the dark-adapted (Fm) and in the light-adapted (Fm') state was
determined by applying a 0.8 s saturating flash (> 8000 µmol m-2 s-1). The Fo' was calculated
according to the equation of Oxborough and Baker (1997). The operating quantum yield of
photosystem II photochemistry (ΦPSII) was calculated according to Genty et al. (1989). The
quantum efficiency of dissipation by down-regulation was calculated as ΦNPQ = 1 - ΦPSII -
1/(Fm/Fm' + (((Fm'-F ')Fo') / ((Fm'-Fo')F ')) × (Fm/Fo-1)), and the quantum efficiency of other
non-photochemical losses (non-light induced, basal or dark, quenching process) as ΦNO =1 -
ΦPSII - ΦNPQ (Kramer et al., 2004). For nomenclature of the fluorescence states and parameters
see Rosenqvist and van Kooten (2003). The light response curves were fitted according to
Norman et al. (1992) using the Photosynthesis program V.1.0 (LI-COR).

Chapter 4
31
4.2.4 Measurement of physiological traits under field conditions Photosynthesis and chlorophyll fluorescence parameters were measured on fully developed
third leaves of randomly selected seedlings using infrared gas analyzer equipped with a pulse-
amplitude modulation fluorometer (LI-6400, LI-COR, Lincoln, USA). The light intensity was
400 µmol m-2 s-1, the temperature of the sample chamber was 15 °C and humidity and CO2
concentration were the same as the ambient conditions. The quantum yield of electron
transport at PS II (ΦPSII), the efficiency of open PS II reaction centers (Fv'/Fm'), photochemical
quenching factor (qP) and carbon exchange rate (CER) were measured when the variation of
ΔCO2 + ΔH2O + Δflow was below 0.2 %.
The maximum quantum efficiency of PS II (Fv/Fm) was determined with a PAM-2000 (Walz,
Effeltrich, Germany) fluorometer after 30 min dark adaptation by applying a one-second
saturation flash (> 8000 µmol m-2 s-1).
To measure greenness of the leaves, three measurements were made n the middle section of
the third leaf and averaged for each plant using a Minolta SPAD-502 chlorophyll meter
(Minolta Corporation, Ramsey, Japan).
4.2.5 Data analysis and statistic Mean and standard deviation were estimated for each genotype. Statistical comparison of the
means was done according to the Tukey-Kramer test where the P value was less than 0.05 and
was considered to be significant.
4.3 Results 4.3.1 Genotypic differences in the light response of CO2 assimilation, PS II
functioning and energy dissipation The maximum quantum efficiency of PS II primary photochemistry (Fv/Fm) showed no
significant differences between the genotypes at optimal temperature (Table 4.1). However,
significant differences among the genotypes were observed in seedlings that developed at
suboptimal temperature (15 °C). In the chilling sensitive genotype ETH-DL3, the Fv/Fm
declined most by 52%, whereas the Fv/Fm of NIL152, NIL146 and ETH-DH7 declined by 22,
29 and 16% respectively, when grown at 15 °C in comparison to seedlings that grown at
25 °C.

Characterization of NILs
32
Figure 4.1 shows the light response curves for photosynthesis constructed from data of
genotypes grown at optimal (25 °C) and at suboptimal temperature (15 °C). The parameters,
which define the fitted curves, are summarized in Table 4.2. The rate of CO2 assimilation
(CER) of the genotypes grown at optimal temperature (25 °C) was nearly identical.
Significant differences were observed when genotypes were grown at 15 °C and at light
intensities higher than 1200 µmol m-2 s-1 (for statistical analysis see Annex Table A.1). The
chilling tolerant parent ETH-DH7 and NIL152 exhibited higher rates of CO2 assimilation than
the chilling sensitive parent ETH-DL3. Substantial decrease in the initial slope (Φ), the
convexity (Ø) of the light response curve and the light-saturated rate of photosynthesis (Pmax)
were observed at 15 °C for all genotypes. The high Φ and the low Ø for NIL152 compared to
the other genotypes grown at 15 °C may have been resulted from a bias in the fitting of three
parameters the light response curve to data that resided mainly in the lower light intensity
range. The chilling tolerant parent ETH-DH7 and NIL146 had higher absolute values for all
the three parameters at 15 °C. The operating efficiency of the light harvesting of PS II (ΦPSII)
was affected by genotype and light intensity. Under optimal temperature (25 °C),
Table 4.2: Parameters of the photosynthetic light response curve fitted to data from 25 °C and 15 °C grown plants. The fitting was conducted based on the average values for each genotype.
Genotype Trait Growth temperature ETH-DH7 NIL146 NIL152 ETH-DL3
Φ 25 °C 0.065 0.073 0.067 0.065 15 °C 0.033 0.023 0.063 0.019
Ø 25 °C 1.491 1.249 1.818 1.252 15 °C 1.093 1.052 0.515 1.027
Pmax 25 °C 31.0 39.3 28.8 44.1 15 °C 10.7 7.1 15.0 2.5
Table 4.1: Fv/Fm of genotype grown at 25 °C and 15 °C. Values are means ± SD of four replications. Significant differences (P ≤ 0.05) for pair-wise comparisons within a growth temperature are indicated by different letters.
Genotype Growth temperature ETH-DH7 NIL146 NIL152 ETH-DL3
25 °C 0.758 ± 0.023 a 0.761 ± 0.024 a 0.748 ± 0.012 a 0.782 ± 0.001 a
15 °C 0.658 ± 0.034 a 0.541 ± 0.069 b 0.589 ± 0.063 a 0.382 ± 0.036 c

Chapter 4
33
PPFD (µmol m-2 s-1)
0 400 800 1200 1600
ΦN
PQ
0.0
0.2
0.4
0.6
PPFD (µmol m-2 s-1)
0 400 800 1200 1600
ΦN
O
0.0
0.2
0.4
0.6
CER
(µm
ol m
-2 s
-1)
0
10
20
30
40
ΦPS
II
0.0
0.2
0.4
0.6
0.8F v'/
F m'
0.0
0.2
0.4
0.6
0.8
q P
0.0
0.2
0.4
0.6
0.8
1.0
ETH-DH7NIL146NIL152ETH-DL3
25 / 15 °C
Figure 4.1: Light response curves of carbon exchange rate (CER), operating quantum efficiency of PS II (ΦPSII), efficiency of open PS II reaction centers (Fv'/Fm'), photochemical quenching factor (qP), quantum efficiency for dissipation by down regulation (ΦNPQ), and quantum efficiency of other non-photochemical losses (ΦNO) in the chilling tolerant line ETH-DH7, chilling sensitive line ETH-DL3 and the near isogenic lines NIL152 and NIL146. Values are means ± SD of four replications.

Characterization of NILs
34
all genotypes were having nearly equal ΦPSII values at low light intensity (Figure 4.1).
However, at higher light intensity (≥ 800 µmol m-2 s-1), the chilling sensitive parent ETH-DL3
had significantly higher values of ΦPSII compared to ETH-DH7 and NIL152. The higher
operating efficiency of light harvesting of PS II (ΦPSII) at higher light intensity was due to
higher quantum efficiency of open PS II centers (Fv'/Fm') and photochemical factor (qP). The
energy dissipation via regulated mechanism (ΦNPQ) and non-regulated processes (ΦNO) were
nearly the same in all the genotypes grown at optimal temperature. However, at suboptimal
temperature (15 °C), the chilling tolerant parent ETH-DH7 and the near isogenic lines
NIL152 and NIL146 had significantly higher ΦPSII values than ETH-DL3 at all light
intensities (Figure 4.1). The decrease in the ΦPSII of ETH-DL3 was associated with a decrease
in the quantum efficiency of open PS II centers (Fv'/Fm') as well as in the photochemical
factor, qP. The excess of absorbed light energy in the chilling sensitive parent ETH-DL3 was
dissipated to a significantly greater extent by non-regulatory process (ΦNO) than in the chilling
tolerant parental line ETH-DH7 and in the near isogenic lines NIL152 and NIL146. The ΦNPQ
was higher at 15 °C than at 25 °C at all the light intensities. However, there were no
significant differences among the genotypes (see also Annex Table A.1).
4.3.2 Field experiment Under field conditions, the seedlings experienced a mean temperature of 13.5 °C for 15 days
between the planting of seedlings and time of measurements. During the time of measurement
(18 May 2007), the temperature was about 13 °C. At, the leaves of the s this temperature,
seedlings had a low Fv/Fm, ΦPSII, Fv'/Fm', qP and CER (Table 4.3), which were comparable to
Table 4.3: Chlorophyll fluorescence parameters (Fv/Fm, ΦPSII, Fv'/Fm', qP), carbon exchange rate (CER) and leaf greenness (SPAD) of two near isogenic lines and the parental lines ETH DH7 and ETH-DL3 under field conditions. The data are the mean values ± SD of five replications. Significant differences (P ≤ 0.05) for pair-wise comparisons are indicated by different letters.
Trait ETH-DH7 NIL146 NIL152 ETH-DL3
Fv/Fm 0.696 ± 0.020 a 0.525 ± 0.014 a 0.689 ± 0.015 a 0.382 ± 0.060 b
ΦPSII 0.159 ± 0.042 a 0.141 ± 0.009 ab 0.169 ± 0.029 a 0.113 ± 0.024 b
Fv'/Fm' 0.234 ± 0.044 a 0.214 ± 0.013 ab 0.251 ± 0.033 a 0.171 ± 0.032 b
qP 0.668 ± 0.058 a 0.658 ± 0.018 a 0.673 ± 0.043 a 0.659 ± 0.025 a
CER 03.9 ± 1.2 a 03.2 ± 0.4 ab 04.2 ± 0.7 a 02.1 ± 0.8 b
SPAD 25.4 ± 0.9 a 18.0 ± 0.6 ab 23.3 ± 2.2 a 12.6 ± 1.2 b

Chapter 4
35
the seedlings grown at 15 °C under controlled conditions (Table 4.1, Figure 4.1). With the
exception of qP, all the other traits were significantly different with higher values for ETH-
DH7 and NIL152 and low values for ETH-DL3. NIL146 was in between these two groups
(Table 4.3).
4.4 Discussion In the present study, the development of near isogenic lines (NILs) was accelerated by marker
assisted selection. Furthermore, the sequential genotyping approach used here considerably
lowered the costs of experiment and proved to be successful for QTL transfer as was also
shown for major genes (Frisch and Melchinger, 2001). The two NILs developed here
recovered the recipient genotype at all selected loci but contained the chromosomal segment
carrying QTL(s) for chilling tolerance of photosynthesis from the tolerant donor parent, ETH-
DH7. Since more and more recombination events accumulate over generations, the number of
donor segments spread over the genome increases as their length decreases. Therefore, an
increasing number of markers was needed to control all the potential recombinations during
the latter generations of backcross breeding. A higher marker density in the BC3F1 and BC3F2
generation was useful in eliminating these donor segments more rapidly as was also
demonstrated by Hospital et al. (2002). Homozygous alleles of the recurrent parent at all the
SSR loci indicated complete recovery of the recurrent parental genome.
In the previous QTL analyses of the ETH-DH7 × ETH-DL3 population in the F2:3
(Fracheboud et al., 2004; Jompuk et al., 2005) and BC3F2 generation (Chapter 3) it was found
that the major QTL on chromosome 6 was associated with changes in Fv/Fm suggesting a
lower photosynthetic efficiency of lines carrying the allele from ETH-DL3. The change in
Fv/Fm, which was accompanied with an opposite change in Fo, indicates structural alterations
in the photosystem II. In the above studies, the photosynthesis and chlorophyll fluorescence
were analyzed only at the light intensity of 400 µmol m-2 s-1, at which plants were grown,
thus, it was not known whether the QTL on chromosome 6 affects the dark-reaction of
photosynthesis as well. In order to throw light on this, it is necessary to analyze the plant
material by conducting light response curves. However this is not feasible in mapping
populations, NILs were developed, which carry the allele of the chilling tolerant parent ETH-
DH7 at the target locus while the remaining genome was recovered completely from the
recurrent parent as mentioned above. The light response curves of the parental lines and the
NILs revealed that the efficiency as well as the capacity of photosynthesis were affected by

Characterization of NILs
36
the growth temperature. Suboptimal temperature resulted in inhibition of the photosynthetic
carbon metabolism of all the genotypes, but a more substantial reduction was found in ETH-
DL3 than for chilling tolerant parent ETH-DH7 and in the NILs. Furthermore, the results
demonstrated that suboptimal temperature was associated with a decrease in the values of all
the parameters that describe the light response curve. This indicates that the efficiency as well
as the capacity of photosynthesis were affected by suboptimal growth temperature. Such
changes are symptomatic of chilling induced damages, either due to perturbation in the D1
protein turn-over or due to developmental effects on the photosynthetic apparatus (Baker and
Ort, 1992; Stirling et al., 1993). Chilling-induced decrease in the of Φ and Pmax of maize have
been well documented (Baker et al., 1988; Long et al., 1983; Stirling et al., 1991). The higher
photosynthetic efficiency of the NILs compared to ETH-DL3 was due to a high efficiency of
the operating quantum efficiency of PS II (ΦPSII), which in turn was due to both higher qP and
higher Fv'/Fm'. This indicates that the NILs maintained a higher fraction of open PS II reaction
centers, which had a higher quantum efficiency. Consequently, a greater percentage of
absorbed quanta was converted into chemical energy. The remaining quanta were dissipated
as heat (and fluorescence). Since the sum of the quantum yields of photochemistry, heat
dissipation and chlorophyll fluorescence are unity, it was expected that genotypes with a low
ΦPSII would be characterized by a higher amount of heat dissipation. In this study, the lake
antenna model of Kramer et al. (2004) was employed to unravel the different compounds of
the dissipative mechanisms. Although suboptimal growth temperature induced energy
dissipation via the non-photochemical pathway (ΦNPQ), there were no significant differences
in ΦNPQ between genotypes despite differences in ΦPSII. However, seedlings of the chilling
sensitive genotype (ETH-DL3) grown at suboptimal temperature, were characterized by a
greater loss of energy (ΦNO), which was not attributed to down-regulation, indicating chilling-
induced constitutive structural alterations of the photosynthetic apparatus. Since the ΦNO
values of NILs and in ETH-DH7 was similar, it is concluded that the gene(s) behind the
QTL(s) on the long arm of chromosome 6 are directly or indirectly responsible for the
assembly or disassembly of the photosynthetic apparatus. This seems at first to in contrast
with the finding that this QTL also had an effect on the dark reaction of photosynthesis as
shown by the higher photosynthetic capacity of the NILs compared to ETH-DL3. Low growth
temperature decreases the amount of photosynthetic apparatus in a given leaf area (Baker and
Nie, 1994), which results in a lower ratio of photosystems to chlorophyll (Nie and Baker,
1991). The decrease in photochemical reaction centers per unit chlorophyll will inevitably
result in reductions in the quantum yield of ATP and reductants production by thylakoids and

Chapter 4
37
in a contribution to the decreased efficiency of light utilization for carbon assimilation (Baker
and Nie, 1994).
Another important finding of the present study is the confirmation of the effect of the QTL
under field conditions. The NILs exhibited a higher level of chilling tolerance in the field than
the chilling sensitive parent, ETH-DL3. The leaves of the NILs maintained a higher Fv/Fm,
ΦPSII, Fv'/Fm', CER and leaf greenness. This demonstrated that the introgressed allele from
ETH-DH7 at this QTL contributed to the development of functional chloroplasts and their
protection also under field conditions was expected from the previous QTL analysis of the F2:3
population (Jompuk et al., 2005).
Based on the above results it is clear that the introgression of the favorable allele from ETH-
DH7 into the near isogenic lines at chromosome 6 (bin 6.07) contributed towards the
development of a functional photosynthetic apparatus with a high quantum efficiency of PS II
for utilization and dissipation of light under suboptimal growth temperature. This may protect
the photosynthetic apparatus from further adverse effects of low temperature and might be
responsible for the higher photosynthetic activity of genotypes carrying the allele of ETH-
DH7 on chromosome 6. As was found in virescent mutants of maize, disturbances in the
development of the photosynthetic apparatus also have an effect on the photosynthetic activity
(on a chlorophyll basis) under non-limiting light conditions (Chollet and Paolillo, 1972).
Thus, the genes underlying the QTL must be involved in the development of the
photosynthetic apparatus and its protection at low temperature.

QTL analysis in a dent × flint mapping population
38
5 Validation of the major QTL for chilling tolerance of photosynthesis in a dent × flint maize population
5.1 Introduction A major limitation of the applications of identified QTLs in breeding programs is the lack of
consistency of the effects of QTL in different genetic background and/or across environments
(Kandemir et al., 2000; Lecomte et al., 2004). It is particularly relevant when evaluating QTL
effects for abiotic stress which are largely affected by many loci as well as by several
environmental factors. Thus, it is important to confirm QTL effects before implementing
MAS in breeding programs (Melchinger et al., 1998) or attempting to clone a QTL (Mackay,
2001). An accurate evaluation of the effects of a QTL is also beneficial before its cloning, a
resource-demanding undertaking, which can be facilitated when the effects of the QTL show
limited interactions with the environment (Salvi and Tuberosa, 2005). Furthermore, a QTL
with consistent effects across genetic backgrounds has a greater breeding value, particularly
when the favorable allele is not present in the elite germplasm. Results from QTL
confirmation experiments will generate new knowledge about the limitations and strengths of
using QTL in the MAS program. The plethora of QTL data will aid programs to improve
plants and future genomic studies but only when identified the QTL are proven to be real.
The conservation of QTL in different mapping populations exposed to similar stress
conditions indicates the importance of specific genomic regions in the stress response. Several
QTLs for chilling tolerance of photosynthesis in maize were identified in recent studies
(Fracheboud et al., 2002; Fracheboud et al., 2004; Jompuk et al., 2005; Pimentel et al., 2005).
In the ETH-DL3 × ETH-DH7 population, which is the object of this study, the major QTL for
chilling tolerance of photosynthesis was identified on the long arm of chromosome 6
(Fracheboud et al., 2004; Jompuk et al., 2005). Furthermore, a QTL for the minimal
chlorophyll fluorescence (Fo) was found near to this position in seedlings of the IBM302
mapping population (O. Guerra-Peraza, ETH Zurich, personal communication). However,
these QTLs on chromosome 6 were not co-localized with any other QTL for similar traits,
neither in the Ac7643 × Ac7729 (Fracheboud et al., 2002) nor in the W6786 × IL731A
mapping population (Pimentel et al., 2005). To obtain additional information about the
extension of this QTL within the maize germplasm, it is necessary to study additional
mapping populations. However, it will take considerable amount of time to develop,
genotype, and adequately phenotype additional mapping populations. An alternative to the

Chapter 5
39
conventional mapping of an entire population is the bulked segregant analysis, which is a
rapid method for confirming the presence of QTL quickly in other genetic background by
using two bulks of phenotypic extremes for the trait (Michelmore et al., 1991).
In view of these considerations, the present study was undertaken to evaluate the effects of the
QTL on chromosome 6 (bin 6.07) in an alternate F2 population derived from the cross ETH-
DL7 × ETH-FH6 by employing DNA pooling and selective genotyping of selected
individuals.
5.2 Materials and Methods 5.2.1 Plant material One hundred and seventy nine F2 lines, derived from a cross between ETH-DL7 and ETH-
FH6 were used in this study. The two parental lines were originally obtained by divergent
selection from a Swiss dent and flint maize breeding population using chlorophyll
fluorescence as the selection tool (Fracheboud et al., 1999). ETH-FH6 is a chilling tolerant
line of the flint maize type, which maintains higher photosynthetic activity at suboptimal
growth temperature, whereas ETH-DL7 is of the dent type and the photosynthetic activity of
which is poor at suboptimal temperature (Hund et al., 2005). The initial screening of 19
inbred lines, which were derived by divergent selection from Swiss dent and flint maize
breeding populations (Fracheboud et al., 1999) by means of SSR markers linked to the major
chilling tolerance QTLs located on chromosomes 2 and 6 (Fracheboud et al., 2004; Jompuk et
al., 2005), revealed high polymorphism between ETH-DL7 and ETH-FH6 at these loci.
Hence, the population based on these two lines was selected to confirm QTL for chilling
tolerance of photosynthesis in the present study.
5.2.2 Growth conditions Seedlings were germinated in 0.75 l pots containing a commercial mixture of soil, peat and
compost (Topf und Pikiererde 140, Ricoter, Aarberg, Switzerland) and grew at 25/22 °C
(day/night) temperature until the first leaf stage. Six days after sowing, the seedlings were
transferred to suboptimal growth temperature (15/13 °C, day/night) for 15 days. Starting from
the dark period between day 15 and 16, the temperature was decreased to 5/5 °C (day/night)
for two days followed by a recovery treatment for two days at 25/23°C (day/night); the
recovery was started at the beginning of the light period. Throughout the experiment, the light
intensity was 400 µmol m-2 s-1, the photoperiod of 12 hours and the relative humidity 60/70 %

QTL analysis in a dent × flint mapping population
40
(day/night). The plants were watered and fertilized with half-strength Wuxal nutrient solution
(0.2 %) as required. For further details see Chapter 3.
5.2.3 Measurement of chlorophyll fluorescence parameters The chlorophyll fluorescence parameters: minimum fluorescence (Fo), maximum fluorescence
(Fm), variable fluorescence (Fv) and maximum quantum efficiency of PS II (Fv/Fm) were
monitored with a PAM-2000 fluorometer (Walz, Effeltrich, Germany) after 30-60 min dark
adaptation. For details see Chapter 3.
5.2.4 DNA isolation and SSR marker assay DNA was isolated from 25 day old plants according to the method of Dellaporta et al. (1983)
(see also Chapter 3). The PCR using primers of publicly available SSR markers was
conducted as described in Chapter 3.
5.2.5 Bulk segregant analysis Phenotypic extreme plants were selected based on average ranking based on all the
measurements of the trait. This was done by ranking each Fv/Fm measurement. The plants
with highest and lowest average ranking based on all the measurements were considered
phenotypic extremes. Equal amounts of DNA from the phenotypic extremes were used to
constitute the bulks. The size of the bulks differed with 5, 10 and 15 individuals per bulk
(Govindaraj et al., 2005).
5.2.6 QTL mapping The genetic map was constructed using Mapmaker 3.0 (Lander et al., 1987) with the Haldane
mapping function. Based on this map, QTL analysis was carried out using QTL Cartographer
v.1.17b (Basten et al., 1994; Basten et al., 2003). The method of composite interval mapping
(CIM), model 6 of the Zmapqtl program module, was used to map QTLs and estimate their
effects (Jansen and Stam, 1994; Zeng, 1994), as described in Chapter 3.

Chapter 5
41
5.3 Results 5.3.1 Phenotypic analysis The time course for chlorophyll fluorescence parameters of the parental lines and the F2 plants
of the ETH-DL7 × ETH-FH6 population during growth at 15 °C, exposure to 5 °C and
recovery at 25 °C are presented in Figure 5.1. Throughout the experiment, all the leaves of
Leaf 4Leaf 2
F v/F
m
0.0
0.2
0.4
0.6
0.8
ETH-FH6 F2 populationETH-DL7
Leaf 315 5 25 15 5 25 15 5 25
F o
0.0
0.1
0.2
0.3
0.4
0.5
15
Time after transfer to 15°C (days)
5 10 15
F m
0.0
0.2
0.4
0.6
0.8
10 15
Figure 5.1: Time course of Fv/Fm, Fo and Fm in seedlings of ETH-FH6 (white symbols), ETH-DL7 (black symbols) and of the F2 population (grey symbols) in leaf 2 (circles), 3 (squares) and 4 (triangles) during growth at 15 °C, exposure to 5 °C and recovery at 25 °C. Values are means ± SD of 5 (parental lines) and 179 (F2 plants) replications, respectively.

QTL analysis in a dent × flint mapping population
42
ETH-FH6 had higher Fv/Fm values compared to ETH-DL7. The lower Fv/Fm of ETH-DL7
than ETH-FH6 was due to a higher Fo, while Fm was similar in both genotypes. The decrease
in growth temperature from 15 to 5 °C resulted in a substantial reduction in Fv/Fm in both
parental lines. However, the decrease in the Fv/Fm in ETH-FH6 was less pronounced than in
ETH-DL7, especially in leaves that developed at suboptimal temperature. The decrease in
Fv/Fm during exposure to 5 °C was accompanied by a considerable decrease in Fm and a slight
increase in Fo. The variance analysis revealed significant differences between the two parental
lines, ETH-FH6 and ETH-DL7, in Fv/Fm and Fo, but no significant difference in Fm (data not
shown). The response of Fv/Fm of seedlings of the F2 population to the different temperatures
was similar to that of the chilling tolerant genotype ETH-FH6, indicating that the major QTL
for chilling tolerance of photosynthesis is dominant in this population. Transgressive
segregation occurred in both directions (data not shown) implying that different positive
alleles for Fv/Fm exist in both parental lines and that a recombination of these positive alleles
would produce genotypes with enhanced tolerance to photoinhibition at 5 °C.
5.3.2 Bulk segregant analysis In order to identify polymorphic markers, a total of 300 SSR markers were used to screen the
parental lines, ETH-FH6 and ETH-DL7. Ninety SSR markers were found to be polymorphic
between the two parental lines and were used for the bulk segregant analysis. Among these 90
markers, only eight were putatively discriminating between the bulked extremes. These
markers were located on chromosomes 1, 2, 3 and 6. For an example, Figure 5.2 shows the
result of the bulk segregant analysis with the SSR markers bnlg1740 and umc1859. The
difference between the bulked extremes was clearer when the bulk included five individuals
bnlg1740
ETH
-DL7
ETH
-FH
6
5 10 15
L H L H L H
Bulk of
umc1859
ETH
-DL7
ETH
-FH
6
5 10 15
L H L H L H
Bulk of
bnlg1740
ETH
-DL7
ETH
-FH
6
5 10 15
L H L H L H
Bulk of
umc1859
ETH
-DL7
ETH
-FH
6
5 10 15
L H L H L H
Bulk of
Figure 5.2: Profile of the markers umc1859 (bin 6.06) and bnlg1740 (bin 6.07) for DNA bulks of the 5, 10 and 15 phenotypic extremes for Fv/Fm. L, F2 bulks with low Fv/Fm; H, F2bulks with high Fv/Fm.

Chapter 5
43
rather than 15. Based on the analysis of bulked extremes, the eight identified SSR markers
were used to establish the association between marker and Fv/Fm. The screening of the F2
individuals revealed a significant association between Fv/Fm and the SSR marker bnlg1740
indicating that a major QTL is located close to this position (Table 5.1).
5.3.3 Construction of molecular marker map and analysis of QTL In order to precisely map the QTL around bnlg1740 and to asses its genetic effect, additional
polymorphic markers including, 4 SSR and 1 IDP marker, were used to construct a linkage
Table 5.1: Markers associated with Fv/Fm of the 3rd leaf on day 15 based on one way ANOVA. The critical F value was 3.142.
Marker Allele Fv/Fm ANOVA result
Name Bin Name Count Mean Variance F calc. a P
mmc0011 1.06 HH 10 0.664 0.0019 0.312 0.7329 HL 38 0.666 0.0016 LL 18 0.658 0.0010
umc1306 1.09 HH 12 0.663 0.0027 2.046 0.1376 HL 43 0.659 0.0012 LL 11 0.684 0.0009
umc1797 1.12 HH 16 0.673 0.0007 0.731 0.4850 HL 40 0.663 0.0016 LL 10 0.655 0.0020
dupssr21 2.06 HH 14 0.663 0.0011 0.344 0.7098 HL 27 0.668 0.0018 LL 25 0.659 0.0015
phi127 2.07 HH 12 0.674 0.0014 0.563 0.5719 HL 38 0.661 0.0013 LL 25 0.659 0.0015
bnlg1447 3.03 HH 12 0.639 0.0020 1.973 0.146 HL 42 0.663 0.0019 LL 24 0.664 0.0007
umc1859 6.06 HH 13 0.671 0.0022 2.472 0.0925 HL 34 0.670 0.0011 LL 19 0.647 0.0015
bnlg1740 6.07 HH 20 0.676 0.0007 8.824 0.0004 HL 31 0.671 0.0012 LL 15 0.631 0.0019
a Significant at 1 % confidence level. LL, homozygous F2 lines inheriting allele from ETH-DL7; HH, homo-zygous F2 lines inherited allele from ETH-FH6; HL, heterozygous F2 lines inherited allele from both the parents.

QTL analysis in a dent × flint mapping population
44
map covering a length of 48.4 cM (Figure 5.3). Analysis of the marker and phenotypic data of
179 F2 lines were analyzed by composite interval mapping revealed a QTL for Fv/Fm and Fo.
It is probably located between bnlg1740 and umc1897, 2.8 cM from bnlg1740. The QTL
analysis revealed differential expression of the QTL across the three leaves (Figure 5.4). For
Fv/Fm and Fo in leaves at 15 °C, the QTL was insignificant in the second leaf but was strong
in the third and fourth leaves. The favorable allele (high Fv/Fm and low Fo) was inherited from
ETH-FH6. The QTL was also present for Fv/Fm and Fo in the third and fourth leaf at 5 °C and
25 °C but with a lower LOD score than at 15 °C, especially for Fv/Fm. For Fm, the LOD score
was always below the threshold of 3.5.
5.4 Discussion Prior using QTLs to improve elite germplasm through marker assisted breeding program, it is
necessary to confirm the significance of a QTL in other mapping populations and, thereby, to
identify the genotype carrying the most favorable allele for the trait of interest. With respect
to the latter, it was found that maize of the flint type is characterized by better chilling
tolerance than dent maize (e.g. Dolstra et al., 1988) and, therefore, might contain interesting
alleles to improve the chilling tolerance of maize seedlings. Hence, an attempt was made to
verify and characterize the effects of the major QTL for chilling tolerance of photosynthesis,
which was found to be located on chromosome 6 (bin 6.07) in the ETH-DL3 × ETH-DH7
population, in an independent F2 population derived from the cross of a chilling tolerant flint
line (ETH-FH6) and a chilling sensitive dent line (ETH-DL7). In order to avoid the
genotyping of the entire F2 population with polymorphic markers, a bulk segregant analysis
umc1063
umc1897
bnlg1740
AY109996
umc1653
14.9
13.3
5.2
14.9
Figure 5.3: Segmental map of the QTL region on chromosome 6 of the ETH-DL7 × ETH-FH6 population.

Chapter 5
45
(BSA) was conducted to identify genetic loci associated with photoinhibition during chilling
stress. In this method, the DNA of the phenotypic extremes for Fv/Fm was bulked as reported
by Zhang et al. (1994). A preliminary analysis involved a subset of F2 individuals with
phenotypic extremes; out of eight SSR markers, which differentiated the DNA bulks, only
one SSR maker, namely bnlg1740, significantly co-segregated with Fv/Fm. Nevertheless, the
identification of only one QTL based on BSA approach does not preclude the existence of
other loci of minor effect that BSA was not detected due to its low statistical power
(Missiaggia et al., 2005; Wang and Paterson, 1994). The QTL analysis of the 179 F2
individuals with five molecular markers localized in the putative QTL region confirmed the
15 5 25 15 5 25 15 5 25Leaf 4Leaf 2
F v/Fm (L
OD
, R2 )
0
10
20
30LOD scoreR2 (%)
Leaf 3
F o (LO
D, R
2 )
0
10
20
30
15
Time after transfer to 15°C (days)
5 10 15
F m (L
OD
, R2 )
0
10
20
30
10 15
Figure 5.4: Time course of the LOD score (closed symbols) and the phenotypic variance (R2
in %; open symbols) of the QTL at chromosome 6 for Fv/Fm, Fo and Fm in leaf 2 (circles), 3 (squares) and 4 (triangles) of seedlings of the ETH-DL7 × ETH-FH6 population during growth at 15 °C, exposure to 5 °C and recovery at 25 °C.

QTL analysis in a dent × flint mapping population
46
presence of this QTL near to SSR marker bnlg1740, similar to QTL-1 of the ETH-DL3 ×
ETH-DH7 population (see Chapters 2 and 3). Furthermore, the time course of this QTL
revealed very similar effects as found for QTL-1 in the ETH-DL3 × ETH-DH7 BC3F2
population (Chapter 3). Both populations expressed the QTL only in leaves that developed at
suboptimal temperature; furthermore the QTL was less important in both populations when
seedlings were exposed to more severe chilling/cold stress. Given the similar position and the
behavior of the QTL, it is assumed that the same gene (or cluster of genes) may underlie it.
Since ETH-DL3 and ETH-DL7 were derived from the same breeding population (Fracheboud
et al., 1999), the QTL was expressed in both populations due to a similar defect in the ETH-
DL7 and ETH-DL3 allele. a QTL for a higher chilling sensitivity. On the other hand, common
gene chilling tolerance may present across dent and flint lines, regulating the key step in the
development of functional photosynthetic apparatus under chilling stress conditions.
Whatever the cause, the conservation of this QTL in different mapping populations indicates
the importance of this genomic region for the development of a functional photosynthetic
apparatus at suboptimal temperature. However, this QTL was not found in earlier studies with
Ac7643 × Ac7729 (Fracheboud et al., 2002) and the SL × TH populations (Presterl et al.,
2007). Inconsistent QTL expression among mapping populations may have several reasons.
For example, the QTL for chilling tolerance of photosynthesis may exist in the Ac7643 ×
Ac7729 population but was not detected due to the very low marker resolution of the QTL
region in this population. In the SL × TH population, the traits measured for chilling tolerance
were virtually different from the traits measured in the ETH-DL3 × ETH-DH7 population in
which QTL was detected.
The results of the current study indicates that the SSR marker bnlg1740, which is closely
linked to the QTL on chromosome 6, should enable marker assisted selection for chilling
tolerance of photosynthesis if the correct genetic material is used. Since it was shown that
three markers are sufficient to control the QTL confidence interval by minimizing the risk of
"losing" the target allele (Bouchez et al., 2002), the use of the additional flanking markers,
umc1897 and AY10996, is advisable for marker assisted selection of this QTL. Nevertheless,
other monomorphic markers flanking the QTL in this mapping population may be useful for
screening the major QTL when they are polymorphic in the targeted populations.

Chapter 6
47
6 Comparative mapping and identification of candidate genes for the major QTL for chilling tolerance of photosynthesis
6.1 Introduction Chilling tolerance is a complex trait and seems to be controlled by multiple genes in maize
(Fracheboud et al., 2002; Fracheboud et al., 2004; Hund et al., 2005; Jompuk et al., 2005;
Pimentel et al., 2005; Presterl et al., 2007). Thus far, four mapping populations have been
used to identify the QTLs for chilling tolerance in maize. Co-localization of QTLs related to
chilling tolerance of photosynthesis have been proposed for the centromeric region of
chromosome 2 between the ETH-DL3 × ETH-DH7 and the Ac7643 × Ac7729 mapping
population (Fracheboud et al., 2004). This region on chromosome 2 was also found to be
involved in the chilling tolerance of photosynthesis in a part-exotic maize population (J.
Leipner, ETH Zurich, personal communication). With respect to the major QTL for chilling
tolerance of photosynthesis in the ETH-DL3 × ETH-DH7 population, which is localized on
chromosome 6, co-localization has been identified with the ETH-DL7 × ETH-FH6 population
(Chapter 5). Identification of co-localization not only provide information about the
importance of a QTL across different genetic backgrounds, but is also a good starting point
for identifying positional candidate genes and for narrowing the genetic region in which the
underlying gene(s) may be located, especially when high resolution mapping populations are
used.
Positional cloning of a QTL is a time consuming procedure and success is uncertain. This
procedure usually requires fine scale mapping and near isogenic lines of the individual QTL.
As an alternative, the candidate gene approach is a promising method for QTL cloning
especially when genes are known to control the same trait in other species (Collins et al.,
2008). To reduce the number of potential positional and functional candidate genes, results of
expression studies can be employed. The rationale behind this is that chilling induced genes
may ameliorate chilling stress, which implies that chilling induced genes may be genes for
tolerance to chilling. Various techniques have been used to identify chilling induced genes
and a number of these genes have been isolated from maize (e.g. Anderson et al., 1994;
Nguyen et al., 2009; Prasad et al., 1994).
This chapter described an attempt to exploit new data sources to identify putative candidate
genes underlying the QTL on chromosome 6. This was achieved by anchoring both ETH

Comparative mapping and identification of candidate genes
48
mapping populations to maize physical and sequence maps, and putative candidate genes
were identified based on a publicly available cold stress cDNA library.
6.2 Material and Methods 6.2.1 Comparative mapping The QTL mapping data based on the ETH-DL3 × ETH-DH7 (Chapter 2), the ETH-DL7 ×
ETH-FH6 (Chapter 5) and the IBM302 (B73 × Mo17) populations (O. Guerra-Peraza, ETH
Zurich, personal communication) were used for comparative mapping. To identify the map
region containing overlapping QTLs across populations, the maps were merged with common
anchor markers.
6.2.2 Bioinformatics To identify candidate genes, expressed sequence tags (ESTs), which are located in the QTL
region, were searched on the Gramene Curated AGI FPC Oct 2004 physical map
(http://www.gramene.org). A homology search was made with the obtained ESTs from the
above map against EST sequences from a cold stress cDNA library, which is available at the
National Center for Biotechnology Information (NCBI, http://www.ncbi.nlm.nih.gov). This
cDNA library was constructed from seedlings of the chilling tolerant inbred line CO328 (Lee
et al., 2002) exposed to low temperature by the Eastern Cereal and Oilseed Research Centre,
Ottawa, Canada (Singh et al., 2001). In brief, maize seedlings at the 4-leaf stage were exposed
to low temperature in combination with high light intensity (10 °C / 700-800 µmol m-2 s-1) for
4 days and a normalized cDNA library was constructed from mRNA obtained from the cold
stressed plants; furthermore, this cDNA library contained expressed sequence tags (ESTs)
which were obtained from seedlings exposed to gradual cooling down to 5 °C at low light
intensity (125 µmol m-2 s-1).
For ESTs of unknown function, a homology search was made using the basic local alignment
search tool at the NCBI was conducted by employing the blastx algorithm.
6.3 Results and Discussion QTL analyses of the ETH-DL3 × ETH-DH7 mapping population in its F2:3 generation have
revealed that the long arm of chromosome 6 harbors at least one major QTL for chilling
tolerance of photosynthesis (Chapter 2, Fracheboud et al., 2004; Jompuk et al., 2005). The
QTL analysis of this population in the BC3F2 generation gave further evidence that this

Chapter 6
49
chromosomal region contains two separate QTLs, namely QTL-1 near SSR marker bnlg1740
and QTL-2 between bnlg1136 and umc1653 (Chapter 3). Mapping of these QTLs and
comparison with the QTL analysis of the ETH-DL7 × ETH-FH6 population (Chapter 5)
indicate that the QTL found in the ETH-DL7 × ETH-FH6 population corresponds to QTL-1
in the ETH-DL3 × ETH-DH7 population, as shown for the trait minimal chlorophyll
fluorescence (Fo) in Figure 6.1. A comparison with the results of a QTL analysis using the
IBM302 population (O. Guerra-Peraza, ETH Zurich, personal communication) showed a co-
localization of a QTL for Fo in seedlings grown at 24/22 °C (day/night) with QTL-1 of the
ETH-DL3 × ETH-DH7 population as well as the QTL found in the ETH-DL7 × ETH-FH6
population (Figure 6.1). However, the QTL in the IBM302 population was further located
away from the SSR marker bnlg1740 than was the case in the other two mapping populations.
The SSR markers bnlg1136 and umc1653, which flank QTL-2 in the ETH-DL7 × ETH-FH6
population, are mapped in a region in which a QTL for Fo in seedlings of the IBM302
population grown at 17/13 °C and at 17/6 °C was identified. Although these QTLs overlap in
the three populations, it still remains to be determined whether they are controlled by the
same gene.
In order to identify potential candidate genes for this QTL region, the flanking SSR markers
Fo (17/6°C)Fo (17/13°C)
Fo (25°C)Fo (15°C)
bnlg
1732
umc1
859
bnlg
1740
bnlg
1136
umc1
653
umc2
324
Fo (15°C)
umc1
063
umc1
897
bnlg
1740
AY1
0999
6
umc1
653
Fo (24/22°C)
bnl
g173
2
um
c185
9
um
c106
3
bnl
g174
0
bnl
g113
6 u
mc1
653
ETH-DL7 × ETH-FH6
ETH-DL3 × ETH-DH7
IBM302
QTL-1 QTL-2
Figure 6.1: Comparative mapping of QTLs for Fo on the distal part of the long arm of chromosome 6 in the ETH-DL7 × ETH-FH6 (Chapter 5), the IBM302 (O. Guerra-Perza, personal communication) and the ETH-DL3 × ETH-DH7 mapping population (Chapter 2). The colored bars show the range of LOD score values from 0 in blue to 6 (ETH-DL7 × ETH-FH6), 10 (IBM302) and 17.5 (ETH-DL3 × ETH-DH7) in red.
Comparative mapping and identification of candidate genes
50
umc1859 and umc2324 were anchored to the Gramene Curated AGI FPC Oct 2004 physical
map. This region contained three EST contigs (ctg279, ctg280 and ctg281) and several BACs,
yielding a contiguous sequence region of around 8.5 Mbp within which 232 ESTs were
identified. In order to identify the putative candidate genes, a homology search was made with
the obtained 232 EST sequences with the EST sequences from the cold stress library (Singh et
al., 2001). This analysis revealed 33 putative cold induced ESTs, which are located in the
QTL region (Table 6.1).
Among these ESTs, several are involved in the catabolic metabolism. Pyruvate kinase is an
enzyme involved in glycolysis, while NAD-dependent isocitrate dehydrogenase, ATP citrate
lyase and aconitate hydratase are found in the tricarboxylic acid cycle. It was shown for
aconitate hydratase that it is highly sensitive to ROS and is down-regulated in Arabidopsis
during oxidative stress (Sweetlove et al., 2002). Although these enzymes play major roles in
the plant’s metabolism, it is unlikely that they are involved in the expression of the studied
QTL and may not be associated with chilling tolerance for photosynthesis.
Potential candidate genes that may explain the QTL for chilling tolerance of photosynthesis
are the proteins and enzymes which are directly involved in photosynthesis. One of these is
the gene for phosphoribulokinase, an enzyme which is part of the Calvin cycle and catalyzes
the generation of ribulose 1,5-bisphosphate. This gene was also found to be cold-induced in
one of the parental lines of the ETH dent population, namely ETH-DH7 (Nguyen et al., 2009).
However, its position on the map makes it less likely to be the underlying gene of one of the
QTLs on chromosome 6.
The gene psaH, which is located in the close vicinity of marker umc1897 and codes for
PS I-H subunit of PS I. It was shown for Arabidopsis that, in psaH-less mutants, energy can
not be transferred from PS II to PS I and that state transition is impaired (Lunde et al., 2000).
However, due to the fact that PS I is more stable than PS II when photoinhibition occurs
(Powles, 1984), thus, psaH may not be the candidate gene for the QTL.
Following page:
Table 6.1: List of ESTs in the QTL region between SSR marker umc1859 and umc2324 which show homology to ESTs from cold stress (CS) library of Singh et al. (2001) as well as their potential gene product identified by similarity search using the blastx algorithm. The positions of the ESTs and SSR markers correspond to the Gramene Curated AGI FPC Oct 2004 physical map.

Marker/EST Search result to CS EST lib. Search result by blastx Name Position Name E-value Annotation (Species) Accession E-value
umc1859 147509600 PCO083425 147509600 BG320414 9·e-12 Senescence-associated protein (O. sativa) ABF94900 1·e-123 PCO134372 151258100 BG320123 0 Hypothetical protein (O. sativa) EAZ13676 5·e-105 PCO125467 151782400 BG320691 3·e-53 Probable zinc finger protein (O. sativa) AAX92933 5·e-43 CL2757_5 151963700 BG320586 0 S-adenosylmethionine synthetase (O. sativa) CAJ45486 0 PCO079415 152012700 BG319765 0 Phosphoribulokinase (O. sativa) NP849912 6·e-146 PCO142167 152027400 BG321117 2·e-05 Zea root preferential 4 (Z. mays) NP_001066698 2·e-61 CL1479_1 153860000 BG321211 1·e-62 Zmhox1a homeobox protein (Z. mays) NP_001105447 0 CL34961_1 154041300 BG319996 0 Unknown (Z. mays) 2·e-31 CL187_5 154423500 BG320953 2·e-46 Hypothetical protein (O. sativa) EAZ35078 6·e-48 CL1166_1 154555800 BG321034 1·e-26 Cellulose synthase-1 (Z. mays) NP_001104954 0 PCO068622 154874300 BG320162 0 Putative 60S ribosomal protein L28 (O. sativa) BAD22882 5·e-66
umc1063 155080100 PCO089133 155246700 BG319632 1·e-154 Phosphatidylinositol transfer protein (O. sativa) BAD07999 0 PCO088717 156383500 BG321165 0 Hypothetical protein (O. sativa) EAY95622 2·e-11 PCO129762 156711800 BG320677 4·e-72 NAD-dependent isocitrate dehydrogenase (Z. mays) AAV39277 4·e-113 PCO099414 157045000 BG319800 0 Photosystem I complex PsaH subunit precursor (Z. mays) NP_001104905 0
umc1897 157089100 PCO073638 157299800 BG320981 1·e-163 Pyruvate kinase (A. thaliana) NP_566976 0 PCO150712 157397800 BG319952 0 Zein-alpha precursor (Z. mays) NP_001105941 0
bnlg1740 157608500 PCO080711 157657500 BG320382 0 ATP citrate lyase A-3 (A. thaliana) NP_172414 0 PCO099268 157760400 BG321261 0 Unknown (Z. mays) ACF78700 1·e-131 CL187_1 157843700 BG321115 0 Light harvesting chlorophyll a/b binding protein m7 (Z. mays) X53398 0 CL1288_1 157985800 BG320858 0 Thymidylate synthase (Z. mays) NP_001104916 0 PCO060210 157985800 BG319847 9·e-25 No similarity - - PCO068697 158167100 BG319945 0 Putative aconitate hydratase 1 (S. bicolor) ABE77202 0 CL2997_-2 158897200 BG320282 7·e-39 Hypothetical protein (O. sativa) EAZ28425 1·e-01 CL4121_1 158902100 BG320164 2·e-16 Mitogen-activated protein kinase (O. sativa) AAT39148 7·e-132
bnlg1136 158911900 umc1653 159156900
PCO086864 159524400 BG320128 0 Putative lipid transfer protein (O. sativa) BAD73499 8·e-38 PCO111918 159759600 BG319860 0 Putative polyprenyl diphosphate synthase (O. sativa) AAT44203 3·e-135 PCO060490 159769400 BG320274 0 Hypothetical protein (O. sativa) EAZ37586 2·e-44 PCO129004 159945800 BG320318 2·e-19 Putative adhesion regulating molecule family (O. sativa) NP_001056509 2·e-139
umc2324 162116500

Comparative mapping and identification of candidate genes
52
The position of the cab-m7 gene is very close to the SSR marker bnlg1740; codes for a light
harvesting chlorophyll a/b binding protein. The cab-m7 codes for the LHC II proteins
Lhcbm7, which is strongly preferentially expressed in maize mesophyll cells upon
illumination (Becker et al., 1992). In maize seedlings, growth at suboptimal temperature
induces changes in the chlorophyll a/b ratio, indicating a change in the proportion of LHC II
to the reaction center compared to the situation at optimal growth temperature (Haldimann et
al., 1995). It is interesting that, a QTL for the chlorophyll a/b ratio was identified near to
marker bnlg1740 in the ETH-DL3 × ETH-DH7 mapping population when seedlings grew at
suboptimal temperature (J. Leipner, ETH Zurich, personal communication). This QTL was
characterized by negative additivity, meaning that the allele of ETH-DH7 responded to a
lower chlorophyll a/b ratio and, consequently, to a greater proportion of the light harvesting
complex compared to the core complex; which could be explained by a differential expression
of cab-m7. Moreover, co-localization of Lhcb genes with QTLs for cold-induced photo-
inhibition in maize were also reported (Pimentel et al., 2005). However, without knowing the
exact function of Lhcbm7, in particular with respect to the regulation of photosynthesis, it is
only a speculation as to how Lhcbm7 affects the efficiency and capacity of the photosynthetic
apparatus of maize seedlings grown at suboptimal temperature.
Among the ESTs within the QTL region, another candidate gene was identified, which is not
present in the cold stress cDNA library. This EST (PCO153568) is located between bnlg1740
and bnlg1136 and shows homology (E-value of 7·e-39) with the serine protease DegP1 from
Arabidopsis (NP_189431). It was well documented that DegP1 plays an important role in the
repair of degraded D1 protein of the PS II reaction center (Kapri-Pardes et al., 2007) and,
therefore, could explain the changes in Fv/Fm since this parameter is strongly affected by
integrity of the D1 protein (Salonen et al., 1998).
It is already difficult to verify or identify putative candidate genes for chilling tolerance with
known functions; these problems increase, of course, with putative candidate genes of still
unknown functions in chilling tolerance. Clearly, for such a gene, fine mapping and functional
genomic experimentation will be required to clarify their candidacy.

Chapter 7
53
7 General Conclusions
The goal of the present study was to obtain a better understand of the significance of the
telomeric region of chromosome 6 for chilling tolerance of photosynthesis both on the
molecular and a physiological level. In a previous QTL analysis, Fracheboud et al. (2004)
identified a major QTL for chilling tolerance of photosynthesis on chromosome 6 at bin 6.07
in seedlings of the Swiss dent mapping population ETH-DL3 × ETH-DH7 grown at
suboptimal temperature under controlled conditions. Using the same population, Jompuk et al.
(2005) found a stable expression of this major QTL in varying cool temperature conditions in
the field. However, this QTL has been roughly placed on the linkage map with a large
confidence interval. Mapping with additional SSR markers in the QTL region revealed the
presence of another QTL in this region (Chapter 2). The considerable distance between the
QTLs as well as their different effects on the traits indicated that these two QTLs are separate.
The introgression of the QTL region of chromosome 6 (bin 6.07) of the chilling tolerant line
ETH-DH7 into the chilling sensitive line ETH-DL3 by marker assisted backcross breeding
using SSR markers for fore- and background selection was found to be efficient in
introgressing the desired allele into the recurrent parent. In the BC3F2 generation itself, plants
contained the ETH-DH7 allele at the target region while at the remaining genome was
completely recovered from ETH-DL3 (Chapter 3). In traditional backcross breeding, such a
complete recovery of the recurrent parent genome is possible only in the BC6 generation,
showing that the marker assisted selection significantly accelerated the development of near
isogenic lines.
The QTL analyses of the BC2F1, BC3F1 and BC3F2 generation confirmed that the introgressed
segment from ETH-DH7 at chromosome 6 had a stable effect on the chilling tolerance over
backcrossed generations.
The QTL analysis of the BC2F3 generation by composite interval mapping confirmed again
the presence of two separate QTLs in the telomeric region of chromosome 6 (Chapter 3).
Furthermore, the QTL mapping showed significant effects of QTL-1 on Fv/Fm, Fo, ΦPSII,
Fv'/Fm', CER and SPAD while QTL-2 was associated only with the traits Fv/Fm and Fo. The
QTL analysis in the BC3F2 generation revealed that QTL-1 had also an effect on the leaf
greenness (SPAD), which was not the case in the F2:3 population (Fracheboud et al., 2004;
Jompuk et al., 2005). This might be due to the fact that QTL analyses of a particular QTL in

General Conclusions
54
advanced backcrossed generations, such as BC3F2, have the advantage that they are un
affected by other QTLs.
The time course analysis showed that the QTLs were not expressed in leaves, which
developed at optimal growth temperature but were strongly expressed in leaves that
developed at suboptimal temperature (Chapter 3). The effects of the QTLs were weaker when
seedlings were exposed to more severe cold stress as well as during recovery at optimal
temperature. The differential behavior of the QTLs in different leaves indicated that these
QTLs were involved in the development of a functional photosynthetic apparatus at
suboptimal temperature. This conclusion is supported by the finding that near isogenic lines
(NILs), exhibited a much lower value of the quantum efficiency of light regulated by non-
photochemical losses (ΦNO), a measure of structural changes to the photosynthetic machinery
(Chapter 4). It seems that these changes resulted in a higher quantum efficiency of the open
PS II reaction centers (Fv'/Fm') and, partially higher fraction of open reaction PSII centers,
indicated by qP. Both resulted in higher operating quantum efficiency of PS II (ΦPSII) and
together with a greater amount of chlorophyll in a higher photosynthetic activity.
The time course analysis of the QTL, which was found in the dent × flint (ETH-DL7 × ETH-
FH6) mapping population at the same map position as QTL-1 in the ETH-DL3 × ETH-DH7
population, further supports the conclusion that these QTLs in the telomeric region of
chromosome 6 were involved in the development of a functional photosynthetic machinery at
low temperature (Chapter 5).
The co localization of the QTL region by comparative mapping of the ETH-DL3 × ETH-DH7
with the ETH-DL7 × ETH-FH6 and the IBM302 population allowed to perform an in silico
analysis, to identify putative candidate genes underlying these QTLs (Chapter 6). In
particular, two candidate genes in the close vicinity of the QTL peak explained the observed
phenotype. One of these candidate genes, namely cab-m7, codes for a light harvesting
complex II protein and may directly influence the composition of the photosynthetic
apparatus. The other candidate gene showed homology with the gene for the DegP1 protease
in Arabidopsis. This protein is involved in the turnover of D1 protein during photoinhibition,
an essential process for maintaining a functional PS II. The identification of these candidate
genes may be helpful in the future for cloning this QTL; a QTL that seems to be present
across the maize germplasm.

55
8 References
Anderson, M.D., Prasad, T.K., Martin, B.A., Stewart, C.R. 1994. Differential gene expression in chilling-acclimated maize seedlings and evidence for the involvement of abscisic acid in chilling tolerance. Plant Physiology 105: 331-339.
Armond, P.A., Schreiber, U., Björkman, O. 1978. Photosynthetic acclimation to temperature in desert shrub, Larrea divaricata II. Light harvesting efficiency and electron transport. Plant Physiology 61: 411-415.
Baker, N.R., Long, S.P., Ort, D.R. 1988. Photosynthesis and temperature with particular reference to effects on quantum yield. In: Long, S.P., Woodward, F.I. (eds) Plants and Temperature, pp. 347-375. Company of Biologists, Cambridge.
Baker, N.R., Ort, D.R. 1992. Light and crop photosynthetic performance. In: Baker, N.R., Thomas, H. (eds) Crop Photosynthesis: Spatial and Temporal Determinants, pp. 289-312. Elsevier Science Publishers, Amsterdam.
Baker, N.R., Farage, P.K., Stirling, C.M., Long, S.P. 1994. Photoinhibition of crop photosynthesis in the field at low temperature. In: Baker, N.R., Bowyer, J.R. (eds) Photoinhibition of photosynthesis: From molecular mechanisms to the field, pp. 349-363. Bios Scientific Publishers, Oxford.
Baker, N.R., Nie, G.Y. 1994. Chilling sensitivity of photosynthesis in miaze. In: Bajaj, Y.B.S. (ed) Biotechnology in Agriculture and Forestry: Maize, pp. 465-481. Springer, Berlin.
Baroja-Fernández, E., Muñoz, F.J., Akazawa, T., Pozueta-Romero, J. 2001. Reappraisal of the currently revailing model of starch biosynthesis in photosynthetic tissues: a proposal involving the cytosolic production of ADP-glucose by sucrose synthase and occurrence of cyclic turnover of starch in the chloroplast. Plant and Cell Physiology 42: 1311-1320.
Basten, C.J., Weir, B.S., Zeng, Z.-B. 1994. Zmap-a QTL cartographer. In: Smith, C., Gavora, J.S., Chesnais, B.B.J., Fairfull, W., Gibson, J.P., Kennedy, B.W., Burnside, E.B. (eds) Proceedings of the 5th World Congress on Genetics Applied to Livestock Production: Computing Strategies and Software, pp. 65-66, Guelph, Ontario, Canada.
Basten, C.J., Weir, B.S., Zeng, Z.-B. 2003. QTL cartographer; a reference manual and tutorial for QTL mapping. Department of Statistics, North Carolina State University, Raleigh, North Carolina, USA.
Beavis, W.D., Grant, D., Albertsen, M., Fincher, R. 1991. Quantitative trait loci for plant height in four maize populations and their associations with qualitative genetic loci. Theoretical and Applied Genetics 83: 141-145.
Becker, T.W., Templeman, T.S., Viret, J.F., Bogorad, L. 1992. The cab-m7 gene: a light-inducible, mesophyll-specific gene of maize. Plant Molecular Biology 20: 49-60.
Bernacchi, D., Beck-Bunn, T., Emmatty, D., Eshed, Y., Inai, S., Lopez, J., Petiard, V., Sayama, H., Uhlig, J., Zamir, D., Tanksley, S.D. 1998a. Advanced backcross QTL analysis of tomato. II. Evaluation of near-isogenic lines carrying single-donor introgressions for desirable wild QTL-alleles derived from Lycopersicon hirsutum and L. pimpinellifolium. Theoretical and Applied Genetics 97: 170-180.

56
Bernacchi, D., Beck-Bunn, T., Eshed, Y., Lopez, J., Petiard, V., Uhlig, J., Zamir, D., Tanksley, S.D. 1998b. Advanced backcross QTL analysis in tomato. I. Identification of QTLs for traits of agronomic importance from Lycopersicon hirsutum. Theoretical and Applied Genetics 97: 381-397.
Björkman, O., Demmig, B. 1987. Photon yield of O2 evolution and chlorophyll fluorescence characteristics at 77 K among vascular plants of diverse origins. Planta 170.
Bouchez, A., Hospital, F., Causse, M., Gallais, A., Charcosset, A. 2002. Marker-assisted introgression of favorable alleles at quantitative trait loci between maize elite lines. Genetics 162: 1945-1959.
Bravo, L.A., Gallardo, J., Navarrete, A., Olave, N., Martinez, J., Alberdi, M., Close, T.J., Corcuera, L.J. 2003. Cryoprotective activity of a cold-induced dehydrin purified from barley. Physiologia Plantarum 118: 262-269.
Carr, M.K.V., Hough, M.N. 1978. The influence of climate on maize production in north-western Europe. In: Bunting, E.S., Pain, B.F., Phipps, R.H., Wikinson, J.M., Gunn, R.E. (eds) Forage maize: production and utilisation, pp. 15-56. Agricultural Research Council, London.
Chaïb, J., Lecomte, L., Buret, M., Causse, M. 2006. Stability over genetic backgrounds, generations and years of quantitative trait locus (QTLs) for organoleptic quality in tomato. Theoretical and Applied Genetics 112: 934-944.
Chollet, R., Paolillo, D.J.J. 1972. Greening in a virescent mutant of maize. Pigment, ultrastructure and gas exchange studies. Zeitschrift für Pflanzenphysiologie 68: 30-44.
Collins, N.C., Tardieu, F., Tuberosa, R. 2008. Quantitative trait loci and crop performance under abiotic stress: Where do we stand? Plant Physiology 147: 469-486.
Dellaporta, S.L., Wood, J., Hicks, J.B. 1983. A plant DNA minipreparation: Version II. Plant Molecular Biology Reporter 1: 19-21.
Dingersdissen, A.L., Geiger, H.H., Lee, M., Schechert, A., Welz, H.G. 1996. Interval mapping of genes for quantitative resistance of maize to Setosphaeria turcica, cause of northern leaf blight, in tropical environment. Molecular Breeding 2: 143-156.
Doebley, J., Stec, A., Wendel, V., Edwards, W. 1990. Genetic and morphological analysis of a maize-teosinte F2 population: implications for the origin of maize. Proceedings of the National Academy of Sciences of the USA 87: 9888-9892.
Doebley, J., Stec, A. 1991. Genetic analysis of the morphological differences between maize and teosinte. Genetics 129: 285-295.
Doebley, J., Stec, A. 1993. Inheritance of morphological differences between maize and teosinte: comparison of results for two F2 populations. Genetics 134: 559-570.
Dolstra, O., Jongmans, M.A., de Jong, K. 1988. Improvement and significance of resistance to low-temperature damage in maize (Zea mays L.). I. Chlorosis resistance. Euphytica 39: 117-123.
Engels, C. 1994. Effect of root and shoot meristem temperature on shoot to root dry matter partitioning and the internal concentrations of nitrogen and carbohydrates in maize and wheat. Annals of Botany 73: 211-219.
Eshed, Y., Zamir, D. 1995. An introgression line population of Lycopersicon pennellii in the cultivated tomato enables the identification and fine mapping of yield-associated QTL. Genetics 141: 1147-1162.
57
Färber, A., Young, A.J., Ruban, A.V., Horton, P., Jahns, P. 1997. Dynamics of xanthophyll-cycle activity in different antenna subcomplexes in the photosynthetic membranes of higher plants. Plant Physiology 115: 1609-1618.
Fracheboud, Y., Haldimann, P., Leipner, J., Stamp, P. 1999. Chlorophyll fluorescence as a selection tool for cold tolerance of photosynthesis in maize (Zea mays L.). Journal of Experimental Botany 50: 1533-1540.
Fracheboud, Y., Ribaut, J.-M., Vargas, M., Messmer, R., Stamp, P. 2002. Identification of quantitative trait loci for cold-tolerance of photosynthesis in maize (Zea mays L.). Journal of Experimental Botany 53: 1967-1977.
Fracheboud, Y., Jompuk, C., Ribaut, J.-M., Stamp, P., Leipner, J. 2004. Genetic analysis of cold tolarnace of photosyntheis in miaze. Plant Molecular Biology 56: 241-253.
Frary, A., Nesbitt, T.C., Frary, A., Grandillo, S., Van der Knaap, E., Cong, B., Liu, J., Meller, J., Elber, R., Alpert, K.B., Tanksley, S.D. 2000. fw2.2: A quantitative trait locus key to the evolution of tomato fruit size. Science 289: 85-88.
Freymark, P.J., Lee, M., Woodmann, W.L., Martinson, C.A. 1993. Quantitative and qualitative trait loci affecting host response to Exserohilum turcicum in maize (Zea mays L.). Theoretical and Applied Genetics 87: 537-544.
Fridman, E., Pleban, T., Zamir, D. 2000. A recombination hotspot delimits a wild-species quantitative trait locus for tomato sugar content to 484 bp within an invertase gene Proceedings of the National Academy of Sciences of the USA 97: 4718-4723.
Frisch, M., Melchinger, A.E. 2001. Marker-assisted backcrossing for introgression of a recessive gene. Crop Science 41: 1485-1494.
Fryer, M.J., Andrews, J.R., Oxborough, K., Blowers, D.A., Baker, N.R. 1998. Relationship between CO2 assimilation, photosynthetic electron transport, and active O2 metabolism in leaves of maize in the field during periods of low temperature. Plant Physiology 116: 571-580.
Genty, B., Briantais, J.-M., Baker, N.R. 1989. The relationship between the quantum yield of photosynthetic electron transport and quenching of chlorophyll fluorescence. Biochimica et Biophysica Acta 990: 87-92.
Gilmore, A.M., Hazlett, T.L., Debrunner, P.G., Govindjee 1996. Comparative time-resolved photosystem II chlorophyll a fluorescence analyses reveal distinctive differences between photoinhibitory reaction center damage and xanthophyll cycle-dependent energy dissipation. Photochemistry and Photobiology 64: 552-563.
Govindaraj, P., Arumugachamy, S., Maheswaran, M. 2005. Bulked segregant analysis to detect main effect QTL associated with grain quality parameters in Basmati 370/ASD 16 cross cross in rice (Oryza sativa L) using SSR markers. Euphytica 144: 61-68.
Greaves, J.A. 1996. Improving suboptimal temperature tolerance in maize - The search for variation. Journal of Experimental Botany 47: 307-323.
Haldimann, P., Fracheboud, Y., Stamp, P. 1995. Carotenoid composition in Zea mays developed at sub-optimal temperature and different light intensities. Physiologia Plantarum 95: 409-414.
Hillel, J., Schaap, T., Haberfeld, A., Jeffreys, A.J., Plotzky, Y., Cahaner, A., Lavi, U. 1990. DNA fingerprint applied to gene introgression breeding programs. Genetics 124: 783-789.
58
Horváth, E.M., Peter, S.O., Joët, T., Rumeau, D., Cournac, L., Horváth, G.V., Kavanagh, T.A., Schäfer, C., Peltier, G., Medgyesy, P. 2000. Targeted inactivation of the plastid ndhB gene in tobacco results in an enhanced sensitivity of photosynthesis to moderate stomatal closure. Plant Physiology 123: 1337-1349.
Hospital, F., Chevalet, C., Mulsant, P. 1992. Using markers in gene introgression breeding programs. Genetics 132: 1199-1210.
Hund, A., Frascaroli, E., Leipner, J., Jompuk, C., Stamp, P., Fracheboud, Y. 2005. Cold tolerance of the photosynthetic apparatus: pleitropic relationship between photosynthetic performance and specific leaf area of maize seedlings. Molecular Breeding 16: 321-331.
Jansen, R.C., Stam, P. 1994. High resolution of quantitative traits into multiple loci via interval mapping. Genetics 136: 1447-1455.
Jompuk, C., Fracheboud, Y., Stamp, P., Leipner, J. 2005. Mapping of quantitative trait loci associated with chilling tolerance in maize (Zea mays L.) seedlings grown under field conditions. Journal of Experimental Botany 56: 1153-1163.
Kaeppler, S.M., Phillips, R.L., Kim, T.S. 1993. Use of near-isogenic lines derived by backcrossing or selfing to map qualitative traits Theoretical and Applied Genetics 87: 233-237.
Kandemir, N., Jones, B.L., Wesenberg, D.M., Ullrich, S.E., Kleinhofs, A. 2000. Marker-assisted analysis of three grain yield QTL in barley (Hordeum vulgare L.) using near isogenic lines. Molecular Breeding 6: 157-167.
Kapri-Pardes, E., Naveh, L., Adam, Z. 2007. The thylakoid lumen protease Deg1 is involved in the repair of photosystem II from photoinhibition in Arabidopsis. Plant Cell 19: 1039-1047.
Kearsey, M.J., Farquhar, A.G.L. 1998. QTL analysis in plants:where are we now? Heredity 80: 137-142.
Kitao, M., Lei, T.T. 2007. Circumvention of over-excitation of PSII by maintaining electron transport rate in leaves of four cotton genotypes developed under long-term drought. Plant Biology 9: 69-76.
Kole, C., Quijada, P., Michaels, S.D., Amasino, R.M., Osborn, T.C. 2001. Evidence for homology of flowering-time genes VFR2 from Brassica rapa and FLC from Arabidopsis thaliana. Theoretical and Applied Genetics 102: 425-430.
Kraja, A.T., Dudley, J.W. 2000. QTL analysis of two maize inbred line crosses. Maydica 45: 1-12.
Kramer, D.M., Johnson, G., Kiirats, O., Edwards, G. 2004. New fluorescence parameters for the determination of QA redox state and excitation energy fluxes. Photosynthesis Research 79: 209-218.
Lander, E.S., Green, P., Abrahamson, J., Barlow, A., Daly, M.J., Lincoln, S.E., Newburg, L. 1987. MAPMAKER: an interactive computer package for constructing primary genetic linkage maps of experimental and natural populations. Genomics 1: 174-181.
Lecomte, L., Duffé, P., Buret, M., Servin, B., Hospital, F., Causse, M. 2004. Marker-assisted introgression of five QTLs controlling fruit quality traits into three tomato lines revealed interactions between QTLs and genetic backgrounds. Theoretical and Applied Genetics 109: 658-668.

59
Lee, E.A., Staebler, M.A., Tollenaar, M. 2002. Genetic variation in physiological discriminators for cold tolerance - early autotrophic phase of maize development. Crop Science 42: 1919-1929.
Leipner, J., Fracheboud, Y., Stamp, P. 1999. Effect of growing season on the photosynthetic apparatus and leaf antioxidative defenses in two maize genotypes of different chilling tolerance. Environmental and Experimental Botany 42: 129-139.
Leipner, J., Jompuk, C., Camp, K.-H., Stamp, P., Fracheboud, Y. 2008. QTL studies reveal little relevance of chilling-related seedling traits for yield in maize. Theoretical and Applied Genetics 116: 555-562.
Li, Z., Jakkula, L., Hussey, R.S., Tamulonis, J.P. 2001. SSR mapping and confirmation of the QTL from PI96354 conditioning soybean resistance to southern root-knot nematode. Theoretical and Applied Genetics 103: 1167-1173.
Lin, H.X., Yamamoto, T., Sasaki, T., Yano, M. 2000. Characterization and detection of epistatic interactions of 3 QTLs, Hd1, Hd2, and Hd3, controlling heading date in rice using nearly isogenic lines. Theoretical and Applied Genetics 101: 1021-1028.
Long, S.P., East, T.M., Baker, N.R. 1983. Chilling damage to photosynthesis in young Zea mays. I. Effects of light and temperature variation on photosynthetic CO2 assimilation. Journal of Experimental Botany 34: 177-188.
Long, S.P., Humphries, S., Falkowski, P.G. 1994. Photoinhibition of photosynthesis in nature. Annual Review of Plant Physiology and Plant Molecular Biology 45: 633-662.
Lunde, C., Jensen, P.E., Haldrup, A., Knoetzel, J., Scheller, H.V. 2000. The PSI-H subunit of photosystem I is essential for state transitions in plant photosynthesis. Nature 408: 613-615.
Lyons, J.M. 1973. Chilling injury in plants. Annual Review of Plant Physiology 124: 445-466.
Mackay, T.F.C. 2001. Quantitative trait loci in Drosophila. Nature Reviews Genetics 2: 11-20.
Marocco, A., Lorenzoni, C., Fracheboud, Y. 2005. Chilling stress in maize. Maydica 50: 571-580.
Massacci, A., Iannelli, M.A., Pietrini, F., Loreto, F. 1995. The effect of growth at low temperature on photosynthetic characteristics and mechanisms of photoprotection of maize leaves. Journal of Experimental Botany 46: 119-127.
Melchinger, A.E., Utz, H.F., Schön, C.C. 1998. Quantitative trait locus (QTL) mapping using different testers and independent population samples in maize reveals low power of QTL detection and large bias in estimates of QTL effects. Genetics 149: 383-403.
Michelmore, R.W., Paran, I., Kesseli, R.V. 1991. Identification of markers linked to disease-resistance genes by bulked segregant analysis: A rapid method to detect markers in specific genomic regions by using segregating populations. Proceedings of the National Academy of Sciences of the USA 88: 9828-9832.
Miedema, P. 1982. The effects of low temperature on Zea mays L. Advances in Agronomy 35: 93-129.
Missiaggia, A.A., Piacezziand, A.L., Grattapaglia, D. 2005. Genetic mapping of Eef1, a major effect QTL for early flowering in Eucalyptus grandis. Tree Genetics & Genomes 1: 79-84.

60
Mohammadi, S.A., Prasanna, B.M., Singh, N.N. 2003. Sequential path model for determining interrelationships among grain yield and related characters in maize. Crop Science 43: 1690-1697.
Monforte, A.J., Tanksley, S.D. 2000. Fine mapping of a quantitative trait locus (QTL) from Lycopersicon hirsutum chromosome 1 affecting fruit characteristics and agronomic traits:breaking linkage among QTLs affecting different traits and dissection of heterosis for yield. Theoretical and Applied Genetics 100: 471-479.
Mutlu, N., Miklas, J., Reiser, J., Coyne, D.P. 2005. Backcross breeding for improved resistance to common bacterial blight in pinto bean (Phaseolus vulgaris L.). Plant Breeding 124: 282-287.
Nadeau, J.H., Singer, J.B., Matin, A., Lander, E.S. 2000. Analysing complex genetic traits with chromosome substitution strains. Nature Genetics 24: 221-225.
Nezer, C., Collette, C., Moreau, L., Brouwers, B., Kim, J., Giuffra, E., Buys, N., Andersson, L., Georges, M. 2003. Haplotype sharing refines the location of an imprinted quantitative trait locus with major effect on muscle mass to a 250-kb chromosome segment containing the porcine IGF2 gene. Genetics 165: 277-285.
Nguyen, H.T., Leipner, J., Stamp, P., Guerra-Peraza, O. 2009. Low temperature stress in maize (Zea mays L.) induces genes involved in photosynthesis and signal transduction as studied by suppression subtractive hybridization. Plant Physiology and Biochemistry 47: 116-122.
Nie, G.-Y., Baker, N.R. 1991. Modifications to thylakoid composition during development of maize leaves at low growth temperatures. Plant Physiology 95: 184-191.
Nie, G.-Y., Robertson, E.J., Freyer, M.J., Leech, R.M., Baker, N.R. 1995. Response of the photosynthetic apparatus in maize leaves grown at low temperature on transfer to normal growth temperature. Plant, Cell and Environment 18: 1-12.
Norman, J.M., Welles, J.M., McDermitt, D.K. 1992. Estimating canopy light-use and transpiration efficiency from leaf measurements. Licor Application Note #105.
Oxborough, K., Baker, N.R. 1997. Resolving chlorophyll a fluorescence images of photosynthetic efficiency into photochemical and non-photochemical components - calculation of qP and Fv'/Fm' without measuring Fo'. Photosynthesis Research 54: 135-142.
Pe, M.E., Gianfranceschi, L., Taramino, G., Tarchini, R., Angilini, P., Dani, M., Binelli, G. 1993. Mapping quantitative trait loci (QTLs) for resistance to Gibberella zeae infection in maize. Molecular & General Genetics 241: 11-16.
Perez-Brito, S., Jeffers, D., Gonzalez-de-Leon, D., Khairallah, M., Cortes-Cruz, G., Velasquez-Cardelas, G., Azpiroz-Rivero, S., Srinivasan, G. 2001. QTL mapping of Fusarium moniliforme ear rot resistance in highland maize, Mexico. Agrociencia 35: 181-196.
Phillips, R.L., Vasil, I.K. 1994. DNA-based markers in plants. Kluwer Academic Publishers, Dordrecht, The Netherlands.
Pimentel, C., Davey, P.A., Juvik, J.A., Long, S.P. 2005. Gene loci in maize influencing susceptibility to chilling dependent photoinhibition of photosynthesis. Photosynthesis Research 85: 319-326.

61
Powles, S.B. 1984. Photoinhibition of photosynthesis induced by visible light. Annual Review of Plant Physiology and Plant Molecular Biology 35: 15-44.
Prasad, T.K., Anderson, M.D., Martin, B.A., Stewart, C.R. 1994. Evidence for chilling-induced oxidative stress in maize seedlings and a regulatory role for hydrogen peroxide. Plant Cell 6: 65-74.
Presterl, T., Ouzunova, M., Schmidt, W., Möller, E.M., Röber, F.K., Knaak, C., Ernst, K., Westhoff, P., Geiger, H.H. 2007. Quantitative trait loci for early plant vigour of maize grown in chilly environments. Theoretical and Applied Genetics 114: 1059-1070.
Ragot, M., Sisco, P.H., Hoisington, D.A., Stuber, C.W. 1995. Molecular-marker-mediated characterization of favorable exotic alleles at quantitative trait loci in maize. Crop Science 35: 1306-1315.
Reddy, A.R., Ramakrishna, W., Sekhar, A.C., Ithal, N., Babu, P.R., Bonaldo, M.F., Soares, M.B., Bennetzen, J.L. 2001. Novel genes are enriched in normalized cDNA libraries from drought-stressed seedlings of rice (Oryza sativa L. subsp. indica cv. Nagina 22). Genome 45: 204-211.
Reyes-Valdés, M.H. 2000. A model for marker-based selection in gene introgression breeding programs. Crop Science 40: 91-98.
Ribaut, J.-M., Hoisington, D.A., Deutsch, J.A., Jiang, C., Gonzalez-de-Leon, D. 1996. Identification of quantitative trait loci under drought conditions in tropical maize. 1. Flowering parameters and the anthesis-silking interval. Theoretical and Applied Genetics 92: 905-914.
Ribaut, J.M., Hoisington, D. 1998. Marker assisted selection: new tools and strategies. Trends in Plant Science 3: 236-239.
Richner, W., Soldati, A., Stamp, P. 1996. Shoot to root relations in field-grown maize seedlings. Agronomy Journal 88: 56-61.
Robertson, E.J., Baker, N.R., Leech, R.M. 1993. Chlorophyll thylakoid protein changes induced by low growth temperature in maize revealed by immunocytology. Plant, Cell and Environment 16: 809-818.
Rosenqvist, E., Van Kooten, O. 2003. Chlorophyll fluorescence: a general description and nomenclature. In: DeEll, J.R., Toivonen, P.M.A. (eds) Practical Applications of Chlorophyll Fluorescence in Plant Biology, pp. 31-77. Kluwer Academic Publishers, Dordrecht.
Rozen, S., Skaletsky, H.J. 2000. Primer3 on the WWW for general users and for biologist programmers. In: Krawetz, S., Misener, S. (eds) Bioinformatics Methods and Protocols: Methods in Molecular Biology, pp. 365-386. Humana Press, Totowa, NJ.
Rymen, B., Fiorani, F., Kartal, F., Vandepoele, K., Inzé, D., Beemster, G.T.S. 2007. Cold nights impair leaf growth and cell cycle progression in maize through transcriptional changes of cell cycle genes. Plant Physiology 143: 1429-1438.
Salonen, M., Aro, E.-M., Rintamäki, E. 1998. Reversible phosphorylation and turnover of the D1 protein under various redox states of Photosystem II induced by low temperature photoinhibition. Photosynthesis Research 58: 143-151.
Salvi, S., Tuberosa, R. 2005. To clone or not to clone plant QTLs: present and future challenges. Trends in Plant Science 10: 297-304.

62
Sambrook, J., Russell, D.W. 2001. Molecular Cloning: A Laboratory Manual. Cold Spring Harbor Laboratory Press, New York.
Saranga, Y., Jiang, C.-X., Wright, R.J., Yakir, D., Paterson, A.H. 2004. Genetic dissection of cotton physiological responses to arid conditions and their inter-relationships with productivity. Plant, Cell and Environment 27: 263-277.
Singh, J.A., Wakui, K., Couroux, P., De Moors, A., Harris, L.J., Hattori, J.I., Ouellet, T., Robert, L.S., Sprott, D., Tinker, N.A.: Expressed sequence tags from cold-stressed maize seedlings. GenBank, National Center for Biotechnology Information (2001).
Stamp, P. 1981. Activities of PEP and RuBP carboxylase and pigment content in leaves of maize seedlings in relation to genotype and growing temperature. Journal of Plant Breeding 86: 20-32.
Stamp, P. 1986. Chilling stress in maize. In: Dolstra, O., Miedema, P. (eds) Breeding of silage maize, pp. 43-50. Eucarpia Proceeding, Wageningen.
Stirling, C.M., Nie, G.-Y., Aguilera, C., Nugawela, A., Long, S.P., Baker, N.R. 1991. Photosynthetic productivity of an immature maize crop: changes in quantum yield of CO2 assimilation, conversion efficiency and thylakoid proteins. Plant, Cell and Environment 14: 947-954.
Stirling, C.M., Rodrigo, V.H., Emberru, J. 1993. Chilling and photosynthetic productivity of field grown maize (Zea mays); changes in the parameters of the light-response curve, canopy leaf CO2 assimilation rate and crop radiation-use efficiency. Photosynthesis Research 38: 125-133.
Stone, P.J., Sorensen, I.B., Jamieson, P.D. 1999. Effect of soil temperature on phenology, canopy development, biomass and yield of maize in a cool-temperate climate. Field Crops Research 63: 169-178.
Sweetlove, L.J., Heazlewood, J.L., Herald, V., Holtzapffel, R., Day, D.A., Leaver, C.J., Millar, A.H. 2002. The impact of oxidative stress on Arabidopsis mitochondria. The Plant Journal 32: 891-904.
Tajima, T., Noguchi, S., Tanoue, W., Negishi, H., Nakakawaji, T., Ohno, T. 2002. Background selection using DNA markers in backcross breeding program for potato virus Y resistance of tobacco. Breeding Science 52: 253-257.
Tang, A.-C., Boyer, J.S. 2002. Growth-induced water potentials and the growth of maize leaves. Journal of Experimental Botany 53: 489-503.
Tanksley, S.D., Nelson, J.C. 1996. Advanced backcross QTL analysis: a method for the simultaneous discovery and transfer of valuable QTLs from unadapted germplasm into elite breeding lines. Theoretical and Applied Genetics 92: 191-203.
Thabuis, A., Palloix, A., Servin, B., Daubèze, A.M., Signoret, P., Hospital, F., Lefebvre, V. 2004. Marker assisted introgression of 4 Phytophthora capsici resistance QTL alleles into a bell pepper line: validation of additive and epistatic effects. Molecular Breeding 14: 9-20.
Tuberosa, R., Salvi, S., Sanguienti, M.C., Landi, P., Maccaferri, M., Conti, S. 2002a. Mapping QTLs regulating morpho-physiological traits and yield in drought-stressed maize: case studies, shortcomings and perspectives. Annals of Botany 89: 941-963.
Tuberosa, R., Salvi, S., Sanguineti, M.C., Landi, P., MacCaferri, M., Conti, S. 2002b. Mapping QTLs regulating morpho-physiological traits and yield: case studies, shortcomings and perspectives in drought-stressed maize. Annals of Botany 89: 941-963.

63
Tuinstra, M.R., Ejeta, G., Goldsbrough, P.B. 1997. Heterogeneous inbred family (HIF) analysis: a method for developing near-isogenic lines that differ at quantitative trait loci. Theoretical and Applied Genetics 95: 1005-1011.
Van Berloo, R., Aalbers, H., Werkman, A., Niks, R.E. 2001. Resistance QTL confirmed through development of QTL-NILs for barley leaf rust resistance. Molecular Breeding 8: 187-195.
Visscher, P.M., Haley, C.S., Thompson, R. 1996. Marker-assisted introgression in backcross breeding programs. Genetics 144: 1923-1932.
Vladutu, C., McLaughlin, J., Phillips, R.L. 1999. Fine mapping and characterization of linked quantitative trait loci involved in the transition of the maize apical meristem from vegetative to generative structures. Genetics 153: 993-1007.
Wang, G.L., Paterson, A.H. 1994. Assessment of DNA pooling strategies for mapping of QTLs. Theoretical and Applied Genetics 88: 355-361.
Yano, M. 2001. Genetic and molecular dissection of naturally occurring variation. Current Opinion in Plant Biology 4: 130-135.
Ying, J., Lee, E.A., Tollenaar, M. 2000. Response of maize leaf photosynthesis to low temperature during the grain-filling period. Field Crops Research 68: 87-96.
Zeng, Z.-B. 1994. Precision mapping of quantitative trait loci. Genetics 136: 1457-1468.
Zhang, Q., Shen, B.Z., Dai, X.K., Mei, M.H., Saghai Maroof, M.A., Li, Z.B. 1994. Using bulked extremes and recessive class to map genes for photoperiod-sensitive genic male sterility in rice. Proceedings of the National Academy of Sciences of the USA 91: 8675-8679.
Zheng, K., Subudhi, P., Domingo, J., Magpantay, G., Huang, N. 1995. Rapid DNA isolation for marker assisted selection in rice breeding. Rice Genetics Newsletter 12: 255-258.

64
9 Appendix
Table A.1: Statistical analysis of the light response curves of carbon exchange rate (CER), operating quantum efficiency of PS II (ΦPSII), efficiency of open PS II reaction centers (Fv'/Fm'), photochemical quenching factor (qP), quantum efficiency for dissipation by down regulation (ΦNPQ), and quantum efficiency of other non-photochemical losses (ΦNO) in the chilling tolerant line ETH-DH7, chilling sensitive line ETH-DL3 and the near isogenic lines NIL152 and NIL146. Significant differences (P < 0.05) for pair-wise comparisons within the photon flux density (PPFD) are indicated by different letters. Empty rows indicate no significant differences.
Comparison at 25 °C Comparison at 15 °C
Trait PPFD ETH
-DH
7
NIL
146
NIL
152
ETH
-DL3
ETH
-DH
7
NIL
146
NIL
152
ETH
-DL3
CER 50 100 200 a ab ab b 400 a ab ab b 800 a ab ab b 1200 a ab a b 1600 ab ab b a a ab a b
ΦPSII 50 a ab a b 100 a ab a b 200 a ab a b 400 a a a b 800 b ab b a a a a b 1200 ab ab b a a a a b 1600 ab ab b a a a a b
Fv'/Fm' 50 a ab a b 100 a ab a b 200 a a a b 400 a b ab c 800 b ab b a a b ab c 1200 ab ab b a a b ab c 1600 ab ab b a a b ab c
qP 50 a ab a b 100 a ab a b 200 ab a ab b a a a b 400 b a b ab a a a b 800 b ab b a a a a b 1200 ab ab b a a a a b 1600 ab ab b a a a a b

65
Table A.1: continuation.
Comparison at 25 °C Comparison at 15 °C
Trait PPFD ETH
-DH
7
NIL
146
NIL
152
ETH
-DL3
ETH
-DH
7
NIL
146
NIL
152
ETH
-DL3
ΦNPQ 50 ab ab b a 100 200 ab ab b a b ab ab a 400 800 1200 b ab ab a 1600 b ab ab a
ΦNO 50 a ab a b b b b a 100 ab ab a b c ab bc a 200 ab ab a b b ab b a 400 ab ab a b b ab b a 800 ab ab a b b ab b a 1200 ab b a b b ab b a 1600 ab b a b b ab b a

66
Acknowledgements
I very much appreciate Prof. Dr. Peter Stamp for his guidance, constant support and
encouragement while carrying out the research work. Without his unflinching support and
guidance, this thesis would not have been possible.
I express my heartfelt indebtedness to my supervisor, Dr. Jörg Leipner. He has guided me like
a beacon of light and has been a persistent source of encouragement throughout the entire
investigation. His suggestions in the planning and executing of the experiments have been
most helpful. His supervision gave me a sense of freedom, has broadened my scientific
outlook and inculcated a positive attitude in me. I would also like to thank him for his great
support during the writing of this thesis.
I would like thank my co-examiner Dr. Christof Sautter for his willingness to read the thesis
and to deliver his comments in a short period of time.
I would like to thank Dr. Yvan Fracheboud and Dr. Choosak Jompuk for providing valuable
basic data.
The support and help of Ernst Merz in the field and Brigitta Pichler in the glasshouse related
to the research study was indeed significant and is gratefully acknowledged.
I acknowledge with gratitude the active support and help given by Marianne Wettstein-Bättig
and Susanne Hochmann. They offered useful suggestions and active help in carrying out the
experiments in the laboratory. Without their help, it would have been very difficult for me to
bring this study to a logical conclusion.
I would also like to place on record my gratitude to all the members of the Group of
Agronomy and Plant Breeding for their encouragement and support. Special thanks go to
Sami for his help in solving statistical problems and Rainer for his suggestions.
I am thankful to the Swiss Federal Commission of Scholarship for Foreign Students and the
Swiss Federal Institute of Technology for their financial support.
I would like to place on record my sincerest gratitude to Chiesa Verena, Fredy Hubmann, and
Elisabeth Schniderlin for their support and encouragement.
The support received from my parents, Mr. Mahadevapa Biradar and Mrs. Ratnamma Biradar
has been significant and I would like to thank them for understanding the nature of my
research work, bearing with me through all these years and for motivating me to achieve my
objectives.
67
I consider myself fortunate to have Shashirekha as my partner in life. Words cannot express
the depth of my affection and gratitude to her; she has displayed enormous strength, patience,
courage and perseverance in supporting me during my studies. Without her love and support I
would not have completed my PhD work. She deserves credit for all my success. During the
final phases of the research work, we were blessed with the birth of our daughter Ananya,
who will motivate both of us to achieve very best in the future.
Last but not least; I thank the Almighty for all his blessings and for helping me to achieve the
satisfactory completion of my research.
Sunil

68
Curriculum Vitae
Name: Biradar, Sunil Kumar
Date of birth: 01 June 1976
Place of birth: Bidar, India
Citizen of: India
Civil status: Married
1981-1989 Primary school 1989-1992 Secondary school 1992-1994 Pre-university 1994-1998 B. Sc. in Agricultural Sciences. University of Agricultural Sciences, Dharwad,
India 1998-2000 M. Sc. in Agricultural Sciences (Genetics and Plant Breeding). University of
Agricultural Sciences, Dharwad, India. 2000-2001 Apprenticeship on molecular markers studies at ICRISAT, India 2001-2004 Research Associate at Directorate of Rice Research, India 2004-2008 Doctoral student at Swiss Federal Institute of Technology Zurich, Switzerland