Embed Size (px)
Citation preview

Molecular and cellular analysis of adult plant
resistance in wheat to Puccinia graminis f. sp. tritici
Howard Dean Castelyn
A thesis submitted in fulfilment of the requirements for the degree Philosophiae Doctor,
Department of Plant Sciences, University of the Free State, Bloemfontein, South Africa
2018
Promoter:
Z.A. Pretorius
Department of Plant Sciences, University of the Free State, Bloemfontein, South Africa
Co-promoter:
B. Visser
Department of Plant Sciences, University of the Free State, Bloemfontein, South Africa
Co-promoter:
L.A. Boyd
National Institute of Agricultural Botany, Cambridge, United Kingdom

ii
Table of Contents
Declaration ............................................................................................................................... vii
Acknowledgements ................................................................................................................. viii
List of abbreviations ................................................................................................................. ix
List of figures .......................................................................................................................... xiii
List of tables ........................................................................................................................... xxii
List of supplementary material ............................................................................................. xxiv
Abstract ................................................................................................................................. xxxi
Chapter 1: Introduction ............................................................................................................. 1
Chapter 2: Literature review ...................................................................................................... 6
2.1 The impact of rust diseases on wheat production .................................................... 7
2.2 Stem rust on wheat caused by Puccinia graminis f. sp. tritici ................................ 7
2.2.1 The life cycle of Puccinia spp. ............................................................................. 7
2.2.2 Race nomenclature systems for Puccinia graminis f. sp. tritici ......................... 10
2.2.3 The spread of and recent epidemics of stem rust ................................................ 11
2.2.3.1 The ‘Ug99’ race group ..................................................................................... 11
2.2.3.2 Non-‘Ug99’ races............................................................................................. 12
2.3 Pathogen effectors .................................................................................................. 13
2.3.1 Identification and mechanisms of effectors. ....................................................... 13
2.3.2 Effectoromics ...................................................................................................... 15
2.3.3 Validation of effector mechanisms ..................................................................... 16
2.4 Plant defence .......................................................................................................... 17
2.4.1 Constitutive defence responses ........................................................................... 17

iii
2.4.2 Inducible defence responses ............................................................................... 17
2.4.3 Acquired resistance ............................................................................................. 21
2.5 Modes of plant resistance....................................................................................... 22
2.5.1 Non-host resistance ............................................................................................. 22
2.5.2 Race-specific/R gene resistance .......................................................................... 24
2.5.2.1 R gene products as nucleotide-binding and a leucine-rich repeat proteins ...... 24
2.5.2.2 Functioning of nucleotide-binding and a leucine-rich repeat proteins. ........... 26
2.5.2.3 Durability of R gene resistance ........................................................................ 29
2.5.3 Race non-specific/adult plant resistance ............................................................. 30
Chapter 3: Experimental layout of greenhouse trials and inoculation methods ...................... 33
3.1 Introduction ............................................................................................................ 34
3.2 Materials and methods .......................................................................................... 35
3.2.1 Plant and pathogen materials. ............................................................................. 35
3.2.2 Wheat growing conditions and urediniospore multiplication ............................. 35
3.2.3 Seedling trial ....................................................................................................... 38
3.2.4 Adult plant trials ................................................................................................. 38
3.3 Results .................................................................................................................... 42
3.3.1 Seedling trial ....................................................................................................... 42
3.3.2 Adult plant trials ................................................................................................. 42
3.4 Discussion .............................................................................................................. 54
Chapter 4: Histological observations of Puccinia graminis f. sp. tritici colonization in adult
wheat lines ............................................................................................................................... 56
4.1 Introduction ............................................................................................................ 57
4.2 Materials and methods ........................................................................................... 64
4.2.1 Biological material .............................................................................................. 64

iv
4.2.2 Scanning electron microscopy ............................................................................ 64
4.2.3 Fluorescence microscopy .................................................................................... 65
4.2.4 Cross-sectioning of last internodes .................................................................... 66
4.3 Results .................................................................................................................... 68
4.3.1 Initial microscopic experimentation ................................................................... 68
4.3.2 Scanning electron microscopy ............................................................................ 68
4.3.3 Fluorescence microscopy .................................................................................... 69
4.3.4 Cross-sectioning of last internodes ..................................................................... 82
4.4 Discussion .............................................................................................................. 88
Chapter 5: Molecular quantification of Puccinia graminis f. sp. tritici biomass and
haustorium formation in adult wheat plants ............................................................................ 95
5.1 Introduction ........................................................................................................... 96
5.2 Materials and methods .......................................................................................... 99
5.2.1 Biological material .............................................................................................. 99
5.2.2 Chitin quantification by fluorescence analysis ................................................... 99
5.2.3 Relative gene quantification analysis ................................................................ 100
5.2.3.1 Total RNA extraction ..................................................................................... 100
5.2.3.2 Reverse transcriptase quantitative polymerase chain reaction ...................... 100
5.2.4 Sequence analysis of PGTG_11318 .................................................................. 102
5.2.4.1 Sequencing of PGTG_11318 ......................................................................... 102
5.2.4.2 Computational analysis of PGTG_11318 ...................................................... 104
5.3 Results ................................................................................................................. 108
5.3.1 Chitin quantification by fluorescence analysis ................................................ 108
5.3.2 General reverse transcriptase quantitative polymerase chain reaction results and
reference gene validation .......................................................................................... 108
5.3.3 Puccinia graminis f. sp. tritici β-tubulin transcript quantification ................... 109
5.3.4 Sequence analysis of PGTG_11318 .................................................................. 111

v
5.3.5 PGTG_11318 transcript quantification ............................................................. 122
5.4 Discussion ........................................................................................................... 132
Chapter 6: An analysis of transcriptomic changes in adult wheat lines upon Puccinia
graminis f. sp. tritici infection .............................................................................................. 142
6.1 Introduction ......................................................................................................... 143
6.2 Materials and methods ........................................................................................ 145
6.2.1 Biological material ............................................................................................ 145
6.2.2 RNA sequencing .............................................................................................. 145
6.2.2.1 Total RNA extraction .................................................................................... 145
6.2.2.2 Illumina sequencing ....................................................................................... 145
6.2.2.3 Ion Torrent sequencing .................................................................................. 146
6.2.2.4 Reference transcriptomes ............................................................................... 146
6.2.2.5 Sequencing platform comparison .................................................................. 146
6.2.2.6 Ion Torrent transcriptome analysis ................................................................ 147
6.2.2 Note on transcript abbreviation convention ...................................................... 149
6.3 Results .................................................................................................................. 152
6.3.1 Cross-mapping between wheat and Puccinia graminis f. sp. tritici reference
transcriptomes ............................................................................................................ 152
6.3.2 Sequencing platform comparison .................................................................... 152
6.3.3 Ion Torrent transcriptomic analysis .................................................................. 157
6.3.3.1 The time vs time comparison ......................................................................... 157
6.3.3.1.1 Differential expression of wheat transcripts ............................................... 157
6.3.3.1.2 Differential expression of Puccinia graminis f. sp. tritici transcripts ......... 167
6.3.3.2 The line vs line comparison ........................................................................... 175
6.3.3.2.1 Differentially expressed wheat transcripts .................................................. 175
6.3.3.2.2 Differentially expressed Puccinia graminis f. sp. tritici transcripts ........... 184

vi
6.4 Discussion ........................................................................................................... 185
Chapter 7: Conclusions .......................................................................................................... 193
References .............................................................................................................................. 199

vii
Declaration
(i) I, Howard Dean Castelyn, declare that the Doctoral Degree research thesis that I herewith
submit for the Doctoral Degree qualification Botany at the University of the Free State is my
independent work and that I have not previously submitted it for a qualification at another
institution of higher education.
(ii) I, Howard Dean Castelyn, hereby declare that I am aware that the copyright is vested in
the University of the Free State.
(iii) I, Howard Dean Castelyn, hereby declare that all royalties as regards intellectual property
that was developed during the course of and/or in connection with the study at the University
of the Free State, will accrue to the University.
Howard Dean Castelyn

viii
Acknowledgements
I would like to express appreciation to my promoter Prof Zakkie Pretorius and my co-
promoters Prof Botma Visser and Dr Lesley Boyd for your guidance. Your expertise in the
respective fields was invaluable to my project and your continuous support was crucial to my
development as a researcher. I can but only hope to someday emulate your professionalism,
work ethic and meticulousness as researchers.
The work was supported in part by the UK Biotechnology and Biological Sciences Research
Council (BBSRC) special initiative: Sustainable Crop Production Research for International
Development (SCPRID) Project BB/J011525/1. Without this contribution the project would
not have been possible.
I am deeply grateful to the Prestige Doctoral Programme and the South African Research
Chairs Initiative (SARChI) in Disease Resistance and Quality in Field Crops at the University
of the Free State (UFS) for financial assistance during the course of my study.
A travel grant from the European and Mediterranean Cereal Rusts Foundation (EMCRF)
allowed me to attend an international conference; an opportunity for which I am truly
grateful.
I am grateful to the Department of Plant Sciences (UFS) for the use of their facilities and for
creating a work environment that promotes research excellence. Appreciation must be
extended to the National Institute of Agricultural Botany (NIAB) for hosting me at your
esteemed institution and giving me the opportunity to acquire essential research skills.
Special recognition must go to Dr Nelzo Ereful (NIAB) and Louis Lategan du Preez (UFS)
for helping me develop bioinformatics skills and imparting to me a deep admiration for this
research tool.
I am eternally thankful to family and friends, whose encouragement gave me personal
support beyond the academic field.
My sincerest appreciation goes to my dear wife Sarada for your continuous patience and
motivation during the course of my study. Only you know the full extent of the challenges we
faced, but together we overcame them all.

ix
List of abbreviations
ABC Adenosine triphosphate-binding cassette
APR Adult plant resistance
AR Acquired resistance
ATP Adenosine triphosphate
Avr Avirulence
CC-NB-LRR Coiled-coil, nucleotide-binding and a leucine-rich repeat
DE Differentially expressed
DH Doubled haploid
DMPC Dimethyldicarbonate
dpi Days post inoculation
CTP Chloroplast-targeted proteins
ECM Extracellular matrix
EDTA Ethylenediaminetetraacetic acid
EHM Extrahaustorial matrix
ELISA Enzyme-linked immunosorbent assay
EST Expressed sequence tag
ETI Effector triggered immunity
ETS Effector triggered susceptibility
FC Fold change
FDR False discovery rate
GO Gene ontology
GWAS Genome-wide association analysis
HIGS Host-induced gene silencing

x
HMC Haustorial mother cell
hpi Hours post inoculation
HR Hypersensitive response
IH Infection hyphae
JA Jasmonic acid
LAR Localised acquired resistance
LB Lysogeny broth
M Mean expression stability
MOPS 3-(N-Morpholino)propanesulfonic acid
MR Moderately resistant
MRMS Moderately resistant to moderately susceptible
MS Moderately susceptible
NB-LRR Nucleotide-binding and a leucine-rich repeat
NCBI National Center for Biotechnology Information
NGS Next generation sequencing
NHR Non-host resistance
nt nucleotides
PAL Phenylalanine-ammonia lyase
PAMP Pathogen associated molecular pattern
PCA Principal component analysis
Pgt Puccinia graminis f. sp. tritici
Pgt-BTUB Puccinia graminis f. sp. tritici β-tubulin
PR Pathogen-related
PRR Pattern-recognition receptor
Pst Puccinia striiformis f. sp. tritici
Pt Puccinia triticina
PTI Pathogen associated molecular pattern triggered immunity

xi
qPCR Quantitative polymerase chain reaction
QTL Quantitative trait loci
R Resistance
RenSeq Resistance gene enrichment sequencing
RLK Receptor-like protein kinase
RLP Receptor-like proteins
RMR Resistant to moderately resistant
RNA-seq RNA sequencing
ROS Reactive oxygen species
rpm Revolutions per minute
RTP Rust fungi transferred proteins
RT-qPCR Reverse transcriptase quantitative polymerase chain reaction
R-Avr Resistance-avirulence
S Susceptible
SA Salicylic acid
SAR Systemic acquired resistance
SEM Scanning electron microscopy
SNP Single nucleotide polymorphism
SSV Sub-stomatal vesicle
Ta-18S Triticum aestivum 18S ribosomal RNA
Ta-BTUB Triticum aestivum β-tubulin
Ta-CDC Triticum aestivum cell division control protein
Ta-TEF Triticum aestivum transcription elongation factor 1 alpha
TGAC Centre for Genome Analysis
TIR-NB-LRR Toll/interleukin receptor-like, nucleotide-binding and a leucine-rich repeat
Tris-HCl Tris(hydroxymethyl)aminomethane-hydrochloric acid
v Version
vs Versus

xii
WGA-FITC Wheat germ agglutinin fluorescein isothiocyanate conjugate
xiii
List of figures
Page
Figure 2.1: The life cycle of P. graminis (taken from Leonard and Szabo, 2005).
9
Figure 3.1: Sampling of the leaf sheath from adult wheat plants.
40
Figure 3.2: Seedling infection types of three wheat lines (37-07, W1406 and
W6979) when inoculated with Puccinia graminis f. sp. tritici race PTKST.
43
Figure 3.3: Adult plant infection response of the three wheat lines 37-07, W1406
and W6979 inoculated with Puccinia graminis f. sp. tritici race PTKST.
44
Figure 3.4: Adult plant infection response of the three wheat lines 37-07, W1406
and W6979 inoculated with Puccinia graminis f. sp. tritici race PTKST.
45
Figure 3.5: Adult plant infection response of the three wheat lines 37-07, W1406
and W6979 inoculated with Puccinia graminis f. sp. tritici race PTKST.
46
Figure 3.6: Adult plant infection response of the four doubled haploid wheat lines
DH1.43, DH1.50, DH2.31 and DH2.38 inoculated with Puccinia graminis f. sp.
tritici race PTKST.
47
Figure 3.7: Adult plant infection response of the three wheat lines 37-07, W1406
and W6979 inoculated with Puccinia graminis f. sp. tritici race PTKST.
48
Figure 3.8: Adult plant infection response of the four doubled haploid wheat lines
DH1.43, DH1.50, DH2.31 and DH2.38 inoculated with Puccinia graminis f. sp.
tritici race PTKST.
49
Figure 3.9: Adult plant infection response of the four wheat lines 37-07, Francolin-
1, Kingbird and Pavon-76 inoculated with Puccinia graminis f. sp. tritici race
PTKST.
50
xiv
Figure 3.10: Adult plant infection response of the four wheat lines 37-07, Francolin-
1, Kingbird and Pavon-76 inoculated with Puccinia graminis f. sp. tritici race
PTKST.
51
Figure 4.1: Schematic representation of the infection process of a Puccinia spp. on
wheat (taken from Garnica, et al., 2013 with modification to labels).
61
Figure 4.2: Scanning electron micrograph of the Puccinia graminis f. sp. tritici
infection process on the flag leaf sheath of the 37-07 wheat line at 6 hours post
inoculation.
70
Figure 4.3: Scanning electron micrograph of the Puccinia graminis f. sp. tritici
infection process on the flag leaf sheath of the 37-07 wheat line at 12 hours post
inoculation.
70
Figure 4.4: Scanning electron micrograph of the Puccinia graminis f. sp. tritici
infection process on the flag leaf sheath of the 37-07 wheat line at 1 day post
inoculation.
71
Figure 4.5: Scanning electron micrograph of the Puccinia graminis f. sp. tritici
infection process on the flag leaf sheath of the 37-07 wheat line at 1 day post
inoculation.
71
Figure 4.6: Scanning electron micrograph of the Puccinia graminis f. sp. tritici
infection process on the flag leaf sheath of the W1406 wheat line at 6 hours post
inoculation.
72
Figure 4.7: Scanning electron micrograph of the Puccinia graminis f. sp. tritici
infection process on the flag leaf sheath of the W1406 wheat line at 12 hours post
inoculation.
72

xv
Figure 4.8: Scanning electron micrograph of the Puccinia graminis f. sp. tritici
infection process on the flag leaf sheath of the W1406 wheat line at 1 day post
inoculation.
73
Figure 4.9: Scanning electron micrograph of the Puccinia graminis f. sp. tritici
infection process on the flag leaf sheath of the W1406 wheat line at 1 day post
inoculation.
73
Figure 4.10: Scanning electron micrograph of the Puccinia graminis f. sp. tritici
infection process on the flag leaf sheath of the W6979 wheat line at 6 hours post
inoculation.
74
Figure 4.11: Scanning electron micrograph of the Puccinia graminis f. sp. tritici
infection process on the flag leaf sheath of the W6979 wheat line at 12 hours post
inoculation.
74
Figure 4.12: Scanning electron micrograph of the Puccinia graminis f. sp. tritici
infection process on the flag leaf sheath of the W6979 wheat line at 1 day post
inoculation.
75
Figure 4.13: Scanning electron micrograph of the Puccinia graminis f. sp. tritici
infection process on the flag leaf sheath of the W6979 wheat line at 1 day post
inoculation.
75
Figure 4.14: Sub-epidermal scanning electron micrograph of the Puccinia graminis
f. sp. tritici infection process on the flag leaf sheath of the 37-07 wheat line at 1 day
post inoculation.
76
Figure 4.15: Sub-epidermal scanning electron micrograph rograph of the Puccinia
graminis f. sp. tritici infection process on the flag leaf sheath of the 37-07 wheat
line at 36 hours post inoculation.
76

xvi
Figure 4.16: Sub-epidermal scanning electron micrograph of the Puccinia graminis
f. sp. tritici infection process on the flag leaf sheath of the 37-07 wheat line at 36
hours post inoculation.
77
Figure 4.17: Sub-epidermal scanning electron micrograph of the Puccinia graminis
f. sp. tritici infection process on the flag leaf sheath of the 37-07 wheat line at 2
days post inoculation.
77
Figure 4.18: Fluorescence micrograph of Puccinia graminis f. sp. tritici infection
sites on the flag leaf sheath at 1 day post inoculation.
78
Figure 4.19: Fluorescence micrograph of Puccinia graminis f. sp. tritici infection
sites on the flag leaf sheath at 2 days post inoculation.
79
Figure 4.20: Fluorescence micrograph of Puccinia graminis f. sp. tritici infection
sites on the flag leaf sheaths at 3 days post inoculation.
80
Figure 4.21: Fluorescence micrograph of Puccinia graminis f. sp. tritici colonies in
the flag leaf sheath at 5 days post inoculation.
81
Figure 4.22: Mean colony size (mm2) of Puccinia graminis f. sp. tritici colonies at 5
days post inoculation.
83
Figure 4.23: Fluorescence micrograph of Puccinia graminis f. sp. tritici colonies in
the flag leaf sheath at 10 days post inoculation.
84
Figure 4.24: Light micrograph of the cross section of a Puccinia graminis f. sp.
tritici-inoculated last internode.
85
Figure 4.25: Fluorescence micrograph of the cross section of a Puccinia graminis f.
sp. tritici-inoculated last internode.
86
xvii
Figure 4.26: Light micrograph of the cross section of a Puccinia graminis f. sp.
tritici-inoculated last internode.
87
Figure 4.27: Fluorescence micrograph of the cross section of a Puccinia graminis f.
sp. tritici-inoculated last internode.
87
Figure 5.1: Quantification of chitin in Puccinia graminis f. sp. tritici-inoculated
wheat lines tested in Adult trial 1 (a) and Adult trial 2 (b).
112
Figure 5.2: Mean expression stability (M value) of four reference genes in Puccinia
graminis f. sp. tritici-inoculated wheat lines tested in Adult trials 1-4.
113
Figure 5.3: Mean expression stability (M value) of four reference genes in Puccinia
graminis f. sp. tritici-inoculated wheat lines tested in Adult trials 5 and 6.
113
Figure 5.4: Normalised relative quantity of Puccinia graminis f. sp. tritici β-tubulin
transcripts in inoculated wheat lines tested in the seedling trial.
114
Figure 5.5: Normalised relative quantity of Puccinia graminis f. sp. tritici β-tubulin
transcripts in inoculated wheat lines tested in four biological replicates.
115
Figure 5.6: Mean normalised relative quantity of Puccinia graminis f. sp. tritici β-
tubulin transcripts in inoculated wheat lines tested for four biological replicates
(Adult trials 1-4).
116
Figure 5.7: Normalised relative quantity of Puccinia graminis f. sp. tritici β-tubulin
transcripts in inoculated doubled haploid wheat lines from the W1406 x 37-07 cross
tested in Adult trial 3 (a) and Adult trial 4 (b).
118
Figure 5.8: Normalised relative quantity of Puccinia graminis f. sp. tritici β-tubulin
transcripts in inoculated doubled haploid wheat lines from the W6979 x 37-07 cross
tested in Adult trial 3 (a) and Adult trial 4 (b).
119
xviii
Figure 5.9: Normalised relative quantity of Puccinia graminis f. sp. tritici β-tubulin
transcripts in inoculated wheat lines tested in Adult trial 5 (a) and Adult trial 6 (b).
120
Figure 5.10: Non-linear regression graphs of normalised relative quantity of
Puccinia graminis f. sp. tritici β-tubulin transcripts in the inoculated 37-07 wheat
line.
121
Figure 5.11: Normalised relative quantity of PGTG_11318 transcripts in inoculated
wheat lines tested in the seedling trial.
124
Figure 5.12: Normalised relative quantity of PGTG_11318 transcripts in inoculated
wheat lines tested in four biological replicates.
125
Figure 5.13: Mean normalised relative quantity of PGTG_11318 transcripts in
inoculated wheat lines tested for four biological replicates (Adult trials 1-4).
126
Figure 5.14: Normalised relative quantity of PGTG_11318 transcripts in inoculated
doubled haploid wheat lines from the W1406 x 37-07 cross tested in Adult trial 3
(a) and Adult trial 4 (b).
128
Figure 5.15: Normalised relative quantity of PGTG_11318 transcripts in inoculated
doubled haploid wheat lines from the W6979 x 37-07 cross tested in Adult trial 3
(a) and Adult trial 4 (b).
129
Figure 5.16: Normalised relative quantity of PGTG_11318 transcripts in inoculated
wheat lines tested in Adult trial 5 (a) and Adult trial 6 (b).
130
Figure 5.17: Non-linear regression graphs of normalised relative quantity of
PGTG_11318 transcripts in the inoculated 37-07 wheat line.
131
Figure 6.1: Bioinformatics pipeline used in the current study for the analysis of
RNA-sequencing data.
150

xix
Figure 6.2: Pairwise comparisons for determining differentially expressed
transcripts using baySeq with triplicated Ion Torrent datasets.
151
Figure 6.3: Principal component analysis of the differentially expressed transcripts
identified by intensity difference analysis.
155
Figure 6.4: Analysis of the shared differentially expressed transcripts identified by
intensity difference analysis in the sequencing platform comparison.
156
Figure 6.5: Venn diagram showing the number of differentially expressed wheat
transcripts in each line for the time vs time comparison.
160
Figure 6.6: Summarised heatmaps of hierarchical clustered wheat transcripts for the
time vs time comparison.
161
Figure 6.7: Multilevel distribution of gene ontology (GO) annotations in the
differentially expressed wheat transcripts in the 37-07 line for the time vs time
comparison.
162
Figure 6.8: Multilevel distribution of gene ontology (GO) annotations in the
differentially expressed wheat transcripts in the W1406 line for the time vs time
comparison.
163
Figure 6.9: Multilevel distribution of gene ontology (GO) annotations in the
differentially expressed wheat transcripts in the W6979 line for the time vs time
comparison.
164
Figure 6.10: Heatmaps of differentially expressed transcripts in time vs time
comparison encoding wheat peroxidases.
166
Figure 6.11: Venn diagram showing the differentially expressed Puccinia graminis
f. sp. tritici transcripts in each line for the time vs time comparison.
168

xx
Figure 6.12: Summarised heatmaps of hierarchical clustered Puccinia graminis f.
sp. tritici transcripts for the time vs time comparison.
169
Figure 6.13: Multilevel distribution of gene ontology (GO) annotations in the
differentially expressed Puccinia graminis f. sp. tritici transcripts in the 37-07 line
for the time vs time comparison.
170
Figure 6.14: Multilevel distribution of gene ontology (GO) annotations in the
differentially expressed Puccinia graminis f. sp. tritici transcripts in the W1406 line
for the time vs time comparison.
171
Figure 6.15: Multilevel distribution of gene ontology (GO) annotations in the
differentially expressed Puccinia graminis f. sp. tritici transcripts in the W6979 line
for the time vs time comparison.
172
Figure 6.16: Venn diagram of the number of differentially expressed Puccinia
graminis f. sp. tritici transcripts in each wheat line sample for the time vs time
comparison that encoded predicted effector proteins.
174
Figure 6.17: Venn diagram of the number of differentially expressed wheat
transcripts in each wheat line sample for the line vs line comparison.
177
Figure 6.18: Summarised heatmaps of hierarchical clustered wheat transcripts for
the line vs line comparison.
178
Figure 6.19: Venn diagram of the number of differentially expressed wheat
transcripts in each wheat line for the line vs line comparison that encoded predicted
nucleotide-binding and a leucine-rich repeat proteins.
179
Figure 6.20: Chromosomal distribution of differentially expressed wheat transcripts
in each wheat line for the line vs line comparison that encoded predicted nucleotide-
binding and a leucine-rich repeat proteins.
180

xxi
Figure 6.21: Differentially expressed wheat transcripts in the W1406 line for the
line vs line comparison located on chromosome 4D.
182
Figure 6.22: Differentially expressed wheat transcripts in the W6979 line for the
line vs line comparison located on chromosome 6A.
183
xxii
List of tables
Page
Table 3.1: Pedigrees of wheat lines used in the current study.
36
Table 3.2: Quantitative trait loci linked to the adult plant resistance response to
Puccinia graminis f. sp. tritici in two doubled haploid wheat lines, DH1.43 and
DH1.50.
37
Table 3.3: Quantitative trait loci linked to the adult plant resistance response to
Puccinia graminis f. sp. tritici in two doubled haploid wheat lines, DH2.31 and
DH2.38.
37
Table 3.4: Summary of greenhouse trials performed and methods used to
investigate generated samples.
41
Table 3.5: Adult plant infection responses of wheat lines used in the current
study.
52
Table 4.1: Tukey's multiple comparison test results for mean colony size of
Puccinia graminis f. sp. tritici on wheat lines at 5 days post inoculation.
83
Table 5.1: Primer sequences of analysed transcripts used for reverse transcriptase
quantitative polymerase chain reaction.
105
Table 5.2: Reverse transcriptase quantitative polymerase chain reaction details
for transcripts analysed in the current study.
106
Table 5.3: Programmes used for the analysis of the predicted PGTG_11318
protein sequence.
107
Table 5.4: Tukey's multiple comparison test results for mean normalised relative
quantity of Puccinia graminis f. sp. tritici β-tubulin transcripts in Puccinia
117

xxiii
graminis f. sp. tritici-inoculated wheat.
Table 5.5: Tukey's multiple comparison test results for mean normalised relative
quantity of PGTG_11318 transcripts in Puccinia graminis f. sp. tritici-inoculated
wheat.
127
Table 6.1: Number and lengths of reads for the sequencing platform comparison
reported before and after quality trimming.
153
Table 6.2: Number and percentage of reads mapped to the reference
transcriptomes in the sequencing platform comparison.
154
Table 6.3: Number and lengths of reads for the triplicated Ion Torrent dataset
reported before and after quality trimming.
158
Table 6.4: Number and percentage of reads mapped to the reference
transcriptomes for the triplicated Ion Torrent dataset.
159

xxiv
List of supplementary material
Supplementary Table S1: Clustered expression profiles in log2 fold change (FC) of
differentially expressed wheat transcripts in the 37-07 line for the time vs. time comparison.
The 1 and 3 days post inoculation (dpi) samples were respectively analysed in a pairwise
comparison with 0 dpi sample. The five subdivided clusters (A-E) are indicated with the
mean log2FC for all transcripts within that cluster. The Ensembl accessions are reported for
the differentially expressed transcripts.
Supplementary Table S2: Clustered expression profiles in log2 fold change (FC) of
differentially expressed wheat transcripts in the W1406 line for the time vs. time comparison.
The 1 and 3 days post inoculation (dpi) samples were respectively analysed in a pairwise
comparison with 0 dpi sample. The five subdivided clusters (A-E) are indicated with the
mean log2FC for all transcripts within that cluster. The Ensembl accessions are reported for
the differentially expressed transcripts.
Supplementary Table S3: Clustered expression profiles in log2 fold change (FC) of
differentially expressed wheat transcripts in the W6979 line for the time vs. time comparison.
The 1 and 3 days post inoculation (dpi) samples were respectively analysed in a pairwise
comparison with 0 dpi sample. The five subdivided clusters (A-E) are indicated with the
mean log2FC for all transcripts within that cluster. The Ensembl accessions are reported for
the differentially expressed transcripts.
Supplementary Table S4: Descriptions, homologies and log2 fold change (FC) values of
differentially expressed wheat transcripts in the 37-07 line for the time vs. time comparison.
The Ensembl accessions and descriptions are reported for the all transcripts. Description of
homologous genes and associated E values, gene ontology (GO) accessions, InterPro
accessions and associated GO accessions were determined with Blast2GO and reported.

xxv
Supplementary Table S5: Descriptions, homologies and log2 fold change (FC) values of
differentially expressed wheat transcripts in the W1406 line for the time vs. time comparison.
The Ensembl accessions and descriptions are reported for the all transcripts. Description of
homologous genes and associated E values, gene ontology (GO) accessions, InterPro
accessions and associated GO accessions were determined with Blast2GO and reported.
Supplementary Table S6: Descriptions, homologies and log2 fold change (FC) values of
differentially expressed wheat transcripts in the W6979 line for the time vs. time comparison.
The Ensembl accessions and descriptions are reported for the all transcripts. Description of
homologous genes and associated E values, gene ontology (GO) accessions, InterPro
accessions and associated GO accessions were determined with Blast2GO and reported.
Supplementary Table S7: Clustered expression profiles in log2 fold change (FC) of
differentially expressed Puccinia graminis f. sp. tritici transcripts in the 37-07 line for the
time vs. time comparison. The 1 and 3 days post inoculation (dpi) samples were respectively
analysed in a pairwise comparison with 0 dpi sample. The five subdivided clusters (A-E) are
indicated with the mean log2FC for all transcripts within that cluster. The Ensembl accessions
are reported for the differentially expressed transcripts.
Supplementary Table S8: Clustered expression profiles in log2 fold change (FC) of
differentially expressed Puccinia graminis f. sp. tritici transcripts in the W1406 line for the
time vs. time comparison. The 1 and 3 days post inoculation (dpi) samples were respectively
analysed in a pairwise comparison with 0 dpi sample. The five subdivided clusters (A-E) are
indicated with the mean log2FC for all transcripts within that cluster. The Ensembl accessions
are reported for the differentially expressed transcripts.

xxvi
Supplementary Table S9: Clustered expression profiles in log2 fold change (FC) of
differentially expressed Puccinia graminis f. sp. tritici transcripts in the W6979 line for the
time vs. time comparison. The 1 and 3 days post inoculation (dpi) samples were respectively
analysed in a pairwise comparison with 0 dpi sample. The five subdivided clusters (A-E) are
indicated with the mean log2FC for all transcripts within that cluster. The Ensembl accessions
are reported for the differentially expressed transcripts.
Supplementary Table S10: Descriptions, homologies and log2 fold change (FC) values of
differentially expressed Puccinia graminis f. sp. tritici transcripts in the 37-07 line for the
time vs. time comparison. The Ensembl accessions and descriptions are reported for the all
transcripts. Description of homologous genes and associated E values, gene ontology (GO)
accessions, InterPro accessions and associated GO accessions were determined with
Blast2GO and reported.
Supplementary Table S11: Descriptions, homologies and log2 fold change (FC) values of
differentially expressed Puccinia graminis f. sp. tritici transcripts in the W1406 line for the
time vs. time comparison. The Ensembl accessions and descriptions are reported for the all
transcripts. Description of homologous genes and associated E values, gene ontology (GO)
accessions, InterPro accessions and associated GO accessions were determined with
Blast2GO and reported.
Supplementary Table S12: Descriptions, homologies and log2 fold change (FC) values of
differentially expressed Puccinia graminis f. sp. tritici transcripts in the W6979 line for the
time vs. time comparison. The Ensembl accessions and descriptions are reported for the all
transcripts. Description of homologous genes and associated E values, gene ontology (GO)
accessions, InterPro accessions and associated GO accessions were determined with
Blast2GO and reported.

xxvii
Supplementary Table S13: EffectorP predictions for differentially expressed Puccinia
graminis f. sp. tritici transcripts in the 37-07 line for the time vs. time comparison. Transcript
products were classified as putative effectors, non-effectors or unlikely effectors based on
calculated EffectorP probabilities. Putative sub-cellular localization within the host cell was
determined with LOCALIZER as chloroplast, mitochondrion, nucleus or undetermined (-).
Supplementary Table S14: EffectorP predictions for differentially expressed Puccinia
graminis f. sp. tritici transcripts in the W1406 line for the time vs. time comparison.
Transcript products were classified as putative effectors, non-effectors or unlikely effectors
based on calculated EffectorP probabilities. Putative sub-cellular localization within the host
cell was determined with LOCALIZER as chloroplast, mitochondrion, nucleus or
undetermined (-).
Supplementary Table S15: EffectorP predictions for differentially expressed Puccinia
graminis f. sp. tritici transcripts in the W1406 line for the time vs. time comparison.
Transcript products were classified as putative effectors, non-effectors or unlikely effectors
based on calculated EffectorP probabilities. Putative sub-cellular localization within the host
cell was determined with LOCALIZER as chloroplast, mitochondrion, nucleus or
undetermined (-).
Supplementary Table S16: Clustered expression profiles in log2 fold change (FC) of
differentially expressed wheat transcripts in the W1407 line for the line vs. line comparison.
The 0, 1 and 3 days post inoculation (dpi) samples were respectively analysed in a pairwise
comparison with same time points in the 37-07 line. The nine subdivided clusters (A-I) are
indicated with the mean log2FC for all transcripts within that cluster. The Ensembl accessions
are reported for the differentially expressed transcripts.

xxviii
Supplementary Table S17: Clustered expression profiles in log2 fold change (FC) of
differentially expressed wheat transcripts in the W6979 line for the line vs. line comparison.
The 0, 1 and 3 days post inoculation (dpi) samples were respectively analysed in a pairwise
comparison with same time points in the 37-07 line. The nine subdivided clusters (A-I) are
indicated with the mean log2FC for all transcripts within that cluster. The Ensembl accessions
are reported for the differentially expressed transcripts.
Supplementary Table S18: Descriptions, InterPro accessions and log2 fold change (FC)
values of differentially expressed wheat transcripts in the W1406 line for the time vs. time
comparison. The Ensembl accessions and descriptions are reported for the all transcripts
along with InterPro accessions and associated GO accessions.
Supplementary Table S19: Descriptions, InterPro accessions and log2 fold change (FC)
values of differentially expressed wheat transcripts in the W6979 line for the time vs. time
comparison. The Ensembl accessions and descriptions are reported for the all transcripts
along with InterPro accessions and associated GO accessions.
Supplementary Table S20: Putative nucleotide-binding and a leucine-rich repeat (NB-LRR)
domain encoding transcripts in the W1406 line. Differentially expressed wheat transcripts in
the time vs. time comparison were analysed by NLR-parser and classified based on the
presence of a coiled-coil (CC)-NB-LRR or Toll/interleukin receptor-like (TIR)-NB-LRR
domain.
Supplementary Table S21: Putative nucleotide-binding and a leucine-rich repeat (NB-LRR)
domain encoding transcripts in the W6979 line. Differentially expressed wheat transcripts in
the time vs. time comparison were analysed by NLR-parser and classified based on the
presence of a coiled-coil (CC)-NB-LRR or Toll/interleukin receptor-like (TIR)-NB-LRR
domain.

xxix
Supplementary Table S22: Clustered expression profiles in log2 fold change (FC) of
differentially expressed Puccinia graminis f. sp. tritici transcripts in the W1407 line for the
line vs. line comparison. The 0, 1 and 3 days post inoculation (dpi) samples were respectively
analysed in a pairwise comparison with same time points in the 37-07 line. The Ensembl
accessions are reported for the differentially expressed transcripts.
Supplementary Table S23: Clustered expression profiles in log2 fold change (FC) of
differentially expressed Puccinia graminis f. sp. tritici transcripts in the W6979 line for the
line vs. line comparison. The 0, 1 and 3 days post inoculation (dpi) samples were respectively
analysed in a pairwise comparison with same time points in the 37-07 line. The Ensembl
accessions are reported for the differentially expressed transcripts.
Supplementary Table S24: Descriptions, InterPro accessions and log2 fold change (FC)
values of differentially expressed Puccinia graminis f. sp. tritici transcripts in the W1406 line
for the time vs. time comparison. The Ensembl accessions and descriptions are reported for
the all transcripts along with InterPro accessions and associated GO accessions.
Supplementary Table S25: Descriptions, InterPro accessions and log2 fold change (FC)
values of differentially expressed Puccinia graminis f. sp. tritici transcripts in the W6979 line
for the time vs. time comparison. The Ensembl accessions and descriptions are reported for
the all transcripts along with InterPro accessions and associated GO accessions.
Supplementary Table S26: EffectorP predictions for differentially expressed Puccinia
graminis f. sp. tritici transcripts in the W1406 line for the line vs. line comparison. Transcript
products were classified as putative effectors, non-effectors or unlikely effectors based on
calculated EffectorP probabilities. Putative sub-cellular localization within the host cell was
determined with LOCALIZER as chloroplast, mitochondrion, nucleus or undetermined (-).

xxx
Supplementary Table S27: EffectorP predictions for differentially expressed Puccinia
graminis f. sp. tritici transcripts in the W6979 line for the line vs. line comparison. Transcript
products were classified as putative effectors, non-effectors or unlikely effectors based on
calculated EffectorP probabilities. Putative sub-cellular localization within the host cell was
determined with LOCALIZER as chloroplast, mitochondrion, nucleus or undetermined (-).

xxxi
Abstract
Wheat (Triticum aestivum L.) production is affected by fungal diseases such as stem rust
caused by Puccinia graminis f. sp. tritici Erikss. & Henning (Pgt). Commercially
implemented single gene resistance in wheat may break down with the emergence of new
virulent races of Pgt. Emergence of the ‘Ug99’ race group reaffirmed the need for durable
stem rust resistance. A paradigm shift is therefore required towards durable types of
resistance. Adult plant resistance (APR) may remain durable in the presence of new pathogen
races. A preceding project identified two Kenyan wheat lines (W1406 and W6979) from the
Genome Resource Unit (Norwich, UK) that exhibited APR to Pgt. The aim of this study was
to investigate the APR response to Pgt race PTKST in W1406 and W6979 compared to a
susceptible control (37-07). Four greenhouse trials were done and Pgt-inoculated flag leaf
sheaths were sampled at selected days post inoculation (dpi). Histological observations using
scanning electron microscopy and fluorescence microscopy, described the infection process
of Pgt on wheat flag leaf sheaths. Fluorescence microscopy in particular showed a significant
decrease in Pgt colony sizes in the APR lines at 5 dpi. Fungal biomass quantification with a
chitin-binding probe and relative expression of the Pgt β-tubulin gene distinguished the APR
lines from line 37-07 at 5 and 10 dpi. Relative expression of a haustorium-associated gene
also distinguished the APR lines from the control line at 5 dpi. Taken together, these findings
supported phenotypic evidence that W1406 and W6979 inhibited Pgt development, but that
the effect was more pronounced in W6979. These results prompted the selection of time
points earlier than 5 dpi for RNA-sequencing (RNA-seq) analysis. A time based comparison
of differentially expressed (DE) transcripts showed two phases of the APR response at 1 and
3 dpi. The majority of differentially expressed transcripts in W1406 were induced at 3 dpi but
in W6979 at 1 dpi. The current hypothesis maintains that the activation of an earlier defence
response in W6979 caused a notable decrease of Pgt development in this line. The defence
response in W1406 was delayed but still significantly decreased Pgt development. RNA-seq
also identified several transcripts encoding putative effectors in Pgt. A comparison of
differentially expressed between the APR lines and 37-07 identified a number of candidate
APR associated transcripts. The current study therefore delivered a multifaceted description
of the APR response in W1406 and W6979 and its effect on Pgt development.
Key terms: Adult plant resistance, wheat, Triticum aestivum, stem rust, Puccinia graminis f.
sp. tritici, RNA-seq

1
Chapter 1: Introduction

2
Wheat (Triticum aestivum) production is under constant threat from biotic stress factors such
as fungal pathogens. An important fungal pathogen that threatens global wheat production is
Puccinia graminis f. sp. tritici (Pgt), the causal agent of stem rust (Dean et al., 2012). Global
yield losses per year due to stem rust were estimated to be 6.2 million metric tons for the
period of 1961-2009 (Pardey et al., 2013). These figures correspond to an estimated financial
loss of 1.12 billion USD per year. Combatting Pgt and other fungal pathogens of wheat is an
ongoing objective of farmers, breeders and agricultural researchers.
Resistance in wheat to Pgt is largely based on the implementation of Sr genes. Products of
such resistance genes (R genes) recognise products of pathogen avirulence genes (Avr genes)
in a highly specific plant-pathogen interaction called the R-Avr interaction. Recognition of
Avr proteins from the pathogen induces a plant defence response that renders the plant
resistant (Van der Biezen and Jones, 1998a). Pathogens such as Pgt are therefore under
constant selection pressure to negate recognition by the plant and re-establish host
compatibility.
The breakdown of resistance genes has received renewed attention since the emergence of the
‘Ug99’ race of Pgt. ‘Ug99’ was detected in 1998, an isolate collected in Uganda that acquired
virulence for the Pgt resistance gene Sr31 (Pretorius et al., 2000). Worldwide resistance to
Pgt was largely based on Sr31 and the concern of ‘Ug99’ spreading beyond Africa re-
focussed research on Pgt. Here the emergence of ‘Ug99’ is a key example of the ‘boom-and-
bust’ cycle seen in many plant-pathogen interactions. The widespread use of a single
resistance gene, for example Sr31, which protects numerous cultivars from a pathogen is
referred to as a ‘boom’. However, when a pathogen overcomes this resistance gene many
cultivars may simultaneously become susceptible, informally referred to as ‘bust’ (McDonald
and Linde, 2002). Furthermore, through step-wise mutations, ‘Ug99’ has acquired virulence
against other Sr resistance genes, resulting in a race group with a shared lineage. The ‘Ug99’
race group consists of 13 races spread across 13 countries in Africa and the Middle East
(RustTracker.org, 2016).
Non-‘Ug99’ races of stem rust have also received attention especially for the potential threat
to wheat production in Europe. An outbreak of the TKTTF race occurred in Ethiopia during
2013/2014 (Olivera et al., 2015) and the race has now been detected in North Africa, the
Middle East (Singh et al., 2015), Germany (Olivera Firpo et al., 2017) and the United
Kingdom (Lewis et al., 2018). An outbreak of another race, TTTTF, has occurred in Sicily

3
(Bhattacharya, 2017) and may spread further into North Africa and mainland Europe
(Hansen, 2017).
The deployment of durable forms of wheat stem rust resistance is required to halt the spread
of Pgt and reduce the occurrences of new races. Durable resistance is defined as resistance
that is effectively granted to a wheat cultivar grown under high disease pressure over an
extended period of time (Johnson, 1979). Adult plant resistance (APR) is resistance expressed
upon maturation of wheat (Gustafson and Shaner, 1982) and many sources of APR have been
proven durable. Unlike R gene resistance, effective APR is often based on a number of genes
with smaller effects working additively, each genetic region conferring a quantitative
phenotype being referred to as quantitative trait loci (QTL) (Kou and Wang, 2010).
To identify potential QTL for Pgt resistance, Prins et al. (2016) undertook a genome-wide
association study (GWAS) of 256 African wheat accessions held at the Genome Resource
Unit, Norwich Research Park, United Kingdom. Two wheat lines of Kenyan origin, W1406
and W6979, exhibited APR to races TTKST and PTKST within the ‘Ug99’ linage. These
APR lines were crossed with the stem rust susceptible 37-07 line and two doubled haploid
(DH) mapping populations were generated. Five QTL were identified from each mapping
population, including one QTL coincident with Sr57 (Lr34/Yr18) present in both populations
(Prins et al., 2016). In W1406 the four identified QTL were QSr.ufs-4D, QSr.ufs-2B.1,
QSr.ufs-3B and QSr.ufs-4A. In field trials QSr.ufs-4D had highest logarithm of the odds
(LOD) score in most localities and Sr57 in some. The four identified QTL in W6979 were
QSr.ufs-6A, QSr.ufs-2B.2, QSr.ufs-2D and QSr.ufs-3D. In field trials QSr.ufs-6A had highest
the LOD score in all of the localities. Both lines therefore expressed APR conferred by
complex genetics, based on multiple QTL. The parental lines W1406, W6979 and 37-07
(Prins et al. 2016) formed the main focus of the current study.
In South Africa the PTKST race was detected in 2009 (Pretorius et al., 2010) and has been
proposed to be a foreign introduction (Visser et al., 2011). In addition to virulence for Sr31,
PTKST is also virulent for Sr24 and a number of other Sr genes (Pretorius et al., 2010) and
59 of 103 tested South African wheat cultivars/lines were seedling susceptible to PTKST
(Pretorius et al., 2012). PTKST has a wide distribution in Africa and has been detected in
South Africa, Zimbabwe, Mozambique, Kenya, Ethiopia and Eritrea (RustTracker.org, 2016).
Based on its broad virulence and distribution, Pgt race PTKST was selected as the inoculum
in the current study.

4
The main aim of the study was to deliver a comprehensive description of the APR response in
the W1406 and W6979 wheat lines, compared to the susceptible 37-07 line, upon inoculation
with Pgt race PTKST, and its effects on the development of the pathogen. To achieve this a
number of specific objectives were defined.
The first objective was to generate Pgt-inoculated flag leaf sheath samples from adult wheat
plants under greenhouse conditions. Since the flag leaf sheath of the last internode is often
used for phenotypic scoring of stem rust on adult wheat plants (Roelfs et al., 1992), this
tissue was selected for this study. Adult wheat plants were inoculated according to the
method developed by Pretorius et al. (2007) and modified by Bender et al. (2016). The
inoculation method was thus tested for effectiveness to reproducibly deliver Pgt-inoculated
adult wheat plants under controlled conditions. The greenhouse trials also generated Pgt-
inoculated flag leaf sheath samples for the subsequent time course analyses. Samples were
taken at different time points from inoculation up to the appearance of uredinia at 10 days
post inoculation (dpi).
The second objective was to investigate the infection process of Pgt on the flag leaf sheath of
adult wheat plants. Histological studies of the infection process on the flag leaf sheath in
particular are scarce and accurate comparisons to the adult plant infection response should
refocus research on this tissue. The infection process was investigated for the insights it
would provide into the cellular response conferred by APR in W1406 and W6979, and how it
affects Pgt development.
The third specific objective was to investigate the biomass and haustorium accumulation of
Pgt in the flag leaf sheath of adult wheat plants by reverse transcriptase quantitative
polymerase chain reaction (RT-qPCR) and fluorescence measurement. Such quantitative
molecular techniques must be tested for efficacy to follow Pgt colonization over the time
course of infection and to consistently distinguish APR lines from the susceptible 37-07 line.
The identified techniques should support the phenotypic classification and histological
observations.
The fourth and final objective was to examine the changes in gene expression in Pgt-
inoculated adult wheat plants. Next-generation sequencing of RNA was used as the method
of choice as this allows large numbers of transcripts to be identified and compared at any
given point in time and between wheat lines. Changes in gene expression over the course of
infection and comparison of the APR lines to the susceptible control could reveal the

5
molecular mechanisms underlying the APR response in the W1406 and W6979 lines and the
timing of these mechanisms. Currently, there are few published transcriptomic studies of
APR to Pgt in wheat.
The current study therefore aims to present a multifaceted approach to an understanding of
the APR response in wheat against Pgt infection. The study delivers both basic and applied
scientific research outputs and ultimately contributes to the continued efforts of agricultural
scientists to limit the worldwide spread of and damage caused by Pgt.

6
Chapter 2: Literature review

7
2.1 The impact of rust diseases on wheat production
Wheat (Triticum aestivum) is a globally important food crop with 756.5 million metric tons
being produced during the 2016/2017 season (USDA, 2018). Recent models have projected
that the current annual yield increase is only 38% of that required to double wheat production
by 2050 (Ray et al., 2013). Thus, farmers and agricultural scientists must continually strive
towards increasing wheat production, in part by combating numerous production constraints.
Among the significant biotic constraints present are the rust fungi of the genus Puccinia.
Puccinia species are obligate biotrophs of the family Pucciniaceae and the division
Basidiomycota. The three Puccinia spp. that occur on wheat are P. triticina Erikss. (Pt), P.
striiformis f. sp. tritici Erikss. (Pst) and P. graminis f. sp. tritici (Pgt), the causal agents of
leaf (brown) rust, stripe (yellow) rust and stem (black) rust, respectively. The rust fungi of
wheat are considered one of the most economically and scientifically important groups of
plant pathogens (Dean et al., 2012).
2.2 Stem rust on wheat caused by Puccinia graminis f. sp. tritici
2.2.1 The life cycle of Puccinia spp.
Puccinia spp. occurring on wheat are heteroecious, requiring two different hosts for the
completion of the sexual life cycle. On wheat Puccinia spp. may reproduce exclusively
asexually in weather conditions unfavourable for sexual reproduction or in the absence of the
alternative host. The asexual cycle involves repeated infection of wheat with urediniospores
and can be completed a number of times during the wheat growing season (Voegele et al.,
2009).
Late in the growing season structures called telia are formed on wheat and teliospores are
produced which are required for the start of the sexual life cycle (Voegele et al., 2009). Pgt
will here serve as an example of a sexual life cycle that requires wheat and an alternate host.
In the case of Pgt the alternate hosts are Berberis spp. (barberry) and Mahonia spp. (Leonard
and Szabo, 2005). The life cycle of Pgt completes five different spore stages which include
urediniospores, teliospores, basidiospores, pyniospores and aeciospores. During maturation of
teliospores the two haploid nuclei fuse in a process called karyogamy and meiosis is initiated.
After a period of dormancy, meiosis and associated genetic recombination is completed in the
teliospores. Thereafter, the teliospore forms a protruding structure called the basidium. The
basidium carries four basidiospores, each spore with one haploid nucleus, which may now
8
spread to the alternative host of Pgt. Infection of the alternative host by basidiospores
eventually leads to the formation of pycnia and pycniospores on the adaxial leaf surface of
the alternative host. Pycniospores have a single haploid nucleus and are either of the + or -
mating type. Pycniospores of one mating type are carried to the pycnial hyphae of the
opposite mating type allowing fusion to occur. The fusion of the mating types from
potentially different pycnia re-establishes the dikaryotic state and allows for genetic
exchange. The resulting dikaryotic hyphae spread through the mesophyll of the alternative
host and forms an aecium on the abaxial surface below the pynium. Aecia produce
aeciospores on the alternative host, which may once again spread to wheat. Infection of wheat
with aeciospores eventually leads to the formation of uredinia. Pgt urediniospores can once
again complete the asexual life cycle on wheat and if teliospores are formed, the sexual life
cycle may start again (Leonard and Szabo, 2005). The life cycle of P. graminis is shown in
Figure 2.1.
Since the sexual phase allows exchange of genetic information, the life cycle on the alternate
host is very important for the generation of new races of Pgt that may exhibit increased
virulence against its cereal hosts (Jin, 2011). A stem rust epidemic in the United Sates in
1916 prompted a barberry eradication programme aiming to control Pgt. This eradication
programme, often viewed as one of the most successful interventions in the history of plant
disease management, decreased the number of stem rust epidemics, delayed disease onset and
decreased the number of Pgt races (Roelfs, 1982). Under certain circumstances Puccinia spp.
can also undergo genetic exchange during the asexual stage in wheat, but except for this and
natural mutation, the asexual cycle on wheat remains clonal. The asexual cycle does however
allow for rapid dispersal of spores in a wheat field, and if the Puccinia spp. are highly
virulent on a widely grown cultivar, it could lead to an epidemic (Leonard and Szabo, 2005).
The infection process of Puccinia spp. on wheat during the asexual phase is near identical
and to illustrate the differentiation of infection structures, Pgt will serve as an example.
Infection starts with the successful adhesion of an urediniospore to the wheat epidermis. This
adhesion is more effective on hydrophobic surfaces, but many spores release molecules that
facilitate adhesion. Spores are often dispersed in a state of dormancy and activation is
required before germination occurs. The passive hydration of the spore is followed by
induction of metabolic processes, but germination is finally marked by the formation of a
germ tube (Hardham, 2001; Leonard and Szabo, 2005).

9
Figure 2.1: The life cycle of P. graminis (taken from Leonard and Szabo, 2005). The five
spore stages: urediniospores, teliospores, basidiospores, pyniospores and aeciospores are
indicated and are successively formed during the stages of the life cycle of P. graminis.
During the sexual life cycle the fungal pathogen infects the grass host species (T. aestivum for
Pgt), proceeds to infect the alternative host species (Berberis spp. and Mahonia spp. for Pgt)
and thereafter infects the grass host species again. The asexual life may be completed through
exclusive and continued infection of the grass host species by urediniospores.

10
Under advantageous conditions the spore germinates and a germ tube grows towards a stoma.
The germ tube extends away from the spore with epidermal topography and chemical signals
as guiding factors. The germ tube of Pgt has long been accepted to exhibit tropism and
extend perpendicular to the length of epidermal cells (Johnson, 1934). A germ tube
differentiates into an appressorium above the stoma and an infection peg allows the fungus to
enter the plant’s tissue via the stomatal opening. The infection peg swells into a sub-stomatal
vesicle within the stomatal cavity. Infection hyphae grow from the sub-stomatal vesicle and
spread through the intercellular spaces of the plant tissue. When infection hyphae reach
mesophyll cells, haustorial mother cells differentiate at the tip of the infection hyphae from
which a infection peg is formed that finally breaches the plant cell wall via enzymatic actions
(Leonard and Szabo, 2005). A structure called a haustorium is formed, in close association
with the plant cell. The haustorium does not penetrate the host plasma membrane and is
surrounded by an extrahaustorial matrix, which contains proteins and carbohydrates that
primarily originate from the host. For obligate biotrophs like Pgt, the establishment and
maintenance of the interaction between the fungal haustorium and the plant mesophyll cell is
crucial for the continued uptake of nutrients (Voegele and Mendgen, 2011). Genes expressed
in the haustorium of Uromyces fabae encoded amino acid transporters (Hahn and Mendgen,
1997) and in Pt various proteins involved in carbohydrate and amino acid metabolism were
identified (Song et al., 2011). It has thus been established that haustoria absorb simple
carbohydrates and amino acids from the plant tissues needed for proliferation of the fungal
mycelium (Voegele and Mendgen, 2011). Eventually uredinia are formed which erupt from
the epidermis of infected tissue. Mature urediniospores can detach from uredinia to infect the
same or other wheat plants, thereby completing the asexual cycle (Hardham, 2001; Leonard
and Szabo, 2005).
2.2.2 Race nomenclature systems for Puccinia graminis f. sp. tritici
Plant resistance genes against Pt, Pst and Pgt are designated as Lr, Yr and Sr respectively,
each followed by a number (McIntosh et al., 1995). In wheat and other Triticeae, 59 Sr genes
have been listed (McIntosh et al., 2016). Classification of Puccinia spp. races is based on
their observed infection type on wheat differential lines that each possesses a known, but
different resistance gene. Phenotypically, due to specificity of the interaction between the
host and pathogen, the interaction is ranked as either compatible or incompatible. Likewise
the fungal race is classified as either virulent or avirulent against the resistance gene in a
differential line.

11
A nomenclature system for ‘standard races’ using 12 differential lines was proposed by
Stakman et al. (1962). However, it soon became apparent that this set could not differentiate
important new races and modifications were made by rust workers across the globe. The
North American system of nomenclature for Pgt races was established by Roelfs and Martens
(1988). Initially this system considered four groups of four wheat lines, each containing a
known Sr gene. These sixteen lines are simultaneously infected with a Pgt isolate, and
depending on its virulence profile on the four wheat lines within each group, a four letter
alphabetic code is assigned (Roelfs and Martens, 1988). The Australian nomenclature system
retained certain Stakman differentials, but added supplementary lines with the ability to
classify Pgt races of regional importance (Park, 2007). The South African differential set
proposed by Le Roux and Rijkenberg (1987) has since been replaced by the North American
series, but also focuses on the South African Pgt populations by adding wheat lines of local
significance (Terefe et al., 2016).
2.2.3 The spread of and recent epidemics of stem rust
2.2.3.1 The ‘Ug99’ race group
In 1998 severe stem rust infections were observed on wheat lines containing the Pgt
resistance gene Sr31 in Uganda. Virulence for Sr31 was confirmed in 1999, prompting the
common referral to the new race as ‘Ug99’, a name derived from the original isolate number
Pgt-Ug99 (Pretorius et al., 2000). Sr31 was the basis of much of worldwide Pgt resistance
and the emergence of ‘Ug99’ was of concern. Researchers anticipated the spread of ‘Ug99’ to
the Middle-East and Asia and the large wheat producing areas of India, China and Russia
(Singh et al., 2006). A 2005/2006 survey of cultivars from 18 African and Asian countries
estimated that 51.6% of the area under wheat production was susceptible to ‘Ug99’ (Singh et
al., 2008). Globally, 66% of wheat grown worldwide is in a climate suitable for stem rust
(Pardey et al., 2013). When 174 wheat cultivars from the United States of America were
tested against the African ‘Ug99’ races 91.4% were susceptible (Singh et al., 2015). These
numbers highlighted the potential threat posed to wheat by Pgt and the ‘Ug99’ race group in
particular.
The African ‘Ug99’ race with Sr31 virulence was initially classified as TTKS (Wanyera et
al., 2006). The subsequent detection of ‘Ug99’ variants virulent on wheat containg both Sr31
and Sr24 prompted the inclusion of a fifth differential subset and a fifth letter in the North
American code, thus distinguishing between TTKSK and TTKST (Jin et al., 2008). Through
12
various step-wise mutations ‘Ug99’ has acquired virulence for other Sr resistance genes,
resulting in what is now accepted as a race group with a shared lineage, but different
virulence profiles. The hypothetical race PTKSF is considered the ancestor of races in the
‘Ug99’ lineage (Park et al., 2011). Since the nomenclature of Pgt races is dependent on a
limited number of Sr genes in the established differential sets, many races may still remain
undescribed, requiring even more refinement of the system. For example, another variant of
TTKSF, virulent on the cultivar Matlabas, was detected (Pretorius et al., 2012). This race
most likely developed due to the breakdown of the Sr9h resistance gene (Rouse et al., 2014).
Even though it was indistinguishable from TTKSF on the current five differential subsets, the
addition of Matlabas as part of the differential set labelled it as TTKSF+. Despite these
shortcomings, the North American Pgt nomenclature system remains robust, recognised and
widely implemented, but also under regular revision.
The ‘Ug99’ race group is spread over a large geographical region; from South Africa, along
Eastern Africa and towards Egypt. In Asia ‘Ug99’ races were detected in Yemen and Iran
(Singh et al., 2015). The number of races within the ‘Ug99’ group is also increasing as Sr
resistance genes are overcome. In 2014, a Pgt race TTKTK (a race within the ‘Ug99’ lineage)
became virulent against the resistance gene SrTmp and was identified in Kenya, Uganda,
Rwanda and Egypt (Patpour et al., 2016). Through such monitoring of ‘Ug99’, another five
races were recently added to the race group, bringing the total up to 13 races spread across 13
countries (RustTracker.org, 2016).
2.2.3.2 Non-‘Ug99’ races
Pgt races that do not form part of the ‘Ug99’ lineage have also become important. Olivera et
al. (2015) showed that breakdown of the SrTmp gene for resistance against ‘Ug99’, may have
rendered the Digalu cultivar susceptible to the non-‘Ug99’ race TKTTF, causing a major
epidemic in Ethiopia between 2013/2014. Genotypic and phenotypic characterization
identified four Pgt races, but race TKTTF was the main cause of the epidemic. Digalu was
widely planted in Ethiopia since it had high yield and resistance to races within the known
‘Ug99’ lineage. The prevalence of Digalu in the field and high disease severity (80-100%)
caused yield losses of 51% compared to the previous season. TKTTF has already been
detected in Turkey, Iran, Lebanon, Egypt and Ethiopia (Singh et al., 2015).
In Germany a stem rust outbreak occurred in 2013, from which six races were detected.
Though none of these races were of the ‘Ug99’ lineage, the TKTTF race was also present

13
(Olivera Firpo et al., 2017). Race TKTTF, or a closely related race, was detected in the
United Kingdom in 2013 (Lewis et al., 2018). The susceptibility of wheat varieties in the
United Kingdom along with the presence of Berberis vulgaris L. and changing climatic
conditions favour the spread of stem rust. In 2016, an outbreak of the TTTTF Pgt race
occurred in Sicily which affected both bread and durum wheat (Bhattacharya, 2017). Spore
dispersal models of the TTTTF outbreak in Sicily predicted that this race may spread further
to Italy, Greece, Albania, Montenegro, Bosnia and Herzegovina, Croatia, Slovenia, Libya and
Tunisia (Hansen, 2017). These findings indicate that Pgt may again become problematic in
Europe, and highlighted the continued importance of combatting this fungal pathogen.
2.3 Pathogen effectors
2.3.1 Identification and mechanisms of effectors
Molecular studies of Puccinia spp. have always been complicated since, as obligate
biotrophs, development of the pathogen and the formation of infection structures require a
direct association with the host. Though changes in gene expression of Pgt transcripts can be
followed within axenic cultures and infected plant tissue (Broeker et al., 2006) the former
method may not fully emulate the colonization process. Voegele et al. (2001) identified
haustoria as being responsible for active uptake of nutrients from the host. Cell wall
strengthening during early infection stages was also associated with the inhibition of
haustorium formation (Collins et al., 2007). These findings placed haustoria at the forefront
in the study of plant-pathogen interactions. A method for haustorium isolation from infected
plant tissue was first developed by Hahn and Mendgen (1997) and allowed the identification
of infection induced transcripts. This technique allowed for the proteomic analysis of Pt-
infected wheat and identified 260 proteins of fungal origin of which 50 were secreted (Song
et al., 2011).
As knowledge of effectors increased, secretion of proteins by the pathogen became a
common feature (Rep, 2005). Proteins are secreted to the extracellular matrix of haustoria or
the cytosol of the host and function in creating favourable conditions for the pathogen
infection within the host cell. Such proteins are classified as effectors.
Rust fungi transferred proteins (RTPs) were some of the first effectors that were shown to
pass from the haustorium of Uromyces spp. to the host cytosol (Kemen et al., 2005). RTPs
are so common that they are used as markers to validate haustorium isolation (Puthoff et al.,

14
2008) or to follow fungal infection (Voegele and Schmid, 2011). RTPs occur in numerous
members of the Pucciniales, with 28 genes identified in the Order. The N-terminal is highly
variable between species but the C-terminal is conserved and shows homology to cysteine
protease inhibitors (Pretsch et al., 2013). In Melampsora larici-populina Kleb., 20 selected
effectors were secreted and delivered primarily to the plant cytosol or nucleus and protein
interactions with host proteins were confirmed (Petre et al., 2015). Interestingly, a small
group of M. larici-populina effectors called the CTPs (chloroplast-targeted proteins) were
delivered to chloroplasts. The CTPs represent effectors that hypothetically mimic host
peptides to be delivered with the cell (Petre et al., 2016).
Effectors were shown to have a vast array of functions. FGL1 in Fusarium graminearum
Schwabe. encodes a lipase (Voigt et al., 2005), AvrP123 in Melampsora lini (Ehrenb.) Lév.
for a Kazal serine protease inhibitor (Catanzariti et al., 2006) and Avr4 in Cladosporium
fulvum Cooke contains a chitin-binding domain (Van den Burg et al., 2003). It was proposed
that the binding of Avr4 to chitin in the fungal wall protects it against plant chitinases (Van
den Burg et al., 2006). Another chitin-binding effector, Slp1 in Magnaporthe oryzae (Hebert)
Barr, leads to susceptibility in rice when it competes with the chitin oligosaccharide elicitor-
binding protein (CEBiP) (Mentlak et al., 2012) by being N-glycosylated by a fungal Alg3
protein (Chen et al., 2014). The current model proposes that Slp1 binds chitin that would
otherwise be recognised by CEBiP that would lead to a plant defence response. Ma. oryzae
thereby evades detection by the host (Mentlak et al., 2012). The effectors of biotrophic
pathogens are proteins which function allows the fungus to proliferate by suppressing
pathogen associated molecular pattern triggered immunity (PTI) and modifying the plant’s
cellular environment (Vleeshouwers and Oliver, 2014). The Tin2 effector from Ustilago
maydis (DC.) Corda, binds and stabilises the maize protein kinase ZmTTK1 which in turn
activates the anthocyanin biosynthetic pathway. Researchers proposed that the anthocyanin
biosynthetic pathway directs precursors away from the lignin biosynthetic pathway and
lignification of the host cell walls are thus supressed (Tanaka et al., 2014). Many other
effectors however remain undiscovered and their mechanisms undescribed.
An important group of effectors are encoded by the avirulence genes (Avr genes) that are
recognised directly or indirectly by the resistance gene (R gene) products (Dodds et al.,
2007). Once the R-Avr interaction has been established the host induces a defence response
called effector triggered immunity (ETI) (Jones and Dangl, 2006). If however non-
synonymous mutation alters the protein structure sufficiently to terminate the R-Avr

15
interaction, infection may proceed as before. Effectors, and Avr genes in particular, are
therefore of keen importance to research. In Pgt two avirulence genes have recently been
identified and R-Avr recognition confirmed in wheat between the products of AvrSr35 and
Sr35 (Salcedo et al., 2017) and AvrSr50 and Sr50 (Chen et al., 2017).
2.3.2 Effectoromics
Studies implementing next generation sequencing (NGS) and bioinformatics have narrowed
the search for effectors to the secretome (the sum total of secreted proteins). From there the
analysis of all effectors of a pathogen (effectoromics) was undertaken which has increased
the number of known effectors considerably. In a study by Cantu et al. (2011), genome
sequencing of Pst and prediction of the secretome delivered 1088 putative effectors.
Secretome prediction from the publically available Pgt genome identified 1463 putative
effectors, and the secretomes of Pst and Pgt shared only 27% similarity. In another study
(Duplessis et al., 2011), genome sequencing of M. larici-populina and Pgt delivered 812 and
1184 secreted proteins respectively. Microarray analysis of gene expression also showed only
16% overlap in the top upregulated secreted transcripts. The high diversity found in
comparative studies of effectors confirms the high evolution rate of effectors.
Haustorium enrichment and NGS have also been combined. From a transcriptomic study, a
total of 437 secreted proteins associated with the haustorium were predicted in Pst (Garnica
et al., 2013). In Pgt, 520 haustorium-associated secreted proteins were identified in three
races, two of which are more virulent mutants derived from the third race. Reference genome
based single nucleotide polymorphism (SNP) analysis of the three races identified mutations
in 25 putative effectors that may be responsible for the increased virulence in the two mutants
(Upadhyaya et al., 2015). A transcriptomic analysis of Pt comparing infected tissue to
purified haustoria identified 532 predicted secreted proteins, 456 of which were shared
between six races. Furthermore, 15 effectors with SNP mutations resulting in non-
synonymous codon changes in some races were linked to phenotypic observations. Thus
effector gene mutations could be linked to virulence changes that occurred with respect to Lr
genes (Bruce et al., 2014). In Pst, out of 2999 proteins in the secretome, five polymorphic
effectors were identified in two Pst races (Cantu et al., 2013).
Comprehensive classification of effectors can now be undertaken by clustering them
according to protein domain features. Eight discreet clusters were proposed, namely repeat
containing, annotated haustorium expressed, induced during infection, small cysteine rich,

16
secreted haustoria expressed, rich in effector motifs, haustoria expressed and non-annotated
(Saunders et al., 2012). Hierarchical clustering analysis of predicted proteins in Pgt and M.
larici-populina (Saunders et al., 2012) and Pst (Cantu et al., 2013) has also been completed.
One important class of effectors is the ‘rich in cysteine’ class that accounts for the largest
class of effectors in Pgt and M. larici-populina (Duplessis et al., 2011). The current research
focus to identify effectors by searching for secreted proteins has led to the development of
bioinformatics tools for effector prediction such as EffectorP (Sperschneider et al., 2015).
Through such research the list of putative effectors and knowledge of their functioning are
continually increasing.
2.3.3 Validation of effector mechanisms
The validation of effector functioning can be done through a RNA-silencing method called
host-induced gene silencing (HIGS). A viral vector is used to deliver an antisense nucleotide
sequence into the plant which is degraded by the plant RNA-silencing mechanisms. Whereas
traditional gene silencing methods were implemented to study the effects of the removal of
plant transcripts, HIGS rather targets pathogen transcripts (Nunes and Dean, 2012). Barley
stripe mosaic virus based HIGS negated the Avra10 effector and reduced growth of Blumeria
graminis f. sp. hordei Marchal on barley (Nowara et al., 2010). HIGS by particle
bombardment was used to screen 50 genes encoding haustorium secreted proteins from B.
graminis f. sp. hordei. Eight genes contributed to infection and one candidate effector,
encoding a ribonuclease-like gene, was shown to interfere with the hypersensitive response
(HR) mechanisms of the host (Pliego et al., 2013).
Silencing of three Pt infection-associated genes led to the suppression of this disease on
wheat (Panwar et al., 2013). Interestingly, silencing of these genes not only supressed the
infection of Pt but also that of Pgt and Pst. Likewise, HIGS with barley stripe mosaic virus
also showed disease suppression of Pgt when 10 haustorium associated genes were silenced
(Yin et al., 2015). A few of these genes also supressed Pt and Pst infection when silenced in
the respective interactions. HIGS therefore allows the study of effectors but is also a potential
method to control a pathogen by exclusion of effectors or other essential pathogenic genes
(Nunes and Dean, 2012). HIGS may thus be viewed as an approach to deliver resistance to a
range of pathogens, though it may not necessarily be based on the silencing of effectors.
To validate the function of putative effectors, researchers have also used pathogenic bacteria
to deliver putative effectors into plants via the type III secretion system. Transformed

17
Pseudomonas syringae van Hall and Pseudomonas fluorescens Migula expressing a Pst
ToxA effector delivered the effector in wheat that led to the activation of the HR (Yin and
Hulbert, 2011). Another bacterium, Burkholderia glumae Kurita and Tabei, was transformed
and then successfully delivered effectors into rice, wheat and barley (Sharma et al., 2013).
The Ps. syringae system for effector delivery was also used to screen multiple wheat cultivars
with known Sr genes against putative effectors and the study established an R-Avr interaction
between Sr22 and the PGTAUSPE-10-1 gene from Pgt (Upadhyaya et al., 2014).
The continually changing interaction between the plant host and pathogen hinges on the Avr-
R gene interaction. Thereby, if a Puccinia spp. race can negate the Avr-R interaction by
mutation of an effector, it can overcome that resistance gene. If the resistance gene is widely
implemented the newly emerged race can quickly become problematic, leading to a classical
‘boom and bust’ cycle. This is the major disadvantage of R gene resistance and cause of the
emergence of the ‘Ug99’ stem rust race group.
2.4 Plant defence
2.4.1 Constitutive defence responses
To combat fungal infections plants have evolved a number of effective constitutive and/or
inducible defence responses. Constitutive defence mechanisms include both physical and
chemical barriers (Johal et al., 1995). The first constitutive defensive barrier is the cuticle of
epidermal cells and suberised cell walls that respectively contain the hydrophobic fatty acid-
like polymers cutin and suberin. Pathogens evolved specialised enzymes to break through
these preformed barriers (Koiattukudy, 1985).
Plant cells may also accumulate secondary metabolites that are directly detrimental to the
pathogen with phytoalexins and saponins serving as examples. Various Arabidopsis mutants
in phytoalexin synthesis pathways were more susceptible to Hyaloperonospora parasitica
(Pers.) Constant. (Glazebrook et al., 1997) and Alternaria brassicicola (Schwein.) Wiltshire
infection (Thomma et al., 1999). Saponin deficient oat mutants were also shown to be more
susceptible to Gaeumannomyces graminis (Sacc.) Arx and D.L. Olivier infection
(Papadopoulou et al., 1999).
2.4.2 Inducible defence responses

18
Constitutive defences prevent a range of potential pathogens from infecting a plant species. If
a pathogen overcomes the constitutive defence mechanisms, an inducible defence response is
activated in the plant in order to prevent infection. Recognition of the presence of a potential
pathogen is achieved by the plant by perception of small molecules called pathogen
associated molecular patterns (PAMPs). PAMPs can either be fungal derived molecules or
by-products of plant cell wall damage. Recognition of PAMPs by the plant leads to a signal
transduction cascade that induces the basal plant defence responses. This first line of
inducible plant defence is referred to as PTI (Jones and Dangl, 2006; Schwessinger and
Zipfel, 2008).
Flagellin is a bacterial PAMP that was shown to induce defence responses in tomato, potato,
tobacco and Arabidopsis (Felix et al., 1999). β-Glucan, a component of fungal cell wall
degradation, induces defence responses in tobacco (Klarzynski et al., 2000) and phytoalexin
accumulation rice (Yamaguchi et al., 2000). Likewise, chitin, also a component of fungal cell
wall, can induce plant cell wall lignification in wheat (Barber and Ride, 1994) and
phytoalexin accumulation in rice (Ito et al., 1997). These and other PAMPs have been
described in numerous plant species (Nürnberger et al., 2004) and illustrate the similarity in
their identity and their mode of their recognition.
PAMPs are recognised by pattern-recognition receptors (PRRs) in the plant that bind the
PAMP, leading to the activation of a PTI signal cascade. PRRs are classified as either
receptor-like protein kinases (RLKs) or receptor-like proteins (RLPs) depending on whether
an intracellular kinase domain is present or not (Zipfel, 2014). In Arabidopsis, the chitin-
binding protein was identified by Ito et al. (1997) and later described as the CEBiP protein
(Kaku et al., 2006). However, CEBiP in Arabidopsis was not involved in signalling, but
rather the CERK1 protein being the crucial receptor (Shinya et al., 2012). In rice CERK1 is
responsive to chitin elicitation, and required for the downstream activation of mitogen-
activated protein kinases, gene expression and the production of reactive oxygen species
(ROS) (Miya et al., 2007). CEBiP (structurally a RLP) and CERK1 (structurally a RLK)
were shown to interact, forming a dimeric complex. Homo-dimeric CEBiP/CEBiP dominates
in the cellular membrane, with chitin inducing the formation of the membrane associated
CEBiP/CERK1 complex. The current model of chitin induced PTI in rice proposes the
formation of a CEBiP/CERK1 complex, where CEBiP binds chitin and the associated
CERK1 activates signal transduction via protein phosphorylation (Shimizu et al., 2010).
19
Pathogens overcome PTI by producing effectors that enable the pathogen to suppress the
defence responses (Jones and Dangl, 2006) (see section 2.3.1). In the case of Puccinia spp.,
these effectors are believed to be delivered to the plant cell by the haustorium. By
suppressing PTI, effector triggered susceptibility (ETS) is established (Jones and Dangl,
2006) and infection may proceed.
Host plants in turn have evolved R genes which may directly or indirectly recognise a
specific effector protein. In doing so this effector protein has now become an avirulence
factor. This recognition results in the induction of a strong plant defence response called
effector triggered immunity (ETI) (Jones and Dangl, 2006). The interaction between the R
and Avr proteins (R-Avr interaction) renders a plant resistant and the pathogen avirulent,
thereby establishing host incompatibility. These plant-pathogen interactions are therefore
referred to as gene-for-gene interactions since products of the Avr and R genes interact (Van
der Biezen and Jones, 1998a).
Fungal pathogens are consequently under a strong selection pressure to negate the R-Avr
interaction and establish host compatibility (i.e. ETS). Plants in turn are under strong
selection pressure to re-establish host incompatibility (i.e. ETI) via an R-Avr interaction that
recognises the presence of pathogens. This continual evolutionary shift between ETS and
ETI, based on the specificity of the R-Avr interaction, is called the zig-zag plant defence
model (Jones and Dangl, 2006).
The PTI and ETI defence responses share similarities, such as the accumulation of secondary
metabolites, but ETI is regularly (although not exclusively) associated with the hypersensitive
response (HR) (Jones and Dangl, 2006). The HR is characterised by localised cell death in
cells in direct contact with the pathogen and in close proximity to the infection site, and is
visible as tissue necrosis on a plant. The cell death effectively restricts the spread of the
fungal pathogen and in the case of biotrophs, prevents the uptake of nutrients. The HR is
often associated with the so-called oxidative burst, whereby ROS such as hydrogen peroxide
(H2O2) and the superoxide anion (O2-) are formed (Mur et al., 2008). Comparing the
incompatible and compatible Pst responses in wheat, ROS was closely associated with the
HR. The incompatible interaction quickly sees H2O2 and O2- accumulate at infection sites,
whereas the compatible interaction accumulates H2O2 much later. In a study by Wang et al.
(2010) the HR associated with infection sites continually increased during the incompatible
interaction to reach 100% of infection sites, while during the same time interval the

20
compatible interaction showed the HR in less than 5% of infection sites. The delayed HR in
the compatible Pst-wheat interaction can also be correlated with the delayed induction of
H2O2 synthesis (Wang et al., 2007). In the incompatible interaction the accumulation of H2O2
was associated with the cell walls, plasmalemma and intercellular spaces in close proximity
to infection sites (Wang et al., 2010).
While ROS may be directly detrimental to the pathogen, H2O2 is important in cell wall
strengthening via the enzymatic action of peroxidases. Peroxidase is associated with cell
walls and plasma membranes in wheat cells close to Pst infection sites (Wang et al., 2010).
Peroxidases use H2O2 to catalyse the crosslinking of glycoproteins, such as lignin and
suberin, in the cell wall (Passardi et al., 2004). Lignin is a product of the phenylpropanoid
pathway with phenylalanine-ammonia lyase (PAL) being a key enzyme. The inhibition of
PAL activity in wheat decreases lignification and the HR associated with Pgt infection sites,
illustrating the importance of this enzyme (Moerschbacher et al., 1990). In barley infected
with B. graminis f. sp. hordei, H2O2 is also associated with the deposition of callose and
papillae formation to further reinforce the cell wall against penetration (Thordal‐Christensen
et al., 1997). Resistance granted to wheat by Sr5 and Sr36 was linked to callose deposition in
the guard cells, thereby forming a defensive barrier before appressorium formation.
Resistance granted by Sr6, Sr24 and Sr30 in turn was associated with a HR and lignification
(Wang et al., 2015).
Peroxidases form one of the classes of pathogen-related (PR) proteins, a group of proteins
rapidly induced by pathogen inoculation, which are linked with the inducible defence
response and HR (Van Loon et al., 2006). These proteins are subdivided into 17 recognised
classes, even though the properties of some are still unknown. These include β-1,3-
glucanases (PR2), chitinases (PR3, PR4, PR8 and PR11), peroxidases (PR5) and defensins
(PR12). β-1,3-glucanases hydrolyses the β-1,3-bonds in glucan, while chitinase in turn
hydrolyses the β-1,4-bonds in chitin. Both glucan and chitin are complex polymers present in
cell walls of pathogenic fungi. These PR proteins are therefore directly antifungal and
effectively degrade the pathogen cell wall (Mauch et al., 1988). Characterization of the wheat
β-1,3-glucanase activity confirmed higher expression levels during the incompatible
interaction with Pst and localization in the host cell wall and fungal extrahaustorial matrix
(Liu et al., 2010). The products of some enzymatic PR proteins such as β-glucan (Klarzynski
et al., 2000) and chitin (Barber and Ride 1994) also act as elicitors of further defense
response mechanisms. Upon infection by Pt, β-1,3-glucanase and chitinase activity is induced

21
in both resistant and susceptible wheat cultivars, but to greater levels in the resistant cultivar
(Anguelova-Merhar et al., 2001).
2.4.3 Acquired resistance
The inducible defence responses protect the plant at the site of infection but non-infected
plant tissues may also exhibit improved resistance against future pathogenic attack. The
feature is called acquired resistance (AR) and ensures that tissues are protected against
secondary infection (Van Loon, 1997). However, a distinction must be made between
localised acquired resistance (LAR) present in tissues in close proximity to the site of
infection, and systemic acquired resistance (SAR) present in distal tissues. In tobacco, LAR
was defined as only being present in the region of the leaf surrounding a lesion and SAR as
present in the rest of the leaf (Ross, 1961a; Ross, 1961b; Dorey et al., 1997) Alternatively,
LAR was defined as being present in the whole leaf where the primary infection occurred
(Malamy et al., 1996; Mur et al., 1996). The latter definition of LAR was proposed for barley
(Colebrook, 2010). For both definitions, SAR is present on all other leaves of the plant where
secondary infection may occur.
SAR has been confirmed in dicotyledonous plants and especially well described in
Arabidopsis and tobacco (Sticher et al.,1997; Gozzo and Faoro, 2013), but limited results
exist for monocotyledonous plants. B. graminis f. sp. tritici infection in barley granted SAR
to subsequent Magnaporthe grisea (Hebert) Barr infection on secondary leaves (Jarosch et
al., 2003). Ps. syringae and Exserohilum tercicum (Pass.) Leonards and Suggs induced SAR
in corn against Puccinia sorghi Schw. (Gautam and Stein, 2011). In barley, LAR was
confirmed against Ps. syringae and Ma. oryzae on the same leaf as on which primary
infection occurred. However, SAR was not observed for both pathogens on other leaves upon
secondary infection (Colebrook et al., 2012). In monocotyledonous plants, SAR therefore
requires further investigation.
Numerous systemic signals have been proposed including salicylic acid (SA), the derivative
methyl salicylate, jasmonic acid (JA), glycerol-3-phosphate, azelaic acid, dehydroabietinal
and pipecolic acid (Dempsey and Klessig, 2012; Gozzo and Faoro, 2013). The JA signalling
pathways are associated with the response to necrotrophic pathogens, the SA signalling
pathway with the response to biotrophic pathogens (Durrant and Dong, 2004) while the JA
and SA signalling pathways work antagonistically under the regulation of the NPR1 protein
(Spoel et al., 2003).

22
The signal transduction mechanism of SAR appears to be conserved in dicotyledonous and
monocotyledonous plants. The NPR1 signalling pathway is present in both rice (Chern et al.,
2001) and wheat (Makandar et al., 2006). Genes induced during LAR in barley against Ps.
syringae showed high similarity to those associated with SAR in Arabidopsis (Colebrook et
al., 2012). A systemic leaf extract from Arabidopsis could induce a SA signalling dependent
defence response in wheat (Chaturvedi et al., 2008) and SAR signals such as JA and SA
induced the β-1,3-glucanase accumulation (Liu et al., 2010). Putative systemic signals must
however be confirmed to be naturally transferred to distal tissue for SAR to be validated in
monocotyledonous plants. The potential of putative AR signals to induce a defence response
is of importance for crop protection against pathogens.
2.5 Modes of plant resistance
Understanding and applying the plant’s defence mechanisms has been of crucial importance
for crop protection. Broadly speaking plant resistance may be subdivided into non-host
resistance (NHR) and host resistance (Periyannan et al., 2017), although increasing evidence
indicates considerable overlap in the two modes of action. The vast majority of potential
pathogens do not have the ability to infect the majority of plant species and these are
considered non-host species and the resistance is called NHR. Both constitutive defence
mechanisms and a range of inducible defence responses are classified as NHR. Where a
specific plant-pathogen interaction may lead to susceptibility and disease symptoms the plant
is considered a host species (Mysore and Ryu, 2004). The resistance mechanism to counter
the pathogen is called host resistance and may be further subdivided into race-specific
resistance and race non-specific resistance.
2.5.1 Non-host resistance
In the past the inducible NHR was subdivided into type I NHR, where the HR is absent and
type II where the HR is present. Type I NHR has parallels with PTI (Mysore and Ryu, 2004)
and limits pathogenic infection during the earlier stages of the interaction. In Arabidopsis the
PEN3 gene grants NHR to B. graminis f. sp. hordei (Stein et al., 2006). PEN3 encodes an
ABC transporter that localises to the plant cell membrane and limits pathogen growth by
exporting toxins to the apoplast at the site of infection. In turn type II NHR has parallels with
ETI (Mysore and Ryu, 2004). The HR was observed in non-host interactions such as barley
infected with B. graminis f. sp. tritici (Hückelhoven et al., 2001) and tobacco infected with
Ps. syringae (Keith et al., 2003).

23
The type I/type II classification has however been replaced by a variable classification
system, whereby a continuum of responses exist between host and non-host plants. Atienza et
al. (2004) showed that phenotypic responses of barley infected with various Puccinia spp.
were statistically different. Barley was classified a non-host of Puccinai recondita Dietel and
Holw. and a host to Puccinia hordei G.H.Otth. However, when barley is infected with such
species such as Puccinia persistens Plowr. and Pt it may be ranked in an intermediate
position on the range of phenotypic responses spanning from host to non-host (Niks et al.,
2009).
The continuum of responses between host and complete non-host plants was further clarified
by a quantitative plant-rust interaction model that was proposed by Bettgenhaeuser et al.,
(2014). Thereby a plant is described as a host if the frequency of colonization and pustule
formation is high and nearly all infection sites develop pustules. If the frequency of these
traits is less and infection sites without eventual pustules formation are observed, the plant
may be called an intermediate host. If pustules formation does not occur, but there are still
some occurrences of colonization, a plant may be considered an intermediate non-host.
Finally if the frequency of colonization and pustule formation is approaching zero, the plant
would be described as a non-host (Bettgenhaeuser et al., 2014). A method to validate and
further test the model was proposed by Dawson et al., (2015) and determines percentage
colonization and pustule formation by fluorescence microscopy. The method presents barley
as an intermediate host of Pst and Brachypodium distachyon L. as an intermediate non-host
of Pst. As previously proposed, the intermediate non-host had exhibited fewer pustules of the
pathogen even though colonization did occur.
In rice, NHR effectively limits development of Puccinia spp. before the formation of
appressorium. However, if appressorium formation does occur, the majority of infection sites
develop infection hyphae. NHR in rice to Pgt, Pt, Pst and P. hordei involves H2O2
accumulation, callose deposition, but infrequent cell death. Even within a single leaf, the
NHR response of rice was variable, with a wide range of colony sizes being observed
(Ayliffe et al., 2011). The continuum therefore also exists between the PTI- and ETI-based
mechanisms that may be associated with NHR responses.
The genetic basis of NHR is under investigation since it may potentially convey resistance to
a plant that is an established host of a pathogen (Bettgenhaeuser et al., 2014). In barley, the
Rps6 locus was identified to contribute to intermediate NHR to Pst (Dawson et al., 2016; Li

24
et al., 2016). Characterizing the gene responsible for barley NHR and transforming it into
wheat may grant resistance to Pst. Though such advances in the understanding of NHR may
prove valuable in the future, historically race-specific resistance was the main focus of
research and breeding programmes.
2.5.2 Race-specific/R gene resistance
Race-specific resistance is the consequence of the incompatible gene-for-gene interaction
seen in plants (Flor, 1971). Genetic resistance implemented in agriculture is largely based on
this mode of resistance and is advantageous to breeders since it allows a single R gene to be
transferred into the genetic background of a high yielding, but potentially susceptible,
cultivar. When induced, the HR commonly associated with R gene resistance can rapidly
limit the spread of a pathogen. Race-specific resistance has also been called seedling
resistance, all-stage resistance, major resistance, vertical resistance or R gene resistance
(Lowe et al., 2011) but some of these descriptions may not hold true. Race-specific resistance
is often expressed during all stages of plant growth, thereby providing protection in seedlings
and allowing the early screening of resistant lines by breeders. The defence response induced
is based on the R-Avr interaction that triggers a defence response (Van der Biezen and Jones,
1998a).
2.5.2.1 R gene products as nucleotide-binding and a leucine-rich repeat proteins
The majority of race-specific R genes are known to encode proteins with a nucleotide-binding
and a leucine-rich repeat (NB-LRR) domain (Jones and Dangl, 2006). These proteins were
identified as the major receptors leading to the induction of ETI and the HR associated with
the R-Avr interaction (Van der Biezen and Jones, 1998b). NB-LRR proteins therefore stand
in contrast with the receptors of PTI that are most often RLKs or RLPs (Zipfel, 2014),
Since NB-LRR domains can hydrolyse adenosine triphosphate (ATP), they are classified as
belonging to the STAND (signal transduction ATPases with numerous domains) family of
proteins (Lukasik and Takken, 2009). In Arabidopsis, close to 200 genes encoding NB-LRR
proteins have been identified (Meyers et al., 2003). More recently, 1117 NB-LRR encoding
genes were identified in the wheat genome (Peng and Yang, 2017). The existing diversity
within NB-LRR domains most likely recognises various potential pathogenic challenges.
In general, NB-LRR proteins have one of two additional N-terminal domains and are
therefore described as either Toll/interleukin receptor-like (TIR)-NB-LRR proteins (Meyers

25
et al., 1999) or coiled-coil (CC)-NB-LRR proteins (Pan et al., 2000). NB-LRR proteins in
plants can be further grouped into four subclasses based on the presence of various domains
and their arrangement (Li et al., 2015). Typical NB-LRR proteins have a TIR or CC N-
terminal domain and other domains common to these classes of proteins. Truncated NB-LRR
proteins have lost one or more of these domains. NB-LRR proteins may also have an unusual
additional domain on the N-terminal or C-terminal side of the protein. Lastly NB-LRR
proteins may have unusual assemblies where domains have been rearranged and even
duplicated.
Comparative studies of the NB-LRR proteins in monocotyledonous and dicotyledonous
plants show independent evolutionary paths since divergence of these two groups of
flowering plants. In cereals, the TIR-NB-LRR subgroup appears to be absent (Pan et al.,
2000; Bai et al., 2002). CC-NB-LRR proteins and truncated NB-LRR proteins, lacking the
LRR domain, are however well represented (Bai et al., 2002). Further studies in other
monocotyledonous species also showed no TIR-NB-LRR proteins to be present (Tarr and
Alexander, 2009).
The NB domain is in close proximity to the ARC domain and these domains are collectively
called the NB-ARC domain (Van der Biezen and Jones, 1998b). ARC domains form protein
interactions with the LRR domain and assure auto-inhibition of the NB domain. Resistance
genes induce the HR and regulation of signal transduction is crucial to prevent unnecessary
cell death. Therefore NB-LRR proteins are in a default state of auto-inhibition. The presence
of pathogenic effectors cause conformational changes of the NB-LRR proteins, thereby
releasing the auto-inhibitory effect of the LRR domain, leaving the NB domain free to
interact with signalling proteins (Lukasik and Takken, 2009).
The strong association of NB-LRR domains with disease perception has placed the focus on
genes encoding these domains. Bioinformatics techniques can be used to predict the NB-LRR
domains within plant proteins. Computationally, a total of 438 genes with NB-LRR domains
were identified in potato (Jupe et al., 2012), which increased to 755 when resistance gene
enrichment sequencing (RenSeq) was used. The identified potato NB-LRR proteins were
used to computationally predict 394 putative NB-LRR proteins in tomato (Jupe et al., 2013).
RenSeq in tomato could directly annotate only 355 NB-LRR proteins, which is less than half
of potato, but still includes 105 novel tomato NB-LRR proteins (Andolfo et al., 2014). The
bioinformatics tool NLR-parser has now been developed to predict NB-LRR proteins in any

26
plant (Steuernagel et al., 2015). A further variation on RenSeq, called Mut RenSeq, has
allowed the identification the Sr22 and Sr45 genes from wheat as encoding NB-LRR
(Steuernagel et al., 2016).
2.5.2.2 Functioning of nucleotide-binding and a leucine-rich repeat proteins
NB-LRR proteins function cooperatively. In wheat, the Lr10 resistance gene encodes a CC-
NB-LRR protein that lies in close genetic proximity to a resistance gene analog 2 (RGA2)
gene (Feuillet et al., 2003). The resistance conferred by Lr10 is dependent on RGA2. The N
terminus domain of Lr10 is under selection pressure, identifying it as the effector interacting
protein, while RGA2 may act downstream during signal transduction (Loutre et al., 2009).
Likewise resistance conferred by rpg4 to barley against Pgt is dependent on three genes in
close genetic proximity, namely Rpg5 (a resistance gene against Puccinia graminis f. sp.
secalis Erikss. and Henning), HvRga1 (another NB-LRR encoding gene) and HvAdf3 (a gene
with homology to actin depolymerizing factors) (Wang et al., 2013).
The cooperative function of NB-LRR proteins also works through the formation of polymeric
complexes. In rice RGA4 and RGA5 are both required to induce a HR in the presence of the
Ma. oryzae effector AVR1-CO39. Recognition of AVR1-CO39 and another effector (AVR-
Pia) occurs directly by the C-terminal domain of RGA5. This supports a direct R-Avr
interaction and recognition of multiple effectors by a single NB-LRR (Césari et al., 2013).
RGA4 is essential for the induction of the HR while RGA5 most likely negatively regulates
RGA4. Furthermore, RGA4 and RGA5 form both homo- and hetero-dimeric complexes
though the interaction of their N-terminal CC domains. The model proposes that in the
RGA4/RGA5 dimer complex, RGA5 recognises effectors through the C-terminal RATX1
domain, where after conformational changes release the negative regulation of RGA4 that
leads to signal transduction and the eventual HR (Césari et al., 2014b). In Arabidopsis, the
PopP2 effector from Ralstonia solanacearum Smith and the RRS1 resistance protein directly
interact. This R-Avr interaction does not involve the additional C-terminal domain in RRS1,
a WRKY domain (Deslandes et al., 2003). RRS1 and another resistance protein RPS4 also
form a dimeric complex that interacts at the N-terminal TIR domain. In this model the
RPS4/RRS1 dimer conformation inhibits ETI signal transduction via the TIR domain of
RPS4, but recognition of an effector by RRS1 releases inhibitory conformation (Williams et
al., 2014).
27
The nature of the R-Avr interaction is under continual investigation to determine whether this
interaction is direct or indirect. The former proposes a protein-protein interaction between the
R and Avr gene products within the host plant (Dangl and Jones, 2001). Direct protein-
protein interaction was shown in the interaction of flax (Linum usitatissimum L.) and the
causal agent of flax rust (M. lini) (Dodds et al., 2006). Positive interactions in the yeast two-
hybrid system between AvrL567 avirulence protein variants and L resistance proteins
corresponded to the phenotypic responses of flax lines when exposed to the corresponding
avirulence protein variants.
An indirect R-Avr interaction in turn was first proposed by Van der Biezen and Jones
(1998a). The guard model proposes that the R gene product recognises the modification made
by an effector to another protein, rather than the effector directly. The modified protein is
called the guardee and the alteration is perceived by the R gene product (Dangl and Jones,
2001). Formally the model is based on a number of principles. Firstly, the effector targets one
or multiple guardees in the plant host. Secondly, alteration of the guardees leads to
susceptibility of the host in the compatible interaction. Finally, alteration of a guardee
generates a molecular pattern that may be perceived by a corresponding R protein in the
incompatible interaction.
Validation of the guard model can be seen for Arabidopsis protein RIN4 and its role during
Ps. syringae infection. RIN4 is required for resistance granted by the RPS2. The RIN4 and
RPS2 proteins are membrane associated (Axtell et al., 2003a) and directly interact (Mackey
et al., 2003). RIN4 serves to negatively regulate RPS2 activity when the pathogen is absent
(Belkhadir et al., 2004). However, RIN4 is targeted and degraded by the AvrRpt2 effector
(Axtell et al., 2003a; Mackey et al., 2003). AvrRpt2 is a cysteine protease (Axtell et al.,
2003b) that cleaves RIN4 and potentially a large number of other Arabidopsis proteins
containing the target cleavage site (Chisholm et al., 2005). The action of AvrRpt2 shows that
the putative function of the effector in virulence is by protein degradation (Chisholm et al.,
2005). Degradation of RIN4 in particular releases the inhibition of RPS2, which leads to the
induction of defence (Day et al., 2005). RIN4 therefore acts as the guardee, which when
modified, activates RPS2, triggering defence responses leading to resistance.
The existence of both direct and indirect R-Avr interactions may be explained by host
specificity. By this hypothesis an indirect R-Avr interaction is associated with pathogens that
infect multiple hosts such as Ps. syringae. A direct R-Avr interaction is associated with a

28
pathogen that is specialised for a single plant host, with strong selection pressure driving the
co-evolution of R and Avr genes (Dodds et al., 2006; Jones and Dangl, 2006). However, the
RPS4/RRS1 NB-LRR dimer grants resistance in Arabidopsis to Colletotrichum
higginsianum, Ralstonia solanacearum and Ps. syringae (Narusaka et al., 2009). The
interaction between RRS1 and some effectors are known to be direct (Deslandes et al., 2003),
challenging the association of direct effector recognition and a single specific plant-pathogen
interaction.
Further modes of interaction between the R and Avr gene products that are variations of the
guard model, have also been proposed. The decoy model proposes that along with the target
of an effector protein, a number of decoy targets may also exist. Modification of target
proteins by an effector typically leads to increased pathogenicity, but the modification of a
decoy does not. The presence of these decoys theoretically then improves the chance of the R
protein perceiving the modification made by an effector (Van der Hoorn and Kamoun, 2008).
Support for the decoy model is found during the infection of tomatoes (Solanum
lycopersicum L.) with C. fulvum (Shabab et al., 2008). The fungus produces the AVR2
effector, a protease inhibitor that targets two papain-like cysteine proteases PIP1 and RCR3.
Both are transcriptionally induced during benzothiadiazole treatment, but PIP1 protein levels
are more abundant and most likely the target of AVR2. RCR3 is required by the Cf-2
resistance protein for resistance against C. fulvum (Dixon et al., 2000). RCR3, like PIP1, is
under strong selection pressure. Therefore RCR3 may act as a decoy that induces the defence
response when modified by AVR2, although PIP1 is the true target (Shabab et al., 2008).
The integrated decoy hypothesis proposes that a decoy may be incorporated into a NB-LRR
as an additional domain. The effector directly modifies this domain by binding, resulting in
conformational changes that start a signalling cascade (Césari et al., 2014a). The integrated
decoy model is based on dimeric NB-LRR proteins such as RGA4/RGA5 in rice (Césari et
al., 2014b) and RPS4/RRS1 in Arabidopsis (Williams et al., 2014). In such a NB-LRR dimer,
one element acts as ‘receptor’ NB-LRR and has an additional or unusual domain that act as
the decoy. The other protein in the dimer is the ‘signalling’ NB-LRR protein that, once
activated by the first NB-LRR, leads to signal transduction (Césari et al., 2014a).
Commentary on the integrated decoy hypothesis highlighted that domains that sense effector
modification need not necessarily be decoys and may still have functionality. If functionality

29
was lost, it is also unknown if this occurred before or after incorporation into NB-LRR
proteins (Wu et al., 2015). These hypotheses must however be tested further.
2.5.2.3 Durability of R gene resistance
The specificity of the R-Avr interaction determines which race of the pathogen is virulent on
which plant cultivar, hence the term race-specific resistance. The defence response places the
particular race of the pathogen under a selection pressure to negate the interaction and re-
establish virulence. New races of fungal pathogens develop when selection pressure leads to
the breakdown of the effectiveness of R genes. The ‘Ug99’ race group of Pgt developed with
the breakdown of a number of widely implemented Sr genes (see section 2.2.3.1). This
highlights a disadvantage associated with R gene resistance. Though some of these Sr genes
may have become ineffective, resistance is still granted to the ‘Ug99’ race group by a
provisional list of 39 known Sr genes (Singh et al., 2015). However, if R genes are not
correctly utilised, new races of Puccinia spp. will continue to emerge and if an R gene is
widely implemented epidemics may occur. When researchers implement resistance genes
irresponsibly a continued ‘boom-and-bust’ cycle may occur (McDonald and Linde, 2002). A
paradigm shift is therefore required to shift away from the widespread implementation of
single gene resistance.
Multiple R genes may be combined to attempt to assure durability in wheat. The approach is
called gene pyramiding or stacking and is based on the principle that multiple resistance
genes require multiple mutations within the pathogen to overcome resistance, thereby
decreasing the likelihood of the emergence of a new virulent race (Joshi and Nayak, 2010).
Identifying and linking R genes on a large genome such as wheat have proven to be
challenging (Hulbert and Pumphrey, 2014). Sr24 has however been successfully pyramided
in various combinations with Sr26, Sr31, and SrR (Mago et al., 2011).
A key theme in combatting resistance breakdown and potential rust epidemics is the
implementation of durable resistance. Durable resistance is resistance that is effectively
granted to a plant cultivar over an extended period of time in an environment usually suitable
for disease development (Johnson, 1979). Plant resistance may be seen as a continuum from
most to least durable, with NHR considered most durable and race-specific resistance non-
durable (Gurr and Rushton, 2005). Another type of host resistance, termed race non-specific
resistance (Periyannan et al., 2017) has the immediate potential of practical durability in
current wheat breeding programmes.

30
2.5.3 Race non-specific/adult plant resistance
Race non-specific resistance has also been called slow-rusting resistance, partial resistance,
field resistance, horizontal resistance or adult plant resistance (APR) (Lowe et al., 2011).
APR is resistance that is only effective at later plant growth stages, with resistance often
becoming more effective as the plant matures (Gustafson and Shaner, 1982). APR is usually
partial and often race non-specific. Many forms of rust APR are slow-rusting, working by
slowing down the development of the disease. Although multiple race non-specific resistance
genes are usually required to achieve an effective level of resistance, it is worth noting genes
such as Rpg1, Lr34, Yr36 and Lr67 that may convey effective resistance on their own.
Rpg1 in barley encodes two tandem protein kinase domains (Brueggeman et al., 2002). In
wheat, Lr34 encodes an adenosine triphosphate-binding cassette (ABC) transporter protein
(Krattinger et al., 2009), Yr36 for a kinase with a START domain (Fu et al., 2009) and Lr67
is for a hexose transporter protein (Moore et al., 2015). Though these single race non-specific
resistance genes have diverse protein products, all lack the NB-LRR domain characteristic of
known R gene products in wheat, barley and maize (Singh et al., 2015). These genes are not
only race non-specific but may also be species non-specific. For example, Lr67 not only
grants resistance to Pt but also Pst, Pgt and B. graminis f. sp. tritici (Hiebert et al., 2010;
Herrera-Foessel et al., 2011; Herrera-Foessel et al., 2014) and has subsequently been
synonymised with Yr46, Sr55 and Pm46. Importantly all these genes grant APR and have
proven durable thus far.
The Lr34 gene in wheat also grants resistance against all three Puccinia spp. and B. graminis
f. sp. tritici (Krattinger et al., 2009). As an ABC transporter, Lr34 shows similarity to PEN3
in Arabidopsis identified by Stein et al. (2006) which grants NHR by exporting toxins to the
apoplast. Pt infection of Lr34 containing wheat differentially expressed 151 genes compared
to uninfected resistant wheat. Upregulated genes included those encoding PR proteins, signal
transduction components and enzymes responsible for energy production and metabolism that
points to a high energy demand during the induced defence response (Bolton et al., 2008).
Lr34 transformed barley exhibited Lr34 resistance and inhibited the growth of P. hordei, B.
graminis f. sp. hordei and Pgt (Risk et al., 2013). Rice transformed with Lr34 gained partial
resistance to M. oryzae that was associated with maturation in the plant (Krattinger et al.,
2016).

31
The Yr39 resistance gene restricted fungal growth shortly after infection of wheat with Pst
and potentially before haustorium formation (Coram et al., 2008). The APR response induced
99 transcripts encoding PR proteins, enzymes of the phenylpropanoid pathway and R protein
analogs. Transcriptomic analysis of Pst-infected wheat with the single APR gene Yr39,
compared to the race-specific Yr5 resistance gene, showed a greater diversity of transcripts
with the APR response. Along with β-1,3-glucanase and PAL, a total of nine R gene analogs
were also induced. It was proposed that the R proteins are all under the regulation of Yr39
and that they additively contribute to durability, since each may regulate different defence
components (Chen et al., 2013).
Of the 39 known Sr genes that are considered effective against the ‘Ug99’ race group, only
five confer APR, namely Sr2, Sr55, Sr56, Sr57 and Sr58 (Singh et al., 2015). Sr2
independently conveys partial resistance and under high inoculation levels may exhibit a
susceptible phenotype (Ellis et al., 2014). However, Sr2 is considered the most important Pgt
resistance gene (McIntosh et al., 1995) due to its continued durability and incorporation into
breeding programmes. Sr2 is often combined with other genes in a Sr2-complex, but the
identity of this gene combination is not always known (Ellis et al., 2014).
Durable resistance is usually based on numerous genes working additively. The identification
of a genetic region within the plant genome that contributes a partial, quantitative resistance
is referred to as quantitative trait loci (QTL). Lr34 and Yr36 are examples of single genes that
appear as QTL. Some researchers have designated a QTL that explains greater than 10% of
the phenotypic response as a major QTL and less than 10% of the phenotypic response a
minor QTL (Kou and Wang, 2010). APR in the South African wheat cultivar Kariega based
on two major and two minor QTL acted additively when conferring resistance to Pst
(Moldenhauer et al., 2008).
A review of APR identified, over a period of 15 years, 80 QTL for Pt resistance and 119 QTL
for B. graminis f. sp. tritici resistance (Li et al., 2014). Breeders therefore have a large
collection of QTL to utilise. However, not all resistance QTL will be durable. Mapping
techniques have shifted away from linkage mapping to genome-wide association analysis
(GWAS) (Li et al., 2014). Modelling predicts GWAS to be an effective approach for the
mapping of QTL for APR against Pgt within International Maize and Wheat Improvement
Center germplasm. Interestingly, the Sr2 region on chromosome 3B of wheat remains crucial
for APR within this germplasm (Rutkoski et al., 2014).

32
Gene pyramiding must be applied to both race specific and race non-specific resistance
genes. The advantage of gene pyramiding can be seen in resistance against Pt which is much
greater in wheat cultivars when Lr34 is combined with other Lr genes (Kloppers and
Pretorius, 1997). QTL have been successfully combined for resistance to the three Puccinia
spp. along with grain quality traits (Tyagi et al., 2014). Only with such advances may durable
resistance in wheat be assured.
Searching for new APR wheat cultivars and mapping QTL have great value for the future of
resistance breeding. Identification of QTL is of importance since it increases the pool of
genes/loci that a plant breeder can use to select from. New gene combinations can be
explored and placed into high yielding cultivar backgrounds. Recent developments in NGS
have allowed the generation of large data sets for detailed genetic studies, but a more
multifaceted and integrated approach to understanding plant-pathogen interactions is needed
(Saunders, 2015). APR must likewise be investigated and not only aim to identify genetic
sources of resistance but also to describe molecular and cellular mechanisms underlying the
APR response.

33
Chapter 3: Experimental layout of greenhouse trials
and inoculation methods

34
3.1 Introduction
Fungal diseases that affect wheat (Triticum aestivum) include stem rust caused by Puccinia
graminis f. sp. tritici (Pgt). On wheat, Pgt infection causes brown uredinia (pustules) on the
surfaces of leaves, stems, leaf sheaths, spikes, glumes, awns and grains (Roelfs et al., 1992;
Leonard and Szabo, 2005). As an obligate biotroph, the successful infection and colonisation
of wheat requires Pgt to absorb nutrients from its host. By directing photosynthetic products
away from host tissue, Pgt infection affects wheat development and ultimately agricultural
productivity (Leonard and Szabo, 2005). Pgt causes epidemics if susceptible cultivars are
widely deployed. Recently, wheat yield losses of 51% caused by Pgt were reported (Olivera
et al., 2015). Farmers in turn aim to reduce losses in wheat production by planting resistant
cultivars. Adult plant resistance (APR) is a type of resistance which is more effective in older
plants, typically conferring no protection at the seedling stage.
Seedling infection types produced by Pgt, as well as P. triticina (Pt) and P. striiformis f. sp.
tritici (Pst), are commonly assessed on primary seedling leaves (Roelfs et al., 1992). Scoring
of infection types on differential sets of wheat varieties is the basis of Pgt race classification,
e.g. as used by the North American system of nomenclature (Roelfs and Martens, 1988).
However, phenotypic scoring of seedlings cannot be used to classify APR, which typically
shows a susceptible infection type during the seedling phase. A noteworthy exception is the
APR gene Sr2, which is linked to chlorosis in seedling leaves. Seedling chlorosis associated
with Sr2 proved an effective phenotypic marker for this gene, but its expression is subject to
environmental variation (Brown, 1997).
Phenotypic scoring of Pgt infection on adult plants is usually done on the flag leaf sheath and
true stem. In contrast, Pt and Pst are scored on the flag leaf, but the entire plant may be
considered for Pst scoring (Roelfs et al., 1992). Any study of APR mechanisms is
underpinned by an understanding and classification of the APR phenotype.
The aim of this chapter was to firstly generate Pgt-inoculated adult wheat plants under
greenhouse conditions. Secondly, to describe and score the adult plant infection responses on
the flag leaf sheath of a number of APR lines. Throughout the study the APR lines were
compared to a susceptible wheat line. Lastly, the aim was to generate Pgt-inoculated flag leaf
sheath samples for subsequent experimentation.
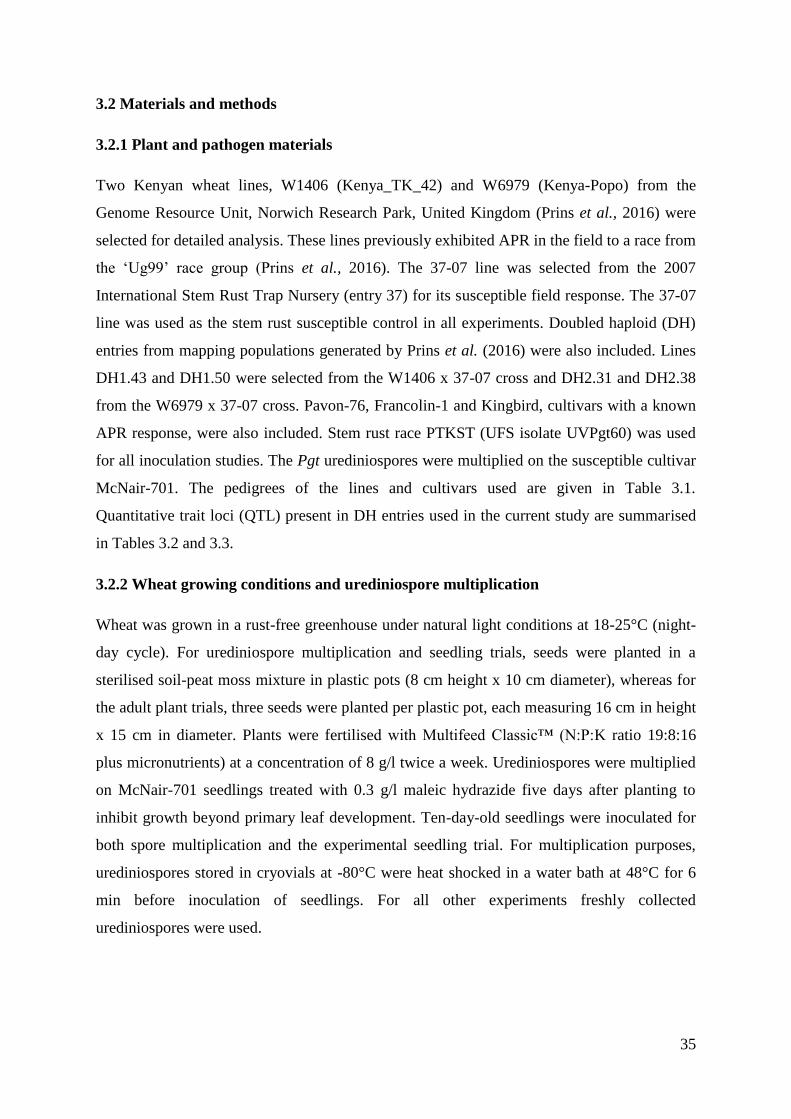
35
3.2 Materials and methods
3.2.1 Plant and pathogen materials
Two Kenyan wheat lines, W1406 (Kenya_TK_42) and W6979 (Kenya-Popo) from the
Genome Resource Unit, Norwich Research Park, United Kingdom (Prins et al., 2016) were
selected for detailed analysis. These lines previously exhibited APR in the field to a race from
the ‘Ug99’ race group (Prins et al., 2016). The 37-07 line was selected from the 2007
International Stem Rust Trap Nursery (entry 37) for its susceptible field response. The 37-07
line was used as the stem rust susceptible control in all experiments. Doubled haploid (DH)
entries from mapping populations generated by Prins et al. (2016) were also included. Lines
DH1.43 and DH1.50 were selected from the W1406 x 37-07 cross and DH2.31 and DH2.38
from the W6979 x 37-07 cross. Pavon-76, Francolin-1 and Kingbird, cultivars with a known
APR response, were also included. Stem rust race PTKST (UFS isolate UVPgt60) was used
for all inoculation studies. The Pgt urediniospores were multiplied on the susceptible cultivar
McNair-701. The pedigrees of the lines and cultivars used are given in Table 3.1.
Quantitative trait loci (QTL) present in DH entries used in the current study are summarised
in Tables 3.2 and 3.3.
3.2.2 Wheat growing conditions and urediniospore multiplication
Wheat was grown in a rust-free greenhouse under natural light conditions at 18-25°C (night-
day cycle). For urediniospore multiplication and seedling trials, seeds were planted in a
sterilised soil-peat moss mixture in plastic pots (8 cm height x 10 cm diameter), whereas for
the adult plant trials, three seeds were planted per plastic pot, each measuring 16 cm in height
x 15 cm in diameter. Plants were fertilised with Multifeed Classic™ (N:P:K ratio 19:8:16
plus micronutrients) at a concentration of 8 g/l twice a week. Urediniospores were multiplied
on McNair-701 seedlings treated with 0.3 g/l maleic hydrazide five days after planting to
inhibit growth beyond primary leaf development. Ten-day-old seedlings were inoculated for
both spore multiplication and the experimental seedling trial. For multiplication purposes,
urediniospores stored in cryovials at -80°C were heat shocked in a water bath at 48°C for 6
min before inoculation of seedlings. For all other experiments freshly collected
urediniospores were used.

36
Table 3.1: Pedigrees of wheat lines used in the current study. Information was either retrieved
from the Genetic Resources Information System for Wheat and Triticale, available at
http://wheatpedigree.net/ [accessed 03-04-2017] or was previously reported in Prins et al.
(2016).
Line/Cultivar Pedigree
37-07 Kasyob/Genaro-81//Cham4
W1406 Penjamo-62/908-Frontana-1//Kentana-54-B
W6979 Klein-Atlas/Tobari-66//Centrifen/3/Bluebird/4/Kenya-Fahari
Pavon-76 Icam-71//Ciano-67/Siete-Cerros-66/3/Kalyansona/Bluebird
Francolin-1 Waxwing*2/Vivitsi
Kingbird Tam-200/Tui/6/Pavon-76//Car-422/Anahuac-
75/5/Bobwhite/Crow//Buckbuck/Pavon-76/3/Yecora-70/4/Trap-1
McNair-701 (S)McNair-2203
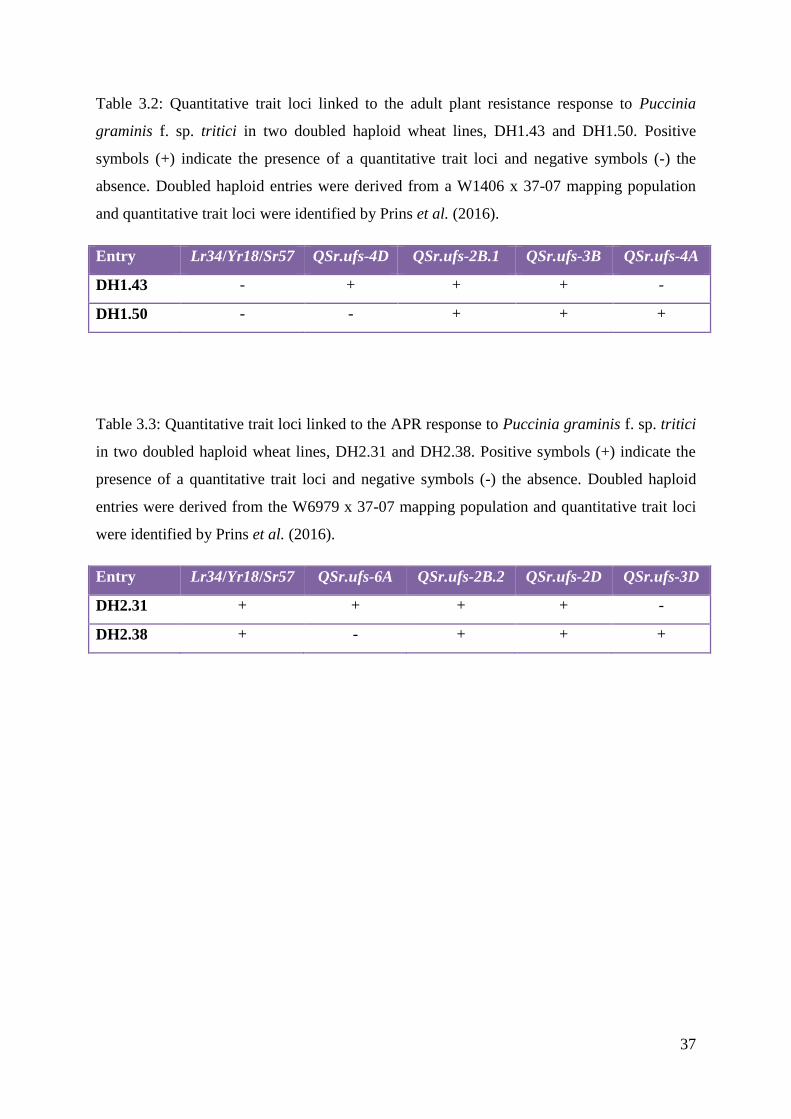
37
Table 3.2: Quantitative trait loci linked to the adult plant resistance response to Puccinia
graminis f. sp. tritici in two doubled haploid wheat lines, DH1.43 and DH1.50. Positive
symbols (+) indicate the presence of a quantitative trait loci and negative symbols (-) the
absence. Doubled haploid entries were derived from a W1406 x 37-07 mapping population
and quantitative trait loci were identified by Prins et al. (2016).
Entry Lr34/Yr18/Sr57 QSr.ufs-4D QSr.ufs-2B.1 QSr.ufs-3B QSr.ufs-4A
DH1.43 - + + + -
DH1.50 - - + + +
Table 3.3: Quantitative trait loci linked to the APR response to Puccinia graminis f. sp. tritici
in two doubled haploid wheat lines, DH2.31 and DH2.38. Positive symbols (+) indicate the
presence of a quantitative trait loci and negative symbols (-) the absence. Doubled haploid
entries were derived from the W6979 x 37-07 mapping population and quantitative trait loci
were identified by Prins et al. (2016).
Entry Lr34/Yr18/Sr57 QSr.ufs-6A QSr.ufs-2B.2 QSr.ufs-2D QSr.ufs-3D
DH2.31 + + + + -
DH2.38 + - + + +

38
3.2.3 Seedling trial
The inoculation method described by Browder (1971), where urediniospores are suspended in
light mineral oil (Soltrol-130™) to a final concentration of 1 mg/ml, was used. A spore
suspension volume of 800 µl was used to inoculate four pots of seedlings. The spore
suspension was transferred into a gelatin capsule that was attached to an atomiser, and using a
pressure pump sprayed onto seedlings on a platform rotating at 14 rpm. After drying off the
plants for 2 h at 25°C under fluorescent lighting, seedlings were incubated for 16 h in the
dark in a dew chamber at 20-23°C. Before transferring seedlings back to the greenhouse, they
were dried off at 20°C for 2 h under fluorescent lighting. First leaves were collected at
designated hours post inoculation (hpi)/days post inoculation (dpi) for further
experimentation. Phenotypic observations were done at 12 dpi and infection types scored
according to Stakman et al. (1962).
3.2.4 Adult plant trials
For adult plant trials, seedlings were thinned to two plants per pot. Wheat plants were grown
until the milk to dough stage (Zadoks scale 77-83; Zadoks et al., 1974) and inoculated
according to the method developed by Pretorius et al. (2007) and modified by Bender et al.
(2016). Freshly collected urediniospores were suspended in distilled water containing 0.003%
(v/v) Tween 20® (polyoxyethylene (20) sorbitan monolaurate) to a final concentration of 0.7
mg/ml. A spore suspension of 80 ml was used to inoculate plants in seven randomised pots. A
compressed air sprayer (spray-gun and compressor) at 250 kPa was used to apply the spore
suspension uniformly on adult plants. Inoculated plants were incubated in chambers
measuring 100 cm x 85 cm x 60 cm that were constructed from an aluminium frame covered
with 200 μm plastic sheeting (Bender et al., 2016). The chambers were submerged in 5 cm
water to assure high humidity. Pots were randomly placed on a metal grid raised above the
water line with 28 pots in each chamber. Plants within chambers were kept under greenhouse
conditions and natural light for 20 h. During incubation, the temperature fluctuated between
20 and 28˚C within the chambers. After removal, plants were grown under greenhouse
conditions as previously described in section 3.2.2.

39
The last internode was sampled since this section is routinely used for phenotypic scoring of
stem rust on adult wheat plants (Roelfs et al., 1992). The wheat stem was cut just below the
flag leaf and above the flag-1 leaf with the head and peduncle being discarded (Figure 3.1).
The flag leaf sheaths of the last internode were collected at selected hpi/dpi. Phenotypic
observations of the last internode were done at 14 dpi and the adult plant infection response
scored using the method of Roelfs et al. (1992). Adult wheat trials were independently
replicated in the greenhouse, and details of respective trials and methods used are given in
Table 3.4.

40
Figure 3.1: Sampling of the leaf sheath from adult wheat plants. The head (H), peduncle (P),
flag leaf (FL) and last internode (LI) are indicated.

41
Table 3.4: Summary of greenhouse trials performed and methods used to investigate
generated samples. One seedling trial and four adult trial replicates (Adult trial 1-4) with lines
37-07, W1406 and W6979 were conducted. Of these, two adult plant trials included
additional doubled haploid entries (Adult trial 3-4). Two other replicate trials (Adult trial 5-6)
made use of the 37-07 line, and the Pavon-76, Francolin-1 and Kingbird cultivars.
Trial Line/Entry/Cultivar Methods used for investigation
Seedling trial 37-07, W1406, W6979
Phenotype, reverse transcriptase
quantitative polymerase chain reaction
(RT-qPCR)
Adult trial 1 37-07, W1406, W6979
Phenotype, histology, chitin biomass,
RT-qPCR, Illumina sequencing, Ion
Torrent sequencing
Adult trial 2 37-07, W1406, W6979
Phenotype, histology, chitin biomass,
RT-qPCR, Ion Torrent sequencing
Adult trial 3 37-07, W1406, DH1.43,
DH1.50, W6979, DH2.31,
DH2.38
Phenotype, RT-qPCR, Ion Torrent
sequencing (excluding DH entries)
Adult trial 4 37-07, W1406, DH1.43,
DH1.50, W6979, DH2.31,
DH2.38
Phenotype, RT-qPCR
Adult trial 5 37-07, Pavon-76, Francolin-1,
Kingbird
Phenotype, RT-qPCR
Adult trial 6 37-07, Pavon-76, Francolin-1,
Kingbird
Phenotype, RT-qPCR

42
3.3 Results
3.3.1 Seedling trial
The seedling infection types of wheat lines 37-07, W1406 and W6979 are shown in Figure
3.2. Large uredinia, typical of Pgt infection were observed on the primary leaves of all three
lines. Based on the phenotypic classification system of Stakman et al. (1962), the 37-07 and
W1406 lines showed an infection type of 4, while the W6979 line showed an infection type
of 3++.
3.3.2 Adult plant trials
Uredinia developed on flag leaf sheaths of all lines used in this study but levels of infection
differed between lines. The adult plant infection response of the wheat lines 37-07, W1406
and W6979 are shown in Figures 3.3, 3.4, 3.5 and 3.7, each showing phenotypes observed in
one of the four biological replicate trails (Adult trial 1-4, respectively). Figures 3.6 and 3.8
show wheat lines DH1.43, DH1.50, DH2.31 and DH2.38 included in the third and fourth
biological replicates (Adult trial 3 and 4). Finally, the adult plant infection response of wheat
lines 37-07, Pavon-76, Francolin-1 and Kingbird are indicated in Figures 3.9 and 3.10. These
observed phenotypes represent the two biological replicates done for additional APR
cultivars (Adult trial 5 and 6).
Adult plant infection responses were phenotypically classified based on the system of Roelfs
et al. (1992) and results are summarised in Table 3.5. The phenotypic response of the 37-07
line was scored susceptible (S) in all six trials, with this line having the highest levels of Pgt
infection. The phenotypic response of the W1406 line varied from moderately resistant (MR)
to moderately susceptible (MS), and the infection response of line W6979 varied from
resistant to moderately resistant (RMR) to MR. Both lines therefore had a lower level of Pgt
infection than 37-07, but W1406 had a marginally higher level of infection compared to
W6979.

43
Figure 3.2: Seedling infection types of three wheat lines (37-07, W1406 and W6979) when
inoculated with Puccinia graminis f. sp. tritici race PTKST. Photographs represent the
abaxial surface of primary leaves at 12 dpi. The infection types of seedlings were scored
according to the method of Stakman et al. (1962) and are indicated in brackets.
37-07
(4) W6979
(3++)
W1406
(4)

44
Figure 3.3: Adult plant infection response of the three wheat lines 37-07, W1406 and W6979
inoculated with Puccinia graminis f. sp. tritici race PTKST. Photographs represent the flag
leaf sheath of the last internode at 14 dpi. Lines were inoculated for the first biological
replicate (Adult trial 1). Adult plant infection responses were scored according to the method
of Roelfs et al. (1992) and are indicated in brackets: resistant to moderately resistant (RMR),
moderately resistant (MR) or susceptible (S).
37-07
(S)
W6979
(RMR)
W1406
(MR)

45
Figure 3.4: Adult plant infection response of the three wheat lines 37-07, W1406 and W6979
inoculated with Puccinia graminis f. sp. tritici race PTKST. Photographs represent the flag
leaf sheath of the last internode at 14 dpi. Lines were inoculated for the second biological
replicate (Adult trial 2). Adult plant infection responses were scored according to the method
of Roelfs et al. (1992) and are indicated in brackets: moderately resistant (MR) and
susceptible (S).
37-07
(S) W6979
(MR) W1406
(MR)

46
Figure 3.5: Adult plant infection response of the three wheat lines 37-07, W1406 and W6979
inoculated with Puccinia graminis f. sp. tritici race PTKST. Photographs represent the flag
leaf sheath of the last internode at 14 dpi. Lines were inoculated for the third biological
replicate (Adult trial 3). Adult plant infection responses were scored according to the method
of Roelfs et al. (1992) and are indicated in brackets: moderately resistant (MR), moderately
resistant to moderately susceptible (MRMS) and susceptible (S).
37-07
(S) W6979
(MR)
W1406
(MRMS)

47
Figure 3.6: Adult plant infection response of the four doubled haploid wheat lines DH1.43,
DH1.50, DH2.31 and DH2.38 inoculated with Puccinia graminis f. sp. tritici race PTKST.
Photographs represent the flag leaf sheath of the last internode at 14 dpi. Lines were
inoculated for the third biological replicate (Adult trial 3). Adult plant infection responses
were scored according to the method of Roelfs et al. (1992) and are indicated in brackets:
moderately resistant (MR) and moderately susceptible (MS).
DH1.43
(MR)
DH2.31
(MS)
DH1.50
(MS)
DH2.38
(MS)

48
Figure 3.7: Adult plant infection response of the three wheat lines 37-07, W1406 and W6979
inoculated with Puccinia graminis f. sp. tritici race PTKST. Photographs represent the flag
leaf sheath of the last internode at 14 dpi. Lines were inoculated for the fourth biological
replicate (Adult trial 4). Adult plant infection responses were scored according to the method
of Roelfs et al. (1992) and are indicated in brackets: moderately resistant (MR), moderately
susceptible (MS) and susceptible (S).
37-07
(S) W6979
(MR)
W1406
(MS)

49
Figure 3.8: Adult plant infection response of the four doubled haploid wheat lines DH1.43,
DH1.50, DH2.31 and DH2.38 inoculated with Puccinia graminis f. sp. tritici race PTKST.
Photographs represent the flag leaf sheath of the last internode at 14 dpi. Lines were
inoculated for the third biological replicate (Adult trial 4). Adult plant infection responses
were scored according to the method of Roelfs et al. (1992) and are indicated in brackets:
moderately resistant (MR), moderately resistant to moderately susceptible (MRMS) and
moderately susceptible (MS).
DH1.43
(MRMS)
DH2.31
(MS)
DH1.50
(MR)
DH2.38
(MS)

50
Figure 3.9: Adult plant infection response of the four wheat lines 37-07, Francolin-1,
Kingbird and Pavon-76 inoculated with Puccinia graminis f. sp. tritici race PTKST.
Photographs represent the flag leaf sheath of the last internode at 14 dpi. Lines were
inoculated for the fifth biological replicate (Adult trial 5). Adult plant infection responses
were scored according to the method of Roelfs et al. (1992) and are indicated in brackets:
moderately resistant (MR) and susceptible (S).
Kingbird
(MR)
Francolin-1
(MR)
Pavon-76
(MR)
37-07
(S)

51
Figure 3.10: Adult plant infection response of the four wheat lines 37-07, Francolin-1,
Kingbird and Pavon-76 inoculated with Puccinia graminis f. sp. tritici race PTKST.
Photographs represent the flag leaf sheath of the last internode at 14 dpi. Lines were
inoculated for the sixth biological replicate (Adult trial 6). Adult plant infection responses
were scored according to the method of Roelfs et al. (1992) and are indicated in brackets:
moderately resistant (MR) and susceptible (S).
Kingbird
(MR) Francolin-1
(MR)
Pavon-76
(MR)
37-07
(S)

52
Table 3.5: Adult plant infection responses of wheat lines used in the current study. The
method of Roelfs et al. (1992) was used to score the Puccinia graminis f. sp. tritici infection
on flag leaf sheaths. Scoring abbreviations are as follows: resistant to moderately resistant
(RMR), moderately resistant (MR), moderately resistant to moderately susceptible (MRMS),
moderately susceptible (MS) and susceptible (S).
Line/Entry/Cultivar Adult
trial 1
Adult
trial 2
Adult
trial 3
Adult
trial 4
Adult
trial 5
Adult
trial 6
37-07 S S S S S S
W1406 MR MR MRMS MS - -
W6979 RMR MR MR MR - -
DH1.43 - - MR MRMS - -
DH1.50 - - MS MR - -
DH2.31 - - MS MS - -
DH2.38 - - MS MS - -
Pavon-76 - - - - MR MR
Francolin-1 - - - - MR MR
Kingbird - - - - MR MR

53
The DH entries showed adult plant infection responses intermediate between those of their
susceptible (37-07) and APR (W1406 and W6979 respectively) parental lines. The DH1.43
entry had a phenotypic response that varied from moderately resistant to moderately
susceptible (MRMS) to MR, while line DH1.50 had an infection phenotype that varied from
MS to MR. In both the biological replicates DH1.50 had a higher level of infection. DH lines
DH2.31 and DH2.38 showed a phenotypic response of MS in both biological replicates.
When comparing the two biological replicates neither of the DH entries could be confirmed
as having a higher level of infection relative to the other.
The phenotypic response of Pavon-76, Francolin-1 and Kingbird was scored as MR. The
level of infection on these APR cultivars corresponded well between the two biological
replicates.

54
3.4 Discussion
The W1406 and W6979 wheat lines, which are the main focus of the current study, exhibited
a susceptible seedling infection type. As seedlings these lines were as susceptible as the
control line, 37-07, with W6979 only displaying a marginally lower infection type. In four
biological replicates, W1406 and W6979 showed partial resistance as adult wheat plants.
Prins et al. (2016) reported the adult plant infection responses of W1406 and W6979 in two
locations for three growing seasons. W1406 was scored as 0R, 5R en 10R and W6979 as 0R,
5R and 40RMR. Based on those scores these two lines were equally resistant but W6979 was
more susceptible at one location. Over two growing seasons, Soko et al. (2018) also showed a
higher stem rust coefficient of infection and area under disease progress curve in the W6979
line. This was contradicted under greenhouse conditions where the APR response in W6979
appeared more effective in restricting Pgt development than W1406 in three of the four trials.
Expression of an APR phenotype in W1406 and W6979, as reported by Prins et al. (2016),
was however confirmed under greenhouse conditions. The 37-07 line was confirmed as an
effective susceptible control.
The DH entries exhibited an APR response but in all cases this was intermediate between the
parental lines. DH lines DH1.43 and DH1.50 each had one QTL absent; the QSr.ufs-4D QTL
was only present in DH1.43 and the QSr.ufs-4A QTL was only present in DH1.50. Based on
the phenotypic observations of these two DH entries, the APR response appeared consistently
more effective in DH1.43. Therefore, the QSr.ufs-4D QTL appeared to convey a more
effective APR response. This corresponds to the study of Prins et al. (2016) which identified
QSr.ufs-4D as a major QTL with the largest effect in the W1406 line.
Similarly, DH lines DH2.31 and DH2.38 differed by one QTL. The QSr.ufs-6A QTL was
only present in DH2.31 and QSr.ufs-3D only in DH2.38. Based on the phenotypic
observations, neither of these two DH entries appeared to consistently have a more effective
APR response. The two biological replicates showed contradicting results, and the QTL that
possibly conveys a more effective APR response could not be identified in the current study.
However the DH mapping study of Prins et al. (2016) identified QSr.ufs-6A as a major QTL
with the largest effect in the W6979 line.
The APR response of the additional wheat cultivars Pavon-76, Francolin-1 and Kingbird was
confirmed under greenhouse conditions. These cultivars were more effective in restricting
Pgt development than either W1406 or W6979, or the DH entries derived from these wheat

55
lines. The APR response of the additional wheat cultivars Pavon-76, Francolin-1 and
Kingbird was confirmed under greenhouse conditions. These cultivars were more effective in
restricting Pgt development than either W1406 or W6979, or the DH entries derived from
these wheat lines. Three stem rust resistance QTL were identified by Njau et al. (2012) in
Pavon-76 and occur on chromosomes 1B (possibly Sr58/Lr46), 3B (possibly Sr2) and 3D.
Sr2 is likely present in Francolin-1 (Lan et al., 2014, Pretorius et al., 2015) along with a Pt
resistance QTL pointing to the presence of Sr58/Lr46 (Lan et al., 2014). In Kingbird, QTL on
chromosomes 2B, 2D, 3B (Sr2), 5D, 7B, and 7D (Sr57/Lr34) were reported by Gambone
(2016). As previously reported in the Chapter 1, Sr57 is present in both W1406 and W6979
but does not convey the greatest Pgt resistance effect (Prins et al., 2016). In many of the APR
lines included in current study Sr2 appears to be the foundation of Pgt resistance, but
additional QTL contribute to resistance. However, Sr2 is not present in the W1406 and
W6979 lines, which is the main focus of the study.
Across all trials of the current study the expression of an APR response against Pgt was
confirmed in a number of wheat lines under greenhouse conditions. The inoculation method
developed by Pretorius et al. (2007) and modified by Bender et al. (2016) for Pgt remained
an effective tool to study APR under greenhouse conditions. In the current study, the flag leaf
sheaths could be phenotypically scored and the inoculation method allowed plant tissue
sampling for subsequent experimentation. The adult plant infection response never exhibited
a full resistance phenotype and was scored as an intermediate category, indicative of the
partial resistance response typical of APR.

56
Chapter 4: Histological observations of Puccinia
graminis f. sp. tritici colonization in adult wheat lines

57
4.1 Introduction
The economic importance of wheat (Triticum aestivum) and the threat of fungal pathogens
such as Puccinia spp. have focused research on the biology and management of rust diseases
for many years. Histological investigations of the infection process are often the first step to
understand the specialised interaction between host and pathogen. Evans (1907) provided one
of the first detailed descriptions of the infection process of the stem rust fungus Puccinia
graminis f. sp. tritici (Pgt) on wheat. Parallels can also be drawn with other species within the
Pucciniales that have similar infection processes. The development of infection structures on
artificial supports has also given insight into the process. These methods use growth media
(Hurd-Karrer and Rodenhiser, 1947) or artificial surfaces such as membranes (Dickenson,
1949). As fabrication techniques improved, artificial surfaces started to feature
microtopographies which are informative for understanding fungal behaviour (Hoch et al.,
1987; Read et al., 1997).
Infection of wheat represents the asexual phase of Pgt. On a susceptible or partially
susceptible wheat cultivar, hyphal proliferation and uredinia (pustules) formation will occur.
As an obligate biotroph Pgt must extract nutrients from its host and complete the infection
process without causing the death of the host. Wheat must counteract this process by halting
or impeding the infection process. If colonisation is successful in wheat, uredinia will form
and the asexual life cycle on wheat can recommence (Leonard and Szabo, 2005).
The infection process begins with the deposition and adhesion of urediniospores on the host
epidermis. Germination of urediniospores is signified by the formation of a germ tube. The
adhesion of urediniospores of Uromyces appendiculatus F. Strauss and subsequent formation
of infection structures are more effective on hydrophobic surfaces (Terhune and Hoch, 1993).
Urediniospores therefore initially attach to the epicuticular waxes on the host epidermis via a
hydrophobic interaction. Urediniospores from Uromyces viciae-fabae (Pers.) Schroet will
attach to various surfaces, but humid conditions are required for germination (Beckett et al.,
1990). Under humid conditions U. viciae-fabae urediniospores form an adhesion pad where
they come in contact with the epidermal cuticle of broad bean plants (Deising et al., 1992).
The adhesion pad is composed of extracellular matrix (ECM) material and is secreted by
urediniospores to facilitate the adhesion of the spore. The ECM also encloses the germ tube
and ensures adhesion of the developing germ tube to the host epidermis (Beckett et al., 1990).
The ECM of U. viciae-fabae can be observed as a hydrophobic region surrounding the spore

58
and germ tube (Clement et al., 1994). A clear distinction can therefore be made between
passive adhesion during spore deposition and active adhesion, whereby secreted ECM
facilitates the adhesion (Clement et al., 1993). Adhesion ensures that germ tubes develop
further on the host epidermis.
The urediniospores of Pgt have 3-5 equatorial pores (Baum and Savile, 1985) from where the
germ tube develops. The urediniospore initially forms two germ tubes but the development of
one is later halted. The one germ tube then develops by extending away from the
urediniospore and becoming branched (Evans, 1907). The germ tubes of Pgt must reach a
stomatal opening before the infection process can continue.
Pgt exhibits tropism as observed by the perpendicular extension of a germ tube in relation to
the long axis of the leaf. In wheat, the stomata together with epidermal cells and vascular
bundles are orientated parallel to the long axis of the leaf. By orientating germ tube growth
perpendicular to the epidermal cells, the probability of reaching stomata may be increased
(Johnson, 1934). It is important to note that though chemical and physical factors may induce
spore germination and differentiation, the germ tube does not seem to grow directly towards
the stomata. Thigmotropic growth only increases the probability of the germ tube finding a
stomatal opening (Lewis and Day, 1972). Directional growth of Pgt was confirmed on wheat
(Lewis and Day, 1972; Lennox and Rijkenberg, 1989; Read et al., 1997) and artificial
microtopographies (Setten et al., 2015). Lewis and Day (1972) argued that the lattice of wax
crystals that covers the epidermis is the thigmotropic stimulus for directional growth of a
germ tube. Removal of the epicuticular wax layer by organic solvents not only prevented
successful adhesion of germ tubes, but the growth of these germ tubes also became non-
directional (Wynn and Wilmot 1977). The observation that Pgt exhibits directional growth on
artificial microtopographies (Setten et al., 2015) that lack epicuticular wax indicates that
microscopic ridges most likely also contribute to urediniospore thigmotropism.
When a germ tube reaches the stomatal opening it swells and forms a structure called the
appressorium. The cytoplasmic content of the germ tube then migrates into the appressorium.
An infection peg develops from the appressorium and grows through the stomatal opening
(Evans, 1907). Appressorium formation in Pgt is also responsive to microtopographies
(Dickenson, 1949; Staples et al., 1983). Fixed widths of the microtopographies that mimic
the close spacing of the stomatal guard cell walls can cause appressorium differentiation
(Read et al., 1997). Physical signals therefore appear crucial for appressorium development.

59
In addition to physical signals, chemical signals may induce development of various infection
structures, and volatile compounds have been particularly well studied. Nonanal induces
urediniospore germination in Pgt (French, 1992). Trans-2-hexen-1-ol acts synergistically
with both ridges on microtopographies (Collins et al., 2001) and a heat shock treatment
(Wiethölter et al., 2003) to induce appressorium formation in Pgt. Nonanal, decanal and
hexenyl acetate induce the colonization of plant hosts by numerous Pucciniales, including
wheat by Pgt (Mendgen et al., 2006).
The tip of the infection peg develops into a sub-stomatal vesicle (SSV) and the cytoplasmic
contents of the appressorium migrate into the SSV. The SSV of Pgt is cylindrical and non-
septate, with its long axis parallel to the long axis of the stomatal opening (Evans, 1907).
From the SSV, infection hyphae (IH) develop that spread through the intercellular spaces of
the host mesophyll. The first IH to form is called the primary IH, subsequently followed by
secondary IH. For Pgt, a single primary IH emerging from either pole of the SSV was
reported by Hurd-Karrer and Rodenhiser (1947). In contrast, a low number of primary IH and
the ability to form a haustorial mother cell (HMC) directly from a SSV without primary IH
formation were noted by Niks (1986). Furthermore, the apparent absence of a primary IH in
Pgt was considered of potential taxonomic use as other Puccinia spp. form a prominent
primary IH. The SSV forms the primary IH which differentiates a HMC at its hyphal tip and
the elongation at the opposite axis of the SSV is simply an appendix (Niks, 1986; Lennox and
Rijkenberg, 1989). IH originating from both ends of a SSV were reported for Pgt on growth
media (Dickenson, 1949; Williams, 1971; Wiethölter et al., 2003), but this has not been
reported on wheat. When appressoria are formed on microtopographies, development will
often proceed further, forming SSV and IH. Read et al. (1997) hypothesised that once
appressorium formation has occurred, the pathogen is set on differentiation up to the point of
IH.
The HMC, usually separated from the IH by a septum, forms a penetration peg that breaches
the plant cell wall (Niks, 1986). A specialised structure called a haustorium develops at the
end of the penetration peg, pushing back the plant cell plasma membrane, but maintaining its
integrity. The haustorium forms a close association with the plant cell, and does not penetrate
the host plasma membrane. The haustorium is surrounded by an extrahaustorial matrix
(EHM), which contains proteins and carbohydrates primarily from the host and is viewed as
an essential component for successful biotrophic interaction (Voegele and Mendgen, 2011).
Pgt generally forms haustoria within mesophyll cells to establish the biotrophic interaction.

60
However, Pgt readily forms a haustorium within the epidermal cells from the primary IH
(Evans, 1907; Tiburzy et al., 1990). This may explain the rapid development of a HMC from
the primary IH as reported by Niks (1986).
Though the haustorium has long been considered the structure by which the pathogen absorbs
nutrients from the host, it was only with molecular techniques that the interaction was
confirmed. In the membrane of U. viciae-fabae, H+-ATPase activity is higher in the
haustorium than the spore and germ tube, resulting in a H+
gradient between the EHM and
haustorium (Struck et al., 1996). Among genes that are expressed in the haustorium of U.
fabae are two putative amino acid transporters (AAT1 and AAT2). The product of AAT2 is
localised in the haustorial membrane. The model proposes that the H+
gradient across the
haustorial membrane drives the uptake of amino acids (Hahn et al., 1997). The product of
AAT1, AAT1p, was shown to transport a number of amino acids, but showed highest affinity
for histidine and lysine (Struck et al., 2002). From the haustorium associated genes reported
by Hahn and Mendgen (1997), HXT1 showed homology to hexose transporters encoding
genes. The product of HXT1, HXT1p, was also localised on the haustorial membrane of U.
fabae and showed highest affinity for glucose and fructose (Voegele et al., 2001). The
function of such proteins confirms that the haustoria formed by members of the Pucciniales
take up amino acids and simple carbohydrates from their hosts.
Upon establishment of the first haustorium, the pathogen absorbs nutrients from its host for
further development. The HMC can then form secondary IH that can in turn form its own
HMC and haustorium. Hughes and Rijkenberg (1985) hypothesised that the formation of
secondary IH is based on the successful establishment of a primary haustroium. IH spread
through the extracellular spaces and continue to form HMC and haustoria. The pathogen
effectively diverts nutrients produced during photosynthesis away from host cells (Mendgen,
1981). Eventually, the extensive hyphal colonies form sporogenous cells that in turn start to
develop into urediniospores. The collection of urediniospores that are carried on the
uredinium then erupts through the plant epidermis. Upon maturation, the urediniospores
detach from their pedicels, thereby completing the asexual life cycle on wheat (Kolmer et al.,
2009). The complete infection process of the asexual life cycle of a Puccinia sp. is
summarised in Figure 4.1.

61
Figure 4.1: Schematic representation of the infection process of Puccinia spp. on wheat
(taken from Garnica et al., 2013 with modification to labels). The fungal urediniospore (S)
forms of a germ tube (GT) on the host epidermis that extends towards a stoma. The germ tube
develops into an appressorium (A) and an infection peg (IP) which allows the fungus to enter
the plant via the stomatal opening. The infection peg develops into a sub-stomatal vesicle
(SSV). An infection hypha (IH) spreads through the intercellular spaces of the plant tissue.
Upon reaching a mesophyll cell (M), the infection hypha differentiates into a haustorial
mother cell (HMC). A haustorium is subsequently formed but does not penetrate the host
plasma membrane. The haustorium is surrounded by an extrahaustorial matrix (EHM) which
acts as an essential interface for the absorption of nutrients from a mesophyll cell. Through
the establishment of a biotrophic relationship between the haustorium and mesophyll cell,
energy is derived for the proliferation of the pathogen. Subsequently infection hyphae spread
through the plant mesophyll and more haustoria are formed. Eventually the fungal mycelium
may form an uredinium (U) from where urediniospores are released.

62
Mendgen et al. (1988) divided the infection process from germination to haustorium
formation and the establishment of biotrophy into a number of phases: the recognition,
signalling and parasitic phases. The host plant has a defence mechanism that may impede
fungal development at each of these stages. The recognition phase proceeds from germination
to appressorium formation, and the plant defence mechanism is typically general and
constitutive. The signalling phase proceeds from SSV formation to the initiation of
haustorium development during which the pathogen starts releasing effectors to suppress the
defence response. The likelihood of the host recognizing the presence of the pathogen also
increases. The parasitic phase is characterised by the establishment of haustoria and the
biotrophic relationship with its host. During the parasitic phase a race-specific defence
response may be induced to restrict haustorium formation. Therefore, if the means of
absorbing nutrients from the host is impeded, development of the pathogen will be inhibited
and the pathogen may perish.
Germination of Pgt urediniospores has also been studied on a number of non-host cereal
plants. In general, infection proceeds as described on wheat up to the point of appressorium
formation (Lennox and Rijkenberg, 1989). On sorghum, primary IH form but further
development is halted. In maize, a primary HMC and secondary IH are formed at the site of
infection. In barley, as in wheat, intracellular hyphae and HMCs are observed. As the
evolutionary distance between the non-host species increases from wheat, the potency of non-
host resistance (NHR) to restrict the spread of Pgt also increases (Lennox and Rijkenberg,
1989). On rice, the early infection process of Pgt is identical to wheat, with NHR mostly
halting the infection process at appressorium formation. If appressorium formation does
occur, the majority of infection sites develop IH, but haustoria are seldom seen. NHR in rice
to Pgt is associated with H2O2 accumulation, callose deposition and infrequent cell death
(Ayliffe et al., 2011).
The defence mechanisms induced by all stage Sr resistance genes that impede Pgt
colonization have been well characterised in wheat seedlings. The presence of the Sr5
resistance gene activated the hypersensitive response (HR) in epidermal cells of Pgt-
inoculated wheat and restricted the establishment of the first HMC and haustorium (Tiburzy
et al., 1990). Sr5 and Sr36 have similar effects in wheat. Both induce an early HR to avirulent
races and few haustoria are formed. Interestingly, both resistance genes induce callose
deposition in the stomatal guard cells, which was hypothesised to impede penetration by
closing the stomatal opening. The signal of this race-specific resistance response prior to

63
haustorium formation is, however, unknown (Wang et al., 2015). Contradicting results were
reported for Sr5, with no differences in infection structures during the early infection process
(Lennox and Rijkenberg, 1994). The number of germ tubes, appressoria, SSV and HMC did
not differ, although no significant statistical analysis supported these observations. Sr6
caused a rapid HR in host cells and necrosis of Pgt HMC and haustoria associated with these
cells. The number of haustoria in the resistant line was thereby reduced but the HMC septum
prevented that the necrosis spread to the hyphae (Skipp et al., 1974). Sr6, Sr24 and Sr30 have
similar effects in wheat, leading to the HR and lignification after inoculation with Pgt. This
response was however only partially effective to restrict further colonization. For these
resistance genes, the response comes into effect after haustorium formation (Wang et al.,
2015). A clear distinction can therefore be made between pre-haustorial and post-haustorial
defence responses.
Microscopic investigation of the Pgt infection process has been effectively completed on
wheat seedlings (Skipp et al., 1974; Tiburzy et al., 1990; Wang et al., 2015) and seedlings of
non-host plants (Lennox and Rijkenberg, 1989; Ayliffe et al., 2011). However, information is
lacking on the infection process of Pgt on adult plants. The focus on wheat seedlings allows
the histological characterisation of defence mechanisms induced by all stage Sr resistance
genes. The histological characterisation of the adult plant resistance (APR) response upon Pgt
colonization, however, needs further description. The phenotypic characterization of P.
triticina (Pt) and P. striiformis f. sp. tritici (Pst) infection on adult wheat uses flag leaves.
Flag leaves have also been effectively used for microscopic observation of the infection
process of Pt (Wesp-Guterres et al., 2013) and Pst (Moldenhauer et al., 2006; Coram et al.,
2008; Moldenhauer et al., 2008; Zhang et al., 2012; Segovia et al., 2014). In contrast, the flag
leaf sheath of the last internode is used for the phenotypic characterization of Pgt infection
response on adult wheat plants. Insufficient information on the Pgt infection process
complicates any comparison to phenotypic scoring and characterisation of the APR response.
The aim of this chapter was therefore to investigate the infection process of Pgt on the flag
leaf sheath of the last internode of adult wheat plants, in particular for the susceptible line
(37-07). In addition, the Pgt infection process in the 37-07 line was compared with two APR
lines, W1406 and W6979.
64
4.2 Materials and methods
4.2.1 Biological material
For histological observations, samples were generated as described in Chapter 3. The 37-07,
W1406 and W6979 lines from the first two adult plant trials (Adult trial 1-2) were included.
The last internode below the flag leaf was collected as described, but the internal stem was
not initially removed. The last internode was cut into manageable sections depending on the
technique implemented. The stem assured structural integrity of samples, but was usually
removed during further processing. The external surface of the flag leaf sheath was the focus
for histological observations as this surface was exposed to Pgt inoculation.
4.2.2 Scanning electron microscopy
Samples for scanning electron microscopy (SEM) were taken at 6 hpi, 12 hpi and 1 dpi for
epidermal observations and at 1 dpi, 36 hpi and 2 dpi for sub-epidermal observations. The
last internodes of inoculated wheat were randomly cut along the length into 5 mm sections.
Internode sections were placed in 3% (v/v) glutaraldehyde in a sodium phosphate buffer (0.1
M, pH 7.0) and stored until processing. Sections were washed in a 0.1 M sodium phosphate
buffer for 10 min and then fixed in 1% (w/v) osmium tetroxide in 0.1 M sodium phosphate
buffer for 1 h. Sections were then washed twice for 10 min in the phosphate buffer. Sections
were dried with a graded ethanol series of 50%, 70% and 95% (v/v) in distilled water for 20
min with a final 100% ethanol stage for 1 h which was repeated twice. Sections were
thereafter dried in a Tousimis critical point drier (Rockville, Maryland, United States of
America) using carbon dioxide drying gas.
For epidermal observations, the dried intact internode sections were mounted on aluminium
stubs (Cambridge pin type 10 mm) with epoxy glue. The Bio-Rad coating system (London,
United Kingdom) was used for gold sputter coating of the sample with a layer of
approximately 60 nm. Observations of spore differentiation on the epidermal layer were
made with a Shimadzu SSX-550 (Kyoto, Japan) scanning electron microscope.
For sub-epidermal observations of the leaf sheath, the fractioning method of Hughes and
Rijkenberg (1985) was used with modifications. Leaf sheaths were removed from the dried
internode sections and laid flat on an aluminium stub using double-sided tape. Another
aluminium stub with double sided tape was then pressed directly on top of the leaf sheath
sections, effectively sandwiching the leaf sheath between two layers of double sided tape and

65
the flat ends of two aluminium stubs. Pulling these two stubs apart separated the two
epidermal layers, each to a different stub. Excess mesophyll tissue was removed with a
scalpel blade and sections were gold sputter coated with an approximately 60 nm layer using
the Bio-Rad coating system. Thereby, the sub-stomatal chambers and any potential infection
structures were exposed for observation using the Shimadzu SSX-550 scanning electron
microscope.
4.2.3 Fluorescence microscopy
Sections of the last internode were sampled for fluorescence microscopy at 1, 2, 3, 5 and 10
dpi. Samples were prepared with a modified method of Rohringer et al. (1977) as described
by Moldenhauer et al. (2006). Uvitex 2B (Polysciences Inc., United States of America) was
used to stain fungal colonies and observations were made using the Olympus AX70 (Tokyo,
Japan) microscope. The blue wavelength (WB) epifluorescence cube with an excitation filter
of 330-385 nm and barrier filter of 420 nm showed the fluorescence of stained fungal tissue.
The ultraviolet wavelenghth (WU) epifluorescence cube with an excitation filter of 450-480
nm and barrier filter of 515 nm showed autofluorescence in wheat tissue, as an indication of
cell death. Mounted samples were subsequently stained with phloroglucinol-HCl, as a test for
lignin formation. The method is based on that of Sherwood and Vance (1976) but was
modified by Moldenhauer et al. (2006) to use Uvitex 2B-stained tissue for subsequent testing.
However, these methods were later abandoned in favour of the wheat germ agglutinin
fluorescein isothiocyanate conjugate (WGA-FITC) staining method as described below.
The samples mentioned above were also processed according to a modified method of
Ayliffe et al. (2011) using WGA-FITC (Sigma-Aldrich, St Louis, Missouri, United States of
America). Sections of the last internode were placed in 1 M KOH and 0.05% (v/v) Silwet L-
77 (SouthernChem, Sandton, South Africa) directly after sampling and incubated at 37°C for
16 h. Samples were washed thrice with a 50 mM tris(hydroxymethyl)aminomethane-
hydrochloric acid (Tris-HCl) buffer (pH 7.0) and the flag leaf sheaths removed from the stem
for further processing. Leaf sheaths were stained for 16 h with 20 μg/ml (w/v) WGA-FITC in
the Tris-HCl buffer. Samples were washed twice with the Tris-HCl buffer and the leaf
sheaths were mounted on microscope slides. Fluorescence observations were made with an
Olympus AX70 microscope using the WU epiflorescence cube with an excitation filter of
450-480 nm and barrier filter of 515 nm. Micrographs were taken with the fitted Olympus
CC12 camera (Olympus Soft Imaging Solutions, Japan) and Olympus AnalySIS LS Research

66
v 2.2 software. The size of fungal colonies at 5 dpi was determined and the means calculated.
Colony sizes were statistically analysed by Tukey's multiple comparison test using GraphPad
Prism v 6.01. The mean colony size of each line was compared to the mean colony size of
every other line. The confidence level for the test was set at 99%.
4.2.4 Cross-sectioning of last internodes
To investigate the cross section (transverse plane) of the last internode of inoculated wheat,
the paraffin wax impregnation technique of Johansen (1940) was used with some
modifications. Samples of the last internode were taken at 10 dpi from the susceptible 37-07
line. The last internodes were randomly cut along the length into 5 mm sections and placed in
3% (v/v) glutaraldehyde in a sodium phosphate buffer (0.1 M) at pH 7.0. Sections were
dehydrated in a tertiary butyl alcohol series (Johansen, 1940). Two additional steps were
included; firstly a 50:50 volume of tertiary butyl alcohol and liquid paraffin and secondly
pure liquid paraffin.
For impregnation the total volume liquid paraffin was gradually replaced with melted paraffin
wax over the course of 5 days while samples were kept at 60°C. Last internode sections in the
paraffin wax suspension were cast in plastic moulds (15 x 15 x 15 mm) and orientated to
allow for the cutting of transverse sections. After setting, the paraffin block containing the
embedded tissue was trimmed and mounted unto small wooden blocks (20 x 20 x 20 mm).
Cross-sectioning of tissue was done with a rotary microtome (Model 45; Lipshaw
Manufacturing Company, Detroit, Michigan, United States of America) equipped with the
standard blade. Cross sections of 5-10 μm (typically 6 μm) were made and affixed to
microscope slides with Entellan® (Merck KGaA, Darmstadt, Germany). The cross sections
were stained with Safranin O/Fast Green FCF (Johansen, 1940) or WGA-FITC.
The Safranin O staining solution was prepared by dissolving 1.0% (w/v) Safranin O (Sigma-
Aldrich, St. Louis, Missouri, United States of America) in a 2:1:1 methyl cellosolve, ethanol
and water solution with 1.0% (w/v) sodium acetate and 2.0% (w/v) formalin. The Fast Green
FCF staining solution consisted of 0.5% (w/v) Fast Green FCF (Sigma-Aldrich) dissolved in
a 1:1:1 methyl cellosolve, ethanol and clove oil solution. For Safranin O/Fast Green FCF
staining of cross sections, the microscope slides were processed with the following solutions:
xylene (10 min), 1:1 xylene and ethanol (10 min), ethanol (10 min), 50% (v/v) ethanol in
water (5 min), Safranin O staining solution (30 min), twice with ethanol, Fast Green FCF
staining solution (as needed), 1:1 xylene and ethanol solution and finally xylene (10 min).
67
Cover slips were permanently fixed with Entallan and observations made under white light
with the Olympus AX70 microscope.
For WGA-FITC staining of cross sections, the microscope slides were transferred through the
following solutions: xylene (10 min), 1:1 xylene and ethanol (10 min), ethanol (10 min), 50%
(v/v) ethanol in 50 mM Tris-HCl buffer at pH 7.0 (10 min), the Tris-HCl buffer (10 min) and
finally 20 μg/ml (w/v) WGA-FITC (16 h) in the Tris-HCl buffer. Slides were washed with
the Tris-HCl buffer and fluorescence observations made with the Olympus AX70 microscope
as described in section 4.2.3.

68
4.3 Results
4.3.1 Initial microscopic experimentation
Fluorescence microscopy using Uvitex 2B only partially allowed the observation of infection
structures of Pgt in the adult plant tissues of wheat lines 37-07, W1406 and W6979. High
background fluorescence of wheat tissue made observations of especially internal infection
structures difficult. Initial optimization however showed that Uvitex 2B staining of inoculated
seedling tissue does show internal infection structures. Autofluorescence, indicative of cell
death associated with infection sites was neither observed in the susceptible nor the APR
lines at all tested time points up to 5 dpi. Lignin formation associated with infection sites was
likewise not observed for all tested time points up to 5 dpi, in all three lines. The wheat
sclerenchymatous fibres associated with vascular bundles did however show the reddish-
brown colour as a positive test for lignin and indicated that staining was successful. Results
for Uvitex 2B staining, autofluorescence and lignin staining of Pgt infection sites are not
shown.
4.3.2 Scanning electron microscopy
Observations made by SEM allowed the description of the early stages of the Pgt infection
process. Epidermal micrographs showed germination of urediniospores on all three wheat
lines by 6 hpi (Figures 4.2, 4.6 and 4.10). The germ tubes extended away from the
urediniospore and had a swollen appearance. No further structures were visible. By 12 hpi
appressoria were observed on all lines at a stomatal opening, as illustrated by a typical
appressorium in Figure 4.3. The appressoria were cylindrical and covered a large section of
the stomatal opening (Figures 4.5, 4.9 and 4.13). The developing germ tubes started to
collapse and only stayed swollen at the distal points (Figures 4.7 and 4.11). At 1 dpi the germ
tubes associated with appressoria were invariably collapsed (Figures 4.5, 4.9 and 4.13) and
germ tubes that have not reached a stomatal opening at 1 dpi had also collapsed (Figures 4.4,
4.8 and 4.12). Adhesion pads and ECM associated with urediniospores were not observed.
From a single urediniospore two germ tubes typically developed (Figure 4.8). One germ tube
did not develop as extensively as the other. No directional development of germ tubes of Pgt
was observed on the epidermis in any of the three lines. Germ tubes were also extensively
branched. In some instances the lateral branch could not be clearly differentiated from the
principal germ tube with two developing points being equally pronounced (Figure 4.7). The

69
wheat epidermal surface also varied slightly. At times longitudinal ridges were prominent
(Figures 4.2, 4.7 and 4.11) but at other times not (Figures 4.4 and 4.8). Epicuticular wax was
prominent on the epidermal surface.
Sub-epidermal observations of the Pgt infection process on the susceptible 37-07 line were
also carried out. Observations of internal infection structures were rare, but possible.
Mesophyll cells and sub-stomatal chambers were readily exposed, but observed infection
sites rare. Where infection sites were observed within the sub-stomatal chamber it showed the
clear development of a SSV by 1 dpi (Figure 4.14). Similar to the appressorium, the SSV was
cylindrical and covered a large section of the internal stomatal opening. The SSV elongated
at both ends by 36 hpi (Figures 4.15 and 4.16), indicating possible IH. One of the elongated
ends however developed a pronounced septum, indicating the formation a HMC by 36 hpi
(Figures 4.15 and 4.16). No extensive primary IH was found developing in the mesophyll
intracellular spaces. At 2 dpi further IH were observed forming just below the septum of the
first HMC and showed a double branched structure (Figure 4.17).
4.3.3 Fluorescence microscopy
Preparation for fluorescence microscopy destained wheat tissue effectively but some
background fluorescence was still seen. Binding of chitin by WGA-FITC allowed internal
fungal infection structures to be observed. At 1 dpi, appressorium development was observed
in all three lines (Figure 4.18). At a different focal plane, corresponding to the deeper sub-
epidermal mesophyll layer, a SSV was observed in all infection sites that had an
appressorium. Some SSV also showed a clear septum indicative of HMC formation, but
primary IH were not well defined. No noteworthy differences in the infection process were
observed for the three lines at this time point.
By 2 dpi the infection sites showed the development of IH branching out, close to the first
HMC (Figure 4.19). The IH associated with the first HMC invariably had a double branched
structure. From these IH the development of further HMC was observed. Here too, no
noteworthy differences in the infection process were observed among the three lines. The IH
had spread through the mesophyll cells and further HMC developed by 3 dpi (Figure 4.20).
The infection sites on the three lines at 3 dpi showed no differences that could be quantified.
Colonies of Pgt were well established by 5 dpi and radiated from the stomata where infection
had begun (Figure 4.21).

70
Figure 4.2: Scanning electron micrograph of the Puccinia graminis f. sp. tritici infection
process on the flag leaf sheath of the 37-07 wheat line at 6 hours post inoculation. The
urediniospore (S) and developing germ tube (GT) are indicated.
Figure 4.3: Scanning electron micrograph of the Puccinia graminis f. sp. tritici infection
process on the flag leaf sheath of the 37-07 wheat line at 12 hours post inoculation. The germ
tube (GT) and appressorium (A) are indicated.

71
Figure 4.4: Scanning electron micrograph of the Puccinia graminis f. sp. tritici infection
process on the flag leaf sheath of the 37-07 wheat line at 1 day post inoculation. The
urediniospore (S) and developing germ tube (GT) are indicated.
Figure 4.5: Scanning electron micrograph of the Puccinia graminis f. sp. tritici infection
process on the flag leaf sheath of the 37-07 wheat line at 1 day post inoculation.
Urediniospores (S), developing germ tubes (GT) and appressoria (A) are indicated.
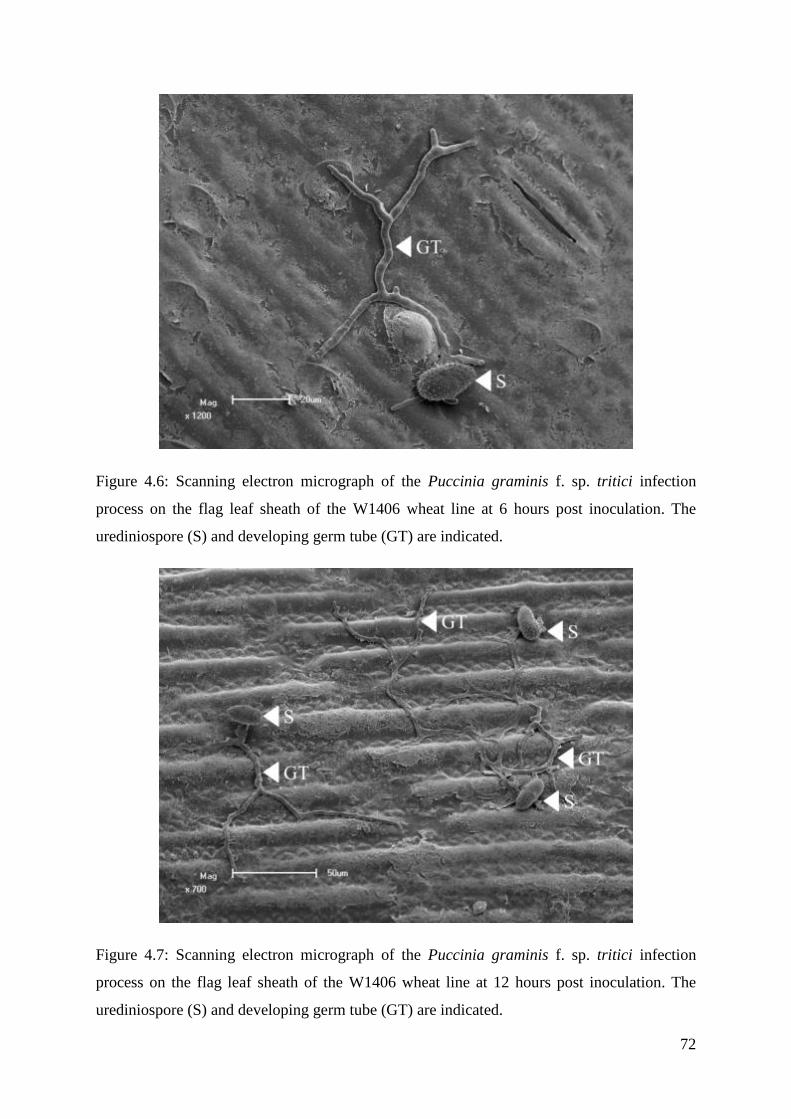
72
Figure 4.6: Scanning electron micrograph of the Puccinia graminis f. sp. tritici infection
process on the flag leaf sheath of the W1406 wheat line at 6 hours post inoculation. The
urediniospore (S) and developing germ tube (GT) are indicated.
Figure 4.7: Scanning electron micrograph of the Puccinia graminis f. sp. tritici infection
process on the flag leaf sheath of the W1406 wheat line at 12 hours post inoculation. The
urediniospore (S) and developing germ tube (GT) are indicated.

73
Figure 4.8: Scanning electron micrograph of the Puccinia graminis f. sp. tritici infection
process on the flag leaf sheath of the W1406 wheat line at 1 day post inoculation. The
urediniospore (S) and developing germ tube (GT) are indicated.
Figure 4.9: Scanning electron micrograph of the Puccinia graminis f. sp. tritici infection
process on the flag leaf sheath of the W1406 wheat line at 1 day post inoculation. The
urediniospore (S), developing germ tube (GT) and appressorium (A) are indicated.

74
Figure 4.10: Scanning electron micrograph of the Puccinia graminis f. sp. tritici infection
process on the flag leaf sheath of the W6979 wheat line at 6 hours post inoculation. The
urediniospore (S) and developing germ tube (GT) are indicated.
Figure 4.11: Scanning electron micrograph of the Puccinia graminis f. sp. tritici infection
process on the flag leaf sheath of the W6979 wheat line at 12 hours post inoculation. The
urediniospore (S) and developing germ tube (GT) are indicated.

75
Figure 4.12 Scanning electron micrograph of the Puccinia graminis f. sp. tritici infection
process on the flag leaf sheath of the W6979 wheat line at 1 day post inoculation. The
urediniospore (S) and developing germ tube (GT) are indicated.
Figure 4.13: Scanning electron micrograph of the Puccinia graminis f. sp. tritici infection
process on the flag leaf sheath of the W6979 wheat line at 1 day post inoculation. The
urediniospore (S), developing germ tube (GT) and appressorium (A) are indicated.

76
Figure 4.14: Sub-epidermal scanning electron micrograph of the Puccinia graminis f. sp.
tritici infection process on the flag leaf sheath of the 37-07 wheat line at 1 day post
inoculation. The sub-stomatal vesicle (SSV) is indicated.
Figure 4.15: Sub-epidermal scanning electron micrograph of the Puccinia graminis f. sp.
tritici infection process on the flag leaf sheath of the 37-07 wheat line at 36 hours post
inoculation. The sub-stomatal vesicle (SSV) and haustorial mother cell (HMC) are indicated.
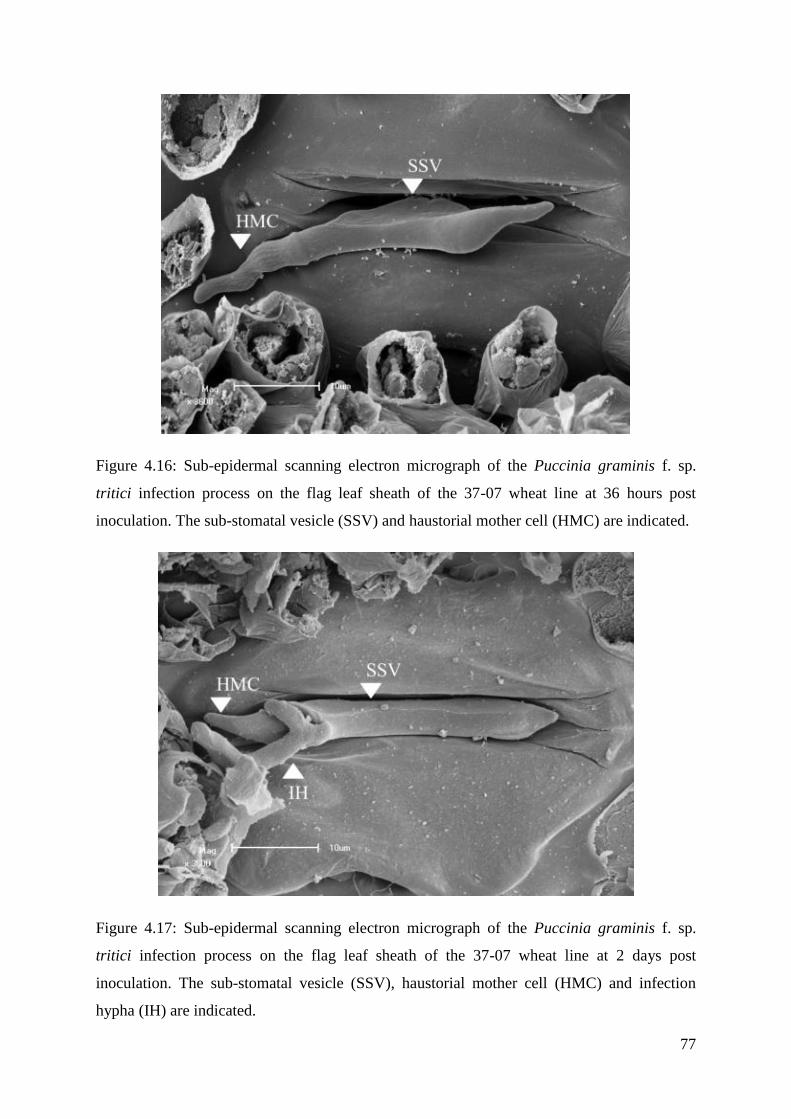
77
Figure 4.16: Sub-epidermal scanning electron micrograph of the Puccinia graminis f. sp.
tritici infection process on the flag leaf sheath of the 37-07 wheat line at 36 hours post
inoculation. The sub-stomatal vesicle (SSV) and haustorial mother cell (HMC) are indicated.
Figure 4.17: Sub-epidermal scanning electron micrograph of the Puccinia graminis f. sp.
tritici infection process on the flag leaf sheath of the 37-07 wheat line at 2 days post
inoculation. The sub-stomatal vesicle (SSV), haustorial mother cell (HMC) and infection
hypha (IH) are indicated.

78
Figure 4.18: Fluorescence micrograph of Puccinia graminis f. sp. tritici infection sites on the
flag leaf sheath at 1 day post inoculation. Each set of three micrographs represents a single
Puccinia graminis f. sp. tritici infection site at different focal planes as seen on the 37-07 (a-
c), W1406 (d-f) and W6979 (g-i) wheat lines. The appressoria (A), sub-stomatal vesicles
(SSV) and haustorial mother cells (HMC) are indicated.

79
Figure 4.19: Fluorescence micrograph of Puccinia graminis f. sp. tritici infection sites on the
flag leaf sheath at 2 days post inoculation. Each set of three micrographs represents a single
Puccinia graminis f. sp. tritici infection site at different focal planes as seen on the 37-07 (a-
c), W1406 (d-f) and W6979 (g-i) wheat lines. The appressoria (A), sub-stomatal vesicles
(SSV), infection hyphae (IH) and haustorial mother cells (HMC) are indicated.

80
Figure 4.20: Fluorescence micrograph of Puccinia graminis f. sp. tritici infection sites on the
flag leaf sheaths at 3 days post inoculation. Each set of three micrographs represents a single
Puccinia graminis f. sp. tritici infection site at different focal planes as seen on the 37-07 (a-
c), W1406 (d-f) and W6979 (g-i) wheat lines. The sub-stomatal vesicles (SSV), infection
hyphae (IH) and haustorial mother cells (HMC) are indicated.

81
Figure 4.21: Fluorescence micrograph of Puccinia graminis f. sp. tritici colonies in the flag
leaf sheath at 5 days post inoculation. The leaf sheaths of the 37-07 (a), W1406 (b) and
W6979 (c) wheat lines are shown.

82
At 5 dpi, the colony sizes showed a marked difference between the wheat lines which was
quantifiable. The mean colony size of Pgt on the three lines is indicated in Figure 4.22. The
mean colony size was significantly different between all treatments as indicated by a Tukey's
multiple comparison test (Table 4.1). The mean colony size on 37-07 was the largest,
followed by W1406 and W6979 (Figure 4.22). Likewise, the 37-07 line had the greatest
variation, followed by W1406 and W6979.
By 10 dpi, colonies of Pgt had spread through the mesophyll tissue and sporulation was
observed (Figure 4.23). The development of a colony was longitudinal, parallel with the long
axis of the leaf sheath. The development of the colony was restricted by the
sclerenchymatous fibres of the vascular bundles. The mycelium had also differentiated to
form uredinia containing urediniospores that lifted the wheat epidermal cells. These features
were observed in all three lines (Figure 4.23). Visually, W1406 and W6979 showed smaller
colonies and less sporulation. However, the proliferation of Pgt mycelium at 10 dpi was such
that a single colony originating from a stoma could not be differentiated from another, and
further quantification was not possible.
4.3.4 Cross-sectioning of last internodes
The larger colonies of 37-07 simplified the cross sectioning of the mycelium and only this
line was investigated at 10 dpi (Figures 4.24 - 4.27). In cross section, the last internode
clearly showed the hollow stem surrounded by two layers of leaf sheath (Figures 4.24 and
4.25). Using Safranin O/Fast Green FCF staining (Figure 4.24) and WGA-FITC staining
(Figure 4.25) a number of uredinia were observed. Under higher magnification (Figures 4.26
and 4.27) the urediniospores and ruptured epidermis are visible. In cross section the
sclerenchymatous fibres are clearly restricting the lateral development of colonies.

83
Figure 4.22: Mean colony size (mm2) of Puccinia graminis f. sp. tritici colonies at 5 days
post inoculation. The mean colony size on the 37-07, W1406 and W6979 wheat lines are
indicated, with the respective sample sizes (n) and standard deviation as error bars.
Corresponding alphabetic symbols indicate samples with no significant differences as
confirmed by Tukey's multiple comparison test (see Table 4.1)
Table 4.1: Tukey's multiple comparison test results for mean colony size of Puccinia
graminis f. sp. tritici on wheat lines at 5 days post inoculation. The mean colony size on 37-
07, W1406 and W6979 was compared to the mean colony size of every other line.
Confidence level for the test was 99%.
Sample comparisons
Sample size
(n)
Mean difference
Confidence interval
of difference
37-07 vs W1406 535 0.0997 0.0894 to 0.1100
37-07 vs W6979 570 0.1118 0.1010 to 0.1226
W1406 vs W6979 474 0.0121 0.0014 to 0.02270

84
Figure 4.23: Fluorescence micrograph of Puccinia graminis f. sp. tritici colonies in the flag
leaf sheath at 10 days post inoculation. The leaf sheath of the 37-07 (a), W1406 (b) and
W6979 (c) wheat lines are shown.

85
Figure 4.24: Light micrograph of the cross section of a Puccinia graminis f. sp. tritici-
inoculated last internode. The 37-07 line is shown at 10 days post inoculation and uredinia
(U) are indicated.

86
Figure 4.25: Fluorescence micrograph of the cross section of a Puccinia graminis f. sp.
tritici-inoculated last internode. The 37-07 line is shown at 10 days post inoculation and
uredinia (U) are indicated.

87
Figure 4.26: Light micrograph of the cross section of a Puccinia graminis f. sp. tritici-
inoculated last internode. The 37-07 line is shown at 10 days post inoculation and an
uredinium (U) and vascular bundle (VB) are indicated.
Figure 4.27: Fluorescence micrograph of the cross section of a Puccinia graminis f. sp.
tritici-inoculated last internode. The 37-07 line is shown at 10 days post inoculation and an
uredinium (U) and vascular bundle (VB) are indicated.

88
4.4 Discussion
The microscopic investigation of the Pgt infection process on flag leaf sheaths of the last
internode presented a number of challenges. The sclerenchymatous fibres associated with
vascular bundles in wheat were resilient to destaining, particularly during preparation for
fluorescence microscopy. Excessive destaining, may however, disintegrate the tissue. The
cylindrical structure of the leaf sheath also complicated the mounting of samples. Any future
work on this tissue must involve optimization of sample preparation for microscopy.
However, microscopic observations were successfully made during this study and gave
insights into the Pgt infection process on adult wheat plants.
Evans (1907) reported that germination of Pgt urediniospores on wheat occurred by 1 dpi. In
the current study, germination had occurred as early as 6 hpi, as confirmed by SEM, an
observation reported previously (Lennox and Rijkenberg, 1989). Adhesion pads and ECM
associated with urediniospores could not be confirmed, but these structures are assumed to be
present. SEM processing seldom caused the spore and germ tube to separate from the
epidermis, suggesting strong adhesion. The initial development of two germ tubes in Pgt, as
reported by Evans (1907), was also confirmed.
During the course of the early infection process, an important observation was made
regarding the directional development of germ tubes on the leaf sheath epidermis. The germ
tubes did not appear to develop at right angles to the longitudinal wall of epidermal cells.
This observation contradicts ‘common knowledge’ of germ tube development of Pgt that
have been previously reported (Johnson, 1934; Lewis and Day, 1972; Lennox and
Rijkenberg, 1989; Read et al., 1997). Importantly, past research was done on inoculated
wheat seedling leaves and not adult leaf sheaths.
The non-directional growth as reported in the current study has various hypothetical
explanations. The germ tubes of Uromyces phaseoli (Pers.) G. Winter exhibit directional
growth on its host but on the non-host wheat, germ tube development becomes non-
directional (Wynn, 1976). The hypothesis was that the adhesion of germ tubes from U.
phaseoli was ineffective due to the waxes on the wheat leaf surface. The directional growth
of Pgt germ tubes has however been confirmed in a number non-host cereal species (Lennox
and Rijkenberg, 1989). Non-directional growth must therefore be attributed to another feature
since Pgt adhesion on the wheat host appeared normal.

89
On the abaxial surface of rye grass (Lolium perenne L.) leaves, the germ tubes of Puccinia
graminis Pers., Puccinia coronata Corda and Puccinia loliina Sydow and Sydow all exhibit
non-directional growth (Roderick and Thomas, 1997). In contrast, on the adaxial surface
typical directional growth was observed. Here it was argued that the abaxial surface has less
rigid topography and lacks epicuticular wax crystals, but rather has an amorphous wax layer
that may lead to the non-directional growth. However, on wheat, Pgt exhibits directional
growth on both the adaxial and abaxial surfaces of wheat seedling leaves (Lewis and Day,
1972). Features of the epicuticular waxes on the flag leaf sheath may however have caused
the non-directional growth observed in this project.
The leaf sheath has a lower rate of transpiration than the flag leaf (Clarke and Richards,
1988) and structural and chemical factors may account for this difference in transpiration.
The composition of the waxes on the leaf sheath was shown to differ from that on the leaf
blades. In the leaf sheath β-diketones are dominant, while alcohols are dominant in the leaf
blades (Tulloch, 1973). Epicuticular wax composition varies greatly in wheat cultivars
(Uddin and Marshall, 1988). In the current study, non-directional growth was observed on all
three wheat lines and even if epicuticular wax content differs, the development of germ tubes
seems to have non-directional growth as a common feature on wheat leaf sheaths.
At times, ridges were observed running parallel to the stomata but in other cases prominent
ridges were absent. Even when longitudinal ridges were observed, they appeared less
pronounced on the leaf sheath in comparison to the ridges reported on seedling leaves (Lewis
and Day, 1972). The less pronounced epidermal ridges may therefore also contribute to the
non-directional growth of Pgt germ tubes seen on flag leaf sheaths.
Quantifying the directional growth of germ tubes from SEM observations remains complex
but novel techniques have been developed. The RIMAPS (Rotated Image with Maximum
Average Power Spectrum) technique coupled with SEM allowed the orientation of
epicuticular wax (Favret and Pidal, 2013) and Pt germ tubes on microtopographies (Setten et
al., 2015) to be quantified. The epicuticular wax of susceptible and resistant wheat cultivars
is near identical with a rigid angular distribution pattern (Favret and Pidal, 2013). Pt germ
tube orientates at a perpendicular angle to a parallel microtopographical surface but the germ
tube development is non-directional on a smooth surface (Setten et al., 2015). Such
approaches may add statistical support to non-directional growth of Pgt on wheat leaf
sheaths.

90
Appressorium formation was observed at 12 hpi in the current study, as opposed to 6 hpi as
reported by Lennox and Rijkenberg (1989) on wheat seedlings. This discrepancy in
appressorium formation may be explained by probability of observing an appressorium,
which should decrease at earlier time points. How the non-directional growth of germ tubes
may potentially delay the infection process is also worth investigating. Furthermore, it is
conceivable that different incubation environments will have a strong influence on the
chronological development of infection structures.
In the current study, appressorium formation was observed in 37-07, W1406 and W6979 by
12 hpi, but the APR response does not appear to restrict appressorium development.
Likewise, the presence of the APR gene, Yr39, made no difference to the germination and
formation of appressoria of Pst (Coram et al., 2008). At 12 hpi these structures formed on
cultivars that had either the functional or non-functioning APR allele. However, only external
microscopic observation of the epidermis was made. Since pustule formation was observed
by 15 dpi in the susceptible cultivar but not in the APR cultivar, the defence response must
have inhibited the infection process of Pst.
Sub-epidermal observations of infection structures using SEM and leaf fractioning were only
done for the susceptible 37-07 line. WGA-FITC staining and fluorescence microscopy
allowed the resolution of internal infection structures and were used to study the infection
process at 1 dpi and onwards. Both SEM and fluorescence microscopy showed SSV
development at 1 dpi but fluorescence microscopy showed HMC development too. Clear
HMC development was only seen by 36 hpi using SEM. The discrepancy between SEM and
fluorescence microscopy may be based on disadvantages associated with the former. Though
SEM delivers better resolution and magnification, infection sites are seldom observed and
required meticulous observation. Fluorescence microscopy allowed large sections of the leaf
sheath to be rapidly examined, but insufficient destaining affected resolution. These
techniques confirmed that HMC are formed from 24-36 hpi. Formation of HMC was
observed by 40 hpi by Niks (1986) but as early as 12 hpi by Lennox and Rijkenberg (1989).
Both SEM and fluorescence microscopy showed the SSV forming a septum, indicating the
formation of HMC. The formation of a primary IH could not be confirmed and was less
pronounced as reported by Lennox and Rijkenberg (1989). The clear distinction between the
primary IH and secondary IH is therefore not made from the observations reported in the
current study. Tiburzy et al. (1990) indicated that the first HMC formed by Pgt within the

91
sub-stomatal chamber penetrates an epidermal cell from beneath, in which it establishes a
haustorium. In the current study the formation of the first HMC was observed just within the
sub-stomatal chamber. The first HMC may form a haustorium that penetrates the epidermal
cell and then acts as a first point for nutrient uptake by the pathogen. Both SEM and
fluorescence microscopy showed the formation of IH off this first HMC by 2 dpi, confirming
this point as crucial in the initiation of the biotrophic relationship. Cells of the epidermis may
well be the first host cells to be penetrated but as the current study did not observe
haustorium formation at 2 dpi, the hypothesis cannot be confirmed. In wheat seedlings
inoculated with Pgt, secondary IH formation with HMC was seen at 1 dpi (Lennox and
Rijkenberg, 1989). Both SEM and fluorescence microscopy showed that the IH invariably
had a double branched structure and similar secondary IH were noted by Lennox and
Rijkenberg (1989).
For fluorescence microscopy of inoculated flag leaf sheaths of wheat, Uvitex 2B staining
proved to be an inadequate approach. Previously, Uvitex 2B was effective for the staining of
Pst colonies on the flag leaves of APR wheat lines (Moldenhauer et al., 2006; Moldenhauer
et al., 2008). The destaining of the flag leaf sheath of the last internode is problematic and the
method must be therefore be further optimised if Uvitex 2B is to be used. The Uvitex 2B
staining method is advantageous as it can be combined with an autofluorescence test for the
HR, and a test for lignin formation. Subsequent testing of Uvitex 2B stained Pst-inoculated
flag leaves showed the HR and lignin formation associated with colonies on the APR line
Kariega (Moldenhauer et al., 2006). Microscopic observations of the APR W1406 and
W6979 lines showed no cell death or lignin formation at any time point up to 5 dpi. Therefore
the HR and lignification may not form part of the early defence mechanism in these two
lines. The quantitative trait loci (QTL) present in the APR line Kariega were varyingly linked
with lignification upon Pst inoculation (Moldenhauer et al., 2008). The presence of QYr.sgi-
7D resulted in lignification in wheat but this did not restrict fungal growth. However, the
presence of QYr.sgi-2B.1 resulted in occasional lignification but the presence of the QTL
effectively restricted fungal growth. Therefore, before the absence of the HR and lignification
can be confirmed in W1406 and W6979, further testing is required.
If the destaining of flag leaf sheaths can be improved, microscopic techniques with better
resolution may be used. Two-photon excitation microscopy was shown to give excellent
resolution of infection structures including haustoria (Sørensen et al., 2012). Haustoria were
seldom observed in the current study and other techniques need to be investigated. In both

92
susceptible and race-specific resistant lines infection sites with more than one haustorium
were only observed from 32 hpi onwards, and greatly increased from 32 to 44 hpi (Skipp et
al., 1974). The formation of HMC from 24-36 hpi and IH associated with the first HMC in
the current study suggests that the biotrophic relationship between the wheat lines and Pgt
was established at 1 dpi, but conclusively at 2 dpi.
Proliferation of intracellular IH and further HMC formation was seen by 3 dpi using
fluorescence microscopy. Furthermore, no quantifiable differences in the infection process of
Pgt on the three lines were observed in any time point up to 3 dpi. The adult plant infection
response observed in W1406 and W6979 (Chapter 3, Table 3.5) can therefore not be related
to histological observations at these time points. The potential of a decrease in Pgt
development could not be excluded and techniques should be improved further on leaf
sheaths. However, in the current study, the defence response appears to be induced after the
formation of the first HMC. Although HMC and haustorium formation was not quantified, a
pre-haustorial defence response coupled with the APR in W1406 and W6979 could not be
confirmed.
By 5 dpi the biotrophic relationship becomes even more apparent with many infection
structures becoming indistinguishable in the mass of fungal mycelium within the leaf sheath
tissue. At this time colony size differed between the two APR lines and the susceptible
control line. The mean colony size differed significantly within a large sampling pool. The
APR response is therefore clearly restricting Pgt growth at 5 dpi. The two APR lines also
differed significantly, which corresponds to the phenotypic scores of the infection responses
shown in Chapter 3 (Table 3.5). W6979 showed a stronger APR response than W1406, but
W1406 could still effectively restrict Pgt development.
The inhibition of fungal development at later time points was also seen in other Puccinia spp.
At 5 dpi adult wheat plants with Lr34 showed significantly smaller Pt colonies as compared
to the susceptible control (Rubiales and Niks, 1995). The early infection structures of Pt were
studied on a susceptible cultivar and two race-specific resistant cultivars (based on Lr19 and
Lr21 respectively) using SEM (Hu and Rijkenberg, 1998). There were no significant
differences between the susceptible and resistant lines in the formation of SSV, primary IH,
secondary IH and HMC up to 4 dpi. However, these lines could be differentiated by the
number of uredinia formed by 6 dpi, indicating that resistance is expressed only after HMC
formation (Hu and Rijkenberg, 1998). Similarly, Pst-inoculated doubled haploid lines with
93
varying numbers of QTL originating from Kariega could only be distinguished from 6 dpi
onwards (Moldenhauer et al., 2008). Such a defence response at these points, as seen in the
current study is clearly post-haustorial in character.
By 10 dpi all three lines exhibited sporulation. On a visual basis the largest amount of
sporulation was seen in 37-07, followed by W1406 and W6979. Though colonization was not
quantified at 10 dpi it was clear that the APR response that restricted Pgt colonization at 5 dpi
still delayed development by 10 dpi and is probably responsible for the observed phenotype.
Dawson et al. (2015) described a method for Pst quantification on the non-host seedlings
using WGA-FITC staining. Percentage colonization and pustule formation at 14 dpi were
correlated with the adult plant infection responses. In the current study, quantification of Pgt
colony size at 5 dpi directly corresponded with the phenotypic scoring at 14 dpi (Chapter 3;
Table 3.5) and quantification of sporulation was not required. Quantification of Pgt colony
size therefore served as an effective tool to distinguish wheat lines nine days earlier than
phenotypic scoring.
The 37-07 line used for cross-sectioning of the last internodes confirmed sporulation by 10
dpi. Fluorescence microscopy proved as effective as the traditionally used Safranin O/Fast
Green FCF staining. The maturation of spores in the uredinium may be easily followed in
cross section. Uredinium formation may also vary along the length of the leaf sheath and
cross-sectioning may assist in elucidating these effects. Cross-sectioning of the last internode
may also lead to further analyses beyond microscopic observations. Hacquard et al. (2010)
impregnated Melampsora larici-populina inoculated leaves with paraffin and the fungal
tissue associated with pustules was then separated and collected by laser capture
microdissection. RNA was extracted from these sections and used for downstream analyses,
comparing expression in the sub-epidermal uredinium to the fungal tissue in the infected
spongy and palisade mesophyll. Microdissection should therefore be considered for further
investigations of the Pgt infection process.
The APR response that effectively restricted Pgt colonization by 5 dpi could not be
elucidated using microscopic techniques. However, microscopic techniques have given
insight into the APR response compared to other Puccinia spp. A Brazilian wheat cultivar
Toropi also exhibits APR against Pt and restricts the development of infection structures
from appressorium formation onwards (Wesp-Guterres et al., 2013) indicating a pre-
haustorial defence mechanism. The HR is observed only in 37% of infection sites as late as 5

94
dpi, indicating that a post-haustorial defence mechanism is also present. The APR cultivar
Xingzi 9104 inhibits Pst haustorium and secondary IH formation along with the accumulation
of H2O2 and O2-, and associated cell death (Zhang et al., 2012), indicating a pre-haustorial
defence mechanism. In contrast, the APR response in Guardian to Pst and Pt is only
expressed much later and was shown to affect sporulation but not earlier fungal development
(Boyd and Minchin, 2001). Cell death and peroxidase activity were not observed in Guardian
(Melichar et al., 2008) indicating a post-haustorial defence mechanism. APR may thus
include either pre- and post-haustorial defence mechanisms or both, and the response is
exceptionally varied.
In Chapter 3 (Table 3.5) the phenotypic scoring of Pgt-inoculated leaf sheaths indicated
expression of an APR response in W1406 and W6979. Though the mechanism of APR in the
W1406 and W6979 lines was not clarified by microscopic observations in the current study,
the timing of the response was illustrated. The APR lines effectively inhibited colonisation in
the APR lines by 5 dpi and implied a defence response being induced earlier than 5 dpi. The
microscopic techniques may allow for better quantification of the Pgt infection process on
leaf sheaths. Other techniques, such as gene expression analysis, are available to researchers
and may also allow for quantification. Histological observation should however remain the
initial basis of any investigation of plant-pathogen interactions.
Microscopic observations made during the current study led to two major conclusions.
Firstly, the methods used proved successful to describe the infection process of Pgt on the
flag leaf sheath of the last internode of adult wheat. The microscopic observations therefore
gave an insight into the infection process on the tissue type that is used for phenotypic
scoring. The study also opens the door for future work on Pgt-inoculated flag leaf sheaths.
Secondly, the time point whereby the APR W1406 and W6979 lines restricted Pgt
development was identified. Due to the importance of haustoria in the infection process, the
defence response is usually separated into pre-haustorial and post-haustorial defence
mechanisms. Microscopic observations confirmed that both the W1406 and W6979 lines
exhibit post-haustorial defence mechanisms. Though the defence mechanism could not be
elucidated by microscopic observations, colonization was found to be significantly inhibited
by the APR lines. The inhibition of Pgt colonization on the flag leaf sheaths matches
phenotypic scoring and is the result of the APR response in W1406 and W6979.

95
Chapter 5: Molecular quantification of Puccinia
graminis f. sp. tritici biomass and haustorium
formation in adult wheat plants

96
5.1 Introduction
The symptoms of rusts on wheat (Triticum aestivum) are caused by infection of fungal
pathogens of the Puccinia spp.. Puccinia triticina (Pt), P. striiformis f. sp. tritici (Pst) and P.
graminis f. sp. tritici (Pgt) are the causal agents of wheat leaf rust, stripe rust and stem rust
respectively (Dean et al., 2012). Wheat host plants may however impede the infection
process of these pathogens by inducing a defence response that often becomes visible as a
quantifiable resistance phenotype. Variation of the disease symptoms manifested by Puccinia
spp. infection has been classified by phenotypic scoring conventions. The phenotypic
response of wheat may be classified according to Stakman et al. (1962) for seedlings and
Roelfs et al. (1992) for adult plants. Phenotypic scoring may, however, be critiqued for being
subjective. More objective techniques to describe the infection phenotype have however been
implemented. Conversely, these methods are often destructive to plant tissue, slow and
labour-intensive.
Microscopic observation of the infection process is more objective and remains a primary
method to describe the plant-pathogen interaction. The infection process of Pgt has been
thoroughly explained through histological investigations (Leonard and Szabo, 2005). Using
microscopic techniques, the infection structures of fungal pathogens can be directly observed,
described and quantified. While microscopic observations are less subjective it remains
laborious.
Methods beyond phenotypic scoring and microscopy may be used by researchers to quantify
the infection processes of fungal plant pathogens. These methods are classified as direct or
indirect (Sankaran et al., 2010). Direct methods are based on the exact detection of the
pathogen and indirect methods rather on the host plant response when challenged by
infection. In the current chapter, focus was given to direct molecular methods that allow
infection to be quantified and followed over time, particularly in the Pucciniales.
Quantitative polymerase chain reaction (qPCR) based methods were proposed as crucial tools
to detect plant pathogens on hosts (Schena et al., 2004). A method for absolute fungal DNA
quantification was used by Jackson et al. (2006) to quantify Puccinia coronata f. sp. avenae
infection on inoculated oat seedlings and flag leaves. In that study, fungal genomic markers
were analysed by qPCR and DNA quantified from a qPCR standard curve. Absolute fungal
DNA quantification by qPCR was also used for Pst (Gao et al., 2016). The number of nuclei
observed in Pst during colonization varied greatly especially in haustorial mother cells

97
(HMC) and non-sporogenous mycelium (Chong et al., 1992). Voegele and Schmid (2011)
argued that due to this difference in the number of nuclei, absolute DNA quantification may
not be an accurate method to follow the development of multinucleate fungi on hosts. In the
P. coronata f. sp. avenae - oat interaction a relative qPCR quantification method expressing
the marker of Jackson et al. (2006) versus the oat β-actin gene proved as successful as
absolute DNA quantification (Acevedo et al., 2010).
Relative quantification of pathogen versus host genes analysed by qPCR has subsequently
been widely implemented. Relative quantification of the rRNA intergenic ITS region of both
the pathogen and host was used to follow Melampsora larici-populina development on poplar
cuttings (Rinaldi et al., 2007; Hacquard et al., 2011). The pathogen rRNA intergenic ITS
region versus the host ubiquitin gene was used to follow Pgt colonization in barley seedlings
(Zurn et al., 2015). DNA quantification can thereby be used to infer fungal biomass and
follow its accumulation over the course of infection.
RNA quantification by reverse transcriptase qPCR (RT-qPCR) was proposed as the
alternative to absolute DNA quantification (Voegele and Schmid, 2011). β-tubulin and two
uncharacterised genes (Hahn and Mendgen, 1997) allowed the quantification of Uromyces
fabae development on broad bean plants (Voegele and Schmid, 2011). Relative quantification
of pathogen genes is informative of the infection process of fungal pathogens and was used to
infer fungal biomass of Pst on wheat (Coram et al., 2008). Relative gene quantification
analysis by RT-qPCR has also found application in the analysis of haustorium associated
transcripts to infer its formation in Uromyces appendiculatus (Puthoff et al., 2008) and Pst
(Yin et al., 2009).
In addition, direct quantification of fungal proteins by immunological based methods is
possible. Monoclonal antibodies for urediniospores were generated for Pst (Skottrup et al.,
2007) and Pt (Gao et al., 2013) and used to detect urediniospores by an enzyme-linked
immunosorbent assay (ELISA). Immunological based methods have however not been
applied to quantify Puccinia spp. infection on hosts.
Another direct quantification method of fungal pathogen infection was described by Ayliffe
et al. (2013). The method is based on the binding of wheat germ agglutinin fluorescein
conjugate (WGA-FITC) to fungal chitin. Fluorescence measurement of bound WGA-FITC
allows chitin quantity, and by extension fungal biomass quantification. The method can be
applied to any plant-fungal interaction, but cannot distinguish species. Ayliffe et al. (2013)

98
successfully applied the method to wheat inoculated with Pgt, Pst, Pt and Blumeria graminis
f. sp. tritici. The method has been widely implemented to study the various interactions of
Puccinia spp. with wheat (Moore et al., 2015; Hiebert et al., 2016; Rinaldo et al., 2017) and
maize (Sucher et al., 2017).
Numerous methods are therefore available to follow fungal infection, but these have not been
extensively applied in Pgt infected flag leaf sheaths of adult wheat plants. The flag leaf
sheath is used for phenotypic scoring of stem rust on adult wheat plants (Roelfs et al., 1992),
and methods to detect and quantify Pgt infection must therefore sample leaf sheaths to allow
direct comparison to the phenotypic scoring.
The aim of this chapter was to identify the time point whereby Pgt colonization is inhibited in
adult plant resistant (APR) wheat lines. Particular focus was given to the W1406 and W6979
lines under investigation. To achieve the aim, two objectives were defined. Firstly, to
investigate molecular methods to quantify Pgt infection on inoculated flag leaf sheaths of
adult wheat plants. Secondly, to determine if the implemented methods can follow Pgt
development over the course of infection and consistently distinguish APR wheat from
susceptible wheat.

99
5.2 Materials and methods
5.2.1 Biological material
For molecular analysis, Pgt-inoculated wheat samples were generated as described in Chapter
3. Unless otherwise stated, all wheat lines, entries or cultivars from the seedling and six adult
plant trials (Adult trials 1-6) were included. The flag leaf sheath of the last internode was
collected as previously described and further processed. The 0 days post inoculation (dpi)
sample was collected directly following inoculation. Samples were thereafter taken at 1, 3, 5
and 10 dpi.
5.2.2 Chitin quantification by fluorescence analysis
For chitin quantification, the method of Ayliffe et al. (2013) was used with modifications
relevant to processing wheat leaf sheaths. Samples were collected for the first two adult plant
trials (Adult trials 1 and 2; see Chapter 3) which included the 37-07, W1406 and W6979
lines. The last internode (leaf sheath and stem) was cut into manageable sections and placed
directly in 1 M KOH containing 0.05% (v/v) Silwet L-77 (SouthernChem, Sandton, South
Africa). The stem assured structural integrity of samples. Samples were autoclaved at 120°C
and 1.0 kg/cm2. Sections were thereafter washed thrice with a 50 mM
tris(hydroxymethyl)aminomethane-hydrochloric acid (Tris-HCl) buffer (pH 7.0), the internal
stems removed and the flag leaf sheaths further processed. Flag leaf sheath samples were
adjusted to a ratio of 200 mg to 1 ml 50 mM Tris-HCl buffer (pH 7.0).
The flag leaf sheaths required maceration by a polytron blender to achieve a uniform
suspension. Samples were further processed as described by Ayliffe et al. (2013) and chitin
probed by WGA-FITC (Sigma-Aldrich, St Louis, Missouri, United States of America).
Fluorescence was measured in 200 μl of macerated sample using a Zenyth 3100 multimode
detector (Anthos Labtec Instruments, Salzburg, Austria). Fluorescence measurements were
done in quadruplicate with excitation at 485 nm and emission at 535 nm with an integration
time of 1 sec. An uninoculated flag leaf sheath sample was used to generate a fluorescence
versus chitin standard curve. Chitin from crab shells (Sigma-Aldrich, St. Louis, Missouri,
United States of America) of 0-100 μg was added to the uninoculated sample and
fluorescence measured as before.

100
5.2.3 Relative gene quantification analysis
5.2.3.1 Total RNA extraction
For RNA sampling, the flag leaf sheath was gently removed and the stem discarded at the
moment of collection. Samples were collected for the seedling trial and all adult plant trials
(Adult trials 1-6; see Chapter 3). Leaf sheath samples were immediately frozen in liquid
nitrogen. Tissue was ground to a fine powder in liquid nitrogen using a mortar and pestle and
thereafter stored at -80°C. All experimentation described hereafter relating to RNA was done
using nuclease free water. The nuclease free water was prepared by adding 0.1% (v/v)
dimethyldicarbonate (DMPC) to deionised water and leaving it overnight at room
temperature. The water was finally autoclaved twice to destroy the DMPC.
Total RNA was extracted from 100 mg ground wheat leaf sheath tissue using TRIzolTM
reagent (Chomczynski and Sacchi, 1987), keeping to the manufacturer’s instructions (Thermo
Fisher Scientific, Waltham, Massachusetts, United States of America). After finally
dissolving the RNA in 200 µl DMPC-treated water, the concentration was determined using
the NanoDrop 2000 Spectrophotometer (Thermo Fisher Scientific). RNA quality was
assessed by separating 200 ng RNA on a 1.0% (w/v) denaturing agarose gel (Sambrook et al.,
1989) prepared in a 3-(N-morpholino)propanesulfonic acid (MOPS) buffer (20 mM MOPS
pH 7.0, 5 mM sodium acetate, 1 mM ethylenediaminetetraacetic acid (EDTA)). The RNA
was dissolved in 1x MOPS buffer, 50% (v/v) formamide, 6.5% (v/v) formaldehyde and 50
μg/ml ethidium bromide, denatured at 65°C for 15 min and separated using 1x MOPS
running buffer. The gel was observed under ultraviolet light illumination (302 nm) using the
GelDoc XR+ system (Bio-Rad, Hercules, California, United States of America).
5.2.3.2 Reverse transcriptase quantitative polymerase chain reaction
The expression of six gene transcripts (four reference transcripts from wheat and two
experimental transcripts from Pgt) was determined by RT-qPCR. The primer sequences of
these transcripts are reported in Table 5.1 and were derived from literature or designed using
PrimerQuest (https://eu.idtdna.com/Primerquest/Home/Index). The KAPA SYBR® FAST
One-Step RT-qPCR kit (Kapa Biosystems, Wilmington, Massachusetts, United States of
America) was used for amplification from 10 ng total RNA as per the manufacturer’s
instructions. Amplification was done with the C1000 thermal cycler and the CFX96 real-time

101
attachment (Bio-Rad). The amplification protocol was 42°C for 10 min, 95°C for 3 min, 40
cycles of 95°C for 10 sec and the specific primer annealing temperature (Table 5.2) for 30
sec. Primer specificity was confirmed using a melt curve analysis from 65-95°C at 0.5°C/5
sec. Optimal annealing temperatures were determined from a gradient RT-qPCR and the
range of linear amplification determined from a 3:1 total RNA serial dilution, Cq versus log
starting quantity standard curve. Each RT-qPCR run included a no template control to
confirm primer specificity and absence of DNA or RNA contamination.
The RT-qPCR amplicons were separated on a 2.0% (w/v) agarose gel prepared in 0.5x TAE
buffer (20 mM Tris-HCl pH 8.0, 0.5 mM EDTA, 0.28% (v/v) acetic acid) containing 0.5
μg/ml ethidium bromide (Sambrook et al., 1989). The gel was observed under ultraviolet
light illumination using the GelDoc XR+ system (Bio-Rad) to confirm the amplification of a
single product. Melt curves were further validated by comparison to predicted melt curves as
generated by uMELT v 2.0 (https://www.dna.utah.edu/umelt/umelt.html) (Dwight et al.,
2011).
All gene quantification analyses were done using qBasePlus v 2.6 (Biogazelle, Gent,
Belgium) (Hellemans et al., 2007). Reference gene validation was done for four transcripts
from wheat: 18S ribosomal RNA (Ta-18S), β-tubulin (Ta-BTUB), cell division control protein
(Ta-CDC) and transcription elongation factor 1 alpha (Ta-TEF). All samples from Adult
trials 1-6 were included for reference gene validation with the exception of the doubled
haploid (DH) entries. Due to differences in wheat samples included in trials, Adult trials 1-4
and Adult trials 5-6 were analysed separately. Cq values were imported into the geNorm
module of qBasePlus and the mean expression stability (M) values calculated based on the
method of Vandesompele et al. (2002). The M value allows a group of selected candidate
reference genes to be ranked based on their expression stability in a given experiment. A
lower M value corresponds to higher stability of a reference gene. Furthermore, if a gene has
an M value greater than 1.0 it is considered unstable and should not be selected as a candidate
reference gene.
Relative gene quantification was done for two experimental transcripts from Pgt: β-tubulin
(Pgt-BTUB) and a transcript encoding an uncharacterised protein (PGTG_11318). The Pgt-
BTUB transcripts level was expressed relative to the level of Ta-TEF transcripts as based on
the method of Coram et al. (2008). The PGTG_11318 gene was selected as a putative marker
for haustorium formation in the current study. PGTG_11318 encodes an uncharacterised

102
protein and the transcript was highly upregulated in Pgt infected wheat tissue at 8 dpi
compared to urediniospores (Duplessis et al., 2011). Furthermore, PGTG_11318 had
homology to ten expressed sequence tags (EST) in a haustorial library. The PGTG_11318
transcript level was expressed relative to the level of the Pgt-BTUB transcript.
Normalised relative quantity of the two experimental transcripts was calculated in qBasePlus
based on the method of Pfaffl (2001). For both reference gene validation and relative gene
quantification analyses, replicate variability was set to a maximum limit of 0.5 Cq values and
significant outliers were excluded for each set of four technical replicates. The RT-qPCR
analyses were done in compliance to the essential Minimum Information for Publication of
Quantitative Real-Time PCR Experiments (MIQE) recommendations (Bustin et al., 2009;
Taylor et al., 2010).
The mean normalised relative quantities from Adult trials 1-4 for the 37-07, W1406 and
W6979 lines were statistically analysed by a Tukey's multiple comparisons test using
GraphPad Prism v 6.01. The mean normalised relative quantity of each line was compared to
the mean normalised relative quantity of every other line at every time point. The confidence
level for the test was set at 99%. The 37-07 line for the seedling and six adult plant trials was
used to model the normalised relative quantities over the course of infection. The non-linear
regression equations from GraphPad Prism were used to determine the best fit model. The
least squares method was used to fit the model and determine the graph equation with a
confidence level of 95%. An additional sum of squares F test was included to determine if a
single model may accurately describe all the independent trials.
5.2.4 Sequence analysis of PGTG_11318
5.2.4.1 Sequencing of PGTG_11318
Specific amplification of PGTG_11318 was confirmed by cloning and sequencing the
amplicon. RNA samples from the first four biological replicates (Adult trials 1-4) at 3 dpi
from the 37-07 line were used for a non-quantitative RT-PCR. The RobusT II RT-PCR kit
(Finnzymes, Espoo, Finland) was used per the instruction manual using 10 ng of total RNA.
The amplification protocol was identical to the RT-qPCR protocol (see section 5.2.3.2) but
excluded a melt curve analysis. A subset of the RT-PCR products were separated on a 2.0%
(w/v) agarose gel and observed using the GelDoc XR+ system (Bio-Rad) (see section 5.2.3.2)
to confirm the amplification of a single product.

103
The remaining RT-PCR products were ligated into pGEM®-T Easy vector (Promega,
Madison, Wisconsin, United States of America) as per the instruction manual. Plasmids were
transformed into the JM109 strain of Escherichia coli competent cells. Five μl of the ligation
reaction was added to 80 μl competent cells and incubated for 30 min on ice. Thereafter the
suspension was heat shocked at 42°C for 45 sec and again incubated for 2 min on ice. To the
suspension, 900 μl lysogeny broth (LB) medium consisting of 1.0% (w/v) tryptone, 0.5%
(w/v) yeast extract and 1.0% (w/v) NaCl, was added and incubated at 37°C for 90 min. The
suspension was thereafter plated on LB plates (LB medium with the addition of 1.5% (w/v)
agar, 2.0% (w/v) 5-bromo-4-chloro-3-indolyl-β-D-galactopyranoside (X-gal) and 2.0% (w/v)
isopropyl β-D-1-thiogalactopyranoside (IPTG)). Plates were incubated at 37°C for 12 h and
subjected to blue-white selection. Selected colonies were inoculated in 5 ml LB medium and
incubated at 37°C for 16 h. After centrifugation for 5 min at 12 000g, the pelleted cells were
suspended in DMPC treated water and incubated for 5 min at 94°C. The suspension was
centrifuged for 5 min at 12 000g and the extracted plasmids was directly used for PCR.
The KAPA Taq PCR kit (Kapa Biosystems) was used per the instruction manual using 10
pmol of the PGTG_11318 primers. The PCR protocol was 95°C for 3 min, 40 cycles of 95°C
for 10 s and 62°C for 30 s. The PCR products were separated on a 2.0% (w/v) agarose gel
and observed using the GelDoc XR+ system (Bio-Rad) (see section 5.2.3.2) to confirm the
amplification of a single product. The remaining PCR products were purified with the
FavorPrep™ Gel/ PCR Purification kit (Favorgen Biotech Corporation, Pingtung City,
Taiwan) as per the instruction manual.
Purified PCR products were sequenced using the BigDye® Terminator v. 3.1 Cycle
Sequencing Kit (Applied Biosystems, Foster City, California, United States of America) as
per the instruction manual. PCR products were sequenced using 3.2 pmol of the forward
primer for PGTG_11318. The sequencing PCR protocol was 96°C for 1 min, 25 cycles of
96°C for 10 sec, 50°C for 10 sec and 60°C for 4 min. The sequenced PCR products were
purified by adding 5 µl 125 mM EDTA and 60 μl 100% ethanol to each tube. Samples were
incubated at room temperature for 15 min, and then centrifuged for 15 min at 12 000g. The
supernatant was discarded and the pellet washed with 70% (v/v) ethanol. Thereafter each
reaction was centrifuged for 5 min at 12 000g, the supernatant discarded and the pellet dried.
Eeactions were separated on a 3130xl Genetic Analyzer (Applied Biosystems) with the
StdSeq50_POP7 sequencing run module. Sequencing was done at the facilities of the

104
Department of Microbial, Biochemical and Food Biotechnology (University of the Free
State).
5.2.4.2 Computational analysis of PGTG_11318
To elucidate the possible function of PGTG_11318, the protein sequence was aligned against
the Ensembl database for fungal species (http://fungi.ensembl.org) limited to the Pucciniales.
The Ensembl database was also used to search for homologues of PGTG_11318. National
Center for Biotechnology Information (NCBI) Blast (https://blast.ncbi.nlm.nih.gov/Blast.cgi)
was used to search for ESTs with homology to the PGTG_11318 coding sequence. Online
programmes (Table 5.3) were used to elucidate the putative subcellular localization and
function of PGTG_11318 from the protein sequence.

105
Table 5.1: Primer sequences of analysed transcripts used for reverse transcriptase quantitative
polymerase chain reaction. Forward (F) and reverse (R) primer sequences are shown.
References for published primer sequences and accession for designed primers are indicated;
the Ensembl accession firstly and the National Center for Biotechnology Information
accession in brackets.
Transcripts Primer sequence
(5' → 3')
Reference/
Accession number
Ta-18S F: GTGACGGGTGACGGAGAATT
R: GACACTAATGCGCCCGGTAT
Jarošová and
Kundu (2010)
Ta-BTUB F: CAAGGAGGTGGACGAGCAGATG
R: GACTTGACGTTGTTGGGGATCCA
Jarošová and
Kundu (2010)
Ta-CDC F: CAAATACGCCATCAGGGAGAACATC
R: CGCTGCCGAAACCACGAGAC
Paolacci et al.
(2009)
Ta-TEF F: GCCCTCCTTGCTTTCACTCT
R: AACGCGCCTTTGAGTACTTG
Giménez et al.
(2011)
Pgt-BTUB F: CTCGATCGTGATGAGTGGGA
R: AGTGCAATCGAGGGAAAGGA
PGTG_12204
(XM_003330619.2)
PGTG_11318 F: AACGGTGGCATGAACACTAT
R: GAAGACTTGGGAGCCTTGTT
PGTG_11318
(XM_003329520.2)

106
Table 5.2: Reverse transcriptase quantitative polymerase chain reaction details for transcripts
analysed in the current study. Confirmed amplicon sizes in number of nucleotides (nt) and
annealing temperatures are shown. Efficiencies and coefficients of determination (R2-values)
established from Cq versus log starting quantity standard curves for each respective transcript
are indicated.
Transcripts Amplicon size
(nt)
Annealing
temperature
(°C)
Efficiency
(%)
Coefficient of
determination
(R2-value)
Ta-18S 151 65 110.3 0.999
Ta-BTUB 84 64 103.3 0.999
Ta-CDC 227 64 107.0 0.996
Ta-TEF 91 60 98.6 0.993
Pgt-BTUB 107 56 107.1 0.984
PGTG_11318 120 62 99.7 0.943

107
Table 5.3: Programmes used for the analysis of the predicted PGTG_11318 protein sequence.
Respective references and websites accessed are indicated.
Programme Reference Website
EffectorP
v 2.0
Sperschneider et al. (2018) http://effectorp.csiro.au
InterPro
v 5.25
Jones et al. (2014) https://www.ebi.ac.uk/interpro
Phobius
v 1.01
Käll et al. (2007) http://phobius.sbc.su.se
SignalP
v 4.1
Petersen et al. (2011) http://www.cbs.dtu.dk/services/SignalP
TargetP
v 1.1
Emanuelsson et al. (2000) http://www.cbs.dtu.dk/services/TargetP
TMHMM
v 2.0
Krogh et al. (2001) http://www.cbs.dtu.dk/services/TMHMM
WoLF PSORT
v 0.2
Horton et al. (2007) https://wolfpsort.hgc.jp

108
5.3 Results
5.3.1 Chitin quantification by fluorescence analysis
The fluorescence versus chitin standard curve exhibited a linear correlation (R2 = 0.9178)
between fluorescence and amount of added chitin up to a maximum quantity of 100 μg
(results not shown). At the maximum amount of chitin, the measured fluorescence units were
approximately 700 000. All subsequent fluorescence measurements fell within the linear
range of the standard curve.
The binding of WGA-FITC to chitin in fungal tissue and the resulting fluorescence
measurements allowed chitin amount to be inferred in Pgt-inoculated adult wheat over time.
In both Adult trial 1 and 2 the chitin quantity increased from 0 to 10 dpi in the susceptible
(37-07) and APR lines (W1406 and W6979) (Figure 5.1). For Adult trial 1 (Figure 5.1 a) the
greatest increase of chitin quantity was observed in the time interval from 0 to 1 dpi, but such
a rapid increase was not observed for the same time interval in Adult trial 2 (Figure 5.1 b).
All samples showed the highest chitin quantity at 10 dpi (approximately 400 000
fluorescence units). The general pattern of chitin accumulation over time corresponded well
between the two trials.
In both trials the tested wheat lines could not be distinguished at 0, 1 or 3 dpi. However, at 5
and 10 dpi the three wheat lines could be clearly distinguished with the exception of the 37-
07 and W1406 lines at 5 dpi in Adult trial 2 (Figure 5.1 b). In both trials at 5 dpi the 37-07
line had the highest chitin quantity followed by W1406, with W6979 having the lowest. The
ranking of the three wheat lines was maintained at 10 dpi, and was identical in both trials.
5.3.2 General reverse transcriptase quantitative polymerase chain reaction results and
reference gene validation
Amplification of a single product during RT-qPCR was observed for all six tested primer
pairs. Melt curves of amplicons corresponded to predicted melt curves generated by uMELT
and showed a single peak for all six amplicons (results not shown). Amplification occurred
within the linear range, as confirmed by the standard curve of Cq versus log starting quantity.
The R2-values (Table 5.2) were above the desired value of 0.980 for all transcripts with the
exception of PGTG_11318. The amplification efficiency values (Table 5.2) were all within
the desired range of 90-110% for all transcripts, with the exception of Ta-18S.

109
The M values determined by the geNorm analysis for the four reference transcripts are
reported in Figure 5.2 for Adult trails 1-4 and Figure 5.3 for Adult trails 5-6. These two
groups of trials were analysed and reported separately based on the wheat lines/cultivars used
in the respective trials. The M values for Adult trails 1-4 were all below the 1.0 cut-off for
heterogeneous samples. Ta-TEF had the lowest M value, followed by Ta-18S, Ta-CDC and
finally Ta-BTUB. Three of the four reference transcripts for Adult trails 5-6 fell below the 1.0
cut-off, with Ta-BTUB having an M value greater than 1.0. The M values determined for
Adult trails 5-6 were much higher than the M values of Adult trail 1-4. Ta-TEF again had the
lowest M value, but was then followed by Ta-CDC and Ta-18S, with Ta-BTUB having the
highest M value.
5.3.3 Puccinia graminis f. sp. tritici β-tubulin transcript quantification
Quantification of the Pgt-BTUB transcript relative to the Ta-TEF reference transcript allowed
the Pgt biomass in inoculated wheat to be inferred. The seedling trial (Figure 5.4), in which
all three wheat lines are susceptible to Pgt, showed an increase in Pgt-BTUB transcripts over
the course of infection. The three lines were not distinguishable from 0 to 5 dpi; but at 10 dpi
the Pgt-BTUB transcript levels indicated that W1406 had higher fungal biomass than 37-07
and W6979, but these two lines could not be distinguished from each other.
The Pgt biomass in the flag leaf sheaths of inoculated adult plants are indicated in Figures
5.5-5.9. The analysis of the 37-07, W1406 and W6979 lines of Adult trials 1-4 are indicated
in Figure 5.5. These lines were not distinguishable based on Pgt biomass from 0 to 3 dpi.
However, at 5 dpi differences between lines were distinguishable, but results were variable.
Adult trial 4 (Figure 5.5 d) showed Pgt-BTUB transcript levels highest in the 37-07 line,
followed by W1406 and then W6979. In the other trials, two of the three lines could not be
distinguished at 5 dpi. At 10 dpi the Pgt biomass greatly increased and the three lines were
clearly distinguishable. Consistently, the 37-07 line had the highest Pgt-BTUB transcript
levels followed by W1406 and finally W6979. The ranking of these APR lines at 10 dpi,
based on inferred biomass, was consistent in Adult trial 1-4.
The mean transcript levels of Pgt-BTUB, in the four biological replicates over the course of
infection are indicated in Figure 5.6. The ranking of wheat lines as 37-07, W1406 and
W6979, based on inferred biomass was possible at 5 and 10 dpi. However, a Tukey's multiple
comparison test (Table 5.4) indicated that each line could only be statistically distinguished
from the other two at 10 dpi.
110
Adult trials 3 and 4 included four DH entries in the analysis of Pgt-BTUB transcripts (Figures
5.7 and 5.8). These entries were DH1.43, DH1.50, DH2.31 and DH2.38, indicated with their
respective parental lines. As before, no entries could be distinguished from the parental lines
from 0 to 3 dpi. Analyses of the DH1.43 and DH1.50 biomass showed that these entries,
along with W1406, were distinguishable from 37-07 at 5 dpi. In Adult trial 3 (Figure 5.7 a),
ranking of lines and entries at 10 dpi showed 37-07 had the highest Pgt-BTUB transcript
levels followed by DH1.50, then W1406 and finally DH1.43. In Adult trial 4 ranking of the
lines and entries were: 37-07, DH1.50, DH1.43 and W1406 (Figure 5.7 b).
Biomass analyses of the other two DH entries, DH2.31 and DH2.38, showed that these
entries could not be consistently distinguished at 5 dpi (Figure 5.8). In Adult trial 3 (Figure
5.8 a) DH2.31, DH2.38 and the parental lines were distinguishable at 5 dpi, but in Adult trial
4 (Figure 5.8 b) only 37-07 was distinguishable and showed the highest Pgt-BTUB transcript
levels. At 10 dpi all lines and entries were distinguishable. In Adult trial 3 the ranking of
biomass from highest to lowest was: 37-07, DH2.31, DH2.38 and W6979, but the DH entries
could not be distinguished from one another. In Adult trial 4 at 10 dpi, the highest Pgt-BTUB
transcript levels were in 37-07, and were followed by DH2.38, then DH2.31 and finally
W6979 as before.
Adult trials 5 and 6 (Figure 5.9) included the Pavon-76, Francolin-1 and Kingbird cultivars
along with the 37-07 line. These cultivars were not distinguishable based on Pgt biomass
from 0 to 3 dpi. At 5 dpi in Adult trial 5 (Figure 5.9 a), these cultivars remained
indistinguishable. In Adult trial 6 (Figure 5.9 b) however, 37-07 and Francolin-1 could be
clearly distinguished from the other cultivars. At 10 dpi the ranking of cultivars based on Pgt-
BTUB transcripts was identical for both trials, but some cultivars were not distinguishable.
The 37-07 line had the highest Pgt-BTUB transcript levels and was distinguishable in both
trials at 10 dpi. Pavon-76, Francolin-1 and Kingbird had less Pgt-BTUB transcripts. In Adult
trial 5 (Figure 5.9 a), Pavon-76 and Francolin-1 could not be distinguished at 10 dpi but
Kingbird was distinguishable and had the lowest Pgt biomass. However, in Adult trial 6
(Figure 5.9 b) Pavon-76, Francolin-1 and Kingbird could not be distinguished from one
another.
The change in normalised relative quantities of Pgt-BTUB in the 37-07 line in the seedling
and all adult wheat trials was used to fit a non-linear regression equation. Due to rapid
increase of Pgt-BTUB transcripts from 5 to 10 dpi, an exponential growth equation was

111
selected (Figure 5.10). A sum of squares F-test indicated that a single equation could not
accurately describe all the independent trials simultaneously. Independent trials were
separately fitted to an exponential growth equation using the least squares method with a
confidence level of 95%. All trials fitted this model except the seedling trial and Adult trial 5,
where the fit was ambiguous and outside the predetermined confidence level. The R2-values
of the fitted non-linear regression equations ranged from 0.9902 to 0.9998.
5.3.4 Sequence analysis of PGTG_11318
PGTG_11318 encodes a single transcript with no known splice variants and an
uncharacterised protein. The NCBI GenBank accession is XM_003329520.2. The
PGTG_11318 product had homology to a number of sequences within the Ensembl database.
Hits were found in Pgt, Pst, Pt and P. hordei and all were uncharacterised proteins. No hits
were found in M. larici-populina. PGTG_11318 had five paralogues in Pgt (PGTG_11320,
PGTG_11179, PGTG_00415, PGTG_11182 and PGTG_11180). PGTG_11318 and had three
orthologues in related species (VP01_3521g1 and VP01_1186g7 in P. sorghi and maker-
PST130_11738-snap-gene-0.3-mRNA-1 in Pst). PGTG_11318 had high homology with two
ESTs from Pgt namely CV191731 (E value = 0.0) and CV191667 (E value = 9e-114
), most
likely originating from the same transcript.
EffectorP analysis predicted that PGTG_11318 is not an effector protein (p-value = 0.623).
SignalP results (maximum raw cleavage site score = 0.197, maximum signal peptide score =
0.187, maximum combined cleavage site score = 0.274) indicated PGTG_11318 as a non-
secreted protein. A signal domain, transmembrane helix and extracellular domain were
predicted by TMHMM and confirmed by Phobius, with good posterior probabilities across
the length of the protein sequence. WoLF PSORT predicted PGTG_11318 to be an
extracellular protein, but TargetP results indicated the protein to be localised in the
mitochondrion (neural network score = 0.863). The mitochondrion was ranked second most
probable subcellular localization predicted by WoLF PSORT. InterPro could not identify
protein family membership, domains or repeats. However, regions on the protein
corresponded to signal peptide, transmembrane, non-cytoplasmic and intrinsically disordered
protein sequences.

112
Figure 5.1: Quantification of chitin in Puccinia graminis f. sp. tritici-inoculated wheat lines
tested in Adult trial 1 (a) and Adult trial 2 (b). Mean fluorescence units are plotted with
standard error (n = 4) at the indicated days post inoculation. Fluorescence was measured after
the binding of wheat germ agglutinin fluorescein isothiocyanate conjugate to Puccinia
graminis f. sp. tritici on inoculated wheat.
0
50 000
100 000
150 000
200 000
250 000
300 000
350 000
400 000
450 000
500 000
0 1 2 3 4 5 6 7 8 9 10
Flu
ore
scen
ce u
nit
s
Days post inoculation
37-07
W1406
W6979
0
50 000
100 000
150 000
200 000
250 000
300 000
350 000
400 000
450 000
0 1 2 3 4 5 6 7 8 9 10
Flu
ore
scen
ce u
nit
s
Days post inoculation
37-07
W1406
W6979
(a)
(b)

113
Figure 5.2: Mean expression stability (M value) of four reference genes in Puccinia graminis
f. sp. tritici-inoculated wheat lines tested in Adult trials 1-4. The expression of the 18S
ribosomal RNA (Ta-18S), β-tubulin (Ta-BTUB), cell division control protein (Ta-CDC) and
transcription elongation factor 1 alpha (Ta-TEF) transcripts were analysed by the geNorm
package of qBasePlus.
Figure 5.3: Mean expression stability (M value) of four reference genes in Puccinia graminis
f. sp. tritici-inoculated wheat lines tested in Adult trials 5 and 6. The expression of the 18S
ribosomal RNA (Ta-18S), β-tubulin (Ta-BTUB), cell division control protein (Ta-CDC) and
transcription elongation factor 1 alpha (Ta-TEF) transcripts were analysed by the geNorm
package of qBasePlus.
0.50
0.52
0.54
0.56
0.58
0.60
0.62
0.64
Ta-BTUB Ta-CDC Ta-18S Ta-TEF
M v
alu
e
Reference transcript
0.50
0.60
0.70
0.80
0.90
1.00
1.10
Ta-BTUB Ta-18S Ta-CDC Ta-TEF
M v
alu
e
Reference transcript

114
Figure 5.4: Normalised relative quantity of Puccinia graminis f. sp. tritici β-tubulin
transcripts in inoculated wheat lines tested in the seedling trial. Points show normalised
relative quantity mean with standard error (n = 4) at indicated days post inoculation. Puccinia
graminis f. sp. tritici β-tubulin transcripts were expressed relative to Triticum aestivum
transcription elongation factor 1 alpha transcripts and Cq values were determined by reverse
transcriptase quantitative polymerase chain reaction.
0
10
20
30
40
50
60
70
80
0 1 2 3 4 5 6 7 8 9 10
Norm
ali
zed
rel
ati
ve
qu
an
tity
Days post inoculation
37-07
W1406
W6979

115
Figure 5.5: Normalised relative quantity of Puccinia graminis f. sp. tritici β-tubulin
transcripts in inoculated wheat lines tested in four biological replicates. Respective figures
are shown for Adult trial 1 (a), Adult trial 2 (b), Adult trial 3 (c) and Adult trial 4 (d). Points
show normalised relative quantity mean with standard error (n = 4) at indicated days post
inoculation. Cq values were determined by reverse transcriptase quantitative polymerase
chain reaction and Puccinia graminis f. sp. tritici β-tubulin transcripts were expressed relative
to Triticum aestivum transcription elongation factor 1 alpha transcripts.
0
10
20
30
40
50
60
70
80
0 1 2 3 4 5 6 7 8 9 10
No
rma
lize
d r
ela
tiv
e q
ua
nti
ty
Days post inoculation
37-07
W1406
W6979
0
10
20
30
40
50
60
70
80
90
100
110
0 1 2 3 4 5 6 7 8 9 10N
orm
ali
zed
rel
ati
ve
qu
an
tity
Days post inoculation
37-07
W1406
W6979
0
10
20
30
40
50
60
70
0 1 2 3 4 5 6 7 8 9 10
Norm
ali
zed
rel
ati
ve
qu
an
tity
Days post inoculation
37-07
W1406
W6979
0
10
20
30
40
50
0 1 2 3 4 5 6 7 8 9 10
Norm
ali
zed
rel
ati
ve
qu
an
tity
Days post inoculation
37-07
W1406
W6979
(a) (b)
(c) (d)

116
Figure 5.6: Mean normalised relative quantity of Puccinia graminis f. sp. tritici β-tubulin
transcripts in inoculated wheat lines tested for four biological replicates (Adult trials 1-4).
Points show normalised relative quantity mean with standard error (n = 4 trials) at indicated
days post inoculation. Different alphabetic symbols indicate samples with significant
differences for a time point as confirmed by a Tukey's multiple comparison test (see Table
5.4). Time points with no significant differences for all sample comparisons were indicated as
non-significant (ns).
0
10
20
30
40
50
60
70
80
90
0 1 2 3 4 5 6 7 8 9 10
Norm
ali
zed
rel
ati
ve
qu
an
tity
Days post inoculation
37-07
W1406
W6979x
y
z
ns ns
ns
ns

117
Table 5.4: Tukey's multiple comparison test results for mean normalised relative quantity of
Puccinia graminis f. sp. tritici β-tubulin transcripts in Puccinia graminis f. sp. tritici-
inoculated wheat. Means were calculated from four biological replicates (Adult trials 1-4).
The mean normalised relative quantity of 37-07, W1406 and W6979 was compared to every
other line, at every time point. Confidence level for the test was 99%. Sample comparisons
are indicated as significant (*) or non-significant (ns).
Sample comparisons Mean difference Confidence interval
of difference
Significant
0 dpi
37-07 vs W1406 -0.02288 -17.82 to 17.77 ns
37-07 vs W6979 -0.09386 -17.89 to 17.70 ns
W1406 vs W6979 -0.07098 -17.87 to 17.72 ns
1 dpi
37-07 vs W1406 -0.006238 -17.80 to 17.79 ns
37-07 vs W6979 0.04084 -17.75 to 17.84 ns
W1406 vs W6979 0.04708 -17.75 to 17.84 ns
3 dpi
37-07 vs W1406 -0.1732 -17.97 to 17.62 ns
37-07 vs W6979 0.2433 -17.55 to 18.04 ns
W1406 vs W6979 0.4165 -17.38 to 18.21 ns
5 dpi
37-07 vs W1406 3.761 -14.03 to 21.56 ns
37-07 vs W6979 5.298 -12.50 to 23.09 ns
W1406 vs W6979 1.537 -16.26 to 19.33 ns
10 dpi
37-07 vs W1406 35.72 17.93 to 53.52 *
37-07 vs W6979 59.65 41.85 to 77.44 *
W1406 vs W6979 23.92 6.128 to 41.72 *

118
Figure 5.7: Normalised relative quantity of Puccinia graminis f. sp. tritici β-tubulin
transcripts in inoculated doubled haploid wheat lines from the W1406 x 37-07 cross tested in
Adult trial 3 (a) and Adult trial 4 (b). Points show normalised relative quantity mean with
standard error (n = 4) at indicated days post inoculation. Puccinia graminis f. sp. tritici β-
tubulin transcripts were expressed relative to Triticum aestivum transcription elongation
factor 1 alpha transcripts and Cq values were determined by reverse transcriptase quantitative
polymerase chain reaction.
0
10
20
30
40
50
60
70
0 1 2 3 4 5 6 7 8 9 10
Norm
ali
zed
rel
ati
ve
qu
an
tity
Days post inoculation
37-07
DH1.43
DH1.50
W1406
0
10
20
30
40
50
60
0 1 2 3 4 5 6 7 8 9 10
Norm
ali
zed
rel
ati
ve
qu
an
tity
Days post inoculation
37-07
DH1.43
DH1.50
W1406
(a)
(b)
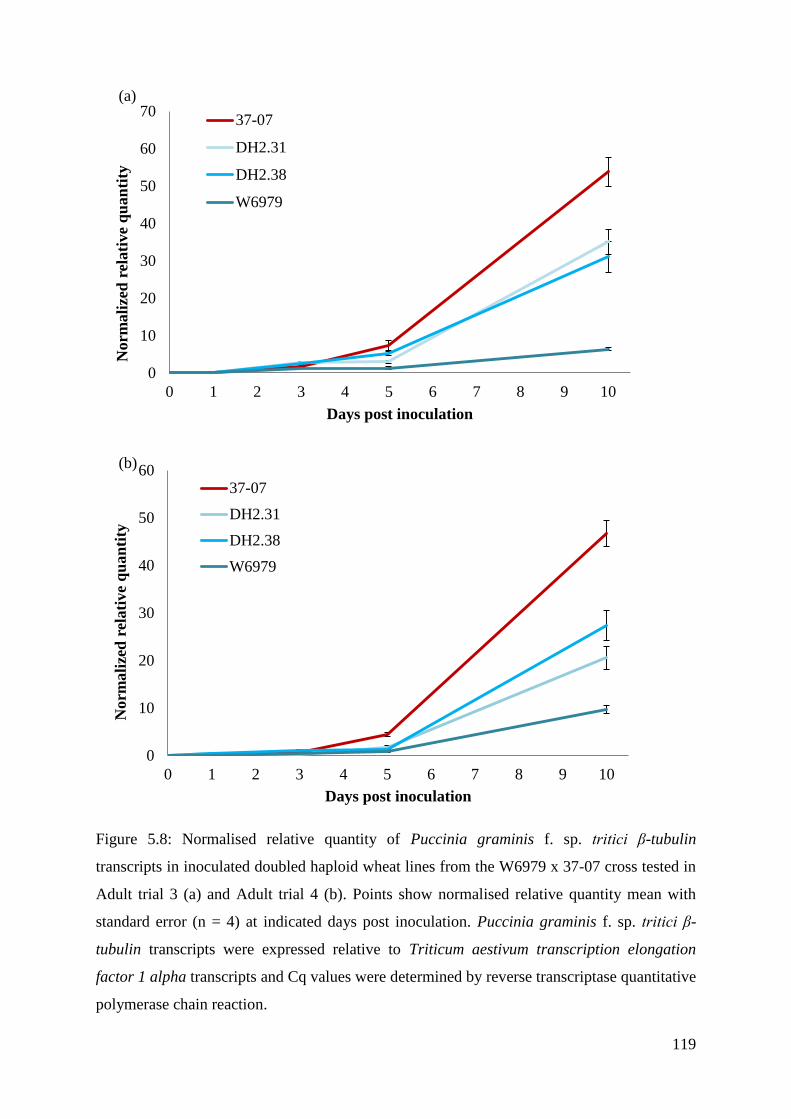
119
Figure 5.8: Normalised relative quantity of Puccinia graminis f. sp. tritici β-tubulin
transcripts in inoculated doubled haploid wheat lines from the W6979 x 37-07 cross tested in
Adult trial 3 (a) and Adult trial 4 (b). Points show normalised relative quantity mean with
standard error (n = 4) at indicated days post inoculation. Puccinia graminis f. sp. tritici β-
tubulin transcripts were expressed relative to Triticum aestivum transcription elongation
factor 1 alpha transcripts and Cq values were determined by reverse transcriptase quantitative
polymerase chain reaction.
0
10
20
30
40
50
60
70
0 1 2 3 4 5 6 7 8 9 10
Norm
ali
zed
rel
ati
ve
qu
an
tity
Days post inoculation
37-07
DH2.31
DH2.38
W6979
0
10
20
30
40
50
60
0 1 2 3 4 5 6 7 8 9 10
Norm
ali
zed
rel
ati
ve
qu
an
tity
Days post inoculation
37-07
DH2.31
DH2.38
W6979
(a)
(b)

120
Figure 5.9: Normalised relative quantity of Puccinia graminis f. sp. tritici β-tubulin
transcripts in inoculated wheat lines tested in Adult trial 5 (a) and Adult trial 6 (b). Points
show normalised relative quantity mean with standard error (n = 4) at indicated days post
inoculation. Puccinia graminis f. sp. tritici β-tubulin transcripts were expressed relative to
Triticum aestivum transcription elongation factor 1 alpha transcripts and Cq values were
determined by reverse transcriptase quantitative polymerase chain reaction.
0
10
20
30
40
50
0 1 2 3 4 5 6 7 8 9 10
Norm
ali
zed
rel
ati
ve
qu
an
tity
Days post inoculation
37-07
Francolin-1
Kingbird
Pavon-76
0
10
20
30
40
0 1 2 3 4 5 6 7 8 9 10
Norm
ali
zed
rel
ati
ve
qu
an
tity
Days post inoculation
37-07
Francolin-1
Kingbird
Pavon-76
(a)
(b)

121
Figure 5.10: Non-linear regression graphs of normalised relative quantity of Puccinia
graminis f. sp. tritici β-tubulin transcripts in the inoculated 37-07 wheat line. Points show
normalised relative quantity mean with standard error (n = 4) at indicated days post
inoculation. The seedling trial and six adult plant trials (Adult trials 1-6) were modelled
separately using an exponential growth equation (confidence level = 95%). Trials indicated in
red had an ambiguous fit to the selected model.

122
5.3.5 PGTG_11318 transcript quantification
The quantification of the PGTG_11318 transcript relative to Pgt-BTUB allowed haustorium
formation in Pgt-inoculated wheat, over time, to be inferred. The PGTG_11318 transcript
levels in the seedling trial (Figure 5.11) showed an increase from 0 to 5 dpi, but a decrease
from 5 to 10 dpi. The 37-07, W1406 and W6979 lines were not distinguishable from 0 to 3
dpi. The PGTG_11318 transcript levels at 5 dpi were highest in the W1406 line, thereafter
W6979 and finally 37-07. At 10 dpi the tested lines could not be distinguished.
The transcript levels of PGTG_11318 in the flag leaf sheaths of adult wheat plants are
indicated in Figures 5.12-5.16. The analysis of the 37-07, W1406 and W6979 lines of Adult
trials 1-4 are indicated in Figure 5.12. The relative quantity of transcripts invariably increased
over the course of infection up to 5 dpi. Lines were not distinguishable based on
PGTG_11318 transcript levels from at 0 or 1 dpi, and in some trials not at 3 dpi. However, at
5 dpi lines were clearly distinguishable in three of the four trials. Consistently the level of the
PGTG_11318 transcripts was highest in the 37-07 line, lower in W1406, and lowest in
W6979. The only exception was Adult trial 3 (Figure 5.12 c) where W1406 and W6979 were
not distinguishable at 5 dpi. PGTG_11318 transcripts decreased from the 5 to 10 dpi, and the
ranking of PGTG_11318 transcript levels varied between the first four trials at 10 dpi.
In Figure 5.13 the mean transcript levels of PGTG_11318 of the four biological replicates
over the course of infection are indicated. At 5 dpi, the wheat lines are ranked as 37-07,
W1406 and W6979, but different rankings were observed at 3 and 10 dpi. Furthermore, a
Tukey's multiple comparison test (Table 5.5) indicated the 37-07 line could only be
statistically distinguished from the other two lines at 5 dpi, while W1406 and W6979 could
not be statistically distinguished from each other at that time point. At all other time points
the lines could not be statistically distinguished
The transcript levels of PGTG_11318 for the DH entries of Adult trials 3 and 4 are indicated
in Figures 5.14 and 5.15. The quantity of transcripts increased from 0 to 5 dpi and decreased
from 5 to 10 dpi. In Adult trial 3 (Figure 5.14 a) DH1.43, DH1.50 and W1406 were not
distinguishable at any time point, but had lower transcript levels than 37-07, with the
exception of 10 dpi. Similarly, in Adult trial 4 (Figure 5.14 b) DH1.43, DH1.50 and W1406
were not distinguishable at 3 or 5 dpi, but the PGTG_11318 transcripts were less than in the
37-07 line at both time points.

123
The relative quantification analysis of PGTG_11318 in the DH2.31 and DH2.38 entries from
Adult trial 3 and 4 showed no point where these entries and the parental lines were
distinguishable, with the exception of 5 dpi. In Adult trial 3 (Figure 5.15 a) 37-07, DH2.31
and DH2.38 could not be distinguished at 5 dpi, but the transcript levels in W6979 were
lower and distinguishable. At 5 dpi in Adult trial 4 (Figure 5.15 b) 37-07, DH2.31 and
DH2.38 were not distinguishable. However, W6979 again had less transcripts and was
distinguishable. Interestingly, the DH2.38 entry had the highest transcript levels of
PGTG_11318 at 3 dpi, but it could not be distinguished from 37-07 in Adult trial 4 at that
time point.
The transcript levels of PGTG_11318 for Pavon-76, Francolin-1 and Kingbird along with the
37-07 line from Adult trials 5 and 6 are indicated in Figure 5.16. As with the other trials, the
PGTG_11318 transcripts increased from 0 to 5 dpi and decreased from 5 to 10 dpi. The
results of Adult trial 5 and 6 were only comparable in some regards, including the general
pattern of transcript quantification, and the 37-07 line consistently showing the highest
transcript levels at 5 dpi. In Adult trials 5 (Figure 5.16 a) cultivars could be clearly
distinguished at 5 dpi. However, in Adult trial 6 (Figure 5.16 b) cultivars were
distinguishable as early as 3 dpi. The ranking of cultivars based on PGTG_11318 transcript
levels also differed. Consistently, at 5 dpi, the 37-07 line showed the highest transcript levels
of PGTG_11318 followed by Pavon-76. In Adult trial 5 Francolin-1 had more transcripts than
Kingbird, while in Adult trial 6 the ranking was reversed, but the two cultivars could not be
distinguished at 5 dpi.
The change in normalised relative quantities of PGTG_11318 in the 37-07 line in all trials
was also used to fit a non-linear regression equation. Due to the increase of PGTG_11318
transcripts from 0 to 5 dpi, but a decrease thereafter, a Gaussian equation was selected
(Figure 5.17). A sum of squares F-test indicated that a single equation could not accurately
describe all the independent trials simultaneously. Independent trials were separately fitted to
a Gaussian equation using the least squares method with a confidence level of 95%. All trials
were found to fit this model and the R2-values ranged from 0.9857 to 0.9996.

124
Figure 5.11: Normalised relative quantity of PGTG_11318 transcripts in inoculated wheat
lines tested in the seedling trial. Points show normalised relative quantity mean with standard
error (n = 4) at indicated days post inoculation. PGTG_11318 transcripts were expressed
relative to Pgt-BTUB transcripts and Cq values were determined by reverse transcriptase
quantitative polymerase chain reaction.
0
2
4
6
8
10
12
14
16
18
0 1 2 3 4 5 6 7 8 9 10
Norm
ali
zed
rel
ati
ve
qu
an
tity
Days post inoculation
37-07
W1406
W6979

125
Figure 5.12: Normalised relative quantity of PGTG_11318 transcripts in inoculated wheat
lines tested in four biological replicates. Respective figures are shown for Adult trial 1 (a),
Adult trial 2 (b), Adult trial 3 (c) and Adult trial 4 (d). Points show normalised relative
quantity mean with standard error (n = 4) at indicated days post inoculation. Cq values were
determined by reverse transcriptase quantitative polymerase chain reaction and PGTG_11318
transcripts were expressed relative to Puccinia graminis f. sp. tritici β-tubulin transcripts.
0
2
4
6
8
10
12
0 1 2 3 4 5 6 7 8 9 10
Norm
ali
zed
rel
ati
ve
qu
an
tity
Days post inoculation
37-07
W1406
W6979
0
2
4
6
8
10
12
14
16
0 1 2 3 4 5 6 7 8 9 10N
orm
ali
zed
rel
ati
ve
qu
an
tity
Days post inoculation
37-07
W1406
W6979
0
2
4
6
8
10
12
14
0 1 2 3 4 5 6 7 8 9 10
Norm
ali
zed
rel
ati
ve
qu
an
tity
Days post inoculation
37-07
W1406
W6979
0
2
4
6
8
10
0 1 2 3 4 5 6 7 8 9 10
Norm
ali
zed
rel
ati
ve
qu
an
tity
Days post inoculation
37-07
W1406
W6979
(a) (b)
(c) (d)

126
Figure 5.13: Mean normalised relative quantity of PGTG_11318 transcripts in inoculated
wheat lines tested for four biological replicates (Adult trials 1-4). Points show normalised
relative quantity mean with standard error (n = 4 trials) at indicated days post inoculation.
Corresponding alphabetic symbols indicate samples with no significant differences for a time
point as confirmed by a Tukey's multiple comparison test (see Table 5.5). Time points with
no significant differences for all sample comparisons were indicated as non-significant (ns).
0
2
4
6
8
10
12
14
0 1 2 3 4 5 6 7 8 9 10
Norm
ali
zed
rel
ati
ve
qu
an
tity
Days post inoculation
37-07
W1406
W6979 x
y
y
ns
ns
ns
ns

127
Table 5.5: Tukey's multiple comparison test results for mean normalised relative quantity of
PGTG_11318 transcripts in Puccinia graminis f. sp. tritici-inoculated wheat. Means were
calculated from four biological replicates (Adult trials 1-4). The mean normalised relative
quantity of 37-07, W1406 and W6979 was compared to every other line, at every time point.
Confidence level for the test was 99%. Sample comparisons are indicated as significant (*) or
non-significant (ns).
Sample comparisons Mean difference Confidence interval
of difference
Significant
0 dpi
37-07 vs W1406 0.2545 -2.187 to 2.696 ns
37-07 vs W6979 0.2055 -2.236 to 2.647 ns
W1406 vs W6979 -0.04894 -2.491 to 2.393 ns
1 dpi
37-07 vs W1406 0.3177 -2.124 to 2.759 ns
37-07 vs W6979 0.2434 -2.198 to 2.685 ns
W1406 vs W6979 -0.07424 -2.516 to 2.367 ns
3 dpi
37-07 vs W1406 1.527 -0.9145 to 3.969 ns
37-07 vs W6979 1.146 -1.295 to 3.588 ns
W1406 vs W6979 -0.3806 -2.822 to 2.061 ns
5 dpi
37-07 vs W1406 4.276 1.835 to 6.718 *
37-07 vs W6979 6.488 4.046 to 8.930 *
W1406 vs W6979 2.212 -0.2301 to 4.653 ns
10 dpi
37-07 vs W1406 -0.1417 -2.583 to 2.300 ns
37-07 vs W6979 -1.470 -3.911 to 0.9718 ns
W1406 vs W6979 -1.328 -3.770 to 1.114 ns

128
Figure 5.14: Normalised relative quantity of PGTG_11318 transcripts in inoculated doubled
haploid wheat lines from the W1406 x 37-07 cross tested in Adult trial 3 (a) and Adult trial 4
(b). Points show normalised relative quantity mean with standard error (n = 4) at indicated
days post inoculation. PGTG_11318 transcripts were expressed relative to Puccinia graminis
f. sp. tritici β-tubulin transcripts and Cq values were determined by reverse transcriptase
quantitative polymerase chain reaction.
0
2
4
6
8
10
12
14
0 1 2 3 4 5 6 7 8 9 10
Norm
ali
zed
rel
ati
ve
qu
an
tity
Days post inoculation
37-07
DH1.43
DH1.50
W1406
0
2
4
6
8
10
0 1 2 3 4 5 6 7 8 9 10
Norm
ali
zed
rel
ati
ve
qu
an
tity
Days post inoculation
37-07
DH1.43
DH1.50
W1406
(a)
(b)

129
Figure 5.15: Normalised relative quantity of PGTG_11318 transcripts in inoculated doubled
haploid wheat lines from the W6979 x 37-07 cross tested in Adult trial 3 (a) and Adult trial 4
(b). Points show normalised relative quantity mean with standard error (n = 4) at indicated
days post inoculation. PGTG_11318 transcripts were expressed relative to Puccinia graminis
f. sp. tritici β-tubulin transcripts and Cq values were determined by reverse transcriptase
quantitative polymerase chain reaction.
0
2
4
6
8
10
12
14
0 1 2 3 4 5 6 7 8 9 10
No
rma
lize
d r
ela
tiv
e q
ua
nti
ty
Days post inoculation
37-07
DH2.31
DH2.38
W6979
0
2
4
6
8
10
0 1 2 3 4 5 6 7 8 9 10
Norm
ali
zed
rel
ati
ve
qu
an
tity
Days post inoculation
37-07
DH2.31
DH2.38
W6979
(a)
(b)

130
Figure 5.16: Normalised relative quantity of PGTG_11318 transcripts in inoculated wheat
lines tested in Adult trial 5 (a) and Adult trial 6 (b). Points show normalised relative quantity
mean with standard error (n = 4) at indicated days post inoculation. PGTG_11318 transcripts
were expressed relative to Puccinia graminis f. sp. tritici β-tubulin transcripts and Cq values
were determined by Reverse transcriptase quantitative polymerase chain reaction.
0
2
4
6
8
10
12
14
16
0 1 2 3 4 5 6 7 8 9 10
Norm
ali
zed
rel
ati
ve
qu
an
tity
Days post inoculation
37-07
Francolin-1
Kingbird
Pavon-76
0
2
4
6
8
10
12
14
0 1 2 3 4 5 6 7 8 9 10
Norm
ali
zed
rel
ati
ve
qu
an
tity
Days post inoculation
37-07
Francolin-1
Kingbird
Pavon-76
(a)
(b)

131
Figure 5.17: Non-linear regression graphs of normalised relative quantity of PGTG_11318
transcripts in the inoculated 37-07 wheat line. Points show normalised relative quantity mean
with standard error (n = 4) at indicated days post inoculation. The seedling trial and six adult
plant trials (Adult trials 1-6) were modelled separately using a Gaussian equation (confidence
level = 95%).

132
5.4 Discussion
Methods used in the current chapter successfully quantified Pgt biomass in inoculated adult
wheat plants. These methods allowed the infection process to be followed, and showed at
which time point the APR response could be distinguished from the susceptible response.
The presence of chitin in the cell walls of fungi, combined with the binding of WGA-FITC
and resulting fluorescence measurement, underpins the quantification method of Ayliffe et al.
(2013) and presents an effective tool for chitin quantification. The linear correlation between
fluorescence and chitin was proven by Ayliffe et al. (2013), which indicated 40 μg of chitin
and the corresponding 200 000 fluorescence units as the maximum value for this linear range.
WGA-FITC binding was reported to become limiting above 40 μg of chitin. In the current
study 100 μg of chitin and approximately 700 000 fluorescence units were shown as the
maximum for the linear range. However, chitin measurements in technically replicated
samples showed high variation and the fluorescence versus chitin standard curve was
therefore not used for absolute quantification of chitin.
In the current study, the method of Ayliffe et al. (2013) was effectively used to infer Pgt
biomass in inoculated adult wheat plants. Results obtained for the two independent trials
(Adult trials 1 and 2) were similar, indicating good reproducibility. Any differences in the
pattern of chitin quantity over time could be attributed to effects of biological or
environmental variation. The ranking of tested wheat lines from Adult trials 1 and 2 was
identical, with 37-07 having the greatest chitin quantity, W1406 being intermediate and
W6979 having the lowest chitin quantity. Measurements therefore indicated the 37-07 line as
most susceptible to Pgt and the W1406 and W6979 lines comparably less susceptible.
Measurements confirmed the adult plant infection response observed in the W1406 and
W6979 lines (Chapter 3; Table 3.5). The APR response in the tested lines was thus confirmed
to effectively restrict the Pgt colonization process.
Chitin quantification was previously used by Ayliffe et al. (2013) to follow Pgt infection on
wheat seedlings. The method was used to distinguish susceptible and resistant wheat lines
quantitatively at 9 dpi. The current application could distinguish test lines at 5 dpi, but most
clear differentiation only occurred at 10 dpi. Though the method was previously applied to
Pgt-inoculated wheat seedlings (Ayliffe et al., 2013; Hiebert et al., 2016) the current
application to Pgt-inoculated flag leaf sheaths of adult wheat plants is the first known report.

133
The binding of WGA-FITC is not only used for chitin quantification but also for histological
studies (Ayliffe et al., 2011). WGA-FITC was used for microscopic observation of the Pgt
infection process on the tested APR lines (Chapter 4). Distinguishing wheat lines by colony
size at 5 dpi (Chapter 4; Figure 4.22) was directly comparable to chitin quantification at the
same time point, in the same trials. Both methods indicated the 37-07 line as most
susceptible, the W1406 line as intermediate and the W6979 line as the least susceptible.
Chitin quantification also has the advantage of allowing Pgt infection to be quantified at 10
dpi, which was not accomplished by colony sizes (Chapter 4).
Before the relative quantification of Pgt biomass by RT-qPCR was undertaken, reference
gene validation was required. A previous validation of reference gene stability in Pgt-
inoculated wheat seedlings showed Ta-18S, Ta-BTUB and Ta-CDC (in that order) as the most
stable transcripts (Scholtz and Visser, 2013). In their study, only Ta-18S had an M value
lower than the 0.5 cut-off for homogeneous samples, and with the inclusion of the other two
transcripts were deemed sufficient for expression analysis. The Ta-18S transcript was
previously used for expression analysis in Pst-inoculated wheat seedlings (Bozkurt et al.,
2007). These findings served as the rationale for inclusion of Ta-18S, Ta-BTUB and Ta-CDC
as candidates for reference gene validation in the current study. Ta-TEF was included as a
fourth candidate since it was previously used as a reference gene to infer fungal biomass
(Coram et al., 2008) and was confirmed a stable reference gene in Pt-inoculated adult wheat
flag leaves (Casassola et al., 2015).
In the current study the transcripts reported by Scholtz and Visser (2013) were sufficiently
stable for gene expression analyses in Pgt-inoculated wheat flag leaf sheaths. This finding
was supported in two different experimental layouts using different wheat lines/cultivars
(Adult trials 1-4 and Adult trials 5-6) which showed comparable results. Ta-TEF, Ta-18S and
Ta-CDC proved sufficiently stable in both experiments though the ranking of the latter two
genes was different between the two experiments. The higher M values in Adult trials 5-6 and
the exclusion of Ta-BTUB may be attributed to fewer biological replicates and high sample
heterogeneity (i.e. genetic difference) in wheat from these trials. In Adult trials 1-4, three
APR lines were analysed and in Adult trial 5-6 four APR lines/cultivars were analysed,
potentially adding to the effect of sample heterogeneity in the latter experiment.
Ta-TEF was the most stable reference gene throughout all experimentation and showed the
importance of reference gene validation. Numerous other reference genes remain to be tested

134
and may prove even more stable during Pgt inoculation. Scholtz and Visser (2013) also
reported stable reference transcripts during Pst and Pt inoculation of wheat seedlings,
although reference gene validation for adult wheat for these two species still needs to be
undertaken. Here presented, however, is the first known reference gene validation study for
adult wheat inoculated with Pgt.
Vandesompele et al. (2002) proposed that three to five stable reference genes should be
selected for accurate expression analysis. The current findings indicated that for large scale
gene expression analysis of Pgt-inoculated wheat flag leaf sheaths, Ta-TEF, Ta-18S and Ta-
CDC may be used. Ta-BTUB is another candidate transcript to be considered. However, for
quick and routine gene expression analyses, as used for determining Pgt development, a
single reference transcript is suggested. Ta-TEF was thus subsequently used as a reference
transcript since it proved most stable in all trials.
The expression of Pgt-BTUB relative to Ta-TEF to assess Pgt biomass in inoculated wheat
flag leaf sheaths was based on a method of Coram et al. (2008). The method was effectively
used to infer biomass in Pgt-inoculated adult wheat over the course of infection. In general
tested cultivars, lines and entries were not distinguishable at the 0 - 3 dpi time points. In the
study of Coram et al. (2008), the wheat line with the Yr39 APR gene could be distinguished
from the susceptible line from 2 dpi onwards when inoculated with Pst using relative β-
tubulin expression. A qPCR based method could distinguish Pgt-inoculated barley
lines/cultivars as early as 1 dpi, and though it corresponded to the fluorescence microscopy
results, it was contradicted by the infection types on inoculated seedlings (Zurn et al., 2015).
A pre-haustorial defence response that may be overcome by Pgt was hypothesised to account
for this discrepancy.
In the current study, at 5 dpi some of the tested samples could be distinguished, but results
were variable. Results imply that Pgt biomass must pass some threshold in the flag leaf
sheath for the effect of the APR response to be accurately measured. This hypothesis applies
to both the chitin quantification by fluorescence and the Pgt-BTUB transcript quantification
by RT-qPCR. In most trials, a clear ranking of Pgt-BTUB transcript levels was established at
10 dpi. The Pgt biomass on inoculated flag leaf sheaths increased over the course of
infection, but most rapidly from 5 to 10 dpi. For future quantification it is therefore suggested
that 5 dpi and later be considered to allow wheat cultivars or lines to be effectively

135
distinguished, with 10 dpi as the best time point. The inclusion of more time points in future
studies may shift this to an earlier time interval.
At 10 dpi, the 37-07 line had the highest Pgt biomass, confirming this line as the most
susceptible. The W1406 and W6979 lines were by extension less susceptible, with W1406
being intermediate. Differences in transcript levels were statistically significant only at 10
dpi. The ranking of these lines are supported by phenotypic scoring of the adult plant
infection responses at 14 dpi (Chapter 3; Table 3.5). The APR response in W1406 and
W6979 was thereby confirmed to restrict the Pgt colonization process.
The DH entries delivered variable results for Pgt-BTUB transcript quantification at 10 dpi.
The ranking of DH1.43 and DH1.50 differed between the two trials and from the phenotypic
scoring (Chapter 3; Table 3.5). These lines could not be distinguished based on phenotypic
scoring (Chapter 3; Table 3.5) but in Adult trial 4 these lines were distinguishable by Pgt-
BTUB transcript quantification, alluding to the potential of the method. However, the method
proved less accurate when analysing DH lines. A connection between the respective
quantitative trait loci (QTL) in the DH entries and the putative effects on Pgt biomass could
not be established. Regardless, the DH entries were confirmed to effectively restrict the Pgt
colonization process.
Results of Pgt biomass at 10 dpi indicated that other APR cultivars were distinguishable and
Pgt-BTUB transcript levels ranked the tested cultivars from 37-07 (most susceptible) to
Francolin-1, Pavon-76 and Kingbird (least susceptible). The APR cultivars could not be
distinguished by phenotypic scoring of the adult plant infection responses at 14 dpi (Chapter
3; Table 3.5). Therefore, Pgt-BTUB transcript quantification again allowed cultivars to be
distinguished that was otherwise difficult by phenotypic scoring. The low Pgt biomass in
Kingbird was attributed to the presence of strong APR including the Sr2 gene (Maré, 2017).
Theis method to infer fungal biomass in inoculated adult wheat was also used by Maré
(2017). Quantification of β-tubulin from Puccinia spp. relative to Ta-TEF was analysed at 5
dpi intervals for Pt-, Pst- and Pgt-inoculated wheat and showed that 10 dpi was the best time
point to distinguish inoculated lines/cultivars. Results confirmed the efficacy of the method to
infer biomass in adult wheat plants and the choice of 10 dpi as the most effective time point
for distinguishing the APR response.

136
Due to the confirmed effects of the APR cultivars, lines and entries, these transcript levels
were not considered to model a non-linear equation. The infection process on the susceptible
37-07 line was assumed to be the best representation of the infection process on the flag leaf
sheaths of wheat. Most of the trials fitted the exponential growth equation and confirmed the
rapid accumulation of Pgt biomass over the course of infection. The exclusion of the seedling
trial and Adult trial 5 from this model implied that the exponential growth equation may not
be the ideal model. Inclusion of more time points over the course of infection and time points
after 10 dpi may improve the model.
The biomass quantification of U. fabae on broad bean inferred by RT-qPCR appeared to fit a
sigmoidal growth curve (Voegele and Schmid, 2011). At early time points gene expression
was in the lag phase, but from 4 to 9 dpi expression may be described as proceeding through
an exponential phase. In the current study, parallels can be drawn with the exponential
growth equation of Pgt development and the rapid increase of transcript levels from 5 to 10
dpi. In U. fabae at 9 dpi, gene expression entered the steady-state phase that was maintained
until 18 dpi (Voegele and Schmid, 2011). A sigmoidal growth equation may thus accurately
describe Pgt development on adult wheat, but requires more time points after 10 dpi to
confirm a steady-state phase.
Maré (2017) included a 15 dpi time point in the analysis of fungal β-tubulin transcripts in
Pgt-inoculated adult wheat. The fungal β-tubulin transcript levels in most lines/cultivars
continued to increase from 10 to 15 dpi, but the most susceptible line showed decreased
transcripts at 15 dpi. The decrease was reported for certain susceptible lines/cultivars at 10
dpi in Pt-inoculated adult wheat and at 15 dpi in Pst-inoculated adult wheat. Results implied
a sigmoidal growth curve with a decline phase of fungal development in Puccinia spp.,
especially on inoculated susceptible adult wheat. From these findings it seems unlikely that
an unified model of fungal β-tubulin transcript levels on inoculated adult wheat could be
applied to all the Puccinia spp. and even within Pgt. The transcript levels of β-tubulin seem
variable.
Another transcript, PGTG_11318, was selected to quantify haustoria development in
inoculated wheat. The gene encodes a putative haustorium associated protein and the
transcript was highly upregulated in Pgt infected wheat tissue (Duplessis et al., 2011). In the
current study TMHMM, Phobius and InterPro indicated that PGTG_11318 may be membrane
bound with a large extracellular region. The protein may thus be associated with transport

137
across the membrane or recognition of an extracellular signal. Haustoria were established as
important in the uptake of simple carbohydrates and amino acids from the host (Voegele and
Mendgen, 2011). Alternatively, PGTG_11318 may be localised in mitochondria as indicated
by TargetP and WoLF PSORT. Mitochondria were proven to accumulate in the haustoria of
Pgt (Ehrlich and Ehrlich, 1963). The expression of the PGTG_11318 transcript may thus be
associated haustorial mitochondria and the proliferation thereof during the Pgt infection
process.
PGTG_11318 was homologous to two ESTs reported in Broeker et al. (2006), and both are
likely encoded by PGTG_11318. The ESTs were highly expressed during Pgt infection and
reported to share homology to INF24 encoding infection structure-specific protein 24 from U.
appendiculatus. However, homology of PGTG_11318 to INF24 could not be confirmed.
Based on the reports of Duplessis et al. (2011) and Broeker et al. (2006) PGTG_11318 was
therefore assumed to be associated with haustorium formation in Pgt, although not assumed
to be exclusively expressed in the haustorium. Its function could, however, not be elucidated.
PGTG_11318, unlike Pgt-BTUB, was not expressed relative to the Ta-TEF reference
transcript. Since PGTG_11318 was assumed to be associated with a particular infection
structure in Pgt, this transcript was expressed relative to Pgt-BTUB. As discussed in section
5.4.2.2, Pgt-BTUB was induced over the course of infection and may not be a stable reference
gene. The quantity of PGTG_11318 transcripts relative to Pgt-BTUB transcripts does
however give an indication of the relationship of haustoria to fungal biomass. The expression
of a number of haustorial ESTs has previously been quantified relative to β-tubulin,
elongation factor 1 alpha and actin in Pst (Yin et al., 2009).
In the current study the tested lines were distinguishable from 3 - 10 dpi, but results were
variable. A clear ranking of PGTG_11318 transcript levels was established at 5 dpi in most
trials and this time point was thus considered the most appropriate for accurate quantification
of haustorium formation. A ranking of most lines, entries or cultivars was possible at 5 dpi
when PGTG_11318 transcripts were quantified.
At 5 dpi, the 37-07 line had the highest transcript levels, implying greater haustorium
formation and confirming this line as the most susceptible. The W1406 and W6979 lines
were by extension less susceptible, with the W1406 line being intermediate between 37-07
and W6979. The differences in transcript levels were statistically significant only at 5 dpi.
The ranking by PGTG_11318 transcript levels does however differ from the ranking

138
determined in the seedling trials; thereby indicating the defence response associated with
adult phase of the W1406 and W6979. The APR response in these lines was thereby
confirmed to restrict the Pgt colonization process, possibly by restricting haustorium
formation.
Analysis of the PGTG_11318 transcripts in the DH entries delivered comparable results at 5
dpi, but clearly distinguishing all entries was not possible. DH1.43 and DH1.50 could not be
distinguished from the W1406 line, while DH2.31 and DH2.38 could not be distinguished
from 37-07. These results imply that DH1.43 and DH1.50 potentially restrict haustorium
formation to the same extent as in the W1406 line. DH2.31 and DH2.38 could not restrict
haustorium formation to the same extent as W6979. Furthermore, results implied that while
haustorium formation may be restricted by both W1406 and W6979, the QTL interactions
may have a crucial effect.
Results of PGTG_11318 transcript quantification analysis at 5 dpi could not consistently
distinguish Francolin-1, Pavon-76 and Kingbird. The ranking of cultivars, in turn, differed
from the ranking seen in the analysis of Pgt-BTUB transcripts. Generally, Kingbird was
considered to have the lowest PGTG_11318 and Pgt-BTUB transcript levels. The APR
cultivars could not be distinguished by phenotypic scoring of the adult plant infection
responses at 14 dpi (Chapter 3; Table 3.5). The tested cultivars may therefore overlap in the
intensity of APR response, but not necessarily in the mechanism. All cultivars had lower
quantities of PGTG_11318 transcripts than the 37-07 line confirming the APR response in
these cultivars. The restriction of haustorium formation was thus a possible contributing
factor to the inhibition of Pgt colonization.
PGTG_11318 transcript levels showed that the APR response in most of the tested cultivars,
lines and entries inhibited haustorium formation from 3 dpi onwards, but particularly at 5 dpi.
Quantifiable differences in haustorium formation could not be confirmed by microscopic
observation. Results imply a post-haustorial defence response in the tested lines/cultivars that
may restrict Pgt proliferation. A pre-haustorial defence response cannot be completely ruled
out, but quantification of haustorium formation at early time points requires an improvement
of the sensitivity of the current methods.
The transcript levels of PGTG_11318 showed a fixed pattern in all trials. PGTG_11318
transcripts started low, increased over the course of infection, peaked at 5 dpi, but deceased
thereafter. At the early time intervals the infection process is starting and fungal biomass is

139
low, as confirmed by chitin quantification and biomass analysis. Though HMC formation was
confirmed by microscopic observations at 1 dpi (Chapter 4; Figure 4.18), the quantity of
haustoria is assumed to be too low to be detected by RT-qPCR of PGTG_11318. These initial
phases were classified as recognition, signalling and parasitic by Mendgen et al. (1988).
During the parasitic phase the pathogen establishes a biotrophic relationship through
haustorium formation. The tested haustorium-associated transcript therefore accumulates in
proportion to total biomass and increases as Pgt proliferates.
From 5 to 10 dpi the transcript levels of PGTG_11318 decreased, however fungal biomass
still increased exponentially. This observation implies that haustorium formation was
proportionally low at 10 dpi and that fungal development may have shifted away from the
parasitic phase. Microscopic observations confirmed that uredinia were formed from 5 to 10
dpi, and that sporulation occurred by 10 dpi (Chapter 4, Figure 4.23). It is hypothesised that
the proportion of haustoria in the total Pgt biomass decreased from 5 to 10 dpi. Sporulating
mycelium and urediniospores increased in the proportion to the total Pgt biomass at 10 dpi.
The peak of PGTG transcripts therefore neatly separates the phases into establishment of the
pathogen, proliferation of haustoria and sporulation.
A similar pattern of expression for haustorium-associated transcripts was reported by Puthoff
et al. (2008) in U. appendiculatus. The rust fungi transferred protein 1 (RTP1) transcript was
expressed relative to the fungal elongation factor 1 alpha in purified fungal infection
structures. RTP1 expression was detected in the hyphal fractions at 2 and 4 dpi, reaching the
highest level in the haustorium fraction at 5 dpi and then decreased at 6 and 8 dpi. The EST
homologous to PGTG_11318 were induced from 5 dpi onwards, but was down regulated in
sporogenous mycelium (Broeker et al., 2006). The pattern of PGTG_11318 expression in the
current study was thereby confirmed, especially the relative decrease of transcripts at 10 dpi,
here hypothesised to be attributed to a developmental shift to sporulation.
The transcript levels of PGTG_11318 in the APR cultivars, lines and entries were not
considered for the fitting of a non-linear equation due to effects that the APR response may
have on haustorium formation. The infection process in the susceptible 37-07 line was
assumed to be the best representation of haustorium formation on the flag leaf sheaths of
wheat. The quantification of PGTG_11318 transcripts in all trials of the current study fit the
Gaussian equation and confirmed this model as descriptive of haustorium formation relative
to total biomass. Based on the models of transcript levels, the relative quantity of this
140
transcript should peak at 5 to 7 dpi in the different trials. However, more time points are
needed to improve the model and support this conclusion. The time points from 5 to 7 dpi
may therefore be more informative when attempting to distinguish APR lines.
The expression of three haustorium-associated transcripts, hexose transporter 1 (HXT1),
thiamine biosynthesis gene 1 (THI1) and RTP1 in U. fabae on broad bean showed parallels to
expression analysis for biomass quantification (Voegele and Schmid, 2011). A lag phase,
exponential phase and steady-state phase for haustorium formation were observed and
appeared to fit a sigmoidal growth curve. However, these results did not present relative
transcript quantification and cannot be directly compared to the Gaussian model presented in
the current study.
As fungal genes continue to be described and their expression patterns determined, our
knowledge of the molecular basis of infection is ever expanding. In the future gene
expression markers may be developed for stages or structures of fungal infection. Just as the
expression of RTP1, THI1, HXT1 (Hacquard et al., 2011; Voegele and Schmid, 2011) and
putatively PGTG_11318 are associated with haustoria, other genes associated with
germination, formation of appressoria, sub-stomatal vesicles or sporogenous mycelium may
be identified. Expression analysis of such genes will make quantification of infection
structures possible without microscopic observations. In the current study, HMC formation
was confirmed by microscopic observations as early as 1 dpi (Chapter 4; Figure 4.18), but
haustoria were not directly observed and quantification was therefore not possible. However,
relative quantification of PGTG_11318 allowed haustorium formation to be inferred and
highlights the potential of this analysis.
Methods presented in this chapter improved on the ability to distinguish between the adult
wheat lines after Pgt inoculation. The adult plant infection responses could be scored
phenotypically at 14 dpi (Chapter 3; Table 3.5). Assessing biomass by chitin quantification
and Pgt-BTUB transcript quantification allowed APR wheat to be distinguished from
susceptible wheat at 10 dpi, 4 days earlier than phenotypic scoring. Assessing haustoria
formation by PGTG_11318 transcript quantification allowed APR wheat to be distinguished
from susceptible wheat at 5 dpi, 9 days earlier than phenotypic scoring and 5 days earlier than
biomass analysis by RT-qPCR. Quantification of the colony size of 37-07, W1406 and
W6979 was likewise possible at 5 dpi (Chapter 4; Figure 4.22), but PGTG_11318 transcript
141
quantification has the added benefit of inferring haustoria formation that was not possible by
histological observations.
The wheat lines that were the particular focus of the current study were consistently ranked
using the applied methods. The methods ranked lines 37-07, W1406 and W6979 from most to
least susceptible. The ranking of these lines was supported by chitin quantification and Pgt-
BTUB transcript quantification at 10 dpi, and PGTG_11318 transcript quantification at 5 dpi.
The ranking was additionally supported by phenotypic scoring of the adult plant infection
responses at 14 dpi (Chapter 3; Table 3.5) and the quantified colony sizes at 5 dpi (Chapter 4;
Figure 4.22). Based on the adult plant infection responses of the two APR lines in two
locations, over three growing seasons, W1406 was scored as 0R, 5R and 10R and W6979 as
0R, 5R, and 40RMR (Prins et al., 2016). These field trials appeared to rank W6979 as equal
to, or more susceptible than W1406. Though this contradicts the ranking established in the
current study, the APR response in the W1406 and W6979 lines, and the susceptible
phenotype of the 37-07 line are confirmed, while the ranking was well supported by all
methods.
Distinguishing W1406 and W6979 from 37-07 allowed for the identification of the putative
time point for the expression of the APR response. Determination of fungal biomass by chitin
quantification and Pgt-BTUB transcript quantification both indicated that the APR response
started to restrict Pgt colonization from 5 dpi, even though the effect was only statistically
significant at 10 dpi. Determination of PGTG_11318 transcript levels indicated that the
W1406 and W6979 lines restricted Pgt haustorium formation by 5 dpi. When compared to
the difference in colony size measured at 5 dpi (Chapter 4; Figure 4.22), all results indicated
that the APR response is active by this time point. However, induction of the APR response
in the W1406 and W6979 lines must have occurred at an earlier time point. A more sensitive
method is required to potentially elucidate the response and differentially expressed
transcripts. To understand the APR response in the W1406 and W6979 lines further
experimentation will focus on time points preceding 5 dpi, to possibly elucidate APR
responses that inhibit Pgt colonization.

142
Chapter 6: An analysis of transcriptomic changes in
adult wheat lines upon Puccinia graminis f. sp. tritici
infection

143
6.1 Introduction
Our understanding of the molecular biology of living organisms has been revolutionised by
the development of next-generation sequencing (NGS); called so to distinguish it from first
generation sequencing. NGS technologies allows for the simultaneous sequencing of a large
number of relatively short reads and include sequencing technology platforms such as
Illumina and Ion Torrent. Illumina sequencing is based on the detection of the incorporation
of a fluorescently-labelled deoxynucleotide (dNTP) during DNA synthesis. Ion Torrent
sequencing measures the incorporation of a dNTP through changes in pH (Liu et al., 2012).
More recent developments in NGS have delivered third generation sequencing technologies
such as Pacific Biosciences SMRT and Oxford Nanopore sequencing (Kchouk et al., 2017).
In the current study, the term NGS shall be used to refer to the Illumina, Ion Torrent and
other second generation sequencing platforms.
In studies of plants, their associated pathogens and interactions between plant and pathogen,
NGS have accelerated the accumulation of knowledge. This has also greatly improved our
understanding of the interaction of wheat (Triticum aestivum) with the three Puccinia spp.
that cause rust diseases: P. triticina (Pt), P. striiformis f. sp. tritici (Pst) and P. graminis f. sp.
tritici (Pgt). The wheat genome has been sequenced (Clavijo et al., 2017), and the assembly
and annotation thereof is constantly being improved. Genotyping by sequencing has allowed
the mapping of complex traits such Pgt resistance in wheat (Bajgain et al., 2016). Resistance
gene enrichment sequencing (RenSeq) has allowed the identification of wheat nucleotide-
binding and a leucine-rich repeat (NB-LRR) protein encoding genes that confer resistance
(Steuernagel et al., 2016). The genomes of Pst, Pt and Pgt have also been sequenced (Cantu
et al., 2011; Duplessis et al., 2011;
http://www.broadinstitute.org/annotation/genome/puccinia_group/Info.html). Field
pathogenomics has allowed the investigation of the Pst population structure in the United
Kingdom (Hubbard et al., 2015) and has potential for worldwide application. NGS and
associated computational analysis have permitted the identification of numerous candidate
effector encoding genes in Pgt (Duplessis et al., 2011; Saunders et al., 2012; Upadhyaya et
al., 2015).
The application of NGS to study large scale gene expression changes under variable
conditions is called RNA sequencing (RNA-seq). RNA-seq has a number of advantages over
other methods such as microarrays. RNA-seq does not require the genome of the analysed

144
organism to be sequenced and transcripts can be constructed de novo. The method is more
sensitive and allows transcripts with low copy numbers to be quantified. RNA-seq also does
not require any cloning steps. Challenges of RNA-seq are similar to those associated with
most NGS techniques. Inherent biases are introduced with the fragmentation of larger
transcripts. To ensure sufficient coverage of the transcriptome, higher sequencing depth is
required, but this adds costs to the experiment. Bioinformatics and databases need constant
improvement to accurately analyse large data sets (Wang et al., 2009). RNA-seq has been
widely applied to study changes in the wheat transcriptome upon infection with the Puccinia
spp. (Dobon et al., 2016; Hao et al., 2016; Rutter et al., 2017; Neugebauer et al., 2018).
The aim of this chapter was to identify differentially expressed (DE) transcripts in the flag
leaf sheath of adult wheat upon Pgt inoculation. Under investigation were the adult plant
resistant (APR) W1406 and W6979 lines, and the susceptible control 37-07 line. The main
aim was sub-divided into four objectives. The first objective was to compare the two leading
NGS platforms for their capacity to identify similar DE transcripts from the same RNA
samples. The second objective was to determine the wheat transcripts associated with the
defence response in the APR lines. The third objective was to identify changes in Pgt
transcript expression on the adult wheat host. The fourth and final objective was to determine
how DE transcripts may clarify the genetic basis of the APR response in the W1406 and
W6979 lines.
145
6.2 Materials and methods
6.2.1 Biological material
For RNA-seq, Pgt-inoculated wheat samples were generated as described in Chapter 3. The
37-07, W1406 and W6979 wheat lines from the first three adult plant trials (Adult trial 1-3)
were used. The flag leaf sheaths of the last internode were collected as previously described
and further processed. The 0 days post inoculation (dpi) sample was collected directly after
inoculation and samples were thereafter collected at 1 and 3 dpi.
6.2.2 RNA sequencing
6.2.2.1 Total RNA extraction
Total RNA was extracted from 100 mg of flag leaf sheath tissue using the TRIzolTM
reagent
(Thermo Fisher Scientific, Waltham, Massachusetts, United States of America) as described
in Chapter 5 (section 5.2.3.1). RNA quantity and quality were assessed using the NanoDrop
2000 Spectrophotometer (Thermo Fisher Scientific) and 1.0% (w/v) denaturing agarose gel
electrophoresis (Sambrook et al., 1989) respectively. Total RNA samples were further
purified using the RNAeasy® Mini kit (Qiagen, Hilden, Germany) according to the
manufacturer’s instructions. An on-column DNase I (RNase-free, 10 units) (Thermo Fisher
Scientific) treatment was included. Samples were transported in RNAstable® (Biomatrica,
San Diego, California, United States of America) to the respective laboratories for RNA-seq,
where it was re-dissolved in nuclease free water. RNA quality was assessed using a 2100
Bioanalyzer (Agilent Technologies, Santa Clara, California, United States) and an RNA
integrity number (RIN) > 7 was required before samples were further processed.
6.2.2.2 Illumina sequencing
The 1 and 3 dpi samples from the 37-07, W1406 and W6979 wheat lines from the first
biological replicate (Adult trial 1) were sequenced at Cofactor Genomics (St. Louis,
Missouri, United States). RNA samples underwent poly-adenine selection and were further
prepared according to Illumina guidelines. The cDNA libraries were constructed with TruSeq
RNA Library Prep Kit v2 (Illumina, San Diego, California, United States of America) and
sequenced on the Illumina HiSeq 2000TM
platform (Thermo Fischer Scientific). Single-
stranded reads of 75 nucleotides (nt) were generated.

146
6.2.2.3 Ion Torrent sequencing
The 0, 1 and 3 dpi samples from the 37-07, W1406 and W6979 wheat lines from the first
three biological replicates (Adult trials 1-3) were sequenced at the Central Analytical Facility
(University of Stellenbosch, South Africa). RNA samples underwent poly-adenine selection
and were further prepared according to Ion Torrent guidelines. The cDNA libraries were
constructed with Ion Total RNA-Seq Kit v 2 (Thermo Fischer Scientific) and sequenced on
the Ion Torrent ProtonTM
platform (Thermo Fischer Scientific). Single-stranded reads varying
between 25-386 nt were generated.
6.2.2.4 Reference transcriptomes
The transcriptome reference sequence of the bread wheat cultivar Chinese Spring TGAC
(Ensembl release 35) (Clavijo et al., 2017) and the complete Pgt reference transcriptome
from Puccinia Group Database at the Broad Institute (release 35; Duplessis et al., 2011) were
used as reference sequences. These transcriptome references were hosted by Ensembl
(https://www.ensembl.org). To test whether there was significant cross-mapping between the
two reference transcriptomes the wheat transcriptome reference sequence was aligned to the
Pgt transcriptome reference sequence using Nucleotide-Nucleotide BLAST v 2.6.0+ with the
default E value < 10. Similarly the Pgt transcriptome reference sequence was aligned to the
wheat transcriptome reference sequence. Cross-mapping sequences from both reference
transcriptomes were noted and discarded in further downstream analyses. The bioinformatics
pipeline used the merged wheat and Pgt transcriptome reference sequences, henceforth
simply referred to as the reference transcriptome.
6.2.2.5 Sequencing platform comparison
A subset (from one biological replicate) of the Ion Torrent sequenced samples, corresponding
to 1 and 3 dpi from the 37-07, W1406 and W6979 wheat lines’ first biological replicate
(Adult trial 1), was used for the sequencing platform comparison. RNA for these samples was
thus derived from the same inoculated wheat tissue that was used for the Illumina
sequencing. For quality control, raw reads from the Illumina dataset and Ion Torrent subset
were analysed with FastQC v 0.11.5
(http://www.bioinformatics.babraham.ac.uk/projects/fastqc). FASTX Toolkit v 0.0.14
(http://hannonlab.cshl.edu/fastx_toolkit) was used to trim bases from trailing ends of reads

147
with a quality score < 20. Read lengths < 75 nt were subsequently discarded. Reads were
mapped to the reference transcriptome using Bowtie v 2.3.2 (Langmead and Salzberg, 2012).
Alignment files, generated by Bowtie, for the Illumina and Ion Torrent datasets were
separately imported into SeqMonk v 1.40.1
(https://www.bioinformatics.babraham.ac.uk/projects/seqmonk) running R v 3.4.1. DE
transcripts were identified using an intensity difference analysis (p-value < 0.05). The
intensity difference analysis tested whether the read count of any transcript varied
significantly from the overall distribution of read counts and tested all pairwise combinations
of the imported libraries. The intensity difference analysis may be applied to non-replicated
data as represented by the datasets for the sequencing platform comparison. Raw read counts
were thereafter log2 transformed for normalization. Principal component analysis (PCA) was
done using ClustVis (Metsalu and Vilo, 2015; https://biit.cs.ut.ee/clustvis) with unit variance
scaling and singular value decomposition.
6.2.2.6 Ion Torrent transcriptomic analysis
A schematic representation of the bioinformatics pipeline used for the analysis of the Ion
Torrent datasets is presented in Figure 6.1. For quality control, raw reads from the complete
Ion Torrent datasets were analysed with FastQC v 0.11.5 and trimmed with FASTX Toolkit v
0.0.14. Bases with a quality score < 20 were trimmed from the trailing end of the strand and
resulting reads < 25 nt were discarded. Reads were mapped to the reference transcriptome
with Bowtie v 2.3.2 (Langmead and Salzberg, 2012) and mapped reads were quantified with
Salmon v 0.9.1 using its alignment-based mode (Patro et al., 2017). The raw sequencing data
for the three biological replicates were run independently through this bioinformatics
pipeline. The raw data counts from each sample replicate were combined and then analysed
for differential expression as described below.
DE transcripts were determined using baySeq v 2.12.0 (Hardcastle and Kelly, 2010) package
in R v 3.4.1. Pairwise comparisons were made for wheat lines and time points independently
over the course of infection (Figure 6.2). When sample replicates at 0 dpi were analysed
against the other time points in the same wheat line, the comparison was referred to as time
vs time (Figure 6.2 a). When the inoculated 37-07 line was analysed against an APR line for
a given time point, the comparison was referred to as line vs line (Figure 6.2 b). Transcripts
were considered as DE if they exhibited a false discovery rate (FDR) < 0.05 at any point over
the course of infection and for any comparison. Throughout the DE datasets one was added to

148
every read count to assure division by zero did not occur for the subsequent calculation of
log2 fold change (FC). Transcripts with a log2FC > 1.0 were considered induced in the
pairwise comparison and log2FC < -1.0 repressed. Heatmaps were created using Genesis v
1.7.7 (Sturn et al., 2002) and relationships between transcripts and their expression patterns,
indicated as log2FC values, were determined by complete linkage hierarchical clustering.
Groups of similarly expressed were summarised as distinct clusters.
DE wheat and Pgt transcripts were firstly annotated using BioMart in Ensembl Plants and
Fungi respectively. Transcripts were further annotated using Blast2GO v 5.0.13 (Conesa et
al., 2005). The BLAST search (blastx-fast) for wheat transcripts was restricted to the
Magnoliophyta (taxid: 3398) and for Pgt transcripts to the Basidiomycota (taxid: 5204) with
an E value cut-off < 0.001. Gene ontology (GO) annotations were determined from BLAST
hits. The InterPro (Finn et al., 2017) and associated GO annotations were subsequently
retrieved. Multilevel GO distributions based on node scores were determined in Blast2GO.
Node scores were calculated from the number of sequences converging at a given GO node
and identified the reported GO term (Conesa et al., 2005).
For the identification of NB-LRR protein encoding transcripts, wheat transcripts were
scanned for NB-LRR motifs using MEME suite v 4.9.1 (Bailey et al., 2009) using the
definitions of Jupe et al. (2012). Identified NB-LRR protein encoding transcripts were then
classified by NLR-Parser (Steuernagel et al., 2015). To identify wheat transcripts with
homology to known APR genes, a number of protein domains were identified from InterPro
accessions as described by Peng and Yang (2017). For adenosine triphosphate-binding
cassette (ABC) transporters, the ‘ABC transporter-like domain’ (IPR00343) was used. For
single domain START kinases, the ‘START domain’ (IPR002913 and IPR005031) and
‘START-like domain superfamily’ (IPR023393) were used. Multiple domain START kinases
included the ‘homeobox-like domain superfamily’ (IPR009057) and possibly an additional
‘MEKHLA domain’ (IPR013978). For hexose transporters, both a ‘major facilitator
superfamily domain’ (IPR020846) and ‘sugar transporter conserved site’ (IPR005829) were
used.
For the identification of effectors from the Pgt transcripts, the peptide sequences were
imported into EffectorP v 2.0 (Sperschneider et al., 2018; http://effectorp.csiro.au). The
identified effector peptide sequences were also imported into LOCALIZER v 1.0.4
(Sperschneider et al., 2017; http://localizer.csiro.au) to identify the putative subcellular

149
localization within the plant host. The first 20 amino acids were removed from putative
effector sequences within LOCALIZER to exclude the effector signal peptide sequence.
6.2.2 Note on transcript abbreviation convention
For in-text reports of the wheat transcript accessions an abbreviated code was used. The
Ensembl accession convention for wheat included the TRIAE, CS42 and TGACv1 labels to
designate the sequence as originating from T. aestivum, cv. Chinese Spring and the TGAC
sequencing project. As these labels are common to all wheat accessions, they were removed
in the abbreviated code. For example, 4DL_343575_AA1136830.2 in-text corresponds to
TRIAE_CS42_4DL_TGACv1_343575_AA1136830.2 Ensembl accession. Full accessions
are however reported in the Supplementary Tables as appended to the current study.

150
Figure 6.1: Bioinformatics pipeline used in the current study for the analysis of RNA
sequencing data. RNA was extracted from triplicated samples at 0, 1 and 3 days post
inoculation from adult wheat plants of the 37-07, W1406 and W6979 lines inoculated with
Puccinia graminis f. sp. tritici (Pgt). RNA was sequenced using the Ion Torrent ProtonTM
platform. Steps in the bioinformatics pipeline are noted, with quality checking being repeated
after quality filtering. Programmes and versions used for each step are listed to the right.
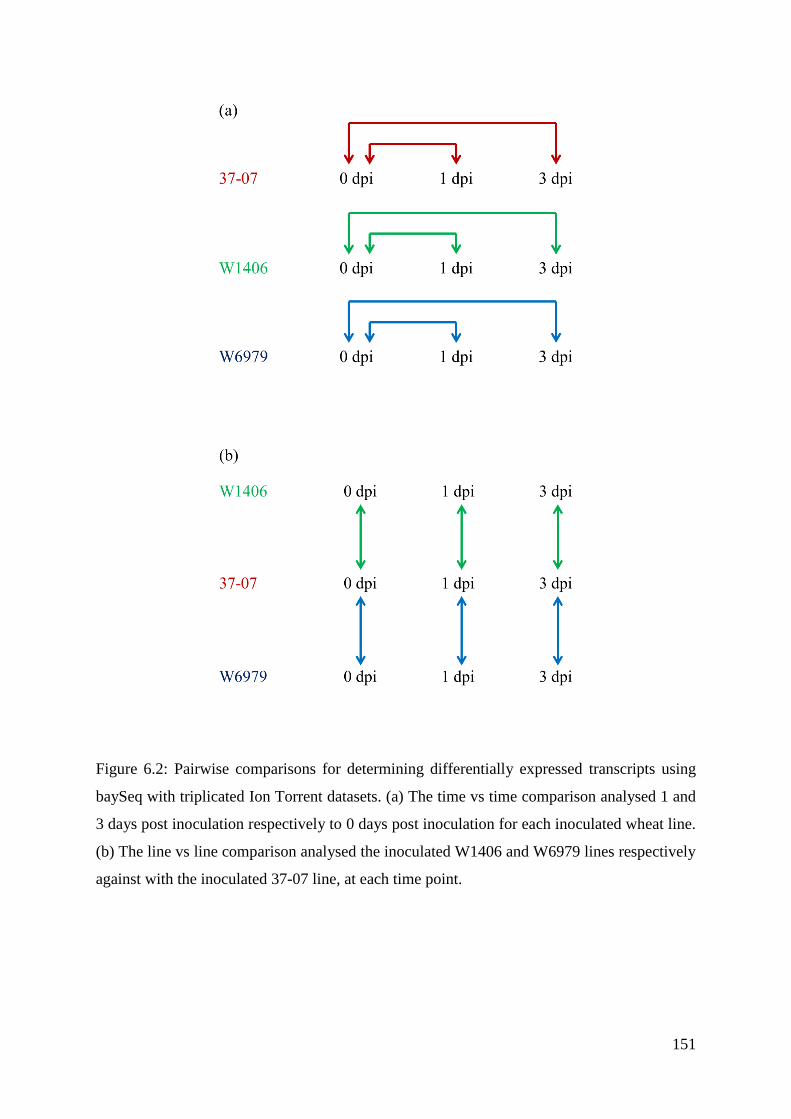
151
Figure 6.2: Pairwise comparisons for determining differentially expressed transcripts using
baySeq with triplicated Ion Torrent datasets. (a) The time vs time comparison analysed 1 and
3 days post inoculation respectively to 0 days post inoculation for each inoculated wheat line.
(b) The line vs line comparison analysed the inoculated W1406 and W6979 lines respectively
against with the inoculated 37-07 line, at each time point.

152
6.3 Results
6.3.1 Cross-mapping between wheat and Puccinia graminis f. sp. tritici reference
transcriptomes
Analysis of wheat and Pgt reference transcriptome sequences demonstrated that a small
percentage of cross-mapping occurred between the host and pathogen. Results showed that
0.19% of the wheat transcriptome aligned to the Pgt transcriptome. Of the Pgt transcriptome,
0.24% aligned to the wheat transcriptome. Sequences that cross-mapped coded for histones,
tubulins, ubiquitins, peptidyl-prolyl isomerases, glyceraldehyde-3-phosphate dehydrogenases
and GTP-binding nuclear proteins. These protein functions are highly conserved in
eukaryotes and the genes are expected to share high homology. Included in the cross-
mapping reads were also a number of transcripts coding for uncharacterised proteins. Reads
aligning to cross-mapping sequences were discarded in further downstream analyses.
6.3.2 Sequencing platform comparison
The number of generated Illumina reads varied from 28.4 to 32.2 million and required no
additional quality filtering (Table 6.1). Illumina reads were directly used for mapping to the
reference transcriptomes. For the Ion Torrent subset, the mean number of reads was 68.5
million and required quality filtering. Reads shorter than 75 nt were discarded. After filtering,
the number of reads in the Ion Torrent subset varied from 43.9 to 73.5 million, with a mean
read length of 130 nt. A mean 81.44% (24.4 million) of Illumina reads and 73.05% (42.8
million) of Ion Torrent reads respectively, mapped to the reference transcriptome (Table 6.2).
Using the intensity difference analysis option in SeqMonk, 101 DE transcripts were identified
in the Illumina dataset and 530 in the Ion Torrent subset. The PCA of the DE Illumina
transcripts showed a cumulative explained variance for the two principal components of
78.9% (Figure 6.3 a) and for the DE Ion Torrent transcripts of 63.5% (Figure 6.3 b). For both
PCAs, distinct clusters for 1 and 3 dpi were seen. However, with the Ion Torrent analysis 37-
07 at 1 dpi was slightly more removed from the APR lines at that time point than in the
Illumina data sets. Of the DE transcripts identified by the two platforms, 97 transcripts were
shared (Figure 6.4 a). For the shared DE transcripts, the PCA showed a cumulative explained
variance for the two principal components of 81.0% (Figure 6.4 b). Samples from the two
different platforms and time points clustered separately.

153
Table 6.1: Number and lengths of reads for the sequencing platform comparison reported
before and after quality trimming. Values for both the Illumina and Ion Torrent platforms are
indicated even though the Illumina dataset required no trimming and the number and length
of remaining reads are not applicable (na).
Wheat line
(days post
inoculation)
Total reads
(million)
Read length
(nucleotides)
Remaining
reads
(million)
Read length
(nucleotides)
Illumina
37-07 (1) 29.7 75 na na
37-07 (3) 32.2 75 na na
W1406 (1) 30.5 75 na na
W1406 (3) 29.8 75 na na
W6979 (1) 28.4 75 na na
W6979 (3) 29.6 75 na na
Ion Torrent
37-07 (1) 65.8 25-384 60.6 75-369
37-07 (3) 65.1 25-384 43.9 75-367
W1406 (1) 83.6 25-380 73.5 75-368
W1406 (3) 65.3 25-383 60.7 75-367
W6979 (1) 59.5 25-384 54.1 75-368
W6979 (3) 70.5 25-384 63.0 75-367

154
Table 6.2: Number and percentage of reads mapped to the reference transcriptomes in the
sequencing platform comparison. Reads used for mapping were those that remained after
quality control.
Wheat line
(days post
inoculation)
Remaining
reads
(million)
Mapped reads
(million)
Percentage
mapped (%)
Illumina
37-07 (1) 29.7 23.8 80.33
37-07 (3) 32.2 26.4 82.03
W1406 (1) 30.5 24.6 80.53
W1406 (3) 29.8 24.1 80.91
W6979 (1) 28.4 23.6 83.24
W6979 (3) 29.6 24.1 81.62
Mean 30.0 24.4 81.44
Ion Torrent
37-07 (1) 60.6 46.6 76.84
37-07 (3) 43.9 36.2 82.43
W1406 (1) 73.5 44.6 60.72
W1406 (3) 60.7 45.2 74.45
W6979 (1) 54.1 37.5 69.35
W6979 (3) 63.0 46.9 74.51
Mean 59.3 42.8 73.05

155
Figure 6.3: Principal component analysis of the differentially expressed transcripts identified
by intensity difference analysis. Principal component 1 and 2 (PC1 and PC2) were plotted
and percentage variance explained indicated in brackets. The analyses for the 101 DE
transcripts identified from the Illumina dataset (a) and the 530 differentially expressed
transcripts identified from the Ion Torrent subset (b) are shown separately.
37-07 (1 dpi) 37-07 (3 dpi)
W1406 (1 dpi)
W1406 (3 dpi) W6979 (1 dpi)
W6979 (3 dpi)
-15
-10
-5
0
5
10
15
-15 -10 -5 0 5 10 15
PC
2 (
14.5
%)
PC1 (64.4%)
37-07 (1 dpi)
37-07 (3 dpi)
W1406 (1 dpi) W1406 (3 dpi)
W6979 (1 dpi)
W6979 (3 dpi)
-25
-20
-15
-10
-5
0
5
10
15
20
25
-25 -15 -5 5 15 25
PC
2 (
23.4
%)
PC1 (40.1%)
(a)
(b)

156
Figure 6.4: Analysis of the shared differentially expressed transcripts identified by intensity
difference analysis in the sequencing platform comparison. (a) From the analysis of the
Illumina dataset and the Ion Torrent subset a total of 97 differentially expressed transcripts
are shared. (b) Principal component analysis of the 97 shared differentially expressed
transcripts with percentage variance explained indicated in brackets. The Illumina dataset (○)
and Ion Torrent subset (●) are shown separately.
37-07 (1 dpi)
37-07 (3 dpi)
W1406 (1 dpi)
W1406 (3 dpi)
W6979 (1 dpi)
W6979 (3 dpi) 37-07 (1 dpi)
37-07 (3 dpi)
W1406 (1 dpi)
W1406 (3 dpi)
W6979 (1 dpi)
W6979 (3 dpi)
-10
-8
-6
-4
-2
0
2
4
6
8
10
-20 -15 -10 -5 0 5 10 15 20
PC
2 (
15.8
%)
PC1 (65.2%)
(a)
(b)

157
6.3.3 Ion Torrent transcriptomic analysis
For the triplicated Ion Torrent dataset, a mean 61.2 million reads from the 62.0 million raw
reads remained after quality filtering (Table 6.3). A mean of 46.1 million (75.66%) of the
remaining reads were mapped to the reference transcriptome (Table 6.4).
6.3.3.1 The time vs time comparison
6.3.3.1.1 Differential expression of wheat transcripts
The time vs time comparison reported DE transcripts within each wheat line in relation to 0
dpi. A total of 723 transcripts were DE in the 37-07 dataset, 280 of which were wheat
transcripts. In the W1406 dataset a total of 169 DE transcripts were identified, 141 of which
were wheat transcripts. Of the 164 DE transcripts in the W6979 dataset, 75 were of wheat
origin. The relationship between the different lines with respect to identified DE wheat
transcripts is indicated in Figure 6.5.
Clear differences in expression patterns for the DE wheat transcripts were observed over the
course of infection. The hierarchical clustering of the DE wheat transcripts and the log2FC
values are reported in Supplementary Tables S1-S3. The hierarchical clustered data for each
line was subdivided into five clusters based on the the mean log2FC for each cluster was
reported in Figure 6.6. For each wheat line the log2FC values were presented with a colour
code directly corresponding to the numerical scale. Yellow indicates repressed transcripts and
red, green and blue represents induced transcripts for the 37-07, W1406 and W6979 lines
respectively. Lighter colour intensity indicates greater log2FC in the direction of either
repression or induction. The largest cluster (E) in the 37-07 line identified 195 transcripts
induced at 3 dpi and the second largest cluster (B) showed transcripts induced at 1 dpi, but
repressed thereafter (Figure 6.6 a). The largest cluster (C) in W1406 with 99 transcripts, also
identified transcripts induced at 3 dpi (Figure 6.6 b). Smaller clusters (D and E) in W1406
showed transcripts induced at 1 dpi, but repressed at 3 dpi. In W6979 the three largest
clusters (A-C) indicated a total of 65 transcripts transiently induced at 1 dpi (Figure 6.6 c).
The identities and homologies of the DE wheat transcripts are reported in Supplementary
Tables S4-S6 along with associated GO and InterPro accessions. The multilevel distributions
of GO accessions are shown in Figures 6.7-6.9 for each line. The GO descriptions indicated a
large degree of dissimilarity between lines, but the GO accession corresponding to the
‘oxidation-reduction process’ was the most prevalent in all lines.

158
Table 6.3: Number and lengths of reads for the triplicated Ion Torrent dataset reported before
and after quality trimming. Values for samples from the three independent trials are indicated
separately.
Wheat line
(days post
inoculation)
Total reads
(million)
Read length
(nucleotides)
Remaining
reads
(million)
Read length
(nucleotides)
Adult trial 1
37-07 (0) 60.8 25-381 60.4 25-369
37-07 (1) 65.8 25-384 65.7 25-369
37-07 (3) 65.1 25-384 65.0 25-367
W1406 (0) 45.6 25-383 45.3 25-367
W1406 (1) 83.6 25-380 83.4 25-368
W1406 (3) 65.3 25-383 65.1 25-367
W6979 (0) 49.8 25-378 49.5 25-368
W6979 (1) 59.5 25-384 59.3 25-368
W6979 (3) 70.5 25-384 70.4 25-367
Adult trial 2
37-07 (0) 51.6 25-376 51.3 25-370
37-07 (1) 56.7 25-380 56.4 25-368
37-07 (3) 42.0 25-383 41.7 25-369
W1406 (0) 55.4 25-383 55.1 25-372
W1406 (1) 60.1 25-384 59.7 25-370
W1406 (3) 56.4 25-383 56.1 25-370
W6979 (0) 69.0 25-383 55.2 25-370
W6979 (1) 73.3 25-383 72.8 25-372
W6979 (3) 62.9 25-385 62.6 25-370
Adult trial 3
37-07 (0) 70.1 25-383 69.7 25-370
37-07 (1) 64.5 25-383 64.0 25-371
37-07 (3) 57.9 25-383 57.4 25-369
W1406 (0) 56.1 25-380 55.8 25-368
W1406 (1) 73.1 25-383 72.5 25-371
W1406 (3) 71.7 25-383 71.2 25-368
W6979 (0) 62.7 25-385 62.4 25-371
W6979 (1) 66.8 25-386 66.4 25-370
W6979 (3) 58.4 25-383 58.0 25-369

159
Table 6.4: Number and percentage of reads mapped to the reference transcriptomes for the
triplicated Ion Torrent dataset. Reads used for mapping were those that remained after quality
control.
Wheat line
(days post
inoculation)
Remaining
reads
(million)
Mapped reads
(million)
Percentage
mapped (%)
Adult trial 1
37-07 (0) 60.4 46.8 77.49
37-07 (1) 65.7 50.4 76.82
37-07 (3) 65.0 54.2 83.46
W1406 (0) 45.3 33.6 74.14
W1406 (1) 83.4 51.7 61.95
W1406 (3) 65.1 48.6 74.57
W6979 (0) 49.5 39.8 80.48
W6979 (1) 59.3 41.4 69.86
W6979 (3) 70.4 52.7 74.83
Adult trial 2
37-07 (0) 51.3 39.3 76.57
37-07 (1) 56.4 45.2 80.22
37-07 (3) 41.7 32.5 77.88
W1406 (0) 55.1 39.1 71.10
W1406 (1) 59.7 45.2 75.69
W1406 (3) 56.1 44.6 79.50
W6979 (0) 55.2 45.4 82.36
W6979 (1) 72.8 59.4 81.60
W6979 (3) 62.6 50.1 80.14
Adult trial 3
37-07 (0) 69.7 53.5 76.87
37-07 (1) 64.0 50.1 78.23
37-07 (3) 57.4 41.1 71.65
W1406 (0) 55.8 43.4 77.92
W1406 (1) 72.5 54.4 75.03
W1406 (3) 71.2 48.3 67.80
W6979 (0) 62.4 45.6 73.09
W6979 (1) 66.4 47.3 71.23
W6979 (3) 58.0 42.0 72.40
Mean 61.2 46.1 75.66

160
Figure 6.5: Venn diagram showing the number of differentially expressed wheat transcripts in
each line for the time vs time comparison. Transcripts were considered differentially
expressed with a false discovery rate < 0.05 and a log2 fold change > 1.0 or log2 fold change
< -1.0 at any time point over the course of infection.

161
Figure 6.6: Summarised heatmaps of hierarchical clustered wheat transcripts for the time vs
time comparison. Colour intensity corresponds to log2 fold change (FC) values of
differentially expressed wheat transcripts at either 1 or 3 days post inoculation (dpi). The 37-
07 (a), W1406 (b) and W6979 (c) lines are indicated, with five assigned clusters (A-E) each.
In brackets are indicated the number of transcripts in each cluster.
(a)
(b)
(c)

162
Figure 6.7: Multilevel distribution of gene ontology (GO) annotations in the differentially
expressed wheat transcripts in the 37-07 line for the time vs time comparison. Gene ontology
descriptions and node scores are reported for gene ontology annotations within the categories
of biological process, molecular function and cellular component domains.

163
Figure 6.8: Multilevel distribution of gene ontology (GO) annotations in the differentially
expressed wheat transcripts in the W1406 line for the time vs time comparison. Gene
ontology descriptions and node scores are reported for gene ontology annotations within the
categories of biological process, molecular function and cellular component domains.

164
Figure 6.9: Multilevel distribution of gene ontology (GO) annotations in the differentially
expressed wheat transcripts in the W6979 line for the time vs time comparison. Gene
ontology descriptions and node scores are reported for gene ontology annotations within the
categories of biological process, molecular function and cellular component domains.

165
The defence response in the Pgt-inoculated wheat lines was illustrated by the distribution of
GO accessions, particularly when focussing on those classified under the biological processes
category. In the 37-07 line, the GO descriptions pointing to the maintenance of the plant cell
wall dominated and included the cellulose biosynthetic process, plant-type secondary cell
wall biogenesis and the pectin metabolic process (Figure 6.7). In contrast, W1406 included
diverse GO descriptions such as the regulation of transcription by RNA polymerase II,
proteolysis and the response to oxidative stress (Figure 6.8). In W6979 the GO descriptions
pointed to the oxidative burst and included cellular oxidant detoxification, hydrogen peroxide
catabolic processes and responses to hydrogen peroxide (Figure 6.9).
While a number of DE transcripts were uniquely induced in each wheat line, others were
shared. Transcripts encoding sucrose synthases, cellulose synthases and an arginine
decarboxylase were unique to 37-07. Two Bowman-Birk trypsin inhibitor-like proteins and
two other protease inhibitor-like proteins were encoded by transcripts unique to W1406.
Transcripts encoding salicylic acid-binding protein 2-like and a putative invertase inhibitor
were unique to W6979. Transcripts that were shared included those encoding chalcone
synthase occurring in both 37-07 and W1406 and Wheatwin-1 occurring in both 37-07 and
W6979. Glucan endo-1,3-beta-D-glucosidase encoding transcripts occurred in all three lines.
DE transcripts encoding peroxidases were common in all lines, but the expression patterns of
these transcripts showed clear differences between lines. In the 37-07 line no transcripts
encoding peroxidases were detected at 1 dpi, but numerous were induced at 3 dpi (Figure
6.10 a). W1406 induced peroxidase encoding transcripts either at 1 or 3 dpi but others were
induced over the course of infection (Figure 6.10 b). Transcripts encoding peroxidases in
W6979 were all induced at 1 dpi, but had much lower expression levels at 3 dpi (Figure 6.10
c).
The time vs time comparison identified few putative resistance-associated protein encoding
transcripts. No NB-LRR proteins were DE in any of the wheat lines. ABC transporters,
START kinases and hexose transporters were not DE in either 37-07 or W6979. Likewise,
ABC transporters and hexose transporters were not DE in W1406. However, W1406 had a
single DE transcript (2BL_130389_AA0410180.4) encoding a protein with a START-like
domain that was induced at 3 dpi. The function of the encoded peptide is unknown in wheat,
but it showed homology to the major latex protein (MLP)-like 423 in Arabidopsis.

166
Figure 6.10: Heatmaps of differentially expressed transcripts in time vs time comparison
encoding wheat peroxidases. Colour intensity corresponds to log2 fold change (FC) values of
putative peroxidase encoding transcripts at either 1 or 3 days post inoculation (dpi) reported
for the 37-07 (a), W1406 (b) and W6979 (c) lines. Transcripts in bold are shared between
two wheat lines but no transcripts were shared by all three lines.
(a)
(b)
(c)
167
6.3.3.1.2 Differential expression of Puccinia graminis f. sp. tritici transcripts
The relationship between DE Pgt transcripts in the different wheat lines is shown in Figure
6.11. A total of 723 transcripts were DE in the 37-07 dataset, 443 of which were Pgt
transcripts. In the W1406 dataset a total of 169 DE transcripts were identified, 28 of which
were Pgt transcripts. Of the 164 DE transcripts in the W6979 dataset, 89 were from Pgt.
Fungal transcripts therefore constituted 61.2% (37-07), 54.2% (W1406) and 16.5% (W6979)
of the total DE transcripts in each line.
The induction of Pgt transcripts relative to 0 dpi was a near uniform feature of identified
expression patterns. The hierarchical clustered DE Pgt transcripts and the log2FC values are
reported in Supplementary Tables S7-S9. As before the hierarchical clustered Pgt expression
data in each line was subdivided into five clusters clusters based on the log2FC value. The
mean log2FC for each cluster is reported in Figure 6.12 as a summarised heatmap. The
log2FC values for each respective wheat line were presented with colour code as before, with
yellow indicating repressed transcripts and red, green and blue representing induced
transcripts. The largest cluster (D) of Pgt transcripts in 37-07 identified 232 transcripts
induced to higher levels at 3 dpi as compared to 1 dpi (Figure 6.12 a).The second (C) and
third (E) largest clusters likewise showed transcripts induced at 3 dpi, but only marginally so
at 1 dpi. The largest clusters (D and E) for Pgt in W1406 with 21 transcripts in total,
identified transcripts induced at similar levels at 1 and 3 dpi (Figure 6.12 b). In contrast, for
W6979 all clusters, except cluster A, show lower levels at 3 dpi than 1 dpi, though in some
clusters this decrease was only marginal (Figure 6.12 c).
Identities and homologies of DE Pgt transcripts are reported in Supplementary Tables S10-
S12 along with associated GO and InterPro accessions. The multilevel distributions of GO
accessions are shown in Figures 6.13-6.15 for each line. The putative functions of encoded
proteins are largely unknown for most Pgt transcripts. Of the DE transcripts, 56.9%, 92.9%
and 84.3% encoded hypothetical proteins in the 37-07, W1406 and W6979 lines,
respectively. Additionally, 16.3% of DE transcripts in 37-07 encoded ribosomal proteins. In
contrast, Pgt transcripts encoding transcription factors were prominent in W1406 (Figure
6.14). Putative proteins involved in proteolysis and the response to oxidative stress were
dominant in W6979 (Figure 6.15).

168
Figure 6.11: Venn diagram showing the differentially expressed Puccinia graminis f. sp.
tritici transcripts in each line for the time vs time comparison. Transcripts were considered
differentially expressed with a false discovery rate < 0.05 and a log2 fold change > 1.0 or log2
fold change < -1.0 at any time point over the course of infection.

169
Figure 6.12: Summarised heatmaps of hierarchical clustered Puccinia graminis f. sp. tritici
transcripts for the time vs time comparison. Colour intensity corresponds to log2 fold change
(FC) values of differenttally expressed wheat transcripts at either 1 or 3 days post inoculation
(dpi). The 37-07 (a), W1406 (b) and W6979 (c) lines are indicated, with five assigned
clusters (A-E) each. In brackets are indicated the number of transcripts in each cluster.
(a)
(b)
(c)

170
Figure 6.13: Multilevel distribution of gene ontology (GO) annotations in the differentially
expressed Puccinia graminis f. sp. tritici transcripts in the 37-07 line for the time vs time
comparison. Gene ontology descriptions and node scores are reported for gene ontology
annotations within the biological process, molecular function and cellular component
domains.

171
Figure 6.14: Multilevel distribution of gene ontology (GO) annotations in the differentially
expressed Puccinia graminis f. sp. tritici transcripts in the W1406 line for the time vs time
comparison. Gene ontology descriptions and node scores are reported for gene ontology
annotations within the biological process, molecular function and cellular component
domains.

172
Figure 6.15: Multilevel distribution of gene ontology (GO) annotations in the differentially
expressed Puccinia graminis f. sp. tritici transcripts in the W6979 line for the time vs time
comparison. Gene ontology descriptions and node scores are reported for gene ontology
annotations within the biological process, molecular function and cellular component
domains.
173
The expression of Pgt transcripts showed a number of unique patterns in each of the wheat
lines. A large number of annotated transcripts were unique to 37-07 and included an
argininosuccinate synthase, a phosphoglycerate kinase and a pyruvate carboxylase. In
W6979, transcripts encoding a bleomycin hydrolase, a hypothetical class III chitin synthase
and a saccharopepsin were unique. Among the 25 transcripts DE in all three wheat lines only
two were annotated, encoding an L-iditol 2-dehydrogenase and a copper/zinc superoxide
dismutase. The only Pgt transcript repressed over the course of infection was a transcript
encoding an uncharacterised protein unique to 37-07.
To further classify the DE Pgt transcripts, putative effectors and their localization in the host
plant were analysed (Supplementary Tables S13-S15). In 37-07, 80 putative effectors were
predicted, two in W1406 and 19 in W6979. The relationship of the DE effectors in the
different wheat lines is shown in Figure 6.16. The expression of putative effectors over the
course of infection was variable and did not group exclusively within any of the previously
identified clusters (Figure 6.11), indicating variable expression of effector encoding
transcripts.
In parallel with the data for all DE Pgt transcripts, most predicted effector transcripts encoded
uncharacterised proteins and also a number of ribosomal associated proteins. Of the DE
effectors present in the 37-07 line a copper/zinc superoxide dismutase, predicted to be
localised to the host mitochondrion, was found. A transcript encoding a TdcF protein,
putatively localised to the host chloroplast and mitochondrion, and another encoding unique
argininosuccinate synthase were also found. A single effector encoding transcript was unique
to W1406 and two to W6979, both encoding uncharacterised proteins. The only effector
identified in all three wheat lines (EHS63013) was induced at 1 and 3 dpi. The transcript
encoded an uncharacterised protein that was putatively localised to the host nucleus.

174
Figure 6.16: Venn diagram of the number of differentially expressed Puccinia graminis f. sp.
tritici transcripts in each wheat line sample for the time vs time comparison that encoded
predicted effector proteins. Transcripts were considered differentially expressed with a false
discovery rate < 0.05 and a log2 fold change > 1.0 or log2 fold change < -1.0 at any time point
over the course of infection. Effectors were predicted by EffectorP (Sperschneider et al.,
2018).

175
6.3.3.2 The line vs line comparison
6.3.3.2.1 Differentially expressed wheat transcripts
The line vs line comparison reports DE transcripts within the two APR lines in relation to the
susceptible 37-07 line. In the W1406 dataset, 1741 DE wheat transcripts were identified and
in W6979, 1432 DE wheat transcripts. The relationship of the two APR lines with respect to
the identified DE wheat transcripts is shown in Figure 6.17 and indicated that 448 transcripts
were shared.
The hierarchical clustered DE wheat transcripts and the log2FC values are reported in
Supplementary Tables S16 and S17. The hierarchical clustered data for each line was
subdivided into nine clusters clusters based on the log2FC value. The mean log2FC for each
cluster is reported in Figure 6.18 as a summarised heatmap. For each APR lines the log2FC
values were presented on colour code comparable to before. Red indicates repressed
transcripts, i.e. those induced in the 37-07 line and green and blue represents induced
transcripts in the W1406 and W6979 lines respectively. Lighter colour intensity indicates
greater log2FC in the direction of either one or the other compared wheat lines. The largest
cluster (G) in W1406 identified 504 transcripts induced at 3 dpi (Figure 6.18 a). The second
and fourth largest clusters (C and D) showed 444 and 165 transcripts respectively that were
repressed over the course of infection, but the third largest cluster (H) identified 376
transcripts induced over the course of infection (Figure 6.18 a). In W6979 (Figure 6.18 b) the
largest cluster (I) included a total of 429 transcripts repressed over the course of infection,
while in the second largest cluster (E) 421 transcripts were induced over the course of
infection.
The Ensembl descriptions of DE wheat transcripts are reported in Supplementary Tables S18
and S19 with their associated InterPro accessions. In W1406, 89.4% of the 1741 DE
transcripts are uncharacterised and 91.3% of the 1458 DE transcripts from W6979. A number
of features of DE transcripts of the time vs time comparison were repeated in the line vs line
comparison such as the prominence of peroxidases and identification of a Bowman-Birk
trypsin inhibitor-like protein unique to W1406. However, a number of transcripts unique to
the line vs line comparison were also found. Transcripts encoding bidirectional sugar
transporter (SWEET) proteins were present in both lines, but expression patterns were
variable over the course on infection. One SWEET protein encoding transcript was
downregulated in the APR lines. Other SWEET protein encoding transcripts in W1406 were

176
typically not detected at 0 and 1 dpi, but induced at 3 dpi. Contrastingly, the SWEET protein
encoding transcripts in W6979 were induced over the course of infection. A transcript
encoding a WRKY45-like transcription factor was shared by the two APR lines and was
induced to high levels at 1 dpi, but decreased thereafter. Transcripts encoding receptor-like
serine/threonine protein kinase 2 were unique to W1406 and highly induced at 3 dpi.
The line vs line comparison identified a number of NB-LRR protein encoding transcripts in
the APR lines that are reported in Supplementary Tables S20 and S21. A total of 181 were
identified in W1406 and 158 in W6979, with 57 shared (Figure 6.19). The coiled-coil (CC)-
NB-LRR subclass made up the majority of identified NB-LRR protein encoding transcripts
and accounted for 91.1% in W1406 and 93.0% in W6979. The Toll/interleukin receptor-like
(TIR)-NB-LRR subclass was absent. Predicted protein domains in the unclassified NB-LRR
protein encoding transcripts showed the loss of a N-terminal domain that resulted in this
classification. The chromosomal positions of DE NB-LRR protein encoding transcripts in the
APR lines are shown in Figure 6.20. In W1406, the largest number of NB-LRR protein
encoding transcripts was predicted to locate to chromosomes 1A, 1D, 2B, 2D and 4B. In
W6979 the largest number were predicted to locate to chromosomes 1B, 2B, 3B, 5B and 7A.
To identify possible APR genes, the DE transcripts were searched for predefined InterPro
accessions. Four putative ABC transporter transcripts were DE in W1406:
2AL_094030_AA0291350.1, 2AL_094030_AA0291350.2, 2BS_147394_AA0482680.1 and
7AL_556235_AA1758970.1. The expression of these transcripts was variable over the course
of infection. Twenty four START domain encoding transcripts were DE and were encoded by
4BS_329705_AA1103430 and were universally repressed over the course of infection. An
additional START-like domain encoding transcript, 2AL_094002_AA0290990.1, was
induced over the course of infection. No DE putative hexose transporter encoding transcripts
were identified in W1406.
For W6979, the DE transcripts were likewise searched for predefined InterPro accessions.
Eight DE transcripts encoding putative ABC transporter proteins were encoded by four genes
in W6979: 2AS_114278_AA0365810, 2BS_146633_AA0469740, 2BS_147394_AA0482680
and 2DS_177216_AA0569300. Only the two transcripts from the gene on chromosome 2D
were induced over the course of infection. No DE putative START domain or hexose
transporter encoding transcripts were identified in W6979. None of the identified protein
domains coupled to APR were shared between W1406 and W6979.

177
Figure 6.17: Venn diagram of the number of differentially expressed wheat transcripts in each
wheat line sample for the line vs line comparison. Transcripts were considered differentially
expressed with a false discovery rate < 0.05 and a log2 fold change > 1.0 or log2 fold change
< -1.0 at any time point over the course of infection.

178
Figure 6.18: Summarised heatmaps of hierarchical clustered wheat transcripts for the line vs
line comparison. Colour intensity corresponds to log2 fold change (FC) values of
differentially expressed wheat transcripts at 0, 1 or 3 days post inoculation (dpi). The W1406
(a) and W6979 (b) and transcripts assigned to nine clusters (A-I) each. In brackets are
indicated the number of transcripts in each cluster
(a)
(b)

179
Figure 6.19: Venn diagram of the number of differentially expressed wheat transcripts in each
wheat line for the line vs line comparison that encoded predicted nucleotide-binding and a
leucine-rich repeat proteins. Transcripts were considered differentially expressed with a false
discovery rate < 0.05 and a log2 fold change > 1.0 or log2 fold change < -1.0 at any time point
over the course of infection. Nucleotide-binding and a leucine-rich repeat domains were
predicted by NLR-Parser (Steuernagel et al., 2015).
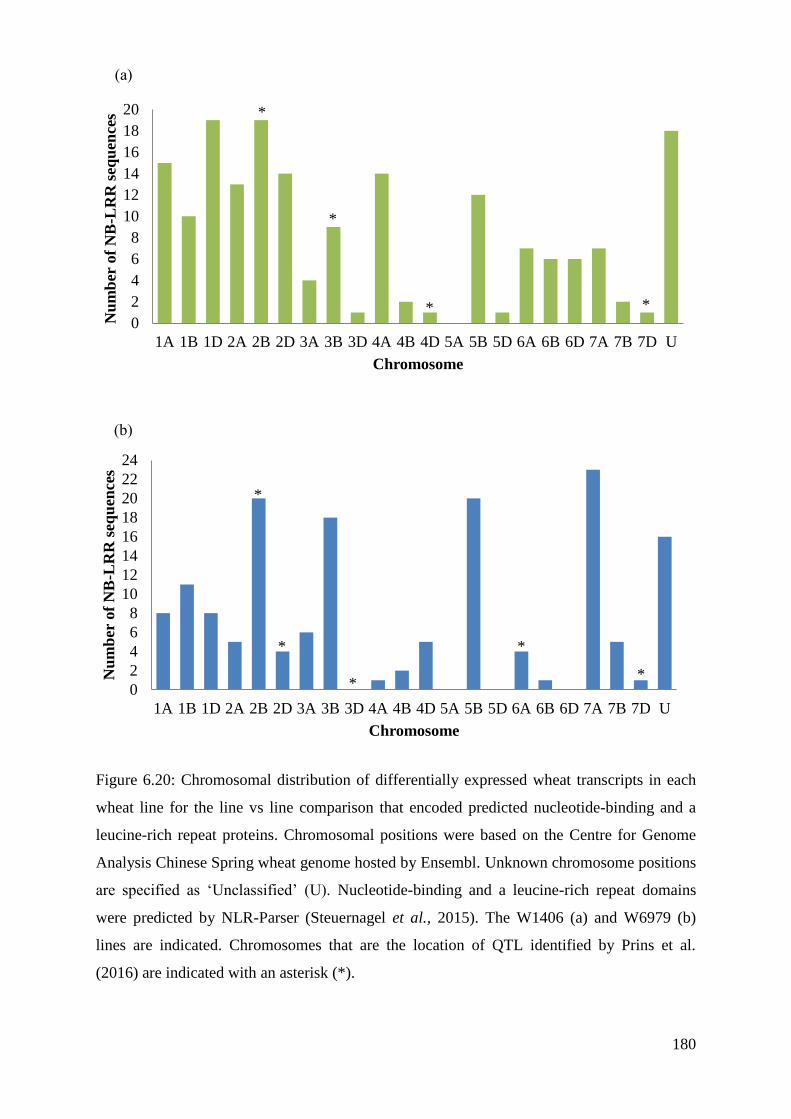
180
Figure 6.20: Chromosomal distribution of differentially expressed wheat transcripts in each
wheat line for the line vs line comparison that encoded predicted nucleotide-binding and a
leucine-rich repeat proteins. Chromosomal positions were based on the Centre for Genome
Analysis Chinese Spring wheat genome hosted by Ensembl. Unknown chromosome positions
are specified as ‘Unclassified’ (U). Nucleotide-binding and a leucine-rich repeat domains
were predicted by NLR-Parser (Steuernagel et al., 2015). The W1406 (a) and W6979 (b)
lines are indicated. Chromosomes that are the location of QTL identified by Prins et al.
(2016) are indicated with an asterisk (*).
0
2
4
6
8
10
12
14
16
18
20
1A 1B 1D 2A 2B 2D 3A 3B 3D 4A 4B 4D 5A 5B 5D 6A 6B 6D 7A 7B 7D U
Nu
mb
er o
f N
B-L
RR
seq
uen
ces
Chromosome
0
2
4
6
8
10
12
14
16
18
20
22
24
1A 1B 1D 2A 2B 2D 3A 3B 3D 4A 4B 4D 5A 5B 5D 6A 6B 6D 7A 7B 7D U
Nu
mb
er o
f N
B-L
RR
seq
uen
ces
Chromosome
(a)
(b)
*
*
*
*
*
* *
*
*

181
DE transcripts may potentially identify the contribution to gene expression influenced by the
stem rust resistance QTL in the APR lines identified by Prins et al. (2016). To investigate this
hypothesis, DE wheat transcripts were filtered by chromosomal position. Two chromosomes
were selected for this approach: 4D for DE transcripts in W1406 and 6A for DE transcripts in
W6979. These respective chromosomes were the location of the QTL with the greatest
contribution to the APR response of W1406 and W6979 in the field as reported by Prins et al.
(2016). The expression patterns of DE transcripts originating from these chromosomes are
reported in Figures 2.21 and 2.22.
Particular focus was given to induced transcripts encoded by putative resistance genes.
However, no DE transcripts originating from chromosome 4D or 6A encoded putative ABC
transporters, START kinases or hexose transporters.
A single NB-LRR protein encoding transcript (4DS_361408_AA1167400.1) originating from
chromosome 4D was found to be induced in W1406. Another transcript
(4DS_361408_AA1167390.1), encoding an uncharacterised protein, was not detected by NB-
LRR analysis but showed homology to a putative disease resistance RPP13-like protein 2
isoform X1. Both these putative disease resistance genes were shared with W6979, thereby
excluding these transcripts. Other DE transcripts that were induced and may be linked to the
defence response included beta-galactosidases, a flavin-containing monooxygenase and non-
specific lipid-transfer proteins.
Four NB-LRR protein encoding transcripts originating from chromosome 6A were unique to
W6979, but only two were induced (6AL_472855_AA1526610.1 and
6AL_471511_AA1510160.1). These two transcripts encoded proteins with homology to a
putative disease resistance RPP13-like protein 3 and Sr13 respectively. Other induced
transcripts to be noted encoded an uncharacterised protein (6AL_472536_AA1523250.1)
with homology to a chitin elicitor receptor kinase 1 and another
(6AS_488347_AA1575210.1) with homology to a leucine-rich repeat receptor-like protein
kinase. One characterised transcript (6AS_485239_AA1541390.1) encoded a
serine/threonine-protein kinase.

182
Figure 6.21: Differentially expressed wheat transcripts in the W1406 line in comparison to
the 37-07 line located on chromosome 4D. Chromosome positions were based on the Centre
for Genome Analysis Chinese Spring wheat genome hosted by Ensembl. Transcript
descriptions were derived from Ensembl. Log2 fold change (FC) values for differentially
expressed transcripts are reported for each time point at days post inoculation (dpi).

183
Figure 6.22: Differentially expressed wheat transcripts in the W6979 line in comparison to
the 37-07 line located located on chromosome 6A. Chromosome positions were based on the
Centre for Genome Analysis Chinese Spring wheat genome hosted by Ensembl. Transcript
descriptions were derived from Ensembl. Log2 fold change (FC) values for differentially
expressed transcripts are reported for each time point at days post inoculation (dpi).

184
6.3.3.2.2 Differentially expressed Puccinia graminis f. sp. tritici transcripts
The line vs line comparison delivered few DE Pgt transcripts. In the W1406 dataset, a total of
1743 DE transcripts were identified, but only two of these were Pgt transcripts. A total of
1458 transcripts were DE in the W6979 dataset, of which 26 were Pgt transcripts. Pgt
transcripts therefore constituted 0.11% (W1406) and 1.78% (W6979) of the total DE
transcripts. No DE Pgt transcripts were shared between lines. The expression of Pgt
transcripts over the course of infection are reported in Supplementary Tables S22 and S23
and the Ensembl identities in Supplementary Tables S24 and S25. The majority of DE Pgt
transcripts were repressed at the tested time points in both APR lines for the line vs line
comparison.
The two DE transcripts from W1406 encoded uncharacterised proteins and neither were
predicted to be effectors (Supplementary Table S26). In W6979, DE transcripts included one
coding for a ribose-phosphate pyrophosphokinase and another for an inosine-5'-
monophosphate dehydrogenase. Five putative effectors were predicted from the W6979
dataset (Supplementary Table S27), and all have been previously identified in the time vs
time comparison. Four of the putative effector transcripts encoded uncharacterised proteins
while the fifth encoded a TdcF protein, predicted to be localised to the host chloroplast and
mitochondrion.

185
6.4 Discussion
The transcriptomic analysis of Pgt-inoculated adult wheat lines presented here gave a number
of valuable technical insights into the analysis of RNA-seq data. Mapping to a combined
wheat and Pgt reference transcriptome aimed to distinguish different transcripts or isoforms
that are products of alternative gene splicing. Such a transcript-based approach to differential
expression has been encouraged over a union exons-based approach (Zhao et al., 2015). The
latter collapses transcripts into their respective genes, while the former assigns expression
values to each transcript. In the current study, changes in transcript levels were thus
presented.
As far as we know, the current comparison of the Illumina and Ion Torrent sequencing
platforms was the first for wheat. The DE transcripts from the Ion Torrent subset identified
the same transcripts as the Illumina dataset, except for four transcripts found only in the
Illumina dataset. The identification of 433 DE transcripts unique to the Ion Torrent subset
may be attributed to the higher number of reads in those libraries. As the number of reads in a
library increases, the number of reads mapping to any transcript increases, providing
improved resolution. An increased number of reads also increases the probability of low copy
transcripts being sequenced. Though the Ion Torrent platform had a lower percentage of
mapped reads, in terms of absolute number of reads mapped (42.8 vs 24.4 million), the Ion
Torrent subset had more mapping reads than the Illumina dataset. For the DE transcripts
identified by each sequencing platform, similar relationships between samples were shown by
PCA. The same time points from both the Ion Torrent subset and Illumina dataset clustered
together, while the two time points (1 and 3 dpi) were distinct from each other, indicating
altered gene expression patterns over the course of infection.
For the 97 shared DE transcripts, the Illumina dataset and Ion Torrent subset clustered
separately, indicating that the data from these platforms cannot be statistically combined,
most likely due to the difference in number of reads in the Ion Torrent libraries. As the
number of reads increases, the number of reads mapping to sequences in a reference library
also increases, which will lead to a higher read count. Log2 transformation aims to normalise
read counts but the Ion Torrent subset and Illumina dataset still clustered separately.
However, the relationship between the samples for a given sequencing platform corresponded
well for the 97 shared DE transcripts. Ion Torrent platform was however selected for further

186
experimentation because of the higher number of reads in the generated libraries and
potential to thus identify more DE transcripts.
The two distinct pairwise comparisons used in the current study aimed to address two
different biological questions. Firstly, to what extent does gene expression change in wheat
over time following inoculation with Pgt? This was addressed by the time vs time
comparison. Secondly, how does gene expression alter in wheat lines conferring APR to Pgt
compared to a Pgt susceptible wheat line? This in turn was addressed by line vs line
comparison. The line vs line comparison identified the largest number of DE transcripts, the
majority of which were from wheat. For the time vs time comparison, fewer DE transcripts
were identified, but the proportion of Pgt transcripts was far greater. The lowest percentage
of Pgt transcripts within a sampled line was 16.5%, while the highest percentage in the line
vs line comparison was a mere 1.78%.
The pairwise comparison of samples therefore must take into consideration the biological
question asked. The time vs time comparison avoided genetic differences between wheat
lines and purely looked for DE transcripts within a line caused by Pgt inoculation. Although
no major morphological changes were seen in the flag leaf sheath during the 3 day period
under consideration, substantial molecular changes were occurring in response to Pgt
inoculation, as seen by the DE transcripts.
Although the three wheat lines shared similarities in some features of their response to Pgt
infection, the DE transcripts differed noticeably, as did expression patterns. In 37-07 and
W1406, the majority of wheat transcripts were induced at 3 dpi, but at 1 dpi in W6979. It
may be hypothesised that the earlier response in W6979 led to a quantifiably superior APR
response as compared to W1406. This hypothesis was supported by adult plant infection
responses at 14 dpi (Chapter 3; Table 3.5), colony sises at 5 dpi (Chapter 4; Figure 4.22) and
fungal biomass accumulation at 10 dpi (Chapter 5; Figures 5.1 and 5.6) that all indicated that
W6979 inhibited Pgt development more than W1406. However, it is important to note that
W1406 also had transcripts induced at 1 dpi.
Taking the expression of peroxidase encoding transcripts as a general characteristic of the
defence response, it appeared that an earlier induction at 1 dpi of peroxidases added a benefit
to the APR lines. The expression pattern of peroxidase encoding transcripts was maintained
over the course of infection in W1406, but was transient in W6979, with the expression
pronounced at 1 dpi. In the susceptible 37-07 line, peroxidase encoding transcripts were
187
absent at 1 dpi and were only induced at 3 dpi. It remains to be seen if a maintained or
transient expression profile was more beneficial as a defence response against Pgt, even
though the APR response in W6979 was superior to W1406.
The induction peroxidase encoding transcripts appeared to be a common feature of the APR
response of wheat to Puccinia spp. with the W6979 line showing a transient induction. The
induction of PRA2 and PR9 (encoding peroxidases) at 6 hpi has also been found by RT-qPCR
in the APR line Toropi upon infection with Pt (Casassola et al., 2015). However, at 12 hpi,
gene expression returned to basal levels and remained so until 3 dpi. The APR response in
Toropi therefore includes the induction of peroxidase encoding transcripts as a pre-haustorial
defence mechanism. Huang et al. (2013) showed that the expression of peroxidase encoding
transcripts in the APR cultivar Xingzi 9104 infected with Pst is highly induced at 1 dpi, but
steadily decreases thereafter.
The Yr36 APR gene corresponds to the Wheat Kinase START1 (WKS1) gene which encoded a
protein kinase shown to phosphorylate and thus inactivate thylakoid associated peroxidases
(Gou et al., 2015). Reduced peroxidase activity in the chloroplast leads to the accumulation
of H2O2 that was hypothesised to lead to a hypersensitive response (HR) to Pst. Though such
a mechanism was not confirmed in the current study it may likewise be hypothesised that a
repressed expression of peroxidase encoding transcripts in W6979, and subsequent decreased
enzymatic activity, may also lead to the HR.
In the time vs time comparison, the number of DE Pgt transcripts showed a marked
difference between the lines. Fewer Pgt transcripts in W1406 and W6979 appeared to mirror
the adult plant infection responses (Chapter 3; Table 3.5), Pgt colony sizes (Chapter 4; Figure
4.22), fungal biomass accumulation (Chapter 5; Figures 5.1 and 5.6) and haustorium
formation (Chapter 5; Figure 5.6). It may be hypothesised that the increase in Pgt biomass
over the course of infection contributed to the differences in copy number of Pgt transcripts
and thereby presents a quantifiable induction of transcripts. However, all of the techniques
used in previous chapters could only distinguish the development of Pgt on the wheat lines at
5 dpi and were ineffective at 1 and 3 dpi. RNA-seq may be a more sensitive technique to
detect changes in transcript levels due to changes in fungal biomass. However, in Pst, as
infection proceeded the percentage of mapped fungal reads increased over time, but only
significantly from 5 dpi onwards (Dobon et al., 2016).

188
The limitations of the RT-qPCR markers used in Chapter 5 at early time points were
confirmed in the RNA-seq results. The marker for β-tubulin, EFP86248 (encoded by
PGTG_12204), was not DE at any time point, in any line. The marker for haustorium
formation, EFP85149 (encoded by PGTG_11318) was DE in 37-07 and W6979 at 1 and 3
dpi, but not at any time points in W1406. The RT-qPCR analysis of these transcripts were
only informative at 10 and 5 dpi respectively, but not at the earlier time points. The 25 DE
Pgt transcripts shared by the lines may however be considered in the search for other RT-
qPCR markers that may allow for routine quantification of Pgt on wheat at earlier time
points.
The number of DE Pgt transcripts in all three wheat lines was proportionally large in relation
to the number of wheat DE genes. Over the course of infection Pgt was undergoing
developmental changes as infection structures differentiated (Chapter 4). The time vs time
comparison therefore reflects Pgt development over the course of infection.
The induction of a Pgt transcript encoding a superoxide dismutase may indicate that the
pathogen is counteracting the oxidative burst of the host. Lanfranco et al. (2005) proposed
such a mechanism whereby fungal superoxide dismutases may scavenge host O2-. Previously,
a proteome analysis identified a superoxide dismutase induced in Pt during the infection of
wheat (Song et al., 2011). Moreover, in 37-07 another superoxide dismutase encoding
transcript was induced and classified as a putative effector localised to the host mitochondria.
Superoxide dismutases have previously been confirmed as encoded by a number of putative
Pgt effector genes (Sperschneider et al., 2014). Pgt may therefore export superoxide
dismutases to the host to directly scavenge O2-. The induction of a transcript encoding a
putative superoxide dismutase effector unique to 37-07 may indicate the contribution of this
effector to wheat susceptibility in this line. This effect however needs to be investigated
further.
The line vs line comparison highlighted the considerable genetic differences between 37-07
and the two APR lines. Far more DE wheat transcripts were identified in this comparison,
than the time vs time comparison. The uniform induction or repression of transcripts over the
course of infection may indicate genes present in one line but absent in the other.
Within the identified NB-LRR protein encoding transcripts, the CC-NB-LRR subclass
dominated. As previously reported by Pan et al. (2000) and Bai et al. (2002), the TIR-NB-
LRR subclass appears to be absent in cereals. The TIR-NB-LRR subclass was also absent in

189
the current study. However, Peng and Yang (2017) have recently found nine putative TIR-
NB-LRR proteins in wheat. The chromosomal distribution of 1117 NB-LRR proteins showed
the largest numbers on chromosomes 6B, 4A, 7D, 7A and 1B. This differed from the
chromosomal distribution of the W1406 and W6979 lines (except for the prominence of 1B
in the latter line). Furthermore, the two APR lines differed from one another, except for the
prominence of 2B in both.
The prediction of NB-LRR encoding transcripts identified a number of candidate resistance
genes for further investigation. However, the current understanding of durable APR genes in
particular indicates diverse functions that may exclude NB-LRR proteins. For that purposes,
ABC transporters, START kinases and hexose transporters were investigated within the DE
transcripts. These protein products have previously been shown to be encoded by APR genes.
Peng and Yang (2017) identified 526 ABC transporters and 114 START kinases in wheat. In
the current study, 12 putative ABC transporter and 25 putative START kinase encoding
transcripts were DE in one or the other line. No putative hexose transporter encoding
transcripts were identified. Only two of these transcripts, both encoded by the
2DS_177216_AA0569300 gene, may be linked to the same chromosome as a minor QTL
(QSr.ufs-2D) identified by Prins et al. (2016) in W6979. These two transcripts originated
from chromosome 2D and encoded putative ABC transporters that may be further
investigated.
To broaden the search for resistance genes in the APR lines and in an attempt to link DE
transcripts to QTL locations, the transcripts originating from chromosome 4D for W1406 and
6A for W6979 were further investigated. The respective chromosomes are the location of two
QTL, QSr.ufs-4D and QSr.ufs-6A, identified by Prins et al. (2016) with the largest
contribution of the APR response in W1406 and W6979 respectively.
DE transcripts from chromosome 4D could not be linked to any known resistance genes or
functional resistance domains. The Sr55 (Lr67/Yr46/Pm46) gene was previously mapped to
chromosome 4D (Hiebert et al., 2010). The identification of a QTL in W1406 on
chromosome 4D by Prins et al. (2016) draws particular attention to the Sr55 locus. However,
in the current study the Ensemble accession 4DL_343575_AA1136830.2 (Genbank
accession: ALL26331.2) corresponding to Sr55 was not detected as DE in W1406. Further
fine mapping of QSr.ufs-4D will however ultimately exclude or confirm whether it is the
Sr55 QTL.

190
A number of DE transcripts from chromosome 6A could putatively be linked to known
resistance genes or functional resistance domains. The consensus map of Yu et al. (2014) for
stem rust resistance loci reports five QTL and three designated Sr genes (Sr13, Sr26 and
Sr52) on chromosome 6A. The DE transcript 6AL_471511_AA1510160.1 has high
homology with Sr13 (Genbank accession: KY825229.1; Zhang et al., 2017). Sr13 has been
mapped to the long arm of chromosome 6A (McIntosh, 1972). However, Prins et al. (2016)
mapped QSr.ufs-6A in W6979 to the short-arm of chromosome 6A. Also, PTKST is avirulent
on seedlings in the presence of Sr13 (Pretorius et al., 2010), while this Pgt race was virulent
on W6979 seedlings (Chapter 3; Figure 3.2). Sr13 is therefore not contributing to the APR
response in W6979. Attention was therefore focussed on the short-arm of chromosome 6A.
Three candidate transcripts from 6AS, encoding a chitin elicitor receptor kinase 1, a probable
leucine-rich repeat receptor-like protein kinase and a serine/threonine-protein kinase, could
be potential candidates for QSr.ufs-6A.
Linking DE transcripts to chromosomal locations gave only limited insight into the potential
genes underlying the QTL for APR. In the current study, Lr34 (Yr18/Sr57) will serve as an
example of a characterised gene with known chromosomal location. Prins et al. (2016)
confirmed that Lr34 contributed to the APR response in both W1406 and W6979. This
resistance gene encoded the Ensemble accession 7DS_621754_AA2025300.1. However, this
transcript was not DE in any data comparisons. The potential cause for the absence of Lr34
highlights important considerations when applying gene expression data to QTL analysis.
The expression level of Lr34 may be either too low or biologically variable to be considered
as DE within the current statistical parameters. This limitation is inherent to the statistical
analysis of RNA-seq data and complicated linking of expression profiles to QTL locations.
To significantly link expression profiles of DE transcripts to QTL, an expression QTL
(eQTL) analysis is required. An eQTL analysis combines transcriptomic analysis using
microarrays or RNA-seq, with mapping of a QTL in a segregating population (Hansen et al.,
2008). The technique has been used on near-isogenic barley lines to identify candidate genes
for partial resistance to P. hordei (Chen et al., 2010). Near-isogenic lines are often not
available and recombinant inbred lines, doubled haploid (DH) or back cross populations may
be used. The resolution of any eQTL analysis, however, increases with the size of the
population which will accordingly increase the size of trials required. Such an analysis often
only considers variation in two alleles at a time, and must be well supported by genotypic and
phenotypic data (Ballini et al., 2013). Keeping these considerations in mind, an eQTL

191
analysis may potentially be undertaken on the DH populations for W1406 and W6979
generated by Prins et al. (2016).
PTKST was used for the inoculation of all lines, so DE Pgt transcripts in the line vs line
comparison cannot be attributed to genetic differences in Pgt. As previously noted,
histological observations showed no clear differences in the development of Pgt infection
structures at any time point up to 3 dpi (Chapter 4). It is thus deduced that for this reason the
line vs line comparison showed substantially less DE Pgt transcripts. Most of DE Pgt
transcripts were repressed which may indicate that the APR lines are inhibiting Pgt
development. Lines could not be distinguished at any given time point up to 3 dpi by biomass
quantification (Chapter 5; Figures 5.1 and 5.6) but RNA-seq may be a more sensitive
technique to detect differences in Pgt gene expression at these time points. The line vs line
comparison was therefore only of minimal use. Most features of the DE Pgt transcripts were
already observed in the time vs time comparison, including all of the putative effector
encoding transcripts.
The two approaches to DE transcript analysis implemented in the current study gave insights
into the adult wheat-Pgt interaction. The time vs time comparison was required to accurately
describe transcriptional changes in the wheat lines in response to Pgt over the course of
infection. The comparison also gave insight into Pgt development and especially the effector
repertoire of the pathogen. The line vs line comparison was required to describe the genetic
differences that underpin the APR in the respective wheat lines and was the only approach
that effectively allowed putative resistance genes to be discovered. Both of these approaches
were therefore required to completely describe the interaction. In wheat a large number of
NB-LRR protein encoding transcripts were identified along with some candidate genes
showing homology to previously described APR genes that warrant further study. In Pgt a
number of putative effector encoding transcripts were also found that warrant future testing.
An overview of the APR response in the W1406 and W6979 lines highlighted a number of
important considerations. The expression of some transcripts at either 1 or 3 dpi may indicate
that these time points define two distinct phases of the APR response. Based on histological
observation made in Chapter 3, Pgt haustoria were assumed to have formed at 1 dpi in adult
wheat plants. The APR response presented here therefore indicates a post-haustorial defence
response. However, time points earlier than 1 dpi may help identify a pre-haustorial defence
if it exists. DE transcripts indicated that the oxidative burst and HR may be induced in the

192
APR lines. Histological studies of cell death and the accumulation of reactive oxygen species
(ROS) such as H2O2 and O2- in association with Pgt infection sites should be undertaken.
Cellular peroxidase activity and ROS levels should likewise be investigated. The
confirmation of these defence response may further elucidate the APR response in wheat to
Pgt infection.
193
Chapter 7: Conclusions

194
The current study used various methods to investigate Puccinia graminis f. sp. tritici (Pgt)
infection of the two wheat lines W1406 and W6979, both of which express stem rust adult
plant resistance (APR). By comparing these lines to the susceptible control 37-07 line, a
number of key insights were made regarding Pgt development on adult wheat plants, the
APR response in general, and APR response in W1406 and W6979 in particular.
Six adult plant wheat trails were completed under greenhouse conditions and a number of
different wheat lines, entries and/or cultivars were successfully evaluated. Adult wheat plants
were inoculated with the Pgt race PTKST according to the method developed by Pretorius et
al. (2007) and modified by Bender et al. (2016). The method reproducibly delivered Pgt-
inoculated adult wheat plants for sampling. Phenotypic scoring of Pgt infection on adult
wheat plants is typically done on the flag leaf sheath of the last internode (Roelfs et al.,
1992). The sampling of Pgt-inoculated flag leaf sheaths was thus a fundamental paradigm of
the current study.
Four adult plant wheat trails included the 37-07, W1406 and W6979 lines, that were the main
focus of the current study. W1406 and W6979 were susceptible as seedlings to Pgt race
PTKST, but showed partial resistance in the adult plant trials, confirming the report of Prins
et al. (2016). Based on phenotypic scores at 14 dpi, W6979 was more effective at restricting
Pgt development in three trials, but was scored similar to W1406 in one trial. Results
contradicted the field observations of Prins et al. (2016) which scored similar levels of stem
rust infection on W1406 and W6979, except at one location. Results of Soko et al. (2018),
however, indicated W6979 as more susceptible. It appears that the stem rust APR in W1406
and W6979 may be influenced by environmental conditions, a common feature of APR.
Histological observations allowed the development of Pgt to be effectively followed over the
course of infection on the flag leaf sheaths of adult wheat plants. Scanning electron
microscopy (SEM) and fluorescence microscopy (based on the method of Ayliffe et al.,
2011) were used to observe Pgt development. SEM in particular gave insight into the early
development (2 dpi or earlier) of Pgt. Epidermal observations indicated that directional
growth of germ tubes may not be a feature of Pgt development on flag leaf sheaths. Sub-
epidermal observations showed the rapid differentiation of the first haustorial mother cell
(HMC) from the sub-stomatal vesicle, with no clear primary infection hyphae, all occurring
within the sub-stomatal chamber of the host. Since both these findings appear to contradict
common assumptions regarding Puccinia spp. development it should be further investigated.

195
Fluorescence microscopy was used to follow Pgt development over the course of the
infection process up to 10 dpi. All Pgt infection structures could be observed, except for
haustoria. However, the formation of HMCs is a good indication of the subsequent formation
of haustoria, and indicated that the biotrophic relationship was potentially established at 1
dpi, but definitely by 2 dpi. Further optimization is required to improve the processing of
inoculated flag leaf sheaths of adult wheat plants, to allow the observation of haustoria.
The histological approach allowed colony size to be monitored as part of the APR response.
At 5 dpi, Pgt had produced significantly smaller colonies on both W1406 and W6979
compared to those found on 37-07. This directly parallels the observed phenotypic scoring
seen at 14 dpi in the greenhouse experiments. However, no quantifiable effect on Pgt
development could be seen at earlier time points. The inhibition of Pgt development at 5 dpi
was the first visual indication of a putative post-haustorial defence response in the APR lines.
The fluorescence-based method described by Ayliffe et al. (2013) proved appropriate to the
examination of Pgt biomass accumulation, and the current study was one of the first to apply
this method to flag leaf sheaths of adult wheat plants. The method could distinguish the wheat
lines at 5 and 10 dpi, but not at any earlier time points. The results directly supported the
fluorescence microscopy observations that showed significantly smaller colony sizes in
W1406 and W6979 at 5 dpi, compared to 37-07.
Before reverse transcriptase quantitative polymerase chain reaction (RT-qPCR)-based
methods were applied to the Pgt-inoculated wheat lines, reference gene validation was
undertaken. Though stable reference genes were previously reported by Scholtz and Visser
(2013) in a study of Pgt-inoculated near-isogenic wheat seedlings, the current study was the
first to apply this method to a range of Pgt-inoculated adult wheat lines and cultivars. The
expression of the 18S ribosomal RNA (Ta-18S), cell division control protein (Ta-CDC) and
transcription elongation factor 1 alpha (Ta-TEF) genes proved stable over the course of
infection and may be considered for future RT-qPCR studies.
The relative expression of the Pgt β-tubulin (Pgt-BTUB) gene, as described by Coram et al.
(2008), was successfully used to follow biomass accumulation. This study was one of the first
to apply this method to Pgt-inoculated flag leaf sheaths of adult wheat plants. The method
distinguished APR lines, entries and/or cultivars from the susceptible 37-07 line at 5 and 10
dpi, but not at any earlier time points. Relative Pgt-BTUB transcript accumulation in the
susceptible 37-07 line fitted an exponential growth equation in most trials, thereby indicating

196
a rapid increase of Pgt biomass, particularly between 5 and 10 dpi. For future implementation
of this method to monitor Pgt development in APR wheat lines, time points after 5 dpi were
recommended, and 10 dpi appeared to be the most appropriate choice.
The deductions made using the relative expression of Pgt-BTUB are generally supported by
the fluorescence-based method for biomass accumulation. It is important to note that both
these methods only infer total Pgt biomass and do so by different proxies. The pattern of
biomass accumulation resolved by the two methods appears different over the course of
infection, but important comparisons are possible. Both methods show an increase in biomass
over the course of infection, increasing rapidly from 5 dpi onwards and allowing the APR
lines to be clearly distinguished at 10 dpi. These therefore methods have equal application in
future research.
The PGTG_11318 gene, encoding an uncharacterised protein, was previously linked to
haustorium formation (Broeker et al., 2006; Duplessis et al., 2011) and the relative
expression of this gene was used to infer Pgt haustorium formation in adult wheat plants. The
method was advantageous, as haustoria could not be observed by the histological techniques
used. The method could also distinguish APR lines, entries and/or cultivars from the
susceptible 37-07 line at 5 dpi, but not at any earlier or later time points. The W1406 and
W6979 lines showed a significant difference from the 37-07 line at 5 dpi. The relative
transcription of PGTG_11318 indicated a rapid increase in haustoria from 0 to 5 dpi,
paralleling biomass accumulation, but a decrease from 5 to 10 dpi. PGTG_11318 expression
in the susceptible 37-07 line fitted a Gaussian equation in all trials, and indicated 5 to 7 dpi as
time interval whereby Pgt haustoria formation peaks relative to total Pgt biomass. This time
interval should be considered for any future investigations that focus on Pgt haustoria in adult
wheat plants. The pattern of PGTG_11318 expression appeared to separate Pgt development
into three distinct phases: establishment, proliferation (with an increase in haustoria
formation) and sporulation.
Methods used for the determination of colony size, biomass accumulation and haustorium
formation were objective techniques used to support the phenotypic classification of stem rust
APR in adult wheat lines. These methods all ranked the wheat lines identically, either at 5 or
10 dpi. W1406 and W6979 showed less Pgt development than the 37-07 line, while W1406
was intermediate between 37-07 and W6979. These measurements supported the phenotypic
scoring of the adult plant infection response and confirm the expression of an APR response

197
in W1406 and W6979. Results indicated that by 5 dpi the APR response effectively restricted
Pgt development. This prompted the selection of time points 0, 1 and 3 dpi for RNA-
sequencing (RNA-seq) analysis.
A sequencing platform comparison was undertaken, comparing the Illumina HiSeq 2000TM
and Ion Torrent ProtonTM
platforms. To the best of our knowledge, the current study is the
first report of such a comparison in wheat. The majority of differentially expressed (DE)
transcripts identified from reads generated by the Illumina platform were also identified from
reads generated by the Ion Torrent platform. However, the higher number of reads generated
by the Ion Torrent datasets resulted in a greater number of DE transcripts. The Ion Torrent
platform was therefore selected for RNA-seq analysis.
The RNA-seq analysis of Pgt infection in wheat genotypes expressing APR to stem rust is
one of the first reported, especially considering that inoculated flag leaf sheaths from adult
wheat plants were used. Two comparative approaches were implemented: a pairwise
comparison of either time points or wheat lines. The time vs time comparison identified DE
transcripts in the wheat lines over the course of Pgt infection, but also changes in Pgt
transcripts through development of the pathogen. Pgt transcripts encoding putative effectors
were also identified. DE transcripts identified in the line vs line comparison were deduced to
be based on genetic differences between lines, and identified a number of transcripts encoded
by APR candidate genes. However, only limited success was obtained with linking candidate
transcripts to the chromosomal positions of the quantitative trait loci (QTL) identified by
Prins et al. (2016).
In the time vs time comparison the DE wheat transcripts were unique to the respective wheat
lines. The APR lines not only differed from the susceptible control line, 37-07, but also from
each other. Although the APR responses may share common features, they appear to be
contributed by entirely different transcripts in W1406 and W6979.
The DE wheat transcripts indicated the oxidative burst as a common feature of Pgt infected
adult wheat plants. The induction of the oxidative burst occurred as early as 1 dpi in W1406
and W6979, and may be essential for the establishment of the APR response in these lines.
This highlights the effectiveness of RNA-seq in identifying putative effects not observed by
microscopic techniques, and indicates other avenues that require further investigation. The
accumulation of reactive oxygen species in close association with infection sites may validate
the presence of the oxidative burst. The hypersensitive response in wheat cells should

198
likewise be confirmed. Improved methods for the histological study of Pgt-inoculated flag
leaf sheaths are therefore required.
The investigated wheat lines showed that the nature of the response to Pgt inoculation also
differed in its distribution over time. Transcripts may be DE at either of the investigated time
points (1 and 3 dpi), over the course of infection, but appeared to form part of two distinct
phases in the APR responses in W1406 and W6979. The majority of DE transcripts in W1406
were induced at 3 dpi, but in W6979 most of the DE transcripts were induced transiently at 1
dpi. Whether at 1 or 3 dpi, the DE transcripts in W1406 and W6979 indicated an APR
response that restricted Pgt development. The induction of transcripts at 1 dpi may indicate a
pre-haustorial defence mechanism. However, histological observation of HMC formation at 1
dpi implied associated haustorium formation. Until haustorium formation is directly observed
and gene expression changes earlier than 1 dpi are measured, a pre-haustorial defence
mechanism cannot be confirmed. A pre-haustorial defence mechanism may also be induced
at some infection points but not others, another avenue for further investigation. Considering
the current gene expression patterns, the presence of a post-haustorial defence mechanism is
most likely present in both APR lines.
In summary, it is considered that upon inoculation with Pgt, the W1406 and W6979 wheat
lines confer an APR response that involves primarily post-haustorial defence mechanisms,
restricting the growth of colonies. Two distinct phases of the APR response were observed, at
1 and 3 dpi in the two APR lines, the former being particularly associated with W6979 and
the latter with W1406. It was hypothesised that this APR response limits Pgt development
and results in quantifiable inhibition of Pgt development from 5 dpi onwards. W6979
inhibited the Pgt infection process more intensely than W1406, indicating that the induction
of an earlier defence mechanisms at 1 dpi may have made a contribution to the stronger APR
response in W6979. The inhibition of Pgt development by the APR responses eventually
leads to phenotypically observable adult plant infection responses in W1406 and W6979. The
current study therefore delivered a multifaceted description of the APR in W1406 and
W6979, and gave insights into the defence response based on multiple QTL that additively
contribute to resistance. Findings contributed to a broader understanding of the APR response
in wheat and its effects on Pgt development.

199
References

200
Acevedo, M, Jackson, EW, Sturbaum, A, Ohm, HW and Bonman, JM. 2010. An improved
method to quantify Puccinia coronata f. sp. avenae DNA in the host Avena sativa. Canadian
Journal of Plant Pathology 32 (2): 215-224.
Andolfo, G, Jupe, F, Witek, K, Etherington, GJ, Ercolano, MR and Jones, JDG. 2014.
Defining the full tomato NB-LRR resistance gene repertoire using genomic and cDNA
RenSeq. BMC Plant Biology 14: 120.
Anguelova-Merhar, VS, Van der Westhuizen, AJ and Pretorius, ZA. 2001. β-1,3-Glucanase
and chitinase activities and the resistance response of wheat to leaf rust. Journal of
Phytopathology 149: 381-384.
Atienza, SG, Jafary, H and Niks, RE. 2004. Accumulation of genes for susceptibility to rust
fungi for which barley is nearly a nonhost results in two barley lines with extreme multiple
susceptibility. Planta 220 (1): 71-79.
Axtell, MJ and Staskawicz, BJ. 2003a. Initiation of RPS2-specified disease resistance in
Arabidopsis is coupled to the AvrRpt2-Directed Elimination of RIN4. Cell 112: 369-377.
Axtell, MJ, Chisholm, ST, Dahlbeck, D and Staskawicz, BJ. 2003b. Genetic and molecular
evidence that the Pseudomonas syringae type III effector protein AvrRpt2 is a cysteine
protease. Molecular Microbiology 49 (6): 1537-1546.
Ayliffe, M, Devilla, R, Mago, R, White, R, Talbot, M, Pryor A and Leung H. 2011. Nonhost
resistance of rice to rust pathogens. Molecular Plant-Microbe Interactions 24 (10): 1143-
1155.
Ayliffe, M, Periyannan, SK, Feechan, A, Dry, I, Schumann, U, Wang, M, Pryor, A and
Lagudah, E. 2013. A simple method for comparing fungal biomass in infected plant tissues.
Molecular Plant-Microbe Interactions 26 (6): 658-667.
Bai, J, Pennill, LA, Ning, J, Lee, SW, Ramalingam, J, Webb, CA, Zhao, B, Sun, Q, Nelson,
JC, Leach, JE and Hulbert, SH. 2002. Diversity in nucleotide binding site-leucine-rich repeat
genes in cereals. Genome Research 12 (12): 1871-1884.
Bailey, TL, Boden, M, Buske, FA, Frith, M, Grant, CE, Clementi, L, Ren, J, Li, WW and
Noble, WS. 2009. MEME SUITE: Tools for motif discovery and searching. Nucleic Acids
Research 37 (supplement 2): W202-W208.

201
Bajgain, P, Rouse, MN, Tsilo, TJ, Macharia, GK, Bhavani, S, Jin, Y and Anderson, JA. 2016.
Nested association mapping of stem rust resistance in wheat using genotyping by sequencing.
PLOS ONE 11 (5): e0155760.
Ballini, E, Lauter, N and Wise, R. 2013. Prospects for advancing defense to cereal rusts
through genetical genomics. Frontiers in Plant Science 4: 117.
Barber MS and Ride JP. 1994. Levels of elicitor-active β (1-4) linked N-acetyl-D-
glucosamine oligosaccharides in the lignifying tissue of wheat. Physiological and Molecular
Plant Pathology 45: 37-45.
Baum, BR and Savile, DB. 1985. Rusts (Uredinales) of Triticeae: Evolution and extent of
coevolution, a cladistic analysis. Botanical journal of the Linnean Society 91 (3): 367-394.
Beckett, A, Tatnell, JA and Taylor, N. 1990. Adhesion and pre-invasion behaviour of
urediniospores of Uromyces viciae-fabae during germination on host and synthetic surfaces.
Mycological Research 94 (7): 865-875.
Belkhadir, Y, Nimchuk, Z, Hubert, DA, Mackey, D and Dangl, JL. 2004. Arabidopsis RIN4
negatively regulates disease resistance mediated by RPS2 and RPM1 downstream or
independent of the NDR1 signal modulator and is not required for the virulence functions of
bacterial type III effectors AvrRpt2 or AvrRpm1. The Plant Cell 16: 2822-2835.
Bender, CM, Prins, R and Pretorius, ZA. 2016. Development of a greenhouse screening
method for adult plant response in wheat to stem rust. Plant Disease 100 (8): 1627-1633.
Bettgenhaeuser, J, Gilbert, B, Ayliffe, M and Moscou, MJ. 2014. Nonhost resistance to rust
pathogens-a continuation of continua. Frontiers in plant science 5: 664.
Bhattacharya, S. 2017. Deadly new wheat disease threatens Europe's crops. Nature 542
(7640): 145-146.
Bozkurt, O, Unver, T and Akkaya, MS. 2007. Genes associated with resistance to wheat
yellow rust disease identified by differential display analysis. Physiological and Molecular
Plant Pathology 71(4-6): 251-259.
Bolton, MD, Kolmer, JA, Xu, WW and Garvin, DF. 2008. Lr34-mediated leaf rust resistance
in wheat: Transcript profiling reveals a high energetic demand supported by transient

202
recruitment of multiple metabolic pathways. Molecular Plant-Microbe Interactions 21 (12):
1515-1527.
Boyd, LA and Minchin, PN. 2001. Wheat mutants showing altered adult plant disease
resistance. Euphytica 122: 361-368.
Broeker, K, Bernard, F and Moerschbacher, BM. 2006. An EST library from Puccinia
graminis f. sp. tritici reveals genes potentially involved in fungal differentiation. Federation
of European Microbiological Societies Microbiology Letters 256: 273-281.
Browder, LE. 1971. Pathogenic specialization in cereal rust fungi, especially Puccinia
recondita f. sp. tritici: Concepts, methods of study and application. Technical Bulletin of the
United States Department of Agriculture 1432: 45.
Brown, GN. 1997. The inheritance and expression of leaf chlorosis associated with gene Sr2
for adult plant resistance to wheat stem rust. Euphytica 95 (1): 67-71.
Bruce, M, Neugebauer, KA, Joly, DL, Migeon, P, Cuomo, CA, Wang S, Akhunov, E,
Bakkeren, G, Kolmer JA and Fellers, JP. 2014. Using transcription of six Puccinia triticina
races to identify the effective secretome during infection of wheat. Frontiers in Plant Science
4: 520.
Brueggeman, R, Rostoks, N, Kudrna, D, Kilian, A, Han, F, Chen, J, Druka, A, Steffenson, B
and Kleinhofs, A. 2002. The barley stem rust-resistance gene Rpg1 is a novel disease-
resistance gene with homology to receptor kinases. Proceedings of the National Academy of
Sciences, USA 99 (14): 9328-9333.
Bustin, SA, Benes, V, Garson, JA, Hellemans, J, Huggett, J, Kubista, M, Mueller, R, Nolan,
T, Pfaffl, MW, Shipley, GL, Vandesompele, J and Wittwer, CT. 2009. The MIQE guidelines:
Minimum information for publication of quantitative real-time PCR experiments. Clinical
Chemistry 55 (4): 611-622.
Cantu, D, Govindarajulu, M, Kozik, A, Wang, M, Chen, X, Kojima, KK, Jurka, J,
Michelmore, RW and Dubcovsky, J. 2011. Next generation sequencing provides rapid access
to the genome of Puccinia striiformis f. sp. tritici, the causal agent of wheat stripe rust. PLOS
ONE 6 (8): e24230.

203
Cantu, D, Segovia, V, MacLean, D, Bayles, R, Chen, X, Kamoun, S, Dubcovsky, J,
Saunders, DGO and Uauy, C. 2013. Genome analyses of the wheat yellow (stripe) rust
pathogen Puccinia striiformis f. sp. tritici reveal polymorphic and haustorial expressed
secreted proteins as candidate effectors. BMC Genomics 14: 270.
Casassola, A, Brammer SP, Chaves MS, Martinelli JA, Stefanato F and Boyd LA. 2015.
Changes in gene expression profiles as they relate to the adult plant leaf rust resistance in the
wheat cv. Toropi. Physiological and Molecular Plant Pathology 89: 49-54.
Catanzariti, AM, Dodds PN, Lawrence, GJ, Ayliffe, MA and Ellis JG. 2006. Haustorially
expressed secreted proteins from flax rust are highly enriched for avirulence elicitors. Plant
Cell 18: 243-56.
Césari, S, Bernoux, M, Moncuquet, P, Kroj, T and Dodds, PN. 2014a. A novel conserved
mechanism for plant NLR protein pairs: The “integrated decoy” hypothesis. Frontiers in
Plant Science 5: 606.
Césari, S, Kanzaki, H, Fujiwara, T, Bernoux, M, Chalvon, V, Kawano, Y, Shimamoto, K,
Dodds, PN, Terauchi, R and KrojT. 2014b. The NB-LRR proteins RGA4 and RGA5 interact
functionally and physically to confer disease resistance. The European Molecular Biology
Organization Journal 33: 1941-1959.
Césari, S, Thilliez, G, Ribot, C, Chalvon, V, Michel, C, Jauneau, A, Rivas, S, Alaux, L,
Kanzaki, H, Okuyama, Y, Morel, J, Fournier, E, Tharreau, D, Terauchi, R and Thomas Kroja,
T. 2013. The rice resistance protein pair RGA4/RGA5 recognizes the Magnaporthe oryzae
effectors AVR-Pia and AVR1-CO39 by direct binding. Plant Cell 25: 1463-1481.
Chaturvedi, R, Krothapalli, K, Makandar, R, Nandi, A, Sparks, AA, Roth, MR, Welti, R and
Shah, J. 2008. Plastid ω3‐fatty acid desaturase‐dependent accumulation of a systemic
acquired resistance inducing activity in petiole exudates of Arabidopsis thaliana is
independent of jasmonic acid. The Plant Journal 54 (1): 106-117.
Chen, J, Upadhyaya, NM, Ortiz, D, Sperschneider, J, Li, F, Bouton, C, Breen, S, Dong, C,
Xu, B, Zhang, X, Mago, R, Newell, K, Xia, X, Bernoux, M, Taylor, JM, Steffenson, B, Jin,
Y, Zhang, P, Kanyuka, K, Figueroa, M, Ellis, JG, Park, RF, Peter N. Dodds, PN. 2017. Loss
of AvrSr50 by somatic exchange in stem rust leads to virulence for Sr50 resistance in wheat.
Science 358 (6370): 1607-1610.

204
Chen, X, Coram, T, Huang, X, Wang, M and Dolezal, A. 2013. Understanding molecular
mechanisms of durable and non-durable resistance to stripe rust in wheat using a
transcriptomics approach. Current Genomics 14 (2): 111-126.
Chen, X, Niks, RE, Hedley, PE, Morris, J, Druka, A, Marcel, TC, Vels, A and Waugh, R.
2010. Differential gene expression in nearly isogenic lines with QTL for partial resistance to
Puccinia hordei in barley. BMC Genomics 11 (1): 629.
Chen, X, Shi, T, Yang, J, Shi, W, Gao, X, Chen, D, Xu, X, Xu, J, Talbot, NJ and Peng, Y.
2014. N-glycosylation of effector proteins by an α-1,3-mannosyltransferase is required for the
rice blast fungus to evade host innate immunity. The Plant Cell 26: 1360-1376.
Chern, MS, Fitzgerald, HA, Yadav, RC, Canlas, PE, Dong, X and Ronald, PC. 2001.
Evidence for a disease‐resistance pathway in rice similar to the NPR1‐mediated signaling
pathway in Arabidopsis. The Plant Journal 27 (2): 101-113.
Chisholm, ST, Dahlbeck, D, Krishnamurthy, N, Day, B, Sjolander, K and Staskawicz, BJ.
2005. Molecular characterization of proteolytic cleavage sites of the Pseudomonas syringae
effector AvrRpt2. Proceedings of the National Academy of Sciences, USA 102 (6): 2087-
2092.
Chomczynski, P and Sacchi, N. 1987. Single-step method of RNA isolation by acid
guanidiniumthiocyanate-phenol-chloroform extraction. Analytical Biochemistry 162 (1): 156-
159.
Chong, J, Kang, Z, Kim, WK and Rohringer, R. 1992. Multinucleate condition of Puccinia
striiformis in colonies isolated from infected wheat leaves with macerating enzymes.
Canadian Journal of Botany 70 (1): 222-224.
Clarke, JM and Richards, RA. 1988. The effects of glaucousness, epicuticular wax, leaf age,
plant height, and growth environment on water loss rates of excised wheat leaves. Canadian
Journal of Botany 73: 961-967.
Clavijo, BJ, Venturini, L, Schudoma, C, Accinelli, GG, Kaithakottil, G, Wright, J, Borrill, P,
Kettleborough, G, Heavens, D, Chapman, H, Lipscombe, J, Barker, T, Lu, F, McKenzie, N,
Raats, D, Ramirez-Gonzalez, RH, Coince, A, Peel, N, Percival-Alwyn, L, Duncan, O,
Trösch, J, Yu, G, Bolser, DM, Namaati, G, Kerhornou, A, Spannagl, M, Gundlach, H,
Haberer, G, Davey, RP, Fosker, C, Di Palma, FM, Phillips, AL, Millar, AH, Kersey, PJ,

205
Uauy, C, Krasileva, KV, David Swarbreck, D, Bevan, MW and Clark, MD. 2017. An
improved assembly and annotation of the allohexaploid wheat genome identifies complete
families of agronomic genes and provides genomic evidence for chromosomal translocations.
Genome Research 27 (5): 885-896.
Clement, JA, Martin, SG, Porter, R, Butt, TM and Beckett, A. 1993. Germination and the role
of extracellular matrix in adhesion of urediniospores of Uromyces viciae-fabae to synthetic
surfaces. Mycological Research 97 (5): 585-593.
Clement, JA, Porter, R, Butt, TM and Beckett, A. 1994. The role of hydrophobicity in
attachment of urediniospores and sporelings of Uromyces viciae-fabae. Mycological
Research 98 (11): 1217-1228.
Colebrook, EH. 2010. The localisation of Pseudomonas-induced acquired resistance in
barley. PhD thesis. University of East Anglia, United Kingdom.
Colebrook, EH, Creissen, G, McGrann, GRD, Dreos, R, Lamb, C and Boyd, LA. 2012.
Broad-spectrum acquired resistance in barley induced by the Pseudomonas pathosystem
shares transcriptional components with Arabidopsis systemic acquired resistance. Molecular
Plant-Microbe Interactions 25 (5): 658-667.
Collins, NC, Niks, RE and P. Schulze-Lefert, P. 2007. Resistance to cereal rusts at the plant
cell wall—what can we learn from other host-pathogen systems? Australian Journal of
Agricultural Research 58: 476-489.
Collins, TJ, Moerschbacher, BM and Read, ND. 2001. Synergistic induction of wheat stem
rust appressoria by chemical and topographical signals. Physiological and Molecular Plant
Pathology 58: 259-266.
Conesa, A, Götz, S, García-Gómez, JM, Terol, J, Talón, M and Robles, M. 2005. Blast2GO:
A universal tool for annotation, visualization and analysis in functional genomics research.
Bioinformatics 21 (18): 3674-3676.
Coram, TE, Settles, ML and Chen, X. 2008. Transcriptome analysis of high‐temperature
adult‐plant resistance conditioned by Yr39 during the wheat-Puccinia striiformis f. sp. tritici
interaction. Molecular Plant Pathology 9 (4): 479-493.

206
Dangl, JL and Jones, JDG. 2001. Plant pathogens and integrated defence responses to
infection. Nature 411: 826-833.
Dawson, AM, Bettgenhaeuser, J, Gardiner, M, Green, P, Hernández-Pinzón, I, Hubbard, A
and Moscou, MJ. 2015. The development of quick, robust, quantitative phenotypic assays for
describing the host-nonhost landscape to stripe rust. Frontiers in Plant Science 6: 876.
Dawson, AM, Ferguson, JN, Gardiner, M, Green, P, Hubbard, A and Moscou, MJ. 2016.
Isolation and fine mapping of Rps6: An intermediate host resistance gene in barley to wheat
stripe rust. Theoretical and Applied Genetics 129 (4): 831-843.
Day, B, Dahlbeck, D, Huang, J, Chisholm, ST, Li, D and Staskawicz, BJ. 2005. Molecular
basis for the RIN4 negative regulation of RPS2 disease resistance. The Plant Cell 17: 1292-
1305.
Dean, R, Van Kan, JAL, Pretorius, ZA, Hammond-Kosack, KE, Di Pietro, A, Spanu, PD,
Rudd, JJ, Dickman, M, Kahmann, R, Ellis, J and Foster, GD. 2012. The top 10 fungal
pathogens in molecular plant pathology. Molecular Plant Pathology 13 (4): 414-430.
Deising, H, Nicholson, RL, Haug, M, Howard, RJ and Mendgen, K. 1992. Adhesion pad
formation and the involvement of cutinase and esterases in the attachment of uredospores to
the host cuticle. Plant Cell 4: 1101-1111.
Dempsey, DA and Klessig, DF. 2012. SOS - Too many signals for systemic acquired
resistance? Trends in Plant Science 17 (9): 538-545.
Deslandes, L, Olivier, J, Peeters, N, Feng, DX, Khounlotham, M, Boucher, C, Somssich, I,
Genin, S and Marco, Y. 2003. Physical interaction between RRS1-R, a protein conferring
resistance to bacterial wilt, and PopP2, a type III effector targeted to the plant nucleus.
Proceedings of the National Academy of Sciences, USA 100 (13): 8024-8029.
Dickinson, S. 1949. Studies in the physiology of obligate parasitism: II. The behaviour of the
germ-tubes of certain rusts in contact with various membranes. Annals of Botany 13 (50):
219-236.
Dixon, MS, Golstein, C, Thomas, CM, Van der Biezen, EA and Jones, JDG. 2000. Genetic
complexity of pathogen perception by plants: The example of Rcr3, a tomato gene required

207
specifically by Cf-2. Proceedings of the National Academy of Sciences, USA 97 (16): 8807-
8814.
Dobon, A, Bunting, DC, Cabrera-Quio, LE, Uauy, C and Saunders, DGO. 2016. The host-
pathogen interaction between wheat and yellow rust induces temporally coordinated waves of
gene expression. BMC Genomics 17 (1): 380.
Dodds, PN, Catanzariti, A, Lawrence, GJ and Ellis, JG. 2007. Avirulence proteins of rust
fungi: Penetrating the host-haustorium barrier. Australian Journal of Agricultural Research
58: 512-517.
Dodds, PN, Lawrence, GJ, Catanzariti, A, Teh, T, Wang, CA, Ayliffe, MA, Kobe, B and
Ellis, JG. 2006. Direct protein interaction underlies gene-for-gene specificity and coevolution
of the flax resistance genes and flax rust avirulence genes. Proceedings of the National
Academy of Sciences, USA 103 (23): 8888-8893.
Dorey, S, Baillieul, F, Pierrel, MA, Saindrenan, P, Fritig, B and Kauffmann, S. 1997. Spatial
and temporal induction of cell death, defense genes, and accumulation of salicylic acid in
tobacco leaves reacting hypersensitively to a fungal glycoprotein elicitor. Molecular Plant-
Microbe Interactions 10 (5): 646-655.
Duplessis, S, Cuomo, CA, Lin, Y, Aerts, A, Tisserant, E, Veneault-Fourrey, C, Joly, DL,
Hacquard, S, Amselem, J, Cantarel, BL, Chiu, R, Couthinho, PM, Feau, N, Field, M, Frey, P,
Gelhaye, E, Goldberg, J, Grabherr, MG, Kodira, CD, Kohler, A, Kües, U, Lindquist, EA,
Lucas, SM, Mago, R, Mauceli, E, Morin, E, Murat, C, Pangilinan, JL, Park, R, Pearson, M,
Quesneville, H, Rouhier, N, Sakthikumar, S, Salamov, AA, Schmutz, J, Selles, B, Shapiro, H,
Tangay, P, Tuskan, GA, Van de Peer, Y, Henrissat, B, Rouzé, P, Ellis, JG, Dodds, PN,
Schein, JE, Zhong, S, Hamelin, RC, Grigoriev, IV, Szabo, LJ and Martin, F. 2011. Obligate
biotrophy features unraveled by the genomic analysis of the rust fungi. Proceedings of the
National Acadamy of Sciences, USA 108 (22): 9166-9171.
Durrant, WE and Dong, X. 2004. Systemic acquired resistance. Annual Review of
Phytopathology 42: 185-209.
Dwight, Z, Palais, R and Wittwer, CT. 2011. uMELT: Prediction of high-resolution melting
curves and dynamic melting profiles of PCR products in a rich web application.
Bioinformatics 27 (7): 1019-1020.

208
Ehrlich, HG and Ehrlich, MA. 1963. Electron microscopy of the host-parasite relationships in
stem rust of wheat. American Journal of Botany 50 (2): 123-130.
Ellis, JG, Lagudah, ES, Spielmeyer, W and Dodds, PN. 2014. The past, present and future of
breeding rust resistant wheat. Frontiers in Plant Science 5: 641.
Emanuelsson, O, Nielsen, H, Brunak, S and Von Heijne, G. 2000. Predicting subcellular
localization of proteins based on their N-terminal amino acid sequence. Journal of Molecular
Biology 300 (4): 1005-1016.
Evans, IP. 1907. The Cereal Rusts I. The Development of their Uredo mycelia. Annals of
Botany 21 (84): 441-466.
Favret, EA and Pidal, B. 2013. Wheat leaves: The surface disposition of their epicuticular
wax. Microscopy and Microanalysis 19 (S2): 150-151.
Felix, G, Duran, JD Volko, S and Boller, T. 1999. Plants have a sensitive perception system
for the most conserved domain of bacterial flagellin. The Plant Journal 18 (3): 265-276.
Feuillet, C, Travella, S, Stein, N, Albar, L, Nublat, A and Keller, B. 2003. Map-based
isolation of the leaf rust disease resistance gene Lr10 from the hexaploid wheat (Triticum
aestivum L.) genome. Proceedings of the National Academy of Sciences, USA 100: 15253-
15258.
Finn, RD, Attwood, TK, Babbitt, PC, Bateman, A, Bork, P, Bridge, AJ, Chang, HY,
Dosztányi, Z, El-Gebali, S, Fraser, M, Gough, J, David Haft, D, Holliday, GL, Huang, H,
Huang, X, Letunic, I, Lopez, R, Lu, S, Marchler-Bauer, A, Mi, H, Mistry, J, Natale, DA,
Necci, M, Nuka, G, Orengo, CA, Park, Y, Pesseat, S, Piovesan, D, Potter, SC, Rawlings, ND,
Redaschi, N, Richardson, L, Rivoire, C, Sangrador-Vegas, A, Sigrist, C, Sillitoe, I, Smithers,
B, Squizzato, S, Sutton, G, Thanki, N, Thomas, PD, Tosatto, SCE, Wu, CH, Xenarios, I, Yeh,
L, Young, S and Mitchell, AL. 2017. InterPro in 2017 - Beyond protein family and domain
annotations. Nucleic Acids Research 45 (D1): D190-D199.
Flor, HH. 1971. Current status of the gene-for-gene concept. Annual Review of
Phytopathology 9 (1): 275-296.
French, RC. 1992. Volatile chemical germination stimulators of rust and other fungal spores.
Mycologia 84 (3): 277-288.

209
Fu, D, Uauy, C, Distelfeld, A, Blechl, A, Epstein, L, Chen, X, Sela, H, Fahima, T and
Dubcovsky J. 2009. A kinase-START gene confers temperature-dependent resistance to
wheat stripe rust. Science 323: 1357-1359.
Gambone, K. 2016. Mapping stem rust resistance genes in ‘Kingbird’. PhD thesis. Kansas
State University.
Gao, L, Chen, W, Liu, T and Liu, B. 2013. An immunofluorescence assay for the detection of
wheat rust species using monoclonal antibody against urediniospores of Puccinia triticina.
Journal of Applied Microbiology 115 (4): 1023-1028.
Gao, L, Yu, HX, Kang, XH, Shen, HM, Li, C, Liu, TG, Liu, B and Chen, WQ. 2016.
Development of SCAR markers and an SYBR green assay to detect Puccinia striiformis f. sp.
tritici in infected wheat leaves. Plant Disease 100 (9): 1840-1847.
Garnica, DP, Upadhyaya, NM, Dodds, PN and Rathjen JP. 2013. Strategies for wheat stripe
rust pathogenicity identified by transcriptome sequencing. PLOS ONE 8 (6): e67150.
Gautam, P and Stein, J. 2011. Induction of systemic acquired resistance to Puccinia sorghi in
corn. International Journal of Plant Pathology 2 (1): 43-50.
Giménez, MJ, Pistón, F and Atienza, SG. 2011. Identification of suitable reference genes for
normalization of qPCR data in comparative transcriptomic analyses in the Triticeae. Planta
233: 163-173.
Glazebrook, J, Zook, M, Mert, F, Kagan, I, Rogers, EE, Crute, IR, Holub, EB,
Hammerschmidt, R and Ausubelt, FM. 1997. Phytoalexin-deficient mutants of Arabidopsis
reveal that pad4 encodes a regulatory factor and that four pad genes contribute to downy
mildew resistance. Genetics 146: 381-392.
Gou, JY, Li, K, Wu, K, Wang, X, Lin, H, Cantu, D, Uauy, C, Dobon-Alonso, A, Midorikawa,
T, Inoue, K and Sánchez, J. 2015. Wheat stripe rust resistance protein WKS1 reduces the
ability of the thylakoid-associated ascorbate peroxidase to detoxify reactive oxygen species.
The Plant Cell 27 (6): 1755-1770.
Gozzo, F and Faoro, F. 2013. Systemic acquired resistance (50 years after discovery):
Moving from the lab to the field. Journal of Agricultural and Food Chemistry 61 (51):
12473-12491.

210
Gurr, SJ and Rushton, PJ. 2005. Engineering plants with increased disease resistance: How
are we going to express it? Trends in Biotechnology 23 (6): 283-290.
Gustafson, GD and Shaner, G. 1982. Influence of plant age on the expression of slow-
mildewing resistance in wheat. Phytopathology 72 (7): 746-749.
Hacquard, S, Delaruelle, C, Legué, V, Tisserant, E, Kohler, A, Frey, P, Martin, F and
Duplessis, S. 2010. Laser capture microdissection of uredinia formed by Melampsora larici-
populina revealed a transcriptional switch between biotrophy and sporulation. Molecular
Plant-Microbe Interactions 23 (10): 1275-1286.
Hacquard, S, Veneault-Fourrey, C, Delaruelle, C, Frey, P, Martin, F and Duplessis, S. 2011.
Validation of Melampsora larici-populina reference genes for in planta RT-quantitative PCR
expression profiling during time-course infection of poplar leaves. Physiological and
Molecular Plant Pathology 75 (3): 106-112.
Hahn, M and Mendgen, K. 1997. Characterization of in planta-induced rust genes isolated
from a haustorium-specific cDNA library. Molecular Plant-Microbe Interactions 10 (4): 427-
437.
Hahn, M, Neef, U, Struck, C, Göttfert, M and Mendgen, K. 1997. A putative amino acid
transporter is specifically expressed in haustoria of the rust fungus Uromyces fabae.
Molecular Plant-Microbe Interactions 10 (4): 438-445.
Hansen, BG, Halkier, BA and Kliebenstein, DJ. 2008. Identifying the molecular basis of
QTLs: eQTLs add a new dimension. Trends in Plant Science 13 (2): 72-77.
Hansen, JG. 2017. Caution: Risk of wheat stem rust in Mediterranean basin in the
forthcoming 2017 crop season following outbreaks on Sicily in 2016. [online] Global Rust
Reference Center. Available at: http://wheatrust.org/news-and-events/news-
item/artikel/caution-risk-of-stem-rust-in-eastern-mediterranean-basin-in-the-forthcoming-
2017-season-due-to-ou/ [accessed 20-02-2017].
Hao, Y, Wang, T, Wang, K, Wang, X, Fu, Y, Huang, L and Kang, Z. 2016. Transcriptome
analysis provides insights into the mechanisms underlying wheat plant resistance to stripe
rust at the adult plant stage. PLOS ONE 11 (3): e0150717.

211
Hardcastle, T.J. and Kelly, K.A. 2010. baySeq: Empirical Bayesian methods for identifying
differential expression in sequence count data. BMC Bioinformatics 11 (1): 422.
Hardham, AR. 2001. Cell biology of fungal infection of plants. Howard RJ and Gow, NAR
(editors). Biology of the fungal cell Volume VIII The Mycota: 91-123.
Hellemans, J, Mortier, G, De Paepe, A, Speleman, F and Vandesompele, J. 2007. qBase
relative quantification framework and software for management and automated analysis of
real-time quantitative PCR data. Genome Biology 8 (2): R19.
Herrera-Foessel, SA, Lagudah, ES, Huerta-Espino, J, Hayden, MJ, Bariana, HS, Singh, D and
Singh, RP. 2011. New slow-rusting leaf rust and stripe rust resistance genes Lr67 and Yr46 in
wheat are pleiotropic or closely linked. Theoretical and Applied Genetics 122 (1): 239-249.
Herrera-Foessel, SA, Singh, RP, Lillemo, M, Huerta-Espino, J, Bhavani, S, Singh, S, Lan, C,
Calvo-Salazar, V and Lagudah, ES. 2014. Lr67/Yr46 confers adult plant resistance to stem
rust and powdery mildew in wheat. Theoretical and Applied Genetics 127 (4): 781-789.
Hiebert, CW, Kolmer, JA, McCartney, CA, Briggs, J, Fetch, T, Bariana, H, Choulet, F,
Rouse, MN and Spielmeyer, W. 2016. Major gene for field stem rust resistance co-locates
with resistance gene Sr12 in ‘Thatcher’ wheat. PLOS ONE 11 (6): e0157029.
Hiebert, CW, Thomas, JB, McCallum, BD, Humphreys, DG, DePauw, RM, Hayden, MJ,
Mago, R, Schnippenkoetter, W and Spielmeyer, W. 2010. An introgression on wheat
chromosome 4DL in RL6077 (Thatcher* 6/PI 250413) confers adult plant resistance to stripe
rust and leaf rust (Lr67). Theoretical and Applied Genetics 121 (6): 1083-1091.
Hoch, HC, Staples, RC, Whitehed, B, Comeau, J and Wolf, ED. 1987. Signaling for growth
orientation and cell differentiation by surface topography in Uromyces. Science 235: 1659-
1663.
Horton, P, Park, KJ, Obayashi, T, Fujita, N, Harada, H, Adams-Collier, CJ and Nakai, K.
2007. WoLF PSORT: Protein localization predictor. Nucleic Acids Research 35 (S2): W585-
W587.
Hu, G and Rijkenberg, FHJ. 1998. Scanning electron microscopy of early infection structure
formation by Puccinia recondita f. sp. tritici on and in susceptible and resistant wheat lines.
Mycological Research 102 (4): 391-399.

212
Huang, X, Ma, J, Chen, X, Wang, X, Ding, K, Han, D, Qu, Z, Huang, L and Kang, Z. 2013.
Genes involved in adult plant resistance to stripe rust in wheat cultivar Xingzi 9104.
Physiological and Molecular Plant Pathology 81: 26-32.
Hubbard, A, Lewis, CM, Yoshida, K, Ramirez-Gonzalez, RH, De Vallavieille-Pope, C,
Thomas, J, Kamoun, S, Bayles, R, Uauy, C and Saunders, DGO, 2015. Field pathogenomics
reveals the emergence of a diverse wheat yellow rust population. Genome Biology 16 (1): 23.
Hückelhoven, R, Dechert, C and Kogel, K. 2001. Non-host resistance of barley is associated
with a hydrogen peroxide burst at sites of attempted penetration by wheat powdery mildew
fungus. Molecular Plant Pathology 2 (4): 199-205.
Hughes, FL and Rijkenberg, FHJ. 1985. Scanning electron microscopy of early infection in
the uredial stage of Puccinia sorghi in Zea mays. Plant Pathology 34: 61-68.
Hulbert, S and Pumphrey, M. 2014. A time for more booms and fewer busts? Unraveling
cereal-rust interactions. Molecular Plant-Microbe Interactions 27 (3): 207-214.
Hurd-Karrer, AM and Rodenhiser, HA. 1947. Structures corresponding to appressoria and
substomatal vesicles produced on nutrient-solution agar by cereal rusts. American Journal of
Botany 34 (7): 377-384.
Ito, Y, Kaku, H and Shibuya, N. 1997. Identification of a high-affinity binding protein for N-
acetylchitooligosaccharide elicitor in plasma membrane of suspension-cultured rice cells by
affinity labelling. The Plant Journal 12 (2): 347-356.
Jackson, EW, Avant, JB, Overturf, KE and Bonman, JM. 2006. A quantitative assay of
Puccinia coronata f. sp. avenae DNA in Avena sativa. Plant Disease 90 (5): 629-636.
Jarosch, B, Jansen, M and Schaffrath, U. 2003. Acquired resistance functions in mlo barley,
which is hypersusceptible to Magnaporthe grisea. Molecular Plant-Microbe Interactions 16
(2): 107-114.
Jarošová, J and Kundu, JK. 2010. Validation of reference genes as internal control for
studying viral infections in cereals by quantitative real-time RT-PCR. BMC Plant Biology 10
(1): 46.
Jin, Y. 2011. Role of Berberis spp. as alternate hosts in generating new races of Puccinia
graminis and P. striiformis. Euphytica 179: 105-108.

213
Jin, Y, Szabo, LJ, Pretorius, ZA, Singh, RP, Ward, R and Fetch, T. 2008. Detection of
virulence to resistance gene Sr24 within race TTKS of Puccinia graminis f. sp. tritici. Plant
Disease 92 (6) 923-926.
Johal, GS, Gray, J, Gruis, D and Briggs, S. P. 1995. Convergent insights into mechanism
determining disease and resistant response in plant-fungal interactions. Canadian Journal of
Botany 73 (supplement 1): 468-474.
Johansen, DA. 1940. Plant microtechnique. McGraw-Hill Book Company.
Johnson, R. 1979. Letter to the Editor: The concept of durable resistance. Phytopathology, 69
(3): 198-199.
Johnson, T. 1934. A tropic response in germ tubes of urediospores of Puccinia graminis
tritici. Phytopathology 24: 80-82.
Jones, JDG and Dangl, JL. 2006. The plant immune system. Nature 444 (16): 323-329.
Jones, P, Binns, D, Chang, HY, Fraser, M, Li, W, McAnulla, C, McWilliam, H, Maslen, J,
Mitchell, A, Nuka, G and Pesseat, S. 2014. InterProScan 5: Genome-scale protein function
classification. Bioinformatics 30 (9): 1236-1240.
Joshi, RK and Nayak, S. 2010. Gene pyramiding - A broad spectrum technique for
developing durable stress resistance in crops. Biotechnology and Molecular Biology Reviews,
5 (3): 51-60.
Jupe, F, Pritchard, L, Etherington, GJ, MacKenzie, K, Cock, PJA, Frank Wright, F, Sharma,
SK, Bolser, D, Bryan, GJ, Jones, JDG and Hein, I. 2012. Identification and localisation of the
NB-LRR gene family within the potato genome. BMC Genomics 13: 75.
Jupe, F, Witek, K, Verweij, W, Sliwka, J, Pritchard, L, Etherington, GJ, Maclean, D, Cock,
PJA, Leggett, RM, Bryan, GJ, Cardle, L, Hein, I and Jones, JDG. 2013. Resistance gene
enrichment sequencing (RenSeq) enables reannotation of the NB-LRR gene family from
sequenced plant genomes and rapid mapping of resistance loci in segregating populations.
The Plant Journal 76: 530-544.
Kaku, H, Nishizawa, Y, Ishii-Minami, N, Akimoto-Tomiyama, C, Dohmae, N, Takio, K,
Minami, E and Shibuya, N. 2006. Plant cells recognize chitin fragments for defence

214
signalling through a plasma membrane receptor. Proceedings of the National Academy of
Science, USA 103 (29): 11086-11091.
Käll, L, Krogh, A and Sonnhammer, EL. 2007. Advantages of combined transmembrane
topology and signal peptide prediction - The Phobius web server. Nucleic Acids Research 35
(S2): W429-W432.
Kchouk, M, Gibrat, JF and Elloumi, M. 2017. Generations of sequencing technologies: From
first to next generation. Biology and Medicine 9: 3.
Keith, RC, Keith, LWM, Hernández-Guzmán, G, Uppalapati, SR and Bender, CL. 2003.
Alginate gene expression by Pseudomonas syringae pv. tomato DC3000 in host and non-host
plants. Microbiology 149: 1127-1138.
Kemen, E, Kemen, AC, Rafiqi, M, Hempel, U, Mendgen, K, Hahn, M and Voegele, RT.
2005. Identification of a protein from rust fungi transferred from haustoria into infected plant
cells. Molecular Plant-Microbe Interactions 18: 1130-1139.
Klarzynski, O, Plesse, B Joubert, J, Yvin, J, Kopp, M, Kloareg, B and Fritig, B. 2000. Linear
β-1,3 glucans are elicitors of defense responses in tobacco. Plant Physiology 124: 1027-1037.
Kloppers, FJ and Pretorius ZA. 1997. Effects of combinations amongst genes Lr13, Lr34 and
Lr37 on components of resistance in wheat to leaf rust. Plant Pathology 46: 737-750.
Koiattukudy, PE. 1985. Enzymatic penetration of the plant cuticle by fungal pathogens.
Annual Review of Phytopatholgy 23: 223-250.
Kolmer, JA, Ordonez, ME and Groth, JV. 2009. The Rust Fungi. Encyclopedia of Life
Sciences. John Wiley and Sons.
Kou, Y and Wang, S. 2010. Broad-spectrum and durability: Understanding of quantitative
disease resistance. Current Opinion in Plant Biology 13 (2): 181-185.
Krattinger, SG, Lagudah, ES, Spielmeyer, W, Singh, RP, Huerta-Espino, J, McFadden, H,
Bossolini, E, Selter, LL and Keller, B. 2009. A putative ABC transporter confers durable
resistance to multiple fungal pathogens in wheat. Science 323: 1360-1363.
Krattinger, SG, Sucher, J, Selter, LL, Chauhan, H, Zhou, B, Tang, M, Upadhyaya, NM,
Mieulet, D, Guiderdoni, E, Weidenbach, D and Schaffrath, U. 2016. The wheat durable,

215
multipathogen resistance gene Lr34 confers partial blast resistance in rice. Plant
Biotechnology Journal.14: 1261-1268.
Krogh, A, Larsson, B, Von Heijne, G and Sonnhammer, EL. 2001. Predicting transmembrane
protein topology with a hidden Markov model: Application to complete genomes. Journal of
Molecular Biology 305 (3): 567-580.
Lan, C, Rosewarne, GM, Singh, RP, Herrera-Foessel, SA, Huerta-Espino, J, Basnet, BR,
Zhang, Y and Yang, E. 2014. QTL characterization of resistance to leaf rust and stripe rust in
the spring wheat line Francolin# 1. Molecular Breeding 34 (3): 789-803.
Lanfranco, L, Novero, M and Bonfante, P. 2005. The mycorrhizal fungus Gigaspora
margarita possesses a CuZn superoxide dismutase that is up-regulated during symbiosis with
legume hosts. Plant Physiology 137 (4): 1319-1330.
Langmead, B and Salzberg, SL. 2012. Fast gapped-read alignment with Bowtie 2. Nature
Methods 9 (4): 357.
Le Roux, J and Rijkenberg, FHJ. 1987. Occurrence and pathogenicity of Puccinia graminis f.
sp. tritici in South Africa during the period 1981-1985. Phytophylactica 19 (4): 467-472.
Lennox, CL and Rijkenberg, FHJ. 1989. Scanning electron microscopy study of infection
structure formation of Puccinia graminis f. sp. tritici in host and non-host cereal species.
Plant Pathology 38 (4): 547-556.
Lennox, CL and Rijkenberg, FHJ. 1994. Towards an understanding of the expression of stem
rust resistance gene Sr5. Journal of Phytopathology 140 (2): 165-171.
Leonard, KJ and Szabo, LJ. 2005. Stem rust of small grains and grasses caused by Puccinia
graminis. Molecular Plant Pathology 6 (2): 99-111.
Lewis, BG and Day, JR. 1972. Behaviour of uredospore germ-tubes of Puccinia graminis
tritici in relation to the fine structure of wheat leaf surfaces. Transactions of the British
Mycological Society 58 (I): 139-145.
Lewis, CM, Persoons, A, Bebber, DP, Kigathi, RN, Maintz, J, Findlay, K, Bueno-Sancho, V,
Corredor-Moreno, P, Harrington, SA, Kangara, N, Berlin, A, García, R, Germán, SE,
Hanzalová, A, Hodson, DP, Hovmøller, MS, Huerta-Espino, J, Imtiaz, M, Mirza, JI, Justesen,
AF, Niks, RE, Omrani, A, Patpour, M, Pretorius, ZA, Roohparvar, R, Sela, H, Singh, RP,

216
Steffenson, B, Visser, B, Fenwick, PM, Thomas, J, Wulff, BBH and Saunders, DGO. 2018.
Potential for re-emergence of wheat stem rust in the United Kingdom. Communications
Biology 1 (1): 13.
Li, K, Hegarty, J, Zhang, C, Wan, A, Wu, J, Guedira, GB, Chen, X, Muñoz-Amatriaín, M,
Fu, D and Dubcovsky, J. 2016. Fine mapping of barley locus Rps6 conferring resistance to
wheat stripe rust. Theoretical and Applied Genetics 129 (4): 845-859.
Li, X, Kapos, P and Zhang, Y. 2015. NLRs in plants. Current Opinion in Immunology 32:
114-121.
Li, Z, Lan, C, He, Z, Singh, RP, Rosewarne, GM, Chen, X and Xia, X. 2014. Overview and
application of QTL for adult plant resistance to leaf rust and powdery mildew in wheat. Crop
Science 54: 1907-1925.
Liu, B, Xue, X, Cui, S, Zhang, X, Han, Q, Zhu, L, Liang, X, Wang, X, Huang, L, Chen, X
and Kang, Z. 2010. Cloning and characterization of a wheat β-1, 3-glucanase gene induced by
the stripe rust pathogen Puccinia striiformis f. sp. tritici. Molecular Biology Reports 37 (2):
1045.
Liu, L, Li, Y, Li, S, Hu, N, He, Y, Pong, R, Lin, D, Lu, L and Law, M. 2012. Comparison of
next-generation sequencing systems. Journal of Biomedicine and Biotechnology:
doi:10.1155/2012/251364.
Loutre, C, Wicker, T, Travella, S, Galli, P, Scofield, S, Fahima, T, Feuillet, C and Keller, B.
2009. Two different CC-NBS-LRR genes are required for Lr10-mediated leaf rust resistance
in tetraploid and hexaploid wheat. The Plant Journal 60: 1043-1054.
Lowe, I, Cantu, D and Dubcovsky, J. 2011. Durable resistance to the wheat rusts: Integrating
systems biology and traditional phenotype-based research methods to guide the deployment
of resistance genes. Euphytica 179 (1): 69-79.
Lukasik, E and Takken, FLW. 2009. STANDing strong, resistance proteins instigators of
plant defence. Current Opinion in Plant Biology 12: 427-436.
Mackey, D, Belkhadir, Y, Alonso, JM, Ecker, JR and Dangl JL. 2003. Arabidopsis RIN4 is a
target of the type III virulence effector AvrRpt2 and modulates RPS2-mediated resistance.
Cell 112: 379-389.

217
Mago, R, Lawrence, GJ and Ellis, JG. 2011. The application of DNA marker and doubled-
haploid technology for stacking multiple stem rust resistance genes in wheat. Molecular
Breeding 27 (3): 329-335.
Makandar, R, Essig, JS, Schapaugh, MA, Trick, HN and Shah, J. 2006. Genetically
engineered resistance to Fusarium head blight in wheat by expression of Arabidopsis NPR1.
Molecular Plant-Microbe Interactions 19 (2): 123-129.
Malamy, J, Sánchez-Casas, P, Henning, J, Guo, A and Klessig, DF. 1996. Dissection of the
salicylic acid signaling pathway. Molecular Plant-Microbe Interactions 9: 474-482.
Maré, A. 2017. Development of wheat lines with complex resistance to rusts and Fusarium
head blight. PhD thesis. University of the Free State, South Africa.
Mauch, F, Mauch-Mani, B and Boller, T. 1988. Antifungal hydrolases in pea tissue II.
Inhibition of fungal growth by combinations of chitinase and β-1,3-glucanase. Plant
Physiology 88, 936-942.
McDonald, BA and Linde, C. 2002. The population genetics of plant pathogens and breeding
strategies for durable resistance. Euphytica 124 (2): 163-180.
McIntosh, RA. 1972. Cytogenetical studies in wheat VI. Chromosome location and linkage
studies involving Sr13 and Sr8 for reaction to Puccinia graminis f. sp. tritici. Australian
Journal of Biological Sciences 25 (4): 765-774.
McIntosh, RA, Dubcovsky, J, Rogers, W, Morris, C, Appels, R and Xia, X. 2016. Catalogue
of gene symbols for wheat: 2015-2016 supplement.
McIntosh, RA, Wellings, CR and Park, RF. 1995. Wheat rusts: An atlas of resistance genes.
Melichar, JPE, Berry, S, Newell, C, MacCormack, R and Boyd LA. 2008. QTL identification
and microphenotype characterization of the developmentally regulated yellow rust resistance.
Theoretical and Applied Genetics 117: 391-399.
Mendgen, K. 1981. Nutrient uptake in rust fungi. Phytopathology 71 (9): 983-989.
Mendgen, K, Schneider, A, Sterk, M and Fink, W. 1988. The differentiation of infection
structures as a result of recognition events between some biotrophic parasites and their hosts.
Journal of Phytopathology 123 (3): 259-272.

218
Mendgen, K, Wirsel, SGR, Jux, A, Hoffmann, J and Boland, W. 2006. Volatiles modulate the
development of plant pathogenic rust fungi. Planta 224: 1353-1361.
Mentlak, TA, Kombrink, A, Shinya, T, Ryder, LS, Otomo, I, Saitoh, H, Terauchi, R,
Nishizawa, Y, Shibuya, N, Thomma, BPHJ and Talbot, NJ. 2012. Effector-mediated
suppression of chitin-triggered immunity by Magnaporthe oryzae is necessary for rice blast
disease. The Plant Cell 24: 322-335.
Metsalu, T and Vilo, J. 2015. ClustVis: A web tool for visualizing clustering of multivariate
data using Principal Component Analysis and heatmap. Nucleic Acids Research 43 (W1):
W566-W570.
Meyers, BC, Dickerman, AW, Michelmore, RW, Sivaramakrishnan, S, Sobral, BW and
Young, ND. 1999. Plant disease resistance genes encode members of an ancient and diverse
protein family within the nucleotide-binding superfamily. The Plant Journal 20 (3): 317-332.
Meyers, BC, Kozik, A, Griego, A, Kuang, H and Michelmore, RW. 2003. Genome-wide
analysis of NBS-LRR-encoding genes in Arabidopsis. The Plant Cell 15: 809-834.
Miya, A, Albert, P, Shinya, T, Desaki, Y, Ichimura, K, Shirasu, K, Narusaka, Y, Kawakami,
N, Kaku, H and Shibuya, N. 2007. CERK1, a LysM receptor kinase, is essential for chitin
elicitor signaling in Arabidopsis. Proceedings of the National Academy of Sciences, USA 104
(49): 19613-19618.
Moerschbacher, BM, Noll, U, Gorrichon, L and Reisener, HJ. 1990. Specific inhibition of
lignification breaks hypersensitive resistance of wheat to stem rust. Plant Physiology, 93 (2):
465-470.
Moldenhauer, J, Moerschbacher, BM and Van der Westhuizen, AJ. 2006. Histological
investigation of stripe rust (Puccinia striiformis f. sp. tritici) development in resistant and
susceptible wheat cultivars. Plant Pathology 55: 469-474.
Moldenhauer, J, Pretorius, ZA, Moerschbacher, BM, Prins, R and Van der Westhuizen, AJ.
2008. Histopathology and PR‐protein markers provide insight into adult plant resistance to
stripe rust of wheat. Molecular Plant Pathology 9 (2): 137-145.
Moore, JW, Herrera-Foessel, S, Lan, C, Schnippenkoetter, W, Ayliffe, M, Huerta-Espino, J,
Lillemo, M, Viccars, L, Milne, R, Periyannan, S, Kong, X, Wolfgang Spielmeyer, W, Talbot,

219
M, Bariana, H, Patrick, JW, Dodds, P, Singh, R and Evans Lagudah, L. 2015. A recently
evolved hexose transporter variant confers resistance to multiple pathogens in wheat. Nature
Genetics 47 (12): 1494.
Mur, LA, Naylor, G, Warner, SA, Sugars, JM, White, RF and Draper, J. 1996. Salicylic acid
potentiates defence gene expression in tissue exhibiting acquired resistance to pathogen
attack. The Plant Journal 9 (4): 559-571.
Mur, LAJ, Kenton, P, Lloyd, AJ, Ougham, H and Prats, E. 2008. The hypersensitive
response; the centenary is upon us but how much do we know? Journal of Experimental
Botany 59 (3): 501-520.
Mysore, KS and Ryu C. 2004. Nonhost resistance: How much do we know? Trends in Plant
Science 9 (2): 97-104.
Narusaka, M, Shirasu, K, Noutoshi, Y, Kubo, Y, Shiraishi, T, Iwabuchi, M and Narusaka, Y.
2009. RRS1 and RPS4 providea dual Resistance-gene system against fungal and bacterial
pathogens. The Plant Journal 60: 218-226.
Neugebauer, KA, Bruce, M, Todd, T, Trick, HN and Fellers, JP. 2018. Wheat differential
gene expression induced by different races of Puccinia triticina. PLOS ONE 13 (6):
e0198350.
Niks, RE. 1986. Variation of mycelial morphology between species and formae speciales of
rust fungi of cereals and grasses. Canadian Journal of Botany 64: 2976-2983.
Niks, RE and Thierry C. Marcel, TC. 2009. Nonhost and basal resistance: How to explain
specificity? New Phytologist 182: 817-828.
Njau, PN, Bhavani, S, Huerta-Espino, J, Keller, B and Singh, RP. 2013. Identification of
QTL associated with durable adult plant resistance to stem rust race Ug99 in wheat cultivar
‘Pavon 76’. Euphytica 190 (1): 33-44.
Nowara, D, Gay, A, Lacomme, C, Shaw, J, Ridout, C, Douchkov, D, Hensel, G, Kumlehn, J
and Schweizera, P. 2010. HIGS: Host-induced gene silencing in the obligate biotrophic
fungal pathogen Blumeria graminis. The Plant Cell 22: 3130-3141
220
Nunes CC and Dean, RA. 2012. Host-induced gene silencing: A tool for understanding
fungal host interaction and for developing novel disease control strategies. Molecular Plant
Pathology 13 (5): 519-529.
Nürnberger, T, Brunner, F, Kemmerling, B and Piater, L. 2004. Innate immunity in plants
and animals: Striking similarities and obvious differences. Immunological Reviews 198: 249-
266.
Olivera Firpo, PD, Newcomb, M, Flath, K, Sommerfeldt, N, Szabo, LJ, Carter, M, Luster,
DG and Jin, Y. 2017. Characterization of Puccinia graminis f. sp. tritici isolates derived from
an unusual wheat stem rust outbreak in Germany in 2013. Plant Pathology 66 (8): 1258-
1266.
Olivera, P, Newcomb, M, Szabo, LJ, Rouse, M, Johnson, J, Gale, S, Luster, DG, Hodson, D,
Cox, JA, Burgin, L, Hort, M, Gilligan, CA, Patpour, M, Justesen, AF, Hovmøller, MS,
Woldeab, G, Hailu, E, Hundie, B, Tadesse, K, Pumphrey, M, Singh, RP and Jin, Y. 2015.
Phenotypic and genotypic characterization of race TKTTF of Puccinia graminis f. sp. tritici
that caused a wheat stem rust epidemic in southern Ethiopia in 2013-14. Phytopathology 105
(7): 917-928.
Pan, Q, Wendel, J and Fluhr, R. 2000. Divergent evolution of plant NBS-LRR resistance
gene homologues in dicot and cereal genomes. Journal of Molecular Evolution 50 (3): 203-
213.
Panwar, V, Brent McCallum, B and Bakkeren, G. 2013. Endogenous silencing of Puccinia
triticina pathogenicity genes through in planta-expressed sequences leads to the suppression
of rust diseases on wheat. The Plant Journal 73: 521-532.
Paolacci, AR, Tanzarella, OA, Porceddu, E and Ciaffi, M. 2009. Identification and validation
of reference genes for quantitative RT-PCR normalization in wheat. BMC Molecular Biology
10 (1): 11.
Papadopoulou, K, Melton, R.E, Leggett, M, Daniels, MJ and Osbourn, AE. 1999.
Compromised disease resistance in saponin-deficient plants. Proceedings of the National
Academy of Sciences, USA 96 (22): 12923-12928.
Pardey, PG, Beddow, JM, Kriticos, DJ, Hurley, TM, Park, RF, Duveiller, E, Sutherst, RW,
Burdon, JJ and D. Hodson, D. 2013. Right-sizing stem-rust research. Science 340: 147-148.

221
Park, R, Fetch, T, Hodson, D, Jin, Y, Nazari, K, Prashar, M and Pretorius, ZA. 2011.
International surveillance of wheat rust pathogens: Progress and challenges. Euphytica 179
(1): 109-117.
Park, RF. 2007. Stem rust of wheat in Australia. Australian Journal of Agricultural Research
58 (6): 558-566.
Passardi, F, Penel, C and Dunand, C. 2004. Performing the paradoxical: How plant
peroxidases modify the cell wall. Trends in plant science 9 (11): 534-540.
Patpour, M, Hovmøller, MS and Justesen, AF, Newcomb, M, Olivera, Jin, PY, Szabo, LJ,
Hodson, D, Shahin, AA, Wanyera, R, Habarurema, I and Wobibi, S. 2016. Emergence of
virulence to SrTmp in the Ug99 race group of wheat stem rust, Puccinia graminis f. sp. tritici,
in Africa. Plant Disease 100 (2): 522.
Patro, R, Duggal, G, Love, MI, Irizarry, RA and Kingsford, C. 2017. Salmon provides fast
and bias-aware quantification of transcript expression. Nature Methods 14 (4): 417.
Peng, FY and Yang, RC. 2017. Prediction and analysis of three gene families related to leaf
rust (Puccinia triticina) resistance in wheat (Triticum aestivum L.). BMC Plant Biology 17
(1): 108.
Periyannan, S, Milne, RJ, Figueroa, M, Lagudah, ES and Dodds, PN. 2017. An overview of
genetic rust resistance: From broad to specific mechanisms. PLOS Pathogens 13 (7):
e1006380.
Petersen, TN, Brunak, S, Von Heijne, G and Nielsen, H. 2011. SignalP 4.0: Discriminating
signal peptides from transmembrane regions. Nature Methods 8 (10): 785-786.
Petre, B, Lorrain, C, Saunders, DGO, Win, J, Sklenar, J, Duplessis, S, Kamoun, S. 2016. Rust
fungal effectors mimic host transit peptides to translocate into chloroplasts. Cellular
Microbiology 18 (4): 453-465.
Petre, B, Saunders, DGO, Sklenar, J, Lorrain, C, Win, J, Duplessis, S and Kamoun, S. 2015.
Candidate effector proteins of the rust pathogen Melampsora larici-populina target diverse
plant cell compartments. Molecular Plant-Microbe Interactions 28 (6): 689-700.
Pfaffl, MW. 2001. A new mathematical model for relative quantification in real-time RT-
PCR. Nucleic Acids Research 29 (9): 2002-2007.

222
Pliego, C, Nowara, D, Bonciani, G, Gheorghe, DM, Xu, R, Surana, R, Whigham, E,
Nettleton, D, Bogdanove, AJ, Wise, RP, Schweizer, P, Bindschedler, LV and Spanu PD.
2013. Host-induced gene silencing in barley powdery mildew reveals a class of ribonuclease-
like effectors. Molecular Plant-Microbe Interactions 26 (6): 633-642.
Pretorius, ZA, Bender, CM, Visser, B and Terefe, T. 2010. First report of a Puccinia
graminis f. sp. tritici race virulent to the Sr24 and Sr31 wheat stem rust resistance genes in
South Africa. Plant Disease 94 (6): 784.
Pretorius, ZA, Pienaar, L and Prins, R. 2007. Greenhouse and field assessment of adult plant
resistance in wheat to Puccinia striiformis f. sp. tritici. Australasian Plant Pathology 36: 552-
559.
Pretorius, ZA, Prins, R, Malaker, PK, Barma, NCD, Hakim, MA, Thapa, D, Bansal, U, Cisar,
GL and Park, RF. 2015. Assessing the vulnerability of wheat germplasm from Bangladesh
and Nepal to Ug99 stem rust. Phytoparasitica 43(5): 637-645.
Pretorius, ZA, Singh, RP and Wagoire, WW. 2000. Detection of virulence to wheat stem rust
resistance gene Sr31 in Puccinia graminis f.sp. tritici in Uganda. Plant Disease 84 (2): 203.
Pretorius, ZA, Szabo, LJ, Boshoff, WHP, Herselman, L and Visser, B. 2012. First report of a
new TTKSF race of wheat stem rust (Puccinia graminis f. sp. tritici) in South Africa and
Zimbabwe. Plant Disease 96 (4): 590-590.
Pretsch, K, Kemen, A, Kemen, E, Geiger, M, Mendgen, K and Voegele, RT. 2013. The rust
transferred proteins - A new family of effector proteins exhibiting protease inhibitor function.
Molecular Plant Pathology 14 (1): 96-107.
Prins, R, Dreisigacker, S, Pretorius, ZA, Van Schalkwyk, H, Wessels, E, Smit, C, Bender,
CM, Singh, D and Boyd, LA. 2016. Stem rust resistance in a geographically diverse
collection of spring wheat lines collected from across Africa. Frontiers in Plant Science 7:
973.
Puthoff, DP, Neelam, A, Ehrenfried, ML, Scheffler, BE, Ballard, L, Song, Q, Campbell, KB,
Cooper, B and Tucker, ML. 2008. Analysis of expressed sequence tags from Uromyces
appendiculatus hyphae and haustoria and their comparison to sequences from other rust
fungi. Phytopathology 98 (10): 1126-1135.
223
Ray DK, Mueller ND, West PC and Foley JA. 2013. Yield trends are insufficient to double
global crop production by 2050. PLOS ONE 8 (6): e66428.
Read, ND, Kellock, LJ, Collins, TJ and Gundlach, AM. 1997. Role of topography sensing for
infection-structure differentiation in cereal rust fungi. Planta 202 (2): 163-170.
Rep, M. 2005. Small proteins of plant-pathogenic fungi secreted during host colonization.
Federation of European Microbiological Societies Microbiology Letters 253: 19-27.
Rinaldi, C, Kohler, A, Frey, P, Duchaussoy, F, Ningre, N, Couloux, A, Wincker, P, Le Thiec,
D, Fluch, S, Martin, F and Duplessis, S. 2007. Transcript profiling of poplar leaves upon
infection with compatible and incompatible strains of the foliar rust Melampsora larici-
populina. Plant Physiology 144 (1): 347-366.
Rinaldo, A, Gilbert, B, Boni, R, Krattinger, SG, Singh, D, Park, RF, Lagudah, E and Ayliffe,
M. 2017. The Lr34 adult plant rust resistance gene provides seedling resistance in durum
wheat without senescence. Plant Biotechnology Journal 15: 894-905.
Risk, JM, Selter, LL, Chauhan, H, Krattinger, SG, Kumlehn, J, Hensel, G, Viccars, LA,
Richardson, TM, Buesing, G, Troller, A and Lagudah, ES. 2013. The wheat Lr34 gene
provides resistance against multiple fungal pathogens in barley. Plant Biotechnology Journal
11 (7): 847-854.
Roderick, HW and Thomas, BJ. 1997. Infection of ryegrass by three rust fungi (Puccinia
coronata, P. graminis and P. loliina) and some effects of temperature on the establishment of
the disease and sporulation. Plant Pathology 46 (5): 751-761.
Roelfs, AP. 1982. Effects of barberry eradication on stem rust in the United States. Plant
Disease 66: 177-181.
Roelfs, AP and Martens, JW. 1988. An international system of nomenclature for Puccinia
graminis f. sp. tritici. Phytopathology 78: 526-533.
Roelfs, AP, Singh, RP and Saari, EE. 1992. Rust diseases of wheat: Concepts and methods of
disease management. Hettel, GP (editor). CIMMYT.
Rohringer R, Kim WK, Samborsky DJ and Howes, NK. 1977. Calcofluor: An optical
brightener for fluorescence microscopy of fungal plant parasites in leaves. Phytopathology
67: 808-810.

224
Ross, AF. 1961a. Localized acquired resistance to plant virus infection in hypersensitive
hosts. Virology 14: 329-339.
Ross, AF. 1961b. Systemic acquired resistance induced by localized virus infections in
plants. Virology 14: 340-358.
Rouse, MN, Nirmala, J, Jin, Y, Chao, S, Fetch, TG, Pretorius, ZA and Hiebert, CW. 2014.
Characterization of Sr9h, a wheat stem rust resistance allele effective to Ug99. Theoretical
and Applied Genetics 127 (8): 1681-1688.
Rubiales, D and Niks, RE. 1995. Characterization of Lr34, a major gene conferring
nonhypersensitive resistance to wheat leaf rust. Plant Disease 79 (12): 1208-1212.
RustTracker.org. 2016. Pathotype Tracker - Where is Ug99? Status Summary: Ug99 Lineage
- February 2016. [online] Available at: http://rusttracker.cimmyt.org/?page_id=22 [accessed
20-02-2017].
Rutkoski, JE, Poland, JA, Singh, RP, Huerta-Espino, J, Bhavani, S, Barbier, H, Rouse, MN,
Jannink, J and Sorrells, ME. 2014. Genomic selection for quantitative adult plant stem rust
resistance in wheat. The Plant Genome 7 (3).
Rutter, WB, Salcedo, A, Akhunova, A, He, F, Wang, S, Liang, H, Bowden, RL and
Akhunov, E. 2017. Divergent and convergent modes of interaction between wheat and
Puccinia graminis f. sp. tritici isolates revealed by the comparative gene co-expression
network and genome analyses. BMC Genomics 18 (1): 291.
Salcedo, A, Rutter, W, Wang, S, Akhunova, A, Bolus, S, Chao, S, Anderson, N, De Soto,
MF, Rouse, M, Szabo, L, Bowden, RL, Dubcovsky, J and Akhunov, E. 2017. Variation in the
AvrSr35 gene determines Sr35 resistance against wheat stem rust race Ug99. Science 358
(6370): 1604-1606.
Sambrook, J, Fritsch, EF and Maniatis, T. (1989) Molecular Cloning: A Laboratory Manual,
Edition 2. Cold Spring Harbor Laboratory Press, Cold Spring Harbor.
Sankaran, S, Mishra, A, Ehsani, R and Davis, C. 2010. A review of advanced techniques for
detecting plant diseases. Computers and Electronics in Agriculture 72 (1): 1-13.

225
Saunders, DGO, Win, J, Liliana M, Cano, LM, Szabo, LJ, Kamoun, S and Raffaele. 2012.
Using hierarchical clustering of secreted protein families to classify and rank candidate
effectors of rust fungi. PLOS ONE 7(1): e29847.
Saunders, DGO. 2015. Hitchhiker’s guide to multi-dimensional plant pathology. New
Phytologist 205: 1028-1033.
Schena, L, Nigro, F, Ippolito, A and Gallitelli, D. 2004. Real-time quantitative PCR: A new
technology to detect and study phytopathogenic and antagonistic fungi. European Journal of
Plant Pathology 110 (9): 893-908.
Scholtz, JJ and Visser, B. 2013. Reference gene selection for qPCR gene expression analysis
of rust-infected wheat. Physiological and Molecular Plant Pathology 81: 22-25.
Schwessinger, B and Zipfel, C. 2008. News from the frontline: Recent insights into PAMP-
immunity in plants. Current Opinion in Plant Biology 11: 389-395.
Segovia, V, Hubbard, A, Craze, M, Bowden, S, Wallington, E, Bryant, R, Greenland, A,
Bayles, R and Uauy, C. 2014. Yr36 confers partial resistance at temperatures below 18°C to
UK isolates of Puccinia striiformis. Phytopathology 104 (8): 871-878.
Setten, LM, Lendoiro, N and Favret, EA. 2015. Wheat leaf rust fungus: RIMAPS analysis to
detect germ-tube orientation pattern. Microscopy and Microanalysis 21: 227-228.
Shabab, M, Shindo, T, Gu, C, Kaschani, F, Pansuriya, T, Chintha, R, Harzen, A, Colby, T,
Kamoun, S and Van der Hoorn, RAL. 2008. Fungal effector protein AVR2 targets
diversifying defense-related Cys proteases of tomato. The Plant Cell 20: 1169-1183.
Sharma, S, Shiveta, S, Hirabuchi, A, Yoshida, K, Fujisaki, K, Ito, A, Uemura, A, Terauchi,
R, Kamoun, S, Sohn, KH, Jones JDG and Saitoh, H. 2013. Deployment of the Burkholderia
glumae type III secretion system as an efficient tool for translocating pathogen effectors to
monocot cells. The Plant Journal 74: 701-712.
Sherwood, RT and Vance, CP. 1976. Histochemistry of papillae formed in reed canarygrass
leaves in response to noninfecting pathogenic fungi. Phytopathology 66: 503-510.
Shimizu, T, Nakano, T, Takamizawa, D, Desaki, Y, Ishii‐Minami, N, Nishizawa, Y, Minami,
E, Okada, K, Yamane, H, Kaku, H and Shibuya, N. 2010. Two LysM receptor molecules,

226
CEBiP and OsCERK1, cooperatively regulate chitin elicitor signaling in rice. The Plant
Journal 64 (2): 204-14.
Shinya, T, Motoyama, N, Ikeda, A, Wada, M, Kamiya, K, Hayafune, M, Kaku, H and
Shibuya, N. 2012. Functional characterization of CEBiP and CERK1 homologs in
Arabidopsis and rice reveals the presence of different chitin receptor systems in plants. Plant
and Cell Physiology 53 (10): 1696-1706.
Singh, RP, Hodson, DP, Huerta-Espino, J, Jin, Y, Njau, P, Wanyera, R, Herrera-Foessel, SA
and Ward, RW. 2008. Will stem rust destroy the world’s wheat crop? Sparks, DL (editor).
Advances in Agronomy 98: 271-309.
Singh, RP, Hodson, DP, Jin, Y, Huerta-Espino, J, Kinyua, MG, Wanyera, R, Njau, P and
Ward, RW. 2006. Current status, likely migration and strategies to mitigate the threat to
wheat production from race Ug99 (TTKS) of stem rust pathogen. Centre for Agriculture and
Bioscience Reviews: Perspectives in Agriculture, Veterinary Science, Nutrition and Natural
Resources 1 (54): 1-13.
Singh, RP, Hodson, DP, Jin, Y, Lagudah, ES, Ayliffe, MA, Bhavani, S, Rouse, MN,
Pretorius, ZA, Szabo, LJ, Huerta-Espino, J, Basnet, BR, Lan, C and Hovmøller, MS. 2015.
Emergence and spread of new races of wheat stem rust fungus: Continued threat to food
security and prospects of genetic control. Phytopathology 105 (7): 872-884.
Skipp, RA, Harder, DE and Samborski, DJ. 1974. Electron microscopy studies on infection
of resistant (Sr6 gene) and susceptible near-isogenic wheat lines by Puccinia graminis f. sp.
tritici. Canadian Journal of Botany 52 (12): 2615-2620.
Skottrup, P, Frøkiær, H, Hearty, S, O'Kennedy, R, Hejgaard, J, Nicolaisen, M and Justesen,
AF. 2007. Monoclonal antibodies for the detection of Puccinia striiformis urediniospores.
Mycological Research 111 (3): 332-338.
Soko, T, Bender, CM, Renee Prins, R and Pretorius, ZA. 2018. Yield loss associated with
different levels of stem rust resistance in bread wheat. Plant Disease: doi:10.1094/PDIS-02-
18-0307-RE.
Song, X, Christof Rampitsch, C, Soltani, B, Mauthe, W, Linning, R, Banks, T, McCallum, B
and Bakkeren, G. 2011. Proteome analysis of wheat leaf rust fungus, Puccinia triticina,
infection structures enriched for haustoria. Proteomics 11: 944-963.

227
Sørensen, CK, Justesen, AF and Hovmøller, MS. 2012. 3-D imaging of temporal and spatial
development of Puccinia striiformis haustoria in wheat. Mycologia 104 (6): 1381-1389.
Sperschneider, J, Catanzariti, AM, DeBoer, K, Petre, B, Gardiner, DM, Singh, KB, Dodds,
PN and Taylor, JM. 2017. LOCALIZER: Subcellular localization prediction of both plant and
effector proteins in the plant cell. Scientific Reports 7: 44598.
Sperschneider, J, Dodds, PN, Gardiner, DM, Singh, KB and Taylor, JM. 2018. Improved
prediction of fungal effector proteins from secretomes with EffectorP 2.0. Molecular Plant
Pathology: doi:10.1111/mpp.12682.
Sperschneider, J, Gardiner, DM, Dodds, PN, Tini, F, Covarelli, L, Singh, KB, Manners, JM
and Taylor, JM. 2015. EffectorP: Predicting fungal effector proteins from secretomes using
machine learning. New Phytologist 210 (2): 743-761.
Sperschneider, J, Ying, H, Dodds, PN, Gardiner, DM, Upadhyaya, NM, Singh, KB, Manners
JM and Taylor, JM. 2014. Diversifying selection in the wheat stem rust fungus acts
predominantly on pathogen-associated gene families and reveals candidate effectors.
Frontiers in Plant Science 5: 372.
Spoel, SH, Koornneef, A, Claessens, SM, Korzelius, JP, Van Pelt, JA, Mueller, MJ, Buchala,
AJ, Métraux, JP, Brown, R, Kazan, K and Van Loon, LC. 2003. NPR1 modulates cross-talk
between salicylate- and jasmonate-dependent defense pathways through a novel function in
the cytosol. The Plant Cell 15 (3): 760-770.
Stakman, EC, Stewart, DM and Loegering, WQ. 1962. Identification of physiologic races of
Puccinia graminis var. tritici. USDA ARS.
Staples, RC, Grambow, HJ, Hoch, HC and Wynn, WK. 1983. Contact with membrane
grooves induces wheat stem rust uredospore germlings to differentiate appressoria but not
vesicles. Phytopathology 73 (10): 1436-1439.
Stein, M, Dittgen, J, Sánchez-Rodríguez, C, Hou, B, Molina, A, Schulze-Lefert, P, Lipka, V
and Somerville, S. 2006. Arabidopsis PEN3/PDR8, an ATP binding cassette transporter,
contributes to nonhost resistance to inappropriate pathogens that enter by direct penetration.
The Plant Cell 18: 731-746.

228
Steuernagel, B, Jupe, F, Witek, K, Jones, JDG and Wulff, BBH. 2015. NLR-parser: Rapid
annotation of plant NLR complements. Bioinformatics 31 (10): 1665-1667.
Steuernagel, B, Periyannan, SK, Hernández-Pinzón, I, Witek, K, Rouse, MN, Yu, G, Hatta.
A, Ayliffe, M, Bariana, H, Jones, JDG, Lagudah, ES and Wulff, BBH. 2016. Rapid cloning
of disease-resistance genes in plants using mutagenesis and sequence capture. Nature
Biotechnology 34: 652-655.
Sticher, L, Mauch-Mani, B and Métraux, JP. 1997. Systemic acquired resistance. Annual
Review of Phytopathology 35: 235-270.
Struck, C, Ernst, M and Hahn, M. 2002. Characterization of a developmentally regulated
amino acid transporter (AAT1p) of the rust fungus Uromyces fabae. Molecular Plant
Pathology 3 (1): 23-30.
Struck, C, Hahn, M and Mendgen, K. 1996. Plasma membrane H+-ATPase activity in spores,
germ tubes, and haustoria of the rust fungus Uromyces viciae-fabae. Fungal Genetics and
Biology 20: 30-35.
Sturn, A, Quackenbush, J and Trajanoski, Z. 2002. Genesis: Cluster analysis of microarray
data. Bioinformatics 18 (1): 207-208.
Sucher, J, Boni, R, Yang, P, Rogowsky, P, Büchner, H, Kastner, C, Kumlehn, J, Krattinger,
SG and Keller, B. 2017. The durable wheat disease resistance gene Lr34 confers common
rust and northern corn leaf blight resistance in maize. Plant Biotechnology Journal 15 (4):
489-496.
Tanaka, S, Brefort, T, Neidig, N, Djamei, A, Kahnt, J, Vermerris, W, Koenig, S, Feussner, K,
Feussner, I and Kahmann, R. 2014. A secreted Ustilago maydis effector promotes virulence
by targeting anthocyanin biosynthesis in maize. eLife 3: e01355.
Tarr, DEK and Alexander HM. 2009. TIR-NBS-LRR genes are rare in monocots: Evidence
from diverse monocot orders. BMC Research Notes 2 (1): 197.
Taylor, S, Wakem, M, Dijkman, G, Alsarraj, M and Nguyen, M. 2010. A practical approach
to RT-qPCR - Publishing data that conform to the MIQE guidelines. Methods 50 (4): S1-S5.
Terefe, TG, Visser, B and Pretorius, ZA. 2016. Variation in Puccinia graminis f. sp. tritici
detected on wheat and triticale in South Africa from 2009 to 2013. Crop Protection 86: 9-16.

229
Terhune, BT and Hoch, HC. 1993. Substrate hydrophobicity and adhesion of Uromyces
urediospores and germlings. Experimental Mycology 17 (4): 241-252.
Thomma, BPHJ, Nelissen, I, Eggermont, K and Broekaert, WF. 1999. Deficiency in
phytoalexin production causes enhanced susceptibility of Arabidopsis thaliana to the fungus
Alternaria brassicicola. The Plant Journal 19 (2): 163-171.
Thordal‐Christensen, H, Zhang, Z, Wei, Y and Collinge, DB. 1997. Subcellular localization
of H2O2 in plants. H2O2 accumulation in papillae and hypersensitive response during the
barley-powdery mildew interaction. The Plant Journal 11 (6): 1187-1194.
Tiburzy, R, Noll, U and Reisener, HJ. 1990. Resistance of wheat to Puccinia graminis f. sp.
tritici: Histological investigation of resistance caused by the Sr5 gene. Physiological and
Molecular Plant Pathology 36 (2): 95-108.
Tulloch AP. 1973. Composition of leaf surface waxes of Triticum species: Variation with age
and tissue. Phytochemistry 12 (9): 2225-2232.
Tyagi, S, Mir, RR, Kaur, H, Chhuneja, P, Ramesh, B, Balyan, HS and Gupta, PK. 2014.
Marker-assisted pyramiding of eight QTLs/genes for seven different traits in common wheat
(Triticum aestivum L.). Molecular Breeding 34 (1): 167-175.
Uddin, MN and Marshall, DR. 1988. Variation in epicuticular wax content in wheat.
Euphytica 38 (1): 3-9.
United States Department of Agriculture (USDA). November 2018. World Agricultural
Production, Circular Series, WAP 11-18.
Upadhyaya, NM, Garnica, DP, Karaoglu, H, Sperschneider, J, Nemri, A, Xu, B, Mago, R,
Cuomo, CA, Rathjen, JP, Park, RF, Ellis, JG and Dodds, PN. 2015. Comparative genomics of
Australian isolates of the wheat stem rust pathogen Puccinia graminis f. sp. tritici reveals
extensive polymorphism in candidate effector genes. Frontiers in Plant Science 5: 759.
Upadhyaya, NM, Mago, R, Staskawicz, BJ, Ayliffe, MA, Ellis, JG and Dodds, PN. 2014. A
bacterial type III secretion assay for delivery of fungal effector proteins into wheat.
Molecular Plant-Microbe Interactions 27 (3): 255-264.

230
Van den Burg, HA, Harrison, SJ, Joosten, MHAJ, Vervoort, J and DeWit PJGM. 2006.
Cladosporium fulvum Avr4 protects fungal cell walls against hydrolysis by plant chitinases
accumulating during infection. Molecular Plant-Microbe Interactions 19 (12): 1420-1430.
Van den Burg, HA, Westerink, N, Francoijs, KJ, Roth, R, Woestenenk E, Boeren, S, de Wit,
PJ, Joosten, MH and Vervoort, J. 2003. Natural disulphide bond-disrupted mutants ofAVR4
of the tomato pathogen Cladosporium fulvum are sensitive to proteolysis, circumvent Cf-4-
mediated resistance, but retain their chitin binding ability. The Journal of Biological
Chemistry 278: 27340-27346.
Van der Biezen, EA and Jones, JDG. 1998a. Plant disease resistance proteins and the gene-
for-gene concept. Trends in Biochemical Science 23: 454-456.
Van der Biezen, EA and Jones, JDG. 1998b.The NB-ARC domain: A novel signalling motif
shared by plant resistance gene products and regulators of cell death in animals. Current
Biology 8 (7): R226-R227.
Van der Hoorn, RAL and Kamoun, S. 2008. From guard to decoy: A new model for
perception of plant pathogen effectors. The Plant Cell 20: 2009-2017.
Van Loon, LC. 1997. Induced resistance in plants and the role of pathogenesis-related
proteins. European Journal of Plant Pathology 103 (9): 753-765.
Van Loon, LC, Rep, M and Pieterse, CMJ. 2006. Significance of inducible defence-related
proteins in infected plants. Annual Review Phytopathology 44: 135-162.
Vandesompele, J, De Preter, K, Pattyn, F, Poppe, B, Van Roy, N, De Paepe, A and Speleman,
F. 2002. Accurate normalization of real-time quantitative RT-PCR data by geometric
averaging of multiple internal control genes. Genome Biology 3 (7): 0034.1-0034.11.
Visser, B, Herselman, L, Park, RF, Karaoglu, H, Bender, CM and Pretorius, ZA. 2011.
Characterization of two new Puccinia graminis f. sp. tritici races within the Ug99 lineage in
South Africa. Euphytica 179 (1): 119-127.
Vleeshouwers, VG and Oliver, RP. 2014. Effectors as tools in disease resistance breeding
against biotrophic, hemibiotrophic, and necrotrophic plant pathogens. Molecular Plant-
Microbe Interactions 27 (3): 196-206.

231
Voegele, RT and Mendgen, KW. 2011. Nutrient uptake in rust fungi: How sweet is parasitic
life? Euphytica 179 (1): 41-55.
Voegele, RT and Schmid, A. 2011. RT real-time PCR-based quantification of Uromyces
fabae in planta. Federation of European Microbiological Societies Microbiology Letters 322:
131-137.
Voegele, RT, Hahn, M and Mendgen, K. 2009. The uredinales: Cytology, biochemistry, and
molecular biology. Deising, HB. (editor). Plant Relationships Volume V The Mycota: 69-98.
Voegele, RT, Struck, C, Hahn, M and Mendgen, K. 2001. The role of haustoria in sugar
supply during infection of broad bean by the rust fungus Uromyces fabae. Proceedings of the
National Academy of Sciences, USA 98 (14): 8133-8138.
Voigt, CA and Wilhelm Schäfer, W and Salomon, S. 2005. Secreted lipase of Fusarium
graminearum is a virulence factor required for infection of cereals. The Plant Journal (2005)
42: 364-375.
Wang, C, Huang, L, Buchenauer, H, Han, Q, Zhang, H and Kang, Z. 2007. Histochemical
studies on the accumulation of reactive oxygen species (O2- and H2O2) in the incompatible
and compatible interaction of wheat-Puccinia striiformis f. sp. tritici. Physiological and
Molecular Plant Pathology 71 (4): 230-239.
Wang, C, Huang, L, Zhang, H, Han, Q, Buchenauer, H and Kang, Z. 2010. Cytochemical
localization of reactive oxygen species (O2- and H2O2) and peroxidase in the incompatible
and compatible interaction of wheat-Puccinia striiformis f. sp. tritici. Physiological and
Molecular Plant Pathology 74: 221-229.
Wang, X, McCallum, BD, Fetch, T, Bakkeren, G and Saville, BJ. 2015. Sr36- and Sr5-
mediated resistance response to Puccinia graminis f. sp. tritici is associated with callose
deposition in wheat guard cells. Phytopathology 105 (6): 728-737.
Wang, X, Richards, J, Gross, T, Druka, A, Kleinhofs, A, Steffenson, B Acevedo, M and
Brueggeman, R. 2013. The rpg4-mediated resistance to wheat stem rust (Puccinia graminis)
in barley (Hordeum vulgare) requires Rpg5, a second NBS-LRR gene, and an actin
depolymerization factor. Molecular Plant-Microbe Interactions 26 (4): 407-418.

232
Wang, Z, Gerstein, M and Snyder, M. 2009. RNA-Seq: A revolutionary tool for
transcriptomics. Nature Reviews Genetics 10 (1): 57.
Wanyera, R, Kinyua, MG, Jin, Y and Singh, RP. 2006. The spread of stem rust caused by
Puccinia graminis f. sp. tritici, with virulence on Sr31 in wheat in eastern Africa. Plant
Disease 90: 113.
Wesp-Guterres, C, Martinelli, JA, Graichen, FAS and Chaves, MS. 2013. Histopathology of
durable adult plant resistance to leaf rust in the Brazilian wheat variety Toropi. European
Journal of Plant Pathology 137: 181-196.
Wiethölter, N, Horn, S, Reisige, K, Beike, U and Moerschbacher, BM. 2003. In vitro
differentiation of haustorial mother cells of the wheat stem rust fungus, Puccinia graminis f.
sp. tritici, triggered by synergistic action of chemical and physical signals. Fungal Genetics
and Biology 38 (3): 320-326.
Williams, PG. 1971. A new perspective of the axenic culture of Puccinia graminis f. sp.
tritici from uredospores. Phytopathology 61: 994-1002.
Williams, SJ, Sohn, KH, Wan, L, Bernoux, M, Sarris, PF, Segonzac, C, Ve, T, Ma, Y,
Saucet, SB, Ericsson, DJ, Casey, LW, Lonhienne, T, Winzor, DJ, Zhang, X, Coerdt, A,
Parker, JE, Dodds, PN, Kobe, B and Jones, JDG. 2014. Structural basis for assembly and
function of a heterodimeric plant immune receptor. Science 344: 299-303.
Wu, C, Krasileva, KV, Banfield, MJ, Terauchi, R and Kamoun, S. 2015. The “sensor
domains” of plant NLR proteins: More than decoys? Frontiers in Plant Science 6: 134.
Wynn, WK and Wilmot, VA. 1977. Growth of germ tubes of the wheat stem rust fungus on
leaves and leaf replicas. Annual Proceedings of the American Phytopathological Society 4:
129.
Wynn, WK. 1976. Appressorium formation over stomates by bean rust fungus: Response to a
surface contact stimulus. Phytopathology 66 (2): 136-146.
Yamaguchi, T, Akira Yamada, A, Hong, N, Ogawa, T, Ishii, T and Shibuyaa, N. 2000.
Differences in the recognition of glucan elicitor signals between rice and soybean: β-glucan
fragments from the rice blast disease fungus Pyricularia oryzae that elicit phytoalexin
biosynthesis in suspension-cultured rice cells. The Plant Cell 12: 817-826.

233
Yin, C and Hulbert, S. 2011. Prospects for functional analysis of effectors from cereal rust
fungi. Euphytica 179: 57-67.
Yin, C, Chen, X, Wang, X, Han, Q, Kang, Z and Hulbert, S.H. 2009. Generation and analysis
of expression sequence tags from haustoria of the wheat stripe rust fungus Puccinia
striiformis f. sp. tritici. BMC Genomics 10 (1): 626.
Yin, C, Downey, SI, Klages-Mundt NL, Ramachandran, S, Chen, X, Szabo, LJ, Pumphrey,
M and Hulbert, SH. 2015. Identification of promising host-induced silencing targets among
genes preferentially transcribed in haustoria of Puccinia. BMC Genomics 16: 579.
Yu, LX, Barbier, H, Rouse, MN, Singh, S, Singh, RP, Bhavani, S, Huerta-Espino, J and
Sorrells, ME. 2014. A consensus map for Ug99 stem rust resistance loci in wheat. Theoretical
and Applied Genetics 127 (7): 1561-1581.
Zadoks, JC, Chang, TT and Konzak, CF. 1974. A decimal code for the growth stages of
cereals. Weed Research 14 (6): 415-421.
Zhang, H, Wang, C, Cheng, Y, Chen, X, Han, Q, Huang, L, Wei, G and Kang, Z. 2012.
Histological and cytological characterization of adult plant resistance to wheat stripe rust.
Plant Cell Reports 31 (12): 2121-2137.
Zhang, W, Chen, S, Abate, Z, Nirmala, J, Rouse, MN and Dubcovsky, J. 2017. Identification
and characterization of Sr13, a tetraploid wheat gene that confers resistance to the Ug99 stem
rust race group. Proceedings of the National Academy of Sciences, USA:
doi/10.1073/pnas.1706277114.
Zhao, S, Xi, L and Zhang, B. 2015. Union exon based approach for RNA-seq gene
quantification: To be or not to be? PLOS ONE 10 (11): e0141910.
Zipfel, C. 2014. Plant pattern-recognition receptors. Trends in Immunology 35 (7): 345-351.
Zurn, JD, Dugyala, S, Borowicz, P, Brueggeman, R and Acevedo, M. 2015. Unraveling the
wheat stem rust infection process on barley genotypes through relative qPCR and
fluorescence microscopy. Phytopathology 105 (5): 707-712.
![Cellular Stresses and Stress Responses in the Pathogenesis of … · 2019. 7. 30. · develop insulin resistance [19–26]. Some of the cellular events and mechanisms that have been](https://img.pdfslide.us/doc/110x75/611ba0e1b4eb070bc95a7aef/cellular-stresses-and-stress-responses-in-the-pathogenesis-of-2019-7-30-develop.jpg)


![Cellular and Genetic Characterization of Human Adult Bone ... · [CANCER RESEARCH 63, 8877–8889, December 15, 2003] Cellular and Genetic Characterization of Human Adult Bone Marrow-Derived](https://img.pdfslide.us/doc/110x75/5e1844e643aa1926e153a88b/cellular-and-genetic-characterization-of-human-adult-bone-cancer-research-63.jpg)