Embed Size (px)
Citation preview


July 2004
Environmental Technology Verification Report
MOLECULAR ANALYTICS IONPRO-IMS AMMONIA ANALYZER
Prepared by Battelle
In collaboration with the U.S. Department of Agriculture
Under a cooperative agreement with
U.S. Environmental Protection Agency

July 2004
Environmental Technology VerificationReport
ETV Advanced Monitoring Systems Center
Molecular AnalyticsIonPro-IMS Ammonia Analyzer
byKen Cowen
Ann Louise SumnerAmy DindalKaren Riggs
Zack Willenberg
BattelleColumbus, Ohio 43201
andJerry Hatfield
Richard PfiefferKenwood Scoggin
USDA National Soil Tilth LaboratoryAmes, Iowa 50011

Notice
The U.S. Environmental Protection Agency (EPA), through its Office of Research and Development, has financially supported and collaborated in the extramural program described here. This document has been peer reviewed by the Agency. Mention of trade names or commercial products does not constitute endorsement or recommendation by the EPA for use.
ii

Foreword
The U.S. Environmental Protection Agency (EPA) is charged by Congress with protecting the nation’s air, water, and land resources. Under a mandate of national environmental laws, the Agency strives to formulate and implement actions leading to a compatible balance between human activities and the ability of natural systems to support and nurture life. To meet this mandate, the EPA’s Office of Research and Development provides data and science support that can be used to solve environmental problems and to build the scientific knowledge base needed to manage our ecological resources wisely, to understand how pollutants affect our health, and to prevent or reduce environmental risks.
The Environmental Technology Verification (ETV) Program has been established by the EPA to verify the performance characteristics of innovative environmental technology across all media and to report this objective information to permitters, buyers, and users of the technology, thus substantially accelerating the entrance of new environmental technologies into the marketplace. Verification organizations oversee and report verification activities based on testing and quality assurance protocols developed with input from major stakeholders and customer groups associated with the technology area. ETV consists of seven environmental technology centers. Information about each of these centers can be found on the Internet at http://www.epa.gov/etv/.
Effective verifications of monitoring technologies are needed to assess environmental quality and to supply cost and performance data to select the most appropriate technology for that assessment. Under a cooperative agreement, Battelle has received EPA funding to plan, coordinate, and conduct such verification tests for “Advanced Monitoring Systems for Air, Water, and Soil” and report the results to the community at large. Information concerning this specific environmental technology area can be found on the Internet at http://www.epa.gov/etv/centers/center1.html.
iii
Acknowledgments
The authors wish to acknowledge the support of all those who helped plan and conduct the verification test, analyze the data, and prepare this report. We would like to thank Ernie Bouffard, Connecticut Department of Environmental Protection; Rudy Eden, South Coast Air Quality Management District; Roy Owens, Owens Corning; and Jim Homolya, Bruce Harris, and Linda Sheldon, U.S. Environmental Protection Agency, for their careful review of the verification test/QA plan and/or this verification report. We also thank Amy Morrow and Diane Farris of the U.S. Department of Agriculture National Soil Tilth Laboratory for their assistance in performing the reference sample analysis.
iv
Contents Page
Notice . . . . . . . . . . . . . . . . . . . . . . . . . . . . . . . . . . . . . . . . . . . . . . . . . . . . . . . . . . . . . . . . . . . . . ii
Foreword . . . . . . . . . . . . . . . . . . . . . . . . . . . . . . . . . . . . . . . . . . . . . . . . . . . . . . . . . . . . . . . . . iii
Acknowledgments . . . . . . . . . . . . . . . . . . . . . . . . . . . . . . . . . . . . . . . . . . . . . . . . . . . . . . . . . . iv
List of Abbreviations . . . . . . . . . . . . . . . . . . . . . . . . . . . . . . . . . . . . . . . . . . . . . . . . . . . . . . . viii
1 Background . . . . . . . . . . . . . . . . . . . . . . . . . . . . . . . . . . . . . . . . . . . . . . . . . . . . . . . . . . . . . . 1
2 Technology Description . . . . . . . . . . . . . . . . . . . . . . . . . . . . . . . . . . . . . . . . . . . . . . . . . . . . . 2
3 Test Design and Procedures . . . . . . . . . . . . . . . . . . . . . . . . . . . . . . . . . . . . . . . . . . . . . . . . . . 4 3.1 Test Design . . . . . . . . . . . . . . . . . . . . . . . . . . . . . . . . . . . . . . . . . . . . . . . . . . . . . . . 4 3.2 Site Description—Phase II . . . . . . . . . . . . . . . . . . . . . . . . . . . . . . . . . . . . . . . . . . . . 5 3.3 Test Procedures . . . . . . . . . . . . . . . . . . . . . . . . . . . . . . . . . . . . . . . . . . . . . . . . . . . . 6
3.3.1 Accuracy, Linearity, Precision, and Response Time . . . . . . . . . . . . . . . . . . . 6 3.3.2 Calibration and Zero Drift . . . . . . . . . . . . . . . . . . . . . . . . . . . . . . . . . . . . . . 6 3.3.3 Interference Effects . . . . . . . . . . . . . . . . . . . . . . . . . . . . . . . . . . . . . . . . . . . 6 3.3.4 Comparability . . . . . . . . . . . . . . . . . . . . . . . . . . . . . . . . . . . . . . . . . . . . . . . 7
4 Quality Assurance/Quality Control . . . . . . . . . . . . . . . . . . . . . . . . . . . . . . . . . . . . . . . . . . . . . 9 4.1 Equipment Calibrations . . . . . . . . . . . . . . . . . . . . . . . . . . . . . . . . . . . . . . . . . . . . . . 9
4.1.1 Reference Method Sampling Equipment . . . . . . . . . . . . . . . . . . . . . . . . . . . 9 4.1.2 Analytical Equipment . . . . . . . . . . . . . . . . . . . . . . . . . . . . . . . . . . . . . . . . . 9 4.1.3 Meteorological Equipment . . . . . . . . . . . . . . . . . . . . . . . . . . . . . . . . . . . . . 10 4.1.4 Ammonia Dilution System . . . . . . . . . . . . . . . . . . . . . . . . . . . . . . . . . . . . . 10
4.2 QC Samples . . . . . . . . . . . . . . . . . . . . . . . . . . . . . . . . . . . . . . . . . . . . . . . . . . . . . . 10 4.2.1 Field Blanks . . . . . . . . . . . . . . . . . . . . . . . . . . . . . . . . . . . . . . . . . . . . . . . . 10 4.2.2 Denuder Breakthrough Checks . . . . . . . . . . . . . . . . . . . . . . . . . . . . . . . . . 11 4.2.3 Duplicate Samples . . . . . . . . . . . . . . . . . . . . . . . . . . . . . . . . . . . . . . . . . . . 13 4.2.4 Laboratory Blanks . . . . . . . . . . . . . . . . . . . . . . . . . . . . . . . . . . . . . . . . . . . 13 4.2.5 Calibration Checks . . . . . . . . . . . . . . . . . . . . . . . . . . . . . . . . . . . . . . . . . . . 14 4.2.6 Gas Standard Dilution Checks . . . . . . . . . . . . . . . . . . . . . . . . . . . . . . . . . . 14
4.3 Audits . . . . . . . . . . . . . . . . . . . . . . . . . . . . . . . . . . . . . . . . . . . . . . . . . . . . . . . . . . 15 4.3.1 Performance Evaluation Audit . . . . . . . . . . . . . . . . . . . . . . . . . . . . . . . . . . 15 4.3.2 Technical Systems Audit . . . . . . . . . . . . . . . . . . . . . . . . . . . . . . . . . . . . . . 16 4.3.3 Audit of Data Quality . . . . . . . . . . . . . . . . . . . . . . . . . . . . . . . . . . . . . . . . . 16
4.4 QA/QC Reporting . . . . . . . . . . . . . . . . . . . . . . . . . . . . . . . . . . . . . . . . . . . . . . . . . 16 4.5 Data Review . . . . . . . . . . . . . . . . . . . . . . . . . . . . . . . . . . . . . . . . . . . . . . . . . . . . . 17
v
5 Statistical Methods and Reported Parameters . . . . . . . . . . . . . . . . . . . . . . . . . . . . . . . . . . . . 18 5.1 Relative Accuracy . . . . . . . . . . . . . . . . . . . . . . . . . . . . . . . . . . . . . . . . . . . . . . . . . 18 5.2 Linearity . . . . . . . . . . . . . . . . . . . . . . . . . . . . . . . . . . . . . . . . . . . . . . . . . . . . . . . . 18 5.3 Precision . . . . . . . . . . . . . . . . . . . . . . . . . . . . . . . . . . . . . . . . . . . . . . . . . . . . . . . . 19 5.4 Response Time . . . . . . . . . . . . . . . . . . . . . . . . . . . . . . . . . . . . . . . . . . . . . . . . . . . . 19 5.5 Calibration and Zero Drift . . . . . . . . . . . . . . . . . . . . . . . . . . . . . . . . . . . . . . . . . . . 19 5.6 Interference Effects . . . . . . . . . . . . . . . . . . . . . . . . . . . . . . . . . . . . . . . . . . . . . . . . 19 5.7 Comparability . . . . . . . . . . . . . . . . . . . . . . . . . . . . . . . . . . . . . . . . . . . . . . . . . . . . 20
6 Test Results . . . . . . . . . . . . . . . . . . . . . . . . . . . . . . . . . . . . . . . . . . . . . . . . . . . . . . . . . . . . . . 21 6.1 Relative Accuracy . . . . . . . . . . . . . . . . . . . . . . . . . . . . . . . . . . . . . . . . . . . . . . . . . 22 6.2 Linearity . . . . . . . . . . . . . . . . . . . . . . . . . . . . . . . . . . . . . . . . . . . . . . . . . . . . . . . . 23 6.3 Precision . . . . . . . . . . . . . . . . . . . . . . . . . . . . . . . . . . . . . . . . . . . . . . . . . . . . . . . . 23 6.4 Response Time . . . . . . . . . . . . . . . . . . . . . . . . . . . . . . . . . . . . . . . . . . . . . . . . . . . . 25 6.5 Calibration and Zero Drift . . . . . . . . . . . . . . . . . . . . . . . . . . . . . . . . . . . . . . . . . . . 25 6.6 Interference Effects . . . . . . . . . . . . . . . . . . . . . . . . . . . . . . . . . . . . . . . . . . . . . . . . 26 6.7 Comparability . . . . . . . . . . . . . . . . . . . . . . . . . . . . . . . . . . . . . . . . . . . . . . . . . . . . 27 6.8 Ease of Use . . . . . . . . . . . . . . . . . . . . . . . . . . . . . . . . . . . . . . . . . . . . . . . . . . . . . . 29 6.9 Data Completeness . . . . . . . . . . . . . . . . . . . . . . . . . . . . . . . . . . . . . . . . . . . . . . . . 29
7 Performance Summary . . . . . . . . . . . . . . . . . . . . . . . . . . . . . . . . . . . . . . . . . . . . . . . . . . . . . 31
8 References . . . . . . . . . . . . . . . . . . . . . . . . . . . . . . . . . . . . . . . . . . . . . . . . . . . . . . . . . . . . . . 32
Appendix A. IonPro-IMS Checklist . . . . . . . . . . . . . . . . . . . . . . . . . . . . . . . . . . . . . . . . . . . . A-1
Figures
Figure 2-1. IonPro-IMS Ammonia Analyzer . . . . . . . . . . . . . . . . . . . . . . . . . . . . . . . . . . . . . . 2 Figure 3-1. Phase II Test Site . . . . . . . . . . . . . . . . . . . . . . . . . . . . . . . . . . . . . . . . . . . . . . . . . . 5 Figure 3-2. Reference Method Sampling Cartridge . . . . . . . . . . . . . . . . . . . . . . . . . . . . . . . . . 7 Figure 4-1. Denuder Breakthrough During Phase II as a Function of
Integrated Ammonia Concentration. . . . . . . . . . . . . . . . . . . . . . . . . . . . . . . . . . . 12 Figure 4-2. Analysis of Diluted Ammonia Standards Using the Denuder Reference
Method . . . . . . . . . . . . . . . . . . . . . . . . . . . . . . . . . . . . . . . . . . . . . . . . . . . . . . . . . 15 Figure 6-1. Phase II Meteorological Conditions and
IonPro-IMS Ambient NH3 Measurements . . . . . . . . . . . . . . . . . . . . . . . . . . . . . . 21 Figure 6-2. Phase II Accuracy Results for the IonPro-IMS . . . . . . . . . . . . . . . . . . . . . . . . . . . 22 Figure 6-3. Results of Linearity Check of the IonPro-IMS During Phase II . . . . . . . . . . . . . . 24 Figure 6-4. Comparison of Ambient Reference Measurements with Averages from
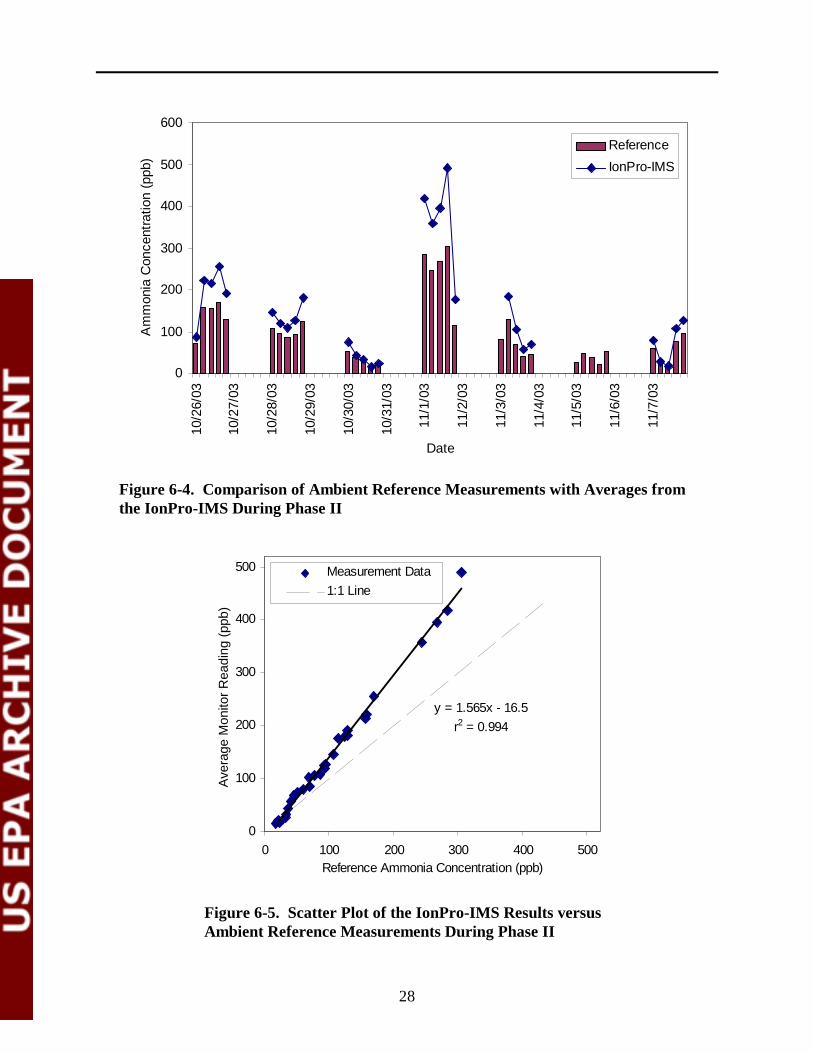
the IonPro-IMS During Phase II . . . . . . . . . . . . . . . . . . . . . . . . . . . . . . . . . . . . . . 28 Figure 6-5. Scatter Plot of the IonPro-IMS Results versus Ambient Reference
Measurements During Phase II . . . . . . . . . . . . . . . . . . . . . . . . . . . . . . . . . . . . . . 28
vi
Tables
Table 4-1. Minimum Detectable Ambient NH3 Concentrations During Phase II . . . . . . . . . 11 Table 4-2. Denuder Breakthrough Checks During Phase II . . . . . . . . . . . . . . . . . . . . . . . . . 13 Table 4-3. Duplicate Sampling During Phase II . . . . . . . . . . . . . . . . . . . . . . . . . . . . . . . . . . 14 Table 4-4. Data Recording Process . . . . . . . . . . . . . . . . . . . . . . . . . . . . . . . . . . . . . . . . . . . . 17 Table 6-1. Relative Accuracy Results . . . . . . . . . . . . . . . . . . . . . . . . . . . . . . . . . . . . . . . . . . 23 Table 6-2. Calculated Precision of the IonPro-IMS . . . . . . . . . . . . . . . . . . . . . . . . . . . . . . . . 24 Table 6-3. Response Time Determinations . . . . . . . . . . . . . . . . . . . . . . . . . . . . . . . . . . . . . . 25 Table 6-4. Calibration and Zero Checks During Phase II . . . . . . . . . . . . . . . . . . . . . . . . . . . 26 Table 6-5. Interference Effect Evaluation . . . . . . . . . . . . . . . . . . . . . . . . . . . . . . . . . . . . . . . 27 Table 6-6. Activities Performed During Phase II . . . . . . . . . . . . . . . . . . . . . . . . . . . . . . . . . . 30 Table 7-1. Performance Summary of the IonPro-IMS . . . . . . . . . . . . . . . . . . . . . . . . . . . . . . 31
vii

List of Abbreviations
AFO animal feeding operation
AMS Advanced Monitoring Systems
CI confidence interval
DL detection limit
EPA U.S. Environmental Protection Agency
ETV Environmental Technology Verification
FIA flow injection analysis/analyzer
IMS ion mobility spectroscopy
L liter
Lpm liters per minute
:g microgram
mg milligram
mL milliliter
NIST National Institute of Standards and Technology
NH3 ammonia
NH4 + ammonium
ppb part per billion
%D percent difference
QA quality assurance
QC quality control
QMP quality management plan
RA relative accuracy
RPD relative percent difference
RSD relative standard deviation
SD standard deviation
TSA technical systems audit
USDA U.S. Department of Agriculture
viii
Chapter 1 Background
The U.S. Environmental Protection Agency (EPA) supports the Environmental Technology Verification (ETV) Program to facilitate the deployment of innovative environmental technologies through performance verification and dissemination of information. The goal of the ETV Program is to further environmental protection by accelerating the acceptance and use of improved and cost-effective technologies. ETV seeks to achieve this goal by providing highquality, peer-reviewed data on technology performance to those involved in the design, distribution, financing, permitting, purchase, and use of environmental technologies.
ETV works in partnership with recognized testing organizations; with stakeholder groups consisting of buyers, vendor organizations, and permitters; and with the full participation of individual technology developers. The program evaluates the performance of innovative technologies by developing test plans that are responsive to the needs of stakeholders, conducting field or laboratory tests (as appropriate), collecting and analyzing data, and preparing peerreviewed reports. All evaluations are conducted in accordance with rigorous quality assurance (QA) protocols to ensure that data of known and adequate quality are generated and that the results are defensible.
The EPA’s National Exposure Research Laboratory and its verification organization partner, Battelle, operate the Advanced Monitoring Systems (AMS) Center under ETV. The AMS Center, in collaboration with the U.S. Department of Agriculture’s (USDA) National Soil Tilth Laboratory, recently evaluated the performance of the Molecular Analytics IonPro-IMSTM
ammonia (NH3) analyzer.
1
Chapter 2 Technology Description
The objective of the ETV AMS Center is to verify the performance characteristics of environmental monitoring technologies for air, water, and soil. This verification report provides results for the verification testing of the IonPro-IMS. The following is a description of the IonPro-IMS, based on information provided by the vendor. The information provided below was not subjected to verification in this test.
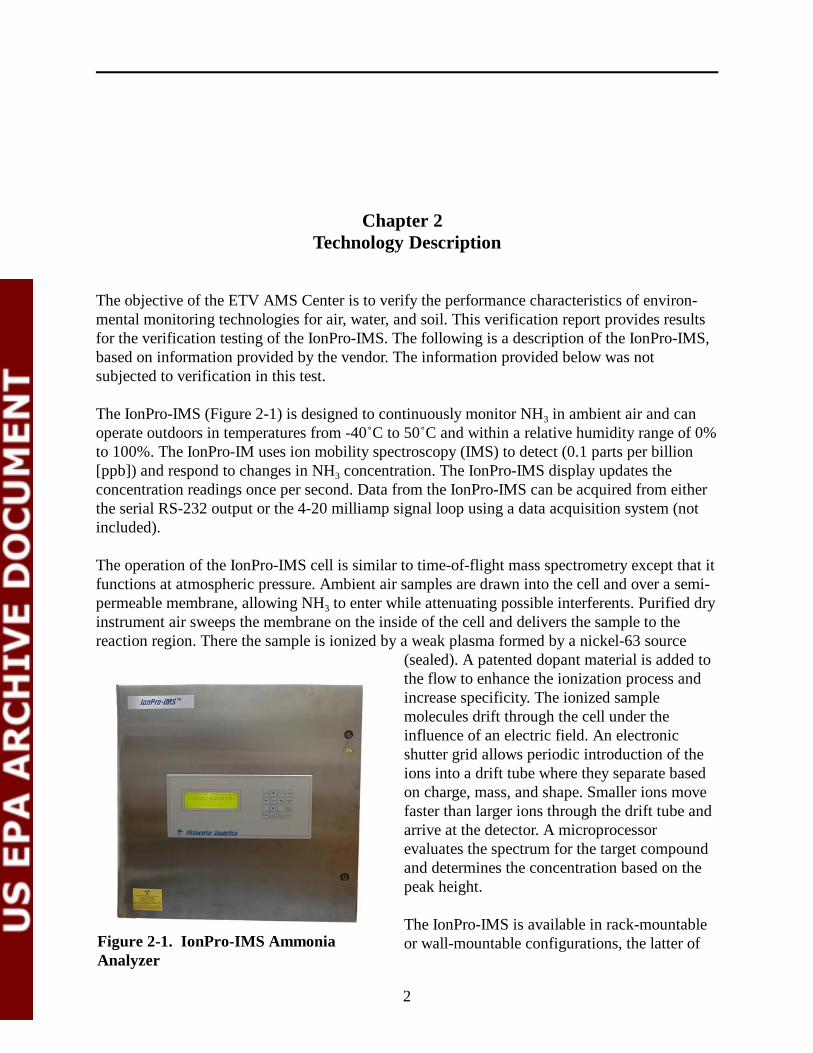
The IonPro-IMS (Figure 2-1) is designed to continuously monitor NH3 in ambient air and can operate outdoors in temperatures from -40/C to 50/C and within a relative humidity range of 0% to 100%. The IonPro-IM uses ion mobility spectroscopy (IMS) to detect (0.1 parts per billion [ppb]) and respond to changes in NH3 concentration. The IonPro-IMS display updates the concentration readings once per second. Data from the IonPro-IMS can be acquired from either the serial RS-232 output or the 4-20 milliamp signal loop using a data acquisition system (not included).
The operation of the IonPro-IMS cell is similar to time-of-flight mass spectrometry except that it functions at atmospheric pressure. Ambient air samples are drawn into the cell and over a semipermeable membrane, allowing NH3 to enter while attenuating possible interferents. Purified dry instrument air sweeps the membrane on the inside of the cell and delivers the sample to the reaction region. There the sample is ionized by a weak plasma formed by a nickel-63 source
(sealed). A patented dopant material is added to the flow to enhance the ionization process and increase specificity. The ionized sample molecules drift through the cell under the influence of an electric field. An electronic shutter grid allows periodic introduction of the ions into a drift tube where they separate based on charge, mass, and shape. Smaller ions move faster than larger ions through the drift tube and arrive at the detector. A microprocessor evaluates the spectrum for the target compound and determines the concentration based on the peak height.
The IonPro-IMS is available in rack-mountable or wall-mountable configurations, the latter of
2
Figure 2-1. IonPro-IMS Ammonia Analyzer

which can be used for outdoor applications. The IonPro-IMS weighs approximately 23 kilograms. The only safety precaution necessary for the sealed nickel-63 source is a semiannual wipe test. An on-board permeation generator option enables field calibration of the IonPro-IMS. The IonPro-IMS is capable of sampling through four separate channels for multipoint sampling. The cost of the IonPro-IMS ranges from $28,900 to $78,900, depending on selected options.
3

Chapter 3 Test Design and Procedures
3.1 Test Design
Livestock agriculture is thought to be the primary source of atmospheric NH3 in the United States and accounts for approximately 70% of NH3 emissions in the United States.(1) As a result, a means to accurately quantify these emissions is needed. The objective of this verification test was to verify the IonPro-IMS’s performance in measuring gaseous NH3 in ambient air at animal feeding operations (AFOs).
This verification test was conducted according to procedures specified in the Test/QA Plan for Verification of Ambient Ammonia Monitors at Animal Feeding Operations,(2) with the exception of six deviations that are addressed later in this report. The verification test was conducted in two phases, each at separate AFOs. The first phase of testing was conducted between September 8 and October 3, 2003, at a swine finishing farm near Ames, Iowa. The second phase was conducted between October 20 and November 14, 2003, at a cattle feedlot in Carroll, Iowa. These sites were selected to provide realistic testing conditions, which were expected to exhibit a wide range of NH3 concentrations during the test periods.
The verification test was designed to evaluate the following performance parameters:
P Relative accuracy P Linearity P Precision P Response time P Calibration/zero drift P Interference effects P Comparability P Ease of use P Data completeness.
The IonPro-IMS was not available during Phase I of the verification test. However, during Phase II of the verification test, the IonPro-IMS response to a series of NH3 gas standards of known concentration was used to quantify relative accuracy (RA), linearity, precision (repeatability), and calibration/zero drift. The IonPro-IMS response time, the time to reach 95% of the stable signal, was also assessed during the delivery of the NH3 standards. During Phase II, interference effects were quantified from the IonPro-IMS response to various chemical species that may be
4
present at AFOs; the potential interferent gases were delivered both in the presence and absence of NH3. The IonPro-IMS response to ambient air also was evaluated during Phase II as the comparability to simultaneous determinations by an ambient NH3 reference method (acid-coated denuders). Additionally, the ease of use of the IonPro-IMS was evaluated based on operator observations. Data completeness was determined based on the amount of data collected as a percentage of the amount of data that could have been collected.
3.2 Site Description—Phase II
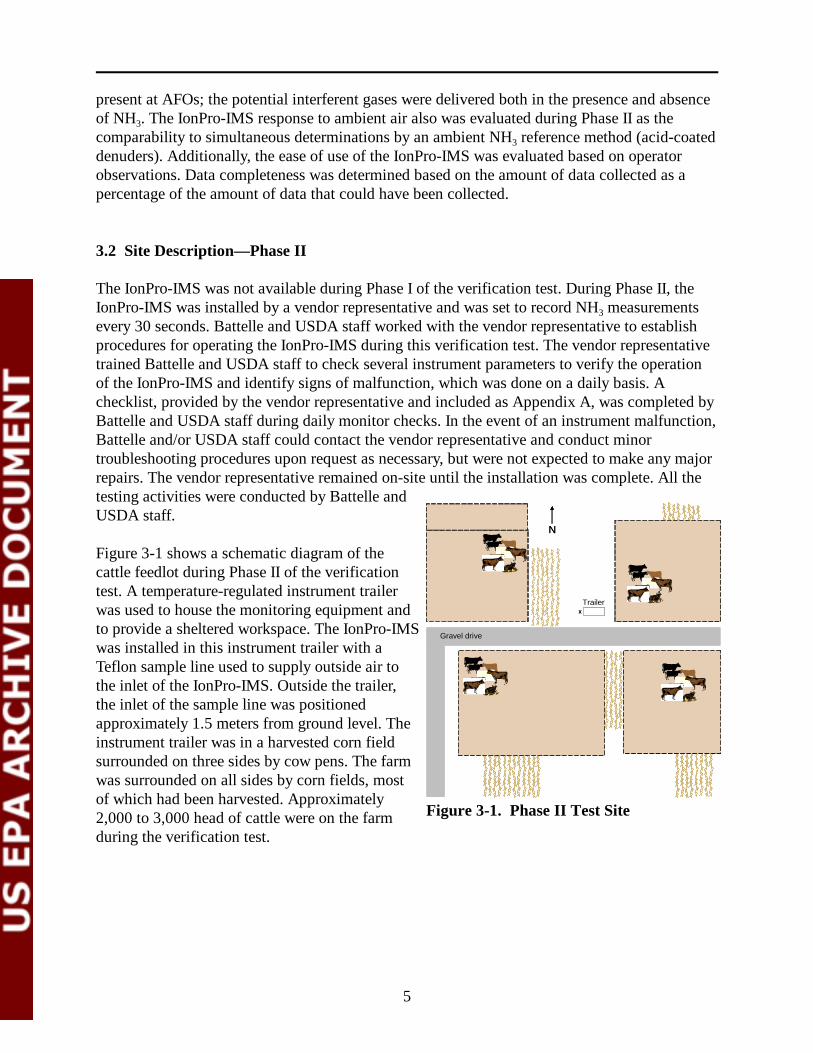
The IonPro-IMS was not available during Phase I of the verification test. During Phase II, the IonPro-IMS was installed by a vendor representative and was set to record NH3 measurements every 30 seconds. Battelle and USDA staff worked with the vendor representative to establish procedures for operating the IonPro-IMS during this verification test. The vendor representative trained Battelle and USDA staff to check several instrument parameters to verify the operation of the IonPro-IMS and identify signs of malfunction, which was done on a daily basis. A checklist, provided by the vendor representative and included as Appendix A, was completed by Battelle and USDA staff during daily monitor checks. In the event of an instrument malfunction, Battelle and/or USDA staff could contact the vendor representative and conduct minor troubleshooting procedures upon request as necessary, but were not expected to make any major repairs. The vendor representative remained on-site until the installation was complete. All the testing activities were conducted by Battelle and USDA staff.
NN
Figure 3-1 shows a schematic diagram of the cattle feedlot during Phase II of the verification test. A temperature-regulated instrument trailer
Trailer xxwas used to house the monitoring equipment and
to provide a sheltered workspace. The IonPro-IMS Gravel drive
was installed in this instrument trailer with a Teflon sample line used to supply outside air to the inlet of the IonPro-IMS. Outside the trailer, the inlet of the sample line was positioned approximately 1.5 meters from ground level. The instrument trailer was in a harvested corn field surrounded on three sides by cow pens. The farm was surrounded on all sides by corn fields, most of which had been harvested. Approximately 2,000 to 3,000 head of cattle were on the farm Figure 3-1. Phase II Test Site
during the verification test.
5
3.3 Test Procedures
3.3.1 Accuracy, Linearity, Precision, and Response Time
During the first week of Phase II, the IonPro-IMS was independently supplied with compressed NH3 gas standards to achieve NH3 concentrations over a range from 0 to 2,000 ppb to simulate the approximate range expected in ambient air during Phase II. The gases delivered to the IonPro-IMS were prepared by diluting higher-concentration NH3 standard gases (i.e., 100 to 500 parts per million) in zero air using a calibrated dilution system provided by the USDA.
The NH3 gas was supplied to the IonPro-IMS for approximately 30 minutes at each concentration level. Accuracy, linearity, and precision were established based on the continuous digital data set recorded by the IonPro-IMS during the periods when the NH3 gas was supplied. Data were used for the calculations once the signal had stabilized at a constant concentration (i.e., the signal did not appear to be increasing or decreasing with time). The time required to reach 95% of the change in the stable reading for each concentration was also recorded for the IonPro-IMS. These data were used to assess the response time of the IonPro-IMS.
3.3.2 Calibration and Zero Drift
On Monday, Wednesday, and Friday of the first and last (fourth) week of testing during Phase II, the IonPro-IMS was supplied with an NH3 gas standard at nominally 1,000 ppb and zero air to check the calibration and zero drift of the IonPro-IMS, respectively. The 1,000-ppb NH3
standard and zero air were each supplied to the IonPro-IMS for between 30 and 60 minutes, during which time the measured concentrations were recorded by the IonPro-IMS.
3.3.3 Interference Effects
Once during Phase II, the IonPro-IMS was independently supplied with a series of potential interference gases (hydrogen sulfide, nitrogen dioxide, 1,3-butadiene, and diethylamine) to assess any impact the gases have on the IonPro-IMS response. The interferent gases were supplied from diffusion tubes (VICI Metronics, Poulsbo, Washington) at concentrations of approximately 100 to 300 ppb in zero air and a 500-ppb NH3 standard as carrier gases.
The process for supplying the interferent gases was as follows: zero air was supplied to the IonPro-IMS until a stable reading was achieved. The interferent gas was added to the zero air flow and supplied to the IonPro-IMS until a stable reading was observed (at least 2 minutes). The IonPro-IMS was flushed for at least 2 minutes with zero air, and the next interferent gas was delivered. This process was repeated for the four interferent gases. A 500-ppb NH3 standard was then supplied to the IonPro-IMS until a stable reading was achieved. The interferent gas was added to the NH3 standard for delivery to the IonPro-IMS, and the process outlined above was repeated, delivering the 500-ppb NH3 standard for at least 2 minutes between each interferent gas.
6
Gases and Acidity of Fine Particles (< 2.5 µm).(3)
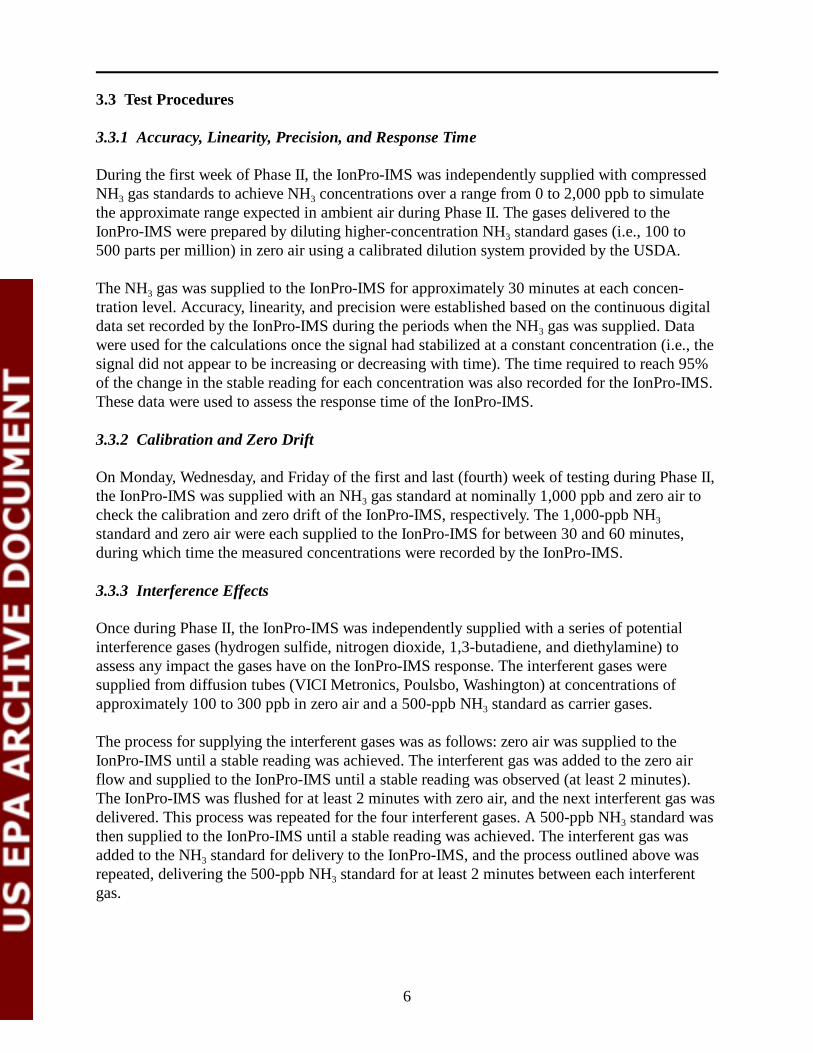
For this test, NH3 samples were collected using a ChemComb Model 3500 Speciation Sampling
To PTo Puummpp
Cartridge (Rupprecht & Patashnick Co., East Greenbush, New York). Figure 3-2 shows a schematic illustration of the ChemComb sampling cartridge. Samples were collected by drawing ambient air through an impactor at a nominal rate TTeefflloonn ffilteilterrof 10 liters per minute (Lpm) to remove particulate matter with aerodynamic diameters DDeenudenuderrgreater than 2.5 micrometers. The air was passed through two or more citric-acid-coated denuders
CoCoaatintingg:: 11%% citrcitricic acacidid
to collect gaseous NH3. A single Teflon filter was used to collect the particulate matter that passed through the denuder. During Phase II, automated
ImImpapaccttoror
Partisol Model 2300 speciation samplers (Rupprecht & Patashnick Co., East Greenbush, New York) were used. The Partisol samplers were equipped with mass-flow controlled sampling systems that were pressure- and temperaturecorrected. InletInlet
3.3.4 Comparability
The comparability of the IonPro-IMS with a standard reference method was established by comparing the average IonPro-IMS readings with time-integrated NH3 samples collected using citric-acid-coated denuders. The reference samples were collected based on procedures described in the EPA Compendium Method IO-4.2, Determination of Reactive Acidic and Basic
The procedures that were used for preparing and Figure 3-2. Reference Method Sampling coating the denuders were based on the Cartridge procedures given in the ChemComb Operating Manual(4) and the test/QA plan.(2) The denuders were coated in an NH3-free glove box at a USDA National Soil Tilth Laboratory facility in Ames, Iowa, and stored in an NH3-free glove box until they were installed in the ChemComb sampling cartridge and transported to the test site. Cartridges were assembled in the laboratory and transported to the test site. All denuders were used within 72 hours of being coated and within 24 hours of being transported to the field.
Reference samples were collected during the second and third weeks of testing during Phase II. To capture diurnal variations in NH3 concentrations, sampling was conducted on the following schedule: 8:00 a.m. to 12:00 p.m., 12:00 p.m. to 2:00 p.m., 2:00 p.m. to 4:00 p.m., 4:00 p.m. to 8:00 p.m., and 8:00 p.m. to 8:00 a.m., so that five sets of samples were collected in each 24-hour period. The short-term (2-hour and 4-hour) sampling captured the midday peaks in NH3 concentrations, whereas the 12-hour sampling captured overnight, generally low, concentrations. The ChemComb sampling cartridges for a full day of sampling were installed in the Partisol speciation samplers before the first sampling period. The Partisol samplers automatically
7
switched the ambient air flow to each cartridge according to the schedule defined above. As a result, the ChemComb samplers were exposed to the ambient environment for approximately 24 hours. After the final sampling period, all of the sampling media were retrieved and transported to the USDA laboratory for extraction and analysis. The reference sampling for singlepoint monitors was conducted at one location near the monitor inlets at the instrument trailer. Duplicate samples were also obtained at this site. Two additional sampling locations were positioned approximately 44 and 74 meters from the instrument trailer for use in the verification testing of open-path monitors, but duplicate samples could not be obtained at these locations due to limitations of the Partisol samplers. The sampling schedule for Phase II deviated from the test/QA plan(2) in that sampling was conducted every other day, including weekends, during the two-week sampling period. The schedule allowed sufficient time for sample transportation and processing between sampling days. The test/QA plan(2) called for sampling every day, Monday through Friday, during the sampling period.
Extraction and analysis of the denuders were performed as described in the test/QA plan,(2) with one exception. The water volume used to extract the denuders was increased from 10 milliliters (mL), as specified in the test/QA plan,(2) to 20 mL. The volume was increased to accommodate the sample volume requirements of the analysis method described below. A deviation was filed to address this change, which does not impact the quality of the reference data. Samples were extracted in an NH3-free glove box and stored in acid-washed scintillation vials to prevent contamination. The samples were analyzed by USDA by flow injection analysis (FIA) using a Lachat QuikChem Automated Flow Injection Ion Analyzer (Lachat Company, Loveland, Colorado) according to QuikChem Method No. 10-107-06-2-A. This method involves heating the NH3 sample with salicylate and hypochlorite in an alkaline phosphate buffer, which produces an emerald green color proportional to the NH3 concentration. The color was intensified by adding sodium nitroprusside and monitored photometrically.
When possible, samples were analyzed within 24 hours of extraction, as specified in the test/QA plan. When analysis within 24 hours of extraction was not possible, the samples were stored frozen until the analysis could be performed, in accordance with the test/QA plan.
8
Chapter 4 Quality Assurance/Quality Control
QA/quality control (QC) procedures were performed in accordance with the quality management plan (QMP) for the AMS Center(5) and the test/QA plan for this verification test.(2)
Six deviation reports were filed during this test and have been addressed in this report. In summary, a change was made in the reference sampling schedule and equipment for Phase II (Section 3.3.4), the denuder extraction volume was increased (Section 3.3.4), some percent difference values measured for duplicate reference samples exceeded 10% (Section 4.2.3), laboratory blank thresholds were redefined (Section 4.2.4), the order in which laboratory blanks and calibration check standards were submitted for analysis was changed (Section 4.2.4 and 4.2.5), and not all of the test data were reviewed within two weeks of the end of the test phase (Section 4.5). None of these deviations impacted the quality of this verification test.
4.1 Equipment Calibrations
4.1.1 Reference Method Sampling Equipment
Reference method sampling was conducted based on the procedures described in the EPA method(3) and the ChemComb operating manual.(4) A single-point calibration of the flow rate through each of the sampling systems (i.e., pump, flow controller, filter pack, denuder, impactor) was performed prior to starting Phase II using a flow meter with a National Institute of Standards and Technology (NIST)-traceable calibration. For Phase II, flows were controlled by the pressure- and temperature-corrected mass flow controllers used in the USDA’s Partisol samplers. These samplers shut off automatically if the flow deviated by ± 5% from the 10 Lpm setpoint for more than 5 minutes, and the data were flagged. Actual sample volumes were recorded by the samplers.
4.1.2 Analytical Equipment
The reference samples were analyzed in the USDA laboratory using FIA. A five-point calibration was measured on the FIA for the reference sample analysis prior to each analytical session by the USDA staff performing the analysis. The calibration was conducted according to the manufacturer’s recommendations and included concentrations of NH3 standard solutions throughout the operating range of the FIA. The calibration was acceptable if the coefficient of determination (r2) of the calibration curve was greater than 0.99. The FIA detection limit (DL)
9
was 0.03 milligrams per liter (mg/L) and was determined as three times the standard deviation of repeated measurements of a low-level NH3 standard. Any analytical results that fell below the FIA DL were used without any further adjustment.
Calibration check standards were analyzed after every fifteenth sample in the batch. These calibration checks were considered acceptable if the measured concentration agreed within 10% of the standard solution concentration. If a calibration check failed to agree within 10% of the standard concentration, the FIA was recalibrated; all analyses since the last acceptable calibration check were repeated. All calibration results were documented for inclusion in the verification test data files.
4.1.3 Meteorological Equipment
The sensors used for meteorological monitoring had been calibrated by the manufacturer (Met One Instruments, Inc., Grants Pass, Oregon) within one year of their use in this verification test. The calibration results were included in the verification test data files.
4.1.4 Ammonia Dilution System
The USDA NH3 dilution system (Environics, Tolland, Connecticut) employs three heated mass flow controllers and valves dedicated for the dilution of compressed NH3 mixtures. The output flow rates were verified using an independent, NIST-traceable flow meter and agreed to within 10%.
4.2 QC Samples
4.2.1 Field Blanks
At least 10% of all reference samples collected were field blanks. The field blanks were collected by installing the sampling media (i.e., denuder and filters) in the sampling train without drawing any air through the train. The media were recovered and handled as normal samples. Field blanks were collected at each of the sampling locations and during each of the sampling periods (e.g., 8:00 a.m. to 12:00 p.m.). Field blank results were used to detect potential sample contamination (defined in the test/QA plan(2) as field blank values greater than 5% of any reference samples for that day) and also to determine the reference method DL.
The reference method DL was determined from the field blank results and reported in terms of an NH3 mass corresponding to three times the standard deviation of the NH3 mass collected on the field blanks. The reference method DL was more than six times higher than the equivalent FIA DL (0.6 microgram [µg] NH3 per 20-mL sample).
The reference method DL, reported as an NH3 mass, was used to determine the minimum detectable NH3 concentrations for Phase II. Since the mass of NH3 collected by the reference method is a function of the sampling time, flow rate, and the ambient NH3 concentration, the minimum (time-integrated) ambient NH3 concentration detectable by the reference method
10
varies depending on the sample period duration. (This assumes a constant flow rate.) For example, to collect 100 µg NH3, the time-integrated ambient NH3 concentration must be 20 ppb for a 12-hour sample and 120 ppb for a 2-hour sample. Accordingly, the minimum ambient NH3
concentrations that could be detected from the collection of 2-, 4-, and 12-hour samples at a nominal flow rate of 10 Lpm were calculated from the reference method DL for Phase II.
A total of 14 field blanks were collected in Phase II. The average NH3 mass collected on these blanks was 2.5 µg NH3, and the range was 0.5 to 4.6 µg NH3. The mass collected on the field blanks ranged from 1.2% to 55.0% of the smallest reference sample mass collected on the same day, with an average of 19.2%. These percentages are not indicative of unusually high levels of contamination, but rather are a result of relatively low ambient NH3 levels at the AFO. The impact of these blank levels on the results of this verification test may be manifested as a small positive bias of the reference method results relative to the readings of the technologies being verified. This bias would be most pronounced on days with low ambient NH3 concentrations. The highest field blank percentages were measured on days when the integrated ambient NH3
levels were as low as 6 ppb, which is approaching the 4.9-ppb minimum detectable ambient NH3
concentration for a 2-hour sample. Assuming an ambient air sample volume of 0.2 cubic meters, the smallest volume collected during Phase II, the maximum field blank value corresponds to an ambient concentration of 5.5 ppb. Thus, the sample handling may account for up to 5.5 ppb of the measured values.
The standard deviation of the NH3 collected from field blanks for Phase II was 1.4 µg, which resulted in a 6.6 :g NH3 Phase II reference method DL. The minimum detectable ambient NH3
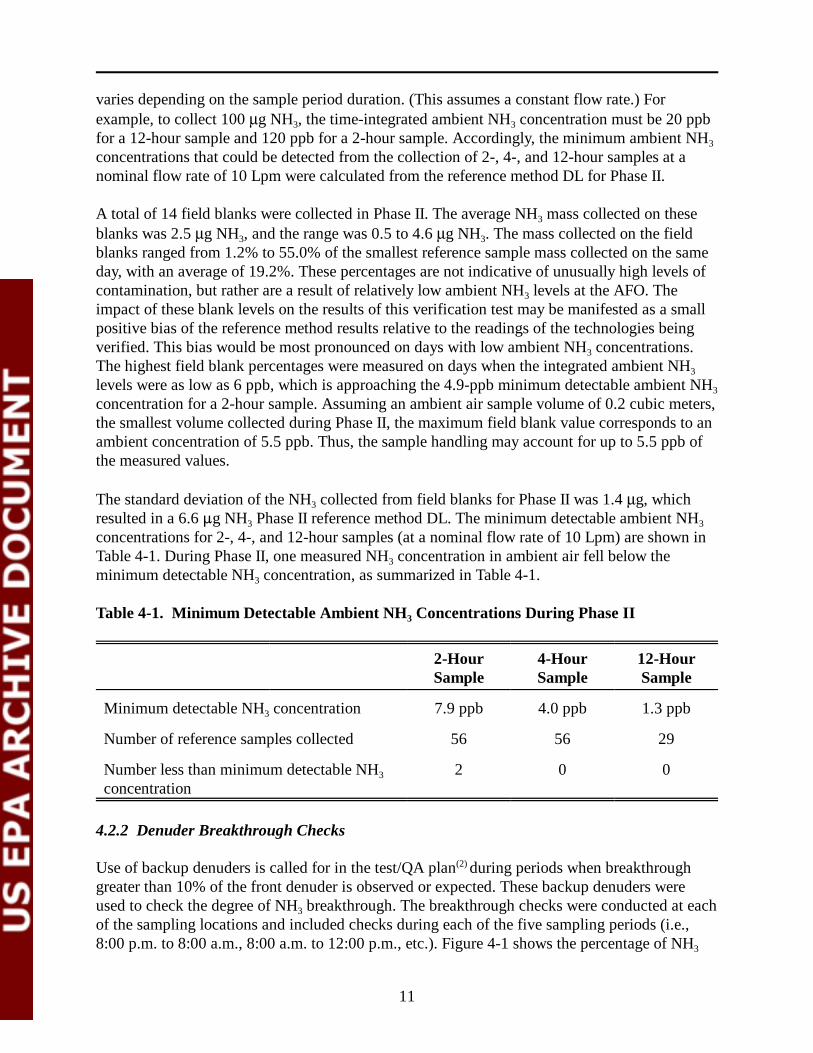
concentrations for 2-, 4-, and 12-hour samples (at a nominal flow rate of 10 Lpm) are shown in Table 4-1. During Phase II, one measured NH3 concentration in ambient air fell below the minimum detectable NH3 concentration, as summarized in Table 4-1.
Table 4-1. Minimum Detectable Ambient NH3 Concentrations During Phase II
2-Hour 4-Hour 12-Hour Sample Sample Sample
Minimum detectable NH3 concentration 7.9 ppb 4.0 ppb 1.3 ppb
Number of reference samples collected 56 56 29
Number less than minimum detectable NH3 2 0 0 concentration
4.2.2 Denuder Breakthrough Checks
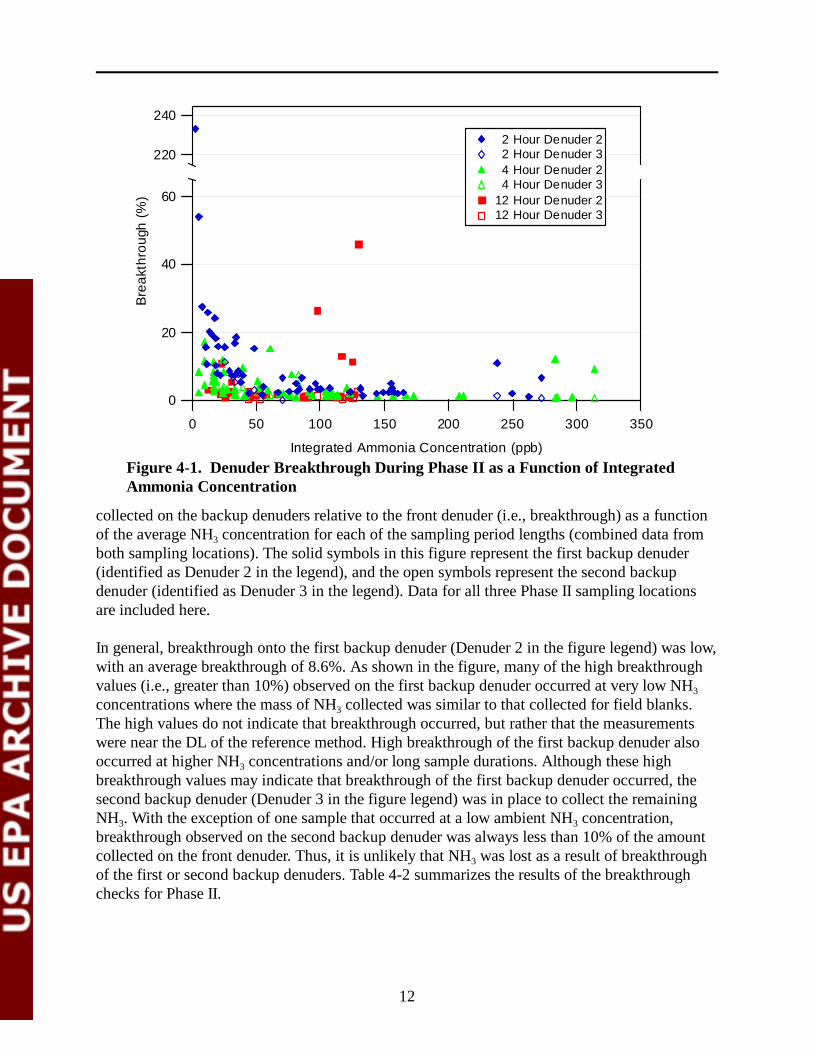
Use of backup denuders is called for in the test/QA plan(2) during periods when breakthrough greater than 10% of the front denuder is observed or expected. These backup denuders were used to check the degree of NH3 breakthrough. The breakthrough checks were conducted at each of the sampling locations and included checks during each of the five sampling periods (i.e., 8:00 p.m. to 8:00 a.m., 8:00 a.m. to 12:00 p.m., etc.). Figure 4-1 shows the percentage of NH3
11
60
40
20
0
Bre
akt
hro
ugh
(%
)
240
220 2 Hour Denuder 2 2 Hour Denuder 3 4 Hour Denuder 2 4 Hour Denuder 3 12 Hour Denuder 2 12 Hour Denuder 3
0 50 100 150 200 250 300 350
Integrated Ammonia Concentration (ppb)
Figure 4-1. Denuder Breakthrough During Phase II as a Function of Integrated Ammonia Concentration
collected on the backup denuders relative to the front denuder (i.e., breakthrough) as a function of the average NH3 concentration for each of the sampling period lengths (combined data from both sampling locations). The solid symbols in this figure represent the first backup denuder (identified as Denuder 2 in the legend), and the open symbols represent the second backup denuder (identified as Denuder 3 in the legend). Data for all three Phase II sampling locations are included here.
In general, breakthrough onto the first backup denuder (Denuder 2 in the figure legend) was low, with an average breakthrough of 8.6%. As shown in the figure, many of the high breakthrough values (i.e., greater than 10%) observed on the first backup denuder occurred at very low NH3
concentrations where the mass of NH3 collected was similar to that collected for field blanks. The high values do not indicate that breakthrough occurred, but rather that the measurements were near the DL of the reference method. High breakthrough of the first backup denuder also occurred at higher NH3 concentrations and/or long sample durations. Although these high breakthrough values may indicate that breakthrough of the first backup denuder occurred, the second backup denuder (Denuder 3 in the figure legend) was in place to collect the remaining NH3. With the exception of one sample that occurred at a low ambient NH3 concentration, breakthrough observed on the second backup denuder was always less than 10% of the amount collected on the front denuder. Thus, it is unlikely that NH3 was lost as a result of breakthrough of the first or second backup denuders. Table 4-2 summarizes the results of the breakthrough checks for Phase II.
12
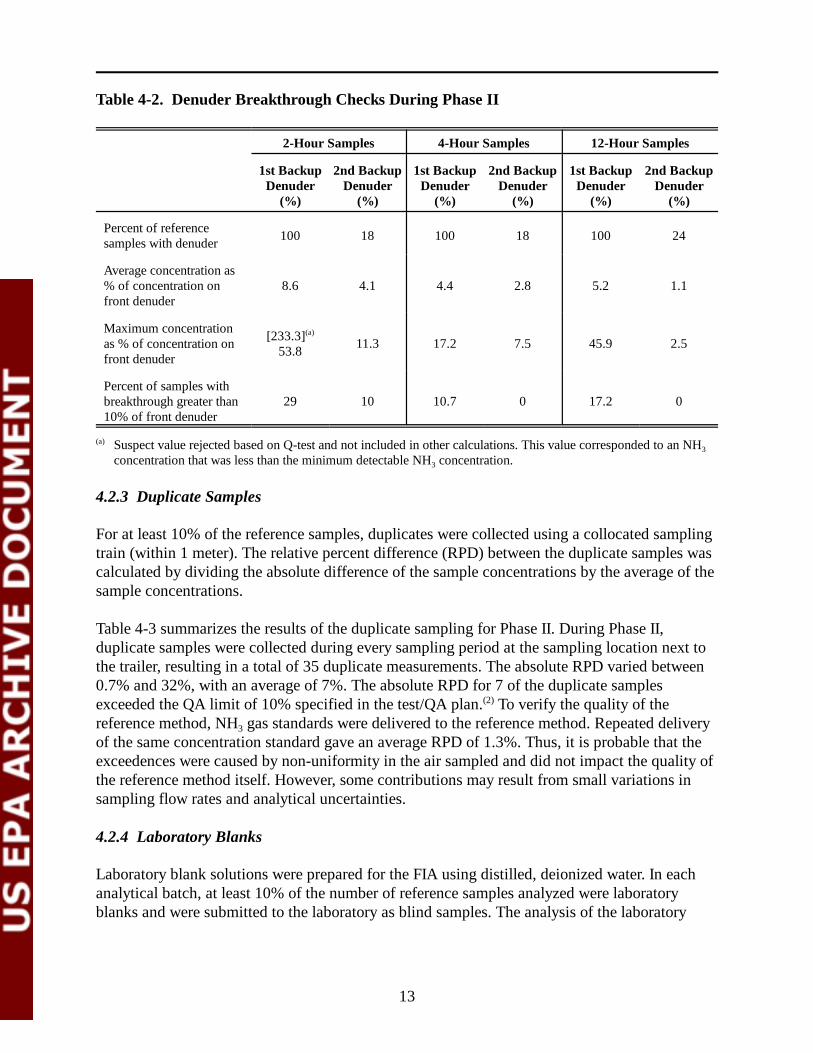
Table 4-2. Denuder Breakthrough Checks During Phase II
2-Hour Samples 4-Hour Samples 12-Hour Samples
1st Backup 2nd Backup Denuder Denuder
(%) (%)
1st Backup 2nd Backup Denuder Denuder
(%) (%)
1st Backup 2nd Backup Denuder Denuder
(%) (%)
Percent of reference samples with denuder
Average concentration as % of concentration on front denuder
Maximum concentration as % of concentration on front denuder
Percent of samples with breakthrough greater than 10% of front denuder
100 18 100 18 100 24
8.6 4.1 4.4 2.8 5.2 1.1
[233.3](a)
11.3 17.2 7.5 45.9 2.5 53.8
29 10 10.7 0 17.2 0
(a) Suspect value rejected based on Q-test and not included in other calculations. This value corresponded to an NH3
concentration that was less than the minimum detectable NH3 concentration.
4.2.3 Duplicate Samples
For at least 10% of the reference samples, duplicates were collected using a collocated sampling train (within 1 meter). The relative percent difference (RPD) between the duplicate samples was calculated by dividing the absolute difference of the sample concentrations by the average of the sample concentrations.
Table 4-3 summarizes the results of the duplicate sampling for Phase II. During Phase II, duplicate samples were collected during every sampling period at the sampling location next to the trailer, resulting in a total of 35 duplicate measurements. The absolute RPD varied between 0.7% and 32%, with an average of 7%. The absolute RPD for 7 of the duplicate samples exceeded the QA limit of 10% specified in the test/QA plan.(2) To verify the quality of the reference method, NH3 gas standards were delivered to the reference method. Repeated delivery of the same concentration standard gave an average RPD of 1.3%. Thus, it is probable that the exceedences were caused by non-uniformity in the air sampled and did not impact the quality of the reference method itself. However, some contributions may result from small variations in sampling flow rates and analytical uncertainties.
4.2.4 Laboratory Blanks
Laboratory blank solutions were prepared for the FIA using distilled, deionized water. In each analytical batch, at least 10% of the number of reference samples analyzed were laboratory blanks and were submitted to the laboratory as blind samples. The analysis of the laboratory
13
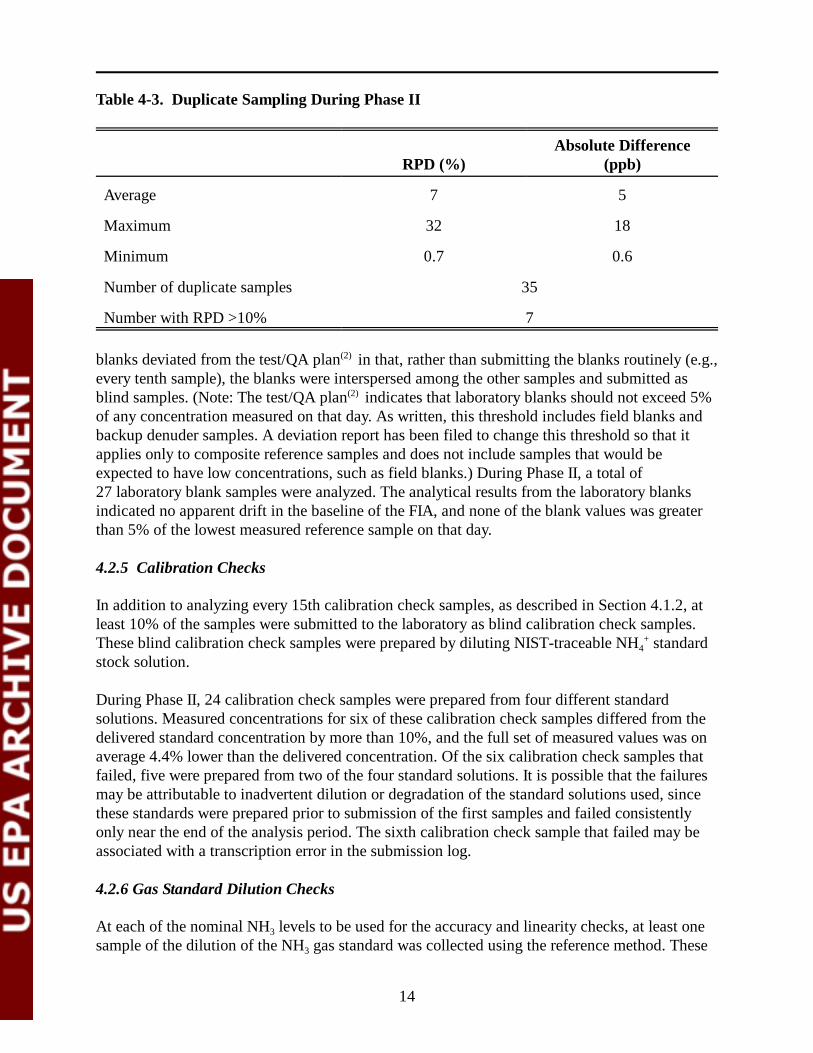
Table 4-3. Duplicate Sampling During Phase II
RPD (%) Absolute Difference
(ppb)
Average 7 5
Maximum 32 18
Minimum 0.7 0.6
Number of duplicate samples 35
Number with RPD >10% 7
blanks deviated from the test/QA plan(2) in that, rather than submitting the blanks routinely (e.g., every tenth sample), the blanks were interspersed among the other samples and submitted as blind samples. (Note: The test/QA plan(2) indicates that laboratory blanks should not exceed 5% of any concentration measured on that day. As written, this threshold includes field blanks and backup denuder samples. A deviation report has been filed to change this threshold so that it applies only to composite reference samples and does not include samples that would be expected to have low concentrations, such as field blanks.) During Phase II, a total of 27 laboratory blank samples were analyzed. The analytical results from the laboratory blanks indicated no apparent drift in the baseline of the FIA, and none of the blank values was greater than 5% of the lowest measured reference sample on that day.
4.2.5 Calibration Checks
In addition to analyzing every 15th calibration check samples, as described in Section 4.1.2, at least 10% of the samples were submitted to the laboratory as blind calibration check samples. These blind calibration check samples were prepared by diluting NIST-traceable NH4
+ standard stock solution.
During Phase II, 24 calibration check samples were prepared from four different standard solutions. Measured concentrations for six of these calibration check samples differed from the delivered standard concentration by more than 10%, and the full set of measured values was on average 4.4% lower than the delivered concentration. Of the six calibration check samples that failed, five were prepared from two of the four standard solutions. It is possible that the failures may be attributable to inadvertent dilution or degradation of the standard solutions used, since these standards were prepared prior to submission of the first samples and failed consistently only near the end of the analysis period. The sixth calibration check sample that failed may be associated with a transcription error in the submission log.
4.2.6 Gas Standard Dilution Checks
At each of the nominal NH3 levels to be used for the accuracy and linearity checks, at least one sample of the dilution of the NH3 gas standard was collected using the reference method. These
14
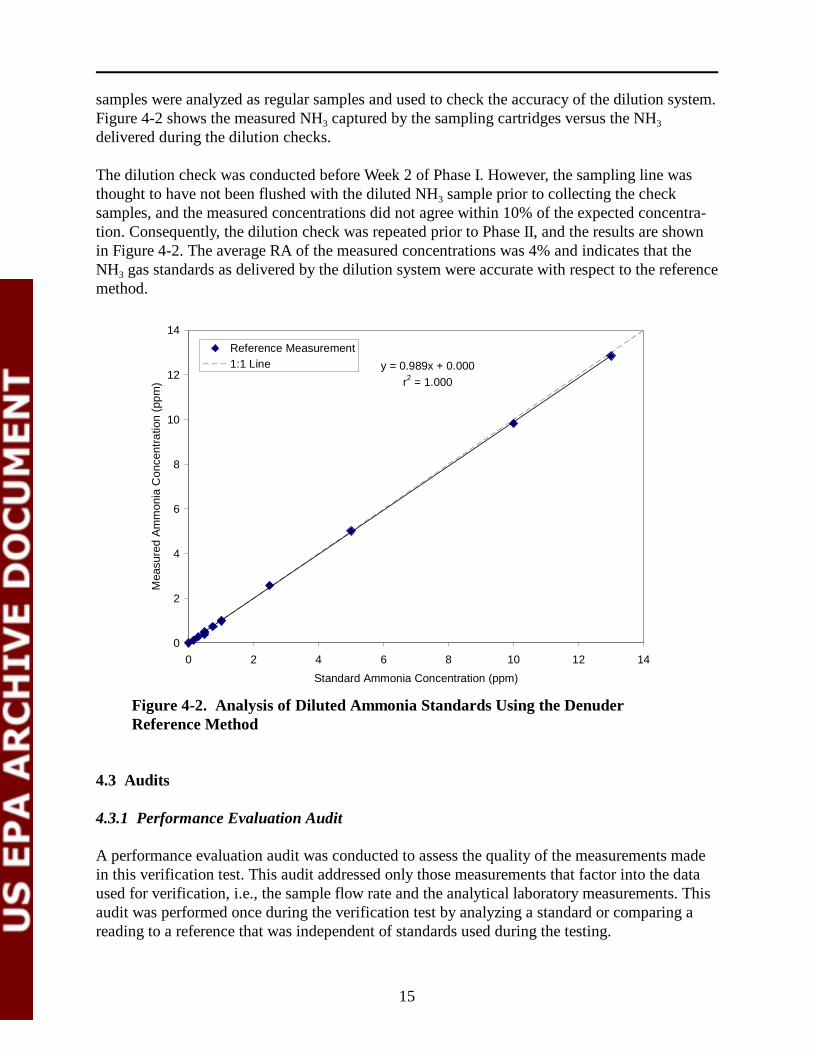
samples were analyzed as regular samples and used to check the accuracy of the dilution system. Figure 4-2 shows the measured NH3 captured by the sampling cartridges versus the NH3
delivered during the dilution checks.
The dilution check was conducted before Week 2 of Phase I. However, the sampling line was thought to have not been flushed with the diluted NH3 sample prior to collecting the check samples, and the measured concentrations did not agree within 10% of the expected concentration. Consequently, the dilution check was repeated prior to Phase II, and the results are shown in Figure 4-2. The average RA of the measured concentrations was 4% and indicates that the NH3 gas standards as delivered by the dilution system were accurate with respect to the reference method.
Mea
sure
d A
mm
onia
Con
cent
ratio
n (p
pm)
14
12
10
8
6
4
2
0
Reference Measurement 1:1 Line y = 0.989x + 0.000
r 2 = 1.000
0 2 4 6 8 10 12 14
Standard Ammonia Concentration (ppm)
Figure 4-2. Analysis of Diluted Ammonia Standards Using the DenuderReference Method
4.3 Audits
4.3.1 Performance Evaluation Audit
A performance evaluation audit was conducted to assess the quality of the measurements made in this verification test. This audit addressed only those measurements that factor into the data used for verification, i.e., the sample flow rate and the analytical laboratory measurements. This audit was performed once during the verification test by analyzing a standard or comparing a reading to a reference that was independent of standards used during the testing.
15
The flow rates of the reference method sampling assemblies were audited once during testing using a flow meter independent of the meter used to calibrate the flow rate. During Phase I, agreement between the audit flow rate and the nominal flow rate indicated a bias in the calibrated flow rates. The flow rates were recalibrated. The bias was later attributed to a faulty audit flow meter, and the original flow calibrations were verified against a second audit flow meter.
The performance of the FIA was audited by analyzing an NH4+ standard independent of those
used for the calibration, but were the same as those used for the calibration checks described in Section 4.2.5. These samples were provided as blind audit samples, and the operator of the FIA was not aware of the concentrations of the samples. In several cases, agreement between the measured concentration and the standard concentration was not within ± 10% (ranged from 43% to 64%). The cause of the discrepancy was investigated but could not be identified. It is possible that some of the discrepancy is attributable to uncertainties associated with dilution of the stock 1,000 mg/L NH4
+ standard solution. Multiple solutions were prepared, and only some of those solutions showed discrepancies with the analytical results. The relative agreement between the reference samples collected during the gas standard dilution check (performed between Phases I and II) and their expected values provide additional verification of the accuracy of the FIA.
4.3.2 Technical Systems Audit
Battelle’s ETV Quality Manager performed a technical systems audit (TSA) of the performance of this verification test during the test. The purpose of this TSA was to ensure that the verification test was being performed in accordance with the test/QA plan(2) and that all QA/QC procedures were implemented. As part of the audit, Battelle’s ETV Quality Manager reviewed the reference sampling and analysis methods used, compared actual test procedures to those specified in the test/QA plan,(2) and reviewed data acquisition and handling procedures. Observations and findings from this audit were documented and submitted to the Battelle Verification Test Coordinator for response. The records concerning the TSA are permanently stored with the Battelle Quality Manager.
4.3.3 Audit of Data Quality
At least 10% of the data acquired during the verification test was audited. Battelle’s Quality Manager traced the data from the initial acquisition, through reduction and statistical analysis, to final reporting, to ensure the integrity of the reported results. All calculations performed on the data undergoing the audit were checked during the technical review process.
4.4 QA/QC Reporting
Each audit was documented in accordance with Sections 3.3.4 and 3.3.5 of the QMP for the ETV AMS Center.(5) Once the audit report was prepared, the Battelle Verification Test Coordinator ensured that a response was provided for each adverse finding or potential problem
16
and implemented any necessary follow-up corrective action. The Battelle Quality Manager ensured that follow-up corrective action was taken. The results of the TSA were sent to the EPA.
4.5 Data Review
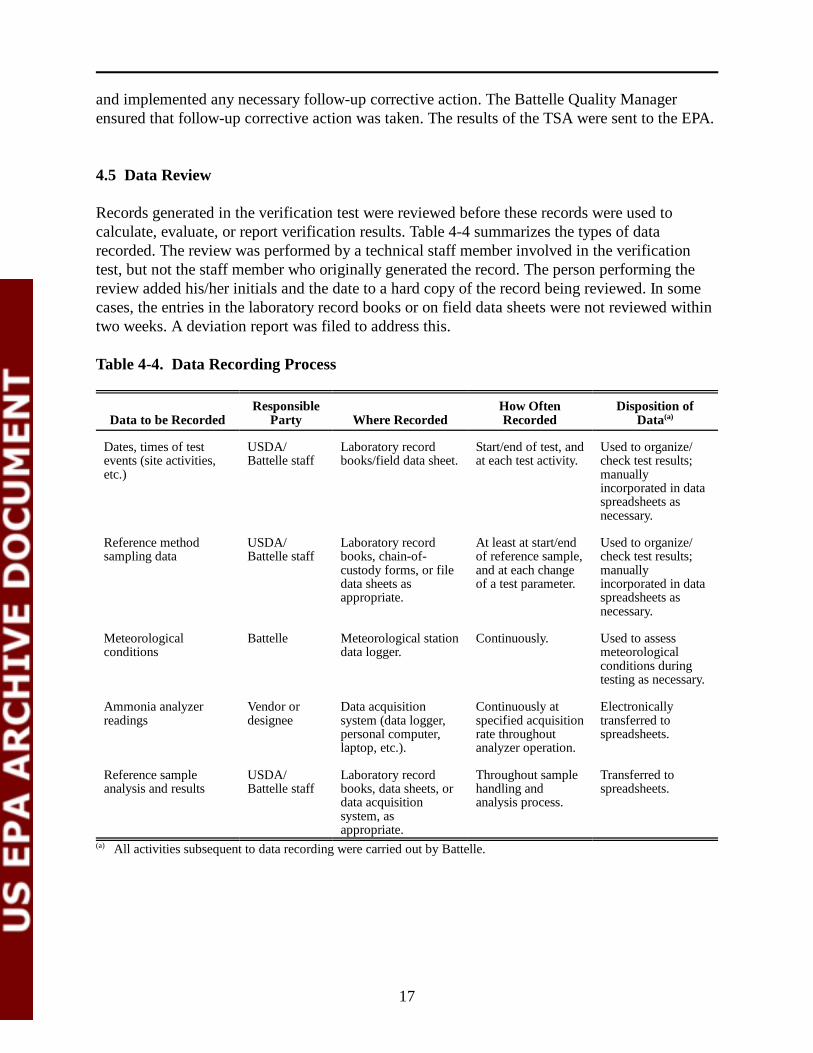
Records generated in the verification test were reviewed before these records were used to calculate, evaluate, or report verification results. Table 4-4 summarizes the types of data recorded. The review was performed by a technical staff member involved in the verification test, but not the staff member who originally generated the record. The person performing the review added his/her initials and the date to a hard copy of the record being reviewed. In some cases, the entries in the laboratory record books or on field data sheets were not reviewed within two weeks. A deviation report was filed to address this.
Table 4-4. Data Recording Process
Data to be Recorded Responsible
Party Where Recorded How Often Recorded
Disposition of Data(a)
Dates, times of test events (site activities, etc.)
USDA/ Battelle staff
Laboratory record books/field data sheet.
Start/end of test, and at each test activity.
Used to organize/ check test results; manually incorporated in data spreadsheets as necessary.
Reference method sampling data
USDA/ Battelle staff
Laboratory record books, chain-ofcustody forms, or file data sheets as appropriate.
At least at start/end of reference sample, and at each change of a test parameter.
Used to organize/ check test results; manually incorporated in data spreadsheets as necessary.
Meteorological conditions
Battelle Meteorological station data logger.
Continuously. Used to assess meteorological conditions during testing as necessary.
Ammonia analyzer readings
Vendor or designee
Data acquisition system (data logger, personal computer, laptop, etc.).
Continuously at specified acquisition rate throughout analyzer operation.
Electronically transferred to spreadsheets.
Reference sample analysis and results
USDA/ Battelle staff
Laboratory record books, data sheets, or data acquisition
Throughout sample handling and analysis process.
Transferred to spreadsheets.
system, as appropriate.
(a) All activities subsequent to data recording were carried out by Battelle.
17

Chapter 5 Statistical Methods and Reported Parameters
The statistical methods presented in this chapter were used to verify the performance parameters listed in Section 3.1. Beginning on November 6, 2003 (during Phase II), the IonPro-IMS data were recorded once every second instead of every 30 seconds. (The change in data recording frequency was made inadvertently when the data acquisition computer was switched to one with data output capabilities.) In order to make the Phase II data set consistent, the higher-frequency data collected starting November 6 were averaged over 30-second intervals using IgorPro software, Version 4.09 (Wavemetrics, Lake Oswego, Oregon), so that they were comparable to the data recorded before November 6. The 30-second interval data were used in the calculations described in this section and reported in Chapter 6.
5.1 Relative Accuracy
The percent difference (%D) of the average IonPro-IMS response to each NH3 gas standard was calculated according to Equation 1:
x x %D =
− n × 100 (1) xn
where x is the average IonPro-IMS response to an NH3 gas standard of nominal concentration xn. During Phase II, the RA with respect to all of the gas standards (n) delivered to the IonPro-IMS within its reported measurement range was calculated using Equation 2:
⎛⎜⎝n i=1
1 n
%Dι ⎞⎟⎠
× 100 (2)∑Average RA =
5.2 Linearity
Linearity was assessed by a linear regression analysis using the compressed gas standard concentrations as the independent variable and average results from the IonPro-IMS as the dependent variable. Linearity was expressed in terms of slope, intercept, and r2 value. The 95% confidence interval (CI) for the slope and intercept was also calculated.
18
5.3 Precision
Precision was calculated in terms of the percent relative standard deviation (RSD) of the IonPro-IMS measurements of several NH3 gas standards. The mean and standard deviations of those readings were calculated. The RSD was then determined as:
SD (3) RSD = × 100
x
where SD is the standard deviation of the IonPro-IMS readings and x is the mean of the IonPro-IMS readings.
5.4 Response Time
Response time was assessed in terms of both the rise and fall times of the IonPro-IMS when sampling NH3 gas standards or zero air. Rise time (i.e., 0% to 95% response time for the change in NH3 concentration) was determined from the IonPro-IMS response to a rapid increase in the delivered NH3 concentration. Once a stable response was achieved with the gas standard, the fall time (i.e., the 100% to 5% response time for the change in NH3 concentration) was determined in a similar way, switching from the NH3 standard back to zero air or a lower concentration NH3
gas standard. Response times are reported in terms of seconds.
5.5 Calibration and Zero Drift
Calibration and zero drift are reported in terms of the mean, RSD, and range (maximum and minimum) of the readings obtained from the IonPro-IMS in the repeated sampling of the same NH3 standard gas and of zero air. For zero drift, the SD is reported instead of the RSD since dividing the SD by a value approximately equal to zero is not meaningful. The calibration and zero drift were calculated during Phase II of testing so that up to six NH3 standard and zero air readings (on Monday, Wednesday, and Friday of Week 1 and Week 4) were used for this calculation. The results of these checks indicate the day-to-day variation in standard and zero readings.
5.6 Interference Effects
The extent of interference was calculated in terms of the ratio of the response of the IonPro-IMS to the interfering species, relative to the actual concentration of the interfering species. For example, if 100 ppb of an interfering species resulted in a 1-ppb increase in the NH3 reading of the IonPro-IMS, the interference effect was reported as 1% (i.e., 1 ppb/100 ppb). The interference effect was reported separately for each interferent, both in the absence and in the presence of NH3.
19

5.7 Comparability
Comparability between the IonPro-IMS results and the reference method results with respect to ambient air was assessed by linear regression using the reference method NH3 concentrations as the independent variable and results from the IonPro-IMS as the dependent variable. The IonPro-IMS measurement data were averaged over 2-, 4-, and 12-hour time intervals corresponding to the reference method sampling schedule. Comparability was expressed in terms of slope, intercept, and r2.
20

Chapter 6 Test Results
The results of the verification test of the IonPro-IMS are presented in this section. The values presented in this section are based on 30-second average readings. The IonPro-IMS was not available for testing during Phase I of the verification test. Therefore, the results presented here are from Phase II only.
Meteorological conditions collected using the meteorological station during Phase II are presented in Figure 6-1. The average ambient temperature was 4.5°C (range: -10 to 29°C), and the average relative humidity was 75%. Winds were predominantly from the northwest and quite variable in speed, averaging 7 miles per hour (30 miles per hour maximum). Figure 6-1 shows the Phase II wind direction, wind speed, and ambient temperature data and the ambient NH3 data set collected by the IonPro-IMS (bottom panel). The shaded region shows the period during which NH3 reference measurements were conducted. The two gaps in the ambient data set were caused by computer-related failures, which are discussed in Section 6.8. The reported IonPro-IMS measurements ranged from 1 to 1,597 ppb during Phase II and averaged 209 ppb.
10/21/03 10/26/03 10/31/03 11/5/03 11/10/03
Date
Figure 6-1. Phase II Meteorological Conditions and IonPro-IMS Ambient NH3 Measurements
30
20
10
0
360
270
180
90
0
30
20
10
0
-10
1500
1000
500
0
Win
d D
irect
ion
(deg
ree
s)
Win
d S
pee
d(m
ph)
Am
mon
ia (
ppb)
T
em
pera
ture
(°C
)
Reference Measurement Period
21
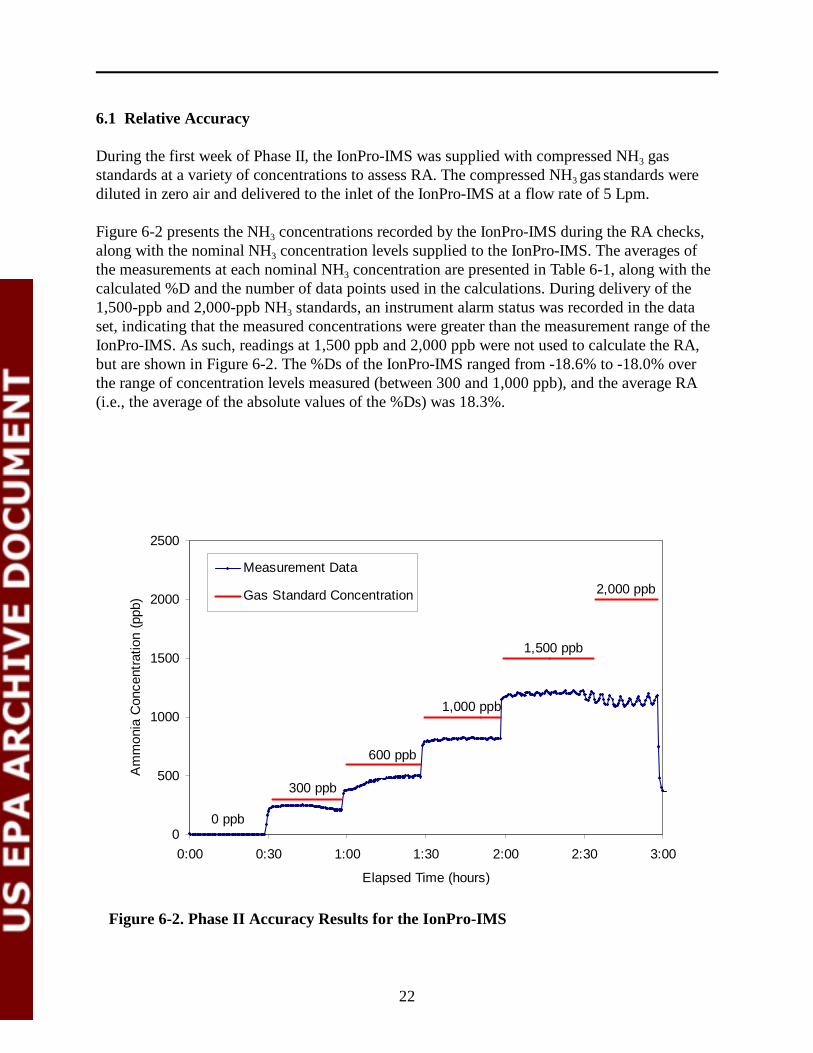
6.1 Relative Accuracy
During the first week of Phase II, the IonPro-IMS was supplied with compressed NH3 gas standards at a variety of concentrations to assess RA. The compressed NH3 gas standards were diluted in zero air and delivered to the inlet of the IonPro-IMS at a flow rate of 5 Lpm.
Figure 6-2 presents the NH3 concentrations recorded by the IonPro-IMS during the RA checks, along with the nominal NH3 concentration levels supplied to the IonPro-IMS. The averages of the measurements at each nominal NH3 concentration are presented in Table 6-1, along with the calculated %D and the number of data points used in the calculations. During delivery of the 1,500-ppb and 2,000-ppb NH3 standards, an instrument alarm status was recorded in the data set, indicating that the measured concentrations were greater than the measurement range of the IonPro-IMS. As such, readings at 1,500 ppb and 2,000 ppb were not used to calculate the RA, but are shown in Figure 6-2. The %Ds of the IonPro-IMS ranged from -18.6% to -18.0% over the range of concentration levels measured (between 300 and 1,000 ppb), and the average RA (i.e., the average of the absolute values of the %Ds) was 18.3%.
0
500
1000
1500
2000
2500
Am
mon
ia C
once
ntra
tion
(ppb
)
Measurement Data
Gas Standard Concentration
300 ppb
600 ppb
1,000 ppb
1,500 ppb
2,000 ppb
0 ppb
0:00 0:30 1:00 1:30 2:00 2:30 3:00
Elapsed Time (hours)
Figure 6-2. Phase II Accuracy Results for the IonPro-IMS
22
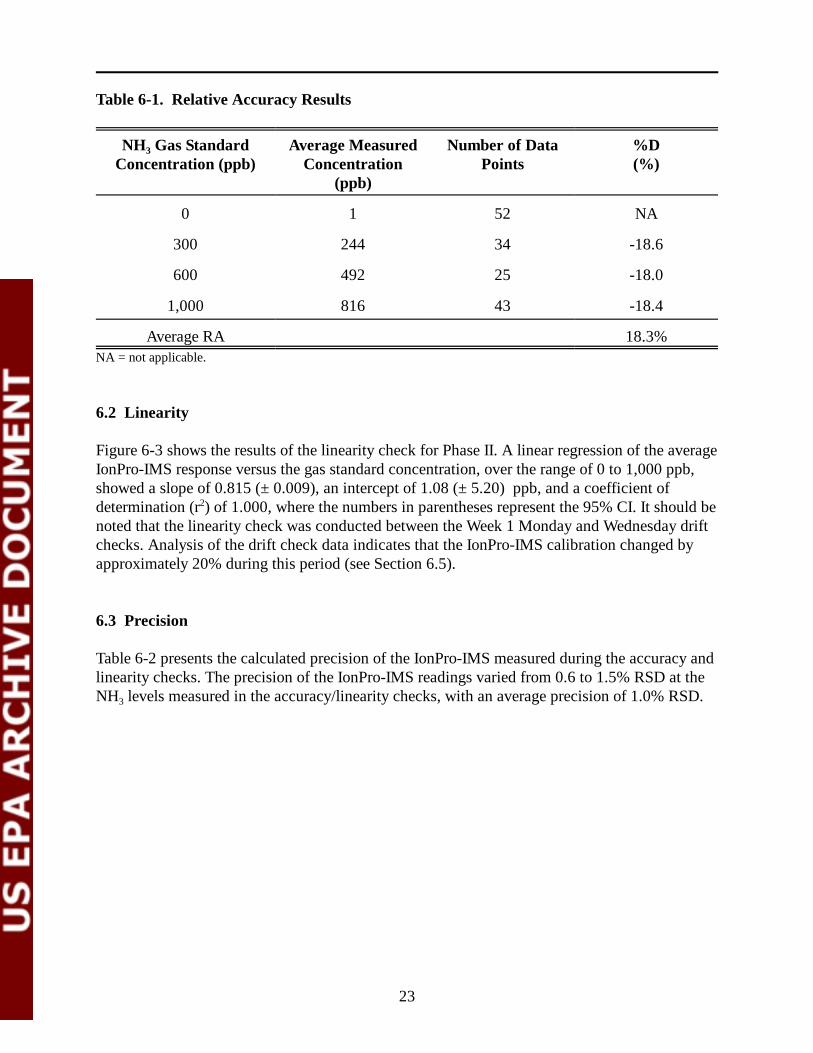
Table 6-1. Relative Accuracy Results
NH3 Gas Standard Average Measured Number of Data %D Concentration (ppb) Concentration Points (%)
(ppb)
0 1 52 NA
300 244 34 -18.6
600 492 25 -18.0
1,000 816 43 -18.4
Average RA 18.3% NA = not applicable.
6.2 Linearity
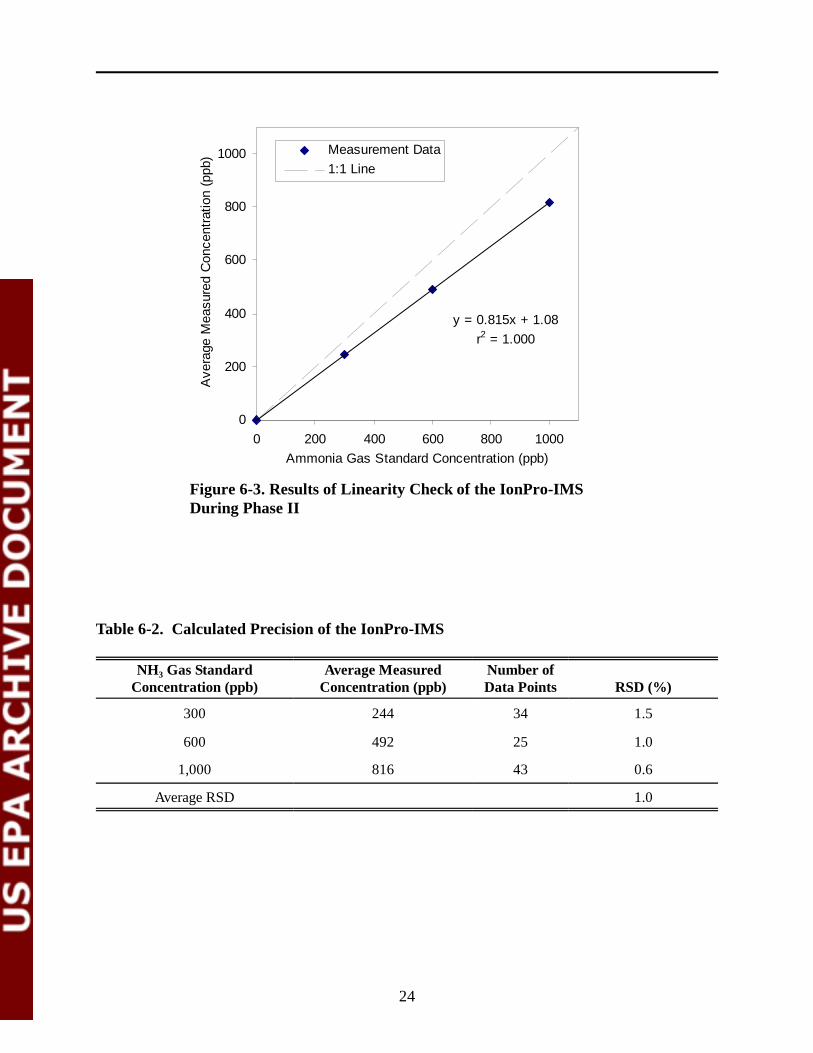
Figure 6-3 shows the results of the linearity check for Phase II. A linear regression of the average IonPro-IMS response versus the gas standard concentration, over the range of 0 to 1,000 ppb, showed a slope of 0.815 (± 0.009), an intercept of 1.08 (± 5.20) ppb, and a coefficient of determination (r2) of 1.000, where the numbers in parentheses represent the 95% CI. It should be noted that the linearity check was conducted between the Week 1 Monday and Wednesday drift checks. Analysis of the drift check data indicates that the IonPro-IMS calibration changed by approximately 20% during this period (see Section 6.5).
6.3 Precision
Table 6-2 presents the calculated precision of the IonPro-IMS measured during the accuracy and linearity checks. The precision of the IonPro-IMS readings varied from 0.6 to 1.5% RSD at the NH3 levels measured in the accuracy/linearity checks, with an average precision of 1.0% RSD.
23
0 200 400 600 800 1000
Ammonia Gas Standard Concentration (ppb)
Figure 6-3. Results of Linearity Check of the IonPro-IMS During Phase II
Table 6-2. Calculated Precision of the IonPro-IMS
y = 0.815x + 1.08
r2 = 1.000
0
200
400
600
800
1000
Ave
rage
Mea
sure
d C
once
ntra
tion
(ppb
) Measurement Data
1:1 Line
NH3 Gas Standard Average Measured Number ofConcentration (ppb) Concentration (ppb) Data Points RSD (%)
300 244 34 1.5
600 492 25 1.0
1,000 816 43 0.6
Average RSD
24
1.0
6.4 Response Time
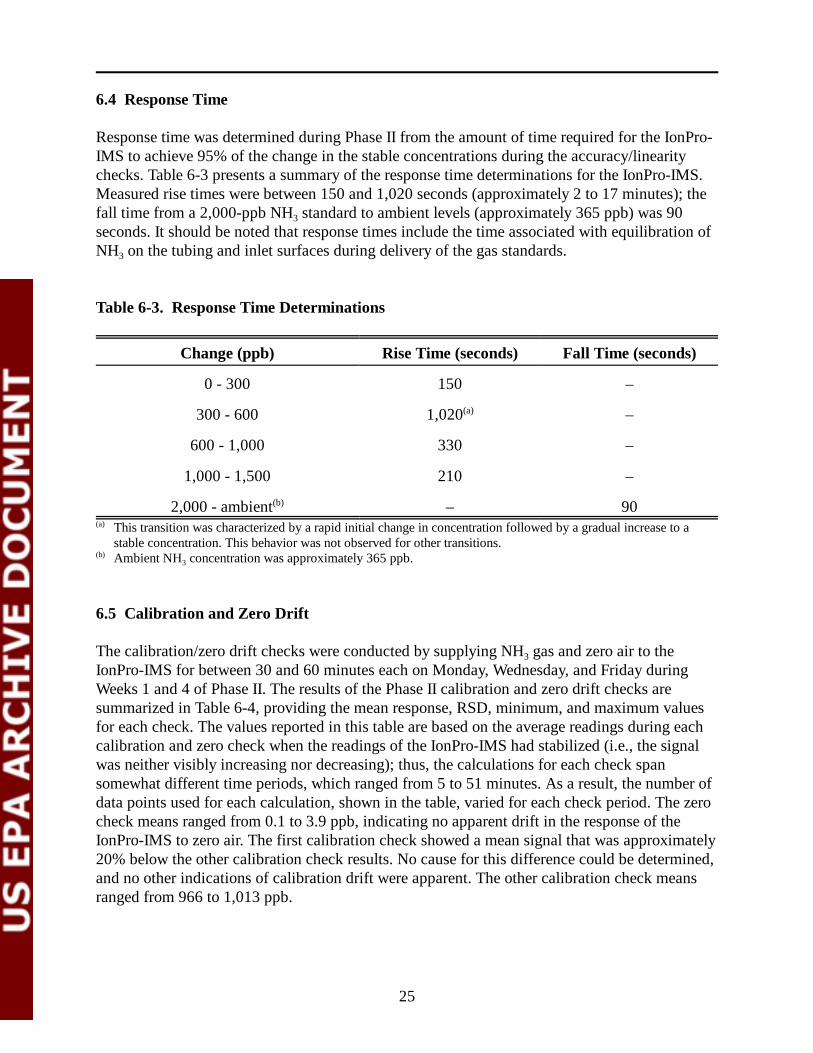
Response time was determined during Phase II from the amount of time required for the IonPro-IMS to achieve 95% of the change in the stable concentrations during the accuracy/linearity checks. Table 6-3 presents a summary of the response time determinations for the IonPro-IMS. Measured rise times were between 150 and 1,020 seconds (approximately 2 to 17 minutes); the fall time from a 2,000-ppb NH3 standard to ambient levels (approximately 365 ppb) was 90 seconds. It should be noted that response times include the time associated with equilibration of NH3 on the tubing and inlet surfaces during delivery of the gas standards.
Table 6-3. Response Time Determinations
Change (ppb) Rise Time (seconds) Fall Time (seconds)
0 - 300 150 –
300 - 600 1,020(a) –
600 - 1,000 330 –
1,000 - 1,500 210 –
2,000 - ambient(b) – 90 (a) This transition was characterized by a rapid initial change in concentration followed by a gradual increase to a
stable concentration. This behavior was not observed for other transitions. (b) Ambient NH3 concentration was approximately 365 ppb.
6.5 Calibration and Zero Drift
The calibration/zero drift checks were conducted by supplying NH3 gas and zero air to the IonPro-IMS for between 30 and 60 minutes each on Monday, Wednesday, and Friday during Weeks 1 and 4 of Phase II. The results of the Phase II calibration and zero drift checks are summarized in Table 6-4, providing the mean response, RSD, minimum, and maximum values for each check. The values reported in this table are based on the average readings during each calibration and zero check when the readings of the IonPro-IMS had stabilized (i.e., the signal was neither visibly increasing nor decreasing); thus, the calculations for each check span somewhat different time periods, which ranged from 5 to 51 minutes. As a result, the number of data points used for each calculation, shown in the table, varied for each check period. The zero check means ranged from 0.1 to 3.9 ppb, indicating no apparent drift in the response of the IonPro-IMS to zero air. The first calibration check showed a mean signal that was approximately 20% below the other calibration check results. No cause for this difference could be determined, and no other indications of calibration drift were apparent. The other calibration check means ranged from 966 to 1,013 ppb.
25
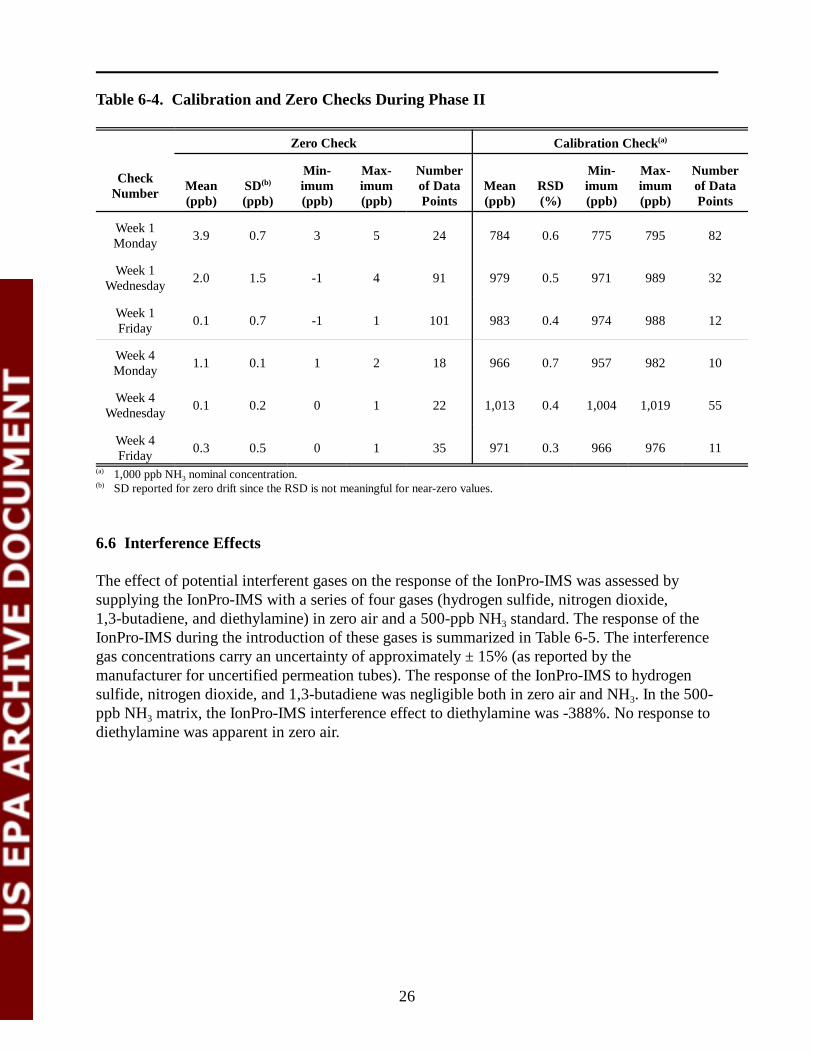
Table 6-4. Calibration and Zero Checks During Phase II
Zero Check
Min- Max- Number Check
Mean SD(b) imum imum of Data Number
(ppb) (ppb) (ppb) (ppb) Points
Week 1 3.9 0.7 3 5 24
Monday
Week 1 2.0 1.5 -1 4 91
Wednesday
Week 1 0.1 0.7 -1 1 101
Friday
Week 4 1.1 0.1 1 2 18
Monday
Week 4 0.1 0.2 0 1 22
Wednesday
Week 4 0.3 0.5 0 1 35
Friday
Calibration Check(a)
Min- Max- Number Mean RSD imum imum of Data (ppb) (%) (ppb) (ppb) Points
784 0.6 775 795 82
979 0.5 971 989 32
983 0.4 974 988 12
966 0.7 957 982 10
1,013 0.4 1,004 1,019 55
971 0.3 966 976 11
(a) 1,000 ppb NH3 nominal concentration. (b) SD reported for zero drift since the RSD is not meaningful for near-zero values.
6.6 Interference Effects
The effect of potential interferent gases on the response of the IonPro-IMS was assessed by supplying the IonPro-IMS with a series of four gases (hydrogen sulfide, nitrogen dioxide, 1,3-butadiene, and diethylamine) in zero air and a 500-ppb NH3 standard. The response of the IonPro-IMS during the introduction of these gases is summarized in Table 6-5. The interference gas concentrations carry an uncertainty of approximately ± 15% (as reported by the manufacturer for uncertified permeation tubes). The response of the IonPro-IMS to hydrogen sulfide, nitrogen dioxide, and 1,3-butadiene was negligible both in zero air and NH3. In the 500ppb NH3 matrix, the IonPro-IMS interference effect to diethylamine was -388%. No response to diethylamine was apparent in zero air.
26
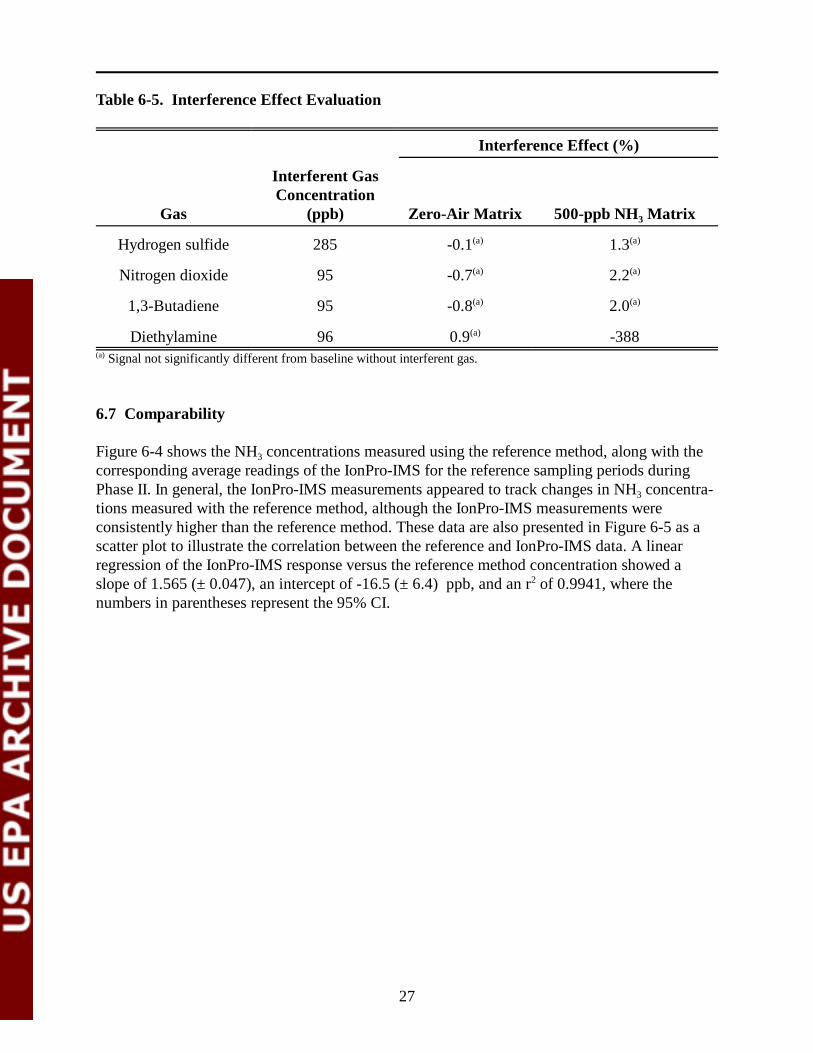
Table 6-5. Interference Effect Evaluation
Interference Effect (%)
Gas
Interferent Gas Concentration
(ppb) Zero-Air Matrix 500-ppb NH3 Matrix
Hydrogen sulfide 285 -0.1(a) 1.3(a)
Nitrogen dioxide 95 -0.7(a) 2.2(a)
1,3-Butadiene 95 -0.8(a) 2.0(a)
Diethylamine 96 0.9(a) -388 (a) Signal not significantly different from baseline without interferent gas.
6.7 Comparability
Figure 6-4 shows the NH3 concentrations measured using the reference method, along with the corresponding average readings of the IonPro-IMS for the reference sampling periods during Phase II. In general, the IonPro-IMS measurements appeared to track changes in NH3 concentrations measured with the reference method, although the IonPro-IMS measurements were consistently higher than the reference method. These data are also presented in Figure 6-5 as a scatter plot to illustrate the correlation between the reference and IonPro-IMS data. A linear regression of the IonPro-IMS response versus the reference method concentration showed a slope of 1.565 (± 0.047), an intercept of -16.5 (± 6.4) ppb, and an r2 of 0.9941, where the numbers in parentheses represent the 95% CI.
27
0
100
200
300
400
500
600
Am
mon
ia C
once
ntra
tion
(ppb
) Reference
IonPro-IMS
10/2
6/03
10/2
7/03
10/2
8/03
10/2
9/03
10/3
0/03
10/3
1/03
11/1
/03
11/2
/03
11/3
/03
11/4
/03
11/5
/03
11/6
/03
11/7
/03
Date
Figure 6-4. Comparison of Ambient Reference Measurements with Averages from the IonPro-IMS During Phase II
Ave
rage
Mon
itor
Rea
ding
(pp
b)
500
400
300
200
100
0
y = 1.565x - 16.5
r2 = 0.994
0 100 200 300 400 500 Reference Ammonia Concentration (ppb)
Measurement Data
1:1 Line
Figure 6-5. Scatter Plot of the IonPro-IMS Results versus Ambient Reference Measurements During Phase II
28
6.8 Ease of Use
The IonPro-IMS was installed at the Phase II testing location by a vendor representative, who completed the installation in several hours. The IonPro-IMS was allowed to equilibrate for at least one day before the vendor representative tested the zero and span using instrument zero air and the internal calibration device. The vendor was on-site for several days, which allowed more than enough time to complete the installation and train Battelle and USDA staff to use the IonPro-IMS and check its performance. Checklists, shown in Appendix A, were completed daily by Battelle/USDA staff. The checks were quick and straightforward and could be completed by an inexperienced user. The air compressor that supplied the monitor’s zero air generator required that the condensed water be drained daily. Data from the IonPro-IMS were acquired by a laptop computer using Hyper Terminal software (Hilgraeve, Inc.). As part of the daily checks, Battelle/USDA staff saved the current data acquisition file and started a new file. This was done at least once daily in an effort to minimize data loss in the event of computer malfunction or power loss. Nonetheless, it was discovered on two occasions that data acquisition from the IonPro-IMS had terminated; thus, some data were not collected although the IonPro-IMS was conducting measurements during those periods. One of the data acquisition failures appeared to be caused by a lock-up of the Hyper Terminal software. The second appeared to be associated with the change in the computer used to acquire data from the IonPro-IMS (discussed in Chapter 5). Neither failure appeared to be caused by the IonPro-IMS itself. During Phase II of testing, no corrective maintenance was performed on the IonPro-IMS. Table 6-6 presents a summary of activities involving the IonPro-IMS during Phase II. The IonPro-IMS did not produce any waste during the test.
The data collected by Hyper Terminal were saved as comma-delimited text files. The files contained the date and time for each data point, the measured NH3 concentration, and a number of instrument parameters. Each text file containing approximately 12 hours of data was approximately 160 kilobytes in size for the lower frequency data collection (one data point reported every 30 seconds). The file sizes increased to approximately 5 megabytes for data recorded every second. The entire data set, including data collected at both frequencies, recorded by the IonPro-IMS was 111 megabytes.
6.9 Data Completeness
Although it was operating and conducting measurements during 100% of Phase II, the IonPro-IMS collected only 92% of the data. The data loss of 8% was caused by computer-related failures during data acquisition, as described in Section 6.8.
29
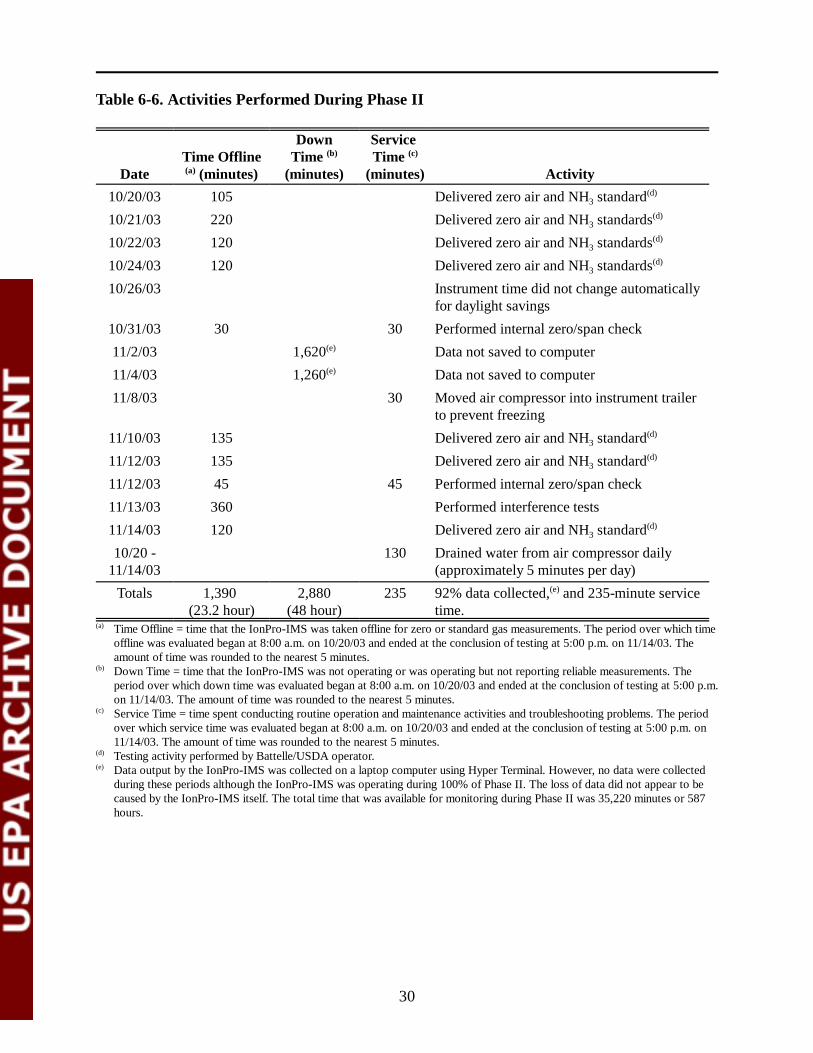
Table 6-6. Activities Performed During Phase II
Down Service Time Offline Time (b) Time (c)
Date (a) (minutes) (minutes) (minutes) Activity
10/20/03 105 Delivered zero air and NH3 standard(d)
10/21/03 220 Delivered zero air and NH3 standards(d)
10/22/03 120 Delivered zero air and NH3 standards(d)
10/24/03 120 Delivered zero air and NH3 standards(d)
10/26/03 Instrument time did not change automatically for daylight savings
10/31/03 30 30 Performed internal zero/span check
11/2/03 1,620(e) Data not saved to computer
11/4/03 1,260(e) Data not saved to computer
11/8/03 30 Moved air compressor into instrument trailer to prevent freezing
11/10/03 135 Delivered zero air and NH3 standard(d)
11/12/03 135 Delivered zero air and NH3 standard(d)
11/12/03 45 45 Performed internal zero/span check
11/13/03 360 Performed interference tests
11/14/03 120 Delivered zero air and NH3 standard(d)
10/20 130 Drained water from air compressor daily 11/14/03 (approximately 5 minutes per day)
Totals 1,390 2,880 235 92% data collected,(e) and 235-minute service (23.2 hour) (48 hour) time.
(a) Time Offline = time that the IonPro-IMS was taken offline for zero or standard gas measurements. The period over which time offline was evaluated began at 8:00 a.m. on 10/20/03 and ended at the conclusion of testing at 5:00 p.m. on 11/14/03. The amount of time was rounded to the nearest 5 minutes.
(b) Down Time = time that the IonPro-IMS was not operating or was operating but not reporting reliable measurements. The period over which down time was evaluated began at 8:00 a.m. on 10/20/03 and ended at the conclusion of testing at 5:00 p.m. on 11/14/03. The amount of time was rounded to the nearest 5 minutes.
(c) Service Time = time spent conducting routine operation and maintenance activities and troubleshooting problems. The period over which service time was evaluated began at 8:00 a.m. on 10/20/03 and ended at the conclusion of testing at 5:00 p.m. on 11/14/03. The amount of time was rounded to the nearest 5 minutes.
(d) Testing activity performed by Battelle/USDA operator. (e) Data output by the IonPro-IMS was collected on a laptop computer using Hyper Terminal. However, no data were collected
during these periods although the IonPro-IMS was operating during 100% of Phase II. The loss of data did not appear to be caused by the IonPro-IMS itself. The total time that was available for monitoring during Phase II was 35,220 minutes or 587 hours.
30
Chapter 7 Performance Summary
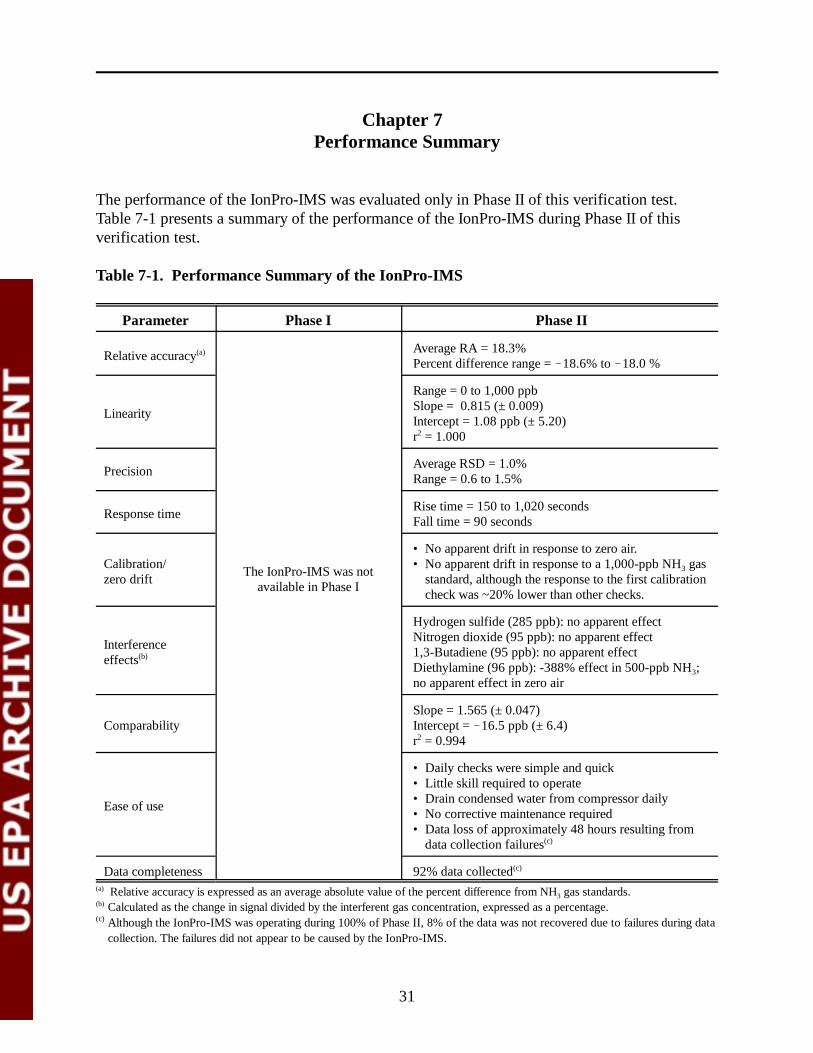
The performance of the IonPro-IMS was evaluated only in Phase II of this verification test. Table 7-1 presents a summary of the performance of the IonPro-IMS during Phase II of this verification test.
Table 7-1. Performance Summary of the IonPro-IMS
Parameter Phase I Phase II
Relative accuracy(a) Average RA = 18.3% Percent difference range = !18.6% to !18.0 %
Linearity
Range = 0 to 1,000 ppb Slope = 0.815 (± 0.009) Intercept = 1.08 ppb (± 5.20) r2 = 1.000
Precision Average RSD = 1.0% Range = 0.6 to 1.5%
Response time Rise time = 150 to 1,020 seconds Fall time = 90 seconds
Calibration/ zero drift
The IonPro-IMS was not available in Phase I
• No apparent drift in response to zero air. • No apparent drift in response to a 1,000-ppb NH3 gas
standard, although the response to the first calibration check was ~20% lower than other checks.
Interference effects(b)
Hydrogen sulfide (285 ppb): no apparent effect Nitrogen dioxide (95 ppb): no apparent effect 1,3-Butadiene (95 ppb): no apparent effect Diethylamine (96 ppb): -388% effect in 500-ppb NH3; no apparent effect in zero air
Comparability Slope = 1.565 (± 0.047) Intercept = !16.5 ppb (± 6.4) r2 = 0.994
Ease of use
• Daily checks were simple and quick • Little skill required to operate • Drain condensed water from compressor daily • No corrective maintenance required • Data loss of approximately 48 hours resulting from
data collection failures(c)
Data completeness 92% data collected(c)
(a) Relative accuracy is expressed as an average absolute value of the percent difference from NH3 gas standards. (b) Calculated as the change in signal divided by the interferent gas concentration, expressed as a percentage. (c) Although the IonPro-IMS was operating during 100% of Phase II, 8% of the data was not recovered due to failures during data
collection. The failures did not appear to be caused by the IonPro-IMS.
31

Chapter 8 References
1. National Air Pollutant Trends, 1900-1998. EPA-454/R-00-02, U.S. Environmental Protection Agency, Office of Air Quality Planning and Standards, Research Triangle Park, North Carolina, 27711.
2. Test/QA Plan for Verification of Ambient Ammonia Monitors at Animal Feeding Operations, Battelle, Columbus, Ohio, September 2003.
3. Determination of Reactive Acidic and Basic Gases and Acidity of Fine Particles (<2.5 :m), Environmental Protection Agency Compendium Method IO-4.2, EPA/625/R96/010A, U.S. Environmental Protection Agency, Office of Research and Development, Cincinnati, Ohio, 45268.
4. Operating Manual, ChemComb Model 3500 Speciation Sampling Cartridge, Revision A, January 2000, Rupprecht & Patashnick Co., Inc. East Greenbush, New York, 12061.
5. Quality Management Plan (QMP) for the ETV Advanced Monitoring Systems Center, U.S. EPA Environmental Technology Verification Program, prepared by Battelle, Columbus, Ohio, Version 4.0, December 2002.
32
Appendix A
IonPro-IMS Checklist
A-1
________________________________________________________________________
ETV Verification of Ambient Ammonia Monitorsat Animal Feeding Operations
Daily Checklist
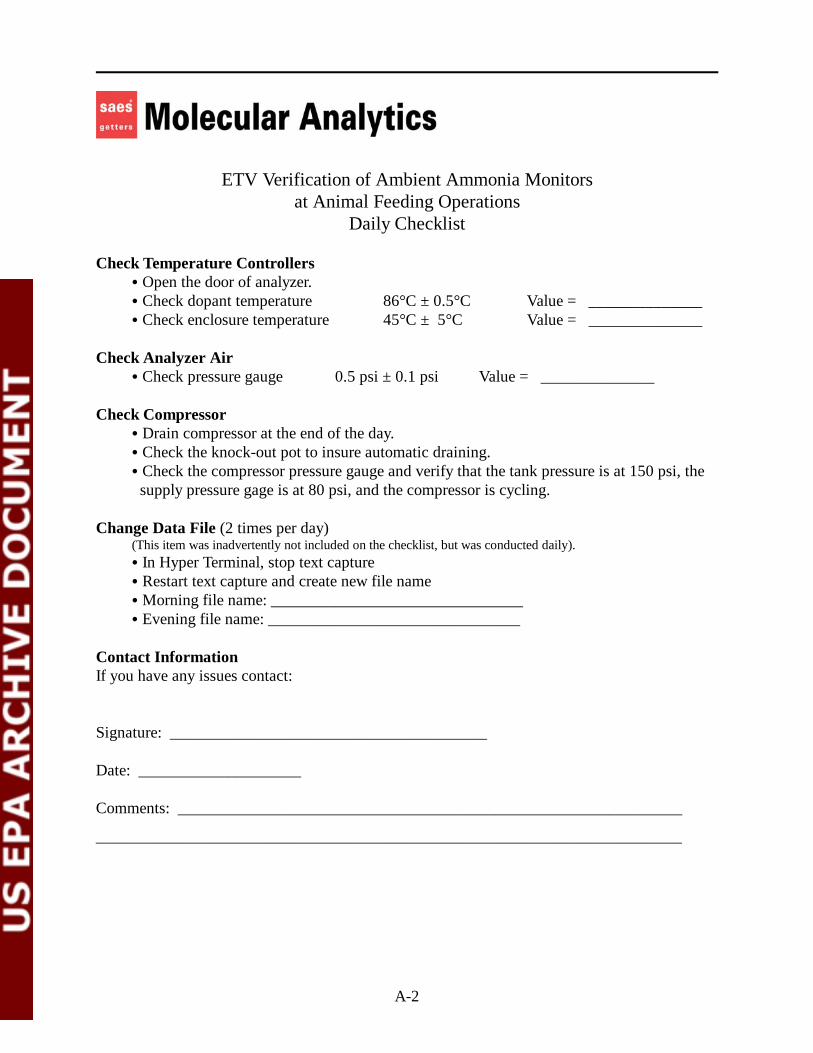
Check Temperature Controllers C Open the door of analyzer. C Check dopant temperature 86°C ± 0.5°C Value = ______________ C Check enclosure temperature 45°C ± 5°C Value = ______________
Check Analyzer Air C Check pressure gauge 0.5 psi ± 0.1 psi Value = ______________
Check Compressor C Drain compressor at the end of the day. C Check the knock-out pot to insure automatic draining. C Check the compressor pressure gauge and verify that the tank pressure is at 150 psi, the supply pressure gage is at 80 psi, and the compressor is cycling.
Change Data File (2 times per day) (This item was inadvertently not included on the checklist, but was conducted daily). C In Hyper Terminal, stop text capture C Restart text capture and create new file name C Morning file name: _______________________________ C Evening file name: _______________________________
Contact Information If you have any issues contact:
Signature: _______________________________________
Date: ____________________
Comments: ______________________________________________________________
A-2


![(4) Masama,B - Willenberg,C [D94] - Chess Western Province](https://img.pdfslide.us/doc/110x75/61969d21a1cc9770721a84d9/4-masamab-willenbergc-d94-chess-western-province.jpg)