Embed Size (px)
Citation preview

1
MOLDOVAN TOMATO VALUE CHAIN STUDY AGRICULTURAL COMPETITIVENESS AND ENTERPRISE DEVELOPMENT PROJECT (ACED)
ACED
Agricultural Competitiveness and
Enterprise Development Project
OCTOBER 2011
This report is made possible by the support of the American people through the United States Agency for
International Development (USAID). The contents are the sole responsibility of DAI and do not necessarily
reflect the views of USAID or the United States Government.

MOLDOVAN TOMATO VALUE CHAIN STUDY
Program Title: AGRICULTURAL COMPETITIVENESS AND ENTERPRISE
DEVELOPMENT (ACED)
Sponsoring USAID Office: USAID/Ukraine Regional Contract Office
Contract Number: AID-117-C-11-00001
Contractor: DAI
Date of Publication: October 2011
Author: DAI/ACED/Oleg Stiopca, Lilian Cipciriuc, Alexandru Bejan
The authors’ views expressed in this publication do not necessarily reflect the views of the United
States Agency for International Development or the United States Government.

3
CONTENTS LIST OF TABLES AND FIGURES........................................................................................................ 4
LIST OF ACRONYMS ........................................................................................................................... 6
INTRODUCTION ................................................................................................................................... 8
Chapter 1: Value Chain Analysis ............................................................................................................. 9
Overview of the Value Chain.................................................................................................................... 9
1.1 End Market Opportunities and Key Market Requirements ................................................................. 9
1.2 Production Overview ........................................................................................................................ 19
2. Value Chain Structure ......................................................................................................................... 22
2.1 Channels ............................................................................................................................................ 22
2.3 Vertical and Horizontal Linkages ..................................................................................................... 26
2.4 Supporting Services and Institutions ................................................................................................. 31
3. Productivity Analysis .......................................................................................................................... 34
3.1 Production Cost Benchmarking and Analysis .................................................................................. 34
3.2 Constraints to Increasing Production ................................................................................................ 39
4. Systemic Constraints Within the Value Chain .................................................................................... 42
4.1 Business Enabling Environment Constraints ................................................................................... 44
Chapter 2: Uprgading Needs and Opportunities ..................................................................................... 49
Annex A. Cumulative Imports of Processed Tomatoes from Moldova, as Reported by Key Markets . 53
Annex B.1. List of Cities Within a Proximity of 2000 km Around Chisinau ........................................ 54
Annex B.2. Pan-European Transport Corridor IX ................................................................................. 55
Annex D. List of Equipment Suppliers .................................................................................................. 57

4
LIST OF TABLES AND FIGURES Tables
Table 1. Tomatoes Production and Trade Flow .......................................................................................... 10
Table 2. Turkish Tomatoes compared to Moldovan Tomatoes .................................................................. 12
Table 3. Belarus Imports of Fresh Tomatoes .............................................................................................. 15
Table 4. Russia Imports of Fresh Tomatoes ............................................................................................... 16
Table 5. Romania Imports of Fresh Tomatoes ............................................................................................ 16
Table 6. Customs Tarfiffs at Russian border (indicative prices) for fresh/chilled tomatoes....................... 16
Table 7. Description of main tomatoes production areas in Moldova ........................................................ 19
Table 8. Case Study for Value Added Price Ladder for Greenhouse tomatoes (sales price 5 lei/kg at
farmergate) .................................................................................................................................................. 27
Table 9. Case Study Open field tomatoes (sales price 2.5 lei/kg at farmergate) ........................................ 28
Table 10. Cost of Production of Greenhouse Tomatoes (S=500m2) in Puhaceni village (2011) ............... 35
Table 11. Greenhouse labor, production, and yields in Moldova and Turkey ............................................ 35
Table 12. Average cost of different packaging produced in Moldova ........................................................ 38
Table 13. Characteristics of some tomatoes seeds varieties planted in Moldova ....................................... 39
Table 14. Market requirements and upgrading needs of Tomato VC ......................................................... 50

5
Figures
Figure 1. Tomato production in Moldova (2005-2010), tons ....................................................................... 9
Figure 2. Moldova’s export/import of fresh tomatoes: general trends 2005-2010 ..................................... 10
Figure 3. Moldova’s Domestic Total and Per Capita Consumption of Vegetables, kg per year ................ 11
Figure 4. Distribution of fresh tomatoes exports from Moldova in 2010, as reported by importing country
and as reported by Moldova for Tomatoes, fresh/chilled .......................................................................... 14
Figure 5. Visual comparison of respective reporting country’s imports compared to Moldova’s reported
exports ......................................................................................................................................................... 14
Figure 6. Production cycles for greenhouse and open field tomatoes ......................................................... 21
Figure 7. Production cycles for greenhouse and open field tomatoes ....................................................... 22
Figure 8. Moldova’s Fresh and Processed Tomato Value Chain Map........................................................ 23
Figure 9. Variation of tomatoes price on the local market /greenhouse production, 2011/ ........................ 27
Figure 10. Cost structure for tomatoes greenhouse production, with labor ................................................ 36

6
LIST OF ACRONYMS
AAFA Access to Agriculture Finance Activity
ACED Agriculture Competitiveness and Enterprise Development Project
ACSA National Agency for Rural Development
ADP Agribusiness Development Project
AN Anenii Noi district
BSPs Business Support Providers
EU European Union
FAO Food and Agriculture Organisation
FL Falesti district
GlobalGAP Global standard in Good Agricultural Practices
HACCP Hazard Analysis and Critical Control Points
HVA High Value Agriculture
IDSP Investment Development Support Provider
IPM Integrated Pest Management
LLC Limited Liability Company
MAFI Ministry of Agriculture and Food Industry
MCA Millennium Challenge Account
MIEPO Moldovan Investment and Export Promotion Organisation
PHH Post-harvest Handling
pH Index presenting the concentration of hydrogen ions in soil/water
RO Romania
RU Russia
STTA Short Term Technical Assistant
TA Technical Assistance
UNCOMTRADE United Nations Statistics Division
USAID United States Agency for International Development
VC Value Chain

7
VCSC Value Chain Support Centre

8
INTRODUCTION Background
ACED is a five-year project, co-funded by the United States Agency for International Development
(USAID) and the Millennium Challenge Corporation (MCC), and implemented by Development
Alternatives, Inc. (DAI) to increase the success of the Moldovan agriculture sector in the production and
marketing of high value crops both in the domestic market and internationally. ACED focuses on a
limited number of high value agriculture value chains that will take advantage of new programs,
supported by MCC, to increase irrigation capacity in the country and provide positive returns to farmers
and the rural economy. The program will provide a combination of technical and managerial training,
technical assistance and marketing services to strengthen existing value chains and encourage the
development of new ones.
Objective
This paper has been prepared to bring together the mass of information that has been gathered with
respect to the tomato value chain in Moldova, including information about various end markets,
production technologies, post-harvest practices, investment needs, relevant government policy and
business practices. This information was carefully analyzed to provide a basis for developing a strategy
and action plan that will be useful to the ACED team as it works with tomato producers, input suppliers,
traders and other participants to improve the efficiency and enhance the profitability of the value chain
and its role as a driver of the Moldovan rural economy.
Methodology
This value chain analysis is based on desk research and interviews with value chain participants,
including producers, intermediate traders, exporters, supermarkets, and input suppliers. The data
presented in this report primarily come from reports and databases published by the Moldovan National
Bureau of Statistics, Ministry of Agriculture and Food Industry and international trade databases – the
UN Comtrade, FAOSTAT, and Eurostat.
Data issues
A significant share of domestic market transactions in the tomato value chain is informal where, for the
purposes of tax evasion, invoices are not used and therefore, accurate data on sales volumes are not
available. For the purposes of this report, where accurate official data were not available, the ACED team
developed its own estimates based on various published reports and interviews with producers and other
value chain actors.
Structure of this report
This report is divided into two chapters: Chapter 1 - Value Chain Analysis includes the analysis of the
structure, production volumes and constraints within the value chain; Chapter 2 – presents upgrading
needs and opportunities identified by the value chain analysis.

9
Chapter 1: Value Chain Analysis
Overview of the Value Chain
1.1 End Market Opportunities and Key Market Requirements
In Moldova tomatoes are grown as a key vegetable crop for domestic consumption and exports. In 2010
Moldova produced 57,230 tons of tomatoes; the total area under production of both greenhouse and open
field tomatoes was 6,000 ha. During the period 2005-2010 production volumes have fluctuated with an
overall decrease trend in production, as shown in the table below (production trend in red). In 2007 a
draught occurred and tomato yields suffered due to lack of irrigation. In addition, volumes of tomato
production generally fluctuate from season to season, as demonstrated by increase in production from
2005 to 2006 and reduction from 2009 to 2010, and usually reflect the market performance of the
previous year. However, occasional fluctuation in production is not an indicator of a long-term trend
towards reduced tomato production.
Figure 1. Tomato production in Moldova (2005-2010), tons
Source: Data from Moldova’s Ministry of Agriculture and Food Industry Expert 2011, ACED calculations
Out of the total production in 2010, 53,334 tons (93% of total production) were sold fresh and 3,896 tons
were processed. Orhei Vit management mentioned that they are exporting 90% of their canned products
and the remaining is sold on the domestic market.
As shown in the Table 1, in 2010 the key end market for Moldovan tomatoes was domestic with about
86% percent of total production consumed domestically (either as fresh tomatoes or as processed tomato
based products1) and 14% exported. In addition, Moldova imported 8,743 tons of fresh tomatoes and
1 In this table the production volume for processed tomatoes indicates the volume of fresh tomatoes that was processed.
However, the volumes of processed tomatoes exported and consumed refer to the volumes of final products such as tomato juice,
canned tomatoes, ketchup, etc, which do not translate directly into the tons of tomatoes produced. On average, tomatoes
constitute about 50% of processed tomato-based products. Other ingredients like water, vinegar, salt, peppers and other account
for the other 50% of the content. Therefore the above comparison is not exact.
84620
104355
46613
83802 84000
57200
0
20000
40000
60000
80000
100000
120000
2005 2006 2007 2008 2009 2010

10
3,052 tons of tomato based processed products, making the total domestic consumption of tomatoes equal
to 57,157 tons of fresh tomatoes and 3,393 tons of processed tomato based products. According to the
below analysis, Moldovan production of fresh tomatoes does not meet the total domestic market demand.
One of the reasons is that local growers have very limited ability to produce tomatoes outside the high
season. Moldova also imports field tomatoes, as well as other vegetables, from Ukraine according to an
illegal import scheme2. This produce looks nicer, are bigger and more uniform compared to Moldovan
field tomatoes. In Ukraine the crops are better maintained and receive a better technology.
Table 1. Tomatoes Production and Trade Flow
Source: ACED team analysis based on UN Comtrade and Moldova’s Bureau of National Statistics data
Total imports of fresh tomatoes to Moldova have been declining over the period 2005-2010, while exports
have shown a slight increase during the same time period. Trends in imports tend to reflect the fluctuation
in domestic production. Note that the number reported above for exports might be inflated due to re-
exports from Turkey going via Moldova to Russia. Main outsource of tomatoes transiting Moldova
territory is Turkey.
Figure 2. Moldova’s export/import of fresh tomatoes: general trends 2005-2010
Source: UN Comtrade, ACED calculations
Domestic market
2 Products come across the border in minibusses and only pay customs duties on some portion of the produce. The other portion
often remains hidden.
Produced
Tomatoes tons tons value in USD tons value in USD tons value in USD tons value in USD
Fresh 53,334 4,920 2,164,800$ 48,414 12,103,500$ 8,743 $6,628,374 57,157 $18,731,874
Processed 3,896 3,072 2,548,789$ 341 n/a 3,052 $2,891,419 3,393 $2,891,419
Total 57,230 7,992 $4,713,589 48,755 $12,103,500 11,795 $9,519,793 60,550 $21,623,293
Exported Consumed Imported Total Domestic Market

11
Naturally the key end market for Moldovan tomatoes should be the domestic one where the primary
market segments for tomatoes is the open air retail market and a much smaller, but growing, supermarket
channel. Given Moldova’s history of tomato production and the existing domestic market demand for
tomatoes, opportunities for import substitution exist when local growers can offer an improved quality
and extend their growing season. Currently Turkish tomatoes dictate the price trend for local tomatoes. In
the off season, Turkish tomatoes dominate HoReCa and Supermarket channels due to their quality and
shelf life. The price of Turkish tomatoes sets a bar for Moldovan ones. For example, Turkish tomatoes
can sell for 12 MDL/kg during the transitional season, and Moldovan ones for 7, representing a price to
quality benchmark.
In Moldova, annual fresh tomato consumption is about 15 kg per capita. Food expenditures constitute
40% of total living expenses of Moldova’s population with 12% of food expenditures spent on
vegetables. It is anticipated, as it is across the world that fresh tomato consumption will continue to
increase as the culture of consuming fresh vegetables as a healthy food takes hold and as the health
benefits of tomatoes become more recognized. This might not result in a visible increase in the local
market in the near term, but will likely result in increases in consumption in regional markets. In addition,
as incomes increase, it is expected that the population will prefer purchasing fresh rather than processed
tomatoes.
The available data show that Moldova’s total and per capita vegetable consumption is increasing.
Assuming that tomatoes continue to account for about 50% of the total vegetable production, this trend is
valid for tomatoes as well.
Figure 3. Moldova’s Domestic Total and Per Capita Consumption of Vegetables, kg per year
Source: Data from Moldova’s Ministry of Agriculture and Food Industry 2009, calculations by ACED staff.
Competitive position in domestic market:
The main competition in the domestic market is presented by imported tomatoes, primarily from Turkey.
In 2010, Moldova spent approximately $ 6,628,374 importing fresh tomatoes, out of which $5,442,704
was spent on imports from Turkey. The sales season for greenhouse tomatoes in Moldova is early May to
late November, sometimes beginning of December (production starts second half of January and finishes
at beginning of December), with open field tomato production taking place from June to late October.
Turkish tomatoes are imported from mid-November to June 1st to substitute for the lack of local
0
20
40
60
80
100
120
140
0
50
100
150
200
250
300
350
400
450
500
2002 2003 2004 2005 2006 2008

12
production at this time. During the local peak production season Turkish tomatoes are not present in the
market, except in unusual cases like when Turkish tomatoes were banned in Russia in 2008 (Fig. 7.).
Direct competition between local and imported tomatoes typically takes place during the roughly 10-day
period of June and the first 10 days of November when both are offered on the market When both
imported and local tomatoes are present on the market, Moldovan consumers prefer local tomatoes which
are believed to be fresher, safer and contain fewer pesticides. This is evidenced by some examples when
local traders purchase Turkish tomatoes on the wholesale market, take out the stems and sell them on the
retail market as locally produced tomatoes.
Although consumers prefer the taste of local tomatoes, Moldovan tomatoes cannot compete on quality
with Turkish tomatoes. Imported tomatoes have better visual appeal due to grading and have a longer
shelf life due to use of pre-cooling and being treated with calcium or other firmness enhancers, in addition
to the individual qualities of the variety itself. Quality characteristics, such as longer shelf life, are not a
factor in the open air retail markets where quality requirements are lower and sanitary and phytosanitary
standards are not enforced. In this market channel, local tomatoes can be more competitive than imported.
However, the inability to meet quality requirements of local supermarkets, limits local producers
competitiveness vis-a-vis imports in this higher value market channel. Other comparative characteristics
of local and Turkish tomatoes are shown in the table below.
Table 2. Turkish Tomatoes compared to Moldovan Tomatoes
Price Taste Shape Color Consistency
For a period of about one week,
right at the beginning of the
season local tomatoes are 10 -
20% more expensive in retail
markets compared to imported
Turkish tomatoes. After this
period, prices for local
tomatoes are 10-20% lower
than imported Turkish ones as
Moldovan tomatoes flood the
market and Turkish imports
cease for the summer.
In the
Moldovan
consumer view,
imported
tomatoes “have
no taste” which
is one of the
key competitive
advantages of
local tomatoes.
Imported tomatoes
are round. There
are no plum
tomatoes imported
from Turkey.
However, there is
demand for both
shapes in the
Moldovan market.
Imported
tomatoes have a
uniform pale red
color. There are
no tomatoes of
other colors,
such as orange
and yellow,
imported from
Turkey.
The common
characteristic for
all of the
imported varieties
are greater
firmness,
compared to local
tomatoes.
Consumer preferences:
During the high season domestic consumer demand is not very sophisticated, with consumers generally
content with what is available. The price difference in the beginning of season relates to enthusiasm for
the re-appearance of local tomatoes and the fact that local buyers believe that the imported tomatoes have
no taste.
Demand for specialty varieties of tomatoes, such as cherry tomatoes, is currently limited to supermarkets
and HORECA sector. There is currently potential for introducing several new varieties for testing, such as
– yellow tomatoes, black tomatoes, heirloom tomatoes, etc. The strategy of introducing new higher value
varieties of tomatoes onto the shelves will be discussed with the supermarkets and we anticipate it being
possible to work in partnership with them, paired with local farmers introducing changes into their
production technology.
Between open field and greenhouse tomatoes the Moldovan consumers prefer open field tomatoes. One
main reason is because they can afford them in larger quantities during the high season. However, during

13
the transition period from greenhouse production to open field production, greenhouse growers often try
to sell their tomatoes as open field tomatoes by removing stems and muddying the tomatoes, thus
showing the ‘naturalness’ of its origin. Open field small and medium sizes tomatoes are also the preferred
choice for making homemade canned products. Traditionally it has become a habit to use such tomatoes
in the cuisine so people got used to them. This is not just a cost factor, but consumers prefer open field
tomatoes instead of greenhouse produced because they are considered healthier, containing less pesticides
and fertilizers. Also the Moldovans think the flavor is much richer and more characteristic to what they
have got used through years.
Market opportunities:
Opportunities exist for import substitution in the domestic market focusing on both the open air retail
market and the supermarket segments. This can be accomplished by extending the production season for
local tomatoes. It is estimated that with slight and not very costly production improvements, such as
introducing energy efficient heating, double layer covers, choosing the right varieties, the trading season
for local tomatoes can be extended both into spring and into late fall with the first local tomatoes reaching
the market on May 1 and lasting until December 1 (Fig. 7.) In this way, local producers will gain almost 2
extra months of product marketing.
In the domestic open air market segment the competition is currently based on price. Quality
requirements are not stringent and can usually be met by local producers. There are no specific
requirements for shape, product uniformity, visual appeal and shelf life. Transactions in this market
segment are informal with no invoices used. Phytosanitary requirements are poorly enforced at the open
air market level. Although sanitary inspection authorities provide a receipt for inspection to all who pass
through, they are not always conducting the proper range of testing of the products at the wholesale
markets before the products reach the retail markets. As a result, a visual inspection by experts as well as
the number of people reporting getting sick indicates that produce sold on open air retail markets
frequently exceeds acceptable quantities of nitrates, pesticides or other contaminants.
Another issue is that farmers don’t bother getting certificates from the local authorities since they don’t
see any commercial value in the open air market. However, those selling directly to supermarkets get the
certification done at state SPS laboratories.
Since the entry requirements in the open air market are not stringent and local consumer taste preferences
already favor local tomatoes over imported, there is an immediate opportunity to substitute for imports by
increasing the local production season beyond November through improvements in greenhouse
technology, minimizing production costs and increasing yields.
The domestic supermarket channel is where competition with imports is strongest and quality
requirements are strict. That makes competing in this market channel a longer term goal for local
producers. Tackling that will require improved quality and sufficient volumes supplied on a sustained
basis, which will require pre-cooling/cold storage, grading, and stronger cooperation among producers.
Farmers need to respond to the requirements of supermarket suppliers for on time delivery, formal
invoices, consistency of supply, and uniformity and longer shelf life of the product. Specific requirements
of domestic supermarkets include:
Longer shelf life -- at least 1 week
Seasonal contracts and ability to deliver on time and to volumes contracted, on a consistent basis
Invoiced transactions
Ability to accept post-payment terms of 14 days

14
Quality certifications and compliance with SPS standards
Single point of transaction (which requires farmer organization and strong relationships between
growers and distributors/supermarket suppliers)
Export markets
Moldovan exports of tomatoes as percentage of total production are small (about 1%). In 2010 Moldova
exported 4,920 tons of fresh tomatoes and 3,072 tons of processed tomato-based products, which mainly
included tomato juices, canned tomatoes, tomato paste, and ketchup. 90% of Moldovan production of
processed tomato products is exported, primarily to Russia, Belarus and Kazakhstan. The fastest growing
market for fresh and processed tomatoes is Russia. So far the Belarus market is smaller in number of
population and slightly declining, nevertheless, it is the biggest consumer market for Moldovan tomatoes.
UN Comtrade data for processed tomatoes are included in the Annex A, since this analysis is primarily
focused on fresh tomatoes.
Moldova’s key export markets for fresh tomatoes are Belarus, Russia and Romania. In the UN Comtrade
database, there is a discrepancy between Moldova’s reported exports to these three markets, and reported
imports by these countries from Moldova. The data differences are due to re-exports by Moldova, likely
of Turkish tomatoes. The most significant difference is with respect to the Russian market which indicates
a larger potential market for Moldovan producers, if they were to substitute the re-exports with local
production. The figure below shows a comparison of reported imports and reported exports of tomatoes
from Moldova.
Figure 4. Distribution of fresh tomatoes exports from Moldova in 2010, as reported by importing country and
as reported by Moldova for Tomatoes, fresh/chilled [HS 070200]
Year Trade
Flow Reporter Trade Value
Net Weight
(kg)
Trade
Flow Trade Value
Net Weight
(kg)
Variation
(value / kg )
2010 Import Belarus $1,295,600 2,829,581 Export $1,333,109 2,886,701 $37,509 57,120
2010 Import Romania $112,238 163,420 Export $83,628 163,420 ($28,610) 0
2010 Import Russia $508,836 745,230 Export $1,234,694 1,870,101 $725,858 1,124,871
From the above table we can see that Moldova has reported exports of roughly 57 truckloads (around
1125 tons) of tomatoes to Russia while Russian statistics show imports of less than half this amount from
Moldova. That probably has to do with the fact that in the Transnistrian region there are uncontrolled
business operations that may account for the surplus. The value chain analysis team verbally received
information that trucks with tomatoes and citrus are being imported heavily to that region, which is not
consistent with the consumption, meaning that some re-export operations are likely running through that
area.
Figure 5. Visual comparison of respective reporting country’s imports compared to Moldova’s reported
exports

15
Source: UN Comtrade
For the purposes of this analysis we use the reported data on imports from Moldova as shown in UN
Comtrade database. Although currently Belarus is the largest market for Moldovan fresh tomatoes in
terms of volumes, analysis of market data presented below shows that Belarus imports of fresh tomatoes
declined from 2009 to 2010 and Moldova’s share of this market declined slightly as well. For the year
2011 we lack data but from discussing with traders and farmers we draw the conclusion that for
greenhouse tomatoes it was a difficult year, because of the volatility of Belarus market. While Moldovan
exports to the Russian market are currently smaller in terms of volume, Russia’s overall imports of fresh
tomatoes have been increasing (indicating a growing market) and Moldova’s share of this market has
been showing a slight increase as well. These trends indicate a need for better understanding of the
requirements of the Russian market and analysis of potential opportunities for Moldovan producers in this
market. Romania’s imports of Moldovan tomatoes are small.
Table 3. Belarus Imports of Fresh Tomatoes
Belarus Imports of Fresh Tomatoes
World Moldova Moldova’s share
value kg value kg value kg
2005 $10,942,500 20,639,040 $1,088,600 2,640,272 9.9% 12.8%
2006 $14,113,800 28,174,484 $1,322,700 3,805,539 9.4% 13.5%
2007 $13,755,900 29,003,064 $826,700 3,278,209 6.0% 11.3%
2008 $22,703,500 28,838,162 $1,426,700 3,819,998 6.3% 13.2%
2009 $15,478,300 34,791,375 $1,391,300 4,201,098 9.0% 12.1%
2010 $18,807,500 25,066,021 $1,295,600 2,829,581 6.9% 11.3%
2,886,701
163,420
1,870,101
NetWeight (kg)2010
Belarus
Romania
Russian Federation
2,829,581
163,420
745,230
Reported Imports Reported Exports

16
Source: UN Comtrade
Table 4. Russia Imports of Fresh Tomatoes
Russia Imports of Fresh Tomatoes
World Moldova Moldova’s share
value kg value kg value kg
2005 $216,170,125 351,831,732 - - 0.0% 0.0%
2006 $300,944,230 413,597,048 - - 0.0% 0.0%
2007 $534,742,408 550,528,118 $48,324 92,930 0.0% 0.0%
2008 $628,923,467 673,894,332 $384,264 771,705 0.1% 0.1%
2009 $648,885,056 694,386,351 $631,788 1,108,487 0.1% 0.2%
2010 $773,582,210 699,282,212 $508,836 745,230 0.1% 0.1%
Source: UN Comtrade
Table 5. Romania Imports of Fresh Tomatoes
Romania Imports of Fresh Tomatoes
World Moldova Moldova’s share
value kg value kg value kg
2005 $13,807,889 52,694,927 $185,402 753,653 1.3% 1.4%
2006 $15,958,574 51,428,924 $6,924 45,500 0.0% 0.1%
2007 $75,578,132 71,059,835 $15,536 19,030 0.0% 0.0%
2008 $70,840,839 66,017,143 - - 0.0% 0.0%
2009 $41,397,537 40,874,441 - - 0.0% 0.0%
2010 $59,120,717 60,765,826 $112,238 163,420 0.2% 0.3%
Source: UN Comtrade
Competitive position in export markets (Belarus, Russia):
In export markets, such as Belarus and Russia, Moldovan tomatoes are sold in the open air wholesale
market segment which primarily supplies the open air retail markets. Moldovan presence in the higher
value and rapidly growing supermarket segment is currently almost non-existent due to inability to meet
quality and volume requirements of supermarket buyers.
Currently Moldova competes on price due to the preferential tariff regime for Moldovan exports to CIS
countries, as compared to other exporters, shown in the table below. In addition, in CIS consumers still
prefer the taste of Moldovan tomatoes. This is likely to change, however, as consumers get used to higher
quality products from other countries. Without tariff advantages (listed in table below), Moldovan
producers would need to drastically improve the quality of product, taste, and consistency of supply
volumes in order to be competitive.
Table 6. Customs Tarfiffs at Russian border (indicative prices) for fresh/chilled tomatoes
Period
Price, USD
CIS Other
Countries Poland

17
01 JAN – 31 MAR 1.05 1.58 1.47
01 APR – 30 APR 1.05 1.31 1.31
01 MAY – 14 MAY 1.05 1.31 1.31
15 MAY – 31 MAY 1.05 1.31 1.31
01 JUN – 30 SEP 0.63 1.31 1.05
01 OCT – 31 OCT 0.58 1.31 1.00
01 NOV – 20 DEC 1.05 1.58 1.47
21 DEC – 31 DEC 1.05 1.58 1.47
Source: Parma Ltd. (Russia), ACED EMS 2011
At the border with Russia, the indicative pricing used for import paperwork for tomatoes from the CIS is
kept lower than for other non-CIS countries, helping Moldovan growers get to market. This means that
the costs of trade are lower for Moldovans, as taxes are collected on this lower indicative price.
Market opportunities:
Immediate opportunities exist to improve the competitiveness and reputation of Moldovan tomatoes in the
wholesale market segment in Russia and Belarus. To remain competitive in this segment over the long
term, Moldovan tomato producers and exporters need to find cost effective methods of increasing total
production volumes by increasing yields, extending the season, reducing post-harvest losses, capitalizing
on economies of scale and improving the quality of the produce. In particular, greenhouse growers should
increase their premium returns in the early market before the open field tomato harvest begins. This will
require grower consolidation to meet volume requirements, as well as quality improvements to ensure:
Longer shelf life of at least 1 week
Product uniformity and visual appeal (lack of visual defects)
Compliance with SPS standards
Russia and Belarus are not the only markets that Moldova has to look at, although these are quite
important ones at the moment. There are other countries to the North and North-West that could be
interested in Moldovan tomatoes such as Poland, the Baltics, Norway and Sweden. As the quality and
reputation of Moldovan tomatoes improves, Moldovan producers will be able to position themselves as
suppliers to the growing and higher value supermarket channel by developing relationships with
importers and traders in export markets that supply supermarkets. Moldovan producers will need to meet
their stringent requirements for quality (sizing of tomatoes, uniformity of varieties delivered), consistency
of supply and volumes, and accept post-payment terms of 14 days. Understanding the unique
requirements of the supermarkets in each of the target markets and how they change over time is critical.
The ACED Russia end market study provides an in-depth understanding of the logistics and dynamics of
the Russian Market. That study did not focus on Tomatoes due to the limited potential for exports there in
the near term. The other most recent studies of the Belarus and Russia tomato markets date back to 2005
and 2006.3 Market analysis in Belarus (the biggest Moldovan export market) concluded that:
- Packaging used by Moldovan exporters does not fully comply with the requirements of Belarus
importers or retailers (especially supermarkets). Tomatoes originating from Moldova are packed in
wooden and plastic boxes, while Belarus importers prefer non-returnable 5-7 kg carton boxes.
3 “The Belarusian Market for Tomatoes”, USAID/CNFA Agribusiness Development Project, July 2006 and “Tomatoes on the
Russian Market”, USAID/CNFA Agribusiness Development Project, May 2005

18
However, in recent discussions with the ACED team some exporters suggested that the carton boxes
are no longer required and that wooden boxes with one layer of tomatoes are preferred.
- Requirements for product visual appearance in 2006 included preference for tomatoes with diameter
in the range of 50-60 mm. Tomatoes needed to be ripe, sound, preferably with peduncle (stem)
attached, free of damage caused by frost and free from soil dust.
In respect to the EU market, changes resulting from the signing of the Free Trade Agreement will be
watched as a strategic opportunity and will be investigated for the purpose of potential exports of fresh
tomatoes and other vegetables. As for the growers this represents a huge opportunity with the opening of
a big market with a big potential of absorption, high purchasing power, and a relative stability of prices.
At the same time one should consider that the competition in this market will be played as well on the
home ‘field’ – meaning that imports of fresh produce from EU will also come to Moldova and compete
here against local tomatoes.
At present, Moldova has a unique position in comparison to other neighbor countries – climate,
participation in important Trade agreements with the neighbors in the East and in the West. Since its
export already benefits from a series of preferences in the majority of surrounding markets, this is
generating a competitive advantage to the local producers. Taking into account the small domestic market
it means that agriculture will still generate most of Moldovan exports in the coming 10 to 15 years.
The Annex B.1 provides a list of towns and proximity to Chisinau throughout Europe, from West up to
Ural Mountains. The analysis of the respective table shows that Moldovan exports to the Russian market
travel much farther than important markets which are situated closer, in the western part of Europe. The
major constraints stopping Moldovan exports of tomatoes to EU are the low volumes, insufficient quality
/ no certification and relative high costs of production. Currently exported tomatoes are of lower quality if
compared with the tomatoes of competing countries such as Turkey and Spain. Moldova is has attractive
position, with remarkable logistics connections. In fact, Chisinau is located along the Pan-European
Corridor IX, which is 3400 km long, connecting Helsinki to Alexandroupoli from North to South, via
Vyborg - St. Petersburg - Pskov - Gomel - Kiev - Lyubashivka - Chisinau - Bucharest - Dimitrovgrad and
through 3 additional branches (see the map displayed in the Annex B.2). Corridor IX crosses Moldova
from East to West and finds its major hub in Chisinau.
An interesting point could be observed when analyzing German imports of tomatoes. Germany is
importing tomatoes from quite remote areas, much farther than Moldova. This one could be an
opportunity that needs a more in-depth analysis for establishing potential new alternative export markets.
Processed tomatoes:
In 2010 Moldova exported 3072 tons of processed tomato-based products to Russia, Belarus and
Kazakhstan. Although a small share of total domestic production, tomato processing industry presents a
market outlet for Moldovan producers. Interviews with processors indicate a growing need for consistent
supply by the producers and willingness to develop contract relationships with farmers. Processors report
underutilization of their production capacity due to difficulty getting reliable and sufficient supply of
product from growers. The challenge is inconsistency of supply on the farmer side, side selling, and lack
of long term relationships between producers and processors. This presents an opportunity for growers to
diversify their markets and create business models that limit reliance on open air markets alone. To
understand the dynamics and requirements of the processing value chain, as well opportunities to increase
value added and increased benefits to tomato producers, ACED plans to carry out a separate study of the
tomato processing value chain. Meetings to this end have already begun.
19
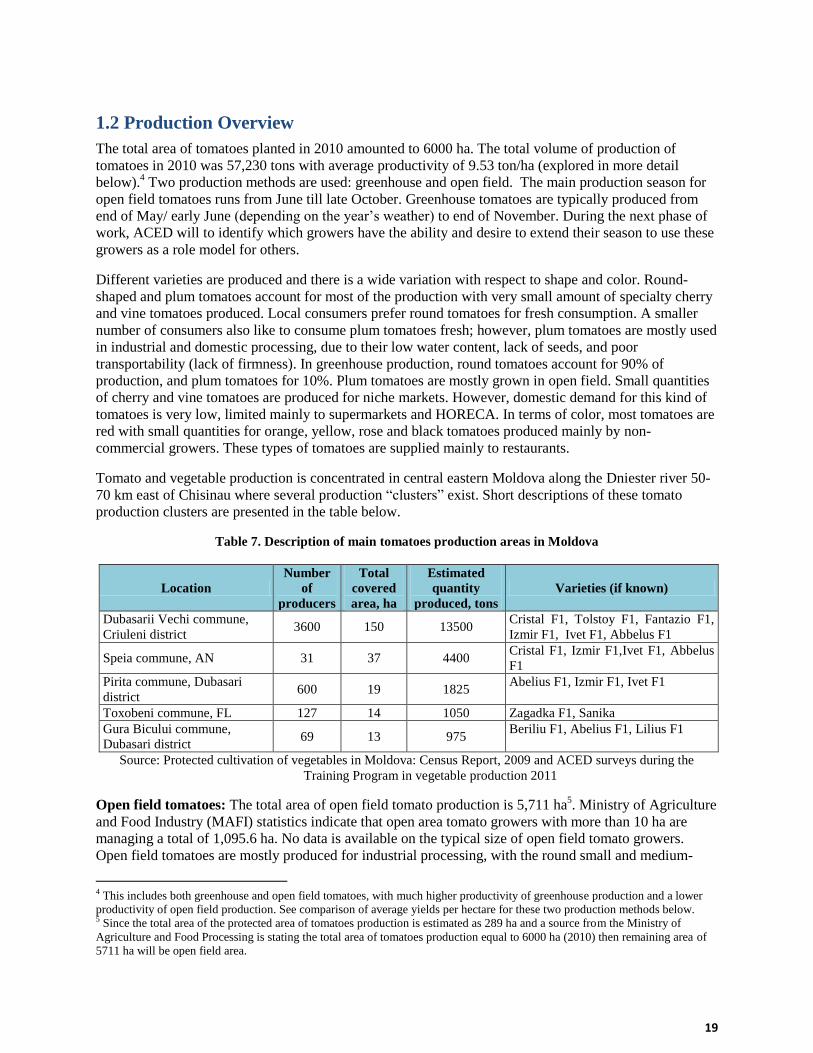
1.2 Production Overview
The total area of tomatoes planted in 2010 amounted to 6000 ha. The total volume of production of
tomatoes in 2010 was 57,230 tons with average productivity of 9.53 ton/ha (explored in more detail
below).4 Two production methods are used: greenhouse and open field. The main production season for
open field tomatoes runs from June till late October. Greenhouse tomatoes are typically produced from
end of May/ early June (depending on the year’s weather) to end of November. During the next phase of
work, ACED will to identify which growers have the ability and desire to extend their season to use these
growers as a role model for others.
Different varieties are produced and there is a wide variation with respect to shape and color. Round-
shaped and plum tomatoes account for most of the production with very small amount of specialty cherry
and vine tomatoes produced. Local consumers prefer round tomatoes for fresh consumption. A smaller
number of consumers also like to consume plum tomatoes fresh; however, plum tomatoes are mostly used
in industrial and domestic processing, due to their low water content, lack of seeds, and poor
transportability (lack of firmness). In greenhouse production, round tomatoes account for 90% of
production, and plum tomatoes for 10%. Plum tomatoes are mostly grown in open field. Small quantities
of cherry and vine tomatoes are produced for niche markets. However, domestic demand for this kind of
tomatoes is very low, limited mainly to supermarkets and HORECA. In terms of color, most tomatoes are
red with small quantities for orange, yellow, rose and black tomatoes produced mainly by non-
commercial growers. These types of tomatoes are supplied mainly to restaurants.
Tomato and vegetable production is concentrated in central eastern Moldova along the Dniester river 50-
70 km east of Chisinau where several production “clusters” exist. Short descriptions of these tomato
production clusters are presented in the table below.
Table 7. Description of main tomatoes production areas in Moldova
Location
Number
of
producers
Total
covered
area, ha
Estimated
quantity
produced, tons
Varieties (if known)
Dubasarii Vechi commune,
Criuleni district 3600 150 13500
Cristal F1, Tolstoy F1, Fantazio F1,
Izmir F1, Ivet F1, Abbelus F1
Speia commune, AN 31 37 4400 Cristal F1, Izmir F1,Ivet F1, Abbelus
F1
Pirita commune, Dubasari
district 600 19 1825
Abelius F1, Izmir F1, Ivet F1
Toxobeni commune, FL 127 14 1050 Zagadka F1, Sanika
Gura Bicului commune,
Dubasari district 69 13 975
Beriliu F1, Abelius F1, Lilius F1
Source: Protected cultivation of vegetables in Moldova: Census Report, 2009 and ACED surveys during the
Training Program in vegetable production 2011
Open field tomatoes: The total area of open field tomato production is 5,711 ha5. Ministry of Agriculture
and Food Industry (MAFI) statistics indicate that open area tomato growers with more than 10 ha are
managing a total of 1,095.6 ha. No data is available on the typical size of open field tomato growers.
Open field tomatoes are mostly produced for industrial processing, with the round small and medium-
4 This includes both greenhouse and open field tomatoes, with much higher productivity of greenhouse production and a lower
productivity of open field production. See comparison of average yields per hectare for these two production methods below. 5 Since the total area of the protected area of tomatoes production is estimated as 289 ha and a source from the Ministry of
Agriculture and Food Processing is stating the total area of tomatoes production equal to 6000 ha (2010) then remaining area of
5711 ha will be open field area.

20
sized tomatoes used for canned products in jars, and plum tomatoes – for tomato juice, ketchup, and
paste.
Greenhouse tomatoes: Plastic and glass covered greenhouses are used for tomato production by 7,986
farmers that own 289 ha of protected area, 40 producers use glass greenhouses and the rest – plastic
covered frames. Interviews with growers from different production areas across Moldova suggest that
greenhouse tomato growers are able to get yields as high as 180 - 250 tons per ha. An estimate of 200
tons/ha is used in the table below.
2010 data Greenhouse tomatoes Open field tomatoes
Number of farmers 7986~ n/a
Hectares planted 289 ha~ 5711 ha
Volume produced 57,800 tons^ 28,300 tons
Yield per ha 200 tons^ 9.4 tons (official statistics)
30 tons (ACED estimates based on farmer
interviews)^
Production season May-November June-October
Number of crops per season 1-3 crops 1 crop
Turkish productivity yield/ ha 170 (Antalya 2006)* 54 tons (2006 approx. average)*
MAFI Official Statistics 2010
*G. Keskin, et al. An Analysis of Tomato Production Cost and Labor Force Productivity in Turkey
^ACED estimations based on farmer interviews. In the case study regarding Puhaceni village the yield was 230
ton/ha
~CNFA Census Report On Protected Area Production
52% of greenhouses growers cultivate only one crop per year. Another 36% grow two crops per season
and 12% - three crops. In the case of a protected area with 2 production cycles:
- Production cycle I starts in January with the preparation of the seedling facility. Harvest starts
during the third 10-day period of May and finishes during the second 10-day period of July.
- Production cycle II starts during the second 10-day period of July with planting. Harvesting starts
during the first 10-day period of September and finishes during the third 10-day period of
November.
As illustrated in the production cycle chart below, there is a time overlap in production cycle of protected
and open area produced tomatoes that starts in the middle of July and finishes at the beginning of
September. There is also a period when both local and imported tomatoes directly compete on the market.
Industry experts estimate that the local production season can be extended with the first local tomatoes
reaching the market on May 1, lasting until December 1.

Figure 6. Production cycles for greenhouse and open field tomatoes
I II III I II III I II III I II III I II III I II III I II III I II III I II III I II III I II III I II III
Preparation of the seedling production facil ity
Procurement of inputs (seeds, substrate)
Sowing
Arrangement of pallets in the seedling pr. Facil ity
Irrigation of the plants ti l l repication
Prickling out
Care of the seedling (irig., fert., protection)
Planting
Install ing the irrigation system
Breaking young vines
Training the plants
Irrigation and fertil ization
Harvesting Tomatoes of I Cycle
Sowing for II cycle
Prickling out
Taking out plants from I cycle
Planting for II cycle
Install ing the irrigation system, mulch
Irrigation and fertil ization
Harvesting Tomatoes of II Cycle
Taking out plants from II cycle
Harvesting (open field from seedling)
Harvesting (open field from seeds)
Presence of Import Tomatoes on the Market
May
Production component
Jan Feb Mar Apr DecJune July Aug Sept Oct Nov

22
Figure 7. Production cycles for greenhouse and open
field tomatoes
Rayon retail agro market (Total - 38)
Whole Sale Market (WSM) (Total - 4)
2. Value Chain Structure
2.1 Channels
Moldovan tomatoes reach the final consumer through
several channels, shown in the value chain map
below, which are defined by the way the retail
distribution channels in end markets are currently
structured. Processed tomato-based products are
mostly exported, while fresh tomatoes are mainly
consumed in the domestic market. Retail distribution
channels in both domestic and key export markets
(Belarus, Russia and Romania) are organized in a
similar way, however for the purposes of this value
chain map export market is presented as one channel
due to the small size of exports overall.
Channel 1: Domestic open air retail market
channel. Open air markets currently dominate the
retail channel for fresh tomatoes in Moldova in terms
of sales volume. It is estimated that around 80% of
total domestic sales of fresh and processed tomatoes
take place through this channel. However, this
channel has also been shrinking in terms of overall
food sales volumes by about 3-5% annually and this
trend is projected to continue as consumers increase
the share of their total shopping done in modern
supermarkets.
Since open air markets handle large volumes of
produce, competition is high and sale prices are low
compared to other channels. Quality requirements for
tomatoes in this channel are not sophisticated and
competition is mainly based on price. Consumers in
this segment choose the product that they feel offer
the best value proposition (price in relation to
appearance). The average retail price for tomatoes in
an open-air retail market ranges between 3 and 4
MDL/kg during the high season. This price can’t be used as a set signpost, but it is often pronounced
by growers themselves when they trade in the market. Transactions in this channel both between
producers and traders, and with consumers are mostly informal, with no invoices or receipts used.
Significant issue also is the lack of enforcement of sanitary and phytosanitary standards. The testing
that is performed on the spot is quite a superficial one, mainly testing for nitrates, and even after
positive results rarely would action be taken by market authorities, such as expelling the respective
offending growers. Consumers, however, prefer to purchase tomatoes in open air market due to an
overall perception that the produce there is better quality and fresher than in supermarkets where
produce stays on the shelf for a longer time.
There are 4 permanent whole sale markets in Moldova (3 in Chisinau and 1 in Balti) that supply 138
open air retail markets across the country (38 at the rayon level and 100 local markets, including 12 in
Chisinau). At the height of the production season temporary wholesale markets are also established in
each municipality where traders and especially local producers sell their produce from minibuses and

23
cars. At the local open air markets, growers usually sell their produce directly, while at the rayon and
Chisinau markets the product is supplied primarily by minibus traders who buy tomatoes from the
wholesale markets and directly from the farmer’s gates. Growers’ access to open air markets is
limited. In cases when individual farmers bring the produce to the open air retail market to trade
directly, they either use their own means of transportation or rent a minibus, sometimes individually
or together with a group of farmers.
Channel 2: Domestic supermarket channel. Major supermarket chains in Moldova include
Fourchette, Green Hills, N1, Fidesco, Metro Cash & Carry, Cvin, Linella, and Everest. Fruit and
vegetables occupy less than 5% of the vending space within a typical Moldovan supermarket. This
percentage is lower in the case of convenience stores or local groceries6. However, the supermarket
channel has been growing at about 3-5% annually as a food sales outlet and is projected to continue to
grow. According to some food distributors’ estimates, about 10-20% of consumers buy their groceries
in supermarkets. There are over 100 supermarkets in Moldova with the majority concentrated in larger
districts. Supermarkets sell both local and imported fresh tomatoes and tomato-based processed
products. This channel is the main sales channel for processed tomato products. In addition, imports
account for about 70% of supermarket’s total fruit and vegetable turnover.
Supermarkets usually source local fresh tomatoes from distribution companies and rarely minibus
traders who purchase produce directly from growers. Imported tomatoes are purchased from
distributors and often directly from importers. Processed tomato products are sourced primarily from
distribution companies. The average price for fresh tomatoes in supermarkets is between 7 and 8
MDL/kg, sometimes even 10 MDL. This channel is the most regulated one in terms of quality,
sanitary standards and supplier requirements. Local producers usually cannot meet the volume
requirements, delivery schedules, and product standards established by the supermarkets. In order to
access this channel, producers need to improve product quality and consistency of production
volumes and establish relationships with distributors and traders that supply supermarkets, as
supermarkets are looking for consistent supply from a limited number of trusted suppliers. This is
also the channel where competition from imports is the strongest.
Channel 3: Domestic small grocery stores. This channel includes small local grocery/convenience
stores and kiosks that trade smaller volumes and offer less variety at prices only 0.5-1.0 MDL/kg
higher than the open air retail markets. This channel serves consumers who are looking to purchase a
mix of different food products and beverages in one nearby location, in addition to fresh produce.
There are over 1,000 such stores in Moldova. According to some distributors’ calculations, 20-40% of
household purchases are made at these stores that are conveniently located throughout the residential
areas. Many of these stores do not offer a full range of fruits and vegetables which occupy less than
3% from the total shelf space.
Channel 4: Export markets. A small share (about 1%) of fresh tomatoes produced is exported.
However, 90% of processed tomato-based products are exported with only 10% sold in the domestic
market. Moldovan fresh and processed tomatoes reach export markets primarily through traders and a
few large growers exporting directly. They use services of transportation companies and specialized
companies in export markets that offer customs clearance services. After passing the customs
procedures traders bring the produce to wholesale markets in Russia and Belarus where they compete
primarily on price. Meeting the sanitary and phytosanitary standards is the primary requirement in this
market segment. To supply the supermarkets in these markets, producers would need to establish
relationships with traders in export markets that supply supermarkets, as well as meet the
requirements for quality and supply volumes.
Figure 8. Moldova’s Fresh and Processed Tomato Value Chain Map
6 Fresh Fruit and Vegetable Market In Moldova: FACTS & FIGURES, BizGates, 2010

24

25
2.2 Functions and Actors
The majority of greenhouse tomato growers are small farmers with individual production areas of
less than 500 m². The total number of small growers is 4,384 managing a total of 136 ha. In addition,
there is an estimated 648 medium-sized growers with production areas of 500-4,999 m² who manage a
total of 72 ha of protected area. Large growers with production area more than 5,000 m² number 45
farmers and manage about 80 ha of protected area7.
Open field tomatoes growers manage a total of 5,711 ha. Although data on the total number and size
characteristics of open field tomato growers are not available, according to Ministry of Agriculture
and Food Industry 1,095.6 ha are managed by farmers owning 10 ha or more.
Harvesting of fresh tomatoes in case of small growers is done directly by producers without hiring
any outside labor. Medium-sized growers hire about 50% of their labor force on a temporary basis,
while large growers and open field growers usually hire 100% of their labor force on a seasonal part-
time basis. Labor cost is $6-9/day.
Basic sorting and grading are done manually by the growers before the produce is transported.
Traders and exporters are asking for 3 or 4 categories of tomatoes and growers grade them
accordingly. Exporters frequently complain of bad quality and lack of uniformity of tomatoes when
growers put the poor quality tomatoes at the bottom of the wooden crates in which tomatoes are
transported.
The Post-harvest handling node of the tomato value chain is missing a warehousing function with
the ability to extend shelf-life. Currently there aren’t any pre-cooling/cold storage/packing facilities
for tomatoes. A cold storage facility (including a forced-air cooling system) would extend the shelf
life of the produce, and allow for storing tomatoes during the peak season when price is low, and
provide the opportunity to meet an extended supply calendar required by supermarkets. Red tomatoes
can be stored for 4-4.5 weeks in cold storage8 allowing for the second greenhouse harvest (Nov.) to be
extended into December, substituting for Turkish imports which currently arrive in late November.
Furthermore, proper packing, grading and sorting at such a facility will allow boxing of standard
quality and uniform tomatoes. The best quality boxes can go to local supermarkets and export. Last,
truck sourcing at the packing & cooling facility will be more efficient than the current procedure of
going to the village for couple of days and negotiating with and getting certificate of origin for many
different farmers.
Women are the main labor force involved in all the stages of the tomato production process from
planting to manual harvesting and grading, processing and to a lesser extent in greenhouse and
irrigation construction. Although very few, there are examples when a woman is leading a vegetable
marketing coop (such as Ala Novac, from Dubasarii Vechi village, a greenhouse tomato producer
also).
Intermediaries: Before reaching the final consumer, tomatoes go through a set of intermediaries who
act as aggregators or transporters to end markets. Small growers frequently sell their tomatoes at
regional markets directly using their own transportation. Medium-scale growers usually sell their
produce at the farm gate to traders who transport it by minibuses and sell on the wholesale or retail
market. Large growers mostly sell to traders that either sell on wholesale markets or export. There are
some instances when large growers export directly.
7 Protected cultivation of vegetables in Moldova: Census Report, CNFA, 2009
8 http://nhb.gov.in/bulletin_files/vegetable/tomato/tom009.pdf

26
- Traders (mini-bus and truck traders): The largest volume of domestic tomato sales goes
through traders, who operate only on the local market supplying mainly the open air market
channel, but also some supermarkets and small grocery stores. It is estimated that total
number of minibuses used in the season is 250 - 300 units. Traders make sporadic transactions
when they see a market opportunity, and rarely have long-term relationships with particular
farmers. Traders usually have a maximum of 3 days to sell the product. On the fourth day of
trading the risks are very high that the produce will spoil.
- Distribution companies: Distributors usually buy tomatoes from growers and supply
supermarkets and small grocery stores. These companies are performing sorting, grading and
packaging of tomatoes to meet supermarket requirements and usually make a margin of 1 leu
per kilo of packaging. To meet supermarket requirements for steady supply, distributors act as
consolidators of produce from a large number of small producers. The main distribution
companies for fresh vegetables are Speranta LLC and Safran LLC with the second having its
own vegetable production. In addition, there are several distributors of processed tomato
products, such as Le Bridge LLC and Unilever LLC, which distribute the products of the
main processors such as Orhei Vit JSC, Natur Bravo JSC, and Alfa Nistru JSC.
Importers: Imports of fresh tomatoes are performed by companies owned completely by, or in
partnership with, Turkish businessmen located in Moldova. There are about 50 of such importing
companies in Moldova. Some importers sell to distributors, but mainly they supply supermarkets
directly. Some supermarket chains as Metro, Fidesco, and Fourchette also run their own import
activities for fruits and vegetables.
Processors: Processing companies are exporting 90% of their production to Russia, Belarus and
Kazakhstan with the remainder being sold in the local market, including an estimated 2-3 % through
the supermarket chains. The processing industry is represented by three large companies: Orhei-Vit,
Alfa-Nistru, and Natur Bravo that own six processing facilities located in northern, central and
southern parts of the country (Orhei, Soroca, Ungheni, Cupcini, Falesti and Causeni). Orhei Vit
produces juices on a franchise basis for the Sandora brand. Processors are collecting fresh products
directly from the field tomato growers. However, they are experiencing difficulty getting sufficient
supply from growers on a consistent basis therefore competition among processors is increasing.
Processors are trying to develop contract based relationships with farmers, but even in cases when a
contract is signed, processors report that farmers often choose to side-sell if the market price is more
favorable. One of the problems Orhei Vit pointed out was that they had problems with cucumber
deliveries and could not source the necessary amounts for existing export orders.
ACED has begun to investigate more the respective processing schemes, how it really works and how
it could realistically work better since each party has complaints. This learning process will continue
as we work further with the sector, especially as we work with production clusters of open field
vegetables such as Edinet, Orhei, and Ungheni. The processing sector is rapidly becoming more
competitive as processors introduce new technologies to optimize product quality and production
efficiency. Processors are investing in new equipment, more energy efficient equipment, calibrating
lines, and packaging and labeling of the final produce. Today, about 25 small and medium-sized
companies are equipped with the most modern and highly productive equipment. About 10 medium
and large-scale fruit dryers and 3 flash freezing facilities have emerged during the last few years.
Processors interviewed for this study have expressed interest in developing new supply mechanisms
with growers (similar to contract farming) to ensure consistent supply of raw material.
2.3 Vertical and Horizontal Linkages
Analysis of value added

27
To understand the power dynamics within the value chain it is important to analyze the value
distribution. Due to seasonality of tomato production the price of fresh tomatoes varies throughout the
year as is shown in Fig. 9. During the period from mid-November to June 1st, when local tomatoes
are not produced and imported tomatoes arrive in the market, the price is higher (due to import taxes
and transport costs incurred by importers.) In winter the retail price for fresh greenhouse tomatoes can
be as high as 20 MDL/kg and in May around 13 MDL/kg. When local tomatoes are in season, the
average retail price for fresh tomatoes is 6-7 MDL/kg for greenhouse tomatoes and 4-5 MDL/kg for
open field tomatoes.
Figure 9. Variation of tomatoes price on the local market /greenhouse production, 2011/
Source: AGROinform
Since competition in the Moldovan tomato market is high it is not common to have significant
margins at each level of the value chain. On average price margins vary between 0.5 and 1 MDL/kg at
each level and this usually is sufficient for each of the actors to cover their costs and generate profit.
A mini-bus trader would usually receive a margin of 0.5-1.0 MDL/kg minimum in high season. At the
end of the season, starting from beginning of October until the Turkish tomatoes arrive, trader
margins may go up to 1.5-2.0 MDL/kg. Average in-season price margins for local value chain actors
for fresh greenhouse and open field tomatoes are presented in the tables below. The percentage
margin of each cost is deducted from the final price the Consumer is paying.
The analysis per kilo of greenhouse growers shows that growers get the highest margin, retailers the
second highest margin and traders the third. Margin distribution is similar for open field tomatoes
however the grower margin is lower.
The price of the tomato seed is formed as following: X (price in Holland or Germany) + 5-15%
(transportation cost) + 20% (VAT at the customs) + 0.8% (customs procedures) + 20-40% (profit
margin of the seed trader).
Table 8. Case Study for Value Added Price Ladder for Greenhouse tomatoes (sales price 5 lei/kg at
farmergate)
Functions Local greenhouse
Sum of
costs MDL % of final price
Costs &
Margins
GH structure installation 2.62 0.18
0.0
5.0
10.0
15.0
20.0
25.0
30.0
1/6
.1
/13
.1
/20
.1
/27
.2
/3.
2/1
0.
2/1
7.
2/2
4.
3/3
.3
/10
.3
/17
.3
/24
.3
/31
.4
/7.
4/1
4.
4/2
1.
4/2
8.
5/5
.5
/12
.5
/19
.5
/26
.6
/2.
6/9
.6
/16
.6
/23
.6
/30
.7
/7.
7/1
4.
7/2
1.
7/2
7.
8/4
.8
/11
.8
/18
.8
/25
.
Tomatoes min Tomatoes max

28
Soil Prep &Fertilization 0.18 7.89 0.55
Seedlings 0.73 22.1 1.53
Grower costs Inputs (mulch, wires) 2.26 2.86 0.20
Plant care 2.46 6.64 0.46
Fertigation 2.92 1.51 0.11
Harvesting 3.02 4.51 0.31
Pulling off plants 3.34 0.5 0.03
Taxes 3.37 1.28 0.09
Grower margin Farmergate Sale price 5 lei 3.46 22.2 1.54
Trader costs Transport 5.00 2.88 0.20
Access to sale point fee 5.20 0.36 0.03
Trader margin at truck market 5.23 7.21 0.50
Retailers costs & margin 5.73 10.1 0.70
Consumer costs Left, tax of 8% on right 6.43 7.41 0.51
Consumer price with VAT 8% 6.94 100.0 6.94
% is of total sale price to consumer (6.94 lei)
In the table above costs are seen in red and margins in green. This table tells us the breakdown of
costs and margins at each step of the value chain. As can be seen in the table above, greenhouse
growers make a healthy profit margin (more than 44% of costs on the farm level).
Table 9. Case Study Open field tomatoes (sales price 2.5 lei/kg at farmergate)
Functions Local / field
Sum of cost
MDL % of final price
Costs &
Margins
Preparing soil 0.00 4.06 0.21
Grower costs Inputs 0.21 11.60 0.60
Nursing the crop 0.81 6.38 0.33
Taxes/contingencies 1.14 3.29 0.17
Grower margin 1.31 25.80 1.20
Trader costs Transport 2.51 3.48 0.18
Spending /per diem 2.69 0.39 0.02
Trader margin at truck market 2.71 8.65 0.40
Retailers costs & margin 3.11 25.78 1.20
Consumer costs
(VAT shown as cost
8% .34) 4.31 7.41
0.34
Consumer price with VAT 8% 4.65 100.0 4.65
% of final cost to consumer 4.65
The table above shows that for open field, the profit margin is less than for greenhouse growers. The
margins at the wholesale and retail level are the same.
Key variations in margins are determined by the price that traders are able to negotiate with
producers, usually at the farm gates or at the wholesale markets. Because producers depend on traders
for market access, their bargaining power is limited and farmers often sell their produce below the
average market price to get rid of the product and reduce the risk of not being able to sell all of the
produce. As a result, growers often get lower profit margins. Growers of field tomatoes also have an
option of selling to processing companies (with price being the same as what traders would pay for
open field tomatoes - 2.5 MDL/kg). As a rule, farmers prefer to sell to whoever offers the best price

29
on the spot and frequently choose to sell below the market price in order to get cash in hand
immediately.
Vertical linkages
Farmers either sell their produce at the farm gate to mini-bus traders or distributors, or choose to take
their product to either the wholesale or retail market and trade directly. (In case of direct trade on the
market, a farmer would incur an open retail market fee of 80MDL/day). Long-term working
relationships between farmers and intermediaries are not common, and transactions are completely
market based with competition based on price. Producer bargaining power vis-a-vis traders is limited
by the number of traders in the market. This makes competition in the market quite volatile and
unpredictable. Often growers representing themselves in an open air market, having to farm still,
would dump the prices at the day’s end in order just to leave since other business is waiting for them
in their greenhouse. The next day it is quite difficult for them to raise back up the prices because the
customers have already perceived a lower price and would expect it to be low when they will buy the
next time.
Transactions between growers and traders are sporadic with a low cost of switching from producer to
producer. Producers get the same price for their tomatoes regardless of which retail outlet the produce
is ultimately sold at or whether it is sold for processing. Due to high risks, producers frequently sell
their produce below the market price that way also reducing the market price for other farmers. With
limited financial analysis skills growers frequently do not understand the impact of the loss on their
overall profitability and do not see the value in marketing cooperation.
Transfer of market information and requirements to growers is also limited by their lack of direct
contact with the retail market. When farmers trade directly to retail, most of their produce is sold in
the open air markets where quality requirements are low and transactions are informal, so there is no
incentive for them to perform well on quality. For the purposes of selling to supermarkets the growers
are trying to increase their quality, but it is still insufficient, since the businesses they are running are
small and supermarkets need larger volumes. At the same time, lack of capacity to supply consistent
volumes of produce, poor quality and lack of SPS certifications limit producer access to distributors
and traders who supply to higher value retail channels, such as supermarkets, and are interested in
developing longer term relationships with growers to ensure consistency of supply. Some processors
interviewed for this study also seek to establish contract relationships with growers to ensure
consistent supply, but due to poor production practices are unable to source the necessary volumes of
raw material. In addition, due to lack of long-term strategic planning, farmers frequently side-sell and
do not fulfill contracts if they see an immediate cash opportunity, often at a long-term loss for
themselves. Frequently processors provide the required amount of inputs (seeds and fertilizer) to
ensure the needed volume of supply, but due to poor production practices (such as lack of irrigation,
appropriate fertilization, pest management, etc.) farmers are unable to get the yields expected by the
processors.
To increase the flow of learning and benefits to growers, uncertainty and risks for both growers and
traders need to be reduced by making the vertical relationships within the value chain more balanced
and interdependent. For example, permanent working relationships between growers and
intermediaries would result in lower overall price fluctuation for the growers and reduced risks.
Opportunities exist to increase supply to supermarkets, as a channel with a long-term growth
trajectory, through establishing seasonal contracts with distributors who supply supermarkets. Such
arrangements would reduce the frequency of negotiation for growers, limiting market uncertainty and
would ensure a price and a market outlet for a share or all of the harvest. Farmers would limit their
exposure to price fluctuations of the open market, reduce costs of transporting produce to market, and
increase their bargaining power overall. In addition, in the long-term this will increase the flow of
market information to farmers and will create incentives for improved quality.

30
In addition to building relationships with distributors supplying supermarkets, the production season
also needs to be extended to ensure the needed volumes of supply for a longer period. According to
distributors interviewed for this study if local producers could ensure volumes and quality of supply to
supermarkets through early December they would not sign contracts with Turkish importers for that
month. Currently farmers expect payment on the spot and do not understand the profitability of such
business models working with supermarkets (including invoices, paper trails and sometimes post
payment), especially as growers don’t typically have developed cash flows or bank accounts. Farmers
prefer cash believing that they don’t owe anything to the government, which is making their life more
difficult than it already is.
Horizontal linkages
Horizontal farmer collaboration is currently limited by lack of a commercial mentality of growers,
lack of grower cooperation and investment. Joint marketing and other horizontal collaboration among
tomato growers is weak due to lack of overall awareness about the benefits and market opportunities
such cooperation could bring. Generally, farmers do not trust any form of formal association or
cooperative for marketing their products, and as a result the interests of vegetable producers at large
are also not represented. A short term mentality results in low incentives to change and accept the
requirements of new business models, such as post payment terms, which contradict the current
practices of getting cash payment on the spot.
Some positive examples of collaboration exist, however, such as the new marketing cooperative
created by vegetable producers from Dubasarii Vechi village, OgutaProd COOP, and the Vegetalcom
Coop in Balauresti village. OgutaProd COOP was created by 10 vegetable producers from Dubasarii
Vechi village and offers some of services to its members such as training seminars, joint procurement
of fertilizers and pesticides, production of seedlings, and joint product marketing.

31
2.4 Supporting Services and Institutions
Input supply service providers
Seed suppliers: In Moldova, tomato seeds are imported (from France, Holland, Italy, and the Czech
Republic) or obtained locally through a few local seed dealers: Agrofit-Bonus LLC, Vadalex-Agro
LLC, Irrigata CropService LLC, Fructul LLC, Agrodor-Succes LLC, Irrigata Crops Service LLC and
Vadalex Agro LLC. Input suppliers are also providing technical assistance to client farmers through
their consultants in the field and demonstration plots serving as training sites and testing sites for new
varieties. Seed suppliers, provide introductory trainings for their customers and suggested plant
protection plans (such as application of fertilizers and pesticides). The only local seed producer in
Moldova is the Institute of Seed Selection in Tiraspol that specializes in open area seed production.
Testing and registration of new varieties on the local seed market is limited by cumbersome
regulatory procedures which is using the old-soviet algorithm and actually is limiting the
competitiveness of local producers. Basically it is protecting the national food security but in reality
the respective food security pertains only to the wheat varieties and has nothing to do with vegetable
production.
Some tomato producers are buying seeds from un-official suppliers from Russia, Ukraine, Romania
and EU and import them unofficially, at the bottom of travel bags, in pockets. There are some
examples when farmers are producing their own seeds for their own use and for selling in small
quantities to other farmers in the area. For example, a tomato producer from Dubasarii Vechi village
is getting the parent stock from Russia and producing tomatoes of Soyuz 8 F19 variety for the Russian
market. Most local varieties however, are not appropriate for commercial greenhouse production
though they are still used by some of open field producers at a very low extent. Some farmers are still
buying seeds from Tiraspol Institute of Plant Selection through institute’s specialized stores or from
the institute’s former researchers, who have started their own commercial seed production operations.
Seedlings Producers: The largest seedling producers in Moldova are Ecoplantera LLC (Chisinau) and
Fructul LLC (Truseni village). These companies are using advanced technologies and equipment for
seedling production and are signing delivery contracts with farmers well in advance of the growing
period. These companies are using their own seeds for seedling production. In addition, both of the
companies are also offering other input supply services, such as greenhouses, irrigation, and heating
equipment. Sometimes Ecoplantera organizes field days at their production site, demonstrating new
greenhouse equipment. Fructul LLC is less open to disseminating information to the farmers, but is
used by Academy of Science for research on the alternative energy use for greenhouse heating.
Small-scale seedling producers also operate in the main production areas. They produce seedlings for
their own use and are selling the surplus to other farmers in the village. In addition, about 83% of
tomato farmers are producing their own seedlings.
Fertilizers and Chemicals Dealers: There are 17 licensed companies - distributors of fertilizers and
chemicals -- in Moldova: Fertilitate JSC, Fructul LLC, Vadalex – Agro LLC, Bioprotect LLC,
Agrostoc COOP, and others. All fertilizers are imported. In 2009 the value of imported fertilizers was
$13,080,579, most of the import coming from Russia ($8,557,598) and Ukraine ($1,691,354).
Moldova imports approximately 70,000 to 80,000 tons of fertilizer each year. According to major
fertilizer distributors, the real production need is at least 150,000 tons per year. In addition to cost,
many small producers, less commercially oriented, don’t see the value in fertilizer use because they
have great faith in Moldovan soil. In addition, there is lack of information on the proper application
and storage of fertilizers among producers. A few producers are performing soil testing before the
production season and applying the fertilizers without any fertilization plan.
9 Determinant variety, ripening period 102…117 days, yield 5…12 kg/m2, the weight of the fruit – 70…100 gr.
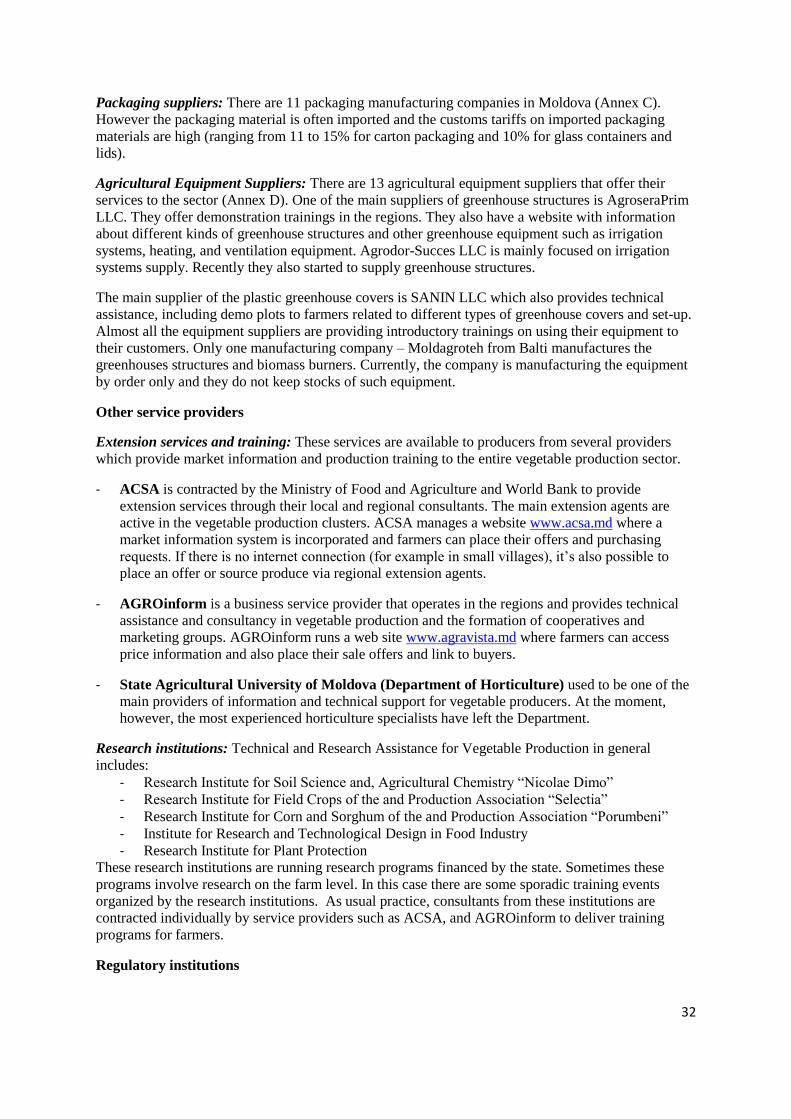
32
Packaging suppliers: There are 11 packaging manufacturing companies in Moldova (Annex C).
However the packaging material is often imported and the customs tariffs on imported packaging
materials are high (ranging from 11 to 15% for carton packaging and 10% for glass containers and
lids).
Agricultural Equipment Suppliers: There are 13 agricultural equipment suppliers that offer their
services to the sector (Annex D). One of the main suppliers of greenhouse structures is AgroseraPrim
LLC. They offer demonstration trainings in the regions. They also have a website with information
about different kinds of greenhouse structures and other greenhouse equipment such as irrigation
systems, heating, and ventilation equipment. Agrodor-Succes LLC is mainly focused on irrigation
systems supply. Recently they also started to supply greenhouse structures.
The main supplier of the plastic greenhouse covers is SANIN LLC which also provides technical
assistance, including demo plots to farmers related to different types of greenhouse covers and set-up.
Almost all the equipment suppliers are providing introductory trainings on using their equipment to
their customers. Only one manufacturing company – Moldagroteh from Balti manufactures the
greenhouses structures and biomass burners. Currently, the company is manufacturing the equipment
by order only and they do not keep stocks of such equipment.
Other service providers
Extension services and training: These services are available to producers from several providers
which provide market information and production training to the entire vegetable production sector.
- ACSA is contracted by the Ministry of Food and Agriculture and World Bank to provide
extension services through their local and regional consultants. The main extension agents are
active in the vegetable production clusters. ACSA manages a website www.acsa.md where a
market information system is incorporated and farmers can place their offers and purchasing
requests. If there is no internet connection (for example in small villages), it’s also possible to
place an offer or source produce via regional extension agents.
- AGROinform is a business service provider that operates in the regions and provides technical
assistance and consultancy in vegetable production and the formation of cooperatives and
marketing groups. AGROinform runs a web site www.agravista.md where farmers can access
price information and also place their sale offers and link to buyers.
- State Agricultural University of Moldova (Department of Horticulture) used to be one of the
main providers of information and technical support for vegetable producers. At the moment,
however, the most experienced horticulture specialists have left the Department.
Research institutions: Technical and Research Assistance for Vegetable Production in general
includes:
- Research Institute for Soil Science and, Agricultural Chemistry “Nicolae Dimo”
- Research Institute for Field Crops of the and Production Association “Selectia”
- Research Institute for Corn and Sorghum of the and Production Association “Porumbeni”
- Institute for Research and Technological Design in Food Industry
- Research Institute for Plant Protection
These research institutions are running research programs financed by the state. Sometimes these
programs involve research on the farm level. In this case there are some sporadic training events
organized by the research institutions. As usual practice, consultants from these institutions are
contracted individually by service providers such as ACSA, and AGROinform to deliver training
programs for farmers.
Regulatory institutions

33
Quality assurance institutions and laboratories: The structure of institutional support for the high-
value agriculture sector in Moldova is developing, albeit slowly. Institutions for Monitoring the
Quality and Safety of Food Products in Moldova include:
- Standardization and Metrology Service of the Republic of Moldova (Chisinau, Balti, Cahul)
- Center for Standardization and Testing the Quality of Canned Products
- National and Practical Center for Preventive Medicine
The Ministry of Agriculture and Food Industry has a legislative and regulatory role in the agriculture
sector. The Department of Marketing Policy and Vegetable Production is a linkage point between the
Ministry and vegetable producers.
The National Farm Federation (FNFM) is mostly lobbying for vegetable growers’ interests and is
less focused on providing technical support for them.
Limited or missing services
Post-harvest handling facilities: As can be seen from the value chain map, the function of the post-
harvest handling in the tomato value chain is missing. No warehousing and pre-cooling/cold storage
facilities or services are provided along the value chain.
Soil testing facilities: There is a shortage of soil testing facilities in Moldova. There are some soil
testing facilities, located in the districts, but most of them are in and around Chisinau, not in the
farming areas where they would more likely be used. As a rule, farmers are not performing soil
testing. Lack of information about the components of the soil is leading to the unbalanced fertilization
program and as result to poor quality of fresh tomatoes. Available soil testing is considered expensive
by farmers - the cost of one soil test is 260 MDL and includes Nitrogen, Phosphorus, Potassium
(NPK), humus, and pH tests. Additionally, for each of the microelement there is an additional cost of
60 MDL/microelement.
Specialized consultants with hands-on experience are in limited supply. There are some production
clusters, e.g. Taxobeni village, where tomato growers do not have access to specialized trainings and
input suppliers are not reaching this territory. As a result, tomato growers in these areas do not use
drip irrigation, enhanced quality plastic greenhouse covers, and high quality seed varieties.
Financial services: According to the Census report of 2008, 90% of the vegetable producers are
using their own finances for new greenhouse construction, 11% are using grants/subsides, and 9% get
bank credit. The low number of loans issued to vegetable growers by banks is explained by high
interest rates for producers and high risk of non-repayment for the banks. The state runs a subsidy
program for the HVA sector annually, including for the greenhouse sector, under which vegetable
growers will be reimbursed 40% of the investment in greenhouse infrastructure, equipment,
greenhouse covers, spunbond and 30% of the investment made in procurement of seedling material
(grown in palettes). The program is difficult for farmers to take advantage of since many tomato
growers are not using invoiced transactions.

34
3. Productivity Analysis
3.1 Production Cost Benchmarking and Analysis
Moldova’s key competitor, especially in the domestic market, is Turkey. In Turkey the total area of
tomato cultivation covers 183,703 hectares and production has reached 10 million tons with the
average yield of 54 tons/ha, which in Moldova the area of tomatoes production is 6,000 ha and
officially reported average yield is 9.5 tons/ha10
. In Turkey 20 % of production is carried out under
greenhouse conditions, while in Moldova the area of greenhouse production constitutes 9% of the
total production area11
. As seen in our productivity section above, Moldovan producers can compete
in productivity in greenhouse yields, however have significantly lower productivity in the case of
open field production.
The table below presents a detailed calculation of greenhouse production cost components based on a
case study (Puhaceni village) in Moldova. Production cost per kg of tomatoes is 3.5 MDL/kg12
($0.3/kg). Financial analysis shows profit margin of 44.5% (in case of sales price 5 MDL/kg at farm
gate). Cost estimates in the table below are based on field interviews by ACED team and include the
following assumptions:
- Prices of inputs are based on 2011 production season.
- Seedlings are produced by the grower. For the first production cycle the cost of the seedling is
5.0 MDL/seedling ($ 0.43/seedling), and for second cycle is 3.5 MDL/seedling ($
0.43/seedling).
- Greenhouse is not heated.
- Film can be used for 4 years and mulch for 3 years.
- Water is from the grower’s well and is not included in the total cost, only the electrical energy
cost for pumping the water is considered.
- Cost components include two production cycles.
- Total volume produced was 7500 kg of fresh tomatoes in I cycle and 4000 kg in II cycle.
- The sale price was 5 MDL per kilo at the farm gate for both of cycles.
10
G. Keshkin, et. al., An Analysis of Tomato Production Cost and Labor Force Productivity in Turkey, 2010 (published in
the Bulgarian Journal of Agriculture Science, 16 (No 6) p692-699.
11 Moldovan National Statistics Department, www.statistics.md, 2010.
12 All the calculations are presented as rate 1$ = 11.5 MDL

35
Table 10. Cost of Production of Greenhouse Tomatoes (S=500m2) in Puhaceni village (2011)
No. Cost component Measure
unit
Units /
500 m2
Unit cost,
MDL
Cycles
I & II %
MDL /
kg
1 Installation of GH Structure 2092.5 5.3% 0.182
Film (using 4 years) m² 1450 5 1812.5
Covering the greenhouse man/day 4 70 280.0
2 Soil Preparation & Fertilization 6300.0 15.8% 0.548
Organic fertilizers kg 5000 0.2 3400.0
Mineral fertilizers kg 200 12 2400.0
Bed preparation lei/100m² 5 50 500.0
3 Seedlings 17600.0 44.2% 1.530
Seedlings (plus seeds) units 2000 5 17000.0
Planting man/day 3 100 600.0
4 Inputs (mulch, wires, irrigation syst.) 2280.0 5.7% 0.198
Mulch (using 3 years) m² 3000 1.2 1200.0
Wire spool 3 50 300.0
Drip irrigation pipes m 390 1 780.0
5 Plant care 5300.0 13.3% 0.461
Plants wiring men/day 3 100 600.0
Mulch installation men/day 2 100 400.0
Taking off the shoots men/7days 12 100 2400.0
Irrigation /till the harvesting/ 6 100 1200.0
Protection 3 50 1200.0
6 Fertigation /during the harvesting/ 1207.6 3.0% 0.105
Irrigation m3 175 0 0.0
Electrical Energy kWh 87.5 1.3 227.6
Fertilization kg 15 26 780.0
Fertilization management men/day 1 100 200.0
7 Harvesting men/days 18 100 3600.0 9.0% 0.313
8 Taking out plants men/days 2 100 400.0 1.0% 0.035
9 Taxes 1020.8 2.6% 0.089
10 Total Production Costs 39800.9 100%
11 Sales fresh tomatoes kg 7500 5 57500.0
12 Net Profit (line 11 – line 10) MDL 17699.2
Profit margin, % 44.5
Sales margin, % 30.8
Net Profit per unit, MDL/kg 1.54
Production cost per unit, MDL/kg 3.46
Several production cost components per kg of tomatoes for Turkey 13
and Moldova 14
are compared in
the table below.
Table 11. Greenhouse labor, production, and yields in Moldova and Turkey
13 G. Keskin. Analysis of tomato production cost and labor force productivity in Turkey. Bulgarian Journal of Agricultural
Science, 2010 and authors calculations.
14 Analysis for Moldova is based on ACED team analysis of 2011 production costs for greenhouse tomatoes in Puhaceni
village, presented in this report.

36
Cost component Moldova15
Turkey16
Share of labor costs in total production costs, % 21,31% 5,65%
Labor cost, $/kg 0,06 0,02
Labor cost, $/ha 14,748 2,439
Total production cost, $/ha 69,219 43,051
Yield, kg/ha 200,000 170,000
Unit selling price (farm-gate), $/kg 0,43 0,36
Unit cost, $/kg 0,30 0,25
Unit cost of greenhouse produced tomatoes ranges from $0.09 to 0.2517
per kg in Turkey18
and is
$0.30 per kg in Moldova. An important cost factor difference between Moldova and Turkey is the
share of production costs spent on labor (21.31% in Moldova vs. 5.65% in Turkey). It is estimated
that the labor cost in Moldova for the 2 cycle greenhouse tomato production accounts for 21% from
the total production cost, and includes soil preparation, fertilization, and harvesting (with harvesting
accounting for 8% of labor costs). In order to increase productivity per worker Greenhouses need to
develop labor skills, re-engineer greenhouse designs for more convenient harvesting, and develop
labor motivation schemes to retain the same workers year on year.
In addition to labor expenditures as a share of total production cost, a significant share of production
cost in Moldova is spent on seedlings (44%) and soil preparation & fertilization (15%).
Minimizing overall production costs by increasing the labor force productivity and increasing yields
(by using the biological potential of the hybrids with proper fertilization, introducing soil testing,
fertigation, enhancing greenhouse design and ventilation, etc.) would increase productivity of the
value chain compared to competitors.
1. High labor expenditure is a result of low labor productivity. For example, as shown in the
table above, Moldovan producers spend 4 times more on labor costs to produce 1kg of
tomatoes, even when the daily cost of labor in two countries is comparable. In Turkey
(Antalya region) the cost of farm labor is $ 8 per day and in Moldova it is $ 6-8.7 per day. In
an interview with ACED team, a large greenhouse grower pointed out that in Hungary a 4.5
ha greenhouse facility employs 16 workers, while at his 2 ha greenhouse facility he employs
20 people, all directly involved in the production process. Low labor productivity is a result of
several factors. These include: lack of skills and adequate training of farm laborers; lack of
continuity in relationships between growers and temporary seasonal workers where workers
do not go back to the same farm season to season; low incentives for better performance and
quality of work; and poor design of greenhouses, such as too narrow construction of
greenhouses which results in lower work productivity per row.
Figure 10. Cost structure for tomatoes greenhouse production, with labor
15 Based on ACED team analysis
16 Same source as footnote 13, authors calculations 17 $1=1,79 YTL 18 G. Keskin, F.F. An Analysis of tomatoes production cost and labor force [productivity in Turkey, Bulgarian Journal of
Agricultural Sciences, 2010

37
Source: ACED Team estimation
2. The high cost of seeds and seedlings is the principal cost driver for greenhouse tomato
production. This category of costs accounts for 41% - 50% of production costs depending on
the variety of seeds. Because tomato seeds are imported about 35 % of the cost is the cost of
import and about 20-40% are margins of the local distributor. Seed distribution companies do
not have fixed prices for the same varieties of seeds. The price depends on the quantity
purchased by the grower. Compared to the labeled retail price, distributors usually offer a 5-
25% discount to groups of farmers purchasing 0.5 – 1.0 kg of seeds depending on many
factors – variety, oversupply, new regional promotion, etc.
3. Soil preparation and fertilization is the third largest cost component, accounting for 15% of
production costs. The high cost is due to the fact that mineral fertilizers are imported. In
addition, farmers do not follow proper procedures for the use of fertilizers as they do not
perform soil testing, which would allow them to develop a more balanced fertilizer program.
Other factors include cost, and a lack of knowlege of the benefits to be realized from properly
utilizing correct amounts. Farmers can either apply more fertilizers than needed or less
fertilizers in inefficient quantities. The fertilizers are applied mostly in soil and farmers are
not using fertigation – application of fertilizer in the irrigation water. In case of fertigation, the
assimilation of the fertilizers by plants is more efficient and the quantity of applied fertilizers
could be reduced.
4. The high cost of energy results in high costs of greenhouse heating, which is considered to
be a major problem by 85% of the vegetables growers in protected area. Energy costs
constitute 60 - 80% of the total production cost of greenhouse vegetables for those that use
heating.19
As a result, 43% of tomato greenhouses are not heated at all, and the rest of the
tomato growers heat greenhouses mainly for temporary crop protection against late spring
frost. Currently, only one exceptional company (Verde Mondial LLC) is using heating to
extend the season. Greenhouse growers are using different sources of energy, but wood is the
predominant one – 38.5%. Opportunities to reduce heating costs include the use of double
layer films for covering the greenhouse, which can reduce the heating costs by over 25%20
,
19 Using of alternative sources of energy for greenhouse vegetable production. Compendium of the Second National Forum
of the Cluster “Producing Vegetables in Protected Spaces” March, 29, 2007 20 Greenhouse sector in Moldova. Report prepared by David Adams, July 2011
Instalation of GH Structure, 9%
Soil Preparation& Fertilization, 15%
Seedlings, 44%
Inputs (mulch, wires, irig.syst.),
7%
Plant care, 11%
Fertigation /during the
harvesting/, 3%
Taxes, 2% Harvesting, 8%

38
and using thermal screens, covering the north walls on the inside with aluminum foil to reflect
light back onto the crop, and use of alternative energy sources.
5. Packaging is mainly used for transporting product to market and currently is not a significant
cost component for growers as they use reusable carton boxes. However, the poor quality
carton boxes used by the producers frequently lose their firmness and collapse as a result of
condensation when tomatoes are transported in lorry trucks without refrigeration
(furthermore, condensation from refrigerated trucks would only increase this phenomenon).
Better packaging is used by distributors and exporters who carry the cost of 1MDL/kg for
styrofoam and plastic crates and 0.8 MDL/kg for wooden crates (Table 11). The following
types of packaging are available and used in Moldova:
Wooden crates - mostly used by exporters for transportation to Belarus and Russia.
Weight of such boxes with the product is 10 kg (crate weight – 1.1 kg)
Carton boxes – used for local transportation of the product on the local market. Weight of
such boxes with the product is 22 kg (box weight - 1.5 kg)
Plastic crates – used for local transportation of the product by minibuses on the local
markets. Weight of such boxes with the product is 8 kg (crate box weight – 0.4 kg)
Styrofoam/plastic crates – used for packaging the product by distributors and
supermarkets and is the most advanced type of packaging currently available.
Table 12. Average cost of different packaging produced in Moldova
Type of package Tomatoes (8 kg Euro standard crate)
Average Price/crate Loadings/truck Cost per kg
Corrugated Fiberboard 0.44 3900 0.088
Wooden crates 0.48 2300 0.06
Plastic crates 0.75 2500 0.093
Source: MIEPO

39
3.2 Constraints to Increasing Production
In addition to high production costs, a number of production level constraints hinder the productivity
of the tomato value chain in Moldova. Extending the production season to compete with imports will
require increased yields in the off-season and increasing productivity. As ACED helps increase
exports, it will be possible to explore additional add-on export deals in the tomato sector as quality
increases. Following is an analysis of key production constraints and opportunities for improvement
in greenhouse production.
- Lack of post-harvest facilities (pre-cooling, cold storage, calibration) results in post-harvest
losses of 10-15% by volume.21
- Poor design of greenhouses (lack of heating, poor ventilation and poor insulation) limits
extension of the production season and reduces potential yields. Greenhouse heating systems
are seldom used by farmers (beyond the occasional use to combat frost) due to high costs of
heating. Using double layers of plastic film would cut the heating costs by 25% compared
with the single layer plastic cover, but would also make it possible to start the season 15-20
days earlier allowing growers to get the product to market earlier in the spring and later in the
fall when the prices are higher. Currently, about 88% of tomatoes are grown in plastic
greenhouses with one layer of film, 24% in plastic greenhouses with double film and about
1% in glass greenhouses. Improving greenhouse ventilation would also help keep plants
cooler during the hot time of the production season and reduce the percentage of aborted
flowers (lost yield).
- Improving performance of planted varieties is needed to reach the full performance
potential of planted varieties. Farmers are unfamiliar with the varieties they plant and how
they perform and sometimes fail to achieve the full production potential of the variety. All of
the varieties produced by tomato growers are underperforming. Based on the interviews with
farmers the average estimated yield per hectare could reach 150 - 200 tons. However, as
shown in the table below, the performance potential of the varieties is higher.
Table 13. Characteristics of some tomatoes seeds varieties planted in Moldova
Producer Hybrids / Local dealer Cost per seed,
lei/seeds
Production potential in
protected area, kg/m2
Agrofit-Bonus LLC
Clause Cristal F1 0,28 30…35
Bejo Tolstoi F1 0,25 27…30
Clause Fantazio F122
0,8 30…32
Vadalex-Agro LLC
Syngenta Izmir F1 1,64 32…35
Syngenta Ivet F1 1,64 15…18
Irigata-Crop Service
LLC
Rijk Zwaan Abellus F1 1,7 30
Rijk Zwaan Lilos F1 1,7 28…30
Rijk Zwaan Beril F1 1,7 30…32
Source: Information provided by seed dealers Agrofit-Bonus LLC, Vadalex-Agro
LLC, Irigata-Crop Service LLC
21 Greenhouse Sector Action Plan for Azerbaijan, USAID, May 2009 22 Fantazio F1 is not yet included in the State Register of Plants Varieties 2011, but farmers are producing it since 2009.

40
Some of the varieties of tomatoes that are planted in Moldova include: Cristal F1, Tolstoi F1, Fantazio
F1, Izmir F1, Ivet F1, Abellus F1, Lilos F1, Beril F1 and widely used for protected area. The survey
conducted by ACED training team, has shown that the most preferred hybrids of tomatoes produced
at the moment by farmers are in descending order: Tolstoy F1, Lilos F1, Cristal F1. In the future,
producers would prefer to plant Tolstoy F1, Magnus F1 and Abelius F1. If the producers want to
reach new or specific markets, they will need to take this into account when choosing varieties. For
example, Cristal F1 is preferred by local consumers but has poor shelf life and transportability and
therefore would not fare well in export markets. Another consideration that should be taken into
account at production planning is considering a harvesting schedule so that not all tomatoes ripen at
exactly the same time.
Figure 11. Some of the varieties of tomatoes that are planted in Moldova
Cristal F1 Tolstoi F1 Izmir F1
The main reasons of underperformance of planted varieties in greenhouses are the following:
Poor quality of water used for irrigation (high salinity).
High level of soil pH (in Moldova the pH is alkaline – higher than 7). For tomatoes the
optimal level of pH = 6.7.
Rare soil testing and poor fertilization (lack of macro- and microelements in the soil).
Those famers who are using organic fertilizers and preparing the compost to be applied
during the inter-cycle period sometimes use poor quality compost that is a source of infection
for soil and plants.
Limited use and improper application of fertilizers. Lack of use of water-soluble fertilizers.
Not ensuring the right temperature of soil at the beginning of the production period which
leads to shortening the production period.
Poor ventilation of the greenhouse leads to excessively high temperatures during July- August
which causes poor flowering and decreased yields.
Fluctuation in temperature levels between night and day temperatures at the beginning of the
production season (early spring) and at the end of the production season (late fall) lead to
infection of plants.
Limited use of pollination and ripening stimulators.
For open field tomatoes, the following opportunities for production improvement exist:
Improved irrigation that would more than double the yields.

41
Intensive production technologies using mesh wiring and poles.
Use of planting machines.
Better fertilization use and pesticide application.
Better variety selection. Variety selection for open field will be better attuned to the needs of
processing companies.
Introducing irrigation use.

42
4. Systemic Constraints Within the
Value Chain Chapter II of this report includes a detailed analysis and prioritization of value chain constraints as
they pertain to its ability to meet end-market requirements. Overall, several systemic issues limit
value chain competitiveness and access to higher value and more profitable markets. These are:
Inability for meet market requirements for quality
- Limited shelf life as a result of lack of post-harvesting capacities (pre-cooling, cold storage,
refrigerated transport). Planting the right varieties (for example, varieties with more firmness)
would also extend the product shelf life.
- Poor visual uniformity of product (tomatoes of different sizes are mixed together) as result of
lack of grading lines and calibration. Basic sorting and grading are done manually – if at all.
- High incidence of visible defects due to unbalanced fertilization and pesticide use which
results in poor quality of fresh tomatoes (green middle, cracked).
- Poor compliance with SPS standards as a result of improper use (doses, timing, safety) of
pesticides, insecticides, fertilizers, and stimulators. Lack of recordkeeping on timing of
sprays, so that the after-spray period does not overlap with the market delivery day leaving
chemical residuals on the fruit.
- Failure to market cooperatively and recognize market standards among small grower
operations leads to disparate quality of fresh tomatoes and lack of uniformity of varieties
supplied to end markets.
Inability to supply sufficient volumes and low productivity:
In addition to the production constraints discussed earlier:
- Limited access to finance and lack of affordable credit result in limited investment in
technologies that would increase production such as cooling equipment for pre-cooling and
cold storage and improvements to greenhouse design.
- Lack of harvest planning results in growers harvesting at the same time and inability to
harvest for an extended period of time in order to supply required volumes on a consistent
basis. Also, need to plant new varieties that would support longer harvesting seasons.
- Lack of long-term strategic planning limits farmer buy in into trying new business models and
cooperative marketing arrangements that would allow for collective access to higher value
markets.
- Business enabling environment constraints resulting in high production costs (see table below
for a detailed analysis of business enabling environment constraints).

43
Other constraints include the following environmental and health related concerns:
- Limited use of crop rotation.
- Growers are not following instructions regarding the safe use of pesticides and insecticides
and are not using proper methods and facilities for storing the pesticides and insecticides.
- Growers have limited knowledge about effective crop protection.

44
4.1 Business Enabling Environment Constraints
BEE issue/constraint What does it mean for the
businesses Root of the problem/what needs to change
HVA in general/all value chains
Inadequate access to seeds and seedlings Low productivity, high cost
on inputs
Cumbersome procedures for testing and registration of new seed varieties.
Need to adopt the European Catalogue for plant varieties
The State Commission for Testing of Plant Varieties, under MAFI,
supervised by the 13-member State Council for Varieties is responsible
for testing and registering procedure.
The Commission is acting according to the internal regulation and is
focusing on “strategic varieties.” The typical testing period is two (for
vegetables) to three years. Sometimes, if the variety is included in the EU
register, the testing may be accelerated, to be completed within one year.
For fruits and grapes the testing period is four years (from date of
plantation) for varieties registered in EU and three years (bearing period)
for national varieties The law allows for non-commercial cultivation (on
< 5 ha) of varieties during the testing period.
Rising cost of fuel High cost of doing business
for producer and distributors.
This is an impact of local fuel market based on international one.
Unfortunately, almost each year diesel price is increasing before
agricultural producers starts new agriculture period (autumn and spring)
Moldova imports almost all of the fertilizers and
chemicals used in agriculture. According to a
fertilizer dealer, the country imports about 80-85
th. tons of fertilizer annually. This, however, is
only one-third to one-half of the actual amount
needed.
The fertilizer and pesticides price is very high.
Low productivity, high cost
on inputs Need to register automatically the phytosanitary products registered
in EU and to simplify the registration process of the new
phytosanitary products that comes from SIS countries.
The introduction of new phytosanitary products (or mixes) is subject to a
testing requirement, handled by the Commission for Testing and
Homologation. The testing period is one year for fertilizer and two years
for pesticides.
The registration cost is not so high, but the dealers are not so interesting

45
to register some phitosanitary products because of lack of market
According to the National Plan for harmonization of legislation for 2011,
the Law nr 119 from 2004 “Phitosanitary products” have to be reviewed.
Low quality of seeds and fertilizers offered on the
Moldovan market.
Low productivity, Large
amount of low quality
products on the market.
Need to increase the capacities of seed laboratory testing and to
diminish the corruption.
Local producers/multipliers sell the best seeds abroad because of good
price, and serve the local market only with poorer elements. In the same
time, very often, the seed from import are not of the same size and
germination, and problem is because of weak laboratory testing
Difficulty meeting International Standards and
Norms due to lack of quality standards compliant
with global market requirement. A part of current
Moldovan national standards are based on the old
GOST system and are not closely harmonized
with requirements established by the European
Union.
Need to reform legal, regulatory, and institutional framework for
food safety and phitosanitary standards.
Technical regulation “Quality requirements for trade with fruit and
vegetables ” has been approved on January 2010, but will enter into force
on January 1, 2012
With respect to technical regulations and standards, the EU has adopted
the „mutual recognition principle“. Goods legally marketed in one
member state must be accepted in any other. Furthermore, the EU’s
„Global approach“ supports mutual recognition of Conformity
Assessment Bodies and their results as part of economic integration
agreements. This means that (i) Moldovan standards should be
harmonized with European standards and (ii) the recognition of Moldovan
conformity certificates by the EU should be ensured. In
this case, EU products will be able to freely enter Moldovan market (as
the EU standards
and conformity assessments will be recognized by Moldova), while
Moldovan products produced under the same EU standards and certified
as conforming to the EU rules will be able to access the EU market.
So far Moldova has implemented about 45 (15 standards in 2010) EU
standards out of approximately 200.

46
According to the National Plan for harmonization of legislation for 2011,
there are about 21 legal acts that are going to be harmonized, including 4
related to HVA
It is clear that the complete modernization of Moldova’s technical
standards, which are often still based on the former Soviet GOS-
STANARD norms, will be technically demanding and time-consuming.
Poor laboratory capacity for chemical testing,
which includes pesticide residues, heavy metals,
and mycotoxins (aflatoxin). The ability to test
agricultural products for chemicals, pathogens,
pests, weeds and disease is a key component of a
phytosanitary control system.
Consumer health and market
access issue in higher value
markets.
Need to increase the laboratory capacity for products testing and
certifications
Lack of modern laboratory equipment and lack of staff capacity to
perform testing requirements. Often, certificates are issued without any
products testing.
Delay of payments for subsidies offered for
orchards, table grapes plantations and equipment
for green houses, and irrigation systems.
Lack of investments The main issue is luck of budget. Because of that, the subsidy regulation,
developed by MAFI, is enough bureaucratic with a lot of constrains, and
in this case difficult for small and medium size agriculture producers to
access subsidy. Agency for Paying and Intervention for Agriculture is the
institution responsible for implementation of the subsidy regulation and
administration of subsidy fund.
There are a total of 8 border inspection points as
well as a series of internal inspection and custom
points within Moldova. There are no inspection
points along the border with Transnistria yet
products from this region receive phytosanitary
certificates issued by the Government of Moldova
for export to EU and other countries.
A part of enterprises
developed on the
Transnistria territory are
registered to the Chamber of
registration of the RM. They
produce in Transnistria and
get phitosanitary certificates
in Moldova without any
control of the concrete
condition of production.
Sometimes the certification
is nontransparent and very
dubious.
It is a political issue with a lot of questions.
World Bank’s 2011 “Doing Business” survey, Documents for export
(number): 6
The number of documents needed for HVA export have to be reviewed
and reduced – that could influence the time and cost of export.

47
where Moldova ranked 141th (135th in 2008) on
the indicator “Trading Across Borders”.
Time for export (days): 32
Cost to export (US$ per
container): 1775
Logistical problems (accessing suppliers, orienting
suppliers to market demand for fruits and
vegetables, and weak institutional structure —lack
of strong logistical centers and market information
dissemination among producers.
This is more an institutional
structure problem than a
regulatory constrains
The MAFI does not have a strong market information center for
producers/procesors and exporters
Annually, ministry of Agriculture and Food
Industry creates/updates a list of exporters of fruits
and vegetables to Russian Federation.
This list is not totally
transparent and doesn’t have
clear criteria for eligible
exporters that are included in
this list.
Criteria for being added to the list of exporters to Russia, issue of
quality control.
High cost of the packaging material (often
imported). Customs tariffs on imported packaging
materials ranging from 11 to 15 percent for carton
packages and 10 percent for glass containers and
lids.
This is a significant
constrain for all HVA
products that are packed and
exported.
Need to revise the Custom Tariff and reduce tariffs on imported
packaging materials and package.
Customs duty on imported packaging materials (increased cost,
constraints to export),
Agricultural land and forestland may not be sold
to foreign individuals and legal entities, nor to
resident legal entities with foreign capital. Foreign
individuals who became owners of agricultural
land and forestland by inheritance may dispose of
such land through legal acts coming into force
during their lives only to Moldovan citizens.
Constraint to foreign
investment. Need to revise the Land Code
Land and plantation are not accepted as collateral. Limited access to finance for
producers.
Official land and plantation are accepted as collateral, but the risks are too
high, that’s why banks are reluctant to accept it as collateral. Currently,
banks (Agroindbank, Banca de Economii) declared almost 2000 ha of
land and plantation for forced sale.
Issues specific to Tomato Value Chain
Informality, lack of invoiced transactions to avoid If farmers want to sell to It is a food safety issue. If supermarkets have to ensure food safety they

48
tax payments. There are 3 major taxes they are
obliged to pay – Income Tax (which is 0% till end
of 2011), Land Tax (%), - depends of quality of
soil. Social Insurance Tax (23.5%). At the end of
the day it makes up 2 to 4 percent of the total
spending in a tomato production depending on the
range of the farm. Also producers don’t want to
incur an extra cost of hiring an accountant.
supermarkets they have to
offer certificates and
invoices.
have to require quality certificates and agriculture producers have to offer
it regardless farm size or legal form.
This is an issue of farm cooperation and association – that will diminish
the cost of certificates and maintenance of accounting system.
The cost of heating is considered a major problem
by 85% of the vegetables growers.
It is not a regulatory issue. Need to use alternative source of heating and implement energy
saving practices.

49
Chapter 2: Upgrading Needs and
Opportunities
Strategy
Upgrading needs of the value chain are determined by market opportunities and overall market
positioning strategy of the value chain. The following market opportunities have been identified for
Moldovan producers.
- Domestic market import substitution focusing on the local supermarkets channel by
extending the production season,
- Building reputation in the export markets by increasing the quality sold to the wholesale
market segment and become a supplier to distributors in export markets supplying
supermarkets,
- Building reliable relationships with domestic processing companies in order to have
diversified channels in case of open field tomatoes production.
Upgrading needs
Upgrading within the value chain should be driven by the requirements of targeted market segments
in end markets and focused on addressing systemic constraints within the value chain that prevent the
industry from meeting the critical requirements of these markets. The analysis below is focused on
critical success factors in each of the targeted market segments (processing, local supermarkets,
export markets) improvements required and constraints that need to be addressed.

50
Table 14. Market requirements and upgrading needs of Tomato VC
Market
segment
Critical success
factors/market
requirements
Improvement needed Constraints to achieving these
improvements
Lo
cal
Su
per
ma
rket
s
- Long shelf life (at least 1
week) from the delivery
time
- Choosing the right hybrid and
timing of harvesting
- Planting varieties with high
firmness
- Pre-cooling
- Expensive hybrids
- Lack of knowledge about
appropriate varieties
- Lack of pre-cooling facilities
- Supplier capacity to offer
supply over extended
period
- Cultivating hybrids with
different ripening periods
- Diversifying the cultivars/other
vegetablesImproved greenhouse
heating and insulation practices
- Increase producer awareness that
such business model is profitable
- Lack of technical background for
new varieties
- High cost of greenhouse heating
- Seasonal contract
- More frequent negotiation of
prices in different supply periods
that can better reflect the current
market situation to limit risk
- Price fluctuations on open markets
- Low bargaining power of growers
- Consistent supply
- Need for a central warehouse to
enable pre-cooling and very
short term storage
- Better production planning and
harvest schedule
- Comparatively high cost of cooling
equipment
- Lack of collective support for this
business model from the grower
community
- Limited production planning and
harvest scheduling
- Invoiced transactions - Better official accounting and
record keeping
- Lack of knowledge in bookkeeping
- Lack of willingness to pay taxes
- Ability to access post
payment terms
- Growers need to accept the terms
where they are not paid in cash
on the spot
- Limited cash flow of producers
- Lack of financial planning
- Supermarkets need to
deal with a small number
of suppliers
- Need to identify a few suppliers
with adequate supply capacity or
joint marketing efforts of small
producers
- Inconsistency of produce in the
given period
- Suppliers need to have
Quality Certifications
- Farmers need to obtain
certificates for their production
- Need to reinforce phyto-sanitary
inspections in the open air
market
- Lack of information about
certification
- Additional payment needed for
certification
- Lack of knowledge about keeping
records on fertilizers and pesticides
used
- Limited local/ regional
Phytosanitary inspection and
testing capacity

51
Market
segment
Critical success
factors/market
requirements
Improvement needed Constraints to achieving these
improvements
Pro
cess
ing
co
mp
an
ies
- Ensured delivery of
contracted volumes of
tomatoes
For growers:
- Intensive production technology
using mesh and poles
- Development of supply
projections
For processors:
- Identify dependable suppliers
providing volumes on the
sustained basis
- Find out % contracted versus
open market
- Labor ‘gangs’ to help in picking
season
For growers:
- Lack of Irrigation
- High costs of inputs, fertilizers,
planting machines
- Limited labor pool for the season
For processors:
- Supplier unwillingness to supply
raw material when the open
markets have higher prices.
- Guaranteed quality of
supply (tomatoes for juice
or stewed tomatoes)
For growers:
- Following the technological
requirements
For processors:
- Identify dependable suppliers
providing required products
needed for different specs.
Provide T.A. and
supervision/crop monitoring
For growers:
- Lack of specific skills pertaining to
a certain tomato variety
- Lack of Irrigation,
- Limited labor pool
For processors:
- Lack of open/established
relationships with growers who can
honor the supply contracts as
agreed
- Reasonable cost for raw
supply
For growers:
- Understanding the Adequate
pricing for raw supply
For processors:
- Proper cost analysis to determine
% contracted versus open market
For growers:
- Lack of economic analysis and
unwillingness to understand the
benefits of the business model
- High production costs
For processors:
- Unpredictability of the open
market of tomatoes

52
Market
segment
Critical success
factors/market
requirements
Improvement needed Constraints to achieving these
improvements E
xp
ort
Ma
rket
s
Op
en a
ir - Extended shelf life of
product
- Uniformity of product
- Grower consolidator in
production area
- Use of cold chain (from
pre-cooling to truck
delivering product)
- Use of appropriate hybrids
- Use of calibration machine
- Customized packaging
- High investment cost for pre-cooling
and packaging
- Lack of knowledge about “extended
shelf live” varieties
- Lack of uniform quality from divided
production community
- Lack of understanding among farmers
about the required quality and
quantity
Ex
po
rt M
ark
ets
rket
s
- Extended shelf life of
product
- Availability of right
varieties
- Packaging
- Supplier ability to accept
post payment terms
- Ability to offer consistent
delivery
- Detailed knowledge about
supermarket requirements
in different end markets
- Use of required hybrids
- Introduction of new
products into the market
- Lack of knowledge about “extended
shelf live” varieties
- Lack of uniformity of delivered
tomatoes
- High / unaffordable cost of modern
packaging
- Attract even more customers to
loyally buy Moldovan produce which
is tastier and brings incomes to the
pockets of the local farmer

53
Annex A. Cumulative Imports of
Processed Tomatoes from
Moldova, as Reported by Key
Markets
Belarus Imports
World Moldova Moldova’s
share
value kg value kg value kg
2005 $8,127,000 13,678,313 $97,200 149,258 1.2% 1.1%
2006 $11,201,300 16,365,616 $60,400 76,023 0.5% 0.5%
2007 $12,116,000 13,731,890 $41,200 58,405 0.3% 0.4%
2008 $20,671,900 16,867,659 $116,700 84,406 0.6% 0.5%
2009 $22,041,800 16,151,356 $71,600 50,380 0.3% 0.3%
2010 $20,621,400 18,326,512 $13,000 7,703 0.1% 0.0%
Russia Imports
World Moldova Moldova’s
share
value kg value kg value kg
2005 $285,782,895 532,697,484 $197,496 455,957 0.1% 0.1%
2006 $401,303,471 604,960,794 $32,303 88,992 0.0% 0.0%
2007 $646,181,391 744,823,586 $176,721 260,516 0.0% 0.0%
2008 $762,269,889 869,990,538 $427,921 847,429 0.1% 0.1%
2009 $778,899,326 882,718,419 $644,990 1,130,395 0.1% 0.1%
2010 $913,151,150 879,122,693 $596,260 823,317 0.1% 0.1%
Romania Imports
World Moldova Moldova’s
share
value kg value kg value kg
2005 $5,609,742 12,116,502 $201,731 334,700 3.6% 2.8%
2006 $7,126,057 14,361,869 $123,765 208,799 1.7% 1.5%
2007 $13,890,161 23,250,789 $242,059 303,673 1.7% 1.3%
2008 $17,690,140 23,433,721 $42,266 68,503 0.2% 0.3%
2009 $22,579,764 29,788,658 $27,237 38,546 0.1% 0.1%
2010 $18,799,060 28,703,037 $44,154 40,830 0.2% 0.1%

54
Annex B.1. List of Cities Within a
Proximity of 2000 km Around
Chisinau
Cities in the range
Distance
Cities in the range
Distance
bird
flight road
bird
flight road
Romania - Iasi 96 160 Latvia - Riga 1146 1654
Ukraine - Odesa 158 177 Russia - Moscow 1148 1380
Romania – Târgu Mureş 330 587 Czech Republic - Plzen 1183 1623
Romania - Bucharest 357 429 Austria - Salzburg 1192 1575
Romania - Cluj-Napoca 400 610 Poland - Szczecin 1242 1598
Bulgaria - Varna 428 703 Germany - Berlin - Berlin 1271 1584
Bulgaria - Burgas 512 773 Russia - Vladimir 1290 1567
Bulgaria - Sofia 644 819 Russia - Novgorod 1291 1663
Hungary - Budapest 727 1031 Germany - Munich 1301 1681
Poland - Kraków 740 984 Estonia - Tallinn 1410 1947
Belarus - Minsk 768 1081 Russia - Saint-Petersburg 1441 1744
Russia - Bryansk 803 1027
Russia - Nizhny
Novgorod 1470 1801
Poland - Warsaw 812 1015 Denmark - Copenhagen 1485 2017
Czech Republic - Ostrava 841 1153 Finland - Helsinki 1488 2033
Poland - Lódz 864 1116 Germany - Hamburg 1521 1868
B-Herzegovina - Sarajevo 884 1412 Germany - Frankfurt 1530 1964
Lithuania - Vilnius 888 1442 Switzerland - Zurich 1535 2024
Slovakia - Bratislava 890 1225 Sweden - Stockholm 1545 1951
Montenegro - Podgorica 897 1173 Switzerland - Basel 1603 2104
B-Herzegovina - Banja Luka 936 1542 Switzerland - Bern 1623 2144
Czech Republic - Brno 941 1329 Russia - Cheboksary 1624 2043
Lithuania - Kaunas 944 1350 Germany - Düsseldorf 1670 2085
Austria - Vienna 946 1268 Russia - Samara 1671 2433
Albania - Tirana 957 1348 Switzerland - Lausanne 1690 2247
Poland - Wroclaw 975 1257 Russia - Kazan 1708 2195
Russia - Lipetsk 991 1423 France - Nice 1724 2285
Croatia - Zagreb 997 1366 Switzerland - Geneva 1740 2297
Russia - Tula 1012 1528 Belgium - Brussels 1835 2283
Russia - Kaliningrad 1038 1365 Netherlands - Rotterdam 1838 2240
Poland - Poznan 1050 1332 Norway - Oslo 1861 2565
Poland - Gdansk 1089 1356 France - Paris 1981 2527
Slovenia - Ljubljana 1102 1483 Russia - Ufa 2078
Czech Republic - Prague 1116 1536 Russia - Perm 2200
Russia - Ryazan 1143 1566

55
Annex B.2. Pan-European
Transport Corridor IX
Source: Chisinau Wholesale Market Pre-Feasibility Study, Studiocom Italia for the Government of
Moldova, Prepared by Ermes Bampa and Dario Caccamisi, Chisinau, 2010

56
Annex C. List of Packaging
Producers
Name of the company, Address # Phone, Fax Web sites
COMBINATUL DE ARTICOLE DIN
CARTON JSC
MD-2023, Chisinau, str.Transnistria, 16
(373-22) fax:472554, tel:470528,
471621, 472544 http://www.kki.md/
CARD BOX PRODUCTION LLC
MD-2028,Chisinau, str.Pietrarilor, 2,et.2, 22
(373-22) fax: 208423, tel: 208424,
208426, 208427
CONVEL-IMPEX LLC
MD-2002, Chisinau, sos.Muncesti, 290-A
(373-22) fax: 503219, tel: 571896,
mob: (+69) 128875
DAVAS-NUCAR LLC
MD-2023, Chisinau, str.Otovasca, 19 (373-22) tel/fax: 477259, 421376
DUNAPACK RAMBOX PRODIMPEX LLC,
MD-2004, Chisinau, bd.Stefan cel Mare, 200,
111
(373-22) tel/fax: 592370, tel:
753696 http://www.dunapack.ro/
HORN LLC,
MD-2023, Chisinau, str.Transnistria, 16
(373-22) fax: 472517, tel: 472553,
472544
MOLDCARTON S.A.,
MD-2086, Chisinau, s.Dobrogea, str.Decebal,
15
(373-22) tel/fax: 258131, 258135,
tel: 258921
TRONCO-SVOB LLC
MD-2005, Chisinau, str.Feredeului, 4 (373-22) tel/fax: 279249
AVANGARD LLC
MD-2008, Chisinau, str.Ioana Radu, 24, 57 (373-22) fax: 745901, tel: 237550
RUBIPLAST-COM LLC
MD-2071, Chisinau, str.Alba-Iulia, 75
(373-22) tel/fax: 589191, tel:
747867, 589252

57
Annex D. List of Equipment
Suppliers N/o Company Phone Fax e-mail, site Equipment
1 AGRproFLORA
LLC
272658,
079509468
744664 Greenhouses
2 TRANSTENT LLC 525552,
069149440
493028 [email protected] Greenhouses
3 VEGSEM - COM
LLC, SEMILEG LLC
272205,211319 ,
069102623
211319 Greenhouses
4 MOLDAGROTEHNI
CA JSC
231 -20102,
069135460
(231)
43665
p_frunza@moldagrotehn
ica.md
Greenhouses
5 AGROSERA - PRIM
LLC
29-65-09,
068019993
Greenhouses
6 CMF GROUPE LLC 069694329 andreibuga1980@yahoo.
fr
Greenhouses
7 SV LANA LLC 286564,
069290852
[email protected] Greenhouses
8 ECOPLANTERA
LLC
278464, 548495,
069192236,
069099144
278464, radulisiiecoplantera@tm
g.md
Greenhouses
9 SANIN LLC 407620 411167 [email protected] Plastic covers
10 VESARTIS LLC 472788,
069278349
476384 Low tunels
12 AIK LLC 069368586 Greenhouses
13 AGROFIT-BONUS
LLC
373 22 27-97-36 Greenhouses