Embed Size (px)
Citation preview

MOLDOVA IN FIGURES
National Bureau of Statistics of the Republic of Moldova
Statistical pocket-book
2018


National Bureau of Statistics of the Republic of Moldova
2018
Chisinau, 2018
MOLDOVA IN FIGURESStatistical pocket-book
EDITORIAL BOARD
Vitalie Valcov – President of Editorial Board
Ala Negruţa, Iurie Mocanu, Lilia Racu, Maria Godiac
© National Bureau of Statistics of the Republic of Moldova, 2018

Foreword
3MOLDOVA IN FIGURESStatistical pocket-book 2018
FOREWORD
The publication comprises a short information about the socio- economic and demographic situation of the country in 2017 in comparison with the previous years.
The information is presented without data on the enterprises and organisations from the left part of the river Nistru and municipality Bender, except the cases mentioned in particular, where the indicators were presented in total for the country.
Data on natural movement and migration of the population include some cases of registration of inhabitants from the left part of the river Nistru and mun. Bender.
Data for 2016, for some indicators, are precised in comparison with data published earlier. Data for 2017, for a series of indicators, are preliminary and can be rectified in the next issues.
More detailed statistical information will be published in the Statistical Yearbook of the Republic of Moldova and in other official statistical issues of the National Bureau of Statistics.
Symbols used
– not applicable ... data not available 0,0 negligible magnitude
In some cases, there may occur insignificant discrepancies between the totals and corresponding sums of the components, fact that could be explained by data approximation.

Contents
4 MOLDOVA IN FIGURESStatistical pocket-book 2018
CONTENTS
Foreword ������������������������������������������������������������������������������ 3
Key features ������������������������������������������������������������������������� 5
Population ���������������������������������������������������������������������������� 9
Labour force ����������������������������������������������������������������������� 19
Population incomes and expenditures ��������������������������� 25
Prices ���������������������������������������������������������������������������������� 33
Dwellings ���������������������������������������������������������������������������� 37
Education and Science ������������������������������������������������������ 39
Health protection �������������������������������������������������������������� 43
Culture and Sport �������������������������������������������������������������� 47
Tourism ������������������������������������������������������������������������������� 51
Crime ���������������������������������������������������������������������������������� 55
Gross domestic product ���������������������������������������������������� 59
Industry ������������������������������������������������������������������������������ 65
Agriculture ������������������������������������������������������������������������� 69
Investments in long term tangible assets and construction ����������������������������������������������������������������������� 75
Transport and communications ��������������������������������������� 81
External trade �������������������������������������������������������������������� 87
Trade and market services ����������������������������������������������� 93
Finance ������������������������������������������������������������������������������� 95

Key features

Key features*
6 MOLDOVA IN FIGURESStatistical pocket-book 2018
Geographic situation of the Republic of Moldova
Extrem point (locality) Region Northern
latitudeEastern
longitude1
North Naslavcea Ocniţa 48°29΄ 27°35΄
South Giurgiuleşti Cahul 45°28΄ 28°12΄
East Palanca Ştefan Vodă 46°24΄ 30°09΄
West Criva Briceni 48°16΄ 26°37΄
1 According Greenwich
• Moldova lies on the South-Eastern part of Europe. At North, East and South it is neighboring with Ukraine, at West – with Romania. The area is equal to 33,8 thou. km2. From North to South it has 339 km, while from West to East – 155 km.1
• Resident population of the Republic of Moldova as of 01.01.2018 was 3547,52 thousand of persons. Population density as of 01.01.2018 – 117,0 inhabitants per 1 km2.
• The capital of the Republic of Moldova is Chisinau (825,92 thou. persons, resident population as of 01.01.2018), is divided into 5 administrative sectors: Botanica, Buiucani, Centru, Ciocana and Râşcani.
• The following types of relief exist on the territory of Moldova: plains, plateaus, hills, valleys and canyons. Influenced by relief and climate factors, the 2 types of flora are predominant: forest and steppe. In the decidouous forests there are oaks, beeches, elms and hornbeams. The steppe flora can be seen only on separate territories and fragments with steppe elements.
Major rivers
Name of the river Length of the river1, km Area of the basin1, km2
Nistru 657 19 070
Prut 695 7 990
Răut 286 7 760
1 On the territory of the Republic of Moldova
* In total for the country 2 Population number and demographic indicators for 2014-2017 will be recalculated based
on the 2014 Population and Housing Census data

Key features*
7MOLDOVA IN FIGURESStatistical pocket-book 2018
Major natural lakes
Name of the lake Region Area of the lake, km2
Beleu Cahul 9,5Dracele Cahul 2,7Nistru Vechi Slobozia 1,9Rotunda Cahul 2,1Sălaş Anenii Noi 3,7
Air temperature, in 2017Celsius degrees
Meteorological station
Annual average
Annual absolute maximum
Annual absolute minimum
Briceni 9,8 36,0 -19,2Chişinău 11,2 37,4 -16,6Cahul 11,5 37,6 -15,2
Precipitations, in 2017
Meteorological station
Annual quantity of
precipitations, mm
Number of days with 0,1 mm precipitations
and over
Relative air humidity, %
Briceni 578 138 72Chişinău 635 100 66Cahul 574 98 74
Wind speed, duration of daylight, in 2017
Meteorological station
Annual average wind speed, m/s
Duration of daylight, hours
Briceni 2,3 2 143Chişinău 2,9 2 333Cahul 3,1 2 426
Scientific reservations
Name of the reservation Region Area, ha Year of
foundationCodrii Străşeni 5 177 1971Iagorlîc Dubăsari 836 1988Pădurea Domnească Glodeni 6 032 1993Plaiul Fagului Ungheni 5 642 1992Prutul de Jos Cahul 1 691 1991

Key features*
8 MOLDOVA IN FIGURESStatistical pocket-book 2018
Administrative-territorial division of the Republic of Moldova, as of January 1, 2018
Regions 32
Municipalities 13
Cities 53
within municipalities 6
Localities within cities (municipalities) 41
Villages (communes) 916
Localities within communes (except residence villages) 659
Total localities 1 682
Autonomous-territorial units 1
Administrative-territorial units from the left part of the river Nistru, to which special forms and conditions of autonomy can be assigned 1

Population

Population
10 MOLDOVA IN FIGURESStatistical pocket-book 2018
Resident population1, as of January 1 thousand persons
2015 2016 2017 2018
Total population 3 555,2 3 553,1 3 550,9 3 547,5By sex:
Men 1 710,3 1 709,1 1 707,4 1 705,3Women 1 844,9 1 844,0 1 843,5 1 842,2
By area: Urban 1 507,3 1 511,1 1 516,8 1 521,9Rural 2 047,9 2 042,0 2 034,1 2 025,6
By age group, years:0 – 14 567,9 567,6 567,0 564,315 – 59 2 410,7 2 392,9 2 374,0 2 353,660 + 576,6 592,6 609,9 629,6
The resident population of the Republic of Moldova as of 01.01.2018 was 3,5 mio. persons, decreasing compared to the same period of 2017 by 3,3 thousand persons. An annual population growth can be noticed in the urban area and a continuous decline in the rural population. These changes were caused, in particular, by the negative natural growth of the rural population and the structure of the internal migration flow.
Resident population, as of January 1
1 Population number and demographic indicators for 2014-2017 will be recalculated based on the 2014 Population and Housing Census data
Women
MenRural
Urban
By sex By area
48,1
51,9
48,1
51,9
2015
2018
42,4
57,6
42,9
57,1
2015
2018

Population
11MOLDOVA IN FIGURESStatistical pocket-book 2018
More than half of the country’s population are the inhabitants from the rural area – 57,1%. In the urban area, 1,5 mio. people live, or 42,9%. The distribution of the population by gender is as follows: 52% (1,8 mio. persons) – women and 48% (1,7 mio. persons) – men.
Population by age and sex, as of January 1, 2018
Working age Non-working age
Men WomenAge, years
+85
80
75
70
65
60
55
50
45
40
35
30
25
20
15
10
5
0
0 1000 3000 400020000100030004000 2000
The age pyramid reflects disproportions in population structure by age and gender. Decrease in the number of young people has further narrowed down the age pyramid.
The female population with an average age of 39,9 years on 1 January 2018 was older with 3,4 years than men.

Population
12 MOLDOVA IN FIGURESStatistical pocket-book 2018
Life expectancy at birth, by sex, years
WomenMenBoth sexe
71,5
71,5
7 ,2 2
6 ,7 5
67,5
6 ,8 1
0 20 40 60 80
2014
2015
2016
75,4
75,5
7 ,6 2
The average life expectancy increased compared to 2014 by 0,6 years for the male population, and to the female with 0,8 years. Current values are 68,1 years for men and 76,2 years for women. Thus, women have an average life span of 8,1 years longer than men.
Vital statisticspersons
2014 2015 2016 2017
Live-births 38 616 38 610 37 394 34 060
Boys 19 937 19 972 19 304 17 547
Girls 18 679 18 638 18 090 16 513
Deaths 39 494 39 906 38 490 36 768
Natural increase -878 -1 296 -1 096 -2 708
In 2017 there were registered 34060 live-births, decreasing by 8,9% compared to the previous year.
Death rate remains at a higher level than birth rate. In 2017, 36768 people died, decreasing by 4,5% compared to 2016.

Population
13MOLDOVA IN FIGURESStatistical pocket-book 2018
Vital statistics rates per 1000 inhabitants
Live-borns Deaths
10,9 10,9
10,5
9,6
11,1 11,2
10,8
10,4
9
10
11
12
2014 2015 2016 2017
‰
Death rates by main causes of the deathper 100 000 inhabitants
2014 2015 2016 2017
Total deaths 1 110,5 1 122,8 1 083,5 1 036,0
Malignant neoplasms 167,1 170,1 173,5 171,3
Diseases of the circulatory system 642,5 648,2 617,3 605,4
Diseases of the respiratory apparatus 48,0 51,6 47,9 45,4
Diseases of the digestive apparatus 101,7 106,0 104,1 86,9
Accidents, poisoning and injuries 85,3 77,1 76,1 64,0
Other causes 65,9 69,8 64,6 63,0
Structure of deaths by major classes of causes of death, 2017, %
16,5
5 ,8 4
4,4
8,4
6,26,1
Malignant neoplasms
Diseases of the circulatory system
Diseases of the respiratory system
Diseases of the digestive organs
Accidents, intoxications and trauma
Other cases

Population
14 MOLDOVA IN FIGURESStatistical pocket-book 2018
Infant mortality
2014 2015 2016 2017
Infant deaths under 1 year, persons 372 375 353 330
Boys 226 223 204 189
Girls 146 152 149 141
Infant deaths per 1000 live-births1 9,7 9,7 9,4 9,7
Boys 11,3 11,2 10,6 10,8
Girls 7,8 8,2 8,2 8,51 Including newborns with a weight of 500-999 grams
The number of deaths under one year registered in 2017 was 330 cases, with 23 cases less than in the previous year. Infant mortality for boys is 1,3 times higher than for girls.
Marriages and divorces
2014 2015 2016 2017
Number of marriages 25 624 24 709 21 992 20 924
Number of divorces 11 130 11 199 10 608 9 312
In 2017 there were about 21,0 thousand marriages, compared to 2016 this indicator decreased by 4,9%.
The number of divorces in 2017 was about 9,3 thousand, less by 12,2% compared to 2016.
Marriages and divorces rates per 1000 inhabitants
Marriages Devorces
‰
7,27,0
6,25,9
3,13,2 3,0
2,6
0
2
4
6
8
2014 2015 2016 2017

Population
15MOLDOVA IN FIGURESStatistical pocket-book 2018
Internal migration
2014 2015 2016 2017
Internal migration caused by change of residence place, persons
Total 35 849 38 671 33 324 30 732
From urban to urban 9 004 8 499 8 211 8 527
From rural to urban 10 675 10 929 10 683 10 186
From urban to rural 6 011 7 268 5 172 4 682
From rural to rural 10 159 11 975 9 258 7 337
Per 1000 inhabitants
Total 10,1 10,9 9,4 8,7
From urban to urban 6,0 5,6 5,4 5,6
From rural to urban 7,1 7,2 7,1 6,7
From urban to rural 2,9 3,6 2,5 2,3
From rural to rural 5,0 5,9 4,5 3,6
Source: Public Services Agency
A number of 30,7 thousand of people changed their residence place inside the country during the 2017 year. The intensity of internal migration can be measured by the number of arrivals and departures per 1000 inhabitants. The population mobility index in 2017 registered a value of 8,7 per 1000 inhabitants compared to 9,4 in 2016.
Migration flows from rural to urban have the highest share in the structure of internal migration.
Emigrants by country of destination1
persons
2014 2015 2016 2017
Left the Republic of Moldova – total 2 374 2 236 2 507 2 111of which, to:
Belarus 82 64 28 35Russian Federation 788 961 857 825Germany 223 253 285 342Israel 210 174 181 164Turkey 22 26 25 21Romania 9 8 14 10United States of America 285 287 623 290Ukraine 602 312 375 289Other countries 153 151 119 135
1 In total for the country Source: Public Services Agency

Population
16 MOLDOVA IN FIGURESStatistical pocket-book 2018
Distribution of immigrants by country of emigration persons
2014 2015 2016 2017
Arrived in the Republic of Moldova – total
4 187 4 209 4 080 3 708
of them:
Armenia 29 29 33 32
Azerbaijan 37 65 61 80
Belarus 33 45 36 27
Bulgaria 37 23 19 15
China 26 28 36 24
Russian Federation 516 567 705 685
France 42 43 29 41
Israel 525 548 594 456
Italy 206 180 170 139
Kazakhstan 17 25 42 33
Romania 852 646 464 427
Syria 34 33 20 15
United States of America 202 209 192 206
Turkey 421 347 293 245
Ukraine 534 754 734 681
Other countries 676 667 652 602
Source: Ministry of Internal Affairs

Population
17MOLDOVA IN FIGURESStatistical pocket-book 2018
Distribution of immigrants by country of emigration and purpose of arrival, in 2017
persons
Total
Purpose of arrival
for work
for studies
family immi-
grationother causes
Number of immigrants 3 708 829 716 1 437 726
of which:
Azerbaijan 80 44 11 23 2
Belarus 27 4 _ 22 1
Russian Federation 685 39 7 437 202
France 41 15 _ 6 20
Germany 41 14 2 4 21
India 84 18 64 1 1
Israel 456 4 439 9 4
Italy 139 64 1 53 21
Romania 427 228 25 135 39
Syria 15 3 1 11 _United States of America 206 16 29 16 145
Turkey 245 104 49 79 13
Ukraine 681 106 21 469 85
Other countries 581 170 67 172 172
Source: Ministry of Internal Affairs


Labour force

Labour force
20 MOLDOVA IN FIGURESStatistical pocket-book 2018
In the last 4 years, the number of economically active population varied insignificantly and was about 1,3 million persons in 2017. The main component, employment, constituted 96% of the economically active population.
The gender distribution of the economically active population also did not undergo any substantial changes, the proportion of men (50.8%) was higher compared to the women (49.2%).
Number of economically active populationthousand persons
2014 2015 2016 2017
Economically active population 1 232 1 266 1 273 1 259
of which, females 607 627 632 619
Employment 1 185 1 204 1 220 1 208
of which, females 588 604 614 598Population occupied in non-agricultural activities 824 822 809 817
of which, females 432 439 428 431
ILO unemployment 47 62 53 52
of which, females 17 23 18 21
Structure of economically active population
96,1 95,1 95,8
3,9 4,9 4,2
0
20
40
60
80
100
2014 2015 2016 2017
%
Employment Unemployment
95,9
4,1

Labour force
21MOLDOVA IN FIGURESStatistical pocket-book 2018
Distribution of employment by main economic activities thousand persons
2014 2015 2016 2017
Total 1 185 1 204 1 220 1 208of which:
Agriculture, hunting and forestry; fishing 361 382 411 390
Industry 146 148 148 144Construction 66 65 61 57Wholesale and retail trade, hotels and restaurants 203 190 200 209Transport and communications 68 76 76 73Public administration; education; health and social assistance 231 236 224 234
Other activities 110 106 100 100
In 2017, in the agricultural sector 32,3% of employed people worked. Over the last 4 years, this share has increased insignificant, especially due to the decrease of the share of employed population in the services sector, public administration, education and healthcare.
Distribution of employees by economic activities, end-year1
thousand persons
2015 2016 2017
Total 673,9 666,9 672,3of which:
Agriculture, forestry and fishing 48,0 47,4 44,4Industry 115,2 116,6 123,2Construction 23,2 22,3 23,3Wholesale and retail trade 102,4 98,8 100,2Transportation and storage 42,2 41,6 40,8Activities of accommodation and public alimentation 14,7 13,6 15,2Information and communication 19,3 19,0 20,2Financial and assurances activities 14,9 14,0 14,6Real estate transactions 11,7 11,5 11,1Professional, scientific and technical activities 16,7 17,2 15,6Activities of administrative services 10,7 11,5 12,9Public administration and defense 56,1 55,2 53,3Education 113,6 111,6 109,8Health and social assistance 64,9 66,0 67,4Art, leisure and recreation activities 14,4 13,7 13,4Other service activities 5,9 7,0 7,1
1 Data cover all economic units (real sector) with 4 and more employees and all budget institutions, regardless of the number of employees

Labour force
22 MOLDOVA IN FIGURESStatistical pocket-book 2018
As defined by the International Labor Office (ILO) unemployment rate in 2017 was of 4,1%, varying very little over the last 4 years. Unemployment rate makes it possible, by comparison, to identify the groups of people who most actively seek to enter the labor market. Thus, young people are more active than adults, men more active than women, urban residents more active than rural residents.
ILO unemployment rate, by age group, sex and areapercentage
2014 2015 2016 2017
Total 3,9 4,9 4,2 4,1under 25 9,8 12,8 11,2 11,825 and older 3,3 4,2 3,6 3,5
Men 4,6 6,2 5,5 4,8under 25 9,6 12,4 10,9 10,925 and older 4,1 5,5 5,0 4,3
Women 3,1 3,6 2,9 3,3under 25 10,2 13,5 11,7 13,025 and older 2,5 2,9 2,3 2,7
Urban 5,2 6,4 6,0 5,7under 25 10,8 16,6 14,1 14,325 and older 4,7 5,9 5,4 5,1
Rural 2,7 3,5 2,6 2,7under 25 9,1 10,1 8,9 9,925 and older 2,1 2,9 2,1 2,7

Labour force
23MOLDOVA IN FIGURESStatistical pocket-book 2018
Registered unemployment, by age group and level of education, during the year
thousand persons
2014 2015 2016 2017
Registered unemployment – total 42,2 50,6 50,1 42,1of which, women 21,2 24,5 23,1 19,5
Registered unemployment by age group:
under 25 8,3 9,2 8,4 6,8of which, women 4,5 4,8 4,0 3,3
25 and older 33,9 41,4 41,7 35,3of which, women 16,7 19,7 19,1 16,2
Registered unemployment by level of education:
Primary 2,0 2,6 3,1 3,1of which, women 1,0 1,4 1,5 1,5
General secondary 23,3 28,0 28,8 24,6of which, women 12,2 14,0 13,4 11,7
Secondary vocational 9,5 11,7 10,5 8,6of which, women 3,6 4,2 3,6 2,9
Postsecondary vocational 3,2 3,6 3,3 2,5of which, women 1,8 2,0 1,8 1,4
Higher education 4,2 4,7 4,4 3,3of which, women 2,6 2,9 2,8 2,0
Source: National Employment Agency


Population incomes and expenditures

Population incomes and expenditures
26 MOLDOVA IN FIGURESStatistical pocket-book 2018
In 2017, the average gross nominal earnings in the national economy constituted 5697,1 lei and increased compared to 2016 in nominal value by 12,1%, and in real terms (adjusted to the consumer price index) it increased by 5, 2%.
Average monthly earnings per employee by economic activities1
lei
2015 2016 2017
Total 4 610,9 5 084,0 5 697,1
of which:
Agriculture, forestry and fishing 3 072,3 3 321,4 3 798,0
Industry 4 962,8 5 353,7 5 902,7
Construction 4 559,0 5 064,5 5 649,8
Wholesale and retail trade 3 903,2 4 558,0 5 120,1
Transportation and storage 4 411,3 4 746,3 5 389,6Activities of accommodation and public alimentation 3 055,6 3 454,8 3 812,9
Information and communication 9 770,7 11 027,5 12 443,7
Financial and assurances activities 8 659,6 10 338,9 11 034,7
Real estate transactions 4 218,7 4 779,6 5 107,2Professional, scientific and technical activities 6 320,2 6 806,8 7 392,1
Activities of administrative services 3 669,7 4 144,3 4 752,3
Public administration and defense 5 749,2 6 144,2 7 361,4
Education 3 813,6 4 017,7 4 459,0
Health and social assistance 4 430,2 5 010,0 5 634,6
Art, leisure and recreation activities 3 015,8 3 130,1 3 323,9
Other service activities 6 965,4 9 081,0 7 592,91 Data cover all economic units (real sector) with 4 and more employees and all budget
institutions, regardless of the number of employees

Population incomes and expenditures
27MOLDOVA IN FIGURESStatistical pocket-book 2018
Average monthly earnings per employee, by economic activities, 2017
Arts, entertainment and recreation
Information and communication
Financial and insurance activities
Other service activities
Professional, scientificand technical activities
Public administration and defense
Industry
Total
Construction
Human healthand social work activities
Real estate activities
Transportation and storage
Wholesale and retail trade
Administrative service activities
Education
Accommodation and food service activities
Agriculture, forestry and fishing
thou.lei
3,3
3,8
3,8
4,5
4,8
5,1
5,1
5,4
5,6
5,7
5,7
5,9
7,4
7,4
7,6
11,0
12,4
1 3 5 7 9 11 13

Population incomes and expenditures
28 MOLDOVA IN FIGURESStatistical pocket-book 2018
The distribution of employees according to the salary size,in September 2017
Up to 2000 lei 2000,01-4000 lei 4000,01-6000 lei
6000,01-8000 lei 8000,01 10000 lei- More than 10000,01 lei
8
4
3
7
6
1
10
26
5
37
38
56
36
39
52
54
73
12
12
56
36
53
19
27
44
45
38
26
25
28
27
26
21
15
23
23
22
25
25
36
24
25
12
20
14
8
18
17
10
9
5
17
25
7
12
10
20
16
14
4
14
6
4
8
8
5
6
2
10
12
4
7
4
5
5
6
1
7
8
3
10
8
8
9
3
37
28
5
13
7
10
2
6
1
21
0 20 40 60 80 100
Total
A
B+C+D+E
F
G
H
I
J
K
L
M
N
O
P
Q
R
S
1 Employees who worked full month of September (and full day)
A – Agriculture, forestry and fishing B+C+D+E – IndustryF – ConstructionG – Wholesale and retail trade H – Transportation and storage I – Accommodation and food service activities J – Information and communication K – Financial and insurance activitiesL – Real estate activitiesM – Professional, scientific and technical activitiesN – Administrative service activities O – Public administration and defense P – EducationQ – Human health and social work activitiesR – Arts, entertainment and recreation S – Other service activities

Population incomes and expenditures
29MOLDOVA IN FIGURESStatistical pocket-book 2018
In 2017, the available disposable incomes of population amounted in average per person per month – 2244,9 lei, increasing 9,0% compared to previous year. Depending on the residence place, the urban population’s incomes were on average 754,0 lei or 1,4 times higher compared to rural areas.
The structure of the disposable incomes, predominantly are cash income, with a share of 91,0% compared to 9,0% for income in-kind.
Population incomes
2014 2015 2016 2017
Disposable incomes(average monthlyper capita) – total, lei 1 767,5 1 956,6 2 060,2 2 244,9
urban 2 111,1 2 350,1 2 437,7 2 671,0rural 1 505,7 1 657,5 1 771,3 1 917,0
Share of in-kind incomes in total disposable incomes – total, % 10,3 10,2 9,3 9,0
urban 3,9 4,0 3,4 3,5rural 17,2 17,0 15,5 14,9
Structure of disposable incomes of population in 2017, %
Income from ownership
Remunerated activity
Self-employment in agriculture
Self-employmentin non-agricultural sector
Social payments
Other incomes (including transfersoutside the country, 1 . %)6 5
4 ,13
7 8,5 5,
2 ,3 4
20,1
0,1
The remunerated activity represents the most important source of income with a share of 43,1% of total incomes, their contribution increasing compared to 2016 by 1 percentage points.
Social payments are the second most important source of income that contributed to the increase of the incomes of the population to 23,4% or by 1,3 percentage points more than in the previous year.
Money transfers from outside the country remain a significant source for the household budget. On average, it represents 16,5% of total incomes or 0,6 percentage points less than in 2016.

Population incomes and expenditures
30 MOLDOVA IN FIGURESStatistical pocket-book 2018
Average monthly consumption expenditures of the population in 2017 amounted in average 2250,3 lei per person, increasing by 6,3% compared to the previous year. Given that the urban population has higher incomes, correspondingly their consumption expenditures are 760,3 lei or 1,4 times higher than the expenditures of the rural population.
The major part of expenditures was intended for food consumption needs – 43,4%.
Structure of consumption expenditures of population, in 2017
4 ,3 4
10,4
1 ,8 6
3 9,
5 9,
3,7
4,5
9,6
Food
Clothing and footwear
Household maintenance
Dwelling equipment
Medical care and health
Transport
Communication
Others
Population incomes and expenditures
31MOLDOVA IN FIGURESStatistical pocket-book 2018
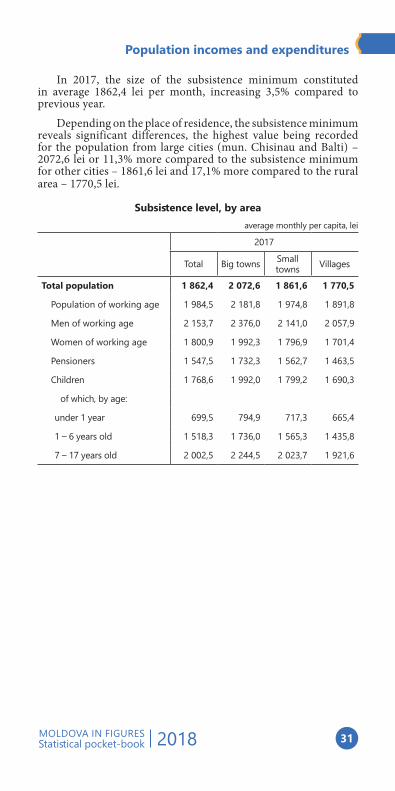
In 2017, the size of the subsistence minimum constituted in average 1862,4 lei per month, increasing 3,5% compared to previous year.
Depending on the place of residence, the subsistence minimum reveals significant differences, the highest value being recorded for the population from large cities (mun. Chisinau and Balti) – 2072,6 lei or 11,3% more compared to the subsistence minimum for other cities – 1861,6 lei and 17,1% more compared to the rural area – 1770,5 lei.
Subsistence level, by areaaverage monthly per capita, lei
2017
Total Big towns Small towns Villages
Total population 1 862,4 2 072,6 1 861,6 1 770,5
Population of working age 1 984,5 2 181,8 1 974,8 1 891,8
Men of working age 2 153,7 2 376,0 2 141,0 2 057,9
Women of working age 1 800,9 1 992,3 1 796,9 1 701,4
Pensioners 1 547,5 1 732,3 1 562,7 1 463,5
Children 1 768,6 1 992,0 1 799,2 1 690,3
of which, by age:
under 1 year 699,5 794,9 717,3 665,4
1 – 6 years old 1 518,3 1 736,0 1 565,3 1 435,8
7 – 17 years old 2 002,5 2 244,5 2 023,7 1 921,6


Prices

Prices
34 MOLDOVA IN FIGURESStatistical pocket-book 2018
For the period 2014-2017, the annual average inflation rate registered a growth from 5,1% (in 2014) to 6,6% (in 2017). Since the most part of the expenditures are intended to food consumption, the evolution of foodstuff products prices has particularly affected the CPI.
Annual average indices for foodstuff products over the period 2014-2017 had higher values than total CPI, the difference being from 1,4 percentage points (in 2014) and 1,3 percentage points (in 2017).
The depreciation of the national currency in 2015 had a major influence on the increase of non-foodstuff products prices, having a difference of 2,1 percentage points of total CPI.
Price indices by sectors of economy (average per year, previous year = 100)
2014 2015 2016 2017Consumer price index for goods and services 105,1 109,7 106,4 106,6
Foodstuff products 106,5 109,8 107,4 107,9
Non-foodstuff products 105,5 111,8 106,3 104,5
Services 102,5 106,2 104,9 107,1
Price Index for industrial production 105,5 106,3 104,5 103,3Price Index of production sold by agricultural enterprises 106,6 122,5 96,6 97,9
Price Index in construction 106,5 110,2 106,8 104,4
Unit value Indices for exported goods 94,0 83,0 96,5 105,5
Unit value Indices for imported goods 96,0 79,0 93,7 104,9
Evolution of consumer price index (December previous year = 100)
105,1
114,3
102,8
109,7
106,5
114,1
103,2
104,1
101,6
111,3
100,5
107,9
90
100
110
120
2014 2015 2016 2017
%
Foodstuff products
Non-foodstuff products
Services

Prices
35MOLDOVA IN FIGURESStatistical pocket-book 2018
Annual rate of inflation (December previous year = 100)
2014 2015 2016 2017
Total 4,7 13,6 2,4 7,3
Foodstuff products 5,1 14,3 2,8 9,7
Non-foodstuff products 6,5 14,1 3,2 4,1
Services 1,6 11,3 0,5 7,9
The average monthly inflation ratepercentage
2014 2015 2016 2017
Total 0,40 1,05 0,20 0,60
Foodstuff products 0,40 1,10 0,25 0,75
Non-foodstuff products 0,55 1,10 0,25 0,35
Services 0,15 0,90 0,05 0,65
The average annual exchange rate
2014 2015 2016 2017
Lei / Euro 18,6305 20,9025 22,0570 20,8306
Lei / US Dollar 14,0356 18,8185 19,9238 18,4990
Evolution of consumer price indices, real earnings and annual average exchange rate (previous year = 100)
%
105,1
109,7
106,4106,6
105,9
100,7103,7
105,2
111,5
134,1
105,9
94,4
111,4
112,2
105,5
92,9
80
100
120
140
2014 2015 2016 2017
Consumer price indices
Real earnings índices
Average annual exchange rate indices Lei/US Dollars
Average annual exchange rate indices Lei/Euro


Dwellings
Dwellings
38 MOLDOVA IN FIGURESStatistical pocket-book 2018
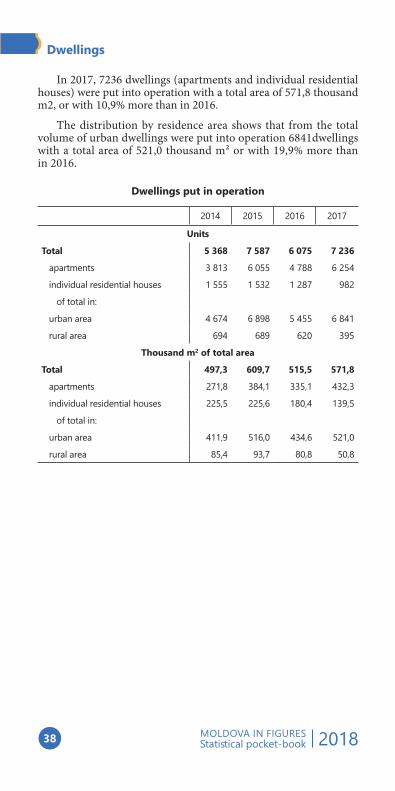
In 2017, 7236 dwellings (apartments and individual residential houses) were put into operation with a total area of 571,8 thousand m2, or with 10,9% more than in 2016.
The distribution by residence area shows that from the total volume of urban dwellings were put into operation 6841dwellings with a total area of 521,0 thousand m² or with 19,9% more than in 2016.
Dwellings put in operation
2014 2015 2016 2017
Units
Total 5 368 7 587 6 075 7 236
apartments 3 813 6 055 4 788 6 254
individual residential houses 1 555 1 532 1 287 982
of total in:
urban area 4 674 6 898 5 455 6 841
rural area 694 689 620 395
Thousand m2 of total area
Total 497,3 609,7 515,5 571,8
apartments 271,8 384,1 335,1 432,3
individual residential houses 225,5 225,6 180,4 139,5
of total in:
urban area 411,9 516,0 434,6 521,0
rural area 85,4 93,7 80,8 50,8

Education and Science

Education and Science
40 MOLDOVA IN FIGURESStatistical pocket-book 2018
In the 2017/18 study year, the educational process is organized in 1358 educational institutions, including 1243 primary and secondary general education institutions, 86 technical schools and 29 higher education institutions. The network of technical vocational education institutions includes 11 centers of excellence, 32 colleges and 43 vocational schools. The number of technical vocational education institutions decreased by 19% compared to the 2014/15 study year and of the primary and secondary general education institutions by 8%.
Education by types of institutions
2014/15 2015/16 2016/17 2017/18Education institutions
Primary and general secondary 1 347 1 323 1 291 1 243Vocational 106 92 86 86Higher 31 31 30 29
Pupils and students, thousandsInstitutions of primary and general secondary education 341,0 334,5 333,7 335,6Technical vocational education institutions 47,3 46,5 48,8 46,6Higher education institutions 89,5 81,7 74,7 65,5
Pupils and students per 10 000 inhabitants
959 941 939 946
133 131 137 131
252 230 210 185
0
200
400
600
800
1000
2014/15 2015/16 2016/17 2017/18
Institutions of primary and general secondary education
Institutions of vocational education
Higher education institutions

Education and Science
41MOLDOVA IN FIGURESStatistical pocket-book 2018
The decrease of the number of graduates compared to 2014 was found for all levels of education, 20% in general secondary education, 18% in higher education and 13% in technical vocational education.
Graduates by type of institution thousand
2014 2015 2016 2017
Secondary general education institutions 50,3 46,3 43,1 40,4
Institutions of vocational education 16,1 15,5 10,4 14,0
Higher education institutions 24,3 23,6 21,9 19,9
Graduates per 10 000 inhabitants
141130
121114
45 4429
39
68 67 62 56
0
40
80
120
160
2014/15 2015/16 2016/17 2017/18
Secondary general education institutions
Institutions of vocational education
Higher education institution
Number and graduation of doctorates
2014 2015 2016 2017Number of institutions with doctorate activities 50 43 45 46Number of doctorates (end-year)1 1 628 1 751 1 718 1 622Graduation of doctorates 368 351 363 410
1 Except foreigners
Number and graduation of post-doctorates
2014 2015 2016 2017
Number of institutions with post-doctorate activities 19 18 16 14Number of post-doctorates (end-year) 41 47 40 30Graduation of post-doctorates 18 14 21 17


Health protection

Health protection
44 MOLDOVA IN FIGURESStatistical pocket-book 2018
In 2017, there were 36,7 doctors and 69,2 medical staff per 10 000 inhabitants. Compared to previous years there is a reduction in the number of beds, per 10 000 inhabitants there were 52 beds.
Most often, the population suffers from respiratory diseases, complications of pregnancy, traumatic injuries and poisonings. At the same time, there is an increase in the number of new cases of malignant neoplasms and HIV carriers.
Main indicators of health protection, end-year
2014 2015 2016 2017
Physicians 12 880 13 006 13 023 13 0181
per 10 000 inhabitants 37,5 36,6 36,6 36,7
Paramedical personnel 25 938 23 856 24 873 24 5591
per 10 000 inhabitants 70,2 67,1 70,0 69,2
Hospitals 87 85 85 87Medical institutions as ambulatories or polyclinics, that provide medical assistance to population 1 028 1 030 1 034 1 103Hospital beds 20 131 18 803 18 745 18 398
per 10 000 inhabitants 56,6 52,9 52,7 51,8
1 Of them, working in the non-public sector, persons:
Physicians of all specialties – 2 857 (21,9%) Paramedical personnel – 1 764 (7,2%)
Population morbidity by main classes of diseases
2014 2015 2016 2017
Ill persons under observation with the diagnosis set for the first time – total, thousand cases 1 127,0 1 161,3 1 152,9 1 181,0
of which:
Infectious and parasitical diseases 74,2 72,8 69,3 66,1Neoplasms 15,3 14,9 15,7 15,5Diseases of the nervous system and sense organs 72,0 69,7 67,1 64,4Diseases of the circulatory system 67,5 64,5 61,8 76,5Diseases of the respiratory apparatus 406,7 465,4 474,9 518,0Diseases of the digestive apparatus 68,7 63,9 57,1 54,9Diseases of the urogenital system 72,1 68,8 70,3 70,8Complications of pregnancy, delivery and post-partum period 44,5 43,5 38,7 33,5

Health protection
45MOLDOVA IN FIGURESStatistical pocket-book 2018
2014 2015 2016 2017
Skin and subcutaneous tissue diseases 60,8 61,0 60,5 56,0Diseases of bones and joints, muscles and conjunctive tissue 53,6 53,3 59,6 49,7Injuries, poisonings and other consequences of the external causes 105,3 106,3 102,5 100,0
Number of cases per 1000 inhabitants 316,8 326,5 324,5 332,7
of which:
Infectious and parasitical diseases 20,8 20,5 19,5 18,6Neoplasms 4,3 4,2 4,4 4,4Diseases of the nervous system and sense organs 20,2 19,6 18,9 18,1Diseases of the circulatory system 19,0 18,1 17,4 21,5Diseases of the respiratory apparatus 114,3 130,9 133,7 145,9Diseases of the digestive apparatus 19,3 18,0 16,1 15,5Diseases of the urogenital system 20,3 19,3 19,8 19,9Complications of pregnancy, delivery and post-partum period 46,5 45,7 41,1 35,8Skin and subcutaneous tissue diseases 17,1 17,2 17,0 15,8Diseases of bones and joints, muscles and conjunctive tissue 15,1 15,0 16,8 13,9Injuries, poisonings and other consequences of the external causes 29,6 29,9 28,8 28,2
Continued

Health protection
46 MOLDOVA IN FIGURESStatistical pocket-book 2018
Population morbidity by separate diseases
2014 2015 2016 2017
Ill persons under observation with the diagnosis set for the first time, thousand cases:
Malignant neoplasms 8,9 8,7 9,9 10,1
Active tuberculosis 2,7 2,9 2,3 2,2
Alcoholism and alcoholic psychosis 3,4 3,2 3,2 3,2
Drug addiction and abuse 1,1 1,0 0,8 1,1
Syphilis 1,9 1,9 1,6 1,4
Gonorrhea 1,0 0,9 0,8 0,7
AIDS infection, cases 88 131 241 182
HIV carrier, cases 586 574 603 618Number of cases per 100 000 inhabitants:
Malignant neoplasms 249,0 244,9 278,6 284,4
Active tuberculosis 77,2 80,2 64,9 61,9
Alcoholism and alcoholic psychosis 96,4 91,0 90,1 90,1
Drug addiction and abuse 29,5 28,0 22,5 30,9
Syphilis 52,1 54,0 45,0 39,4
Gonorrhea 28,2 26,4 22,5 19,7
AIDS infection 2,5 3,7 6,8 5,1
HIV carrier 16,5 16,2 17,0 17,4

Culture and Sport

Culture and Sport
48 MOLDOVA IN FIGURESStatistical pocket-book 2018
In the Republic of Moldova 16 theaters were activating, that have been visited in 2017 by 371,3 thousand persons, or by 5,8% lesc than in 2014.
During the 2014-2017 years, the number of libraries decreased with 22 units, thus in 2017 – 1338 libraries activated in the country. About 12 thousand copies of books and journals are on average per library.
Cultural institutions activity, end-year
2014 2015 2016 2017
Museums (including affiliated representatives) 119 123 123 126
Number of visitors, thousand 880,0 990,4 836,2 757,8
Theatres1 16 16 16 16
Number of visitors, thousand 394,2 414,8 432,8 395,0
Public libraries 1 360 1 353 1 343 1 338Number of books and magazines in public libraries, million copies 16,9 16,6 16,3 16,2
Recreation centers and club establishments (public centers) 1 229 1 218 1 219 1 219Philharmonic 1 1 1 1
Number of visitors, thousand 29,7 28,4 23,4 31,8
1 Including 1 theater studio
Printed books and brochures, magazines and newspapers
2014 2015 2016 2017
Books and brochures 2 724 2 700 2 550 2 655
Edition, million copies 2,3 2,2 2,3 2,5
Magazines and other periodicals 258 216 208 176
Annual edition, million copies 3,3 2,7 2,1 1,0
Newspapers (editions) 171 153 130 131
Single edition, million copies 1,1 1,0 1,0 1,6
Annual edition, million copies 36,6 33,8 25,3 32,1

Culture and Sport
49MOLDOVA IN FIGURESStatistical pocket-book 2018
The number of sports constructions in 2017 was 4563 units, including 51 stadiums with stands for 500 places and over, 2887 flat sport premises, 1241 sports halls, 23 swimming pools and 361 auxiliary premises, equipped rooms. There are also 9 gymnastic and health improvement centers with budget funding.
Sport premises and gymnastic and health improvement centers
2014 2015 2016 2017
Sport constructions – total 4 901 4 806 4 762 4 563
of which:
Stadiums with stands for 500 places and over 51 50 50 51Flat sport premises (grounds and fields) 3 025 3 026 3 028 2 887
Sports halls 1 268 1 268 1 262 1 241
Swimming-pools 25 25 25 23
Auxiliary premises, equipped rooms for gymnastics and sports 532 437 397 361
Gymnastic and health improvement centers 8 9 9 9
Source: Ministry of Education, Culture and Research


Tourism

Tourism
52 MOLDOVA IN FIGURESStatistical pocket-book 2018
Collective tourist accommodation structures in 2017 recorded 1,5 mio. overnight stays, with 2,4% more than in 2016. The increase in tourists 'overnight stays was conditioned by their increase in hotels and motels (+14,4%), rest structures (+11,0%), visitors' dormitories (+3,4 %), tourist and agrotourist pensions (+2,1%). From total overnight stays, 80,4% are overnight stays of the Moldovan tourists and 19,6% – of the non-resident tourists.
Main indicators of collective structures of tourist accommodation
2014 2015 2016 2017Number of accommodation structures1 – total 275 249 252 268
Hotels and motels 100 96 96 106Hostels for visitors 5 4 3 3Tourist and agrotourist pensions 24 26 26 28Health-care structures 7 7 8 8Recreation structures (tourist villas, recreation camps and other recreation structures) 63 57 61 62Pupils summer camps 76 59 58 61
Number of rooms1 – total 8 529 7 735 7 854 8 211Hotels and motels 2 563 2 542 2 628 2 766 Hostels for visitors 185 176 170 170Tourist and agrotourist pensions 457 428 452 409Health-care structures 1 054 1 054 1 086 1 092Recreation structures (tourist villas, recreation camps and other recreation structures) 1 668 1 401 1 496 1 491Pupils summer camps 2 602 2 134 2 022 2 283
Number of places (beds)1 – total 28 548 25 312 25 241 25 991Hotels and motels 4 610 4 623 4 961 5 148Hostels for visitors 552 540 511 545Tourist and agrotourist pensions 990 909 955 867Health-care structures 2 084 2 084 2 130 2 136Recreation structures (tourist villas, recreation camps and other recreation structures) 4 144 3 539 3 968 3 902Pupils summer camps 16 168 13 617 12 716 13 393
Number of tourists placed – total, thousand 283,0 278,9 306,3 337,2
of whom, foreign tourists 93,9 94,4 121,3 145,2Number of overnight stays of tourists – total, thousand 1 514,3 1 501,1 1 480,0 1 515,0
of whom, foreign tourists 217,9 252,9 246,5 297,2Index of net use of functioning tourist accommodation capacity 35,5 35,6 34,3 34,9
1 End-year

Tourism
53MOLDOVA IN FIGURESStatistical pocket-book 2018
Tourists accommodated in the collective accommodation structures (in % compared to the total)
64,8 66,8 66,2 60,4 57,0
35,2 33,2 33,8 39,6 43,0
0
20
40
60
80
100
2013 2014 2015 2016 2017
%
Non-residentsResidents
Number of accommodated foreign tourists in the collective accommodation structures, by main origin countries
2014 2015 2016 2017
Total 93 897 94 381 121 340 145 165of which:
Austria 1 425 986 1 741 1 805Belarus 996 1 043 1 081 1 394Bulgaria 1 837 1 646 1 848 2 207Czech Republic 785 825 1 033 1 279France 2 140 1 882 2 492 2 952Germany 4 672 3 964 5 602 6 701Greece 850 629 810 972Hungary 534 642 684 908Israel 1 424 1 423 2 417 2 796Italy 5 143 4 677 5 086 5 987Lithuania 690 700 751 1 019Netherlands 1 260 1 474 1 842 1 755Poland 2 453 2 154 3 511 4 215Romania 22 624 23 884 29 902 35 950Russian Federation 8 368 9 054 9 705 12 999Spain 921 851 1 041 1 440Sweden 1 122 1 338 1 228 1 296Switzerland 512 505 725 1 077Turkey 3 523 4 118 4 467 5 815Ukraine 10 951 13 503 16 422 17 887United Kingdom 2 827 2 312 3 884 4 554United States of America 6 064 3 877 7 995 10 121Other countries 12 776 12 894 17 073 24 288


Crime

Crime
56 MOLDOVA IN FIGURESStatistical pocket-book 2018
In the 2017 year, 35,6 thousand crimes were registered, showing an a decrease of 15,1% compared to the previous year, and compared to the year 2014 the level of criminality decreased by 14,8%. The crime rate was 100,2 offenses per 10 000 inhabitants compared to 117,5 offenses in 2014. Of the total number of crimes, thefts are most often committed (34,2%).
About 22% of crimes are exceptionally grave, most serious and grave, per 10 000 inhabitant on average there are 21,5 grave crimes.
The number of persons who have committed crimes decreased by 10,9% but increased for convicted persons by 11,4%, compared to 2014. In total number of convicted persons, the minors constitute 3,6%.
Number of registered crimes
2014 2015 2016 2017
Registered crimes – total 41 786 39 782 41 921 35 581
of which:
Thefts 16 729 15 363 16 238 12 154
Robberies and brigandage 1 252 1107 1 210 944
Murder 172 177 189 154
Premeditated severe bodily injuries 320 252 250 196
Rape 352 303 341 301
Crimes connected with narcotics 1 288 1 191 1 153 1 269
Hooliganism 1 614 1 491 1 699 1 447Persons who committed offenses – total 17 675 17 162 17 576 15 745
of which by age, years:
14 – 17 1 761 1 325 1 378 1 295
18 – 29 7 649 6 827 7 160 6 659
30 and older 8 255 7 629 8 052 7 702Of total number – persons who committed offenses:
Women 1 448 1 322 1 317 1 262
Minors 1 761 1 325 1 490 1 384
Unemployed persons 10 973 9 100 9 401 8 065Number of registered crimes per 10 000 inhabitants 117,5 111,0 118,0 100,2

Crime
57MOLDOVA IN FIGURESStatistical pocket-book 2018
Number of grave crimes per 10 000 inhabitants
21,8 22,7 22,9 23,5 21,5
0
5
10
15
20
25
2013 2014 2015 2016 2017
Number of convicted persons
9390 9894
11682
10038 10460
320 264 374 335 377
3,4
2,7
3,2 3,33,6
0
1
2
3
4
0
4000
8000
12000
16000
2013 2014 2015 2016 2017
%persons
Total convicts
Convicted minors
Share of convicted minors in thetotal number of convicted persons
Traffic accidents
2014 2015 2016 2017
Traffic accidents 2 537 2 535 2 478 2 641Number of injured persons in road and transport incidents – total 3 725 3 632 3 237 3 293
of which, children 411 325 425 349Injured – total 3 401 3 334 2 926 2 991
of which, children 339 305 410 336Deceased – total 324 298 311 302
of which, children 21 20 15 13


Gross domestic product

Gross domestic product
60 MOLDOVA IN FIGURESStatistical pocket-book 2018
Gross domestic product (GDP), according to preliminary data, in 2017 totaled 150,4 billion lei, or 42,4 thousand lei per capita. Compared to 2016, GDP, in real terms, increased by 4,5% and GDP per capita – by 4,6%.
Gross added value recorded 126,4 billion lei, exceeding by 3,8% the previous year and representing 84,1% of GDP.
In terms of GDP growth, the increase was due to final consumption of households (+ 4,2%), with a contribution to GDP formation of 85,8% and an increase of 4,9%.
Gross domestic product
2014 2015 2016 2017
Gross domestic product (in current prices), million lei 112 050 122 563 135 397 150 369
per capita, lei 31 506 34 485 38 119 42 367Physical volume index of GDP, in % to the previous year 104,8 99,6 104,5 104,5
per capita 104,9 99,6 104,5 104,6
Gross Domestic Product
Gross Domestic Product
Gross Domestic Product per capita
billion lei, current prices thousand lei per capita
100,5112,0
122,6
135,4
150,4
28,231,5
34,538,1
42,4
0
10
20
30
40
50
0
40
80
120
160
2013 2014 2015 2016 2017

Gross domestic product
61MOLDOVA IN FIGURESStatistical pocket-book 2018
Indices of gross domestic product2010 =100
%
116,0
121,6 121,0
126,4
131,9
113,9117,0
114,8118,5
123,3
119,4
131,4
128,4
125,7
132,4
100
110
120
130
140
2013 2014 2015 2016 2017
Gross domestic product
Final consumption
Gross capital formation
Resources and Uses of Gross Domestic Productmillion lei; current prices
2014 2015 2016 2017
Agriculture, forestry and fishing 14 619 15 002 16 396 18 358
Industry 16 899 18 672 20 434 21 952
Construction 4 008 4 414 4 635 4 929
Other activities 61 059 69 794 76 002 83 244Financial intermediation services indirectly measured -2 082 -4 009 -1 997 -2 042
Gross added value 94 503 103 873 115 470 126 441
Net taxes on products 17 546 18 690 19 927 23 928
Gross domestic product 112 049 122 563 135 397 150 369
Final consumption 124 299 132 828 142 096 157 666
of which:
of households 101 962 107 674 116 547 129 080
of public administration 20 372 23 096 23 392 26 041of non-profit institutions serving households 1 965 2 058 2 157 2 545
Gross capital formation 29 202 27 802 30 506 34 995
of which:
gross fixed capital formation 27 707 29 513 30 289 32 865
changes in stocks 1 495 -1 711 217 2 130Net export -41 451 -38 067 -37 205 -42 292
Gross domestic product
62 MOLDOVA IN FIGURESStatistical pocket-book 2018
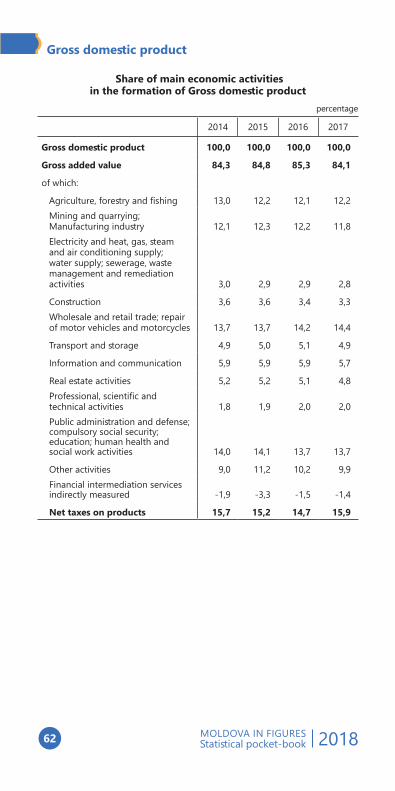
Share of main economic activities in the formation of Gross domestic product
percentage
2014 2015 2016 2017
Gross domestic product 100,0 100,0 100,0 100,0
Gross added value 84,3 84,8 85,3 84,1
of which:
Agriculture, forestry and fishing 13,0 12,2 12,1 12,2Mining and quarrying; Manufacturing industry 12,1 12,3 12,2 11,8Electricity and heat, gas, steam and air conditioning supply; water supply; sewerage, waste management and remediation activities 3,0 2,9 2,9 2,8
Construction 3,6 3,6 3,4 3,3Wholesale and retail trade; repair of motor vehicles and motorcycles 13,7 13,7 14,2 14,4
Transport and storage 4,9 5,0 5,1 4,9
Information and communication 5,9 5,9 5,9 5,7
Real estate activities 5,2 5,2 5,1 4,8Professional, scientific and technical activities 1,8 1,9 2,0 2,0Public administration and defense; compulsory social security; education; human health and social work activities 14,0 14,1 13,7 13,7
Other activities 9,0 11,2 10,2 9,9Financial intermediation services indirectly measured -1,9 -3,3 -1,5 -1,4
Net taxes on products 15,7 15,2 14,7 15,9

Gross domestic product
63MOLDOVA IN FIGURESStatistical pocket-book 2018
Contribution of expenditure items to gross domestic product formation
percentage
2014 2015 2016 2017
Gross domestic product 100,0 100,0 100,0 100,0
of which:
Final consumption 110,9 108,4 104,9 104,8
of which:
of households 91,0 87,9 86,1 85,8
of public administration 18,1 18,8 17,2 17,3of non-profit institutions serving households 1,8 1,7 1,6 1,7
Gross capital formation 26,1 22,7 22,5 23,3
of which:
gross fixed capital formation 24,8 24,1 22,4 21,9
changes in stocks 1,3 -1,4 0,1 1,4
Net export -37,0 -31,1 -27,4 -28,1
Contribution of ownership forms to the gross domestic product formation
percentage
2014 2015 2016
Gross domestic product 100,0 100,0 100,0
of which:
Public 19,7 19,6 19,0
Private 58,0 54,6 54,5Mixed (public and private), without foreign participation 1,2 2,0 1,8
Joint ventures and foreign 21,1 23,8 24,7


Industry

Industry
66 MOLDOVA IN FIGURESStatistical pocket-book 2018
In 2017, the turnover index in industry increased by 6,9% compared to the previous year, a growth supported by growth supported by extractive industry (+28,0) and manufacturing (+6,7%).
In 2017 compared to 2016, the industrial production index increased by 3,4% as a result of the 4,5% increase in manufacturing industry. Mining and quarrying industry and the production and supply of electricity and heating, gas, hot water; air conditioning decreased by 3,7% and 1,7%, respectively.
Turnover index in industry (previous year = 100)
2015 2016 2017
Industry – total 98,7 112,9 106,9
internal market 98,4 108,3 104,9
external market 99,0 117,9 108,6
Mining and quarrying 93,7 83,5 128,0
internal market 94,2 83,2 116,1
external market 32,5 175,6 15 times
Manufacturing industry 98,7 113,3 106,7
internal market 98,5 109,0 104,6
external market 99,0 117,8 108,4
Volume indices of industrial production, by type of activity (previous year = 100)
2014 2015 2016 2017
Industry – total 107,3 100,6 100,9 103,4
Mining and quarrying 100,2 91,0 84,2 96,3
Manufacturing industry 108,5 102,3 101,8 104,5
Food industry 112,3 95,2 101,0 106,4
Manufacture of beverages 90,1 96,2 94,6 107,8
Manufacture of textiles 120,4 96,9 131,8 93,5
Manufacture of wearing apparel 110,3 119,9 115,1 102,3Tanning and dressing of leather; manufacture of luggage and leather goods, saddler and harness; dressing and dyeing of furs 104,0 104,0 110,1 98,4Wood processing, manufacture of wood and cork, except furniture; manufacture of articles of straw and plaiting materials 120,3 115,9 150,2 111,4Manufacture of paper and paper products 108,0 97,0 121,7 94,7

Industry
67MOLDOVA IN FIGURESStatistical pocket-book 2018
2014 2015 2016 2017
Printing and reproduction of recorded media 124,8 89,3 83,4 98,2Manufacture of substances and chemical products 142,4 117,6 117,2 94,0Manufacture of basic pharmaceutical products and pharmaceutical preparations 91,8 116,9 98,7 105,4
Metallurgical industry 114,3 76,0 89,4 106,3Manufacture of rubber and plastic products 104,4 105,9 94,5 116,4Production of other non-metallic mineral products 102,6 106,0 91,0 103,5Manufacture of metal and fabricated metal products, except machinery and equipment 97,4 108,9 103,9 103,6Manufacture of computer, electronic and optical products 98,2 99,3 92,4 89,9
Manufacture of electrical equipment 154,3 132,2 82,6 139,4Manufacture of machinery and equipment n.e.c 97,2 108,5 102,6 95,9Manufacture of motor vehicles, trailers and semi-trailers 93,1 113,2 164,7 112,0
Manufacture of furniture 107,4 103,0 127,5 99,8
Other industrial activities n.c.a. 113,4 152,1 101,7 115,1Repair, maintenance and installation of machinery and equipment 130,8 104,6 78,4 89,3
Production and distribution ofelectricity and heat, gas, hot waterand conditioning air 104,4 99,0 99,0 98,3


Agriculture

Agriculture
70 MOLDOVA IN FIGURESStatistical pocket-book 2018
The agricultural production volume index in households of all categories (agricultural enterprises, farms and households) in 2017, according to preliminary estimates, was 108,6% compared to 2016. The increase of global agricultural output was determined by the increase of vegetal production – by 13,1%, livestock production declining by 2,1%.
Agricultural production (in all categories of households)
2014 2015 2016 20171
Million lei; current prices
Agricultural production 27 254 27 193 30 362 34 023
Plant production 17 341 18 082 21 098 24 278
Animal production 9 417 8 584 8 768 9 199
Services 496 527 496 546
Previous year = 100
Agricultural production 108,6 86,6 118,8 108,6
Plant production 110,8 77,7 126,6 113,1
Animal production 104,1 103,0 102,5 97,9
¹ According to preliminary estimates
Structure of agricultural production by categories of households (in comparable prices)
3947
39 37
1816
19 20
43 37 42 43
0
20
40
60
80
100
2014 2015 2016 2017
%
Agricultural enterprises Farms Households
Agriculture
71MOLDOVA IN FIGURESStatistical pocket-book 2018
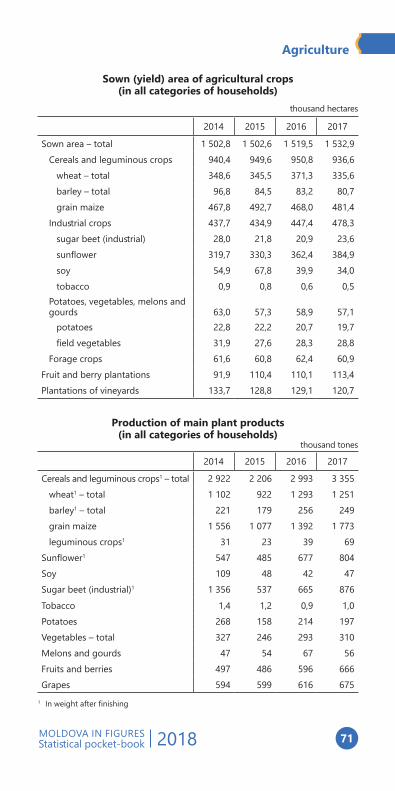
Sown (yield) area of agricultural crops (in all categories of households)
thousand hectares
2014 2015 2016 2017
Sown area – total 1 502,8 1 502,6 1 519,5 1 532,9Cereals and leguminous crops 940,4 949,6 950,8 936,6
wheat – total 348,6 345,5 371,3 335,6barley – total 96,8 84,5 83,2 80,7grain maize 467,8 492,7 468,0 481,4
Industrial crops 437,7 434,9 447,4 478,3sugar beet (industrial) 28,0 21,8 20,9 23,6sunflower 319,7 330,3 362,4 384,9soy 54,9 67,8 39,9 34,0tobacco 0,9 0,8 0,6 0,5
Potatoes, vegetables, melons and gourds 63,0 57,3 58,9 57,1
potatoes 22,8 22,2 20,7 19,7field vegetables 31,9 27,6 28,3 28,8
Forage crops 61,6 60,8 62,4 60,9Fruit and berry plantations 91,9 110,4 110,1 113,4Plantations of vineyards 133,7 128,8 129,1 120,7
Production of main plant products (in all categories of households)
thousand tones
2014 2015 2016 2017
Cereals and leguminous crops1 – total 2 922 2 206 2 993 3 355wheat1 – total 1 102 922 1 293 1 251barley1 – total 221 179 256 249grain maize 1 556 1 077 1 392 1 773leguminous crops1 31 23 39 69
Sunflower1 547 485 677 804Soy 109 48 42 47Sugar beet (industrial)1 1 356 537 665 876Tobacco 1,4 1,2 0,9 1,0Potatoes 268 158 214 197Vegetables – total 327 246 293 310Melons and gourds 47 54 67 56Fruits and berries 497 486 596 666Grapes 594 599 616 675
1 In weight after finishing

Agriculture
72 MOLDOVA IN FIGURESStatistical pocket-book 2018
In 2017, compared to 2016 in households of all categories the average harvest per hectare increased to most agricultural crops.
Yield per hectare of main agricultural crops (in all categories of households)
quintals
2014 2015 2016 2017
Cereals and leguminous crops1 – total 31,2 23,4 31,6 35,9
wheat1 – total 31,7 26,7 34,9 37,3
barley1 – total 22,9 21,2 30,9 30,9
grain maize 33,5 22,0 29,9 37,0
leguminous crops1 14,2 9,9 16,4 20,0
Sunflower1 17,7 14,7 18,7 20,9
Soy 20,7 7,3 11,7 14,0
Sugar beet (industrial)1 498,8 252,6 325,5 369,5
Tobacco 16,3 15,5 13,6 18,2
Potatoes 117,7 71,5 104,0 100,0
Field vegetables 98,0 84,7 97,0 103,2
Melons and gourds 66,9 86,3 87,9 74,9
Fruits and berries 53,4 43,4 53,4 57,2
Grapes 43,7 45,6 46,9 54,2
1 In weight after finishing
Production of main plant products in farmsthousand tones
2014 2015 2016 2017
Cereals and leguminous crops1 – total 865 622 853 953
of which, maize 518 350 442 540
Sugar beet (industrial)1 83 39 55 58
Sunflower1 134 128 174 207
Potatoes 45 23 36 30
Vegetables 44 22 26 31
Fruits and berries 196 233 302 320
Grapes 207 239 191 216
1 In weight after finishing

Agriculture
73MOLDOVA IN FIGURESStatistical pocket-book 2018
On January 1, 2018, as compared to the previous year, there was a decrease in the number of livestock for all types of species.
Livestock (in all categories of households) as of January 1
thousand capita
2015 2016 2017 2018
Cattle 191 186 182 167
of which, cows 130 128 123 113
Pigs 473 453 439 406
Sheep and goats 875 868 870 842
of which, sheep 730 718 711 679
Horses 42 39 37 34
Production of main animal products (in all categories of households)
2014 2015 2016 2017
Cattle and poultry for slaughter (in live weight), thousand tones 164 174 184 205Milk, thousand tones 525 520 504 485
Eggs, million pieces 645 629 674 707
Wool (in natural weight), tones 1 947 1 899 1 710 1 850


Investments in long term tangible assets and construction
Investments in long term tangible assets and construction
76 MOLDOVA IN FIGURESStatistical pocket-book 2018
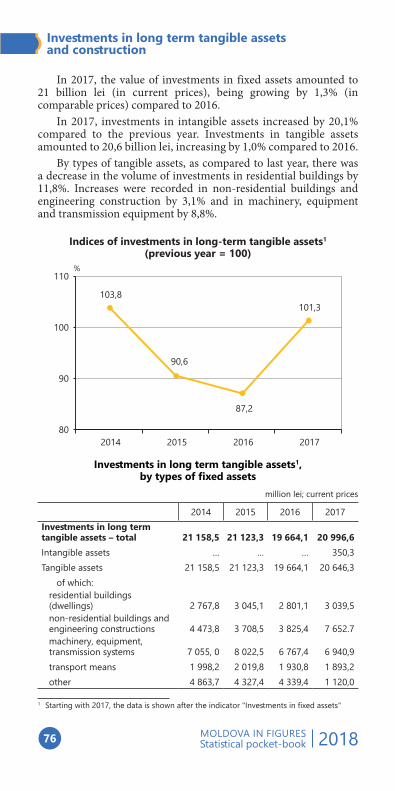
In 2017, the value of investments in fixed assets amounted to 21 billion lei (in current prices), being growing by 1,3% (in comparable prices) compared to 2016.
In 2017, investments in intangible assets increased by 20,1% compared to the previous year. Investments in tangible assets amounted to 20,6 billion lei, increasing by 1,0% compared to 2016.
By types of tangible assets, as compared to last year, there was a decrease in the volume of investments in residential buildings by 11,8%. Increases were recorded in non-residential buildings and engineering construction by 3,1% and in machinery, equipment and transmission equipment by 8,8%.
Indices of investments in long-term tangible assets1
(previous year = 100)
103,8
90,6
87,2
101,3
80
90
100
110
2014 2015 2016 2017
%
Investments in long term tangible assets1, by types of fixed assets
million lei; current prices
2014 2015 2016 2017Investments in long term tangible assets – total 21 158,5 21 123,3 19 664,1 20 996,6Intangible assets … … … 350,3Tangible assets 21 158,5 21 123,3 19 664,1 20 646,3
of which:residential buildings (dwellings) 2 767,8 3 045,1 2 801,1 3 039,5non-residential buildings and engineering constructions 4 473,8 3 708,5 3 825,4 7 652.7machinery, equipment, transmission systems 7 055, 0 8 022,5 6 767,4 6 940,9transport means 1 998,2 2 019,8 1 930,8 1 893,2other 4 863,7 4 327,4 4 339,4 1 120,0
1 Starting with 2017, the data is shown after the indicator "Investments in fixed assets"

Investments in long term tangible assets and construction
77MOLDOVA IN FIGURESStatistical pocket-book 2018
In 2017, the considerable volume of investments in immobilized assets was made by economic entities with the form of private property, which valued 10,0 billion lei or 47,5% of the total volume of investments.
The entities with the form of public property capitalized 6,7 billion lei or 32,1% of the total and to the enterprises with foreign ownership have rebounded 9,9% of total investments in the country.
Investments in long-term tangible assets2, by forms of ownership
million lei; current prices
2014 2015 2016 2017
Investments in long term tangible assets – total 21 158,5 21 123,3 19 664,1 20 996,6
of which:
Public 7 519,2 6 769,9 5 460,3 6 749,3
Private 10 198,5 10 335,5 9 776,1 9 966,0Mixed (public and private), without foreign participation 179,0 144,5 83,7 88,6Foreign 1 499,4 1 789,3 2 334,3 2 071,0
Joint ventures 1 762,4 2 084,1 2 009,7 2 121,7
Investments in long-term tangible assets1, by sources of financing
million lei; current prices
2014 2015 2016 2017Investments in long term tangible assets – total 21 158,5 21 123,3 19 664,1 20 996,6
of which, financed from:
state budget 2 274,7 1 717,9 932,6 1 372,9administrative-territorial units budgets 1 077,2 948,4 898,7 1 251,5
own funds of enterprises 12 072,2 13 069,2 13 176,7 13 768,7
foreign investors funds 1 267,7 1 492,2 1 420,5 1 095,5
other sources 4 466,7 3 895,6 3 235,6 3 508,0
2 See note 1, page 76

Investments in long term tangible assets and construction
78 MOLDOVA IN FIGURESStatistical pocket-book 2018
Structure of investments in long-term tangible assets3, by sources of financing,%
2016 2017
9 3,
67 0,
7 2,
16 5,12,5
65,6
5,2
16,7
State budget Own funds of enterprises
Foreign investors funds Other sources
In 2017 the volume of works performed by organizations with the main type of activity “Constructions” constituted 9,0 billion lei or 102,3% (in comparable prices) compared to 2016.
By structure elements of the executed works, predominantly are the new construction works carried out in a volume of 4,7 billion lei, decreasing by 7,4% compared to 2016.
The value of the construction carried out in the enterprise, on structural elements of the works
million lei; current prices
2014 2015 2016 2017
Total 8 707,4 8 212,8 8 200,0 8 984,2
of which:
new constructions 4 513,4 4 592,6 4 783,0 4 742,3
capital repairs 2 103,9 1 821,6 1 674,4 2 094,6
current repairs 1 803,7 1 516,2 1 466,8 1 982,5
other works 286,4 282,4 275,8 164,8
3 See note 1, page 76

Investments in long term tangible assets and construction
79MOLDOVA IN FIGURESStatistical pocket-book 2018
The value of construction works carried out in the enterprise, by forms of ownership
million lei; current prices
2014 2015 2016 2017Total 8 707,4 8 212,8 8 200,0 8 984,2
of which:
Public 204,4 130,3 126,4 172,8
Private 6 836,5 6 680,1 6 906,9 7 395,8Mixed (public and private), without foreign participation 562,4 538,3 546,9 688,4Foreign 914,9 707,3 409,5 445,0
Joint ventures 189,3 156,7 210,3 282,2


Transport and communications

Transport and communications
82 MOLDOVA IN FIGURESStatistical pocket-book 2018
In the 2017 year, the railway, road, river and air transport companies transported goods in volume of 17,3 million tones or with 23,7% more than of the 2016 year. Increased of volumes of goods transported was registered at air transport companies (of 2,2 times), railway (+37,2%) and river (+19,4%).
The turnover of goods totalized 4,6 billion tonne-km, with 14,2% more than that recorded in 2016. The increase of goods trajectory was registered in the railway undertakings (+25,2%), air (+20,1%) and road (+11,5%). At the same time, the fluvial transport enterprises recorded decreases compared to the year 2016 both in the volume of transported goods (-0,6%) and in their route (-0,7%).
Goods transportation by transport enterprises
2014 2015 2016 2017
Thousand tones
Transported goods – total 14 648,3 13 870,2 13 969,2 17 275,6
of which by:
railway 5 008,4 4 157,9 3 493,0 4 793,9
road1 9 411,9 9 559,7 10 340,1 12 345,8
river 227,2 152,0 135,6 134,8
air 0,81 0,58 0,49 1,06
Million tones-kilometers
Turnover of goods – total 4 256,3 3 914,6 4 071,5 4 648,7
of which by:
railway 1 181,4 963,5 789,9 988,9
road1 3 073,1 2 949,9 3 280,6 3 658,6
river 0,8 0,4 0,3 0,3
air 1,0 0,8 0,7 0,91 Including enterprises with other types of activity, that perform freight road transportation
against fee and possess 10 and more freight transport means, own or rented

Transport and communications
83MOLDOVA IN FIGURESStatistical pocket-book 2018
The evolution of the transported goods and turnover of goods (previous year = 100)
127,0
105,6
95,9
100,7
123,7
116,0
95,492,0
104,0 114,2
80
100
120
140
2013 2014 2015 2016 2017
%
Transported goods Turnover of goods
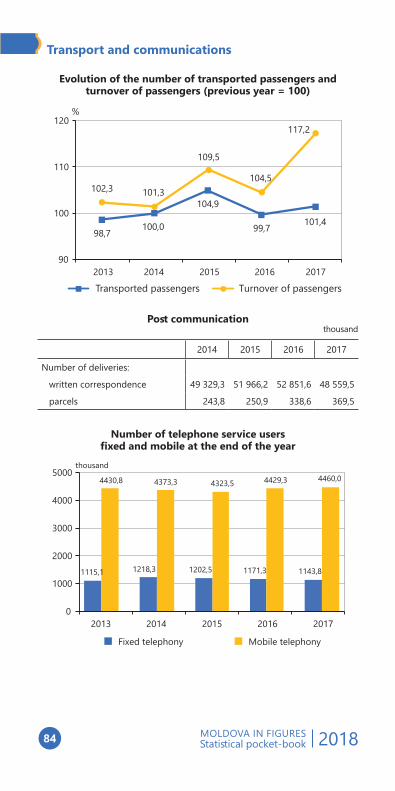
In 2017 compared to 2016, the number of passengers transported by public transport increased (+1,4%) as well as the turnover of passengers (+17,2%).
Passenger transportation, by means of public transport
2014 2015 2016 2017
Million passengersTransported passengers – total 237,1 248,7 248,3 251,7
of which, by:railway 3,8 3,3 2,3 1,8buses 108,3 102,6 102,1 100,3taxi 3,0 5,0 5,0 6,5trolleybuses 121,0 136,6 137,7 141,4river 0,1 0,1 0,1 0,1air 0,9 1,1 1,1 1,6
Million passenger-kilometers
Turnover of passengers – total 4 631,8 5 071,9 5 302,1 6 212,6
of which, by:
railway 256,9 180,8 121,5 99,0
buses 2 720,3 2 834,4 3 005,7 3 123,0
taxi 62,5 100,5 107,8 139,4
trolleybuses 366,9 413,2 415,5 427,0
river 0,28 0,28 0,29 0,26
air 1 224,9 1 542,7 1 651,3 2 423,9
Transport and communications
84 MOLDOVA IN FIGURESStatistical pocket-book 2018
Evolution of the number of transported passengers and turnover of passengers (previous year = 100)
98,7100,0
104,9
99,7101,4
102,3 101,3
109,5
104,5
117,2
90
100
110
120
2013 2014 2015 2016 2017
%
Transported passengers Turnover of passengers
Post communicationthousand
2014 2015 2016 2017
Number of deliveries:
written correspondence 49 329,3 51 966,2 52 851,6 48 559,5
parcels 243,8 250,9 338,6 369,5
Number of telephone service usersfixed and mobile at the end of the year
1115,1 1218,3 1202,5 1171,3 1143,8
4430,8 4373,3 4323,5 4429,3 4460,0
0
1000
2000
3000
4000
5000
2013 2014 2015 2016 2017
Fixed telephony Mobile telephony
thousand

Transport and communications
85MOLDOVA IN FIGURESStatistical pocket-book 2018
Fixed telephonymillion minutes
2014 2015 2016 2017
National fixed telephone traffic networks (local + interurban) 2 258,0 2 090,2 1 824,0 1 587,9International outgoing telephone traffic from fixed networks 39,1 28,4 21,2 15,1
Mobile telephonymillion minutes
2014 2015 2016 2017
National telephone traffic of mobile networks 6 092,1 6 315,7 6 208,3 6 212,6International outgoing telephone traffic from mobile networks 160,8 146,7 119,1 82,9


External trade

External trade
88 MOLDOVA IN FIGURESStatistical pocket-book 2018
The exports of goods in the 2017 year totalized 2,4 billion US dollars, more with 18,6% than in 2016.
The exports of goods in the European Union (EU-28) countries totaled 1,6 billion US dollars (with 19,9% more than 2016), with a share of 65,8% in total exports (65,1% – in 2016).
CIS countries were present in the exports of the Republic of Moldova with a share of 19,1% (20,3% – in the 2016), which corresponds to a value of 462,9 million US dollars. Exports of goods to these countries increased with 11,8% compared with the 2016 year.
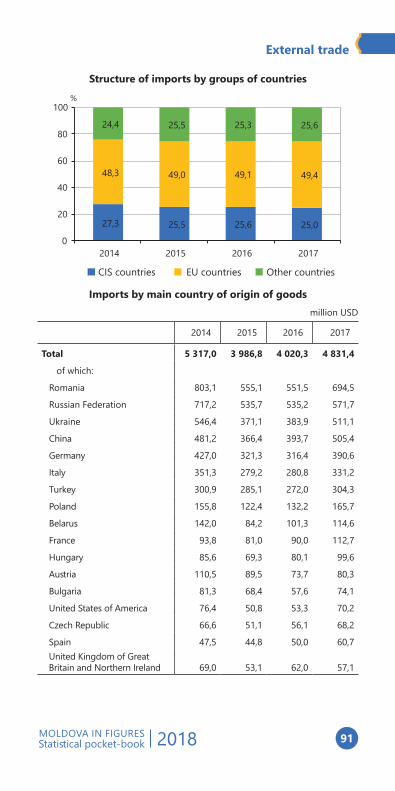
Imports of goods in 2017 the totalized 4,8 billion US dollars, more with 20,2% compared to 2016.
The imports of goods from the countries of the European Union (EU-28) amounted to 2,4 billion US dollars (with 21,1% more than in 2016), with a share of 49,4% in the total of imports (49,1% – in 2016).
The imports of goods from CIS countries registered 1,2 billion US dollars (with 17,4% more than in 2016), which is 25,0% of total imports (25,6% – in 2016).
External trade of goodsmillion USD
2014 2015 2016 2017
Exports – total 2 339,5 1 966,8 2 044,6 2 425,1of which:
CIS countries 735,6 492,3 414,2 462,9European Union countries 1 246,0 1 217,6 1 331,9 1 596,9other countries 357,9 256,9 298,5 365,3
Imports – total 5 317,0 3 986,8 4 020,3 4 831,4of which:
CIS countries 1 449,3 1 018,1 1 027,4 1 206,1European Union countries 2 567,7 1 954,3 1 973,7 2 389,1other countries 1 300,0 1 014,4 1 019,2 1 236,2
Trade balance – total -2 977,5 -2 020,0 -1 975,7 -2 406,3of which:
CIS countries -713,7 -525,8 -613,2 -743,2European Union countries -1 321,7 -736,7 -641,8 -792,2other countries -942,1 -757,5 -720,7 -870,9
Level of coverage of imports by exports – total, % 44,0 49,3 50,9 50,2
of which: CIS countries 50,8 48,4 40,3 38,4European Union countries 48,5 62,3 67,5 66,8other countries 27,5 25,3 29,3 29,5

External trade
89MOLDOVA IN FIGURESStatistical pocket-book 2018
Trends of external trade of goodsmillion USD
2339,51966,8 2044,6
2425,1
5317,0
3986,8 4020,3
4831,4
-2977,5
-2020,0 -1975,7-2406,3
-4000
-2000
0
2000
4000
6000
2014 2015 2016 2017
Exports Imports Trade balance
Value indices of external trade of goods (previous year = 100)
2014 2015 2016 2017
Exports – total 96,3 84,1 104,0 118,6
of which:
CIS countries 79,7 66,9 84,1 111,8
European Union countries 109,6 97,7 109,4 119,9
other countries 97,3 71,8 116,2 122,4
Imports – total 96,8 75,0 100,8 120,2
of which:
CIS countries 86,7 70,3 100,9 117,4
European Union countries 103,9 76,1 101,0 121,1
other countries 96,4 78,0 100,5 121,3

External trade
90 MOLDOVA IN FIGURESStatistical pocket-book 2018
Structure of exports by group of countries
31,4 25,0 20,3 19,1
53,3 61,9 65,1 65,8
15,3 13,1 14,6 15,1
0
20
40
60
80
100
2014 2015 2016 2017
%
CIS countries EU countries Other countries
Exports by main countries of destination of goodsmillion USD
2014 2015 2016 2017
Total 2 339,5 1 966,8 2 044,6 2 425,1
of which:
Romania 434,0 446,4 513,0 600,6
Russian Federation 423,7 240,6 233,2 254,5
Italy 243,4 197,0 197,8 236,0
Germany 137,5 117,2 126,6 166,1United Kingdom of Great Britain and Northern Ireland 108,2 138,2 114,3 136,1
Belarus 134,7 131, 6 103,5 110,1
Turkey 104,7 64,4 61,5 104,1
Poland 64,4 68, 5 73,4 102,9
Bulgaria 37,9 28,2 76,0 78,1
Ukraine 109,2 45,8 49,7 65,5
France 37,6 43,1 44,7 50,8
External trade
91MOLDOVA IN FIGURESStatistical pocket-book 2018
Structure of imports by groups of countries
27,3 25,5 25,6 25,0
48,3 49,0 49,1 49,4
24,4 25,5 25,3 25,6
0
20
40
60
80
100
2014 2015 2016 2017
%
CIS countries EU countries Other countries
Imports by main country of origin of goodsmillion USD
2014 2015 2016 2017
Total 5 317,0 3 986,8 4 020,3 4 831,4
of which:
Romania 803,1 555,1 551,5 694,5
Russian Federation 717,2 535,7 535,2 571,7
Ukraine 546,4 371,1 383,9 511,1
China 481,2 366,4 393,7 505,4
Germany 427,0 321,3 316,4 390,6
Italy 351,3 279,2 280,8 331,2
Turkey 300,9 285,1 272,0 304,3
Poland 155,8 122,4 132,2 165,7
Belarus 142,0 84,2 101,3 114,6
France 93,8 81,0 90,0 112,7
Hungary 85,6 69,3 80,1 99,6
Austria 110,5 89,5 73,7 80,3
Bulgaria 81,3 68,4 57,6 74,1
United States of America 76,4 50,8 53,3 70,2
Czech Republic 66,6 51,1 56,1 68,2
Spain 47,5 44,8 50,0 60,7United Kingdom of Great Britain and Northern Ireland 69,0 53,1 62,0 57,1


Trade and market services

Trade and market services
94 MOLDOVA IN FIGURESStatistical pocket-book 2018
Turnover in trade and market services
Million lei Previous year = 100
2016 2017 2016 2017
Turnover for enterprises with the main activity in:
retail trade (except trade of motor vehicles and motorcycles) 43 647,9 44 006,3 101,1¹ 95,61
market services rendered to the population 14 713,0 16 105,7 100,6¹ 99,91
wholesale trade and retail, maintenance and repair of motor vehicles and motorcycles 7 484,1 8 474,0 120,6² 113,22
wholesale trade (except trade of motor vehicles and motorcycles 76 942,0 92 264,9 103,0² 119,92
market services rendered to enterprises 36 838,3 40 317,4 101,9² 109,42
1 Comparable prices2 Current prices

Finance

Finance
96 MOLDOVA IN FIGURESStatistical pocket-book 2018
National public budget
2014 2015 2016 2017
Revenues:
total, million lei 42 446,8 43 681,1 45 953,9 53 379,4
in % to GDP 37,9 35,6 33,9 35,5
Expenditures:
total, million lei 44 393,1 46 395,8 48 462,6 54 524,1
in % to GDP 39,6 37,9 35,8 36,3
Surplus (+), deficit (-):
total, million lei -1 946,3 -2 714,7 -2 508,7 -1 144,7
in % to GDP -1,7 -2,2 -1,9 -0,8
The credit balance in economy, end-yearmillion lei
2014 2015 2016 2017
The credit balance – total 41 273,0 42 720,9 39 455,2 38 111,9
short-term loans 3 409,4 3 149,4 2 759,3 2 480,3
middle and long-term loans 37 863,6 39 571,5 36 695,9 35 631,6
Source: National Bank of Moldova


NATIONAL BUREAU OF STATISTICS OF THE REPUBLIC OF MOLDOVAMD-2019 Chisinau, 106 Grenoble Str.Tel.: +373 22 403 000, +373 22 403 070
Fax: +373 22 226 146e-mail: [email protected]
http://www.statistica.md

NATIONAL BUREAU OF STATISTICS OF THE REPUBLIC OF MOLDOVA
MD-2019 Chisinau, 106 Grenoble Str.Tel.: +373 22 403 000, +373 22 403 070
Fax: +373 22 226 146e-mail: [email protected]
http://www.statistica.md