Embed Size (px)
Citation preview

Erik Foltz, Max Zamzow, and Dayton Ramirez
The Madison Group www.madisongroup.com
Moldflow Summit 2017
Bend, Don’t Break When Processing Long-Fiber Thermoplastic Resins

Madisongroup.com
An Independent Plastic Consulting Firm
Founded in 1993
Located in Madison, WI
Helping Clients Optimize the Performance of Their Part Designs
The Madison Group

Madisongroup.com
Material Engineering
Material Selection
Product Design Evaluation
Structural FEA
Mechanical and Thermal Material Characterization
Aging and Compatibility
Product and Life Time Analysis
The Madison Group
25.00°C599.5kPSI
60.00°C379.1kPSI
60.13°C
heat at 2°C/min to 150°C25 um at 1 Hzdual cantilever
0.06
0.08
0.10
0.12
Tan D
elta
5
10
15
20
25
30
35
Loss M
odulu
s (
kP
SI)
0
200
400
600
800
Sto
rage M
odulu
s (
kP
SI)
0 20 40 60 80 100 120 140 160
Temperature (°C)
Sample: SPP3A30HBBKSize: 35.0000 x 12.5300 x 2.6300 mm DMA
File: T:\_DMA\2012\ENB014826P.401Operator: MKKInstrument: DMA Q800 V20.9 Build 27
Universal V4.5A TA Instruments

Madisongroup.com
Processing Analysis:
Moldflow Analysis
Injection Molding
Compression Molding
Thermoset and Thermoplastic
Physical DOE Set Up and Analysis
Process Capability
Product Qualification
The Madison Group

Madisongroup.com
Failure Analysis
Determination of Root Cause
Failure Type Assessment
Fractography
Destructive and Non-Destructive
On-site Support
The Madison Group

Long-Fiber Thermoplastics

Madisongroup.com
When Selecting Material Need to Consider:
Performance Requirements (Lifetime, Temperature, Stresses, Strains)
Part Design
Environment
Cost
Material Selection
Madisongroup.com
Metal to Plastic Conversion
First Criteria of Material Selection is a Good Understanding of the Expected Performance Criteria of the Part

Madisongroup.com
Material Selection
Then it is Important to Understand Different Material Options

Madisongroup.com
Material Additives
Add Fillers to Improve the Properties of the Base Resin
Filler A/R Types
Sphere 1 Talc
Plate /Flake 20-200 Mineral
Needle 5-20 Milled Glass
Fiber 20-200+ Glass Fibers, Carbon
Fibers, Long Fibers

Madisongroup.com
Metal to Plastic Conversion
Less Dimensional Stability
Temperature Has Greater Role on Performance
Need to Consider the Effects of Time
(Creep or Stress Relaxation)
Improved Corrosion Resistance
Ability to Net Form Final Shape
Part Consolidation
Eliminate Secondary Operations
Reduced Part Weight and Cost

Madisongroup.com
Long-Fiber Thermoplastic Composites
Development of Discontinuous Fiber Reinforced Thermoplastic Composites Have Increased the Opportunity for Thermoplastic Resins
PP
PA6
PA66
TPU
Introduction of Long Fibers Allows for Improvements of:
Young’s Modulus
Tensile Strength
Impact Strength
Creep/ Fatigue Performance

Madisongroup.com
Long Fiber Thermoplastic Composites
Examination of Datasheet Values Suggest that the Short-Term Performance of Long Glass Fiber Composites Approaches that of Traditional Materials
Modulus Ultimate Tensile Strength
6061 T6 Aluminum 68.9 GPa 310 MPa
60% Long Glass Fiber PA66 21.37 GPa 262 MPa

Madisongroup.com
Potential of Achieving Datasheet Values
Potential for achieving datasheet
properties is limited
Madisongroup.com
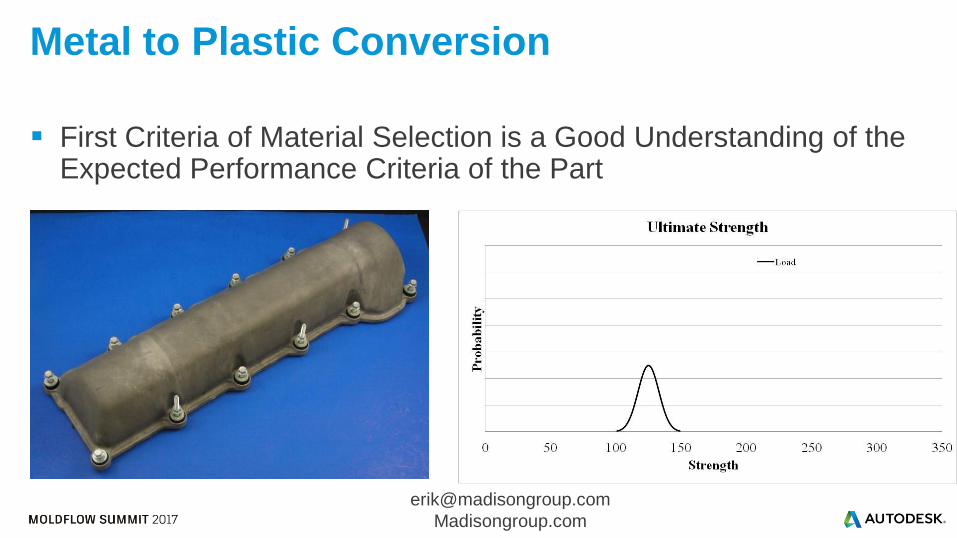
Role of Fiber Orientation on Performance Longitudinal
Transverse
Flow
direction

Madisongroup.com
Role of Fiber Length on Performance
• In addition to the Orientation of the Fibers in Molded Part, the Length of the Fibers Also Influences the Performance of the Molded Part
• Short Fiber – 300 -1000 µm
• Long Fiber – 1 mm – 50 mm
• Fiber Length has a Significant Influence on:
• Impact Strength
• Young’s Modulus
• Tensile Strength

Madisongroup.com
Role of Fiber Length on Performance
Matrix Glass Fiber
(Weight %)
Specific
Gravity
Tensile
Strength
(103 psi)
Tensile
Modulus
(106 psi)
Flexural
Modulus
(106 psi)
Impact
Strength
(ft. lb/in)
Polyester SMC
(Compression Molded)
30 1.85 12.0 1.70 1.60 16.0
Polyester BMC
(Compression Molded)
22 1.82 6.0 1.75 1.58 4.3
Nylon 6
(Injection Molded)
30 1.37 23.0 1.05 1.20 2.3
Polyester (PBT)
(Injection Molded)
30 1.52 19.0 1.20 1.40 1.8

Madisongroup.com
Long-Fiber Thermoplastic Processing
Another Advantage of Long-Fiber Thermoplastic Resins is the Use of Traditional Manufacturing Methods to Mass Produce Components
Extrusion (1- 20 mm Long Fibers)
Injection Molding (1- 12 mm Long Fibers)
Compression Molding (12 mm to 50 mm Long Fibers)

Madisongroup.com
Final Fiber Length Distribution In Part
Fiber Length in Molded Part is Substantially Shorter
Sample
Location
Number Average Fiber
Length Ln [mm]
Location 1 0.322
Location 3 0.299
Location 4 0.340
4
3
2
1
Gate

Madisongroup.com
Critical Fiber Length
In Order to Benefit from the Incorporation of Discontinuous Fibers, a Critical Length Must Be Attained
Otherwise Fibers Act as Inclusion and Stress Concentrators
Based on Several Factors
Polymer Matrix
Fiber Sizing
Type of Fiber
Critical Fiber Length for PP is:
1.3 mm for Uncoupled
0.9 mm for Chemically Coupled

Fiber Breakage

Madisongroup.com
Fiber Breakage Sources
Three Primary Sources for Fiber Breakage During Injection Molding
Fiber – Fiber Interaction
Fiber – Wall Interaction
Fiber – Matrix Interaction

Madisongroup.com
Fiber Breakage Sources
These Conditions Are Most Predominant When There are Contractions in Flow
DSM Design Guide

Madisongroup.com
Fiber Length Distribution In Molded Part
Fiber Length Distribution in Molded Part is Representative of a Weibull Distribution with a Bias Toward Shorter Fibers
Initial Fiber Length – 12 mm
Phelps et al Composites: Part A 51 (2013) 11-21

Madisongroup.com
Fiber Length Distribution Nomenclature
Two Predominate Ways of Describing Length of Fibers In Final Molded Part
Number Average – Average Length Based on Number of Fibers
Weight Average – Average Length Based on Total Weight

Madisongroup.com
Fiber Length Distribution Nomenclature
• Number averaged length ≤ weight averaged length

Fiber Breakage Model

Madisongroup.com
Fiber Breakage Model
Autodesk Moldflow Implemented Fiber Breakage Model Based on Hydrodynamic Loading of Fiber (Fiber Matrix Interaction)
Fiber Break Due to Buckling Load From Differences in Velocity
Fi
Fi

Madisongroup.com
Fiber Breakage Model: Critical Load
http://help.autodesk.com/view/MFIA/2017/ENU/?guid=GUID-4FBB0674-91DE-
415D-AE64-D230656C98AB
Fibers Will Break When Hydrodynamic Forces Exceed Critical Buckling Force
Based on Eulerian Buckling Conditions

Madisongroup.com
Fiber Breakage Model
Therefore, Fiber Breakage Is Dependent on Aligning the Orientation of the Fibers With Critical Hydrodynamic Forces
Need Probability Equations for When Critical Loading Condition and Fiber Orientation Coincide
Phelps et al Composites: Part A 51 (2013) 11-21

Madisongroup.com
Fiber Breakage Model: Probability Function
For a Single Fiber, the Probability of Breaking Under the Hydrodynamic Forces can be Expressed as:
Phelps et al Composites: Part A 51 (2013) 11-21
Shear Rate
Constant
Maximum Shear Rate
Hydrodynamic Force Ratio

Madisongroup.com
Fiber Breakage Model: Child Fiber Generation
L = Initial fiber length
N(l,t) = Number of fibers with length l at time t
P(l) = Scalar probability function of fiber length l
R(l,l’) = Probability function of fiber length and fiber breakage to form a fiber length l’ (where l’<l)
Phelps et al Composites: Part A 51 (2013) 11-21
*Can be expressed as a Gaussian breakage profile
Loss of
fibers by
breaking
Gain of fibers
due to
breakage at l’

Madisongroup.com
Fiber Breakage Model: Child Fiber Generation
Probability of the Breaking Fiber to Break into Different Length Child Fibers
Assumes Highest Probability Will Result in Fiber Breaking in Half
Phelps et al Composites: Part A 51 (2013) 11-21

Madisongroup.com
Fiber Breakage Model: Model Parameters
Model Consists of Three Parameters:
ζ Influences Minimum Fiber Length for Breakage
Cb Controls the Probability of Fiber Breakage
S Controls How the Parent Fiber Breaks into Children Fibers
Additionally, User Can Provide Fiber Length Distribution at the Inlet Location

Madisongroup.com
Fiber Breakage Model: Parameters
ζ Influences Minimum Fiber Length for Breakage
Cb Controls the Probability of Fiber Breakage
S Controls How the Parent Fiber Breaks into Children Fibers
Phelps et al Composites: Part A 51 (2013) 11-21

Madisongroup.com
Fiber Breakage Model: Parameters
ζ Influences Minimum Fiber Length for Breakage
Cb Controls the Probability of Fiber Breakage
Also Time to Reach Steady Stat
S Controls How the Parent Fiber Breaks into Children Fibers
Phelps et al Composites: Part A 51 (2013) 11-21

Madisongroup.com
Fiber Breakage Model: Results
Simulation Can Provide Information on:
Number Average or Weight Average Fiber Length

Madisongroup.com
Fiber Breakage Model: Results
Simulation Can Provide Information on:
Number Average or Weight Average Fiber Length
Fiber Length Probability Distribution

Madisongroup.com
Fiber Breakage Model: Results
Simulation Can Provide Information on:
Number Average or Weight Average Fiber Length
Fiber Length Probability Distribution
Linear Elastic Composite Properties

Madisongroup.com
Fiber Properties
Simulation Can Provide Information on:
Number Average or Weight Average Fiber Length
Fiber Length Probability Distribution
Linear Elastic Composite Properties
In order to Get Good Mechanical Characterization, Need to Have Good Filler Characterization
Also, Need to Obtain Good Fiber Orientation

Fiber Breakage Correlation

Madisongroup.com
Fiber Breakage Study
Goal: Correlate the Fiber Length Model to Molded Parts
Geometry: Modified Tensile Bar
Material: 30%wt Chemically Coupled Long Glass-Reinforced PP
Initial Fiber Length 10 mm
Injection Molded
Tunnel Gate into End of Bar
Varied Gate Size and Fill Time

Madisongroup.com
Fiber Breakage Study
Performed Correlation Studies at Three Locations per Bar
Gate
Mid
End

Madisongroup.com
Fiber Breakage Study
Performed Baseline Analyses
Assumed all Fibers were 10 mm in Length
Ran Simulations with:
Midplane and Full 3D
Beam Elements for Runners
Fill Parameters:
Gate Size 0.040” and 0.70 second Fill Time
Gate Size 0.015” and 0.40 second Fill Time

Madisongroup.com
Fiber Breakage Study
Solver Gate Fill Time Gate
(Number Average)
Middle
(Number Average)
End
(Number Average)
Midplane 0.040” 0.70 second 6.73 6.98 7.63
Midplane
0.015” 0.40 second 6.68 6.91 7.42
3D 0.040” 0.70 second 0.78 1.24 1.29
3D 0.015” 0.40 second 0.78 0.91 0.93

Fiber Measurement
Madisongroup.com
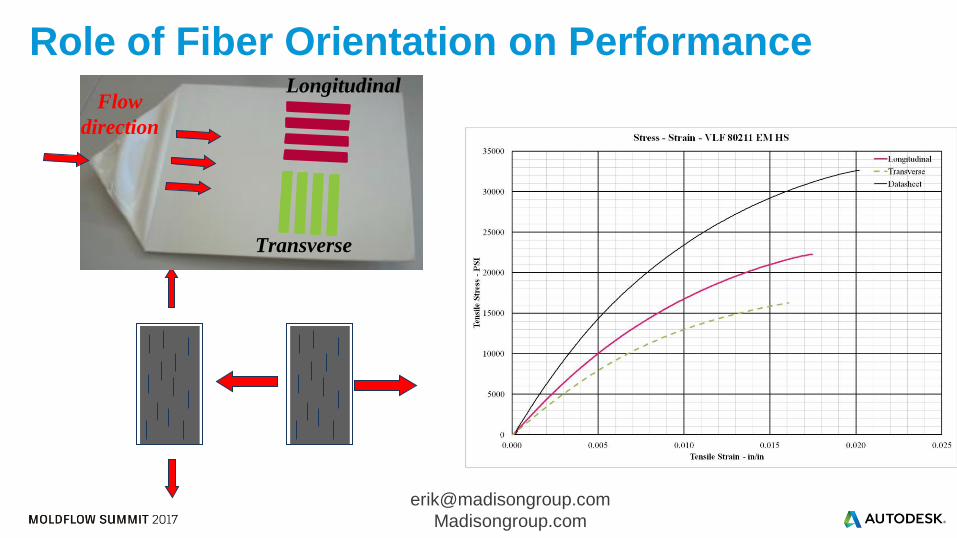
Fiber Measurement
Digital Image Fiber Dispersion Matrix Removal
15 mm
Down-Sampling
10 mm
1. Sample Preparation
Goris, Osswald 2017

Madisongroup.com
Fiber Measurement
Image Enhancement and
Thresholding Automatic Fiber Detection Data Analysis
0.0
0.1
0.2
0.3
0.4
0.5
0.5 2 3.5 5 6.5 8 9.5
Rela
tive
Fre
qu
en
cy [-]
Fiber Length [mm]
2. Image Processing
Goris, Osswald 2017

Madisongroup.com
Fiber Measurement
Goris, PEC
Illustration of dispersed fibers (approx. 7,500 fibers per scanned image)
Goris, Osswald 2017

Madisongroup.com
Fiber Breakage Study: Measurements
Solver Gate Fill Time Gate
(Number Average)
Middle
(Number Average)
End
(Number Average)
Midplane 0.040” 0.70 second 6.73 6.98 7.63
Midplane
0.015” 0.40 second 6.68 6.91 7.42
3D 0.040” 0.70 second 0.78 1.24 1.29
3D 0.015” 0.40 second 0.78 0.91 0.93
Measured 0.040” 0.70 second 0.52 0.51 N/A
Measured 0.015” 0.40 second 0.43 0.38 N/A
Madisongroup.com
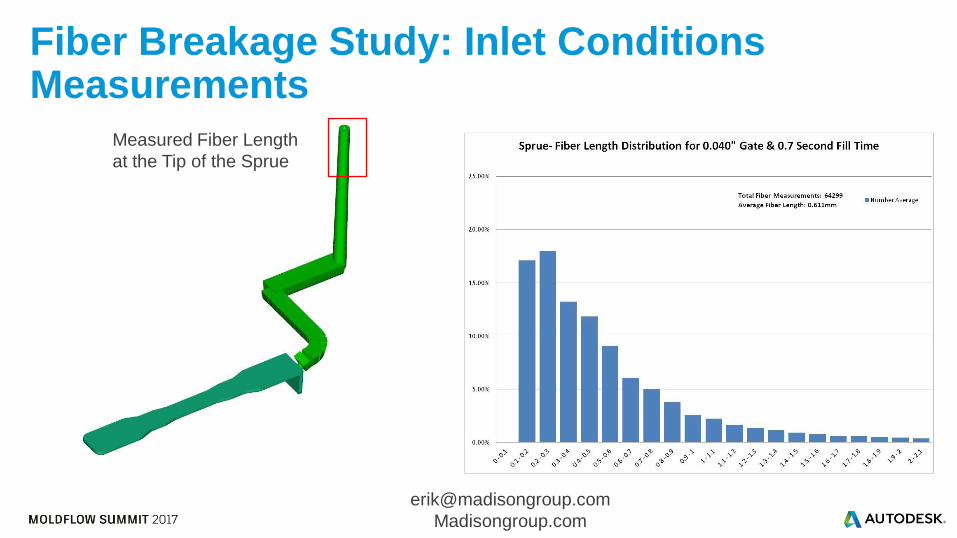
Fiber Breakage Study: Inlet Conditions Measurements
Measured Fiber Length
at the Tip of the Sprue

Madisongroup.com
Fiber Breakage Study: Measurements With Inlet
Solver Gate Fill Time Gate
(Number Average)
Middle
(Number Average)
End
(Number Average)
Midplane 0.040” 0.70 second 6.73 [1.44] 6.98 [1.47] 7.63 [1.51]
Midplane
0.015” 0.40 second 6.68 [1.43] 6.91 [1.46] 7.42 [1.50]
3D 0.040” 0.70 second 0.78 [0.48] 1.24 [0.54] 1.29 [0.55]
3D 0.015” 0.40 second 0.78 [0.45] 0.91 [0.53] 0.93 [0.53]
Measured 0.040” 0.70 second 0.52 0.51 N/A
Measured 0.015” 0.40 second 0.43 0.38 N/A
Madisongroup.com
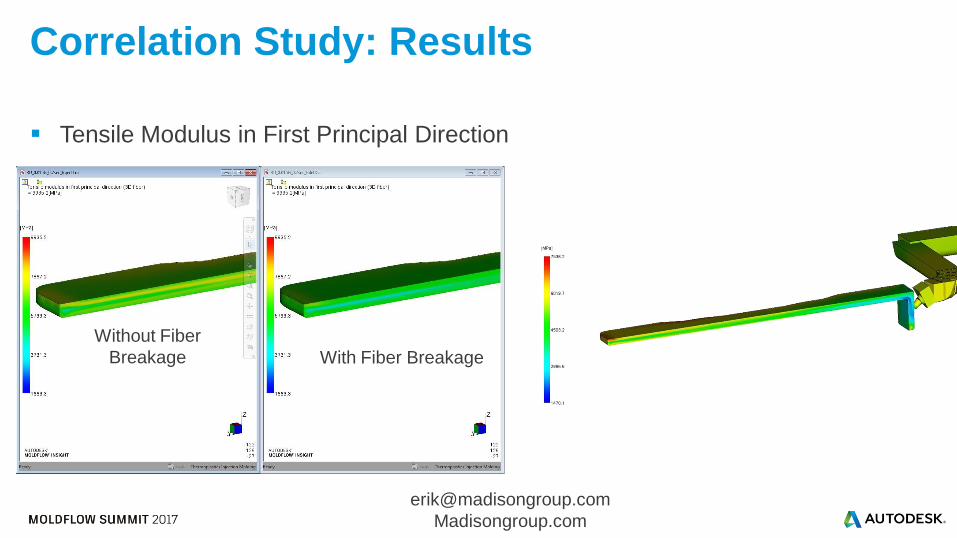
Correlation Study: Results
Tensile Modulus in First Principal Direction
Without Fiber
Breakage With Fiber Breakage

Madisongroup.com
Predicted Mechanical Properties With and Without Fiber Breakage Implemented Tensile Modulus in First Principal Direction
0.040” Diameter Gate; 0.70 sec. Fill Time
Without Fiber Breakage 0.040” Diameter Gate; 0.70 sec. Fill Time
With Fiber Breakage

Madisongroup.com
Predicted Fiber Orientation With and Without Fiber Breakage Implemented Fiber Orientation Prediction is the Same
With and Without Fiber Breakage
Therefore, Differences are a Result of Fiber Breakage
0.040” Diameter Gate; 0.70 sec. Fill Time
With Fiber Breakage

Madisongroup.com
Conclusion
When Selecting Discontinuous Glass-Reinforced Composites it is Important to Account for the Effects of Processing on the Performance of the Material
Fiber Orientation
Fiber Length
Fiber Breakage Code Can Provide a Indications of Fiber Length Trends
How the Melt is Prepared is More Critical than Gate Design and Sizing for Maintaining Fiber Length
A Method of Measuring a Large Number of Fibers in Different Areas Has Been Developed to Characterize the Fiber Length Distribution

Madisongroup.com
Acknowledgements
Max Zamzow, Dayton Ramirez, Matt Dachel and TMG Colleagues
Sebastian Goris, Sara Simon
Michael Miller
RTP for Resin