Embed Size (px)
Citation preview

UNIVERSITÉ DU QUÉBEC
INSTITUT NATIONAL DE LA RECHERCHE SCIENTIFIQUE
CENTRE – URBANISATION CULTURE SOCIÉTÉ
AN EXAMINATION OF CHILD PEDESTRIAN SAFETY: CROSSING BEHAVIORS, ROAD ENVIRONMENT, AND RULE COMPLIANCE NEAR
PARKS IN MONTREAL, CANADA
Par
Mojgan RAFIEI
Maîtrise en étude urbaines
Mémoire présenté pour obtenir le grade de
Maître ès sciences, M.Sc.
Maîtrise en études urbaines
Programme offert conjointement par l’INRS et l’UQAM
Août 2018
© Mojgan RAFIEI, 2018

Ce mémoire intitulé
AN EXAMINATION OF CHILD PEDESTRIAN SAFETY: CROSSING BEHAVIORS, ROAD ENVIRONMENT, AND RULE COMPLIANCE NEAR
PARKS IN MONTREAL, CANADA
et présenté par
Mojgan RAFIEI
a été évalué par un jury composé de
Mme Marie-Soleil CLOUTIER, directrice de recherche, Institut national de la recherche scientifique
Mme Pham HIEN, examinatrice interne, UQAM
Mme Mariana BRUSSONI, examinatrice externe, UBC

To my family, who have made me stronger and more fulfilled; love you to the moon and back.

iii
ABSTRACT
In the past decades, physical activity of children has declined due to many reasons, such as unsafe
roads, which can negatively influence parents’ attitudes toward allowing their children to spend
time outdoors. Urban parks, as natural and outdoor places, can promote children’s physical activity
and psychological health. However, child pedestrians' safety on roads next to parks has not been
fully investigated. In order to fill this research gap, this study examines child pedestrians' safety
considering four rule compliance measures: temporal, spatial and velocity compliance and visual
search.
We employed a naturalistic approach to observe behaviors, road environment, and car interaction
while children were crossing roads near parks. In this study, street crossings of 731 children were
observed at 17 crosswalks around four parks in Montreal, Canada in the summer of 2017. Then,
Chi-square tests were used to verify if the individual, situational, behavioral, and road environment
characteristics are significantly associated with rules compliance. These characteristics were
explored through mixed-effect logistic regression with the same set of independent variables.
Our results showed that parental close supervision, stopping at the curb before crossing, and the
pedestrian countdown display had positive association with rule compliance. Moreover, about 50%
of children started crossing at the same time as the adult companion. In the remaining group, more
rule violations were observed when the adult initiated the crossing. As for effects of vehicles
interacting with child pedestrians, a mixed impact on four rule compliance was observed: more
spatial compliance and visual search, but less temporal and velocity compliance.
The current study outcomes can be used to provide safer road environment near urban parks. In
this regard, longer crossing signal and pedestrian countdown display at traffic lights are quite
advantageous.
Keywords: road traffic safety, crossing behavior, child pedestrian, rule compliance, intersection,
urban parks

iv
RÉSUMÉ
L'activité physique des enfants a diminué dans la dernière décennie pour de nombreuses raisons,
notamment les routes dangereuses qui empêchent les parents de laisser leurs enfants jouer à
l’extérieur. En parallèle, nous savons que les parcs urbains peuvent promouvoir l’activité physique
et la santé mentale des enfants. Pourtant, peu de travaux de recherche se sont intéressés à la
sécurité routière des enfants piétons à proximité des parcs. C’est pourquoi la présente étude
examine leur sécurité en tenant compte de la conformité aux règles relatives aux piétons.
L’approche naturaliste a été adoptée afin d’observer les comportements des enfants,
l'environnement routier et les interactions avec les voitures durant la traversée. Les tests Khi-deux
ont été réalisés pour mettre en évidence les caractéristiques individuelles, situationnelles,
comportementales et de l’environnement routier associées à la conformité aux règles. Ces
caractéristiques ont été analysées à l’aide des modèles de régression logistique à effets mixtes.
Les résultats ont montré que la supervision des adultes, s'arrêter au bord du trottoir avant de
traverser et la présence d'un compte à rebours sont positivement associées à la conformité aux
règles. Environ 50% des enfants ont commencé à traverser en même temps que le compagnon
adulte. Dans le groupe restant, plus de violations de règles ont été observées lorsque l'adulte a
initié la traversée. L’interaction piéton-voiture a eu un impact mitigé sur la conformité aux quatre
règles, ce qui a eu pour effet d’améliorer la conformité spatiale et la recherche visuelle, mais de
réduire la conformité temporelle ainsi que la vélocité.
Nos résultats pourraient être utiles pour les municipalités désirant améliorer la sécurité des enfants
autour des parcs urbains. À ce titre, allonger les temps de traversée et ajouter des décomptes
numériques aux intersections avec feux semblent avoir un effet positif en ce sens.
Mots-clés : sécurité routière, comportement de traversée, conformité des enfants piétons,
intersections, parcs urbains.

v
ACKNOWLEDGEMENTS
First of all, I would like to appreciate my supervisor, Professor Marie-Soleil Cloutier for her
motivation, knowledge, patience, and academic and financial supports. She helped me during
every single stage of my thesis which could not come to end without her everyday support. I learnt
a lot from her valuable comments and informative discussions. I also appreciate her for letting me
attend two conferences that gave me many opportunities.
I acknowledge LAPS for providing me a peaceful atmosphere and great tools for conducting a
productive research. Moreover, my deep thanks go to my fellow lab mates at LAPS, especially
Wiem for all her helps, supports, and helpful discussions. I acknowledge INRS for the financial
support and the great Professors and employees, especially Wassila Foul and Marie-Ève Dugas.
Finally, I sincerely thank my dear father, mother, each of my sisters, and my brother for their
encouragement and supports throughout my life. I especially thank Rezvan, her spouse Alireza,
my nephew Radeen, my friends Amir, Youssef, and all other people helped me during these years.

vi
TABLE OF CONTENTS
List of tables .............................................................................................................................. x
List of figures ............................................................................................................................. x
List of abbreviations ............................................................................................................... xii Introduction ............................................................................................................................... 1
CHAPTER 1: Background: children active transportation, safety, and importance of urban parks .......................................................................................................................................... 3
1.1 Road insecurity and decline in children active transportation ............................................. 3
1.2 Safety concept and unintentional injuries ........................................................................... 4
1.2.1 Safety concept ............................................................................................................. 4
1.2.2 Unintentional Injuries (UI) in children ........................................................................... 6
1.3 Urban parks and children’s safety ...................................................................................... 7
1.3.1 Safe route to parks for children .................................................................................... 8
1.4 Research question and conceptual framework ................................................................... 9
CHAPTER 2: Literature review: child pedestrian injuries and rule compliance .................. 11
2.1 Factors influencing child pedestrian injury ........................................................................ 11
2.1.1 Individual demographics: children’s age and gender ................................................. 11
2.1.2 Situational Characteristics while walking/crossing as a pedestrian ............................ 13
2.1.3 Behavior characteristics ............................................................................................. 16
2.1.4 Road environment characteristics .............................................................................. 19
2.2 Pedestrian rule compliance .............................................................................................. 22
2.2.1 Temporal crossing compliance (compliance with signal timing at signalized
intersections) ...................................................................................................................... 23
2.2.2 Spatial compliance (crossing in/at the crosswalk) ...................................................... 23
2.2.3 Velocity (crossing speed) ........................................................................................... 24
2.2.4 Visual search (before crossing) ................................................................................. 24
CHAPTER 3: Methodology ...................................................................................................... 26
3.1 Operative framework ........................................................................................................ 26
3.2 Selection of study areas ................................................................................................... 27

vii
3.2.1 Park selection ............................................................................................................ 28
3.2.2 Selection of intersections and crosswalks .................................................................. 31
3.3 Creation of the data collection tools: Direct observation of child pedestrian behavior while
crossing ................................................................................................................................. 40
3.3.1 Individual and situational factors ................................................................................ 40
3.3.2 Behavioral factors ...................................................................................................... 41
3.3.3 Observation grid for road environment ....................................................................... 42
3.3.4 Observation form for vehicle-pedestrian interactions ................................................. 43
3.4 Data collection ................................................................................................................. 44
3.5 Data (re)coding and analysis ............................................................................................ 45
3.5.1 Independent variables ............................................................................................... 46
3.5.2 Dependent variables .................................................................................................. 47
3.5.3 Statistical analyses .................................................................................................... 48
CHAPTER 4: Results: an examination of child pedestrian rule compliance at crosswalks around parks in Montreal, Canada ......................................................................................... 51
4.1 Abstract ............................................................................................................................ 52
4.2 Introduction ...................................................................................................................... 53
4.3 Factors associated with child pedestrian safety and compliance ...................................... 54
4.3.1 Individual characteristics ............................................................................................ 54
4.3.2 Situational characteristics .......................................................................................... 54
4.3.3 Behavioral characteristics .......................................................................................... 55
4.3.4 Road environment characteristics .............................................................................. 55
4.4 Methods ........................................................................................................................... 57
4.4.1 Site selection ............................................................................................................. 57
4.4.2 Observation protocol.................................................................................................. 58
4.4.3 Crosswalks characteristics ........................................................................................ 58
4.4.4 Retained individual, situational, and behavioral categories ........................................ 61
4.5 Rule compliance .............................................................................................................. 62

viii
4.6 Statistical analyses........................................................................................................... 63
4.7 Results ............................................................................................................................. 64
4.7.1 Bivariate analysis ....................................................................................................... 64
4.7.2 Mixed-effects logistic models ..................................................................................... 67
4.8 Discussion ....................................................................................................................... 69
4.8.1 Age: the only significant individual factor ................................................................... 69
4.8.2 Adult companion and car interaction affect child pedestrians rule compliance ........... 69
4.8.3 Stopping at the curb and looking at road-related elements: two significant factors before
crossing .............................................................................................................................. 70
4.8.4 Road elements: many significant factors.................................................................... 70
4.8.5 What role for the park as a destination ...................................................................... 71
4.9 Conclusion ....................................................................................................................... 71
CHAPTER 5: Discussion ......................................................................................................... 73
5.1 Age category: the only significant individual factor ........................................................... 73
5.2 Adult companion and car interaction affects child pedestrians rule compliance ................ 73
5.3 Stopping at the curb and looking at road-related elements: two significant factors before
crossing ................................................................................................................................. 74
5.4 Road elements: many significance factors ....................................................................... 74
5.5 What role for the park as destination? .............................................................................. 75
5.6 Limitation of the study ...................................................................................................... 76
Conclusion ............................................................................................................................... 77
Appendix 1: Behavior observation form ................................................................................ 78
Appendix 2 : Road environment observation form ............................................................... 80
Appendix 3 : Vehicle interaction observation form ............................................................... 82
Appendix 4 : Synthése du mémoire en francais.................................................................... 83
Introduction ............................................................................................................................ 83
Méthodologie ......................................................................................................................... 86
Résultats ................................................................................................................................ 90
Discussion ............................................................................................................................. 95

ix
Conclusion ............................................................................................................................. 96
References ............................................................................................................................... 98

x
LIST OF TABLES
Table 3.1 Typology of urban parks on the island of Montreal .............................................. 28
Table 3.2 Summary of selected crosswalks around parks ................................................... 31
Table 3.3 Composite variables of rule compliance ............................................................... 48
Table 3.4 Retained independent variables in the multivariate model .................................. 50
Table 4.1 Crossing characteristics and number of crosswalks ........................................... 59
Table 4.2 Retained individual, situational and behavioral categories ................................. 62
Table 4.3 Number and percentage of outcomes for rule compliance indicators ................ 63
Table 4.4 Descriptive statistics ............................................................................................... 66
Table 4.5 Mixed-effects logistic models of rule compliance (Odds ratios) .......................... 68
LIST OF FIGURES
Figure 1.1 Two dimensions of safety ....................................................................................... 4
Figure 1.2 Two links between safety and health of children .................................................. 5
Figure 1.3 The system approach to road safety ...................................................................... 6
Figure 1.4 Operative framework employed in the current study .......................................... 10
Figure 2.1 Conceptual model of child pedestrian safety with emphasis on the supervision .................................................................................................................................................. 13
Figure 2.2 Levels in pedestrian behavior ............................................................................... 17
Figure 3.1 Operative framework used in the current study .................................................. 26
Figure 3.2 Selected boroughs................................................................................................. 27
Figure 3.3 Different steps in choosing the parks .................................................................. 29
Figure 3.4 Location of Selected Parks ................................................................................... 30
Figure 3.5 Selected crosswalks around Jarry Park ............................................................... 32
Figure 3.6 Selected crosswalks around Jarry Park ............................................................... 33
Figure 3.7 Selected crosswalks around De-Turin Park ......................................................... 34
Figure 3.8 Selected crosswalks around De-Turin Park ......................................................... 35
Figure 3.9 Selected crosswalks around Molson Park ........................................................... 36
Figure 3.10 Selected crosswalks around Molson Park ......................................................... 37
Figure 3.11 Selected crosswalks around Gabriel-Sagard Park ............................................ 38
Figure 3.12 Selected crosswalks around Gabriel-Sagard Park ............................................ 39
Figure 3.13 Individual and Situational factors in observation grid for crossing behavior . 41

xi
Figure 3.14 Behavior factors in observation grid for crossing behavior ............................. 42
Figure 3.15 Road environment characteristics ..................................................................... 43
Figure 3.16 Vehicle-Pedestrian interaction variables ........................................................... 44
Figure 3.17 Observation Zone ................................................................................................ 45
Figure 4.1 Location of selected park in Island of Montreal .................................................. 57
Figure 4.2 Observation protocol for crossing of each child pedestrian .............................. 58

xii
LIST OF ABBREVIATIONS
AMT Agence Métropolitaine de Transport
CCMTA Canadian Council of Motor Transportation Administrators
CMVTC Canadian Motor Vehicle Traffic Collision
CIHR Canadian Institute of Health Research
ESSAIM Environnement scolaire sécuritaire et analyse des interventions municipales
INRS Institut National de la Recherche Scientifique
GP RED GreenPlay Research, Education, and Development
MAPISE la Marche À Pied pour les SEniors
MUTCD Manual on Uniform Traffic Control Devices
NICE National Institute for health and Care Excellence
NRPA National Recreation and Park Association
QHSC Quebec Highway Safety Code
RPP Rosemont-La Petite-Patrie
SAS Statistical Analysis System
SRTP Safe Route to Park
SWOV Institute for Road Safety Research
UI Unintentional Injuries
VRU Vulnerable Road Users
VSP Villeray-Saint Michel-Parc extension
WHO World Health Organization

1
INTRODUCTION
Regular physical activity is necessary for children’s health because it decreases the incidence of
chronic disease and influences children’s energy level. Children with the adequate physical activity
are more likely to have a healthy lifestyle in the future, and its benefits are seen over their lifespan.
For children who live within a reasonable walking distance from a school, park, and playground,
active transport can be a great opportunity for them to have physical activity on a regular basis.
Since the benefits of children’s physical activity affect their lifespan, a decrease in this type of
activity is a major concern for children around the world. However, it was reported by Tremblay,
Brownrigg and Deans (2008) that children and young Canadians spend less time to walk to and
from their destination, such as school, parks, and extracurricular activity spots as significant
sources of physical activity. This is partly attributed to the road safety concerns making the parents
drive them to destinations.
Children are one of the major groups in society that face road risks. According to a Safe Kids
Canada report (2007), one of the most important death causes for children under 14 years old
was pedestrian injuries. More specifically, about 18% of the deaths were for children between five
and nine years old as a result of a collision with motor vehicles. Previous research mainly focused
on the safety of child pedestrians around their schools, as the school was their main destination.
Although parks and playgrounds are also known as frequent destinations for children especially
in urban settings, few studies examined children’s safety on the road around parks.
The current study aims to fill this gap regarding child pedestrian safety via examination of
individual, situational, behavioral and road environment characteristics determining whether
children comply with various road safety rules during street crossings towards parks. Hence, the
overall objective of this study is to examine child pedestrian's safety around parks by considering
four rule compliance measures: temporal, spatial and velocity compliance, and visual search.
This thesis is organized into five chapters. The first chapter explores the basic safety concept,
unintentional injuries (UI) of children, importance of urban parks, and safe routes to parks for
children. This chapter presents various elements including the research question, objectives, and
the conceptual framework. The second chapter explains in more details influential factors on child
pedestrian injury and various pedestrian rules compliance.

2
The third chapter presents the methodological approach used to carry out the present study,
including the study areas, the creation of data collection tools, and the methods of analysis. The
fourth chapter is a manuscript submitted to the Journal of Environmental Psychology which
presents the results of predictive models of rule compliance. Finally, the last chapter includes the
discussion on the results using the factors that could explain child pedestrian compliance with
various road safety measures. This chapter also provides the limitation of the current study and
the conclusion.

3
CHAPTER 1: BACKGROUND: CHILDREN ACTIVE TRANSPORTATION, SAFETY, AND IMPORTANCE OF URBAN PARKS
1.1 Road insecurity and decline in children active transportation
In many developed countries, one hour of physical activity per day has been the suggested norm
for children (Carver, Timperio and Crawford 2008; Tremblay et al. 2016). Since many children
seem to fail to accomplish this daily prescription (Weiler et al. 2014), any opportunity to stay active
should be explored. For instance, time spent outdoors leads to an increase in the regular physical
activity of children, which can decrease the chances of chronic health problems such as obesity
(Bouchard, Blair and Haskell 2007). Sallis et al. (2004) stated that active transportation is another
way of getting those daily minutes of physical activity.
Routine travel in the form of commuting to school offers opportunities for walking at an early age
for students and their parents (Bouchard, Blair and Haskell 2007). However, despite all the
benefits of the physical activity, many parents today drive their children to schools, parks, and
playgrounds (Tremblay, Brownrigg and Deans 2008). This is reflected in recent statistics in
Canada where active transportation decreased from 25% to 19% between 1998 and 2005
(Turcotte 2008). In the Montreal region, a similar decrease in the active transportation from 45%
to 34% between 1993 and 2003 can be seen among of children 6–12 years old (L’Agence
Métropolitaine de Transport 1998,2003).
High traffic-risk perception is one of the reasons leading parents to using other types of
transportation to school for their children (Cloutier, Bergeron and Apparicio 2011), which reduces
children’s opportunities to be physically active. Other examples illustrate this risk perception: in
New Zealand, parents are worried about their children mostly due to the road safety, personal
injuries, stranger danger, and bullying (Carver, Timperio and Crawford 2008). Another study by
Gielen et al. (2004) in Maryland, USA, showed that about 70% of parents limited their children
from playing outdoors because of danger associated with cars and trucks. Furthermore, for most
English children between 9 and 11 years old, the important concern was safety on main roads
(Matthews 1995). To some extent, road insecurity while crossing streets might be a good reason
for parents and children to avoid walking to their destinations for safety reasons, either real or
perceived.

4
1.2 Safety concept and unintentional injuries
1.2.1 Safety concept
According to the first international conference of World Health Organization (WHO) on injury
prevention and control, safety is the control of those hazards leading to physical and psychological
harm in order to preserve individual and community health; all people need safety to achieve their
goals in life (World Health Organization 1989). Following this idea, safety should be seen as a
fundamental human right and should be equal for all individuals and communities (World Health
Organization 1989). In other words, safety as a basic need of humans is a necessity to raise the
level of health and the social welfare of societies (Svanström 1999).
Another concept introduces safety as a dynamic process in terms of safety promotion (Maurice et
al. 1997). The goal of safety promotion is to achieve optimum conditions of safety that are the
ultimate requirement of human beings. Maurice et al. (1997) implied that accidents not only were
not uncontrolled events, but also could be avoided once the risk factors of an activity were
elucidated. This is in contrast to the concept of safety that states that accidents are uncontrolled
occurrences leading to individual’s harm and injury (World Health Organization 1989).
Maurice et al. (1997) stated that safety consists of two different dimensions (Figure 1.1): one is
objective which is evaluated by behavior and environment parameters; the other is subjective,
which is based on the feeling of safety or insecurity in the society. Forde (1993) believed that both
dimensions affect each other, and all societies should adapt their safety promotion considering
these components. To provide two-way and active relations between objective and subjective
dimensions, one should recognize and evaluate the problems and plan for interventions (Maurice
et al. 1997). In this figure and the other ones come afterwards, the arrows show causal relations.
Figure 1.1 Two dimensions of safety Source: Maurice et al. (1997)

5
Maslow (1968) introduced the concept of safety as a psychological need of humans to improve
their health. He stated that behaviors and environmental conditions are another items affecting
the safety and health of a society. According to Maslow’s thoughts, health as an outcome of the
level of safety would be determined by behavior and environment. As depicted in Figure 1.2,
children’s behaviors and the road environment resulted in the child pedestrian safety, and
consequently the children’s health.
Figure 1.2 Two links between safety and health of children Source: inspired by Maslow (1968)
Pedestrians are Vulnerable Road Users (VRU), this term applies to those who are at risk in traffic
more than others. The Institute for Road Safety Research (SWOV) suggested three criteria to
distinguish VRU from other road users: the absence of a protective “shell” in traffic to protect
against kinetic energy (e.g. pedestrians, cyclists, and to some extent, motorcyclists); task
capability (e.g. children and older adults); and resilience in case of injuries (e.g. older adults and
people with disabilities) (Hakkert and Braimaister 2002). Because of these criteria, the injury and
death risk associated with each transport mode is unequal. A small, light, slow pedestrian such as
a child cannot rapidly absorb the kinetic energy of a heavy vehicle moving without sustaining
severe injury, and this is why we should prevent those collisions through a systematic approach.
Historically, pedestrians are important road users who are not considered enough in the
improvement of road user safety (Canadian Motor Vehicle Traffic Collision 2013). The safe system
approach developed in Europe to tackle the road injury burden stresses the need to act on many
levels at the same time for safe speeds, safe vehicles and safe roads and roadsides (Figure 1.3).
In the system approach, humans are found to be vulnerable to injury, and it is believed that a safe
road traffic system could significantly reduce the human vulnerability (World Health Organization
2009). Accordingly, evidence-based research supports built environment interventions of any type
as long as they are locally appropriate, and suggests not to rely solely on educational
interventions. The role of education is to generate public support and compliance with more
effective built environment interventions, but not to stand alone as a solution(Wu et al. 2007).

6
Figure 1.3 The system approach to road safety Source: CCMTA (CCMTA 2013)
1.2.2 Unintentional Injuries (UI) in children
The National Institute for health and Care Excellence (NICE) (2016) studied injuries in children
under 15 years old at home and used the term Unintentional Injury (UI) instead of accidents. UI
was also used by Davis and Pless (2001) to emphasize that the injuries are usually predictable
and preventable. NICE (2016) reported that the possibility of unintentional injuries occurrence
depends on several factors: individual characteristics such as age, behavior characteristics such
as risk taking, and the environment factors. These factors can be considered as effective
parameters to predict the children's injuries.
Unintentional injuries are the main reason for the hospitalization and death of children, particularly
for child pedestrians (Peden 2008; Turner et al. 2004). Injuries in child pedestrians younger than
14 years represent about 12% of all injuries leading to death (CCMTA 2013). Encountering child
pedestrians and motor vehicles are the most common reasons for fatality and injuries in young
ages in the most of industrialized countries (Meir, Oron-Gilad and Parmet 2015). In Canada,
between 1994 and 2003, about 56 child pedestrians under the age of 14 years died every year,
and about 780 in the same age category were hospitalized with serious injuries (Safe Kids Canada
2007). According to Safe Kids Canada (2007), about 70% of the mortality cases and 50% of those
7
suffering from serious injuries were reported where there was no form of traffic control. This report
also stated that for child pedestrians between five and nine years old, those injuries leading to
death are due to motor vehicle accidents, and injuries of pedestrians among 10 and 14 years old
are possibly related to risk taking and inattention to vehicles (Safe Kids Canada 2007). Another
study for the period between 2003 and 2012 for Canadian children under 14 years old stated that
12% of UI leading to death happened as a result of child pedestrians being struck by a vehicle
(Parachute Canada 2016).
1.3 Urban parks and children’s safety
Urban parks play a key role in the urban landscape, environment, and ecological services. These
parks are important to improve the social, physical, and psychological conditions of citizens,
including children (Chiesura 2004; Bedimo-Rung, Mowen and Cohen 2005; Ho et al. 2003). One
of the major consistent predictors of children’s physical activity is the time spent outdoors, and
parks provide the best settings for it (Ho et al. 2003). Children’s outdoor play, after school gives
them a balanced life, because of the connections they build with nature. Although children's skills,
autonomy, and creativity increase by learning how to work with facilities in playgrounds (Alberta
Recreation and Park Association 2010), Herrington and Brussoni (2015) stated that today’s boring
and over-controlled playgrounds are among the places that are least open to autonomy and
creativity, particularly if kids are supervised.
Neighborhood characteristics surrounding parks, their accessibilities, safety perceptions (not only
about the roads but also about attacks), and aesthetics influence the use of parks by nearby
residents (Bedimo-Rung, Mowen and Cohen 2005). In contrast, the most common barriers to
using parks for all ages are personal safety concerns, long distance between home and park, and
poor quality of park facilities (Scott and Munson 1994; Cordell et al. 1999).
Reviewing the previous research concerning children and urban parks showed that they have
been mainly carried out in two major streams: those looking at the health benefits of using parks
and those looking at reasons to visit them (or not), which is the scope of the current study.

8
1.3.1 Safe route to parks for children
Parks and playgrounds are the most important destinations of children after school (Timperio et
al. 2004). Despite this fact, few research studies target the safety of roads near parks compared
to those on safety and quality of facilities in the parks (Allen et al. 2013), or on accessibility and
equity in their spatial distribution (Reyes, Páez and Morency 2014). This study will focus on those
research that address safe routes to parks. They provide useful tools and planning guidelines but
some have research-based evidence.
National Recreation and Park Association (NRPA) (2016) employed a framework called "Safe
Routes to Parks" to assess if policies and practices support safe and equitable access to parks
for all users including children. They identified and prioritized parks based on demographic, traffic,
health, and location information. Then, these data were used to suggest design safety factors on
streets within and leading to parks, including signs and signals, traffic calming devices, marked
crosswalks, and bike lanes.
The Safe Routes to Play (SRTP) created by GP RED (GreenPlay Research, Education, and
Development) is another planning process to increase safe routes to play for children focusing on
active transportation, such as walking and biking, implemented in Lebanon, New Hampshire.
According to the parent survey results, within their neighborhood, children usually tended to either
walk or bike to playgrounds, but when it came to playing outside their neighborhood, the majority
of them preferred to use a vehicle. In this regard, parents stated some reasons for not using active
transportation, in order of importance: lack of pathways, road traffic, distance, speed of traffic along
route, safety at intersections and crossings, and violence or crime (Research Education and
Development 2014).
Ferenchak and Marshall (2017) studied child pedestrians' safety on roads around parks and
schools. They considered the urban locations where child pedestrians were facing fatal collisions
with vehicles. Their results demonstrated that the risk around parks was higher than that around
schools in all of their case studies. They suggested that, in addition to schools, parks are important
locations to focuseon in the field of child pedestrian fatalities.

9
1.4 Research question and conceptual framework
The literature reviews have demonstrated that little attention has been paid to the road safety
conditions around parks. Most of the studies referred to the safety of equipment and facilities in
the park, proximity, and accessibility of the park to children. It is surprising that there are few
studies on safety of children walking to parks and playgrounds. As child pedestrians' behaviors
play a crucial role in their safety while crossing streets, this research concerns the factors with
respect to child pedestrians affecting their safe crossing. Hence, the main question of this study
is: which characteristics are related to the safe crossing behavior of child pedestrian by considering
rule compliance near parks?
In the past two decades, ecological models have been widely used by researchers to guide
behavior of populations in order to reduce potential health problems (Norman et al. 2006). Sallis
et al. (1993) believed that the health and well-being of children resulted from interactions between
behavioral, environmental, social, family, and public policy factors. In order to evaluate this belief,
they employed an ecological model to assess children’s physical activity behaviors, such as
walking to school or using a park.
Inspired by above-mentioned studies, we would like to introduce our own view in order to answer
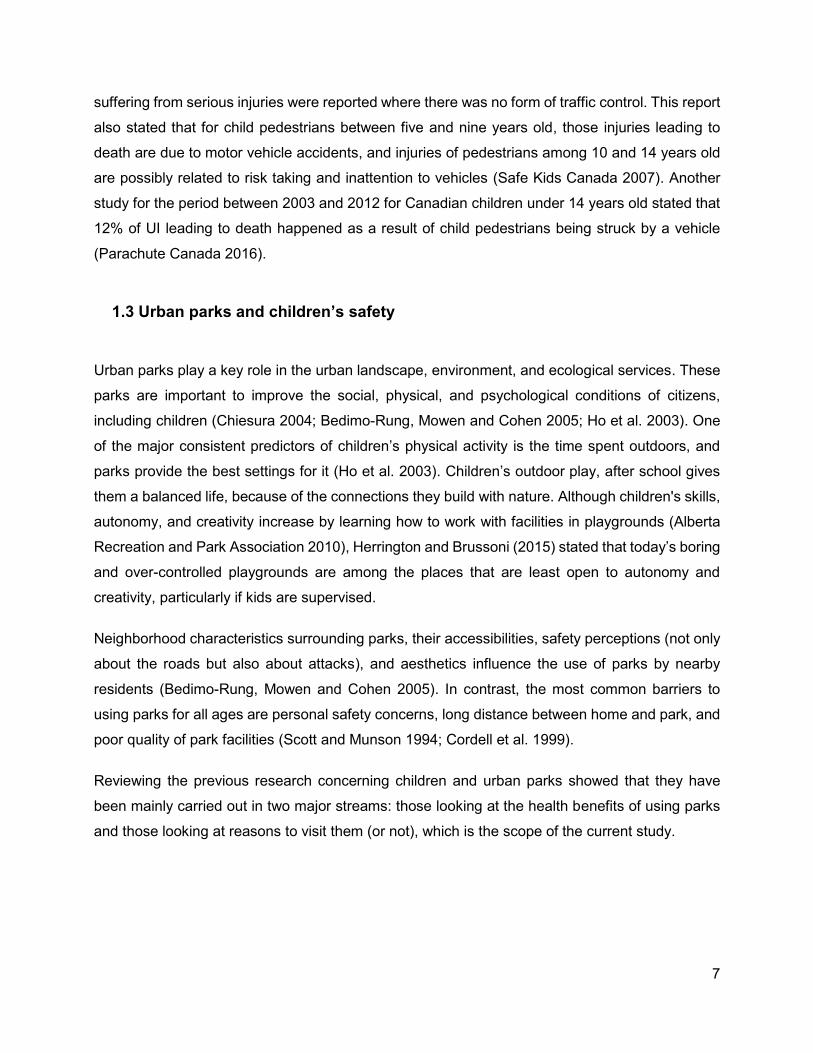
our research question. Figure 1.4 highlights our operative framework presenting the individual,
situational, behavioral, and road environmental characteristics. We expected that these four
groups of factors would be associated with the likelihood of child pedestrian’s rule compliance,
which in turn influence crossing safety. It is worth mentioning that in our operative framework,
compliance to pedestrian road rules and child's crossing safety are considered at the same level
of pedestrian safety, as also pointed out by Şimşekoğlu and Akin and Sisiopiku (Şimşekoğlu 2015;
Akin and Sisiopiku 2007). In this regard, Şimşekoğlu (2015) stated that low level of compliance
with road rules and unsafe behaviors from either drivers or pedestrians are the main reasons for
the low level of pedestrians' safety. In other words, appropriate usage of crosswalks (complying
with rules) by pedestrians and motor vehicles users increases the safety of pedestrians (Akin and
Sisiopiku 2007). The detailed description of our framework is provided in Chapter 3.
10
Figure 1.4 Operative framework employed in the current study Source: Author (2018)

11
CHAPTER 2: LITERATURE REVIEW: CHILD PEDESTRIAN INJURIES AND RULE COMPLIANCE
Now that we have stated our research question, the second chapter will review the literature on
two aspects: factors influencing child pedestrian injuries and rule of compliance, which are the two
main elements of our question.
2.1 Factors influencing child pedestrian injury
Many studies in the last decades investigated the factors influencing the safety of children on
roads. In fact, pedestrian injury risk has multiple complex explanatory factors, such as human and
environmental ones (Cinnamon, Schuurman and Hameed 2011). With regards to the presence of
a variety of risk factors influencing the safety of children, Fuselli et al. (2012) stated that a great
number of children and young people’s injuries are preventable. In addition, Desapriya et al. (2011)
stated that child pedestrian fatalities could be highly preventable by control and modification of
risk factors related to behavior, social, and environmental characteristics. Because injuries remain
the leading cause of children’s and youths’ death and disability, prevention must be incorporated
into strategies aimed at improving child’s health (Yanchar et al. 2012).
Road traffic injuries involving children are known to be a consequence of the interaction of a
variety of factors (Petch and Henson 2000). Four categories sum up most of the main influential
factors on child pedestrian injury risk: individual demographics, situational, behavioral, and road
environment characteristics (Schuurman et al. 2009; Rosenbloom, Ben-Eliyahu and Nemrodov
2008; Wazana et al. 1997). These factors are presented in more details in the following sections.
2.1.1 Individual demographics: children’s age and gender
Demographic characteristics such as age, gender are known as predictors of child pedestrian
injuries (Assailly 1997; Parachute Canada 2016; Schieber Richard and Vegega Maria 2002;
Schuurman et al. 2009). According to a study by Connelly and Isler (1996) based on international
road accident statistics, younger child pedestrians are more at risk than older ones. Children
between five and seven years old are at a higher risk in Britain, while New Zealand, the United
States, and Canada have the highest estimated rate of accidents for five to nine years old children.

12
Age matters for two reasons: Firstly, it is important to perceive what is significant in the
surroundings (Bolstad and Hess 2000), and the awareness of what is happening around a person
is related to experience (Bolstad 2001). Hence, younger children, with lack of adequate knowledge
and experience, are less competent in traffic when compared with older ones (Dunbar, Hill and
Lewis 2001; Whitebread and Neilson 2000). Secondly, crossing the street includes complex
processes and behaviors, which are not developed in young children (CCMTA 2013). Younger
children’s ability to recognize safe behaviors in road crossing starts to develop from about six to
ten years old, following their cognitive development (Oxley et al. 2005). In other words, older
children can avoid the errors leading to injury because of a better understanding of road issues
(Rosenbloom, Ben-Eliyahu and Nemrodov 2008).
According to a study by Schieber and Vegega (2002), children’s ability to be aware of traffic signs
and simple traffic rules are determined by their cognitive development level. Perceptual
development defines children’s abilities to diagnose oncoming car speed, and to visually pay
attention to the environmental elements. Due to the lack of cognitive ability and perception at a
younger age, children are more at risk (Dunbar, Hill and Lewis 2001; Whitebread and Neilson
2000). In other words, there are some factors that jeopardize children in roads: they might be not
able to correctly evaluate traffic situations; their decisions might be not followed by an appropriate
behavior which is common in their age group; and they might inappropriately react to traffic
situations (Rosenbloom, Ben-Eliyahu and Nemrodov 2008). Hence, children more than other
pedestrians need to cross where roads are safer, where we give them sufficient time to cross
before vehicles arrive, and where traffic situation is easy to respond to (Te Velde et al. 2005).
Boys (and men), no matter how old they are, tend to exhibit more risky behaviors, in part because
they have more confidence in their ability to deal with accidents (Granié 2007).Two factors, higher
risk exposure and behavioral differences, contribute to a higher number of pedestrian accidents
involving boys (Assailly 1997). Some explanations from previous studies, illustrated by Barton
and Schwebel (2007), explain the gender differences in injury rates by the boys’ tendency to
exhibit more uncontrolled behavior, and a higher chance of repeating risky behaviors compared
to girls. In other words, since boy pedestrians have a tendency to be less attentive to the road
rules than girls (Granié 2007), often the rate of injuries and fatalities among boys are higher than
for girls (Connelly and Isler 1996).

13
2.1.2 Situational Characteristics while walking/crossing as a pedestrian
Situational factors while crossing, such as parental supervision, have an influence on safety and
compliance of pedestrians (Cinnamon, Schuurman and Hameed 2011). Therefore, situational
factors considered in the current study include presence of adults (supervision), adults' gender,
presence of other pedestrians, occurrence of a child pedestrian-vehicle interaction, and presence
of parked cars within crosswalks.
A. Adult Supervision
Road supervision by parents could prevent most injuries among young children, and the absence
of or delinquency in supervision could lead to a variety of child pedestrian injuries (Morrongiello
2005). In other words, parental supervision performs the role of children protector from the
pedestrian injury risks (Schwebel, Davis and O’Neal 2012), because accompanying adults can
intervene when the child behaves dangerously in a pedestrian environment (Barton and Schwebel
2007). Figure 2.1 highlights a dynamic process including environment and child variables shaped
by situational factors determining the safety of child pedestrians. “Caregiver” (supervisor) was also
added to this model by Morrongiello al. (2005) as the most effective factor to reduce child injuries.
Figure 2.1 Conceptual model of child pedestrian safety with emphasis on the supervision Source: inspired by Morrongiello et al. (2005)
Since children are normally under the supervision of parents (depending on their age and culture),
parental factors have been known for a long time as important factors in examining childhood
14
pedestrian injuries (Lam 2001). However, as stated by Schwebel, Davis and O’Neal (2012), the
positive influence of parental supervision on child pedestrians is not straightforward. For instance,
some previous studies stated that children are less likely to run while holding hands with an adult
companion (Fu and Zou 2016; Granié 2007; van der Molen 1982). Similarly, the study by Zeedyk
and Kelly (2003) shows that the majority of adult-child pairs waited for the next green light before
crossing. On the contrary, another study pointed out that the presence of adults did not have an
influence on the decrease of some critical behaviors, including not stopping before crossing, and
not looking before crossing (Rosenbloom, Ben-Eliyahu and Nemrodov 2008). Also, when children
are crossing street with adults, both girls and boys exhibit the same behavior, except for holding
hands: more adults took a girl’s hand than a boy’s (Zeedyk and Kelly 2003).
B. Gender of adult companion
Previous studies have stated that gender differences were related to the level of risk taking for
adult pedestrians (Tom and Granié 2011; Rosenbloom 2009; Koh, Wong and Chandrasekar
2014). Also, much research with a focus on pedestrian’s gender has shown that risky behavior
and attitude are more common factors in males, and they have no relation to age (Rosenbloom
and Wolf 2002; Harré, Brandt and Dawe 2000). Thus, male pedestrians have more tendency to
violate rules than do females (Rosenbloom, Nemrodov and Barkan 2004). In this regard, Bergeron
et al.’s (1998) study showed that, in the City of Montreal, the rate of women’s compliance with
road signs and markings is about 10% higher than that of men’s.
C. Presence of other pedestrians
When pedestrians cross a street, their surrounding environment might include the presence of
other pedestrians. Sucha, Dostal and Risser (2017) stated that one of the most common situations
experienced by a pedestrian was the “presence of other pedestrians” while crossing on marked
crosswalks. The question then is to know whether this makes a difference in a pedestrian’s
behavior and decision to cross, and the answer is not straightforward: there are contradictory
results showing positive and negative influence of other pedestrians on road crossing behavior
(Havard and Willis 2012; Yagil 2000). On one side, there is the “safety in numbers” hypothesis
made by Jacobsen (2003) and (2015) stating that increase in the number of pedestrians leads to
a decrease in the number of injuries (Geyer et al. 2006). Rosenbloom (2009) found that the

15
presence of other pedestrians increases the rule compliance when compared with that of a lone
pedestrian. The same study also showed that illegal behavior of a pedestrian did not have an
impact on the behavior of others. Moreover, Lachapelle and Cloutier (2017) depicted that being in
larger groups increases the chance of finishing their crossing on time for adult and senior
pedestrians.
On the other side, Faria, Krause and Krause (2010) found that, if nearby pedestrians started to
cross, a pedestrian was 1.5–2.5 times more likely to cross as well (regardless of the rule
compliance). Similarly, Zhou et al. (2011) stated that pedestrians in a group had less tendency to
look at traffic signals than did single or paired pedestrians. In addition, when pedestrians were
crossing in groups, their walking speed tended to be slower (Carey 2005; Zhang 2012). However,
these results are coming from research on adult pedestrians, and it is not clear how the relation
would be for child pedestrians.
D. Pedestrian-vehicle interaction
The term interaction usually refers to an event where, without any collision, the paths of both a
vehicle and a pedestrian intersect while they are still on the roadway (Trozzi, Manley and
Kasparias 2015). As conflicts lead to more collisions (Cloutier, Lachapelle and Howard 2018;
Sacchi and Sayed 2016), the occurrence of such interaction may alter the trajectory and which
may in turn lead to more collisions (Cloutier et al. 2017; Wazana et al. 1997).
Interaction for two road users can be broadly defined as the presence of two road users at an
intersection in nearness in time and place so that one of them affects the other (De Ceunynck et
al. 2012). Moreover, dangerous situation between two road users arises when one of them
complies with informal rules; for example, when driver commits an illegal behavior to reduce
driving time. (De Ceunynck et al. 2012).
Among some factors that might cause pedestrian-vehicle interactions, red light violation by
pedestrian is one of the significant reasons (Langbroek et al. 2012; Pasanen and Salmivaara
1993). Crossing in designated crosswalks and in a straight line are other factors decreasing the
chance of causing an interaction between vehicles and pedestrians (Akin and Sisiopiku 2000).
Also, interactions could be minimized with proper visual search and pace of crossing (Langbroek
et al. 2012; Wazana et al. 1997).

16
Regarding child pedestrians, it has been reported that presence of traffic signals at crosswalks
near schools decreased by four times the interaction of child pedestrians with vehicles, while
presence of stop sign could increase these interactions by about 4.7% (D'Amours Ouellet 2016).
E. Visibility: Presence of a parked car near a crosswalk
As seen before, children’s physical features (including their shorter height) can put them at risk
since they are not as visible as an adult from long distances (Schieber Richard and Vegega Maria
2002). Accordingly, parked cars create specific risks for child pedestrians, since they restrict the
view of both drivers and children. (Petch and Henson 2000). Yannis, Papadimitriou and Theofilatos
(2013) reported that the presence of prohibited parking areas near mid-block crosswalks led to
more careful behavior by pedestrians. Road injuries can be prevented by making sure that child
pedestrians are visible near crosswalks even with the presence of parked vehicles.
2.1.3 Behavior characteristics
The behavior of children is recognized as an influential factor on road injuries (Rosenbloom, Ben-
Eliyahu and Nemrodov 2008; Schwebel, Davis and O’Neal 2012). Similarly, Papaioannou (2007)
stated that road users' behavior was the most important factor in pedestrian injuries. Despite the
importance of the interrelationship between humans and environment, the behavior of pedestrians
in different environments is yet an understudied factor in road injuries (Cinnamon, Schuurman and
Hameed 2011).
In order to study pedestrian behavior, three levels were modeled by Hoogendoorn, Bovy and
Daamen (2002) and used by other scholars (Daamen 2004; Ishaque and Noland 2008;
Schadschneider et al. 2009). The first level of pedestrian behavior is expanded at a strategic level
showing that pedestrians are making decisions on their activities. Then, at the tactical level
pedestrians are making short-term decisions, such as route choice, according to the density of
other pedestrians and obstacles. The last level of pedestrian behavior in this model is the
operational level describing instantaneous decisions based on actual walking behavior such as
walking fast, slowing down, stopping, and waiting before crossing, as well as performing an activity
and interaction with other road users (Daamen 2004; Ishaque and Noland 2008; Schadschneider
et al. 2009) (Figure 2.2). Actions performed at the operational level are the results of decisions

17
made at the strategy and tactical levels. For instance, pedestrians on crosswalks with no signals
(tactical level) walk faster to save time (operational level) to reach their destination (strategic level)
(Schadschneider et al. 2009). The current study occurs at the operational level to examine the
behavior (i.e. the rule compliance) of child pedestrians before and while crossing, and see what
characteristics are influencing this behavior. The number of common and specific factors involving
pedestrian’s behavior explained in previous studies will be described here to highlight the behavior
characteristics of pedestrians in general. As we are studying children, the information about them
in the literature is highlighted in the following sections; otherwise, the results for general
pedestrians are provided.
Figure 2.2 Levels in pedestrian behavior Source: Based on Hoogendoorn et al. (2001)
A. Pedestrian behavior: tempo and activity before and while crossing
The tempo (rhythm of walking) shown before and while crossing is proven to influence the risk of
fatalities: the fatal-accident reports involving child pedestrians under 15 years in France showed
that nearly seven out of ten cases were pedestrians running or playing (Fontaine and Gourlet
1997). Children in a study by Zeedyk, Wallace and Spry (2002) showed similar behavior, as 75%
of them completed the crossing while running or skipping. As well, Fu and Zou (2016) stated that
for higher percentage of children, running behavior occurred during the last second of the red man

18
in the traffic phase light. In a study by D'Amours Ouellet (2016) which is conducted for child
pedestrians-vehicle interaction at crosswalks near schools, it was reported that 37.9% of children
approached the curb with constant speed or acceleration, while others slowed down or stopped
before crossing. Tom and Granié (2011) evaluated the tempo of adult pedestrians while
approaching the curb and during crossing by considering regular walking, stopping, slowing down,
and running. Their results showed that most of the participants walked regularly to reach the curb,
and the majority of them regularly crossed the crosswalk. A few of them ran, stopped, or slowed
down in the middle of the crosswalk.
Koh, Wong and Chandrasekar (2014) demonstrated that most adult pedestrians waiting for the
next green light at the curb could finish crossing before the red light, and 45% of those starting at
flashing hand/clearance phase faced red light at the end. Lachapelle and Cloutier (2017) studied
waiting until the next green light at the curb for adults and senior pedestrians. Their results showed
that higher percentage of senior pedestrians stopped for the next green light compared to the other
age groups.
B. Pedestrian behavior: head and eye movements
Head and eye movements before and during crossing are defined as factors affecting the safety
of pedestrians (Rosenbloom, Ben-Eliyahu and Nemrodov 2008; Tom and Granié 2011). These
movements go toward the traffic lights, moving vehicles, other pedestrians, and the ground. Tom
and Granié (2011) showed that the majority of adult pedestrians at signalized crosswalks looked
at the moving vehicles before crossing, while only 19.5% of them looked at the traffic light and 9%
at the other pedestrians. At unsignalized crosswalks, more than 82% of pedestrians looked at
incoming vehicles before and during crossing, while only 9.5% of the sample looked at other
pedestrians before crossing (Tom and Granié 2011).
With regards to child pedestrians, it was found that most of them do not look at both ways before
crossing (Zeedyk et al. 2001; Rosenbloom, Ben-Eliyahu and Nemrodov 2008). In a study by
Zhuang et Wu (2011), only 3.3% of pedestrians in all age groups did not look left and right before
crossing in the waiting zone. D'Amours Ouellet (2016) studied child pedestrian-vehicle interactions
at crosswalks near schools. According to their results, 17.1% of child pedestrians looked straight
ahead or at the ground without paying attention to vehicles, while 22.1% looked at the vehicles
before and during the crossing.
19
2.1.4 Road environment characteristics
Accidents leading to pedestrian injuries often occur in complex road environments (LaScala,
Gerber and Gruenewald 2000). Certain road and physical environment risk factors have been
evaluated in previous studies in order to examine safety of pedestrians. In this regard, number of
researchers assessed traffic control devices such as presence of traffic light, pedestrian
countdown display, traffic sign (e.g. speed limit), and marked crosswalks (Sisiopiku and Akin 2003;
Paschalidis et al. 2016; Mitman, Ragland and Zegeer 2008; Wazana et al. 1997). In addition, some
other studies have investigated required crossing time, crosswalk width, and required crossing
speed (Lobjois and Cavallo 2007; Chandra and Bharti 2013; Rastogi et al. 2011; Akin 2000). The
above-mentioned road environment risk factors are elaborated in detail in the following sections.
A. Intersection and crosswalk environment
As explained above, lack of appropriate roads and crosswalks put child pedestrians’ safety at risk.
Many crosswalk characteristics can then be taken into consideration when trying to improve the
safety of crossing. Based on the Manual on Uniform Traffic Control Devices (MUTCD) (2009), it is
expected that signalized and controlled intersections have a positive impact on the safety of road
users (Wang and Abdel-Aty 2014).
In fact, uncontrolled crossings (often mid-block) are particularly problematic for both pedestrians
and drivers (Beckwith and Hunter-Zaworski 1998): pedestrians have the right of way on the street
at those marked crossings but drivers do not respect it all the time. Therefore, uncontrolled
crosswalks have the potential to create a conflict between pedestrians and vehicles in urban areas
(Hakkert, Gitelman and Ben-Shabat 2002). For instance, signalized intersections reduce the
probability of pedestrian accidents by half (Gårder 1989). In addition, a study by Cambon de
Lavalette et al. (2009) demonstrated that the absence of signals at an intersection increases the
rate of rule violation by road users. Accordingly, Brosseau et al. (2013) stated that the presence
of pedestrian signals has a positive impact on pedestrians’ decision making and encourages them
to respect the rules.
In crosswalks with a countdown timer, results are contradictory. On one side, a study
demonstrates improvement in behavior: a higher number of pedestrians older than 12 years old
complied with pedestrian signals compared to those in a crosswalk without a countdown display

20
(Lipovac et al. 2013), and dangerous crossings were significantly reduced compared to the rate at
intersections without a timer (Brosseau et al. 2013). On the other side, many other studies stated
that the presence of countdown timers created chances of non-complying behavior (Huang and
Zegeer 2000; Vujanić et al. 2014), and led to an increase in the number of late-starter and late-
finisher pedestrians (Wanty and Wilkie 2010).
The results of Fu and Zou’s (2016) study have shown that presence of a countdown display helped
child pedestrian during the clearance phase not to be caught in the crosswalk before the red man
signal’s onset, and to finish their crossing on time (by speeding up or running, for example).
B. Crossing time, crosswalk width, and required speed to cross on time
The essential need for pedestrians is to recognize the available and necessary time to cross the
road, which depends on road width, walking speed, and ability to speed up (Lobjois and Cavallo
2007). Crosswalk width influences risk of having an accident since it affects the time a pedestrian
is exposed to traffic (H. Li, Graham and Majumdar 2015; Rastogi et al. 2011; Tarawneh 2001).
Collision risk increases with the width of the road (Abrashev et al. 1999; Cloutier et al. 2017;
Noland and Quddus 2004). In other words, pedestrians in a wider street have a wider exposure to
risk (Montella and Mauriello 2010), so with reductions in road width at crosswalks, pedestrians
would have a shorter distance to cross, leading to less exposure to road risks (Hakkert, Gitelman
and Ben-Shabat 2002; Martin 2006; Neumann and Wagner 2008).
The crossing time, is the time required by pedestrians to cross a road with traffic signals (Virkler
and Guell 1984; Cambon de Lavalette et al. 2009), which is affected by crosswalk width (Hakkert,
Gitelman and Ben-Shabat 2002). As such, the pedestrians’ behaviors are associated with the
speed required to cross the street: in crosswalks with higher required speed (because of a greater
width, for example), pedestrians move more quickly (Zhuang, Wu and Ma 2018; X. Zhang et al.
2013; Tarawneh 2001; Rastogi et al. 2011).
According to Chandra and Bharti (2013), crossing speed is analyzed with respect to road width,
and it is calculated as the crossing distance (length of the crosswalk) divided by the estimated
time needed by a pedestrian to cross (Wanty and Wilkie 2010; Li et al. 2013; Marisamynathan and
Perumal 2014). However, walking speed is related to age, gender, group size, disability, traffic
control condition, and departure signal (Gates et al. 2006; Marisamynathan and Perumal 2014).
21
Most of the guidelines and the manuals (e.g. Highway Design Manual – the Road (3rd Edition)
(Hong et al. 2006) did not consider the different situations and characteristics of pedestrians to
specify the speed while crossing (Almodfer et al. 2017).
A crossing speed of 1.2 meter/second is recommended in North America (Avineri, Shinar and
Susilo 2012; National Advisory Committee on Uniform Traffic Control Devices 1988; Milazzo II et
al. 1999; Manual on Uniform Traffic Control Devices 2006). Based on the study by Tarawneh
(2001), many scholars believed that a crossing speed of 1.2 m/s was too fast for most pedestrians.
Furthermore, Dewar (1992) suggested a 0.91 to 0.99 m/s value for traffic signal timing in general.
Similarly, Rastogi et al. (2011) stated that 15th-percentile speeds were between 0.83–1.02 m/s for
adult pedestrians, which vary with road width, traffic volume, and size of the urban area. Again,
average crossing speed showed by Alhajyaseen (2012) ranged between 0.9 and 1.1 m/s. On
average, an older pedestrian crossing speed of 0.95 m/s is slower than a child pedestrian speed,
while for adults, crossing speed is 1.12 m/s (Marisamynathan and Perumal 2014). It is worth
mentioning that the results of Knoflacher (1987) and Weidmann (1993) showed that children under
12 years of age had a slower walking speed in comparison with adults. The speed of adults and
elderly pedestrians have received a lot of attention during the past decades, with lack of attention
paid to children (Li et al. 2013). Therefore, there is great diversity in the research and
recommendations and that little has examined children.
C. Crosswalk marking
A painted crosswalk encourages pedestrians to cross within the marked zone, where drivers
expect more the presence of pedestrians (Montella and Mauriello 2010). Hence, several studies
have shown that there was a considerable reduction in pedestrian injuries at marked crosswalks
(Gorell and Tootill 2001; Morgan, Ogden and Barnes 2004; Zein 2004). Also, crosswalk marking
seems to influence the behavior of pedestrians: they tend to cross faster in the absence of
markings, which might mean that they tend to reduce the time they are exposed to traffic (Ekman
1996; Meir, Parmet and Oron-Gilad 2013).
D. Speed limits
It is well established that the main cause of road injuries is high speed of motor vehicles: the rate
of pedestrian injuries leading to death is eight times higher in a street with a speed limit more than

22
40 km/h (Parachute Canada 2016; Peden et al. 2004). For areas where the speed limit was 50
km/h and 30 km/h, the probability of fatalities was found to be 40% and 5%, respectively (Montella
and Mauriello 2010). In the case of parks, Ferenchak and Marshall (2017) illustrated that lowering
vehicles speed makes drivers more aware of the environment which leads to safer roads for
pedestrians. These speeds depend on the density of the neighborhood in each location.
According to these authors, solutions can be found through initiatives and regulations that reduce
speed of vehicles and increase driver awareness of the presence of children through some
changes in road near parks such as installation of traffic calming devices, which are proven to be
efficient to reduce the rate of child pedestrian injuries (Jones et al. 2005). Traffic calming device
has two main purposes including reduction of the frequency and severity of accidents, and
improving the environment of local areas (e.g., decreasing speed of vehicles and traffic flow)
(García et al. 2011).
Accordingly, providing a high quality and proper crossing location raises the level of pedestrian
safety and reduces the likelihood of pedestrian accidents (Akin and Sisiopiku 2007), especially
for children, who, as we said before, are unequally exposed to accidents in the environment
(Pucher and Renne 2003).
2.2 Pedestrian rule compliance
Generally speaking, compliance refers to obeying a rule, standard, or policy (Lin 2016). Rule
compliance, as discussed by Granié Granié (2007), needs internalization of social rules which
eventually leads to obtaining personal values and attributes. This process is essential in the
process of child development (Kopp 1982; Lytton 1980).
In terms of road rules, it is necessary for all road users to obey the road rules in order to establish
a safe traffic system. Rule compliance can be seen as a crucial component of any safety strategy
(Hopkins 2011) since not complying with road rules from both ends can lead to pedestrian injury
(Cinnamon, Schuurman and Hameed 2011).
Many factors influence pedestrian rule compliance: the street location; individual; and
environmental characteristics. These factors might also affect pedestrian's habits and preferences.
Pedestrian's behavior and attitude are known as decisive factors in rule compliance (Akin and
Sisiopiku 2007). Compliance with pedestrian rules could also be affected by children’s gender
(Granié 2007) and by their age (Rosenbloom, Ben-Eliyahu and Nemrodov 2008). Although

23
compliance is an important factor for both children and adults (Toepfer, Reuter and Maurer 1972),
most of the previous research did not study children compliance, so many results presented here
are for adult pedestrians.
2.2.1 Temporal crossing compliance (compliance with signal timing at signalized intersections)
According to the Quebec Highway Safety Code (QHSC)(Quebec Highway Safety Code 2017), in
an intersection with a pedestrian light, pedestrians should comply with their light, and if there is no
pedestrian light they should comply with the traffic light. In addition, pedestrians facing a flashing
signal with a countdown display may only start to cross if they can reach the other side before the
start of the orange signal. The results of some previous studies in temporal crossing compliance
showed that compliance with walk signals was about 50% (Akin and Sisiopiku 2007), and it was
lower among male pedestrians in the study of Tom and Granié (2011). Also, non-compliance with
signs and signals had positive association with pedestrian collision injuries, while installing
pedestrian countdown display could reduce these injures (Markowitz et al. 2006).
Where there is a countdown signal, pedestrians tend to cross according to the remaining time of
the countdown display, though they might underestimate their crossing time duration and finish on
the red light (Wanty and Wilkie 2010). In addition, the waiting time before the next green light has
a significant impact on compliance with the temporal rules, and the likelihood of crossing against
the red light on a long-time cycle are higher (28%) than on a shorter-time cycle (20%) (Keegan
and O’Mahony 2003).
2.2.2 Spatial compliance (crossing in/at the crosswalk)
Pedestrians should cross the street in a straight line, within the crosswalk if marked; only in the
presence of a peace officer, school crossing guard, sign, or signal, can they cross the street
diagonally (Quebec Highway Safety Code 2017). In other words, crossing compliance refers to
respecting the crossing location (i.e., crosswalks) (Akin and Sisiopiku 2007).
As studies revealed, drivers’ attention to pedestrians is higher when pedestrians cross at
designated locations, such as a crosswalk, and pedestrian-vehicle conflicts can be reduced by
this behavior (Morel et al. 2003; Sisiopiku and Akin 2003). It has been reported in the literature

24
that the majority of adult pedestrian (59%) crossed compliantly in the crosswalk (Sisiopiku and
Akin 2003), and there was no difference in compliance between genders for spatial compliance
(Tom and Granié 2011).
2.2.3 Velocity (crossing speed)
One of the most critical and important issues in road safety planning is pedestrian speed. Crossing
speed includes both walking and running (Chandra and Bharti 2013; Zhou et al. 2011) as two
different types of movement for pedestrians. Walking is known as a common behavior, while
running is considered by some as a risky and unsafe behavior since it decreases the pedestrian
safety margin (Almodfer et al. 2017).
The rate of pedestrian exposure to vehicles is related to speed (Tarawneh 2001) since road users
can make more reasonable decisions at lower speeds. However, among pedestrians, a higher
percentage of running was seen for children (Li et al. 2013), especially when they were
unaccompanied or in a group (Ishaque and Noland 2008). In France, pre-school children learn
some safe road behaviors consistent with pedestrian rules, such as stopping at the curb, and
walking (not running) during crossing (crossing speed) (Granié 2007). In addition, most
pedestrians have the ability to adjust their speed if they encounter a potential or certain risk
(Murray 2006; Tarawneh 2001), which might not be the case for children.
2.2.4 Visual search (before crossing)
Visual search is another important skill involved in the crossing task (Thomson et al. 1996). The
visual system has an important role when crossing the street, because it can acquire information
quickly and reliably (Geruschat, Hassan and Turano 2003). For the reasons mentioned above,
children have often inadequate visual search behavior (Tapiro et al. 2014). About 41% of child
pedestrians aged 5–6 years in a study by Zeedyk, Wallace and Spry (2002) did not look for
oncoming vehicles, and if they were looking, they often did so in the wrong direction or with
restricted view.
Assessing the previous studies concerning child pedestrian’s safety revealed that there is no
comprehensive investigation on children’s safety crossing streets near urban parks. Hence, a
study evaluating the characteristics pertaining to child pedestrians’ safety with regards to rule

25
compliance at crosswalks adjacent to parks is much needed. The following chapters aim to
achieve this goal by providing the methodology and discussing the results.
26
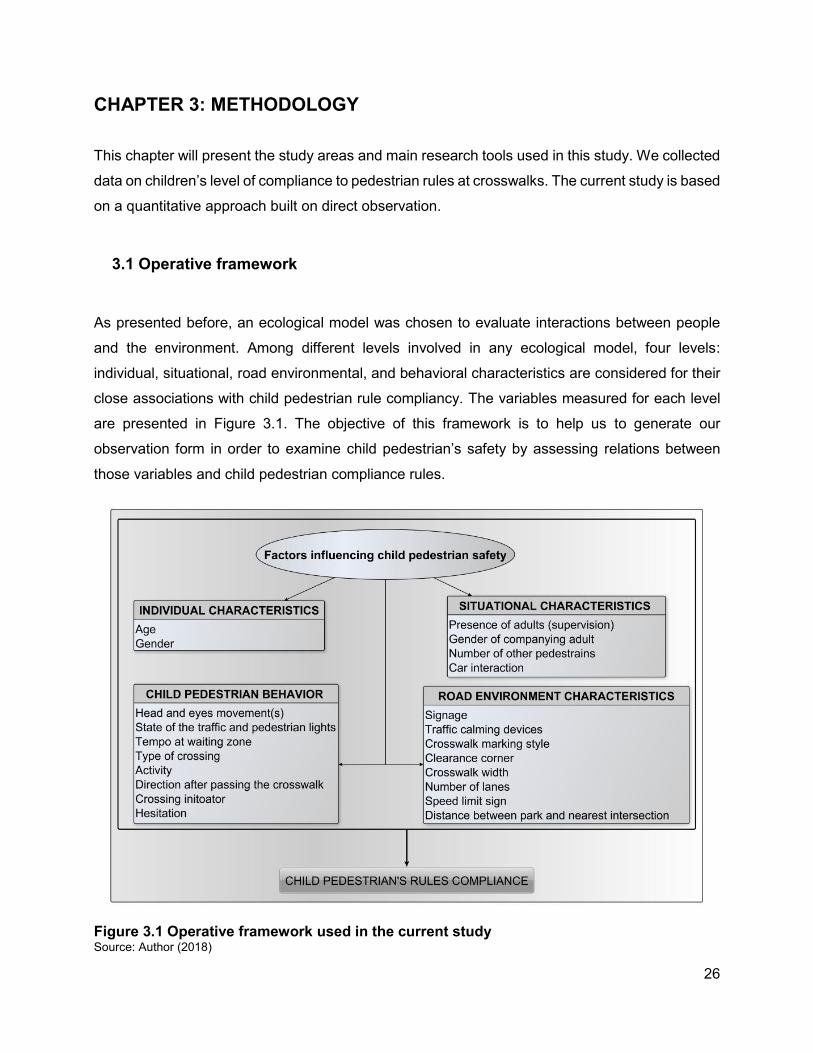
CHAPTER 3: METHODOLOGY
This chapter will present the study areas and main research tools used in this study. We collected
data on children’s level of compliance to pedestrian rules at crosswalks. The current study is based
on a quantitative approach built on direct observation.
3.1 Operative framework
As presented before, an ecological model was chosen to evaluate interactions between people
and the environment. Among different levels involved in any ecological model, four levels:
individual, situational, road environmental, and behavioral characteristics are considered for their
close associations with child pedestrian rule compliancy. The variables measured for each level
are presented in Figure 3.1. The objective of this framework is to help us to generate our
observation form in order to examine child pedestrian’s safety by assessing relations between
those variables and child pedestrian compliance rules.
Figure 3.1 Operative framework used in the current study Source: Author (2018)

27
3.2 Selection of study areas
Montreal is the second most populated city in Canada, located in the southwest of the province
of Quebec. The city of Montreal with its 1.7 million inhabitants is the core part of metropolitan
Montreal. Children under 14 years of age consist 15.6% of the city’s population (Ville de Montréal
2016). Neighborhoods located in the city’s central core are commonly known as “inner-cities”
(Statistics Canada 2006). We selected inner-cities boroughs since they tend to have larger and
denser populations, heavier traffic, and less room for children’s play than the suburbs. The
studied boroughs include Villeray-Saint Michel-Parc extension (VSP) and Rosemont-la Petite-
Patrie (RPP) (see Figure 3.2).
Figure 3.2 Selected boroughs Source: Author (2018)

28
3.2.1 Park selection
We selected parks according to previous work by Apparicio et al. (2010). This paper classified
parks into six different classes according to the presence or absence of facilities and the parks
size (Table 3.1). Parks of type (A) are very small and include one playground. As per Apparicio et
al. (2010), this kind of park is especially intended for children aged four and under. The next type
(B) consists of small parks with two facilities including a playground and a sports field. Type (C)
parks are also small but offer more equipment. Type (D) parks are also smaller but offer more than
seven facilities on average including a skating rink and a swimming pool. The (E) type consists of
larger parks and contains many types of equipment (5 on average). Finally, type (F) are
metropolitan parks providing winter equipment and hiking trails.
Table 3.1 Typology of urban parks on the island of Montreal
Type of parks A B C D E F Total
Number of parks 296 144 104 46 88 15 693
Size of parks very small park (less than 1 ha)
small park (1 to 5 ha)
small park (1 to 5 ha)
small park (1 to 5 ha)
large park (5 to 20 ha)
metropolitan park (more than 20 ha)
Percentage of parks with
playground for children 0-4 years
old
96.6 80.6 85.6 80.4 79.5 20.0 86.7
Average number of equipment1 1,4 2,2 3,5 7,2 5 3,7 2,8
Source : Apparicio et al. (2010)
Parks in the first four categories (A, B, C, D) were selected because they are local and provide a
greater chance of child pedestrians to walk and being present in them. Eighteen parks in different
boroughs of the City of Montreal were selected within these four categories, between 4 to 5 Parks
in each category. An exploratory visit to these parks was undertaken before making the final
choice. We aimed to choosing different local parks having different size, traffic density, and
different features in crosswalks next to the parks. The final parks were carefully chosen to have
playground facilities in order to increase the chance of children presence. Finally, we ended up
with four parks in the inner city of Montreal which had the above criteria. The analyses provided
1 This variable presents the average number of different types of equipment in the parks like playgrounds, sports fields (baseball, football, soccer, etc.), winter sports (skate ring, arena, snow shoeing lanes, etc.), specialized equipment (skate parks), and swimming pools.

29
in Chapter 3 shows that number of observations in these four parks provides reliable statistical
results. Figure 3.3 summarizes our method to select the final four parks.
Figure 3.3 Different steps in choosing the parks Source: Author (2018)
Jarry, De Turin and Gabriel-Sagard Parks are located in the Villeray-Saint Michel- Parc Extension
(VSP) borough. The borough area is 16.5 km2 with a population of more than 140000 (the second
largest in the city), with children under 14 years of age representing 17% of it (Ville de Montréal
2016). The fourth park is in the Rosemont La Petite-Patrie borough (RPP), adjacent to the Villeray-
Saint Michel-Parc Extension one. Rosemont La Petite-Patrie is the third most populated borough
in the City of Montreal with 15.9 km2 of territory and fewer than 140000 residents, with 14% children
under 14 years old (Ville de Montréal 2016) (Figure 3.4).

30
Figure 3.4 Location of Selected Parks Source: Author (2018)

31
3.2.2 Selection of intersections and crosswalks
After choosing the parks, we selected specific intersections to conduct our data collection. In this
study, intersections closer to playgrounds and those on main streets were considered as most
common crosswalks chosen by children based on observation test. After visiting selected
intersections, the crosswalks adjacent to the parks which had highest number of child pedestrians
and had different features, such as marking and signage, were chosen. During direct field
observations, we reported the characteristics of each crosswalk according to our road environment
observation form (see Appendix 2).
Accordingly, nine intersections and seventeen crosswalks attached to these intersections were
retained for this study (Table 3.2). Most of the crosswalks are located at three or four-way
intersections; one crosswalk between an elementary school and Gabriel-Sagard Park was mid-
block and not at an intersection.
Table 3.2 Summary of selected crosswalks around parks
Park
Jarry
Cro
ssw
alk
num
ber
De-Turin
Cro
ssw
alk
num
ber
Molson C
ross
wal
k nu
mbe
r
Gabriel-Sagard
Cro
ssw
alk
num
ber
Cro
ssw
alk
nam
e
Cro
ssw
alk-
ID
Jarry / Saint-Laurent
1
Jean-Talon / De
Lanaudière
8
Beaubien / D’Iberville
11
Sagard
15
Saint-Laurent / Jarry
2
De Lanaudière / Jean-Talon
9
D’Iberville / Beaubien
12
Sagard / Jean-Talon
16
Saint-Laurent / Gounod (North)
3
Chambord / Jean_Talon
10
D’Iberville / Elsdale
13
Jean-Talon / Sagard
17
Saint-Laurent / Gounod (South)
4
Elsdale / D’Iberville
14
Saint-Laurent / Villeray
5
Saint-Laurent / Gary-Carter
6
Gary-Carter / Saint-Laurent
7

32
Because of the vastness of Jarry Park, seven crosswalks were selected around it, most of them
being closer to the playground area (Figures 3.5 and 3.6). The first two crosswalks selected are
located at the intersection of Jarry and Saint-Laurent Streets overlooking the park. The third and
fourth crosswalks are located on Saint-Laurent and Gounod Streets near the entrance of the pool
in Jarry Park, and the fifth crosswalk is at Saint-Laurent and Villeray Streets. Two other crosswalks
around Jarry Park are in Saint-Laurent and Gary Carter and Inverse, very close to the main
entrance of the park.
Figure 3.5 Selected crosswalks around Jarry Park Source: Author (2018)

33
Figure 3.6 Selected crosswalks around Jarry Park Source: Photograph by author (2018)

34
Since De-Turin Park has two playgrounds located near Jean-Talon Street, one unmarked
crosswalk near the first playground at the intersection of Jean-Talon/Chambord Streets was
selected. The two other crosswalks at the Jean Talon– De Lanaudière intersection were also
selected because they are close to a second playground (Figures 3.7 and 3.8).
Figure 3.7 Selected crosswalks around De-Turin Park Source: Author (2018)

35
Figure 3.8 Selected crosswalks around De-Turin Park Source: Photograph by author (2018)
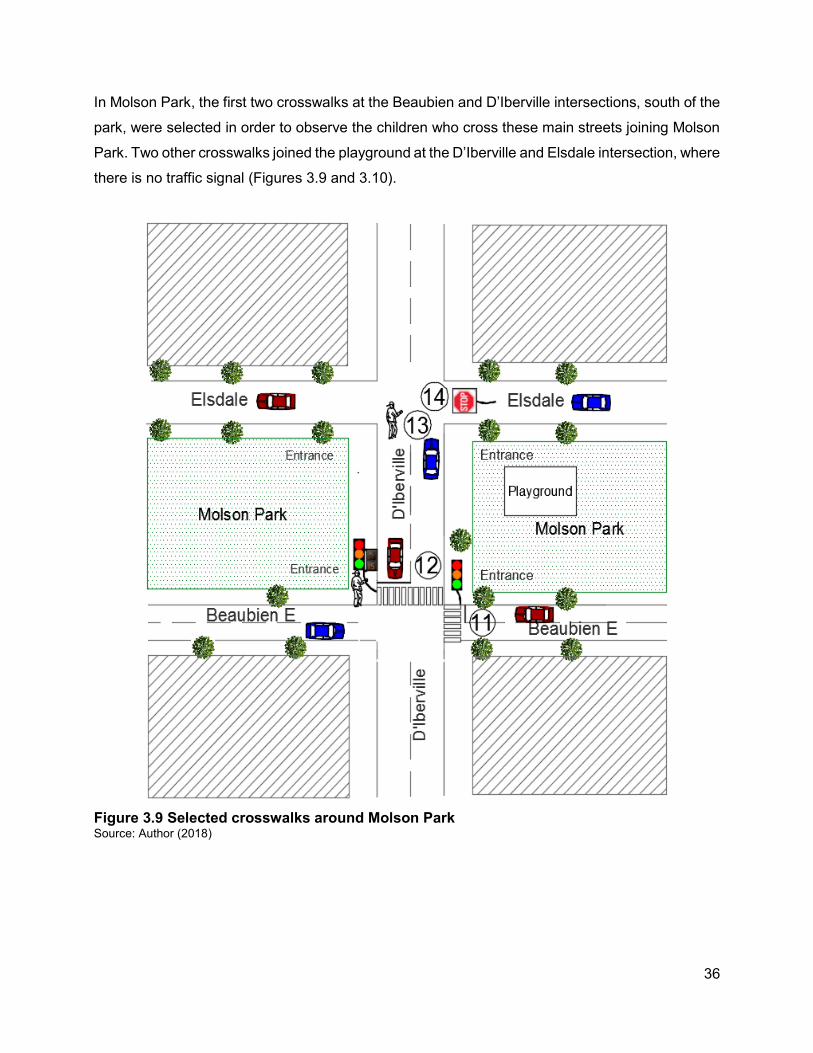
36
In Molson Park, the first two crosswalks at the Beaubien and D’Iberville intersections, south of the
park, were selected in order to observe the children who cross these main streets joining Molson
Park. Two other crosswalks joined the playground at the D’Iberville and Elsdale intersection, where
there is no traffic signal (Figures 3.9 and 3.10).
Figure 3.9 Selected crosswalks around Molson Park Source: Author (2018)

37
Figure 3.10 Selected crosswalks around Molson Park Source: Photograph by author (2018)

38
At Gabriel-Sagard, the crosswalk at mid-block, located between the school (Saint-Barthélemy
elementary school) and the park, and two crosswalks adjacent to the park at Sagard and Jean-
Talon Street intersections were selected (Figures 3.11 and 3.12).
Figure 3.11 Selected crosswalks around Gabriel-Sagard Park Source: Author (2018)

39
Figure 3.12 Selected crosswalks around Gabriel-Sagard Park Source: Photograph by author (2018)

40
3.3 Creation of the data collection tools: Direct observation of child pedestrian behavior while crossing
We created three observation forms to collect data to answer our research question: one for the
individual, situational and child pedestrian behavior while crossing, one for the road environment,
and one for the interactions between child pedestrians and vehicles.
Many previous scholars have used observation methods at crosswalks to examine the behavior
of pedestrians in various age categories. For example, Lachapelle and Cloutier (2017) studied
elderly pedestrians street crossing behavior at signalized crosswalks through observation to
explain the type of street crossing ending (on red light, on red hand or on both). Tom and Granié
(2011) directly observed pedestrian rule compliance according to gender, examining temporal and
spatial compliance as well as visual search at signalized and un-signalized crosswalks. Cinnamon,
Schuurman and Hameed (2011) observed road rule violation in Vancouver through observation of
pedestrians and motorists behaviors. Dommes et al. (2015), in addition to questionnaires, used
observations to record adult pedestrians’ behavior at red light violations; situations at waiting
zones; crossing pace; and types of crossing. Markowitz et al (2006) used the observation method
before and after installation of pedestrian countdown signals to examine the changes in the
number of pedestrian injuries and their temporal compliance. The observation forms for the
present study (Appendixes 1-3) are based on the “ESSAIM and PARI, 2013” project (Cloutier et
al. 2017; D'Amours Ouellet 2016; Cloutier 2016; Bergeron et al. 2017). Most of the observation
form elements were used without any changes comparing to the afore-mentioned ones; however,
some new elements related to parks were added, such as distance between intersection and park
entrances, etc, in order to better study a park-related elements.
3.3.1 Individual and situational factors
Figure 3.12 presents five different categories for individual and situational characteristics. We first
recorded gender and age by categorizing girls and boys in two different age groups: estimated to
be between 4-8 (younger children) and 9-12 years (older children) (Figure 3.13). Since we did not
ask the pedestrians any questions, those age categories are estimates and relative to each other,
based on the height of children.
For situational factors, we recorded several items: if there is a companion with child, the type of
supervision, including physical contact (hand, coat), close supervision, or out of reach; gender and

41
number of adult companions. Also, the total number of other pedestrians waiting to cross at the
same time as the child pedestrian (even if they did not seem to know each other, and excluding
their companions).
Figure 3.13 Individual and Situational factors in observation grid for crossing behavior Source: Author (2018)
3.3.2 Behavioral factors
The behavior section of the form (Figure 3.14) was used to record nine different variables: head
and eye movement before and during crossings; state of traffic light during and at the end of the
crossing; type of crossing (straight line or not); waiting zones (type and tempo); activity before and
after crossing; if there was any hesitation before crossing; who was the initiator of the crossing;
and direction after the crossing (to the park or not).

42
Figure 3.14 Behavior factors in observation grid for crossing behavior Source: Author (2018)
3.3.3 Observation grid for road environment
Figure 3.15 presents the road environment form, which was used to record nine characteristics of
the selected crosswalks and intersections (Appendix 2): presence of traffic calming devices;
visibility within 5 meters of the corner; distance between the park entrances and the crosswalks
in meters; type of intersection; speed limits (30, 40, 50, 70 km/h or none); number of lanes at the
crosswalk; crosswalk width indicating three-difference levels (less than 15m, between 15 -25m
and more than 25m); the crosswalk marking (two parallel lines, white zebra, yellow zebra, paving
stone or other asphalt coating, or no ground markings); the presence or absence of traffic signals
(stop signs, traffic lights and their duration in seconds, pedestrian countdown displays and their
duration in seconds, and no signage).

43
Figure 3.15 Road environment characteristics Source: Author (2018)
3.3.4 Observation form for vehicle-pedestrian interactions
Whenever the paths of the child and a vehicle would cross while the child was still on the
crosswalk, we would record that as an interaction, based on the work cited before in the ESSAIM
and PARI project (Appendix 3). We would then record information about the vehicle, its direction,
its proximity to the child, and other behaviors during the interaction (Figure 3.16). For this study,
we only include a binary variable that indicates whether an interaction occurred (or not) during the
crossing, regardless of how dangerous it was. It allows us to study broadly how a vehicle crossing
a child’s path affects rule compliance.

44
Figure 3.16 Vehicle-Pedestrian interaction variables Source: Author (2018)
3.4 Data collection
All the observations were recorded on iPads in the Survey123 software developed by ESRI
(Environmental Systems Research Institute 2017). Observations were conducted by four trained
observers between mid-June and mid-August 2017. These four observers were trained for two
days by Marie-Soleil Cloutier, associate professor at “Institut National de la Recherche
Scientifique” (INRS). The training observation sessions included elaboration and explanation of
the observation form elements and filling out the electronic version of the forms in real-time. At the
end, the forms were verified by professor Cloutier in order to ensure appropriate data collection.
At crosswalks with a higher traffic volume and number of children, observers were in teams of two:
one observer completed the children’s behaviors and the other, the interaction form. In crosswalks
with a moderate level of traffic and children, only one observer recorded in both forms (children
behavior first, then interaction form, if applicable). Before recording children's behavior and
interaction, each crosswalk characteristic was recorded in a separate form.
Since observation process started at the end of the school year, the time of data collection was
not very specific and could be done during the daytime almost between 9 am and 7 pm, on
weekdays and weekends, in time periods when children were more likely to go to the parks.
Crossing situations were recorded with three different tools based on previous work (Cloutier et
al. 2017): (1) child pedestrian crossing behaviors, (2) crosswalks characteristics and, if applicable,
(3) interactions between the child pedestrian and vehicles.

45
Crossing behaviors were observed at three specific moment (Figure 3.17): (1): at the curb, (2): on
the crosswalk, (3): after crossing. As it was a non-participatory observation, the observer chose
a place that would draw the least attention but provide the most visibility of the children and traffic
signs If there were more than one child or if there was a group of children, only one child was
randomly selected to be observed. In the absence of interaction, the interaction form was not filled
out. In total, a minimum of 40 children were observed at each of the seventeen selected
crosswalks, with the exception of one crosswalk at Saint-Laurent / Gounod (North), in which only
15 observations were recorded. At the end of each day, the data were properly extracted and
backed up.
Figure 3.17 Observation Zone Source : Author (2018)
3.5 Data (re)coding and analysis
To analyze child pedestrian safety rules, we selected the variables presented previously based on
the literature review and our proposed ecological model. Dependent variables represent
“pedestrian rule compliance”, while the independent variables are associated with child pedestrian
behavioral and individual, situational, crosswalk, intersection and park entrance characteristics.

46
3.5.1 Independent variables
After data cleaning and before any analysis, data were converted to a numeric format. Accordingly,
in the Excel file, all proper variables and their attributes were entered in two columns, and coding
for variables with two attributes were recorded as “dummy” variables (value 0 or 1). For example,
age became two variables (“4-8”=0) and (“9-12”=1). Consecutive integer numbers were assigned
to variables attributes. For example, “Initiator of the crossing” with its three attributes were coded
as: “no initiator=0” “child"=1” “adult =2”, and likewise for other variables having more than two
attributes (see Table 3.3). After finalizing the data, the tables for child behavior and road
environment were associated via the crosswalk ID, which was shared. Lastly, the pedestrian–
vehicle interaction table was associated to the data using the pedestrian ID.
We should mention that “speed required to cross in time” was created based on initial data for
crossings with traffic lights, based on the width of each crosswalk (measured by observers) and
the time permitted to cross (green light, white silhouette, and blinking light duration). As explained
in Chapter two, previous research has not taken into account the actual pace of a child pedestrian
when calculating the speed required to cross an intersection on time. For this study, the speed
was fixed at 1m/s –an estimate based on related measures in other studies. This value exceeds
the speed of the elderly and is less than the 1.2 m/s speed considered for pedestrians
(Alhajyaseen 2012; Marisamynathan and Perumal 2014; Rastogi et al. 2011; Almodfer et al. 2017;
Dewar 1992), since many scholars believe that a crossing speed of 1.2 m/s is too fast for most
pedestrians (Tarawneh 2001).
Recoding of other variables was undertaken to ease further analysis. Because the crosswalk width
influences the safety of the pedestrian, the crosswalks in this study were categorized into three
different groups: (1) less than 15m (short), (2) between 15m and 25m (medium), and (3) more
than 25m (long).
As to the variables pertaining to parks, two variables were kept although they were not found in
previous studies: the distance between the nearest park entrance and the intersection, and if the
children entered the park through this entrance. These two variables were considered to better
investigate child pedestrians crossing the streets near urban parks.
It should be noted that not all independent variables were simultaneously used in our model (see
below).

47
3.5.2 Dependent variables
To account for a child’s application of pedestrian safety rules, four binary composite variables were
created to distinguish child pedestrians rule compliance based on visual search, temporal, spatial,
and velocity compliance (Table 3.3). Each of those rule compliance indicators is the dependent
variable for one mixed-effect logistic regression.
In the current study, temporal rule compliance only applies to crosswalks equipped with pedestrian
lights. If children finished crossing on the white silhouette, flashing red hand or even at a green
traffic light (if no pedestrian light), they will be considered to have completed the crossing in time.
Whereas if a pedestrian was on the red, or on the yellow light at the end of crossing, or on the red
hand (if there was a pedestrian light); it means that the pedestrian did not comply with the traffic
rule and finished the crossing out of time. Spatial compliance means crossing within the
boundaries of a marked crosswalk or going straight across and not diagonally (if no marking)
(Granié 2007). Different behaviors such as stopping or not stopping at the curb and running across
the road were defined by previous scholars to examine the velocity of pedestrian at crosswalk
(Rosenbloom, Ben-Eliyahu and Nemrodov 2008; Granié 2007). In the current study, maintaining
a regular pace before and during a crossing is defined as velocity compliance, while accelerated
pace before crossing or non-regular pace during crossing is defined as “non-compliance”. To the
best of our knowledge, there is no specific rule for velocity compliance. In this study, as mentioned
in chapter 2, the safe norm road behaviors associated with pedestrian rules presented by Granié
(2007) were used and denoted as velocity compliance.
Not looking before crossing is considered an unsafe behavior by Rosenbloom, Ben-Eliyahu and
Nemrodov (2008). “Looking before crossing” to check for approaching traffic and “looking while
walking” in the Granié (2007) study are considered complying with pedestrian rules. Our visual
search compliance variable is based on children looking straight ahead, at a traffic light, or toward
the vehicles before crossing. Looking at other pedestrians, objects on hand, the ground or at
nothing related to the street, are all signs of non-visual search.

48
Table 3.3 Composite variables of rule compliance Mixed effect
logistic regression Model No
Type of indicators Retained variables Number of recorded
observation
1 Temporal
Crossing ended on:
568 Compliance 1: Green light, white man or flashing red hand
Non compliance 0: Red light, yellow light or red hand
2 Spatial
Type of crossing:
731 Compliance 1: Crossed in straight line Non
compliance 0: Outside the parallel lines or diagonal
Velocity
Tempo:
731 3 Compliance 1: Regular pace before and during crossing Non
compliance 0: Accelerated pace before crossing or
non-regular pace during crossing
Visual search
Head/eye direction before crossing:
731
4 Compliance
1: Head/eye towards the traffic light, straight ahead or towards the vehicles
Non compliance
0: Head/eye towards the ground, towards other pedestrians,
towards an object or towards nothing in particular
Source: Author (2018)
3.5.3 Statistical analyses
As discussed before, four parks belonging to different categories were chosen in this study. Based
on the park sizes and desired crosswalk types, 17 crosswalks were selected. In order to have
acceptable sample size, the Green's (1991) general rule of thumb were employed to ensure
reliable statistical outcomes (Tabachnick and Fidell 2007). According to this rule, our analysis with
731 observations had enough power of calculation. We also evaluated marginal effect (p<0.1)
which facilitate interpretation of results (Fullerton and Xu 2016) and warrants further investigations
in future research.
After establishing the dependent variables logics, descriptive bivariate analyses provided an
overview of the factors related to each of the four rule compliance measures using Chi-squared
tests of statistical significance for qualitative variables by SAS software (Statistical Analysis
System 2002-201). This analysis confirms whether significant association exists between the

49
dependent variables (child pedestrian rules compliance) and binary/categorical independent
variables.
As the next step, the mixed effect logistic regression models were used, one for each compliance
rule. The mixed effects logistic regression can model binary outcome variables with the log odds
which are linear combination of predictor variables when data are clustered or for considering both
fixed and random effects (Agresti 2013). Since many observations are recorded at each of the
crosswalks, mixed-effects regressions enable us to account for the grouping of observations in
crosswalks using a random effect. Using a variable for parks as a random effect in mixed-effect
logistic regressions did not improve the quality of the models as shown by the AIC (Aikaike
Information Criterion). This is why we did not use it in our final model. Multivariate analyses were
performed on Stata 12 with the melogit command (Stata Statistical Software 2011). A few variables
had to be removed from specific model because they were a direct component of the dependent
variable and, thus, an obvious problem of endogeneity would arise. After verifying for
multicollinearity with Crammer’s V, we excluded three variables: gender of adult (correlated with
supervision) and eye movements towards vehicles (correlated with car interaction). Supervision
was also recoded for the multivariate analysis into a binary variable indicating whether the child
was physically close (contact or within reach) or not (out of reach or no supervision). Table 3.4
describes the independent variables retained in the final models.

50
Table 3.4 Retained independent variables in the multivariate model
Retained independent variables Categories
Individual characteristics
Age 0: 4-8 years (Younger children) 1: 8-12 years (Older children)
Gender 0: Girl 1: Boy
Situational characteristics
Supervision 0: No adult 1: Adult but out of reach 2: Adult within reach or contact
Gender of adult 0: Male 1: Female 2: Both genders
Other pedestrians 0: Alone 1: 1 to 5 people 2: 6 people or more
Car interaction 0: No 1: Yes
Behavior characteristics
Stopping at the curb before crossing 0: No 1: Yes
Looked towards the vehicles before crossing 0: No 1: Yes
Looked straight ahead/at traffic light before crossing 0: No 1: Yes
Initiator of the crossing
0: No initiator (Adult and child at the same time) 1: Child initiator 2: Adult initiator
Road environment characteristics
Signage
0: No signage 1: Stop sign 2: Traffic light without pedestrian light 3: Traffic light with pedestrian countdown display
Crosswalk width 0: Less than 15m 1: Between 15m and 25m 2: More than 25m
Speed required to cross in time 0: 1 m/s or less 1: More than 1m/s
Distance between the nearest park entrance and the intersection
0: 5 m or less 1: More than 5 m
Source: Author (2018)

51
CHAPTER 4: RESULTS: AN EXAMINATION OF CHILD PEDESTRIAN RULE COMPLIANCE AT CROSSWALKS AROUND PARKS IN MONTREAL, CANADA
This thesis has been organized as an article-based manuscript. Hence, this chapter was prepared
as an article, and submitted to the Journal of Environmental Psychology. This paper is entitled “An
examination of child pedestrian rule compliance at crosswalks around parks in Montréal, Canada”
consisting an abstract, introduction, results, discussion, and a brief conclusion. The authors’ name
and their respective affiliations are as follows:
Authors: Mojgan Rafieia, Lambert Desrosiers-Gaudettea, Marie-Soleil Cloutier a,
Affiliations:
a Centre Urbanisation Culture Société, Institut National de la Recherche Scientifique, 385, Sherbrooke Est, Montréal, QC H2X 1E3, Canada

52
4.1 Abstract
Background: While urban parks are an undeniable popular destination for children, the scientific
community has paid very little attention to road safety nearby, in comparison to schools.
Objective: The objective of this study is to examine child pedestrian safety around parks by
considering four rule compliance measures: temporal, spatial and velocity compliance and visual
search.
Method: Street crossing observations of 731 children were recorded at 17 crosswalks around four
parks in Montreal, Canada in the summer of 2017. Information on child behaviors, road features,
and pedestrian-vehicle interactions were gathered in three separate forms. Chi-square tests are
used to highlight the individual, situational, behavioral and road environmental characteristics that
are associated with pedestrian rule compliance. These characteristics are further explored through
four different mixed-effects logistics regressions – one for each rule compliance measure, all using
the same set of correlates.
Results: About half of our sampled children started crossing at the same time as the adults who
accompanied them but more rule violations were observed when the adult initiated the crossing.
Many children were observed to be accelerating in the middle of the crossing as the park was
nearby. In multivariate models, gender of the child did not have a significant impact on rule
compliance. Several variables were positively associated with rule compliance: stopping at the
curb before crossing, parental close supervision, and pedestrian countdown signals. Pedestrian-
car interaction had a mixed impact on rule compliance: the presence of an interaction is positively
associated with visual search but negatively associated with temporal and velocity compliance.
Conclusion: Overall, rule compliance among children was high for each of our indicators, but about
two-thirds failed to comply with all four indicators. A few measures, like longer crossing signal and
pedestrian countdown display at traffic lights, may help to ease rule compliance and, ultimately,
provide safer access to parks.
Keywords: road traffic safety; crossing behavior; child pedestrian; rule compliance; crosswalk;
parks

53
4.2 Introduction
In Canada, traffic collisions are the leading cause of injury-related death for children under 14
years old (Natalie L Yanchar et al. 2012). On average, 30 child pedestrians are killed and more
than 2000 are injured every year, as Canada lags behind OECD’s top performers for the past
years (CCMTA 2013). A great proportion of these collisions occur at road intersections (Siram et
al. 2011).
Crossing a street involves a complex series of tasks - i.e. detecting traffic, planning the route,
assessing the speed and traffic, making oneself visible - that exacerbates the risk of injury for
children (Schieber and Thompson 1996). Hence, because of their small stature and their
developing physical and cognitive overall attributes, child pedestrians form a vulnerable road user
group at risk of severe injuries with long-term physical and mental impairments (Birken et al. 2006).
Active transportation has undeniable health benefits and commuting to schools, parks and other
children’s destinations can provide opportunities for physical activity (Frumkin 2003). However,
road insecurity while crossing streets is a well-founded reason for children to avoid them or for
parents to drive them to destination instead of walking (Ferenchak and Marshall 2017). Among
those destinations, much attention in the recent scientific literature has been paid to the road safety
around schools (ITF 2012; Boarnet et al. 2005). However, little research and much less effort has
been done regarding parks. Yet many children go to parks after schools or on weekends especially
in dense urban areas where there are no yards to play (Marcus and Francis 1997). Accordingly, a
recent study found that the risk of child’s pedestrian fatalities is greater around parks: 1.04 to 2.23
times higher than around schools and 1.16 to 1.81 times higher than any other citywide crossing
(Ferenchak and Marshall 2017), recalling the urge to study this important destination.
For children, injury prevention is often based on systematic behavioral rule application (Zeedyk et
al. 2001). Low level of compliance with road rules and unsafe behaviors from either drivers or
pedestrians are the main reasons for the low level of pedestrians' safety (Şimşekoğlu 2015). In
other words, appropriate usage of crosswalks (complying with rules) by pedestrians and motor
vehicles users increases the safety of pedestrians (Akin and Sisiopiku 2007). However, if a number
of studies cover the prevalence of traffic violations by pedestrians based on specific individual
characteristics like age or gender (Rosenbloom, Nemrodov and Barkan 2004; De Ceunynck et al.
2012), compliance to rules during childhood is much less widespread in research, making our
understanding limited on how various pedestrian and road environment characteristics may affect

54
a child’s compliance to road safety rules. The current study attempts to fill this gap regarding child
pedestrian safety around parks by examining individual, situational, behavioral and road
environment characteristics that determine whether the child complies with various road safety
rules during street crossings.
4.3 Factors associated with child pedestrian safety and compliance
Past research on child’s pedestrian injuries demonstrate that risk factors are related to four
categories, and that they have not changed for decades: children road accidents are caused by a
combination of individual, situational, behavioral and physical (road) environment characteristics.
4.3.1 Individual characteristics
Demographic characteristics such as age and gender are known as important predictors of child
pedestrian injuries (Parachute Canada 2016; Schuurman et al. 2009). Several studies point to the
increased road risk posed by younger pedestrian children, explaining it by their lack of traffic
knowledge and experience, cognitive and physical ability, and visual acuity (Dunbar, Hill and Lewis
2001; Oxley et al. 2005; Whitebread and Neilson 2000). As for gender, Barton and Schwebel
(2007) and Granié (2007) find that boy pedestrians are less likely to comply to road safety rules
and more likely to be involved in injury-related accidents.
4.3.2 Situational characteristics
Situational conditions during the crossing can have an effect on safety and compliance (Cinnamon,
Schuurman and Hameed 2011). When adults accompany children to and from destination, there
is a demonstrated reduction in the risk of injury (Barton and Schwebel 2007; Morrongiello 2005).
We make the hypothesis that the parent/caregiver’s gender may also have an impact, as adult
men are proven to display a more careless attitude and perform more violations (Rosenbloom and
Wolf 2002; Harré, Brandt and Dawe 2000). Likewise, the presence of other pedestrians crossing
jointly may influence the crossing speed, the timing, the trajectory and the level of attention
(Hoogendoorn, Bovy and Daamen 2002).

55
The term “interaction” usually refers to an event where, without any collision, the paths of both a
vehicle and a pedestrian intersect while they are still on the roadway (Trozzi, Manley and
Kasparias 2015). As conflicts lead to more collisions (Cloutier, Lachapelle and Howard 2018;
Sacchi and Sayed 2016), the occurrence of such interaction may alter the trajectory and which
may in turn lead to more collisions (Wazana et al. 1997; Cloutier et al. 2017).
4.3.3 Behavioral characteristics
Tempo displayed before and after the crossing (running or not), not stopping at the curb, not
looking before crossing, and attempting to cross when a car is near are considered unsafe
behaviors as they reduce the ability to correctly assess traffic situations (Rosenbloom, Ben-Eliyahu
and Nemrodov 2008; Tom and Granié 2011; Zeedyk et al. 2001). As behavior and judgement are
inherently inconsistent in young age groups, child pedestrians find themselves notably at risk.
Crossing in a straight line (not diagonally) and waiting for the next green light at the curb are known
to be related to fewer interactions with vehicles and therefore safer (Zhuang, Wu and Ma 2018;
Sisiopiku and Akin 2003).
4.3.4 Road environment characteristics
Road characteristics can reduce the probability of pedestrian injuries by providing a safer
environment to cross. Accordingly, uncontrolled crosswalks inflate the risk of conflict, especially in
urban areas (Hakkert, Gitelman and Ben-Shabat 2002). Crosswalk width also has an impact on
safety since wider streets create longer exposure to traffic for pedestrians (Montella and Mauriello
2010), despite the fact that pedestrians tend to cross them faster and more carelessly (Tarawneh
2001; X. Zhang et al. 2013).
As for pedestrian signals, they seem to have an effect on safety as pedestrians are less likely to
finish crossing on a red light there (Brosseau et al. 2013). However, other results from countdown
timer are highly contradictory: they demonstrate improvement in behavior (Brosseau et al. 2013;
Lipovac et al. 2013; Markowitz et al. 2006; Paschalidis et al. 2016), but they also give rise to non-
complying behaviors (Huang and Zegeer 2000; Vujanić et al. 2014), and led to an increase in the
number of late-starter and late-finisher pedestrians (Wanty and Wilkie 2010). As for child

56
pedestrians, Fu and Zou (2016) demonstrated that countdown display helped child pedestrians
to finish their crossing on time.
Finally, the most common time allowed for a pedestrian to cross in time at a light-controlled
intersection (i.e. based on a 1.2 meter per second walking speed) does not consider slower
walkers or various contextual characteristics: walking speed varies according to age (children
being slower), group size and composition, traffic-control condition or even departure signal
(Almodfer et al. 2017; Gates et al. 2006; Li et al. 2013; Marisamynathan and Perumal 2014).

57
4.4 Methods
4.4.1 Site selection
Four parks (n=4) were selected in Montreal, Canada following the typology developed by Apparicio
et al. (2010) which divides parks according to size and number of facilities (Figure 4.1). Adjacent
intersections and crosswalks (n=17) were selected to represent a variety of road and distance to
the entrance of the park.
Figure 4.1 Location of selected park in Island of Montreal Source: Author (2018)

58
4.4.2 Observation protocol
Observations of child pedestrians crossing toward the park were recorded between June and
August 2017, during daytime, on weekdays and weekends. Four trained observers were posted
near the sidewalk or in the park toward which the child pedestrian was heading. If there was more
than one child or a group of children, only one of them was randomly selected for observation.
Most of the time, the observers would work in groups of two. Crossing situations were recorded
with three different tools based on previous work (Cloutier et al. 2017): (1) child pedestrian
crossing behaviors, (2) crosswalks characteristics and, if applicable, (3) interactions between the
child pedestrian and vehicles.
Crossing behaviors were observed at three specific time (Figure 4.2): (1): at the curb, (2): on the
crosswalk, (3): after crossing. All the observations were recorded on iPads in the Survey123
software developed by ESRI (Environmental Systems Research Institute 2017). Each child and
each crosswalk had a unique ID, which made the link possible between the three forms.
Figure 4.2 Observation protocol for crossing of each child pedestrian Source: Author (2018)
4.4.3 Crosswalks characteristics
Four crosswalk characteristics are included in the present analysis (Table 4.1): presence and type
of traffic control sign (stop sign, traffic light, pedestrian light), crosswalk width (in meter), time

59
allowed to cross (in second), and distance between the nearest entrance of the park and the
crossing (see Figure 4.3 for examples). For street crossings with a traffic light, it was possible to
calculate the ‘required speed to cross on time’: by dividing the crosswalk width by the time allowed
to cross (pedestrian or green phase).
Table 4.1 Crossing characteristics and number of crosswalks
Characteristics Number of crosswalks
Signage
No signage 2 Stop sign 2 Traffic light without pedestrian light 5 Traffic light with pedestrian countdown display 8 Crosswalk width
Less than 15m 6
Between 15m and 25m 9
More than 25m 2 Required speed to cross in time
1 m/s or less 9 More than 1 m/s 4 Distance between nearest entrance and intersection
5 m or less 15 More than 5 m 2
Source: Author (2018)

60
Figure 4.3 Example of crosswalk characteristics: a) No signage b) Stop sign c) Traffic light without pedestrian light d) Traffic light with pedestrian countdown display e) Narrow crosswalk f) Wider crosswalk Source: Author (2018)

61
4.4.4 Retained individual, situational, and behavioral categories
Table 4.2 presents the characteristics observed in this study. Two individual characteristics were
recorded for each pedestrian: age and gender. Age was estimated in two categories: younger
(approximately less than 9 years old) represented 56.9% of our sample, and older children (~ 9 to
12 years old). Although we did not conduct systematic observation, our samples were almost
equally divided between boys (51.2%) and girls (48.8%). As for situational elements, for children
with an adult, we recorded the adult gender and the level of physical proximity; i.e., whether there
was a physical contact, and whether the child was within the adult’s reach. According to our
observation, 84% of children were supervised by adults, which 12.9% of them were out of reach.
It is worth noting that half of the children were accompanied by a female adult, while 14.2% of
them were with both male and female adults. We also recorded the number of other pedestrians
crossing jointly with child pedestrians. Based on our samples, 37.4% of children crossed the street
at the same time with other pedestrians (excluding their companion), with a few of them (8.3%)
crossing with six other pedestrians or more. In the present study, we only included a binary variable
if an interaction with a car occurred during the crossing, meaning whenever child and vehicle’s
paths would cross while the child was still on the crosswalk. It allows us to study broadly how a
vehicle crossing a child’s path affects rule compliance. We observed that 81.5% of child
pedestrians did not experience any interaction with vehicles while crossing the street.
For intersections with traffic lights, ‘Stopping at the curb before crossing’ indicates whether the
child waited for the next green light. We found that 59.1% of children stopped at the curb;
Moreover, only 36.4% of them looked towards the vehicles, while more than half of them (52.7%)
looked straight ahead/at traffic light before starting to cross. In this research, we also recorded the
‘Initiator of the crossing’ referring to the pedestrian, adult or child, who lead the crossing. When
there was no obvious initiator, the observer selected ‘adult and child at the same time’. In 56.5%
of our observations, the adult and the child started to cross at the same time, and in 33.5% of
them, the adult was the initiator.

62
Table 4.2 Retained individual, situational and behavioral categories Individual characteristics Categories n (%) Age Younger children 416 (56.9%)
Older children 315 (43.1%) Gender Girl 357 (48.8%)
Boy 374 (51.2%) Situational characteristics
Supervision No adult 117 (16.0%) Adult but out of reach 94 (12.9%)
Adult within reach or contact 520 (71.1%) Gender of adult Male 144 (19.7%)
Female 366 (50.1%) Both genders 104 (14.2%)
Other pedestrians Alone 457 (62.5%) 1- 5 pedestrians 213 (29.1%) 6 pedestrians or more 61 (8.3%)
Car interaction Yes 135 (18.5%) No 596 (81.5%) Behavior characteristics Stopping at the curb before crossing Yes 432(59.1%) No 299(40.9%) Looked towards the vehicles before crossing Yes 266 (36.4%) No 465 (63.6%) Looked straight ahead/at traffic light before crossing Yes 385 (52.7%) No 346 (47.3%)
Initiator of the crossing
Adult and child at the same time 413 (56.5%) Child Initiator 73 (10.0%) Adult Initiator 245 (33.5%)
Source: Author (2018)
4.5 Rule compliance
To account for child application of pedestrian safety rules, we created four binary composite
indicators that distinguished child pedestrians based on temporal, spatial and velocity compliance
and visual search. Temporal compliance is whenever a child finishes the crossing on time. Spatial
compliance is achieved by walking in a straight line. Velocity compliance refers to a crossing made
with a regular walking pace. Visual search relates to general eyes movements and attention
toward traffic-related elements.
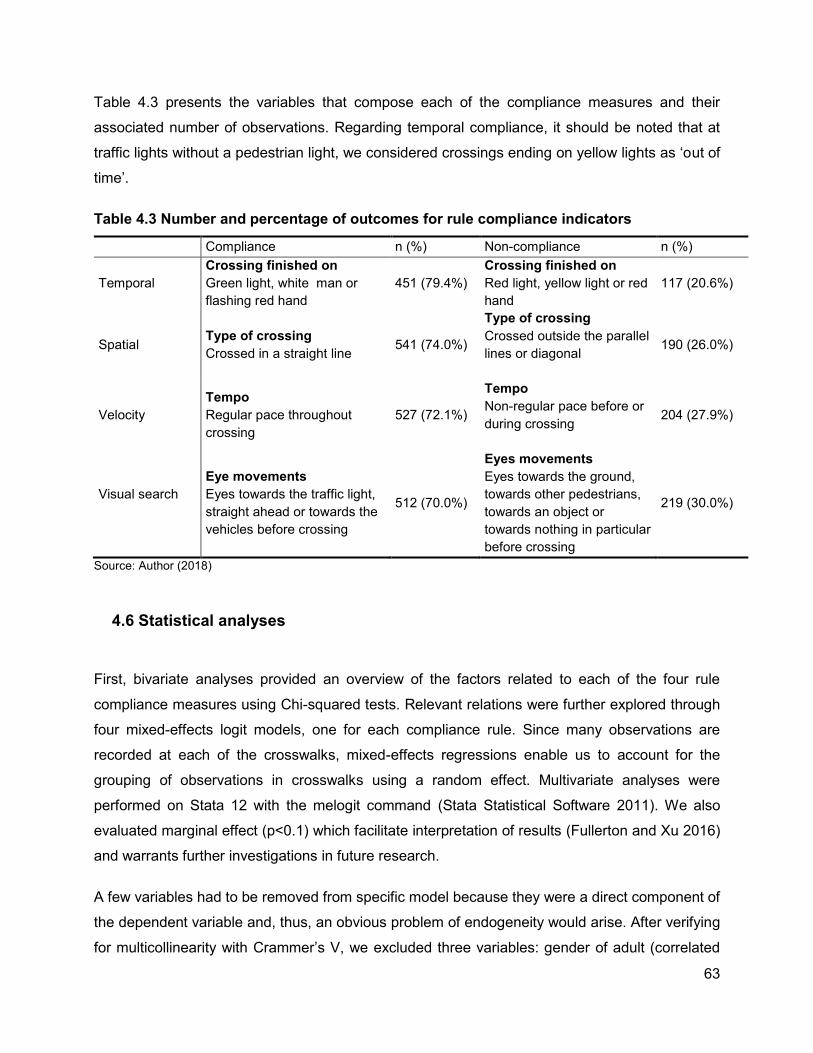
63
Table 4.3 presents the variables that compose each of the compliance measures and their
associated number of observations. Regarding temporal compliance, it should be noted that at
traffic lights without a pedestrian light, we considered crossings ending on yellow lights as ‘out of
time’.
Table 4.3 Number and percentage of outcomes for rule compliance indicators
Compliance n (%) Non-compliance n (%)
Temporal Crossing finished on Green light, white man or flashing red hand
451 (79.4%) Crossing finished on Red light, yellow light or red hand
117 (20.6%)
Spatial Type of crossing Crossed in a straight line 541 (74.0%)
Type of crossing Crossed outside the parallel lines or diagonal
190 (26.0%)
Velocity Tempo Regular pace throughout crossing
527 (72.1%)
Tempo Non-regular pace before or during crossing
204 (27.9%)
Visual search
Eye movements Eyes towards the traffic light, straight ahead or towards the vehicles before crossing
512 (70.0%)
Eyes movements Eyes towards the ground, towards other pedestrians, towards an object or towards nothing in particular before crossing
219 (30.0%)
Source: Author (2018)
4.6 Statistical analyses
First, bivariate analyses provided an overview of the factors related to each of the four rule
compliance measures using Chi-squared tests. Relevant relations were further explored through
four mixed-effects logit models, one for each compliance rule. Since many observations are
recorded at each of the crosswalks, mixed-effects regressions enable us to account for the
grouping of observations in crosswalks using a random effect. Multivariate analyses were
performed on Stata 12 with the melogit command (Stata Statistical Software 2011). We also
evaluated marginal effect (p<0.1) which facilitate interpretation of results (Fullerton and Xu 2016)
and warrants further investigations in future research.
A few variables had to be removed from specific model because they were a direct component of
the dependent variable and, thus, an obvious problem of endogeneity would arise. After verifying
for multicollinearity with Crammer’s V, we excluded three variables: gender of adult (correlated

64
with supervision) and eye movements towards vehicles (correlated with car interaction).
Supervision was also recoded for the multivariate analysis into a binary variable indicating whether
the child was physically close (contact or within reach) or not (out of reach or no supervision).
4.7 Results
More than 700 children (n=731) were observed at the 17 crosswalks. For temporal compliance,
only the observations recorded at an intersection with a traffic light are used (n=568). As we can
see in Table 4.3, between 70% and 80% of children complied with at least one indicator. However,
only a third of the observed child pedestrians complied with all the indicators altogether, both for
controlled and uncontrolled crosswalks.
4.7.1 Bivariate analysis
Table 4.4 presents the descriptive statistics for all the rule compliance indicators and for each
individual, situational, behavioral and road environment characteristics. Younger children were
crossing in straight line (spatial compliance) more often than the older ones, although they were
paying less attention visually to the road-related elements (visual search). There was no statistical
difference between boys and girls.
As for situational characteristics, the majority of children (84%) were accompanied by adults;
among them, 71% holding hands or within reach. The presence of an adult is positively associated
with spatial compliance and negatively related to visual search. The gender of the adult only seems
to have an impact on visual search, as the children accompanied by female adults are more likely
to look at road-related elements. The presence of other pedestrians crossing jointly has a positive
relationship with temporal and velocity compliance, but having groups of six or more is negatively
associated with spatial compliance.
If there is a car interaction, the child is less likely to cross on time (temporal compliance) and less
likely to adopt a regular pace throughout the crossing (velocity compliance). However, he/she is
more likely to comply with the visual search and spatial compliance indicators.
With respect to behavioral factors, 59% of children stopping at the curb before crossing positively
associated with all rule compliance measures except visual search (not significant). Children who

65
were looking straight ahead or at the traffic light before the crossing were more likely to follow
spatial compliance.
Almost half of children crossing with an adult did not have a noticeable initiator while 40% of
crossings were initiated by the adult and 12% by the child. When a child initiated the crossing, he
or she was less likely to comply with velocity compliance. When an adult initiated the crossing, the
child was less likely to comply with temporal compliance and visual search.
The presence of a pedestrian countdown display (47% of crosswalks and 32% of crossings) was
almost always associated with more rule compliance while the absence of signage is associated
with less rule compliance. An outstanding 93% of children who crossed at an intersection with a
pedestrian countdown display finished the crossing on time. This proportion dropped to 70% for
the children who crossed at a traffic light without a pedestrian signal. A child crossing a street with
a pedestrian light was less likely to walk in a straight line than a child crossing a street with only a
traffic light. Crosswalks of mid-sized width associated with more spatial compliance and visual
search, and negatively related to temporal compliance. Higher required speed to cross in time is
negatively associated with temporal compliance: 13% of children did not finish the crossing on
time at crosswalks with speed under 1 m/s, when this proportion reaches 46% at crosswalks with
speed over 1 meter/second.
Finally, a greater distance between the nearest entrance of the park and the crossing had a
positive relationship with spatial compliance and a negative relationship with velocity compliance.

66
Table 4.4 Descriptive statistics Temporal Spatial Velocity Visual Compliance Compliance Compliance Compliance Individual characteristics Age 0,77 0,002*** 0,877 0,001*** 4 to 8 265(79.9%) 326(78.4%) 298(71.6%) 272(65.4%) 9 to 12 186(78.9%) 215(68.3%) 224(71.1%) 240(76%) Gender 0.608 0.138 0.420 0.513 Girl 224(80.3%) 273(76.5%) 250(70.0%) 246(68.9%) Boy 227(78.6%) 268(72.7%) 272(72.7%) 266(71.1%) Situational characteristics Supervision 0.938 0.001*** 0.001*** 0.014** No adult 51(78.5%) 69(59.0%) 78(66.7%) 95(81.2%) Adult but out of reach 59(80.9%) 70(74.5%) 35(37.2%) 66(70.2%) Adult within reach or contact 341(79.3%) 402(77.3%) 409(76.7%) 351(67.5%) Gender of adult 0.110 0.200 0.400 0.030** Male 103(85.1%) 104(72%) 106(73.6%) 94(65.3%) Female 220(76.4%) 290(79.2%) 258(70.5%) 262(71.6%) Both genders 77(81.9%) 78(75%) 80(76.9%) 61(58.7%) Other pedestrians 0.001*** 0.001*** 0.009*** 0.330 No other pedestrians 229(74.1%) 350(76.6%) 313(69%) 329(72.0%) 1 to 5 people 166(83%) 165(77.5%) 156(73.2%) 142(66.7%) 6 people or more 56(93.3%) 26(42.6%) 53(86.9%) 41(67.2%) Car interaction 0.001*** 0.079* 0.076* 0.001*** Yes 70(68%) 108(80.0%) 88(65.2%) 110(81.5%) No 381(81.9%) 433(72.7%) 434(72.8%) 402(67.4%) Behavior characteristics Stopping at the curb before crossing 0.001*** 0.014** 0.006*** 299(69.2%) 0.557
Yes 319(85.8%) 334(77%) 325(75.2%) 213(71.2%) No 132(67.4%) 207(69%) 197(65.9%) Looked straight ahead/at traffic light before crossing
0.722 0.002*** 0.256
Yes 250(78.9%) 303(78.7%) 268(69.6%) - No 201(80.1%) 238(68.8%) 254(73.4%) - Looked towards the vehicles before crossing 0.127
0.499 0.001***
Yes 140 (75.7%) 193 (72.6%) 170 (63.9%) - No 311 (81.2%) 348 (74.8%) 352 (75.7%) - Initiator of the crossing 0.019** 0.135 0.001*** 311(75.3%) 0.001*** No initiator 253(84%) 296(71.7%) 294(71.2%) 61(83.6%) Child 48(77%) 60(82.2%) 35(47.9%) 140(57.1%) Adult 150(74%) 185(76%) 193(78.8%) Physical environment characteristics Signage 0.001*** 0.001*** 0.002*** 0.06* No signage - 56(69.1%) 48(59.3%) 52(64.2%) Stop sign - 53(64.6%) 50(62.0%) 65(79.3%) Traffic light without pedestrian light 232 (69.9%) 282(84.9%) 241(72.6%) 222(66.9%) Traffic light with pedestrian countdown display 219 (92.8%) 150(63.6%) 183(77.5%) 173(73.3%)
Crosswalk width 0.046** 0.001*** 0.240 0.077* Less than 15m 147 (84.5%) 192(64.9%) 207(69.9%) 195(65.9%) Between 15m and 25m 229 (73.4%) 303(85.8%) 250(70.8%) 261 (74.0%) More than 25m 75 (91.5%) 46(56.1%) 65(79.3) 56(68.3%) Required speed to cross in time 0,001*** 1 m/s or less 378(87.5%) - - - More than 1 m/s 73(53.7%) - - - Distance between the nearest entrance and intersection
0.150 0.001*** 0.016** 0.141
5 m or less 213(88.8%) 214(67.5%) 241(76.0%) 213(67.2%) More than 5 m 238(74.1%) 327(79.0%) 281(67.9%) 299(72.2%)
* p < 0.1 ** p < 0.05 *** p < 0.01 Source: Author (2018)

67
4.7.2 Mixed-effects logistic models
To account for the clustering of observations by crosswalks, our binary measures of rule
compliance (yes/no) were modeled in four different mixed-effect logistic regressions with the same
set of variables for each (see Table 4.5). An odds ratio over one means the variable increased the
odds of complying with the measure.
For temporal compliance, not many individual and situational variables were significant except the
car interaction, which is decreasing the odds of crossing on time. Out of all the variables, stopping
at the curb (waiting for the next green light) has the strongest odds of being associated with
finishing the crossing on time (temporal compliance). The presence of a pedestrian countdown
display also increases the odds of finishing on time by 3.6. However, an adult initiating the crossing
decreases the odds by more than 40%. As expected, a higher required speed to cross on time is
negatively associated with temporal compliance: a speed of more than 1 m/s reduces the odds of
finishing on time by 70%.
As for spatial compliance, the physical presence of an adult and the interaction with a car increases
the odds of crossing in a straight line; however, having big groups of pedestrians crossing jointly
(i.e. six or more) reduces the odds of complying with the measure. Spatial compliance shows
increased odds with behavior like stopping at the curb before crossing and looking at the traffic
and the light before crossing. A medium-sized crosswalk (between 15 and 24 meters) and a traffic-
light controlled intersection also increase the odds of complying spatially.
With regards to velocity compliance, older and supervised children have stronger odds of keeping
a constant speed throughout the crossing. Using crosswalks with traffic lights and, if so, stopping
at the curb before crossing also increase these odds. However, the odds of keeping a constant
speed are 65% less for a crossing initiated by a child.
Visual search increased odds of rule compliance for older children. The same can be said for
crossings with car interactions, for crosswalks of mid-sized width or for intersections with stop
signs or pedestrian countdown display. While the child initiating the crossing increases his odds
of looking at road-related elements by 1.8, the adult initiating the crossing has the reverse effect,
decreasing his odds by half.

68
Table 4.5 Mixed-effects logistic models of rule compliance (Odds ratios) Temporal Spatial Velocity Visual Age Younger [Ref.] Older 0.964 0.765 1.581** 1.465** Gender Girl [Ref.] Boy 0.779 0.913 1.150 0.964 Supervision No [Ref.] Yes 0.901 1.817*** 3.305*** 1.017 Other pedestrians Alone [Ref.] 1-5 people 1.383 1.083 0.838 0.807 6 people or more 1.830 0.434** 1.285 0.855 Car interaction No [Ref.] Yes 0.468*** 1.657* 0.560** 2.370*** Stopping at the curb before crossing No [Ref.] Yes 3.796*** 1.458* 1.456* 0.754 Looks at the traffic light/straight ahead No [Ref.] Yes 0.862 1.562** 0.829 - Initiator of the crossing None [Ref.] Child 0.731 1.725 0.356*** 1.789* Adult 0.526** 0.960 1.186 0.469*** Crosswalk width Less than 15m [Ref.] Between 15m and 25m - 2.307*** 0.887 1.88** More than 25m - 0.947 0.978 1.03 Signage No signage [Ref.] Stop sign - 1.658 1.569 2.186* Traffic light without pedestrian light - 2.080* 2.003** 1.119 Traffic light with pedestrian countdown display 3.577*** 0.840 1.924* 2.376** Required speed to cross in time 1 m/s or less [Ref.] More than 1 m/s 0.301*** - - - Distance between nearest entrance and intersection
5 m or less More than 5 m 1.813 1.010 0.712 1.490* Constant 8.910*** 0.745 0.704 1.124 Crossing site constant 0.000 0.071 0.000 0.000 Number of groups 13 17 17 17 Number of observations 568 731 731 731 Chi square 89.81 71.59 77.63 64.86 AIC 477.346 762.471 819.083 851.139 * p < 0.1 ** p < 0.05 *** p < 0.01 Source: Author (2018)

69
4.8 Discussion
4.8.1 Age: the only significant individual factor
Age was found to be the only significant individual factor in child pedestrian rule compliance. The
older children tended to show a more effective visual search and a more constant walking pace,
which is similar to other research results (Dunbar, Hill and Lewis 2001; Oxley et al. 2005;
Whitebread and Neilson 2000). Neither the gender of the child nor the one of the accompanying
adult had a significant impact.
4.8.2 Adult companion and car interaction affect child pedestrians rule compliance
As for situational factors, our results are consistent with previous research studies on supervision:
children who are physically close to adults are more likely to keep a regular pace (Rosenbloom,
Ben-Eliyahu and Nemrodov 2008) and walk in a straight line (Granié 2007). These findings are
reasonable as the physical supervision from an adult creates an inhibitory control on a child’s
behaviors. To the best of our knowledge, there is no previous research study that examines the
impact of the crossing initiator– adult or child – on rule compliance. Our results provide evidence
that whenever adults initiate the crossing, children are less likely to pay attention to road-related
elements and are less likely to finish the crossing on time. This might be owed to the fact that
children supervised, as opposed to children alone, may sometime display careless behaviors
because they rely on the adults for their safety (Rosenbloom, Shahar and Perlman 2008; Granié
2007; van der Molen 1982). Likewise, whenever children initiate the crossing, they are more likely
to perform a visual search because, hypothetically, they become responsible for their own safety.
Seemingly, children who initiate the crossing are also more likely to change their walking pace. It
can be hypothesized from our field observations that these children, already excited about going
to the park, initiate the crossing and accelerate throughout it in order to reach it faster.
As shown by other research (Langbroek et al. 2012; Pasanen and Salmivaara 1993), car
interaction and red light violation have direct association: we found that car interaction decreases
the chance of finishing a crossing on time, which might be due to children changing their behavior
in order to avoid or manage the interactions with the vehicles. As such, children who experienced
a conflict with approaching vehicles considerably increased their visual search. Indeed,

70
pedestrian-vehicle conflict risk can be compensated by an appropriate visual search (Langbroek
et al. 2012). Along the same lines, we found that interactions increase odds of spatial compliance
which may also be explained as a compensatory safe behavior from children since the proper
usage of (marked) crosswalks can reduce interaction with vehicles (Sisiopiku and Akin 2003).
Finally, we found that children were more likely to change their walking pace when they
experienced a traffic interaction, which has also been reported by Pasanen and Salmivaara
(1993).
4.8.3 Stopping at the curb and looking at road-related elements: two significant factors before crossing
Children who stop at the curb have more time and make better and more reasonable crossing
decisions. These results are consistent with others saying that stopping at the curb and waiting for
the next green light before crossing increases the odds of finishing the crossing on time and allows
the pedestrian to walk at a constant speed without having to rush (Koh, Wong and Chandrasekar
2014). Looking at road-related elements prior to the crossing is also in line with previous studies:
pedestrians who are visually aware are more likely to comply with the rules (Thomson et al. 1996;
Tom and Granié 2011).
4.8.4 Road elements: many significant factors
Several road elements have the significant associations with the four forms of compliance, but
their magnitude were not the highest. As expected, children are more likely to finish on time at
shorter crosswalks. When it came to wider crosswalks, they are more likely to have better visual
search and walk in a straight line (which is also significant at crossings with traffic lights), which
echoes previous research stating that children are more conservative in their behaviors when they
are exposed to faster and denser traffic (Abrashev et al. 1999; Cloutier et al. 2017; Montella and
Mauriello 2010; Noland and Quddus 2004).
Since the Manual of Uniform Traffic Control Devices for Canada (MUTCD) (1998) and other similar
manuals recommend 1.2 m/s as the suggested speed to cross a street with traffic signal, it was
no surprise that children were less likely to meet temporal compliance at signalized crosswalks

71
where the required speed was over 1 m/s. Indeed, many scholars believe that a crossing speed
of 1.2 m/s is too fast for most pedestrians (Tarawneh 2001).
Our results depict that higher level of signage such as pedestrian countdowns is generally
associated with more rule compliance, which is in line with previous research (Markowitz et al.
2006). Countdown display seems to have a considerable impact on temporal compliance: when
informed of the time left to cross in time, pedestrians may accelerate their walking speed
accordingly in order to finish on time (Fu and Zou 2016; Wanty and Wilkie 2010). At intersections
with traffic lights, children were more likely to walk in a straight line, which reinforces the idea that
when exposed to heavier traffic, children adopt behaviors that are deemed more careful.
4.8.5 What role for the park as a destination
Although urban parks are undeniably popular destinations for children, the scientific community
has paid very little attention to them in comparison to schools when studying pedestrian road
safety. Although our results did not directly capture a significant park effect, it seems to have a
singular impact on child pedestrians' behaviors. During our observations, parks had stimulating,
yet less predictable, effects on child pedestrians' crossing behavior, such as sudden acceleration,
and more agitated eye movements. For example, out of the 28% of children who changed their
walking tempo during the crossing, the vast majority were accelerating (84%) towards the park.
Moreover, out of the 17% of children who were running in the park after the crossing, 75% were
already running beforehand, right in the middle of the street. Granié (2007) found the opposite
when studying child pedestrians near schools: 68% of them did not run while crossing towards
schools.
4.9 Conclusion
This study explores child pedestrians’ crossing behaviors on roads around parks through an
observational survey of individual, situational, behavioral and road environment predictors of
pedestrian rule compliance. Despite the very limited literature on child pedestrian rule compliance,
let alone child pedestrian rule compliance around parks, past studies that focused on adult safety
at street intersections allowed us to create an analytical framework to fill this gap.

72
Although our results are informative and relevant to child pedestrian injury prevention, they have
two limitations. First, for many predictors, any assumption of causality would be hazardous. For
instance, whenever a car interaction arises, did it make the child more visually aware, or was the
car interaction just a light collateral of what would have otherwise been a more severe conflict had
it not been for the visual awareness of the child? Second, we assume that there is a
correspondence between rule compliance and children’s safety; however, we did not find any
conclusive results showing that children who comply with pedestrian rules are safer.
Consequently, another question is raised: to what extent are the child pedestrians who comply
with road rules safer? This issue can be addressed in future research by considering all road users
in one framework and by focusing on pedestrian-vehicle conflicts.

73
CHAPTER 5: DISCUSSION
Considering the pedestrian rule compliance, the current study provides insights into how different
factors including individual, situational, behavioral, and road environment characteristics might
affect children's behavior who cross the roads next to parks. The most important results found in
this study will be discussed and elaborated in detail in the following sections.
5.1 Age category: the only significant individual factor
In our study, age category was found to be the only individual factor influencing child pedestrians
rule compliance. The older children tended to show a more effective visual search and a more
constant walking pace, which is similar to other research results (Rosenbloom, Ben-Eliyahu and
Nemrodov 2008; Whitebread and Neilson 2000). This finding makes sense since older children
are more experienced and knowledgeable compared to younger ones, which makes them better
at perceiving road conditions. Neither the gender of the child nor the one of the accompanying
adult had a significant impact.
5.2 Adult companion and car interaction affects child pedestrians rule compliance
As for situational factors, our results are consistent with previous research studies on supervision:
children who are physically close to adults are more likely to keep a regular pace (Rosenbloom,
Ben-Eliyahu and Nemrodov 2008) and walk in a straight line (Granié 2007). These findings are
reasonable as children who are physically close to their adults better followed their supervisors
while crossing the road. To the best of our knowledge, there is no previous research investigating
the influence of the crossing initiator (either child or adult) on rule compliance.According to our
results, whenever adults initiated the crossing, children were less likely to pay attention to road-
related elements and were less likely to finish the crossing on time. This might due to the fact that
children supervised, as opposed to children alone, may sometime display careless behaviors
because they rely on the adults for their safety (Rosenbloom, Shahar and Perlman 2008; Granié
2007; van der Molen 1982).

74
Likewise, whenever children initiated the crossing, they were more likely to perform a visual search
and to change their walking pace because, hypothetically, they became responsible for their own
safety. It can be hypothesized from our field observations that these children, already excited
about going to the park, initiated the crossing and accelerated to reach it faster.
As shown by other research (Langbroek et al. 2012; Pasanen and Salmivaara 1993), car
interaction and red light violation have direct association: we found that car interaction decreases
the chance of finishing crossing on time, which might be due to the children executing more
cognitive tasks while crossing to manage the interaction with the vehicles. As such, children who
experienced a conflict with approaching vehicles considerably increased their visual search in
order to be more aware of the traffic elements. Indeed, pedestrian-vehicle conflict risk can be
compensated by an appropriate visual search (Langbroek et al. 2012). Along the same lines, we
found that interactions increase odds of spatial compliance which may also be explained as a
compensatory safe behavior from children since the proper usage of (marked) crosswalks can
reduce interaction with vehicles.(Sisiopiku and Akin 2003). Finally, we found that children were
less likely to have velocity compliance when they experience a traffic interaction, which has been
also reported by Pasanen and Salmivaara (1993).
5.3 Stopping at the curb and looking at road-related elements: two significant factors before crossing
Children who stop at the curb have more time and make better and more reasonable crossing
decisions. These results are consistent with others saying that stopping at the curb and waiting for
the next green light before crossing increases the odds of finishing the crossing on time and allows
the pedestrian to walk at a constant speed without having to rush (Koh, Wong and Chandrasekar
2014). Looking at road-related elements prior to the crossing is also in line with previous studies:
pedestrians who are visually aware are more likely to comply with the rules (Thomson et al. 1996;
Tom and Granié 2011).
5.4 Road elements: many significance factors
Several road elements have the most significant associations with the four form of compliance,
but their magnitude were not the highest. . As expected, children are more likely to finish on time

75
at shorter crosswalks. When it came to wider crosswalks, they are more likely to have better visual
search and walk in a straight line (which is also significant for crossing with traffic lights), which
echoes previous research stating that children are more conservative in their behaviors when they
are exposed to faster and denser traffic., (Abrashev et al. 1999; Cloutier et al. 2017; Montella and
Mauriello 2010; Noland and Quddus 2004).
Since the Manual of Uniform Traffic Control Devices for Canada (MUTCD) (1998) and other similar
manuals recommend 1.2 m/s as the suggested speed to cross a street with traffic signal, it was
no surprise that children were less likely to meet temporal compliance at signalized crosswalks
where the required speed was over 1 m/s. Indeed, many scholars believe that a crossing speed
of 1.2 m/s is too fast for most pedestrians (Tarawneh 2001).
Our results depict that higher level of signage such as pedestrian countdowns is generally
associated with more rule compliance, which is in line with previous research (Markowitz et al.
2006). Countdown display seems to have a considerable impact on temporal compliance: when
informed of the time left to cross in time, pedestrians may accelerate their walking speed
accordingly in order to finish on time (Fu and Zou 2016; Wanty and Wilkie 2010). At intersections
with traffic lights, children were more likely to walk in a straight line, which reinforces the idea that
when exposed to heavier traffic, children adopt behaviors that are deemed more careful.
5.5 What role for the park as destination?
Although urban parks are undeniably popular destinations for children, the scientific community
has paid very little attention to them in comparison to schools when studying pedestrian road
safety. Although our results did not directly capture a significant park effect, it seems to have a
singular impact on child pedestrians' behaviors. During our observations, parks had stimulating,
yet less predictable, effects on child pedestrians' crossing behavior, such as sudden acceleration,
and more agitated eye movements. For example, out of the 28% of children who changed their
walking tempo during the crossing, the vast majority were accelerating (84%) towards the park.
Moreover, out of the 17% of children who were running in the park after the crossing, 75% were
already running beforehand, right in the middle of the street. Granié (2007) found the opposite
when studying child pedestrians near schools: 68% of them did not run while crossing towards
schools.

76
5.6 Limitation of the study
As in any observational research, the current study has limitations associated with the
methodology and data analysis. As one of the main limitations, there were few previous studies
on this topic, nor any statistical resources about child pedestrian injuries on roads surrounding the
parks which prevented us from appropriate validation of our results.
Our observation type also limited our study. Since we employed non-participatory observations,
some factors such as pedestrians' age category and quality of their visual search were estimated.
The other item that drew our attention during the observation was recording children's "head and
eyes movements" factor. Practically, it was impossible to make sure whether children are looking
at the coming vehicles or at other non-related objects. In order to tackle these drawbacks, a short
talk after completion of each observation could be helpful in considering better estimations in future
research.
There are also some limitations in our analysis protocol. For instance, we only considered 4 parks
which were almost in the inner city. Moreover, we studied only some crosswalks and intersections
adjacent to the park, not all of them. Although, these limitations do not allow us to generalize our
results to different situations, the models were strong due to enjoying adequate number of
observation (731 for 17 crosswalks). Generally speaking, crossing a road is a complex process in
which many factors are involved. As some of these factors happen simultaneously, it is not
possible to determine proper causal relationships between them. Nevertheless, our results are
informative on several aspects.

77
CONCLUSION
This study explores child pedestrian rule compliance through a field observation. To achieve our
objectives, we examined individual, situational, behavioral and road environment characteristics.
Previous studies conducted for adults helped us to assess the compliance of pedestrian rules, and
we adapt them to the child pedestrian context since little has been done on this specific population.
Our results demonstrate that certain characteristics could noticeably affect children rule
compliance. However, complexity of road crossing process makes it challenging to find which
factor is dominant. Our findings point to the need for safer road environment near urban parks,
such as countdown display, and adjusting the allowed time of traffic lights based on speed of
children.
There are some items to be investigated more in future research. First, the urban parks can be
selected from different neighborhood to better generalize the results to different regions. Secondly,
we assumed that there is a correspondence between rule compliance and children’s safety;
however, we did not find any conclusive results showing that children who comply with pedestrian
rules are safer. Consequently, another question is raised: to what extent are the child pedestrians
who comply with road rules, safer? This issue can be addressed in future research by considering
all road users in one framework, and by focusing on pedestrian-vehicle conflicts. Thirdly, as
previously mentioned, there is not a specified required speed reference for child pedestrians in
the literature. Hence, more research can be conducted to appropriately estimate this variable.

78
APPENDIX 1: BEHAVIOR OBSERVATION FORM

79

80
APPENDIX 2 : ROAD ENVIRONMENT OBSERVATION FORM

81

82
APPENDIX 3 : VEHICLE INTERACTION OBSERVATION FORM

83
APPENDIX 4 : SYNTHÉSE DU MÉMOIRE EN FRANCAIS
Introduction
L’activité physique est importante pour la santé des enfants dans la mesure où elle leur favorise
une croissance et un développement sain. Nous remarquons aujourd’hui que la participation des
enfants à l’activité physique diminue. Les enfants marchent moins et passent moins de temps
pour se rendre à une destination précise. Au Canada par exemple, le transport actif (tels que la
marche ou le vélo) a diminué de 25% à 19% entre 1998 et 2005 (Turcotte, 2008). Cette diminution
comprend le transport scolaire actif chez les enfants de 6 à 12 ans (L'Agence métropolitaine de
transport 1998, 2003).
Malgré les avantages de l'activité physique, la plupart des parents conduisent leurs enfants à
l'école, au parc et au terrain de jeu, au lieu de les laisser marcher (Tremblay, Brownrigg et Deans,
2008). La perception des parents par rapport au risque de circulation semble élevée. Ce qui les
amène à choisir d'autres moyens de transport pour leurs enfants (Cloutier, Bergeron et Apparicio
2011), et réduire par la suite leur activité physique. La sécurité routière apparait comme la raison
principale pour laquelle les parents conduisent leurs enfants à un lieu particulier. Entre 1994 et
2003, par exemple, le Canada a enregistré des décès liés à des blessures impliquant des piétons,
dont 18% pour des enfants de 5-9 ans et 14% des enfants de 10-14 ans (Cloutier, Bergeron et
Apparicio 2011). Par la suite, le Canada a opté pour une série de programmes nationaux de
sécurité routière visant à réduire le nombre de décès dans les collisions routières (Transport
Canada 2011). Ayant pour objectif d’atteindre des conditions de sécurité optimales pour les êtres
humains (Maurice et al.1997), la promotion de la sécurité apparaît nécessaire. Maurice et al.
(1997) soulignent qu’en connaissant les facteurs de risque d'une activité, les accidents pourraient
être contrôlés. D’après ces auteurs, la sécurité a deux dimensions différentes l'une est objective
et évaluée en fonction des paramètres de comportement et d'environnement; l'autre est plutôt
subjective, basée sur le sentiment de sécurité ou d'insécurité au sein de la population. De plus, la
«sécurité» est définie comme étant les besoins psychologiques de l'homme pour améliorer sa
santé (Maslow 1968).Selon Maslow (1968), la sécurité et la santé d'une société sont basées sur
les comportements et les conditions environnementales.
Utilisons le terme « blessures involontaires », plutôt que le terme « accidents » (Davis et Pless,
2001), Il apparaît que la possibilité de blessures involontaires dépend de plusieurs facteurs (NICE,

84
2016). Les principaux facteurs qui sont étudiés dans cette recherche sont les facteurs individuels,
situationnels, comportementaux, environnementaux, et enfin les facteurs liés aux règles de
conformité de la route.
Pour les facteurs individuels, l’âge et le sexe apparaissent comme d’importants prédicteurs des
blessures chez les enfants (Schuurman et al. 2009). Traverser la rue exige des comportements
complexes qui ne sont pas suffisamment développés chez les enfants (CCATM, 2013). Plusieurs
études ont indiqué que les enfants piétons les plus jeunes sont plus à risque que ceux plus âgés
(Whitebread et Neilson, 2000). Ainsi, le taux de blessures chez les garçons semble plus élevé que
chez les filles. Les garçons sont moins susceptible de se conformer aux règles de sécurité
routières (Connelly et Isler 1996, Barton et Schwebel 2007).
Les facteurs situationnels pendant la traversée ont une influence sur la sécurité et la conformité
des piétons (Cinnamon, Schuurman et Hameed 2011). Ces facteurs concernent
l’accompagnement des enfants (enfant accompagné ou non, le sexe du compagnon, etc.), la
présence de l’enfant avec d’autres piétons et l’interaction.
En effet, certaines études antérieures ont montré que les enfants accompagnés par un adulte
dégagent moins le comportement à risque (Fu et Zou 2016, Zeedyk et Kelly 2003). D’autres
recherches ont constaté que la présence d’un adulte n’a pas d’influence sur la diminution des
comportements à risque (comme ne pas regarder ou s’arrêter avant de traverser, etc.). En ce qui
concerne le sexe d’un compagnon adulte, des travaux ont estimé que le comportement à risque
est plus fréquent chez les hommes (Rosenbloom et Wolf 2002, Brandt et Dawe 2000).
Ainsi, certaines études ont montré que le nombre de piétons attendant en même temps sur le
trottoir (avant la traversée) peut influencer le comportement à risque lors de la traversée. Alors
que d’autres recherches ont constaté le contraire (Havard et Willis 2012 ; Yagil 2000).
L’interaction est définie comme la présence de deux usagers de la route (piéton et véhicule) en
même temps et dans un même lieu (De Ceunynck et al 2012). Selon certains auteurs, la traversée
en ligne droite, la recherche visuelle adéquate et le rythme régulier de la marche diminuent le
risque d’interaction entre les piétons et les véhicules (D Akin et Sisiopiku 2000 ; Langbroek et al.
2012).
Les facteurs liés aux comportements sont souvent étudiés dans le domaine de la sécurité des
piétons (Cinnamon, Schuurman et Hameed 2011). Il apparait que le rythme de marche avant et
après la traversée influence le risque de blessures ou aussi de décès (Fontaine et Gourlet 1997).
La recherche visuelle avant et pendant la traversée est ainsi définis comme des facteurs affectant

85
la sécurité des piétons. Cette recherche visuelle consiste à regarder vers les feux de circulation,
les véhicules en mouvement, les autres piétons et le sol (Rosenbloom, Ben-Eliyahu et Nemrodov
2008). De plus, selon Sisiopiku et Akin (2003), si les piétons traversent la rue en ligne droite aux
passages pour piétons, ils peuvent éviter l’interaction avec les véhicules. Afin de traverser en
sécurité, nous nous attendons à ce que les piétons choisissent d'attendre sur le trottoir le moment
adéquat pour s’engager sur la chaussée (Zhuang, Wu et Ma 2018). En effet, les piétons qui
traversent avant ou après que le bonhomme soit rouge sont plus susceptible d’être impliqués dans
un accident (King, Soole and Ghafourian 2009).
En ce qui concerne les facteurs environnementaux, les passages non contrôlés peuvent créer un
conflit entre les piétons et les véhicules dans les zones urbaines. Néanmoins, la présence d’une
signalisation à des intersections avec une limite de vitesse de plus de 30km/h réduit de 50 % la
probabilité du risque (Gårder 1989). Pour les traverses dotées d'un compte à rebours, un grand
nombre de piétons se conforment aux signaux, contrairement aux passages pour piétons sans
compte à rebours (Lipovac et al, 2013). Ainsi, la largeur des traverses est utilisée comme l’un des
paramètres permettant de définir le confort du piéton dans une traverse avec signalisation (Darcin
Akin 2000). Pour la vitesse de marche, elle varie selon l'âge, la taille et la composition du groupe,
l'état de santé, l'incapacité, le signal de départ, etc. (Gates et al. 2006).
Enfin, la conformité aux règles de la route est mesurée par la recherche visuelle avant de traverser
(Granié 2007), la conformité temporelle (finir la traversée à temps) (Jin et al. 2013), la vélocité
(garder une vitesse constante) (Ishaque et Noland 2008), la conformité spatiale (la traversée en
ligne droite, ou entre les lignes parallèles) (Granié 2007, Sisiopiku et Akin 2003).
Considéré comme la destination la plus importante des enfants après l’école (Timperio et al. 2004,
les parcs constituent l'un des principaux lieux favorisant l'activité physique (Andrew, 2008, Ho et
al. (2003). Cependant, parmi les raisons qui empêchent les gens à fréquenter les parcs, nous
trouvons les problèmes de santé, le manque d'argent et de temps, l'accessibilité, les installations
inappropriées et, surtout, les problèmes de sécurité (Cordell et al.1999).
Certains facteurs, comme la proximité des parcs, le manque d'infrastructures, la criminalité et la
faible sécurité routière, sont considérés comme des obstacles à l'utilisation d'un parc (Active
Transportation Alliance 2014). Les résultats de l'étude de Christie et al. (2009) sur les risques de
blessures de la route pour les enfants des zones défavorisées ont montré que les parents ont
estimé que les parcs possèdent ne sont pas suffisamment sécuritaire et sont inaccessibles aux

86
enfants. Néanmoins, les parcs peuvent être améliorés en possédant des clôtures et en étant plus
accessibles avec de meilleures traversées et de meilleurs éclairages.
Il est important de signaler que plusieurs travaux ont été réalisés sur la sécurité des enfants
piétons vers l’école, alors que la recherche sur ce sujet autour des parcs reste restreinte. Cette
recherche vient combler cette lacune en étudiant le comportement des enfants piétons en
traversant les intersections autour des parcs. Nous nous basons sur le modèle du design
écologique de Sallis, Prochaska (2006). L’objectif de cette étude est d’évaluer les caractéristiques
liées à l’individu, à la situation, au comportement et à l’environnement physique. Ces
caractéristiques vont nous permettre d’évaluer le degré de conformité des enfants aux règles de
la sécurité routière.
Méthodologie
Afin de répondre à notre objectif, Nous avons opté pour une méthode quantitative. Quatre
différents parcs montréalais ont été sélectionnés (n = 4), tels que parc Jarry, parc De-Turin, Parc
Molson et Parc Gabriel-Sagard. Cette sélection a été faite selon le modèle à quatre catégories
développé par (Apparicio 2010) et qui classe ces lieux selon la taille et le nombre d’installations.
Les intersections sélectionnées pour notre étude sont celles les plus proches des terrains de jeux
et des rues principales. Les traverses retenues sont celles qui comportent un nombre important
de piétons et qui sont marqués par une densité de circulation et une variété de caractéristiques
(comme la présence d'un panneau de signalisation, la largeur du passage pour piétons, la
distance par rapport à l'entrée du parc, etc.). Au total, 17 passages pour piétons ont été choisis
pour cette analyse (tableau 1).
Basé sur le projet MAPISE (La marche à pied pour les aînés, 2014), nous avons utilisé pour notre
recherche la technique d’observation indirecte pour repérer les comportements des enfants
piétons. Les grilles d'observation adoptées pour notre travail s'appuient sur le projet «ESSAIM et
PARI, 2013»- inspiré par l'étude de Cloutier et al. (2017), D'Amours Ouellet (2016), et Bergeron
et al. (2017). Ces grilles ont été développées à partir de différents concepts et d’une revue de
littératures. Trois grilles différentes ont été utilisées; (1) grille d'observation pour les
comportements des enfants âgés entre 4-8 et 9-12 ans lors de la traversée et, dans le cas échéant,
(2) grille d'observation pour les caractéristiques de l'environnement routier, (3) grille d'observation
des interactions avec des véhicules (annexe 1,2,3).

87
L'observation a été effectuée entre mi-juin et mi-août 2017 par deux observateurs formés. Les
grilles d’observations ont été intégrées sur une tablette numérique à travers l’application
Survey123 par ESRI (Environmental Systems Research Institute 2017). D’abord, chaque traverse
a été analysée selon ses caractéristiques routières. Ensuite, dans le cas des traverses avec un
volume important de circulation et un nombre d'enfants plus élevé, un observateur a complété la
grille d'interaction, et un autre a observé les comportements des enfants piétons. S'il y a eu plus
d'un enfant ou groupe d'enfants, un seul d'entre eux a été choisi au hasard pour l’observation. Un
identifiant unique a été attribué pour chaque enfant et chaque traverse. Cet identifiant permet le
lien entre les trois grilles. Au moins 731 données ont été collectées pour l'analyse quantitative.
Tableau 1: Les traverses sélectionnées autour des parcs
Par
k
Jarry
Cro
ssw
alk
num
ber
De-Turin C
ross
wal
k nu
mbe
r
Molson
Cro
ssw
alk
num
ber
Gabriel-
Sagard
Cro
ssw
alk
num
ber
Cro
ssw
alk
Cro
ssw
alk-
ID
Jarry / Saint-Laurent
1
Jean-Talon / De Lanaudière
8
Beaubien / D’Iberville
11
Sagard
15
Saint-Laurent / Jarry
2
De Lanaudière / Jean-Talon
9
D’Iberville / Beaubien
12
Sagard / Jean-Talon
16
Saint-Laurent / Gounod (North)
3
Chambord / Jean_Talon
10
D’Iberville / Elsdale
13
Jean-Talon / Sagard
17
Saint-Laurent / Gounod (South)
4
Elsdale / D’Iberville
14
Saint-Laurent / Villeray
5
Saint-Laurent / Gary-Carter
6
Gary-Carter / Saint-Laurent
7
Source : Auteur (2018)
Les variables indépendantes ont été sélectionnées en fonction de la revue de littérature et des
grilles d'observation. Elles sont présentées en quatre différentes catégories : telles que les
caractéristiques individuelles, situationnelles, comportementales et environnementales (Tableau
2). La logique des prédicats pour la «conformité temporelle» basée sur le Code de la sécurité
routière du Québec (QHSC) (2017) consiste à repérer les enfants qui ont terminé le passage à
temps ou hors du temps. Comme l’explique le tableau 3, si les enfants finissent leur passage
quand le bonhomme blanc est encore affiché, quand la main rouge est clignotante ou même
quand le feu est vert, leur passage est considéré à temps et dans les délais légaux.

88
Tableau 2 : Variables indépendantes conservées dans le modèle multivarié
Retained independent variables Categories Individual characteristics
Age 0: 4-8 years (Younger children) 1: 8-12 years (Older children)
Gender 0: Girl 1: Boy
Situational characteristics
Supervision 0: No adult 1:Adult but out of reach 2: Adult within reach or contact
Gender of adult 0:Male 1:Female 2:Both genders
Other pedestrians 0: Alone 1: 1 to 5 people 2: 6 people or more
Car interaction 0: No 1: Yes
Behavior characteristics
Stopping at the curb before crossing 0: No 1: Yes
Looked towards the vehicles before crossing 0: No 1: Yes
Looked straight ahead/at traffic light before crossing 0: No 1: Yes
Initiator of the crossing 0: No initiator (Adult and child at the same time) 1: Child initiator 2: Adult initiator
Road environment characteristics
Signage
0: No signage 1: Stop sign 2: Traffic light without pedestrian light 3: Traffic light with pedestrian countdown display
Crosswalk width 0: Less than 15m 1: Between 15m and 25m 2: More than 25m
Speed required to cross in time 0: 1 m/s or less 1: More than 1m/s
Distance between the nearest park entrance and the intersection 0: 5 m or less 1: More than 5 m
Source: Auteur (2018)
Dans le cas contraire, ils sont considéré comme n’ayant pas respecté les règles relatives aux
piétons et ayant terminé la traversée en dépassant le temps réglementaire (tableau 3).
Pour la «conformité spatiale», basée aussi sur le Code de la sécurité routière du Québec (QHSC
,2017), les piétons doivent traverser la rue en ligne droite. Dans la présente étude, les enfants qui
traversent le passage pour piétons (traverse) en ligne droite répondent à la conformité spatiale.

89
Par contre, les enfants qui traversent les passages pour piétons (ou la traverse) en diagonale sont
considérés comme étant «non spatialement conformes» (tableau 3). Les comportements de la
marche les plus sécuritaires liés à la vélocité des piétons sont inspirés par les règles des piétons
développées par Granié (2007). Ces comportements comprennent : «marcher et ne pas courir sur
le trottoir (marche)», «marcher à un rythme régulier» et «marcher et ne pas courir pendant la
traversée (vitesse de la traversée)». Pour notre étude, le maintien d'un rythme régulier, avant et
pendant la traversée, est définie comme «conformité de vitesse». Alors que le rythme accéléré
avant la traversée ou le rythme irrégulier pendant la traversée est défini comme «non-vélocité»
(Tableau3).
Tableau 3 : Variables composites de la conformité aux règles, type d'analyse
Mixed effect logistic
regression Model No
Type of indicators Retained variables Number of recorded
observation
1 Temporal
Crossing ended on:
568 Compliance 1: Green light, white man or flashing red hand Non
compliance 0: Red light, yellow light or red hand
2 Spatial
Type of crossing:
731 Compliance 1: Crossed in straight line Non
compliance 0: Outside the parallel lines or diagonal
Velocity
Tempo:
731 3 Compliance 1: Regular pace before and during crossing Non
compliance 0: Accelerated pace before crossing or
non-regular pace during crossing
Visual search
Head/eye direction before crossing:
731
4 Compliance 1: Head/eye towards the traffic light, straight ahead or towards the vehicles
Non compliance
0: Head/eye towards the ground, towards other pedestrians,
towards an object or towards nothing in particular
Source: Auteur (2018)
Ne pas regarder avant de traverser est l'un des indices de comportement dangereux utilisés par
Rosenbloom, Ben-Eliyahu et Nemrodov (2008). Pour la «recherche visuelle», cela suppose que
si les enfants regardent droit devant un feu ou vers les véhicules avant de traverser, ils appliquent
une recherche visuelle. Regarder les autres piétons, les objets en main, le sol ou rien du tout lié
à la rue, sont des signes de la recherche non-visuelle des enfants avant de commencer à traverser
la rue.

90
Après avoir effectué les logiques de variables dépendantes, un tableau d'analyse descriptive
bivariée a été créé à l’aide du logiciel SAS (Statistical Analysis System 2002-201) pour résumer
les données et construire une vision globale des variables indépendantes, liées à chacune des
quatre règles de conformité. Ensuite, le «Crammer's V» a été réalisé pour vérifier la
multicolinéarité entre les variables (Annexe 5).
Les modèles de régression logistique avec effets mixtes sont utilisés dans des modèles
statistiques pour indiquer des groupes de variables binaires. Comme de nombreuses
observations ont été effectuées pour chacune des traverses, des régressions logistiques avec
effets mixtes ont été réalisées. Ces régressions permettent d'évaluer les corrélations
significatives tout en s'assurant que les effets fixes des traverses sont traités comme tels. Enfin,
l'analyse multivariée a été faite sur Stata 12 (Stata Statistical Software 2011) avec la commande
melogit.
Résultats
Comme nous pouvons le voir dans le tableau 4, entre 70% et 80% des enfants se conforment,
séparément, aux différentes règles (la conformité temporelle, spatiale, la vélocité et la recherche
visuelle). Cependant, sur les 731 observations enregistrées, 37% des enfants ont respecté les
règles spatiales, de vitesse et visuelles. Sur les 568 enfants ayant utilisé une traverse réglée par
des feux, seulement 34% ont respecté les quatre mesures.

91
Tableau 4 : Variables composites de la conformité aux règles
Compliance n (%) Non-compliance n (%)
Temporal Crossing finished on Green light, white man or flashing red hand
451 (79.4%) Crossing finished on Red light, yellow light or red hand
117 (20.6%)
Spatial Type of crossing Crossed in a straight line 541 (74.0%)
Type of crossing Crossed outside the parallel lines or diagonal
190 (26.0%)
Velocity Tempo Regular pace throughout crossing
527 (72.1%)
Tempo Non-regular pace before or during crossing
204 (27.9%)
Visual search
Eye movements Eyes towards the traffic light, straight ahead or towards the vehicles before crossing
512 (70.0%)
Eyes movements Eyes towards the ground, towards other pedestrians, towards an object or towards nothing in particular before crossing
219 (30.0%)
Source: Auteur (2018)
Le tableau 4.4 mentionné dans chapitre 4, présente les statistiques descriptives de la conformité
et de la non-conformité des quatre mesures (temporelle, spatiale, de vitesse et visuelle) pour
chaque caractéristique; individuelle, situationnelle, comportementale et environnementale.
L'âge semble avoir un faible impact sur la conformité aux règles. Les enfants plus jeunes
traversent en ligne droite plus souvent que les plus âgés, mais ils accordent moins d'attention
visuelle aux éléments liés à la route. Il n'y a pas de différence statistique dans le respect des
règles entre les garçons et les filles.
Nous remarquons aussi que la présence d'un adulte, qu'ils soient proches ou non, est
positivement associée à la conformité spatiale. Néanmoins, cette présence est négativement liée
à la conformité visuelle. Les enfants accompagnés de femmes ont plus de chances de faire la
recherche visuelle avant de traverser, que ceux accompagnés d'hommes adultes, et plus encore
que les enfants accompagnés des deux sexes. La présence d'autres piétons traversant en même
temps que l’enfant a une relation positive avec la conformité temporelle et la conformité de la
vitesse. Cependant, les groupes de plus de 6 personnes sont négativement associés à la
conformité spatiale. Dans le cas d’une interaction avec une voiture, l'enfant est moins susceptible
de traverser à temps (conformité temporelle), mais plus susceptible de se conformer visuellement
et spatialement, alors qu’il ne peut pas garder une vitesse constante.
92
En ce qui concerne les facteurs comportementaux, notre observation sur le terrain a montré que
76% des enfants ont attendu le prochain feu vert aux intersections signalisées. L'attente du
prochain feu vert est positivement associée à toutes les mesures de conformité aux règles, à
l'exception de la recherche visuelle, où aucune différence statistique n'est observée. Les enfants
qui ont regardé droit devant ou au feu avant le passage ont été plus susceptibles de marcher en
ligne droite. Pour l’initiation à la traversée, lorsqu'un enfant a initié la traversée, il a été beaucoup
plus susceptible d'accélérer et donc de ne pas respecter la mesure de la vitesse. Lorsqu'un adulte
initie la traversée, l'enfant est moins susceptible de respecter les mesures temporelles et visuelles.
Garder une vitesse constante tout le long du passage, a une relation positive avec la conformité
temporelle.
Pour les caractéristiques des traverses, la présence d'un affichage de compte à rebours pour
piétons est généralement associée à une plus grande conformité aux règles. Tandis que l'absence
de signalisation est associée à une conformité aux règles moins importante. Un pourcentage
remarquable de 93% des enfants, traversant une intersection avec un compte à rebours pour
piétons, ont terminé le passage à temps. Le seul cas où un piéton n'est pas positivement associé
à la conformité est le cas de la mesure spatiale, car un enfant traversant une rue avec un feu pour
piétons a moins chance de marcher en ligne droite qu'un enfant traversant une rue dotée
seulement d’un feu pour voiture. La conformité temporelle est fortement associée à la vitesse
requise pour traverser à temps. Si seulement 13% des enfants n'ont pas terminé la traversée, aux
passages pour piétons, à temps avec « une vitesse inférieure à 1 m / s », cette proportion atteint
46% aux passages pour piétons à «une vitesse supérieure de 1 m / s». La plus grande distance
entre l'entrée la plus proche du parc et l'intersection a une relation positive avec la conformité
spatiale et une relation négative avec la conformité de vitesse.
Quant aux catégories des traverses, nos mesures binaires de la conformité aux règles ont été
modélisées dans quatre différentes régressions logit avec effets mixtes, avec le même groupe de
variables pour chacune. Le rapport des cotes supérieur à 1 signifie que la variable augmente les
chances de se conformer à la mesure (tableau 5).
Pour la conformité temporelle, peu de variables individuelles et situationnelles étaient
significatives, à l'exception de l'interaction avec la voiture qui diminue les chances de traverser à
temps. Parmi toutes les variables, « attendre le prochain feu vert » a les plus grandes chances
d'être associé à la « fin du passage à temps ». La présence d'un affichage de compte à rebours
pour piétons augmente également de plus de 3,5 les chances de finir à temps la traversée.

93
Cependant, un parent ou un compagnon qui commence la traversée diminue les chances de finir
à temps. Comme prévu, une vitesse requise supérieure pour traverser est négativement associée
à la conformité temporelle.
En ce qui concerne la conformité spatiale, il n'y a pas d'associations significatives relatives aux
corrélats individuels. La présence physique d'un adulte et l'interaction avec une voiture
augmentent les possibilités de traverser en ligne droite. Cependant, six autres piétons – ou plus-
qui traversent en même temps réduisent les chances de traverser en ligne droite. La conformité
spatiale a favorisé certains comportements, tels que l'attente du prochain feu vert et l'observation
de la circulation et de la lumière avant de traverser. Une traverse de taille moyenne (entre 15 et
24 mètres) et une intersection à feux de circulation, mais sans feu pour piétons, augmentent
également la conformité spatiale.
Pour la conformité de vitesse ou la vélocité, les enfants plus âgés et les enfants accompagnés ont
plus de chances de maintenir une vitesse constante tout au long de la traversée. Utiliser des
traverses avec feux de circulation et attendre le prochain feu vert, augmente également ces
chances. Cependant, l'interaction avec la voiture est négativement associée à la vitesse
constante, les chances de maintenir une vitesse constante sont 2.8 (0.35) fois moins pour une
traversée initiée par un enfant que pour une traversée sans initiateur.
En ce qui concerne la recherche visuelle, les enfants plus âgés ont plus de chances de pratiquer
la recherche visuelle avant de traverser, et l'interaction avec la voiture est positivement associée
à la recherche visuelle. De même, la recherche visuelle a augmenté les probabilités de conformité
pour les traverses de largeur moyenne ou pour les intersections avec des panneaux d'arrêt ou
des feux avec un compte à rebours pour piétons. Quant à l'initiateur de la traversée, si l'enfant
initie la traversée, cela augmente les chances de regarder les éléments liés à la route de 1,8. Par
contre, si l'adulte initie le passage cela provoque un effet inverse, diminuant la cote de 2,1. La
distance à l'entrée la plus proche du parc n'est pas très significative pour les mesures, sauf pour
la recherche visuelle où une distance plus élevée augmente la probabilité de 1,5 à l'intervalle de
confiance de 90%.

94
Tableau 5 : Modèles logit avec effet mixte de la conformité aux règles (rapport des cotes)
Temporal Spatial Velocity Visual Age Younger [Ref.] Older 0.964 0.765 1.581** 1.465** Gender Girl [Ref.] Boy 0.779 0.913 1.150 0.964 Supervision No [Ref.] Yes 0.901 1.817*** 3.305*** 1.017 Other pedestrians Alone [Ref.] 1-5 people 1.383 1.083 0.838 0.807 6 people or more 1.830 0.434** 1.285 0.855 Car interaction No [Ref.] Yes 0.468*** 1.657* 0.560** 2.370*** stopping at the curb before crossing No [Ref.] Yes 3.796*** 1.458* 1.456* 0.754 Looks at the traffic light/straight ahead No [Ref.] Yes 0.862 1.562** 0.829 - Initiator of the crossing None [Ref.] Child 0.731 1.725 0.356*** 1.789* Adult 0.526** 0.960 1.186 0.469*** Crosswalk width Less than 15m [Ref.] Between 15m and 25m - 2.307*** 0.887 1.88** More than 25m - 0.947 0.978 1.03 Signage No signage [Ref.] Stop sign - 1.658 1.569 2.186* Traffic light without pedestrian light - 2.080* 2.003** 1.119 Traffic light with pedestrian countdown display 3.577*** 0.840 1.924* 2.376** Required speed to cross in time 1 m/s or less [Ref.] More than 1 m/s 0.301*** - - - Distance between nearest entrance and intersection
5 m or less More than 5 m 1.813 1.010 0.712 1.490* Constant 8.910*** 0.745 0.704 1.124 Crossing site constant 0.000 0.071 0.000 0.000 Number of groups 13 17 17 17 Number of observations 568 731 731 731 Chi square 89.81 71.59 77.63 64.86 AIC 477.346 762.471 819.083 851.139 * p < 0.1 ** p < 0.05 *** p < 0.01
Source: Auteur (2018)

95
Discussion
Dans notre étude, les enfants les plus âgés ont tendance à montrer une recherche visuelle plus
efficace et un rythme de marche plus constant, ce qui confirme les résultats d'autres recherches
(Rosenbloom, Ben Eliyahu et Nemrodov 2008, Whitebread et Neilson 2000). Ce constat semble
logique puisque les enfants plus âgés sont plus expérimentés et mieux informés que les plus
jeunes, ce qui les rend plus aptes à percevoir les conditions routières.
En ce qui concerne la supervision, nos résultats semblent en cohérence avec les études
précédentes : les enfants physiquement proches des adultes sont plus susceptibles de garder un
rythme régulier (Rosenbloom, Ben Eliyahu et Nemrodov 2008) et de marcher en ligne droite
(Granié 2007). Ces résultats sont raisonnables car les enfants qui sont physiquement proches des
adultes ont bien suivi ces superviseurs en traversant la route.
Selon nos résultats, chaque fois que les adultes initient la traversée, les enfants appaîssent moins
susceptibles de prêter attention aux éléments liés à la route et de terminer le passage à temps.
Également, quand les enfants initient la traversée, ils sont plus susceptibles d'effectuer une
recherche visuelle et de changer leur rythme de marche car, hypothétiquement, ils deviennent
responsables de la sécurité du groupe. On peut émettre l'hypothèse que ces enfants, ayant hâte
d’arriver au parc, ont initié la traversée et accéléré pour l'atteindre plus rapidement.
Comme le montrent d'autres recherches (Langbroek et al. 2012 ; Pasanen et Salmivaara, 1993),
l'interaction avec les véhicules ainsi que l’infraction pour la lumière rouge sont directement
associées : l'interaction avec les véhicules diminue la conformité temporelle, ce qui peut être
expliqué par le fait que enfants, en traversant la rue, utilisent plutôt leur système cognitif afin de
pouvoir gérer l'interaction avec les véhicules. Ainsi, les enfants qui ont eu un conflit avec les
véhicules qui s'approchent ont considérablement augmenté leur recherche visuelle afin d'être plus
conscients des éléments liés à l’environnement routier. En effet, le risque de conflit piéton-véhicule
peut être compensé par une recherche visuelle appropriée (Langbroek et al. 2012). Nous avons
également constaté que cette interaction augmente les chances de conformité spatiale, ce qui
n'est pas conforme au résultat précédent, affirmant que l'utilisation appropriée des traverses
(marqués) peut réduire l'interaction avec les véhicules (Sisiopiku et Akin 2003). Enfin, nous avons
constaté que les enfants étaient moins susceptibles de respecter la vitesse lorsqu'ils se trouvent
en interaction avec les véhicules, ce qui a également été soulevé par Pasanen et Salmivaara
(1993).

96
Nos résultats ont démontré que les enfants qui s'arrêtent au bord du trottoir avant de traverser ont
plus souvent un rythme de passage régulier, ce qui est conforme aux études précédentes (Koh,
Wong et Chandrasekar 2014).
Comme attendu, les enfants ont plus la chance de finir à temps à des traverses plus courtes. Dans
le cas des traverses plus larges, les enfants dégagent une meilleure recherche visuelle et sont
plus susceptibles de marcher en ligne droite (ce qui est également important pour traverser dans
des intersections dotées des feux de circulation), ce qui nous renvoie à des études antérieures
montrant que les comportements des enfants sont plus conservateurs lorsqu'ils sont exposés à
une circulation plus rapide et plus dense ou à des collisions de véhicules (Abrashev et al., 1999,
Cloutier et al., 2017, Montella, Mauriello et Eng, Noland et Quddus, 2004). Nous avons également
constaté que les enfants accélèrent leur vitesse de marche pour finir à temps lorsqu'il y a un
compte à rebours, ce qui est similaire pour les adultes (Fu et Zou 2016, Wanty et Wilkie 2010,
Markowitz et al. 2006).
Bien que les parcs urbains soient les destinations populaires pour les enfants, les scientifiques
leur ont accordé très peu d'attention par rapport aux écoles. Les parcs semblent avoir des effets
stimulants, mais moins prévisibles, sur le comportement des enfants piétons durant la traversée,
comme l’accélération brusque et les mouvements oculaires rapides et agités. Bien que nos
résultats n'aient pas soulevé- directement- un effet significatif du parc, ce dernier apparaît avoir
un impact particulier sur les comportements des enfants piétons. Par exemple, sur les 28%
d'enfants qui ont changé leur rythme de marche pendant la traversée, la grande majorité (84%)
accélère. De plus, sur les 17% d'enfants qui courent dans le parc après la traversée, 75% ont
commencé à courir en traversant la rue.
Conclusion
Cette étude examine la conformité aux règles relatives aux enfants piétons à travers une
observation sur le terrain. Pour atteindre nos objectifs, nous avons analysé les caractéristiques
individuelles, situationnelles, comportementales et celle de l'environnement routier. Des études
antérieures menées pour les adultes nous ont aidés à évaluer la conformité aux règles relatives
aux piétons et nous les avons adaptées au contexte des enfants piétons, car peu d’études ont été
faites sur cette population spécifique. Nos résultats ont démontré que certaines caractéristiques
pourraient affecter sensiblement la conformité aux règles des enfants. Cependant, la complexité

97
du processus de « traverser la rue » rend difficile la détermination du facteur dominant. Nos
résultats soulignent la nécessité d'un environnement routier plus sûr à proximité des parcs
urbains, comme l'affichage du compte à rebours et l'adaptation de la durée autorisée des feux de
circulation à la vitesse des enfants.
Enfin, quelques éléments pourraient être étudiés et approfondis dans des recherches futures. Tout
d'abord, les parcs urbains peuvent être sélectionnés à partir de différents quartiers afin de mieux
généraliser les résultats à différentes régions. Deuxièmement, nous avons supposé qu'il existe
une correspondance entre la conformité aux règles et la sécurité des enfants. Cependant, nous
n'avons trouvé aucun résultat démontrant que les enfants qui se conforment aux règles relatives
aux piétons sont plus en sécurité. Par conséquent, une autre question est posée: dans quelle
mesure les enfants piétons qui se conforment aux règles de la route sont-ils plus sains? Cette
question peut être abordée dans les recherches futures en considérant tous les usagers de la
route dans un cadre unique, et en mettant l'accent sur les conflits entre les piétons et les véhicules.
Troisièmement, comme mentionné précédemment, il n'y a pas de référence de vitesse requise
pour les enfants piétons dans la littérature. Par conséquent, des recherches peuvent être menées
pour estimer cette variable de manière appropriée.

98
REFERENCES
Abrashev, MV, AP Litvinchuk, MN Iliev, RL Meng, VN Popov, VG Ivanov, RA Chakalov and C Thomsen. 1999. « Comparative study of optical phonons in the rhombohedrally distorted perovskites LaAlO 3 and LaMnO 3. » Physical Review B 59 (6): 4146.
Akin, Darcin. 2000. « Evaluation of pedestrian crosswalks in an urban environment. », Michigan State
University.
Akin, Darcin and VP Sisiopiku. 2000. « Estimating spatial crossing compliance at pedestrian crosswalks. »
Institute of Transportation Engineers.
———. 2007. Pedestrian Crossing Compliance Characteristics at-grade Signalized Crosswalks: Case Study
in a Downtown-University Campus Environment.
Alberta Recreation and Park Association. 2010. Reporting on the Pan Canadian Survey Re: Children and
Nature.
Alhajyaseen, Wael. 2012. Design Criteria for Crosswalk Width and Position at Signalized Intersections.
Allen, Erin M., Amy L. Hill, Erma Tranter and Karen M. Sheehan. 2013. « Playground Safety and Quality in
Chicago. » Pediatrics 131 (2): 233. 10.1542/peds.2012-0643. http://pediatrics.aappublications.org/content/131/2/233.abstract.
Almodfer, Rolla, Shengwu Xiong, Xiangzhen Kong and Pengfei Duan. 2017. « Pedestrian Crossing Speed
Patterns and running frequency analysis at a non-signalized marked crosswalk: Quantitative and qualitative approaches. » Sustainable Cities and Society 34: 183-192. doi: https://doi.org/10.1016/j.scs.2017.07.003.
Apparicio, Philippe, Marie-Soleil Cloutier, Anne-Marie Séguin and Josefina Ades. 2010. « Accessibilité
spatiale aux parcs urbains pour les enfants et injustice environnementale. Exploration du cas montréalais. » Revue internationale de géomatique 20 (3): 363-389.
Assailly, J. P. 1997. « Characterization and prevention of child pedestrian accidents: An overview. » Journal
of Applied Developmental Psychology 18 (2): 257-262. doi: https://doi.org/10.1016/S0193-3973(97)90039-3.
Avineri, Erel, David Shinar and Yusak O Susilo. 2012. « Pedestrians’ behaviour in cross walks: the effects of
fear of falling and age. » Accident Analysis & Prevention 44 (1): 30-34.

99
Barton, Benjamin K and David C Schwebel. 2007. « The roles of age, gender, inhibitory control, and parental
supervision in children's pedestrian safety. » Journal of Pediatric Psychology 32 (5): 517-526.
Beckwith, Dana and Katharine Hunter-Zaworski. 1998. « Passive pedestrian detection at unsignalized
crossings. » Transportation Research Record: Journal of the Transportation Research Board (1636): 96-103.
Bedimo-Rung, Ariane L., Andrew J. Mowen and Deborah A. Cohen. 2005. « The significance of parks to
physical activity and public health: A conceptual model. » American Journal of Preventive Medicine 28 (2, Supplement 2): 159-168. doi: https://doi.org/10.1016/j.amepre.2004.10.024.
Bergeron, Jacques, H Bélanger Bonneau, R Bourbeau, JP Thouez and A Rannou. 1998. « Influence des
caractéristiques des individus et de l'environnement sur le taux de respect de la signalisation chez les piétons et les cyclistes [Influence of individual and environmental characteristics on compliance with road signs and markings among pedestrians and cyclists]. » Université de Montréal, Montréal, Qc.
Bergeron, Jacques, Marie-Soleil Cloutier, Juan Torres and Akkl St-Denis. 2017. La sécurité des enfants près
des écoles et des terrains de jeux : rapport de recherche. Programme de recherche en sécurité routière FRQNT, MTQ, FRQS (Action concertée).
Birken, Catherine S, Patricia C Parkin, Teresa To and Colin Macarthur. 2006. « Trends in rates of death from
unintentional injury among Canadian children in urban areas: influence of socioeconomic status. » Canadian Medical Association Journal 175 (8): 867-867.
Boarnet, M. G., C. L. Anderson, K. Day, T. McMillan and M. Alfonzo. 2005. « Evaluation of the California
Safe Routes to School legislation: urban form changes and children's active transportation to school. » American Journal of Preventive Medicine 28. doi: 10.1016/j.amepre.2004.10.026.
Bolstad, Cheryl A. 2001. « Situation Awareness: Does it Change With Age? » Proceedings of the Human
Factors and Ergonomics Society Annual Meeting 45 (4): 272-276. doi: 10.1177/154193120104500401.
Bolstad, Cheryl A and Thomas M Hess. 2000. « Situation awareness and aging. » Situation awareness
analysis and measurement: 277-302.
Bouchard, Claude, Steven N Blair and William L Haskell. 2007. Physical activity and health. Human Kinetics
1.
Brosseau, Marilyne, Sohail Zangenehpour, Nicolas Saunier and Luis Miranda-Moreno. 2013. « The impact
of waiting time and other factors on dangerous pedestrian crossings and violations at signalized
100
intersections: A case study in Montreal. » Transportation Research Part F: Traffic Psychology and Behaviour 21: 159-172. doi: https://doi.org/10.1016/j.trf.2013.09.010.
Cambon de Lavalette, Brigitte, Charles Tijus, Sébastien Poitrenaud, Christine Leproux, Jacques Bergeron
and Jean-Paul Thouez. 2009. « Pedestrian crossing decision-making: A situational and behavioral approach. » Safety Science 47 (9): 1248-1253. doi: https://doi.org/10.1016/j.ssci.2009.03.016.
Canadian Motor Vehicle Traffic Collision, Statistics. 2013. « Countermeasures to Improve pedestrain safety
in canada. » Ottawa, Ontario.
Carey, Nick. 2005. « Establishing pedestrian walking speeds (draft results). » http://www westernite
org/datacollectionfund/2005/psu_ ped_summary pdf retrieved on May 25: 2011.
Carver, Alison, Anna Timperio and David Crawford. 2008. « Playing it safe: the influence of neighbourhood
safety on children's physical activity. A review. » Health & place 14 (2): 217.
CCMTA. 2013. Canadian Council of Motor Transportation Administrators
2013 Report.
Chandra, Satish and Anish Kumar Bharti. 2013. « Speed Distribution Curves for Pedestrians During Walking
and Crossing. » Procedia - Social and Behavioral Sciences 104: 660-667. doi: https://doi.org/10.1016/j.sbspro.2013.11.160.
Chiesura, Anna. 2004. « The role of urban parks for the sustainable city. » Landscape and urban planning
68 (1): 129-138.
Cinnamon, Jonathan, Nadine Schuurman and S. Morad Hameed. 2011. « Pedestrian Injury and Human
Behaviour: Observing Road-Rule Violations at High-Incident Intersections. » PLOS ONE 6 (6): e21063. doi: 10.1371/journal.pone.0021063.
Cloutier, Marie-Soleil. 2016. Quand les intersections représentent des obstacles à franchir pour les piétons
âgés : rapport de recherche du projet PARI Piétons âgés, risque et insécurité routière chez une population grandissante. Programme de recherche en sécurité routière FRQSC, SAAQ, FRQS (Action concertée).
Cloutier, Marie-Soleil, Jacques Bergeron and Philippe Apparicio. 2011. « Predictors of Parental Risk
Perceptions: The Case of Child Pedestrian Injuries in School Context. » Risk Analysis 31 (2): 312-323. doi: 10.1111/j.1539-6924.2010.01501.x.
Cloutier, Marie-Soleil, Ugo Lachapelle, Andrée-Anne d’Amours-Ouellet, Jacques Bergeron, Sébastien Lord
and Juan Torres. 2017. « “Outta my way!” Individual and environmental correlates of interactions

101
between pedestrians and vehicles during street crossings. » Accident Analysis & Prevention 104: 36-45.
Cloutier, Marie-Soleil, Ugo Lachapelle and Andrew W Howard. 2018. Bound to Happen? An Empirical
Example of the Relationship Between Pedestrian Collisions and Interaction Rates at Intersections.
Connelly, Marie L. and Robert Isler. 1996. « Child pedestrians' judgments of safe crossing gaps at three
different vehicle approach speeds: A. » Education & Treatment of Children 19 (1): 19. Article. http://search.ebscohost.com/login.aspx?direct=true&db=a9h&AN=9604011174&lang=fr&site=ehost-live.
Cordell, H Ken, Barbara L McDonald, R Jeff Teasley, John C Bergstrom, Jack Martin, Jim Bason and Vernon
R Leeworthy. 1999. « Outdoor recreation participation trends. ».
D'Amours Ouellet, Andrée-Anne. 2016. « L'environnement routier près des écoles primaires et les
interactions de trafic impliquant des enfants piétons. », Université du Québec, Institut national de la recherche scientifique.
Daamen, Winnie. 2004. « Modelling passenger flows in public transport facilities. ».
Davis, Ronald M and Barry Pless. 2001. « BMJ bans “accidents”: Accidents are not unpredictable. » BMJ:
British Medical Journal 322 (7298): 1320.
De Ceunynck, Tim, Evelien Polders, Stijn Daniels, Aliaks Laureshyn, Elke Hermans, Tom Brijs and Geert
Wets. 2012. « Behavioural analysis of vehicle interactions at priority-controlled and right-hand priority intersections. ».
Desapriya, Ediriweera, Meridith Sones, Tansey Ramanzin, Sara Weinstein, Giulia Scime and Ian Pike. 2011.
« Injury prevention in child death review: child pedestrian fatalities. » Injury Prevention 17 (Suppl I): i4. 10.1136/ip.2010.026914. http://injuryprevention.bmj.com/content/17/Suppl_I/i4.abstract.
Dewar, R. E. . 1992. « Driver and pedestrian characteristics. » In: J Pline (Ed), Traffic engineering
handbook (4th ed) Englewood Cliffs, NJ: Prentice-Hall.
Dommes, Aurélie, Marie-Axelle Granie, Marie-Soleil Cloutier, Cécile Coquelet and Florence Huguenin-
Richard. 2015. « Red light violations by adult pedestrians and other safety-related behaviors at signalized crosswalks. » Accident Analysis and Prevention (80): pp. 67-75. doi: 10.1016/j.aap.2015.04.002.
Dunbar, George, Ros Hill and Vicky Lewis. 2001. « Children's attentional skills and road behavior. » Journal
of experimental psychology: Applied 7 (3): 227.

102
Ekman, Lars. 1996. « On the Treatment of Flow in Traffic Safety Analysis,-a non-parametric approach
applied on vulnerable road users. » Bulletin/University of Lund, Lund Institute of Technology, Department of Traffic Planning and Engineering 136.
Environmental Systems Research Institute. 2017. Survey 123 Connect for ArcGIS,Version 2.1.9.
,https://www.arcgis.com/features/index.html.
Faria, Jolyon J., Stefan Krause and Jens Krause. 2010. « Collective behavior in road crossing pedestrians:
the role of social information. » Behavioral Ecology 21 (6): 1236-1242. doi: 10.1093/beheco/arq141.
Ferenchak, Nicholas N. and Wesley E. Marshall. 2017. « Redefining the child pedestrian safety paradigm:
identifying high fatality concentrations in urban areas. » Injury Prevention. 10.1136/injuryprev-2016-042115. http://injuryprevention.bmj.com/content/early/2017/01/10/injuryprev-2016-042115.abstract.
Fontaine, Hélène and Yves Gourlet. 1997. « Fatal pedestrian accidents in france: A typological analysis. »
Accident Analysis & Prevention 29 (3): 303-312. doi: https://doi.org/10.1016/S0001-4575(96)00084-X.
Forde, David Robert. 1993. « Perceived Crime, Fear of Crime, and Walking Alone at Night. » Psychological
Reports 73 (2): 403-407. doi: 10.2466/pr0.1993.73.2.403.
Frumkin, Howard. 2003. « Healthy Places: Exploring the Evidence. » American Journal of Public Health 93
(9): 1451-1456. doi: 10.2105/AJPH.93.9.1451.
Fu, Lianning and Nan Zou. 2016. « The influence of pedestrian countdown signals on children’s crossing
behavior at school intersections. » Accident Analysis & Prevention 94: 73-79. doi: https://doi.org/10.1016/j.aap.2016.05.017.
Fullerton, Andrew S and Jun Xu. 2016. Ordered Regression Models: Parallel, Partial, and Non-Parallel
Alternatives. Chapman and Hall/CRC.
Fuselli, Pamela, Natalie L. Yanchar and Injury Prevention Committee Canadian Paediatric Society. 2012. «
Preventing playground injuries. » Paediatrics & Child Health 17 (6): 328-328. http://www.ncbi.nlm.nih.gov/pmc/articles/PMC3380751/.
García, Alfredo, Antonio José Torres, Mario Alfonso Romero and Ana Tsui Moreno. 2011. « Traffic
Microsimulation Study to Evaluate the Effect of Type and Spacing of Traffic Calming Devices on Capacity. » Procedia - Social and Behavioral Sciences 16: 270-281. doi: https://doi.org/10.1016/j.sbspro.2011.04.449.

103
Gårder, Per. 1989. « Pedestrian safety at traffic signals: A study carried out with the help of a traffic
conflicts technique. » Accident Analysis & Prevention 21 (5): 435-444. doi: https://doi.org/10.1016/0001-4575(89)90004-3.
Gates, Tim J, David A Noyce, Andrea R Bill, Nathanael Van Ee and TJ Gates. 2006. Recommended walking
speeds for pedestrian clearance timing based on pedestrian characteristics. In Proceeding of TRB 2006 Annual Meeting.
Geruschat, Duane r., Shirin e. Hassan and Kathleen a. Turano. 2003. « Gaze Behavior while Crossing
Complex Intersections. » Optometry and Vision Science 80 (7): 515-528. https://journals.lww.com/optvissci/Fulltext/2003/07000/Gaze_Behavior_while_Crossing_Complex_Intersections.13.aspx.
Geyer, Judy, Noah Raford, David Ragland and Trinh Pham. 2006. « The Continuing Debate about Safety in
Numbers—Data From Oakland, CA. ».
Gielen, Andrea Carlson, Susan DeFrancesco, David Bishai, Patricia Mahoney, Shiu Ho and Bernard Guyer.
2004. « Child pedestrians: the role of parental beliefs and practices in promoting safe walking in urban neighborhoods. » Journal of Urban Health 81 (4): 545-555.
Gorell, RSJ and W Tootill. 2001. « Monitoring Local Authority road safety schemes using MOLASSES. » TRL
REPORT 512.
Granié, Marie-Axelle. 2007. « Gender differences in preschool children’s declared and behavioral
compliance with pedestrian rules. » Transportation Research Part F: Traffic Psychology and Behaviour 10 (5): 371-382. doi: http://dx.doi.org/10.1016/j.trf.2007.02.002.
Hakkert, AS and L Braimaister. 2002. « The uses of exposure and risk in road safety studies. ».
Hakkert, AS, V Gitelman and E Ben-Shabat. 2002. « An evaluation of crosswalk warning systems: effects on
pedestrian and vehicle behaviour. » Transportation Research Part F: Traffic Psychology and Behaviour 5 (4): 275-292. doi: http://dx.doi.org/10.1016/S1369-8478(02)00033-5.
Harré, Niki, Theo Brandt and Martin Dawe. 2000. « The development of risky driving in adolescence. »
Journal of Safety Research 31 (4): 185-194.
Havard, Catriona and Alexandra Willis. 2012. « Effects of installing a marked crosswalk on road crossing
behaviour and perceptions of the environment. » Transportation Research Part F: Traffic Psychology and Behaviour 15 (3): 249-260. doi: https://doi.org/10.1016/j.trf.2011.12.007.

104
Herrington, Susan and Mariana Brussoni. 2015. « Beyond physical activity: the importance of play and nature-based play spaces for children’s health and development. » Current obesity reports 4 (4): 477-483.
Ho, Ching-Hua, Laura Payne, Elizabeth Orsega-Smith and Geoffrey Godbey. 2003. « Parks, Recreation and
Public Health. » Parks & Recreation 38 (4): 18-20.
Hong, Kong, Department Highways, Bridges and Division Structures. 2006. Structures design manual for
highways and railways. Hong Kong: Highways Dept.
Hoogendoorn, Serge, P. H. L. Bovy and Winnie Daamen. 2002. Microscopic pedestrian wayfinding and
dynamics modelling.
Hopkins, Andrew. 2011. « Risk-management and rule-compliance: Decision-making in hazardous
industries. » Safety Science 49 (2): 110-120. doi: https://doi.org/10.1016/j.ssci.2010.07.014.
Huang, Herman and Charles Zegeer. 2000. « The effects of pedestrian countdown signals in Lake Buena
Vista. » Tallahassee, Florida: Florida Department of Transportation.
Ishaque, Muhammad Moazzam and Robert B. Noland. 2008. « Behavioural Issues in Pedestrian Speed
Choice and Street Crossing Behaviour: A Review. » Transport Reviews 28 (1): 61-85. doi: 10.1080/01441640701365239.
ITF. 2012. Pedestrian Safety, Urban Space and Health. OECD Publishing. /content/book/9789282103654-
en
http://dx.doi.org/10.1787/9789282103654-en.
Jacobsen, Peter L. 2003. « Safety in numbers: more walkers and bicyclists, safer walking and bicycling. »
Injury Prevention 9 (3): 205-209.
Jacobsen, Peter Lyndon, David R. Ragland and Charles Komanoff. 2015. « Safety in Numbers for walkers
and bicyclists: exploring the mechanisms. » Injury Prevention 21 (4): 217. 10.1136/injuryprev-2015-041635. http://injuryprevention.bmj.com/content/21/4/217.abstract.
Jones, Sarah J, Ronan Anthony Lyons, A John and SR Palmer. 2005. « Traffic calming policy can reduce
inequalities in child pedestrian injuries: database study. » Injury Prevention 11 (3): 152-156.
Keegan, Owen and Margaret O’Mahony. 2003. « Modifying pedestrian behaviour. » Transportation
Research Part A: Policy and Practice 37 (10): 889-901. doi: https://doi.org/10.1016/S0965-8564(03)00061-2.

105
Knoflacher, H. 1987. « Verkehrsplanung für den Menschen, Band 1 Grundstrukturen, Wirtschaftsverlag Dr.
» Anton Orac, Wien.
Koh, PP, YD Wong and P Chandrasekar. 2014. « Safety evaluation of pedestrian behaviour and violations
at signalised pedestrian crossings. » Safety Science 70: 143-152. doi: https://doi.org/10.1016/j.ssci.2014.05.010.
Kopp, Claire B. 1982. « Antecedents of self-regulation: a developmental perspective. » Developmental
psychology 18 (2): 199.
L’Agence Métropolitaine de Transport, AMT. 1998,2003. « Origine-Destination, Enquête. » Montreal,
Quebec, Canada.
Lachapelle, Ugo and Marie-Soleil Cloutier. 2017. « On the complexity of finishing a crossing on time: Elderly
pedestrians, timing and cycling infrastructure. » Transportation Research Part A: Policy and Practice 96: 54-63. doi: https://doi.org/10.1016/j.tra.2016.12.005.
Lam, Lawrence T. 2001. « Parental risk perceptions of childhood pedestrian road safety. » Journal of Safety
Research 32 (4): 465-478.
Langbroek, Joram, Tim De Ceunynck, Stijn Daniels, Ase Svensson, Aliaksei Laureshyn, Tom Brijs and Geert
Wets. 2012. Analyzing interactions between pedestrians and motor vehicles at two-phase signalized intersections-an explorative study combining traffic behaviour and traffic conflict observations in a cross-national context.
LaScala, Elizabeth A, Daniel Gerber and Paul J Gruenewald. 2000. « Demographic and environmental
correlates of pedestrian injury collisions: a spatial analysis. » Accident Analysis & Prevention 32 (5): 651-658.
Li, Yang Bian, Jian Rong, Lin Zhao and Shinan Shu. 2013. « Pedestrian Crossing Behavior at Unsignalized
Mid-block Crosswalks Around the Primary School. » Procedia - Social and Behavioral Sciences 96: 442-450. doi: https://doi.org/10.1016/j.sbspro.2013.08.052.
Li, Haojie, Daniel J. Graham and Arnab Majumdar. 2015. « Effects of changes in road network
characteristics on road casualties: An application of full Bayes models using panel data. » Safety Science 72: 283-292. doi: https://doi.org/10.1016/j.ssci.2014.10.001.
Lin, Tom CW. 2016. « Compliance, Technology, and Modern Finance. » Brook J Corp Fin & Com L 11: 159.

106
Lipovac, Krsto, Milan Vujanic, Bojan Maric and Miladin Nesic. 2013. « Pedestrian Behavior at Signalized Pedestrian Crossings. » Journal of transportation engineering 139 (2): 165-172. doi: 10.1061/(ASCE)TE.1943-5436.0000491.
Lobjois, Régis and Viola Cavallo. 2007. « Age-related differences in street-crossing decisions: The effects of
vehicle speed and time constraints on gap selection in an estimation task. » Accident Analysis & Prevention 39 (5): 934-943. doi: https://doi.org/10.1016/j.aap.2006.12.013.
Lytton, Hugh. 1980. Parent-child interaction. New York: Plenum Press.
Manual of Uniform Traffic Control Devices. 1998. « MUTCD,a, 4th ed.Transportation Association of
Canada, 1998, Section B4.1.1. . ».
Manual on Uniform Traffic Control Devices. 2006. « MUTCD, Texas. » Texas Department of.
———. 2009. MUTCD,Adminstration, Ferderal Highway. FHWA, Washington, DC: FHWA.
Marcus, Clare Cooper and Carolyn Francis. 1997. People places: design guidlines for urban open space.
John Wiley & Sons.
Marisamynathan and Vedagiri Perumal. 2014. « Study on pedestrian crossing behavior at signalized
intersections. » Journal of Traffic and Transportation Engineering (English Edition) 1 (2): 103-110. doi: https://doi.org/10.1016/S2095-7564(15)30094-5.
Markowitz, Frank, Stanley Sciortino, Jack Lucero Fleck and Bond M Yee. 2006. « Pedestrian countdown
signals: experience with an extensive pilot installation. » Institute of Transportation Engineers ITE Journal 76 (1): 43.
Martin, Allison. 2006. Factors influencing pedestrian safety: a literature review. TRL Wokingham, Berks.
Maslow, Abraham H. 1968. Toward a psychology of being 2d ed. New York: New York Van Nostrand
Reinhold.
Matthews, Hugh. 1995. « Culture, Environmental Experience and Environmental Awareness: Making Sense
of Young Kenyan Children's Views of Place. » The Geographical Journal 161 (3): 285-295. doi: 10.2307/3059833.
Maurice, Pierre, Michel Lavoie, Antoine Chapdelaine and Hélène Bélanger Bonneau. 1997. « Safety and
safety promotion: conceptual and operational aspects. » Chronic Diseases and Injuries in Canada 18 (4): 179.

107
Meir, Anat, Tal Oron-Gilad and Yisrael Parmet. 2015. « Are child-pedestrians able to identify hazardous
traffic situations? Measuring their abilities in a virtual reality environment. » Safety Science 80: 33-40. doi: https://doi.org/10.1016/j.ssci.2015.07.007.
Meir, Anat, Yisrael Parmet and Tal Oron-Gilad. 2013. « Towards understanding child-pedestrians’ hazard
perception abilities in a mixed reality dynamic environment. » Transportation Research Part F: Traffic Psychology and Behaviour 20: 90-107. doi: https://doi.org/10.1016/j.trf.2013.05.004.
Milazzo II, Joseph, Nagui Rouphail, Joseph Hummer and D Allen. 1999. « Quality of service for interrupted-
flow pedestrian facilities in highway capacity manual 2000. » Transportation Research Record: Journal of the Transportation Research Board (1678): 25-31.
Mitman, Meghan, David Ragland and Charles Zegeer. 2008. « Marked-crosswalk dilemma: uncovering
some missing links in a 35-year debate. » Transportation Research Record: Journal of the Transportation Research Board (2073): 86-93.
Montella, Alfonso and Filomena Mauriello. 2010. Pedestrian crosswalks safety inspections: safety
assessment procedure. In 4th International Symposium on Highway Geometric Design, TRB.
Morel, R, A Brenac, P Bayle-Guillemaud, C Portemont and F La Rizza. 2003. « Growth and properties of
cobalt clusters made by sputtering gas-aggregation. » The European Physical Journal D-Atomic, Molecular, Optical and Plasma Physics 24 (1): 287-290.
Morgan, R, K Ogden and J Barnes. 2004. GUIDE TO TRAFFIC ENGINEERING PRACTICE, PART 4: TREATMENT
OF CRASH LOCATIONS.
Morrongiello, Barbara A. 2005. « Caregiver Supervision and Child-Injury Risk: I. Issues in Defining and
Measuring Supervision; II. Findings and Directions for Future Research. » Journal of Pediatric Psychology 30 (7): 536-552. doi: 10.1093/jpepsy/jsi041.
Murray, Stephen James. 2006. « The effects of simulated cellular phone conversation on road-crossing
safety. ».
National Advisory Committee on Uniform Traffic Control Devices. 1988. Manual on uniform traffic control
devices for streets and highways. US Department of Transportation.
National Institute for Health and Care Excellence. 2016. « National Institute for health and Care Excellence,
NICE,Preventing unintentional injury among children and young people under 15. ».

108
National Recreation and Park Association. 2016. Safe routes to parks, Improving access to parks through walkability. Consulté le 10-11-2017.
Neumann, T. and P. Wagner. 2008. « Delay times in a cellular traffic flow model for road sections with
periodic outflow. » The European Physical Journal B 63 (2): 255-264. doi: 10.1140/epjb/e2008-00234-6.
NICE, quality standard. 2016. Preventing unintentional injury among children and young people under 15.
Noland, Robert B. and Mohammed A. Quddus. 2004. « A spatially disaggregate analysis of road casualties
in England. » Accident Analysis & Prevention 36 (6): 973-984. doi: https://doi.org/10.1016/j.aap.2003.11.001.
Norman, G. J., S. K. Nutter, S. Ryan, James F Sallis, K. J. Calfras and K. Patrick. 2006. « Community design
and access to recreational facilities as correlates of adolescent physical activity and Body-Mass Index. » Journal of Physical Activity and Health 3.
Oxley, Jennifer A, Elfriede Ihsen, Brian N Fildes, Judith L Charlton and Ross H Day. 2005. « Crossing roads
safely: an experimental study of age differences in gap selection by pedestrians. » Accident Analysis & Prevention 37 (5): 962-971.
Papaioannou, Panagiotis. 2007. « Driver behaviour, dilemma zone and safety effects at urban signalised
intersections in Greece. » Accident Analysis & Prevention 39 (1): 147-158.
Parachute Canada. 2016. « Unintentional Injury Trends for Canadian Children. ».
Pasanen, E. and H. Salmivaara. 1993. « Driving speeds and pedestrian safety in the City of Helsinki. » Traffic
engineering and control 34 (6): 308-310. http://dx.doi.org/.
Paschalidis, Evangelos, Ioannis Politis, Socrates Basbas and Polixeni Lambrianidou. 2016. « Pedestrian
compliance and cross walking speed adaptation due to countdown timer installations: A self report study. » Transportation Research Part F: Traffic Psychology and Behaviour 42: 456-467. doi: https://doi.org/10.1016/j.trf.2015.07.010.
Peden, Margie. 2008. World report on child injury prevention. World Health Organization.
Peden, Margie, Richard Scurfield, David Sleet, Dinesh Mohan, Adnan A Hyder, Eva Jarawan and Colin D
Mathers. 2004. World report on road traffic injury prevention. World Health Organization Geneva.
Petch, R. O. and R. R. Henson. 2000. « Child road safety in the urban environment. » Journal of Transport
Geography 8 (3): 197-211. doi: https://doi.org/10.1016/S0966-6923(00)00006-5.

109
Pucher, John and John L Renne. 2003. « Socioeconomics of urban travel: evidence from the 2001 NHTS. »
Transportation Quarterly 57 (3): 49-77.
Quebec Highway Safety Code. 2017. Highway safety code,Goverment of Quebec.
Rastogi, Rajat, Satish Chandra, J Vamsheedhar and Vivek R Das. 2011. « Parametric study of pedestrian
speeds at midblock crossings. » Journal of urban planning and development 137 (4): 381-389.
Research Education and Development. 2014. Safe Routes to Play City of Lebanon.
http://www.uvlsrpc.org/project/Lebanon_Safe_Routes_to_Play_137/.
Reyes, Mario, Antonio Páez and Catherine Morency. 2014. « Walking accessibility to urban parks by
children: a case study of Montreal. » Landscape and urban planning 125: 38-47.
Rosenbloom, Tova. 2009. « Crossing at a red light: Behaviour of individuals and groups. » Transportation
Research Part F: Traffic Psychology and Behaviour 12 (5): 389-394. doi: https://doi.org/10.1016/j.trf.2009.05.002.
Rosenbloom, Tova, Adar Ben-Eliyahu and Dan Nemrodov. 2008. « Children’s crossing behavior with an
accompanying adult. » Safety Science 46 (8): 1248-1254. doi: https://doi.org/10.1016/j.ssci.2007.07.004.
Rosenbloom, Tova, Dan Nemrodov and Hadar Barkan. 2004. « For heaven’s sake follow the rules:
pedestrians’ behavior in an ultra-orthodox and a non-orthodox city. » Transportation Research Part F: Traffic Psychology and Behaviour 7 (6): 395-404. doi: https://doi.org/10.1016/j.trf.2004.10.004.
Rosenbloom, Tova, Amit Shahar and Amotz Perlman. 2008. « Compliance of Ultra-Orthodox and secular
pedestrians with traffic lights in Ultra-Orthodox and secular locations. » Accident Analysis & Prevention 40 (6): 1919-1924.
Rosenbloom, Tova and Yuval Wolf. 2002. « Sensation seeking and detection of risky road signals: a
developmental perspective. » Accident Analysis & Prevention 34 (5): 569-580. doi: https://doi.org/10.1016/S0001-4575(01)00054-9.
Sacchi, Emanuele and Tarek Sayed. 2016. « Conflict-Based Safety Performance Functions for Predicting
Traffic Collisions by Type. » Transportation Research Record: Journal of the Transportation Research Board (2583): 50-55.
Safe Kids Canada. 2007. Child & Youth Unintentional Injury: 10 Years in Review 1994-2003.

110
Sallis, James F, P. R. Nader, S. L. Broyles, C. C. Berry, J. P. Elder, T. L. McKenzie and J. A. Nelson. 1993. «
Correlates of physical activity at home in Mexican-American and Anglo-American preschool children. » Health Psychology 12. doi: 10.1037/0278-6133.12.5.390.
Sallis, James F., Lawrence D. Frank, Brian E. Saelens and M. Katherine Kraft. 2004. « Active transportation
and physical activity: opportunities for collaboration on transportation and public health research. » Transportation Research Part A: Policy and Practice 38 (4): 249-268. doi: https://doi.org/10.1016/j.tra.2003.11.003.
Schadschneider, Andreas, W. Klingsch, Hubert Klüpfel, Tobias Kretz, Christian Rogsch and Armin Seyfried.
2009. Evacuation Dynamics: Empirical Results, Modeling and Applications.
Schieber Richard and Vegega Maria 2002. « Executive summary: reducing childhood pedestrian injuries. »
Injury Prevention. http://www.ncbi.nlm.nih.gov/pmc/articles/PMC1765415/.
Schieber, Richard and NJ Thompson. 1996. « Developmental risk factors for childhood pedestrian injuries.
» Injury Prevention 2 (3): 228.
Schuurman, Nadine, Jonathan Cinnamon, Valorie A Crooks and S Morad Hameed. 2009. « Pedestrian injury
and the built environment: an environmental scan of hotspots. » BMC public health 9 (1): 233.
Schwebel, David C, Aaron L Davis and Elizabeth E O’Neal. 2012. « Child pedestrian injury: A review of
behavioral risks and preventive strategies. » American journal of lifestyle medicine 6 (4): 292-302.
Scott, David and Wayne Munson. 1994. « Perceived constraints to park usage among individuals with low
incomes. » Journal of Park and Recreation Administration 12 (4): 79-96.
Şimşekoğlu, Özlem. 2015. « How Do Attitudes, Personality Traits, and Driver Behaviors Relate to Pedestrian
Behaviors?: A Turkish Case. » Traffic Injury Prevention 16 (1): 84-89. doi: 10.1080/15389588.2014.880785.
Siram, Suryanarayana M, Victor Sonaike, Oluwaseyi B Bolorunduro, Wendy R Greene, Sonja Z Gerald, David
C Chang, Edward E Cornwell and Tolulope A Oyetunji. 2011. « Does the pattern of injury in elderly pedestrian trauma mirror that of the younger Pedestrian? 1. » Journal of surgical research 167 (1): 14-18.
Sisiopiku, Virginia and Darcin Akin. 2003. Pedestrian behaviors at and perceptions towards various
pedestrian facilities: An examination based on observation and survey data.
Stata Statistical Software. 2011. « Release 12. College Station, TX: StataCorp LP. ».

111
Statistical Analysis System. 2002-201. SAS Institute Inc., Cary, NC, US.
Statistics Canada. 2006. https://www12.statcan.gc.ca/census-recensement/2006/index-eng.cfm.
Sucha, Matus, Daniel Dostal and Ralf Risser. 2017. « Pedestrian-driver communication and decision
strategies at marked crossings. » Accident Analysis & Prevention 102: 41-50. doi: https://doi.org/10.1016/j.aap.2017.02.018.
Svanström, Leif. 1999. Evidence-based Injury Prevention and Safety Promotion: A Review of Concepts and
Studies. Karolinska institutet, Inst. f. folkhälsovetenskap, Avd. f. socialmedicin.
Tabachnick, Barbara G and Linda S Fidell. 2007. Using multivariate statistics. Allyn & Bacon/Pearson
Education.
Tapiro, Hagai, Anat Meir, Yisrael Parmet and Tal Oron-Gilad. 2014. « Visual search strategies of child-
pedestrians in road crossing tasks. » D de Waard, K Brookhuis, R Wiczorek, F di Nocera, R Brouwer, P Barham, C Weikert, A Kluge, W Gerbino, and A Toffetti (Eds).
Tarawneh, Mohammed S. 2001. « Evaluation of pedestrian speed in Jordan with investigation of some
contributing factors. » Journal of Safety Research 32 (2): 229-236. doi: https://doi.org/10.1016/S0022-4375(01)00046-9.
Te Velde, Arenda F., John van der Kamp, José A. Barela and Geert J. P. Savelsbergh. 2005. « Visual timing
and adaptive behavior in a road-crossing simulation study. » Accident Analysis & Prevention 37 (3): 399-406. doi: https://doi.org/10.1016/j.aap.2004.12.002.
Thomson, J, Andrew Tolmie, Hugh C Foot and Brian McLaren. 1996. « Child development and the aims of
road safety education. ».
Timperio, A., D. Crawford, A. Telford and J. Salmon. 2004. « Perceptions about the local neighborhood and
walking and cycling among children. » Preventive Medicine 38. doi: 10.1016/j.ypmed.2003.09.026.
Toepfer, Caroline, Jeanette Reuter and Charles Maurer. 1972. « Design and evaluation of an obedience
training program for mothers of preschool children. » Journal of Consulting and Clinical Psychology 39 (2): 194.
Tom, Ariane and Marie-Axelle Granié. 2011. « Gender differences in pedestrian rule compliance and visual
search at signalized and unsignalized crossroads. » Accident Analysis & Prevention 43 (5): 1794-1801. doi: http://dx.doi.org/10.1016/j.aap.2011.04.012.

112
Transport Canada. 2011. Road Safety in Canada. Transport Canada. https://books.google.ca/books?id=hft5AQAACAAJ.
Tremblay, Mark, M Brownrigg and R Deans. 2008. « Active Healthy Kids Canada report card on physical
activity for children and youth. » In Children and Exercise XXIV
The Proceedings of the 24th Pediatric Work Physiology Meeting, sous la dir. de Neil Armstrong Toivo Jurimae, Jaak Jurimae.
Tremblay, Mark, Valerie Carson, Jean-Philippe Chaput, Sarah Connor Gorber, Thy Dinh, Mary Duggan, Guy
Faulkner, Casey E Gray, Reut Gruber and Katherine Janson. 2016. « Canadian 24-hour movement guidelines for children and youth: an integration of physical activity, sedentary behaviour, and sleep. » Applied Physiology, Nutrition, and Metabolism 41 (6): S311-S327.
Trozzi, V, E Manley and I Kasparias. 2015. Reliability-Based Route Choice in Public Transport Networks.
Turcotte, Martin. 2008. « Life in metropolitan areas Dependence on cars in urban neighbourhoods. »
Canadian Social Trend, Statistics Canada No.85.
Turner, Cathy, Rod McClure, Jim Nixon and Anneliese Spinks. 2004. « Community-based programmes to
prevent pedestrian injuries in children 0–14 years: a systematic review. » Injury control and safety promotion 11 (4): 231-237.
van der Molen, Hugo H. 1982. « Behavior of children and accompanying adults at a pedestrian crosswalk.
» Journal of Safety Research 13 (3): 113-119. doi: https://doi.org/10.1016/0022-4375(82)90047-0.
Ville de Montréal. 2016. Profil sociodémographique recensement.
Virkler, Mark R and David L Guell. 1984. Pedestrian crossing time requirements at intersections. TRB.
Vujanić, Milan, Dalibor Pešić, Boris Antić and Emir Smailović. 2014. « Pedestrian risk at the signalized
pedestrian crossing equipped with countdown display. » International Journal for Traffic & Transport Engineering 4 (1): 52-61.
Wang, Jung-Han and Mohamed A Abdel-Aty. 2014. Comparison of safety evaluation approaches for
intersection signalization in Florida.
Wanty, Dave Keith and SM Wilkie. 2010. Trialling pedestrian countdown timers at traffic signals.

113
Wazana, A., P. Krueger, P. Raina and L. Chambers. 1997. « A review of risk factors for child pedestrian injuries: are they modifiable? » Injury Prevention 3 (4): 295-304. http://www.ncbi.nlm.nih.gov/pmc/articles/PMC1067858/.
Weidmann, U. 1993. Transporttechnik der fussgaenger ETH, schriftenreihe iv. t—beriehte 90, zuerich.
Weiler, Richard, Sam Allardyce, Gregory P Whyte and Emmanuel Stamatakis. 2014. « Is the lack of physical
activity strategy for children complicit mass child neglect? » British Journal of Sports Medicine 48 (13): 1010-1013. doi: 10.1136/bjsports-2013-093018.
Whitebread, David and Kris Neilson. 2000. « The contribution of visual search strategies to the
development of pedestrian skills by 4‐11 year‐old children. » British Journal of Educational Psychology 70 (4): 539-557.
World Health Organization. 1989. « Health principles of housing. ».
———. 2009. Global status report on road safety : time for action.
Wu, Felicia, David Jacobs, Clifford Mitchell, David Miller and Meryl H. Karol. 2007. « Improving Indoor
Environmental Quality for Public Health: Impediments and Policy Recommendations. » Environmental Health Perspectives 115 (6): 953-957. doi: 10.1289/ehp.8986.
Yagil, Dana. 2000. « Beliefs, motives and situational factors related to pedestrians’ self-reported behavior
at signal-controlled crossings. » Transportation Research Part F: Traffic Psychology and Behaviour 3 (1): 1-13. doi: https://doi.org/10.1016/S1369-8478(00)00004-8.
Yanchar, Natalie L, Lynne J Warda, Pamela Fuselli and Canadian Paediatric Society Injury Prevention
Committee. 2012. « Child and youth injury prevention: A public health approach. » Paediatr Child Health 17 (9): 511.
Yanchar, Natalie L., Lynne J. Warda and Pamela Fuselli. 2012. « Child and youth injury prevention: A public
health approach. » Paediatrics & Child Health 17 (9): 511-511. doi: 10.1093/pch/17.9.511.
Yannis, George, Eleonora Papadimitriou and A Theofilatos. 2013. « Pedestrian gap acceptance for mid-
block street crossing. » Transportation planning and technology 36 (5): 450-462.
Zeedyk, M Suzanne and Laura. Kelly. 2003. « Behavioural observations of adult–child pairs at pedestrian
crossings. » Accident Analysis & Prevention 35 (5): 771-776. doi: https://doi.org/10.1016/S0001-4575(02)00086-6.

114
Zeedyk, M Suzanne, Linda Wallace, Bill Carcary, Katy Jones and Karen Larter. 2001. « Children and road safety: Increasing knowledge does not improve behaviour. » British Journal of Educational Psychology 71 (4): 573-594.
Zeedyk, M Suzanne, Linda Wallace and Linsay Spry. 2002. « Stop, look, listen, and think?: What young
children really do when crossing the road. » Accident Analysis & Prevention 34 (1): 43-50. doi: https://doi.org/10.1016/S0001-4575(00)00101-9.
Zein, Sany. 2004. « Canadian Guide to In-Service Road Safety Reviews. ».
Zhang, Jun. 2012. Pedestrian fundamental diagrams: Comparative analysis of experiments in different
geometries. Forschungszentrum Jülich.
Zhang, Xin, Peng Chen, Hideki Nakamura and Miho Asano. 2013. Modeling pedestrian walking speed at
signalized crosswalks considering crosswalk length and signal timing. In Proceedings of the 10th International Conference of the Eastern Asia Society for Transportation Studies, Taipei, Taiwan.
Zhou, Zhuping, Gang Ren, W Wang, Y Zhang and W Wang. 2011. « Pedestrian crossing behaviors at
signalized intersections: Observational study and survey in China. » Transportation Research Record: Journal of the Transportation Research Board 2264: 65-73.
Zhuang, Xiangling and Changxu Wu. 2011. « Pedestrians’ crossing behaviors and safety at unmarked
roadway in China. » Accident Analysis & Prevention 43 (6): 1927-1936. doi: https://doi.org/10.1016/j.aap.2011.05.005.
Zhuang, Xiangling, Changxu Wu and Shu Ma. 2018. « Cross or wait? Pedestrian decision making during
clearance phase at signalized intersections. » Accident Analysis & Prevention 111: 115-124.